Embed Size (px)
Citation preview

Title
1 National Audit of Percutaneous Coronary Interventions Annual Report 2015
National Audit of Percutaneous
Coronary Interventions
Annual Public Report
January 2014 - December 2014

Title
2 National Audit of Percutaneous Coronary Interventions Annual Report 2015
National Audit of Percutaneous Coronary Interventional ProceduresNational Institute for Cardiovascular Outcomes Research (NICOR) Institute of Cardiovascular Science, University College London2nd Floor, Nomura House, 1 St. Martin’s Le Grand, London EC1A 4NP
Tel: 0203 108 7712Email: [email protected]
AuthorsThe report was produced by:Dr Peter F Ludman MA MD FRCP FESCQueen Elizabeth Hospital, Birmingham, Audit Lead for the British Cardiovascular Intervention Society (BCIS)
Lucia GavalovaNAPCI Project ManagerNational Institute for Cardiovascular Outcomes Research
Published 1 April 2016. The contents of this report may not be published or used commercially without permission.
NICOR (National Institute for Cardiovascular Outcomes Research) is a partnership of clinicians, IT experts, statisticians, academics and managers which manages six cardiovascular clinical audits and a growing portfolio of new health technology registries, including the UK TAVI registry. NICOR analyses and disseminates information about clinical practice in order to drive up the quality of care and outcomes for patients.
The British Cardiovascular Intervention Society promotes education, training and research in cardiovascular intervention and develops and upholds clinical and professional standards.
The British Cardiovascular Society is the voice for those working in cardiovascular health, science and disease management in the UK; we aim to promote and support both the healthcare professionals who work in cardiology and the patients for whom we want to encourage the best possible treatment. Our members are healthcare professionals, working in the field of cardiovascular health.
The National Audit of Percutaneous Coronary Interventions is commissioned by the Healthcare Quality Improvement Partnership (HQIP) as part of the National Clinical Audit Programme (NCA). HQIP is led by a consortium of the Academy of Medical Royal Colleges, the Royal College of Nursing and National Voices. Its aim is to promote quality improvement, and in particular to increase the impact that clinical audit has on healthcare quality in England and Wales. HQIP holds the contract to manage and develop the NCA Programme, comprising more than 30 clinical audits that cover care provided to people with a wide range of medical, surgical and mental health conditions. The programme is funded by NHS England, the Welsh Government and, with some individual audits, also funded by the Health Department of the Scottish Government, DHSSPS Northern Ireland and the Channel Islands.
Founded in 1826, UCL (University College London) was the first English university established after Oxford and Cambridge, the first to admit students regardless of race, class, religion or gender, and the first to provide systematic teaching of law, architecture and medicine. It is among the world’s top universities, as reflected by performance in a range of international rankings and tables. UCL currently has 24,000 students from almost 140 countries, and more than 9,500 employees. Its annual income is over £800 million.
In close collaboration with:Dr Darragh O’Neill – Information Analyst / Statistician, NICORAndrew Donald – Senior Analyst Developer, NICORDr David Cunningham – Senior Strategist, NICORDr Emmanouil Lazarides – Senior Information Analyst / Statistician, NICOR
This report is available online at www.ucl.ac.uk/nicor/audits/adultpercutaneous/reports. A full version of the analyses is
available for download from the BCIS website.
AcknowledgmentsThe National Audit of Percutaneous Coronary Interventions is clinically led by the British Cardiovascular Intervention Society (BCIS) and is managed by the National Institute for Cardiovascular Outcomes Research (NICOR) based at University College London. The audit is commissioned by the Healthcare Quality Improvement Partnership (HQIP) as part of the National Clinical Audit and Patient Outcomes Programme (NCAPOP).
We would especially like to thank the contribution of all NHS Trusts, hospitals in Scotland, Wales and Northern Ireland, UK private hospitals and the individual nurses, clinicians and audit teams who collect data and participate in the audit. Without this input the audit could not continue to produce credible analysis, or to effectively monitor and assess the standard of PCI procedures in the United Kingdom.

3 National Audit of Percutaneous Coronary Interventions Annual Report 2015
National Audit of Percutaneous
Coronary Interventions
January 2014 - December 2014
This is a report of the National Audit of Percutaneous Coronary Interventions (NAPCI). It has been produced specifically for anyone who wants to know more about the use of PCI procedures to treat angina and acute coronary syndromes including the treatment of heart attacks. It is written for people with little or no previous knowledge of PCI procedures, clinical conditions or clinical audit.
It is an abbreviated version of the United Kingdom’s National Audit of Percutaneous Coronary Interventions. The full report is available for download at www.BCIS.org.uk.
All words in Red are included in the glossary at the end of the report.

4 National Audit of Percutaneous Coronary Interventions Annual Report 2015
Contents
The authors 2
Contents 4
Executive summary 5
Recommendations 7
1. Introduction 8
1.1 Coronary heart disease 8
1.2 The PCI procedure 8
1.3 Guidelines and quality standards 9
1.4 National Audit of Percutaneous Coronary 10 Interventions (NAPCI)
2. Findings 12
2.1 PCI activity and structure 12
2.2 Patient demographics 14
2.3 Clinical practice 15
2.4 Patient outcomes 23
3. Use of audit data 24
3.1 National reporting 24
3.2 Local reporting and activity 24
4. The future 28
Appendix 1. List of participating hospitals 29 and codes
Appendix 2. Data completeness 32
Appendix 3. Arterial access 37
Appendix 4. Steering group membership 42
5. Glossary 43
6. References 45
List of figures and tables
Figure 1 Different types of acute coronary syndrome 8
Figure 2 Temporal trends of PCI numbers and per million population rates (pmp)
12
Figure 3 Proportion of different indications for all PCIs performed each year
12
Figure 4a Rate of primary PCI pmp by each Local Area Network over the last 5 years
13
Figure 4b Rate of primary PCI pmp by each Local Area Network over the last 5 years.
13
Figure 4c Rate of primary PCI pmp by each Local Area Network over the last 5 years.
13
Figure 4d Rate of primary PCI pmp by each Local Area Network over the last 5 years.
13
Figure 5 Hospitals that performed less than 400 PCIs in 2014 with a year the PCI activity started
14
Table 1 Summary of patient demographics (mean) between 2007 and 2014
14
Table 2 Description of acute coronary syndromes 15
Figure 6 Percentage of patients who received primary PCI within 90 minutes from arrival at the PCI hospital
16
Figure 7 Percentage of patients who received primary PCI within 60 minutes from arrival at the PCI hospital
16
Figure 8 Percentage of patients with nSTEMI who were treated with PCI within 72 hours from admission regardless of method of admission
18
Figure 9 Percentage of patients with nSTEMI that received PCI within 96 hours compared with 72 hours from the time of admission to the first hospital with temporal trends over the last five years
18
Figure 10 Percentage of patients who were ventilated before the procedure
19
Figure 11 Temporal trends of use of radial artery as access route
20
Figure 12 Percentage of patients where the radial artery access was used in individual hospitals
20
Figure 13 Use of drug eluting stents in PCI 21
Figure 14 Use of drug eluting stents in PCI hospitals in the UK
22
Figure 15 Hospitals and their use of bio-absorbable vascular scaffolds in PCI (BVS)
23

Title
5 National Audit of Percutaneous Coronary Interventions Annual Report 2015
Executive summary
The audit of percutaneous coronary intervention (PCI) is continuous audit that collects information about all percutaneous coronary intervention procedures performed in all NHS hospitals and the majority of private hospitals in the UK. It focuses not only on procedures where percutaneous coronary intervention is deemed to have taken place (i.e. any coronary device such as a guide wire approaches, probes or crosses one or more coronary lesions, with the intention of performing a coronary intervention), the audit also collects information about the use of diagnostic interventional procedures such as pressure wire measurement, or the use of intracoronary imaging where no PCI ensues.
The audit shows a reassuring picture of PCI quality in the UK. Over the last 3 or 4 years percutaneous coronary intervention (PCI) activity in the UK has matured, as the proportion of differing clinical syndromes (case mix) treated has stabilized. From 2013 to 2014 there was only a 3% increase in total PCI activity, bringing the total to 96,143 procedures, which represents a rate of 1,488 per million population (pmp). The percentage of patients treated for an acute coronary syndrome has levelled off at about 65%, though with considerable variance between centres. Primary PCI is established across most of the UK as the default treatment for ST elevation MI and represents about 27% of all PCI activity. For most regions in the UK this represents a rate of between 300 and 500 pmp. There are 69 PCI hospitals in the UK to whom ambulances bring patients with STEMI to be treated by primary PCI.
Case ascertainment and data quality have improved but some centres stand out as not meeting the minimum data standards. This is particularly an issue for patients being treated in the context of an acute coronary syndrome. Some participating hospitals need to improve their compliance with the national audit project. Hospitals should also ensure they use the nationally agreed variable definitions when completing the datasets.
Risk adjusted analysis of both operator and hospitals are available to the public. The analysis has not shown any outliers at the 3 standard deviation level (see public reports)1.
Low volume PCI hospitalsThere are a number of NHS and private centres that do not conform to the national guidance of performing a minimum of 400 PCIs per annum2.
Urgent and emergency PCIMost centres achieve satisfactory ‘door-to-balloon’ times for the emergency treatment of STEMI (90% of patients treated within 90 minutes, and 77% within 60 minutes). There is evidence that some centres have improved whilst for others there is definite room for improvement. The recommended standards are not met for many patients requiring an inter-hospital transfer for treatment. Although 85% receive treatment within 150 minutes of a call for help, only 49% meet this target where transfer between hospitals is involved.
However the timeliness of treatment of patients with NSTEMI is generally poor. The median delay to treatment is 69 hours, and as the NICE recommendation is for treatment within 72 hours, over half of all patients are waiting too long for treatment. This is an avoidable cause of prolonged length of stay and increased treatment cost. Only 54% of patients having PCI for NSTEMI receive it within 72 hours (as recommended by NICE). Delays are worse for patients who have to be transferred from another hospital for their PCI. There is considerable variance – those with poor times could learn from centres that provide a more rapid service.
Out of hospital cardiac arrestThe optimal management of patients who are successfully resuscitated following cardiopulmonary arrest in the community remains uncertain. Evidence3 suggests that 80% of patients suffer cardiac arrest at home and 20% in public places. Improved outcomes occur with early resuscitation in the community and the early use of a defibrillator. Guidelines recommend that patients be considered for emergency or urgent angiography and PCI where appropriate. The PCI audit dataset was enlarged to try to capture more information about these patients, and the initial results are presented in this audit. About half of all patients treated by PCI having sustained an out of hospital arrest are self-ventilating by the time they arrive in the catheter lab. The other half needed mechanical ventilatory support, and this amounted to a total of 1,473 patients in 2014. The majority (79%) of these patients presented with ST elevation on their post cardioversion ECG. There was however enormous variability between PCI centres, with these cases representing more than 5% of all PCI activity for some, and almost 0% for others. Although this probably reflects variation in protocol driven investigations for these patients, international guidance supports the treatment of these patients and all centres need to develop a clinical protocol. Of patients having PCI following out of hospital arrest, those needing ventilation had a 30 day mortality of 48% compared with 7% for those who are self-ventilating. Network protocols to enable rapid treatment in the community (before a patient gets to hospital) are likely to improve outcomes.
Executive summary
1. https://www.nhs.uk/Service-Search/consultants/performanceindicators/1024
2. http://heart.bmj.com/content/101/Suppl_3/1.full
3. file://ad.ucl.ac.uk/home/rmhklga/Documents/OHCA_consensus_paper.pdf

6
Radial arterial accessPCI using radial access rather than the traditional femoral artery access is associated with reduced complications in both observational datasets and randomised trials. PCI operators in the UK have continued to switch to using the radial artery as the default strategy, and in 2014 radial access was used in 75.3% of all procedures; there have been continuous increases in the use of this technique over the last few years.
Operators and centres with low radial access rates should review practice.
New stent technologyCurrent stents are metallic and most also deliver an anti-proliferative drug (drug eluting stents) incorporated into a plastic coating on the stent. These stents remain as permanent intracoronary implants. Newer generation stents have produced better results than earlier drug-eluting stents in recent trials. In addition, there are a number of theoretical advantages to stents where the plastic coating disappears over time as well as for stents that having performed their function of scaffolding a narrowed artery, are then completely resorbed, leaving only native coronary artery tissue behind. The potential
advantages of completely bio-resorbable stents need to be weighed against safety concerns. There is evidence of a shift towards using the new generation drug-eluting stents but there is considerable variance between centres. We intend to track the outcomes of the patients treated with the different stents using new variables in the dataset for next year.
Conformance with data completeness There have been year-on-year improvements in conformance with the data completeness of key fields, but there are still a number of hospitals where the quality of the data received is sub-optimal.
Every year the audit produces an extensive list of analyses relating to various quality indicators and recommendations for a good practice with a comparative data for the participating hospitals as well as comparisons amongst the UK countries. The full list of analyses can be found on the BCIS website.

7 National Audit of Percutaneous Coronary Interventions Annual Report 2015
Commissioners and provider Chief ExecutivesWe recommend that:
• PCI activity at individual hospitals reaches the minimum of 400 procedures per year
• Trusts, Strategic Clinical networks and Commissioners work to improve treatment times for patients receiving urgent and emergency care, especially when an inter-hospital transfer is required
• Current service configuration is reviewed for emergency cases with ST elevation MI (a) in hospitals that perform less well than the centres who provide the fastest treatment and (b) for patients where transfer between hospitals is involved
• A review of the clinical pathways for patients with NSTEMI undergoing PCI is undertaken to ensure patients receive timely treatment. This is especially important for those who have to be transferred from one hospital to another for treatment
• There are sufficient resources allocated to support national clinical audit activity
Medical directors and clinical leadsWe recommend that:
• Hospitals review their use of radial artery access for PCI and plan the appropriate training to ensure this route is used as the default access route whenever possible
• Hospitals should use those stent technologies that have been shown to provide better outcomes for patients
• All Trusts provide appropriate support to the clinical audit teams. Our data show that a higher level of clinical engagement with the clinical audit team is associated with better data completeness and data quality. Each clinical audit should have a dedicated clinical lead assigned to support this activity
• All operators engage with the national audit programme and their local clinical audit team and to ensure timely submission of accurate data to NICOR
• All operators regularly review their outcomes via the NICOR PCI Operator Outcomes tool for their in-hospital complication rates and other relevant clinical measures
• Clinical and audit teams comply with completion of the new dataset items on cardiac arrest and new stent technology fields in addition to the existing data fields
Clinical audit teamsEveryone who is responsible or in some way involved in PCI audit data collection and submission should:
• Submit their data regularly, at least on a quarterly basis. More contemporaneous data allow more relevant analyses.
• Check that the data submitted to NICOR are accurate and that the reports on your data are consistent with your submitted data; this is especially relevant to those hospitals that use third party software for data submission
• Engage with the reports that are sent to the hospitals on a quarterly basis to check case ascertainment rates and data completeness especially for fields defined in the NICOR Minimum Data Standard. Data completeness should be at a minimum level of 90% but as high as possible
• Regularly review the audit reports sent to the hospital by the NAPCI team to ensure the hospital’s performance meets NICE quality standards and recommendations for good practice (see section 1.4 of this report)
Recommendations

8 National Audit of Percutaneous Coronary Interventions Annual Report 2015
1 Introduction
1.1 Coronary heart disease
Coronary heart disease (CHD) is the largest cause of death and disability in the United Kingdom. CHD causes around 73,0005 deaths in the UK each year and around one in five men and one in seven women will die from the disease.
Coronary heart disease is usually caused by atherosclerosis which is a process where the walls of the arteries develop fatty deposits called atheroma. Atherosclerosis manifests itself in a number of conditions of which the two conditions below are relevant to this audit:
Stable angina is a symptom that occurs when the artery becomes progressively narrowed and blood supply to the heart muscle will become restricted. People experience a tight constricting feeling, normally across the chest. It is brought on by physical exertion or stress. Stable angina is a chronic medical condition with a low but appreciable incidence of acute coronary events and increased mortality.
Acute Coronary Syndromes (ACS) occur when there is a sudden or recent reduction in the blood supply to the heart and include unstable angina and myocardial infarction (heart attacks); Figure 1. The symptoms for both unstable angina and a myocardial infarction can be similar (for example, chest pain or tightness, breathlessness and sweating) but these syndromes can be distinguished with an electrocardiogram (ECG) and blood tests.
A myocardial infarction (heart attack) occurs when a coronary artery becomes totally blocked by a clot (thrombus) which forms over the fatty deposits in the wall of the artery. If the blockage persists the region of the heart muscle supplied by that artery will progressively die (myocardial necrosis). This syndrome is referred to as ST elevation myocardial infarction (STEMI), because usually this pattern (elevation of the ST segments) is seen on the ECG.
Sometimes the artery becomes partially blocked or only blocked temporarily. The ECG usually does not show ST segment elevation. Shortage of blood supply to the affected heart muscle is less severe or intermittent and may not lead to myocardial necrosis. If it does not then the syndrome is called unstable angina. If there is evidence of some myocardial necrosis without ST segment elevation it is referred to as non ST elevation myocardial infarction (nSTEMI).
1.2 Percutaneous coronary proceduresPercutaneous Coronary Intervention is one of two coronary revascularisation techniques used to treat narrowed arteries, the other being coronary artery bypass grafting (CABG).
The PCI procedure works by mechanically improving blood flow to the heart and it is less invasive than the coronary artery bypass grafting. During the procedure, a small balloon is inserted which, when inflated widens the artery. In most cases a ‘stent’ - metal mesh scaffold - is implanted to keep the artery wall open.
Figure 1: Types of acute coronary syndrome
STEMI
nSTEMI
Unstable angina (UA)
Myocardial Infarction (MI)
Acute reduction in blood supply to heart
ACSSTEMI
nSTEMI
Unstable angina (UA)
Myocardial Infarction (MI)
ACSAcute reduction in blood supply to heart
5. http://www.nhs.uk/Conditions/Coronary-heart-disease/Pages/Introduction.aspx
Artery
Plaque
Stent
Compressed plaque
Catheter
Balloon
The PCI procedure

9 National Audit of Percutaneous Coronary Interventions Annual Report 2015
In addition to NICE guidelines, the British Cardiovascular Intervention Society has published updated recommendations for good practice in 201510 of which key recommendations are:
Quality Detail
NICE quality standard [QS68] Quality statement 3 Coronary angiography and PCI is performed within 72 hours for patients with NSTEMI or unstable angina.
NICE quality standard [QS68]Quality statement 4
Coronary angiography and PCI for adults with NSTEMI or unstable angina who are clinically unstable as soon as possible or within 24 hours from becoming clinically unstable.
NICE quality standard [QS68] Quality statement 5
Adults who are unconscious after cardiac arrest caused by suspected acute ST segment elevation myocardial infarction (STEMI) are not excluded from having coronary angiography (with follow–on primary percutaneous coronary intervention [PCI] if indicated).
NICE technology appraisal guidance 71Sections 1.1 and 1.5
Drug-eluting stents for the treatment of coronary artery disease where indicated for patients with small arteries and long lesions.
Recommendation Detail
Institutional facilities Each PCI hospital undertaking emergency PCI cases should have at least two cardiac dedicated catheter laboratories.
Institutional volume
Minimum case volume for a PCI hospital is 400 procedures per year.
Minimum of three interventional cardiologists per hospital.
Hospitals providing a primary PCI service should perform a minimum of 100 PPCI procedures each year.
Operators volume of cases
Every operator should perform a minimum of 150 cases within a two year period.
Operators performing primary PCI procedures should undertake a minimum of 50 elective or emergency cases per year within the primary PCI hospital.
Monitoring institutional standards
All PCI hospitals are expected to collect comprehensive and accurate data that relate to the interventional treatment they provide for their patients.
Regular departmental discussions should include individual case presentations for all unexpected mortality and morbidity.
BCIS will provide operators with a detailed breakdown of their own PCI activity that includes risk-adjusted outcome analysis.
Other standards/recommendations
Detail
Data from a number of randomized trials and multiple registries11
There is increasing evidence that arterial access via the radial route is associated with a reduction in bleeding complications
6. https://www.nice.org.uk/guidance/cg126/chapter/guidance#investigation-and-revascularisation
7. https://www.nice.org.uk/guidance/qs21
8. https://www.nice.org.uk/guidance/cg167/chapter/recommendations
9. http://www.nice.org.uk/guidance/QS68
10. http://heart.bmj.com/content/101/Suppl_3/1.abstract?etoc
11. J Am Coll Cardiol. 2014;63(10):973-975.doi:10.1016/j.jacc.2013.09.066
1.3 Guidelines and quality standardsThe National Institute for Health and Clinical Excellence (NICE) recommends that PCI is used to manage stable angina6 7 and acute coronary syndromes8 9 in three ways:
• Alleviate the symptoms of angina
• Restore coronary blood flow during a heart attack (primary PCI)
• Prevent future myocardial infarction
To achieve this NICE have published the following statements:

10
1.4 National Audit of Percutaneous Coronary Interventions (NAPCI)
1.4.1 The role of the audit
Clinical audit is the process of monitoring the care and treatment of patients against agreed national and international standards, with a view to driving up the quality of care and improving outcomes for patients. The British Cardiovascular Society (BCIS) has continuously audited PCI activity since 1988 and in collaboration with NICOR since 2006. The audit has collected patient level data nationwide since about 2005. The audit provides information on the:
• Structure of the provision of PCI services across the UK (for example the number of PCI centres and their coverage, number of PCI procedures per centre and population, number of operators in each centre, etc.)
• Appropriateness of clinical care and treatment provided by each hospital, measured against national aggregated data and agreed national standards (for example indication for treatment, use of stents, arterial access routes)
• Process of care (for example delays in receiving treatments such as primary PCI)
• Outcome for patients such as complications, adverse cardiac events and death/survival
1.4.2 Project governance
The audit is managed by the National Institute of Cardiovascular Outcomes Research (based at University College London) and is clinically led by the British Cardiovascular Intervention Society.
The British Cardiovascular Interventional Society provides intellectual and clinical leadership of the audit. In 2014 the BCIS Data Monitoring and Audit Group has expanded its membership to include patient representatives, participating hospitals and representatives from the MHRA, a regulatory body. The audit is referred to as the National Audit of Percutaneous Coronary Interventions (NAPCI).The Steering Group meets three times a year (see appendix 4 for its membership).
The Steering Group’s remit is to:
• Provide leadership on the aims and delivery of the project, dependent on allocation of resources, in collaboration with the British Cardiovascular Intervention Society and to ensure the agreed reports are published
• Ensure that the project is aligned with the evolving needs within the clinical specialty
• Review the UK wide audit data to assess whether hospitals and operators are meeting the evidence based standards. The BCIS has an Outlier Policy which is followed when the results suggest a centre or operator is not meeting those standards
• Review applications to use the audit data for research or other quality improvement programmes outside of NICOR
• Review the dataset for potential changes to ensure it remains up to date in the context of an evolving evidence base
The NAPCI audit is commissioned by the Healthcare Quality Improvement Partnership (HQIP). HQIP holds commissioning and funding responsibility for this and several other national clinical audits.
1.4.3 Methodology
NAPCI is a continuous audit and collects information about all percutaneous coronary intervention procedures performed in all NHS hospitals and the majority of private hospitals (more information about the participation can be found in section 2.1) in the UK (England, Wales, Scotland and Northern Ireland). The data are collected at the hospital level, including in the instances where more than one participating hospital is part of the same trust.
In addition to percutaneous coronary intervention (deemed to have taken place if any coronary device such as a guide wire approaches, probes or crosses one or more coronary lesions, with the intention of performing a coronary intervention), the audit also collects information about the use of diagnostic interventional procedures such as pressure wire measurement, or the use of intracoronary imaging where no PCI ensues. There have been concerns about the overuse of PCI in patients with stable coronary disease. Trial results12 have shown improved outcomes with appropriate use of adjunctive technologies such as pressure wire assessment of lesions and the use of intravascular ultrasound.
Data can be either entered manually via a dedicated interface (web-based application) or imported from existing hospital clinical information systems using commercial or locally developed software. All data uploaded by hospitals are encrypted on transmission and stored encrypted on the NICOR servers. NICOR manages access control to the servers via user ID and password.
In addition to clinical data, the audit also collects patient identifiable information to allow for the datasets to be
12. http://eurheartj.oxfordjournals.org/content/ehj/35/37/2541.full.pdf
11 National Audit of Percutaneous Coronary Interventions Annual Report 2015
linked with external datasets such as the Office for National Statistics for mortality analysis. NICOR has permission from the Confidentiality Advisory Group13 to collect and store this information without patient consent.
Data held within NICOR are managed within a secure environment for storage and processing provided by the UCL network and within the UCL Information Governance and security policies. In addition, NICOR staff recognise that confidentiality is an obligation and regularly undergo information governance training to ensure understanding of the duty of confidentiality, how it relates to patient information and the data that are held and handled at NICOR.
1.4.4 Data quality, data completeness & case ascertainment
External data validation is not possible. We intend to explore the suitability of HES data in this regard. Currently, case ascertainment rates are based on the self-reported data via an annual survey that requests information about total number of cases performed. Each participating hospital is also encouraged to undertake a systematic validation of case ascertainment rates, data completeness and the quality of data that they submit to NICOR. Hospitals are sent automated reports from NICOR on a quarterly and monthly basis that provides feedback on data completeness as well as aggregate data of relevant clinical indicators.
In addition, the audit has defined a minimum data standard14 that comprises those fields most important in the analysis of key quality indicators and the analysis of risk adjusted outcomes. Hospitals are required to meet a minimum of 90% data completeness for these fields. The results of data completeness for the fields in question are available in appendix 2.
1.4.5 How we analysed the data Data held within the secure storage environment at NICOR were extracted and provided to the information analyst. Because the analyst did not need to access personal identifiers for this work, personal identifiers in these data were replaced with codes prior to distribution.
The data provided by hospitals do not always adhere to the technical standards of the audit. The data are first processed to reduce the effect of deviation from the audit’s standards and to maximise their usability for analysis. Analysis proceeds on cleaned data.
The data cleaning and analysis processes described in this report were performed in the R statistical programming language (version 3.2.2, released on 14 August 2015). R is today the sixth most popular programming language in the world, well above its competitors Matlab (ranked 10th) and SAS (26th). NICOR’s Analysis Team standardised around the use of R across all national audit work in 2011. The PCI audit benefits from this standardisation as code snippets, data structures and analysis frameworks are shared among team members, resulting in more sophisticated analysis and presentation in shorter time frames.
The PCI data cleaning and analysis processes use the R package pmgr, written and maintained by NICOR’s Senior Information Analyst. Data that do not fit the standards for each field are transformed when possible to make them usable for analysis. On rare occasions, multiple copies of records for the same procedure are found to be duplicated and so stored twice or more in the database. Duplicate records are identified and removed prior to analysis.
Most of the analyses available in this report are descriptive statistics. They are calculated using standard modules within the R programming framework. Tables and graphics are also prepared within R, and then exported for inclusion in this report. Funnel plot methodology is used to determine whether results from individual centres are within agreed boundaries. A more detailed explanation about the statistical methodology is available on request.
13. http://www.hra.nhs.uk/research-community/applying-for-approvals/confidentiality-advisory-group-cag/
14. http://www.ucl.ac.uk/nicor/audits/adultpercutaneous/datasets
12 National Audit of Percutaneous Coronary Interventions Annual Report 2015
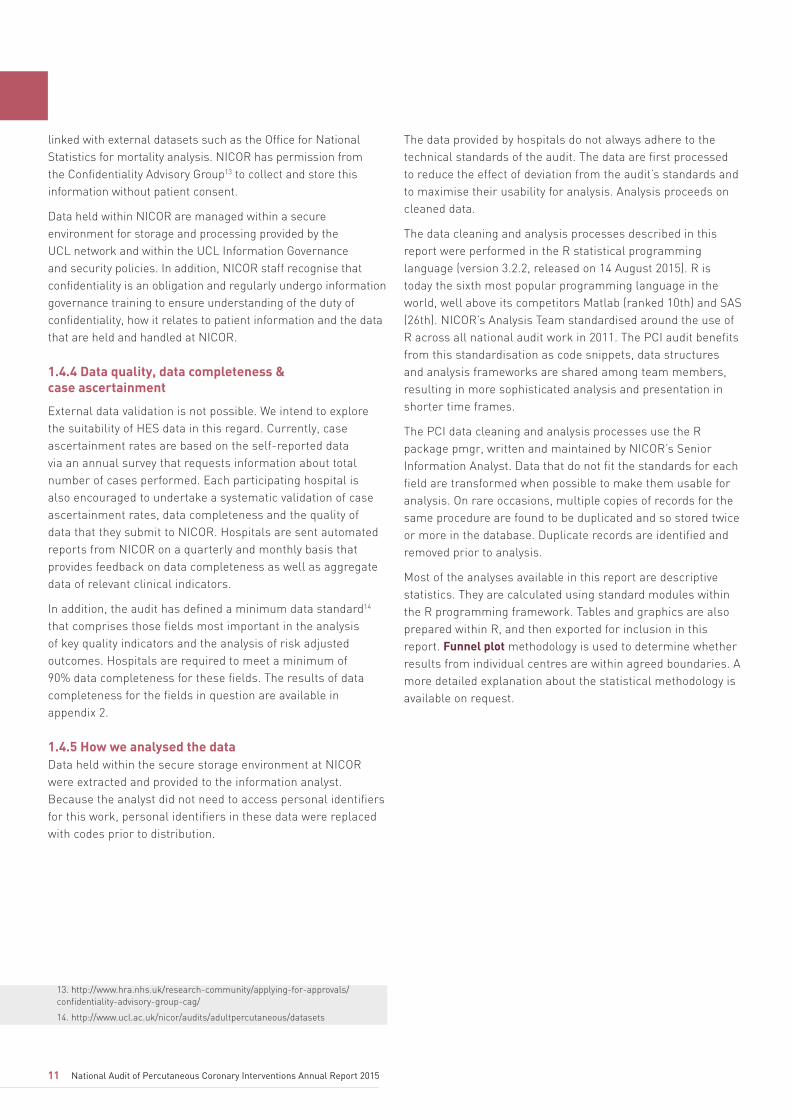
2.1 PCI activity and structureThe optimal rate of PCI per million population (pmp) is difficult to judge and is dependent on many factors, including the varying characteristics of populations in different countries. While the rate of PCI pmp in the UK has, historically, been considerably lower than most other European countries, there have been steady increases in activity. A total of 96,143 PCIs were performed from January to December 2014 compared with 92, 589 in 2013. This represents rate of 1,488 PCI pmp in 2014 compared to 1,444 pmp in 2013 (see Figure 2 for temporal trends).
2 Findings
0 0
200
400
600
800
1000
1200
1400
1,48896,143 1600
10000
20000
30000
40000
50000
60000
Tota
l PC
I pro
cedu
res
PC
I pm
p
70000
80000
90000
100000
110000
1991
1992
1993
1994
1995
1996
1997
1998
1999
2000
2001
2002
2003
2004
2005
2006
2007
2008
2009
2010
2011
2012
2013
2014
Number of PCI procedures Number of PCI pmp
Year
0
10
20
30
40
50
60
Per
cent
age
70
80
90
100
2007 2008 2009 2010 2011 2012 2013 2014
Patients with STEMI
Patients with Stable
Patients with nSTEMI/UA
Patients with Other
Year
40.7
45.2
12.9
38.2
44.3
16.2
38.2
39.9
20.2
37.8
36.2
24
37.3
34.9
26.1
36.9
34
27.3
37.6
32.8
27.5
37.2
33
27.2
1.8 2.1 2.61.81.7 1.91.41.2
Figure 2: Temporal trends of PCI numbers and per million population rates (pmp)
Figure 3: Proportion of different indications for all PCIs performed each year
Primary PCI is established across most of the UK as the default treatment for ST elevation MI and represents about 27% of all PCI activity (see Figure 3), and for most regions in the UK represents a rate of between 300 and 500 pmp (Figures 4a & 4b) which is comparable to the rates in other European countries15. There are 69 PCI centres in the UK to whom ambulances bring patients with STEMI to be treated by primary PCI.
15. Eur Heart J. 2014 Aug 1;35(29):1957-70. doi:10.1093/eurheartj/eht529. Epub 2014 Jan 12.

13 National Audit of Percutaneous Coronary Interventions Annual Report 2015
Figure 4a: Rate of primary PCI pmp by each Local Area Network over the last 5 years
Figure 4c: Rate of primary PCI pmp by each Local Area Network over the last 5 years
Figure 4b: Rate of primary PCI pmp by each Local Area Network over the last 5 years
Figure 4d: Rate of primary PCI pmp by each Local Area Network over the last 5 years
16. http://heart.bmj.com/content/101/Suppl_3/1.abstract?etoc
0
100
200
300
400
500
600
2010 2011 2012 2013 2014
London
Thames Valley
North Wales
Bristol, N Somerset, Somerset, S Gloucs
Bath, Gloucs, Swindon and Wiltshire
N Ireland
Kent and Medway
Pri
mar
y P
CI p
er m
illio
n po
pula
tion
Year
0
100
200
300
400
500
600
2010 2011 2012 2013 2014
Surrey and Sussex
East Anglia
Essex
Scotland
Herts and The S Mids
S Yorks and Bassetlaw
Cheshire, Warrington and Wirral
Pri
mar
y P
CI p
er m
illio
n po
pula
tion
Year
Pri
mar
y P
CI p
er m
illio
n po
pula
tion
Year
0
100
200
300
400
500
600
2010 2011 2012 2013 2014
North Yorkshire and Humber
Derbyshire and Nottinghamshire
Birmingham and The Black Country
Lancashire
Leicestershire and Lincolnshire
Durham, Darlington and Tees
Devon, Cornwall and Isles Of Scilly
Cumbria, Northumberland, Tyne and Wear
Pri
mar
y P
CI p
er m
illio
n po
pula
tion
Year
0
100
200
300
400
500
600
2010 2011 2012 2013 2014
Greater Manchester
South Wales
Wessex
West Yorkshire
Shropshire and Staffordshire
Merseyside
Arden, Herefordshire and Worcestershire

14 National Audit of Percutaneous Coronary Interventions Annual Report 2015
BCIS also recommends that every operator should perform a minimum of 150 cases within a two year period. The information about the individual operator PCI activity is available on the BCIS website.
There are several possible reasons why operators may be recorded with a low procedural volume. It may genuinely reflect their practice. They may have only been appointed as a consultant part way through the year in question. They may have suspended their work due to pregnancy, or by taking a sabbatical.
2.2 Patient demographicsPatients that are treated by PCI have a mean age of 65 on average, 75% are male. Female patients treated with PCI tend to be slightly older with an average age of 69 years.
Patient outcomes are often influenced by other factors in addition to the care provided and some of those characteristics are presented in Table 1. Smoking is one of the risk factors that affects patient outcomes. The British Heart Foundation reports that smokers are almost twice as likely to have a heart attack compared with those that never smoked as smoking damages the lining of the arteries predisposing to the build-up of atheroma resulting in narrowed arteries, and also increases the likelihood of blood clotting in the arteries. There appears to be a small reduction in the patients who are current smokers and the rate of those that never smoked has increased slightly.
The rate of patients who have previously had PCI is steadily increasing as this treatment becomes more prevalent. The rate of patients with diabetes has also increased over the last few years.
RAI: Raigmore Hospital (2010]WEX: Wexham Park Hospital (2006)
DGE: Eastbourne Hospital (2006)MAY: Croydon University Hospital (2006)
WAT: Watford General Hospital (2009) AEI: Royal Albert Edward Infirmary (Wigan) (2007)
KMH: Kings Mill Hospital (2010)PIN: Pinderfields General Hospital (2010)
PMS: Great Western Hospital (2006)SCU: Scunthorpe General Hospital (2010)
BRD: Bradford Royal Infirmary (2005)KSX: Tunbridge Wells Hospital (2008)
DVH: Darent Valley Hospital (2008)IPS: Ipswich Hospital (2014)
GWH: Queen Elizabeth Hospital Woolwich (2007)EAL: Ealing Hospital (2009)
YDH: York District General Hospital (2010)MDW: Medway Maritime Hospital (2010)
FRY: Frenchay Hospital (2008)LDH: Luton and Dunstable (2014)
378363
350347341
335332
314307
296292
261254
245227225220
214190
134
0 200100 400300PCI program start date
Table 1: Summary of patient demographics (mean) between 2007 and 2014
Figure 5: Hospitals that performed less than 400 PCIs in 2014 with a year the PCI activity started
2007 2008 2009 2010 2011 2012 2013 2014
Age (mean) 63.6 63.8 64.2 64.3 64.6 64.8 64.9 65.1
Sex (male) 73.8% 74% 74.1% 74.2% 74.1% 74.1% 74.2% 74.3%
Diabetic 17.5% 18.2% 18.3% 18.7% 19.1% 20.2% 20.8% 21%
Previous CABG 8.6% 9.2% 8.7% 8.6% 8% 8.3% 8.6% 8.4%
Previous PCI 18.4% 20.6% 21.7% 22% 22.7% 23.5% 24.7% 25.6%
Previous MI 29.6% 30.1% 28.8% 28.2% 27.6% 26.8% 27.3% 27.4%
Current smoker 24% 24.2% 25.9% 26.4% 26.1% 25.4% 25.2% 24.4%
Ex-smoker 40.1% 40.7% 40% 38.7% 37.1% 36.8% 37.7% 37.3%
Never smoked 35.8% 35% 34.1% 34.9% 36.8% 37.8 % 37.1% 38.2%
There is evidence that patients treated in higher volume centres may have improved outcomes, particularly centres that perform at least 400 procedures per year. The BCIS and BCS ‘Recommendations for good practice and training’16 recommend that centres undertake at least 400 PCI procedures each year. In 2014, 20% of NHS PCI centres performed 400 or fewer cases compared with 22% in 2013. Nevertheless all but 2 NHS centres performed over 200 cases (Figure 5). Centres that perform less than 400 procedures per year are encouraged to increase their level of activity to a minimum of 400 procedures; whilst those that perform less than 200 procedures per year should have a robust plan in place to show how this standard can be achieved in the future.

15 National Audit of Percutaneous Coronary Interventions Annual Report 2015
2.3 Clinical practice
2.3.1 Urgent and emergency procedures
Emergency procedures are procedures which are most effective if they are performed as soon as possible after the patient becomes ill. Urgent procedures are procedures that are necessary over the next day or so, within this period of hospitalisation, but not needed immediately. Urgent and emergency treatment applies to patients with an acute coronary syndrome (see Table 2).
Table 2: Description of acute coronary syndromes
Patients with STEMI
Patients with STEMI are treated by an emergency procedure called primary PCI for which the NICE guideline17 recommends that patients receive primary PCI within 90 minutes from arrival at the PCI hospital. This is measured as the door-to-balloon time (DTB). The European guideline18 on the other hand recommends a shorter timeline with a door-to-balloon time of 60 minutes or less from arrival at the PCI hospital. In 2014 average percentage of patients being treated within 60 minutes from arrival at a PCI hospital was 77% compared with 90% within the 90 minute target (see Figures 6 and 7).
17. https://www.nice.org.uk/guidance/QS68/chapter/Quality-statement-6-Primary-PCI-for-acute-STEMI
18. http://eurheartj.oxfordjournals.org/content/ehj/35/37/2541.full.pdf
Acute coronary syndrome
ST segment elevation (STEMI)ST-elevation usually indicates complete blockage of a coronary artery and, in most cases, warrants immediate treatment to re-open the artery. Also known as heart attack.
Non-ST segment elevation (nSTEMI)
nSTEMI is another type of a heart attack but usually there is only partial occlusion of the coronary artery. Treatment with PCI is not usually needed immediately but is used over the next few days.
Unstable Angina
Sometimes the artery becomes partially blocked or only blocked temporarily. The ECG may be abnormal but usually does not show ST segment elevation. Shortage of blood supply to the affected heart muscle is less severe or intermittent and may not lead to myocardial necrosis. If it does not then the syndrome is called unstable angina.

16 National Audit of Percutaneous Coronary Interventions Annual Report 2015
0 200 400 600 800 1000
60
70
% D
TB <
90
min
80
90
100
Number of procedures per centre
Figure 6: Percentage of patients who received primary PCI within 90 minutes from arrival at the PCI hospital. The blue line in the middle represents the national average which is 90%. (See Appendix 1 for hospital codes and their corresponding names.)
Number of procedures per centre
60
0 200 400 600 800 1000
70
% D
TB <
60
min
80
90
100
Figure 7: Percentage of patients who received primary PCI within 60 minutes from arrival at the PCI hospital. The blue line in the middle represents national average which is at 77 %. (See Appendix 1 for hospital codes and their corresponding names.)
There is room for improvement for a considerable number of hospitals for the DTB standard whether the NICE or European guidelines are used.

17 National Audit of Percutaneous Coronary Interventions Annual Report 2015
Patients with nSTEMI/unstable angina
Coronary angiography is a diagnostic procedure that is important in determining the extent and severity of the coronary disease. NICE guidelines19 published in September 2014, recommend that once a diagnosis of NSTEMI is made, coronary angiography should be offered, when appropriate, within 72 hours of first admission. This may lead to revascularisation by either PCI or CABG. This guidance specifically relates to patients who have an intermediate or higher risk of adverse cardiovascular events as predicted by the GRACE score20. The audit tracks patients with UA/NSTEMI who end up being treated by PCI.
Figure 8 shows that only the average percentage of patients treated within the 72 hour timeline within centres is only 54%.
19. https://www.nice.org.uk/guidance/QS68 chapter/Quality-statement-3-Coronary-angiography-and-PCI-within-72-hours-for-NSTEMI-or-unstable-angina20.
20. http://www.gracescore.org/WebSite/About.aspx

18 National Audit of Percutaneous Coronary Interventions Annual Report 2015
20
0 200 400 600 800 1000
40
30
Pat
ient
s w
aiti
ng <
72 h
ours
60
50
80
70
100
Number of PCI procedures for nSTEMI with time data
90
Figure 8: Percentage of patients with nSTEMI who were treated with PCI within 72 hours from admission regardless of method of admission i.e. whether they were admitted directly to the PCI hospital or were admitted to a non-PCI hospital first. Data for individual centres will vary depending on the proportion of patients admitted directly or transferred from another hospital. (See Appendix 1 for hospital codes and their corresponding names.)
Figure 9: Percentage of patients with nSTEMI that received PCI within 96 hours compared with 72 hours from the time of admission to the first hospital with temporal trends over the last five years
0
10
2010 2011 2012 2013 2014
40
30
20
50
60
49
61.4
70
80
63.3
52
64.4
58.7
70.3
51.554.3
67.4
< 96 hours < 72 hours
%
Bet
ter
It is not surprising that the method of admission plays a role in the delays that patients face for angiography and PCI. The audit data found that those who are admitted to a non-PCI hospital first and then are transferred wait 82 hours on average for their PCI compared to those that are admitted to the PCI hospital directly where the wait is on average 61 hours (Figure 9).

19 National Audit of Percutaneous Coronary Interventions Annual Report 2015
2.3.2 Out of hospital cardiac arrest
0.0
0 500 1000 1500 2000 2500 3000
1.0
0.5
% o
f all
em
erge
ncy
case
s re
quir
ing
vent
ilati
on (o
f all
PC
Is)
2.0
1.5
3.0
2.5
4.5
Total number of all PCI procedures
4.0
5.0
5.5
3.5
Figure 10: Percentage of patients who were ventilated before the procedure (the majority are patients who have sustained out of hospital cardiac arrest). (See appendix 1 for hospital codes and their corresponding names.)
The optimal management of patients who are successfully resuscitated following cardiopulmonary arrest in the community remains uncertain. The PCI audit dataset was enlarged to try to capture more information about these patients, and the initial results are presented in this audit. About half of all patients treated by PCI having sustained an out of hospital arrest are self-ventilating by the time they arrive in the catheter lab. The other half needed mechanical ventilatory support, and this amounted to a total of 1,473 patients in 2014. The majority (79%) of these patients presented with ST elevation on their post cardioversion ECG. There was however enormous variability between PCI hospitals, with these cases representing more than 5% of all PCI activity for some, and almost 0% for others (Figure 10). Although this probably reflects variation in protocol driven investigations for these patients, international guidance supports the treatment of these patients and all centres need to develop a clinical protocol. Of patients having PCI following out of hospital arrest, those needing ventilation had a 30 day mortality of 48% compared with 7% for those who are self-ventilating.
2.3.3 Radial arterial access
When performing coronary intervention, catheters are introduced to a patient’s arterial system, so the coronary arteries can be reached and treated. During the development of PCI techniques the large femoral artery (at the top of the leg) was used. However, some of the commonest complications after PCI relate to the difficulty in stopping this artery from bleeding after removing the catheter at the end of the procedure. As PCI equipment has become smaller, it has been possible to perform almost all PCI from the smaller radial artery in the wrist. PCI using radial access rather than the traditional femoral artery access is associated with reduced complications in both observational datasets and randomised trials. PCI operators in the UK have continued to switch to using the radial artery as the default strategy, and in 2014 radial access was used in 75% (as can be seen in Figure 11) of all procedures; there have been continuous increases in the use of this technique over the last few years.

20 National Audit of Percutaneous Coronary Interventions Annual Report 2015
0
71.275.3
65.2
58.7
51.6
43
34.7
Cas
es u
sing
rad
ial a
cces
s (%
)
80
70
60
50
40
30
20
10
2007 2008 2009 2010 2011 2012 2013 2014
Year
26.9
0
0 500 1000 1500 2000 2500
20
10
Cas
es u
sing
rad
ial a
cces
s (%
)
40
30
60
50
100
Number of PCIs per centre
80
90
70
Figure 11: Temporal trends of use of radial artery as access route
Figure 12: Percentage of patients where the radial artery access was used in individual hospitals. (See appendix 1 for hospital codes and their corresponding names.)
Although there has been an enormous increase in the use of this technique there is still a large variation in the use of this approach between different PCI centres (see Figure 12 and Table 4 in the appendix 3). The operator level data for radial access are available on the BCIS website.

Title
21 National Audit of Percutaneous Coronary Interventions Annual Report 2015
2.3.4 New stent technology
The National Institute for Health and Care Excellence (NICE) recommends that “Stents should be used routinely where PCI is the clinically appropriate procedure for patients with either stable or unstable angina or with acute myocardial infarction”. The majority of procedures involve stent insertion (92%) which shows centres are following recommended best practice. There are some cases that do not need or cannot be treated with stents.
Drug eluting stents were developed to reduce the risk of treated arteries becoming re-narrowed. Data from multiple trials has confirmed that these devices are associated with improved outcomes, and that ‘second generation’ stents have better outcomes than first. The audit confirms a switch to second generation drug eluting stents. The only disadvantage of drug eluting stents is that a patient needs to be treated with anti-thrombotic drugs for longer than if they are treated with plain metal stents. Where a patient is at risk of bleeding, or needs an urgent operation, bare metal stents may be favoured.
While there has been a gradual increase in use of drug eluting stents since 2007, with 86% of cases being treated with drug eluting stents in 2014, there remains variance in their use across different centres and countries which may be explained by case mix and also financial pressures because drug eluting stents are more expensive (Figures 13 and 14).
0
71.1
76.281.6
85.7
67.163.5
5755
62
53
17
0
63.5
Per
cent
age
of c
ases
usi
ng D
ES
80
90
70
60
50
40
30
20
10
2002 2003 2004 2005 2006 2007 2008 2009 2010 2011 2012 2013 2014
Year
Mean of % use by Centres
Figure 13: Use of drug eluting stents in PCI
A
B
C
Medication

22 National Audit of Percutaneous Coronary Interventions Annual Report 2015
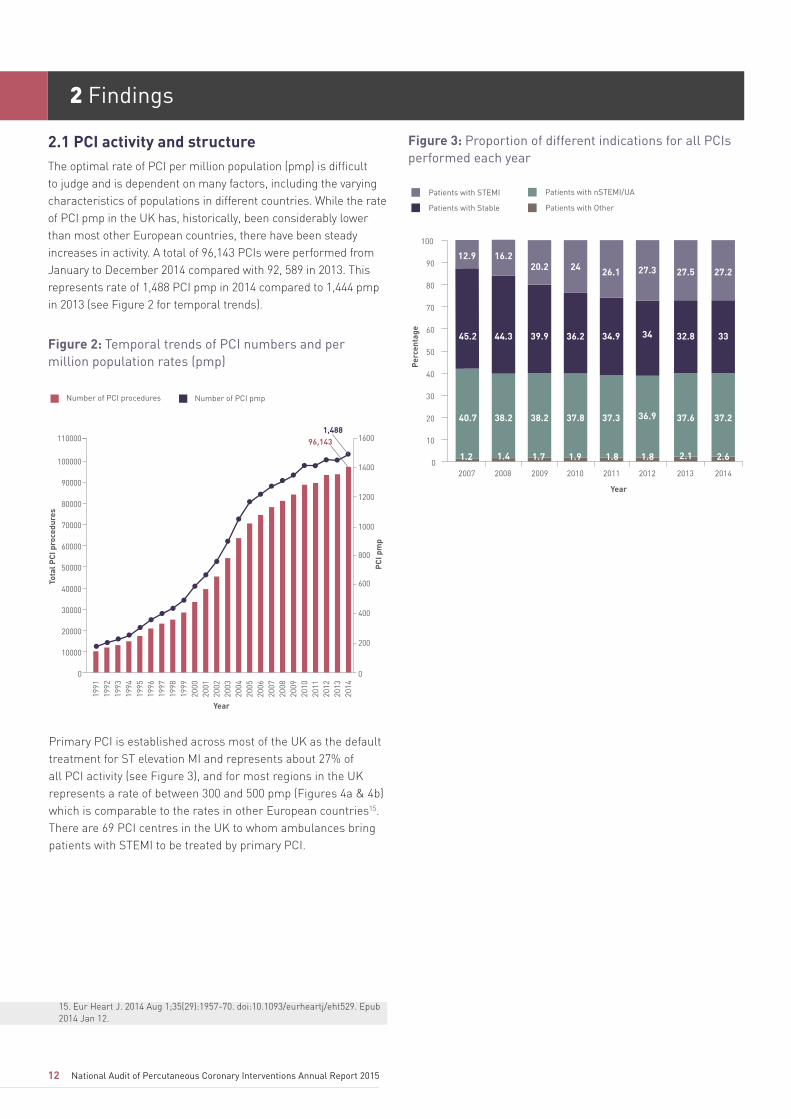
Recent trials demonstrate that newer generation drug-eluting stents are associated with slightly better outcomes for patients. There are a number of technological changes underway. Some stents are now designed where the plastic coating that contains the anti-proliferative drugs dissolve away over time. Other stents have been designed where the anti-proliferative drugs can be put on to the metallic stents without the need for a plastic coat.
Bio-absorbable vascular scaffolds (BVS) are another new technology. Once the artery has healed after a PCI, there should be no on-going need for a scaffold, though metal stents remain in position as permanent implants. The concept behind bio-absorbable vascular scaffolds is that they are eventually completely resorbed leaving no residual implanted material. Early data are encouraging, but the precise role for these devices has yet to be defined. In 2014, 485 cases were performed using these bio-absorbable devices (Figure 15). We will be following the longer term outcomes from these procedures in this audit.
0 500 1000 1500 2000 2500 3000
65
55
60
Per
cent
age
of c
ases
usi
ng D
ES
70
80
75
100
Number of PCIs per centre
90
95
85
Figure 14: Use of drug eluting stents in PCI hospitals in the UK. (See Appendix 1 for hospital codes and their corresponding names.)
23 National Audit of Percutaneous Coronary Interventions Annual Report 2015
2.4 Patient outcomesThe complications from PCI have progressively fallen as techniques have evolved. Nevertheless, this has also meant the procedure can be offered to patients who are considerably sicker, and in whom a higher risk of complications is expected.
Emergency coronary artery surgery may be needed to treat a complication. In 2014, the rate of requirement for emergency surgery remains very low at less than 0.06%. The incidence of stroke also remain low at less than 1% of all PCI procedures.
The overall rate of death in hospital following PCI has gradually increased over the years as sicker patients have been treated (particularly those with STEMI). The mortality of patients treated for similar clinical syndromes however has remained level. In the last 3 years case mix has become more stable because primary PCI had been almost fully implemented across the UK. As a result the overall in-hospital mortality has stabilised. The biggest predictor of mortality is how sick a patient is when they are treated, and almost invariably, a fatal outcome is a result of the patient’s underlying disease, rather than due to the PCI procedure – so it occurs in spite of PCI rather than due to it.
In 2014, in-hospital mortality following PCI for stable symptoms was 0.11%, following PCI for UA/NSTEMI was 0.7%, and for STEMI 5.3%. In the very sickest patients, who present with extremely damaged heart muscle, and are describes as being in cardiogenic shock, mortality was about 31%.
Nevertheless adverse outcomes will also depend on the quality of care given and the timeliness of treatment. Risk adjusted analysis attempts to account for the differences in how sick patients are when they present at the hospital, so that what remains of the variation in outcomes might be explained by the care received.
As part of the Government’s Transparency Agenda introduced in 2012 some specialties have been required to report patient clinical outcomes by an individual operator, and PCI operators have been part of this initiative which is known as the Consultant Outcome Publication. Outcomes are analysed using risk adjustment techniques to account for differences in case mix.
For the third year running, the audit shows that PCI practice with regard to the complication rates i.e. freedom from MACCE rates following PCI meets the expected standard.
In addition this year 30-day survival after a procedure was analysed at both the operator and the hospital level. This analysis made use of the records of deaths in England and Wales held by the Office of National Statistics. Again the findings are reassuring in that the survival rates for all operators and PCI centres in the UK are within the expected standards.
You can check individual hospital or specific operator outcome results on the BCIS website.
0
Num
ber
of P
CI p
roce
dure
s pm
p
70
60
50
40
30
20
10
AN
T
GH
B
LBH
NP
H
RVB
SUN
SAN
HH
RIA
GJH
HH
W
STH
BA
S
CH
N
GR
L
WA
L
MR
I
VIC
KG
H
RSC
SCM
QA
P
CLW
NH
B
LGI
PAP
BR
I
FRE
Hospital codes
BVS including other stents 485 casesBVS only 409
BVS +/- other stents65
545349
323129272222
1612
9888777652111111
Figure 15: Hospitals and their use of bio-absorbable vascular scaffolds (BVS) in PCI. (See Appendix 1 for hospital codes and their corresponding names.)

24 National Audit of Percutaneous Coronary Interventions Annual Report 2015
3 Use of audit data
3.1 National reportingThe audit and its dataset were designed in a way that allows reporting at the national level and inter-hospital comparisons. In the table there are examples of various activities and purposes for which audit data had been used to date:
3.2 Local reporting and activity
3.2.1 Aggregate data available to participating hospitals
Hospitals that participate in the audit are sent reports with aggregate figures relating to the relevant quality standards on a regular basis. The reports specified in the table below allow hospitals to review their clinical practice on a regular basis and to validate data completeness and data quality of the submitted data. Many have reported using the information from these reports in their local service review or a delay breach meetings where the clinical practice is reviewed against the quality standards.
Informing clinical guidelines The Joint Working Group on Percutaneous Coronary Intervention of the British Cardiovascular Intervention Society and the British Cardiovascular Society used audit data to develop guidelines regarding the best practice of coronary intervention.
British Cardiovascular Intervention Society
PCI centre and Individual PCI Consultant operator outcome reports 21
Comprehensive analysis of annual audit data from 1992 to present 22
Transparency of data Data underpinning some of the summary reports are published on data.gov.uk website.
Quality accounts
Department of Health Quality Accounts 2014/15: In their Quality Account providers must report which of the national clinical audits they participated in. This information is published annually and made available to the public, in order to ensure the accountability of NHS institutions to the public, and to engage the leaders of hospitals in the quality improvement agenda of their organisation.
Indicators for quality improvement
The NHS Information Centre: The NHS Information Centre Indicators for Quality Improvement are a library of clinician assured national quality indicators designed to help local clinical teams select indicators for local quality improvement.
NHS England Service Level Markers
Clinical Service Quality Markers is a programme of work that aims to provide better, more accessible information for patients - an ‘at a glance’ indication of how well services are performing and meeting patients’ needs. The intention is to develop composite measures that are based on multiple data items, whilst relying on existing data collections and indicators. The first phase of the project includes the following clinical areas; cancer, cardiac (myocardial infarction), mental health (psychosis and dementia) and musculoskeletal.
NICE Clinical Guidelines The audit data support the NICE clinical guideline consultation process when required.
21.http://www.bcis.org.uk/pages/page_box_contents. asp?pageid=774&navcatid=157
22.http://www.bcis.org.uk/documents/BCIS_Audit_2014_07102015_for_web.pdf
Hospital performance
‘Aggregate reports’ are generated by the data submitted to NICOR and distributed monthly to all PCI centres.
‘Delays reports’ calculate a number of time intervals between various stages of the emergency PCI pathway and generates graphs for door-to-balloon times.
Risk adjusted reports of MACCE and 30-day survival post procedure provide information on the number of actual events compared with predicted events.
Clinical performance The NICOR database has the facility to generate reports that can be used for consultant appraisal and revalidation. All UK Consultant PCI operators are therefore able to monitor their own activity and outcomes systematically.
25 National Audit of Percutaneous Coronary Interventions Annual Report 2015
3.2.2 Case studies about local use of clinical audit data
Although the dataset was developed to allow for the national reporting, it also serves to facilitate a local review of the quality of care provided by the hospital and individual operators. This section presents some examples of how North Wales Cardiac Centre and University Hospital of North Staffordshire have engaged with their audit data to understand the level of care and services provided to their local population.
North Wales Cardiac Centre
A local PCI service was conceived when the first dedicated cardiac catheter laboratory in North Wales opened at Glan Clwyd Hospital in 2006. At that time, North Wales Cardiac Network comprised three independent NHS Trusts, which were amalgamated as a single Local Health Board in 2009. Betsi Cadwaladr University Health Board serves a population of 700 000 spread out over nearly 2500 square miles, including remote rural and coastal communities. Patients were travelling up to 100 miles for PCI in Liverpool and Manchester, and PCI rates were less than 800 per million, some 30% below
the UK average. The main driver towards local PCI was to improve access to revascularisation. Another priority of the Health Board has been to repatriate clinical services from North West England, and it was considered important to offer patients a service with the availability of Welsh-speaking staff.
PCI began immediately after the BCIS site visit in February 2009, with three experienced consultant interventionists working in a single laboratory. It was originally envisaged that the service would provide mainly elective PCI, but it soon became clear that there was a large demand for inpatient PCI. In the first year, we performed 450 cases, of which 200 were for acute coronary syndromes. After that, PCI volume stabilised at between 500 and 550 cases per year, with a 65:35 split between acute and elective.
Because of the geographical distance from neighbouring PCI centres and the existing experience of the operators, we were keen to establish a comprehensive local service. Therefore pressure wire and intravascular ultrasound were available from the start, enabling challenging cases such as left main stem and bifurcations to be undertaken. Rotablation was introduced in 2010 and an optical coherence tomography module was acquired in 2013. Each of these developments was supported by a programme of staff training including courses, on-site proctoring, industry support and local audit. A fourth interventionist was appointed in 2014.
Dr Paul DasConsultant Interventional Cardiologist, North Wales Cardiac Centre
Ms Catrin Hanks Manager, North Wales Cardiac Network
26 National Audit of Percutaneous Coronary Interventions Annual Report 2015
The unit is developing expertise in two particular areas: chronic total occlusions and bio-absorbable vascular scaffolds. The CTO programme has expanded over the last three years to include a full range of hybrid and retrograde techniques. In this we have been supported by industry and colleagues from Liverpool Heart and Chest hospital. All operators have gained experience with BVS; we have participated in the Absorb UK Registry as the fifth highest recruiting centre.
The main barrier to further service development was lack of capacity, resulting in unacceptable delays to inpatient treatment. In 2013, following a great deal of work by the Cardiac Network, the Health Board and Welsh Assembly Government agreed to fund a second catheter laboratory. This was supported by a generous charitable donation from the Livesey Foundation in North Wales. We took the opportunity to redesign the service to better serve the needs of both inpatients and ambulant elective patients. The unit reopened as North Wales Cardiac Centre in August 2014, boasting a dedicated emergency entrance and a day case lounge. Again, Liverpool Heart and Chest Hospital kindly shared their own experience and ideas with us. We now perform 15-20 PCIs each week and aim to treat stable inpatients within one working day following referral. Over 90% of cases are trans-radial, with nearly all elective patients and 50% of inpatients discharged on the same day.
Although local primary PCI was an early ambition, Wales as a whole has lagged behind the rest of the UK in this respect and it has proved difficult to staff an on-call service. An official
weekday PPCI programme was finally launched in June 2015, in collaboration with the Welsh Ambulance Service. This covers the entire region, with air ambulance transfers from as far south as Powys and Ceredigion. A fifth interventionist is joining the unit in autumn 2015, and we hope to expand to a full 24/7 service in 2016. This will be supported by a team of dedicated specialist cardiac nurses.
Originally, data were collected on the CVIS database and uploaded to BCIS. This provided comprehensive data for local audit and enabled us to rank highly in levels of data completeness. A Centricity Cardio Workflow database was introduced when the new centre opened in 2014. This has the advantage of linking images to reports, and facilitates image export. The transition has not been entirely smooth, and we appointed a dedicated audit officer in 2015 to co-ordinate this process and ensure that our internal audit is robust and complete.
From the start, we were aware that offering patients local PCI alone was not enough. The service had to be not only convenient but also of similar scope and quality to the high standard already available in Liverpool and Manchester. The annual Consultant Outcomes Publication of risk-adjusted operator and unit outcomes has enabled us to monitor and demonstrate this, and provided a template for internal audit to improve the service. The PCI Audit has been an invaluable resource, providing reliable data to predict and plan our activity and to benchmark our performance against other units.

27 National Audit of Percutaneous Coronary Interventions Annual Report 2015
University Hospital of North Staffordshire
The cardiology service at the University Hospital of the North Midlands (UHNM) offers adult tertiary cardiac care for a population of between 1.5 and 2 million. The unit has taken part in the BCIS PCI national audit since 2006 and data on the unit’s overall activity are presented and discussed yearly at a meeting open to all clinical staff. A primary PCI service for acute ST-elevation MI was introduced in early 2007 and currently the unit undertakes more than 2000 PCI cases per year. In the last 10-years the unit has grown exponentially in all areas and during this period PCI clinical audit data, collected as part of the BCIS national audit programme, have been regularly used to support critical review of practice, promote learning and drive improvements in quality of care and outcomes for our patients with ischaemic heart disease.
The improvements brought about by systematic audit have been numerous. Some are very well defined and very specific, for example benchmarking our door-to-balloon times in primary PCI allowed us to identify room for improvement in cases sent from neighbouring district hospitals. This has led to a program of work undertaken jointly with the ambulance service and neighbouring colleagues to streamline patient pathways. Other benefits, which are at least partially attributable to rigorous clinical audit, are less well-defined but no less valuable. A culture of openness to peer review has developed which allows frank but constructive debate about individual operator practices and outcomes. A tacit agreement seems to have been reached that our goal is to provide the best quality care for all patients passing through the PCI service using any and all means available, including the forsaking of individual operator egos when necessary. This attitude nurtures effective teamwork and collaboration between operators, particularly on challenging cases.
Furthermore, pathways of care have been standardised based on sound evidence to reduce the risk of human error and minimise idiosyncratic practices.
We believe that our taking part in the National Audit of Percutaneous Coronary Interventions has served our patients very well to date, and we look to the future with enthusiasm tainted by a modicum of concern. Clinical audit will become an increasingly important part of assuring heart disease patients of high-quality care but it will only be of value If it is conducted rigorously, is fully supported and suitably resourced. There are no signs of patient numbers decreasing and treatment options are becoming ever more complex. Rigorous audit is resource hungry and whether or not the NHS will have afforded truly meaningful, widespread clinical audit over the next 10 years remains to be seen.
Dr Adrian LargeConsultant Cardiologist and Audit Clinical Lead, University Hospital of North Staffordshire
Adrian Shufflebotham
Cardiology Information Analyst, University Hospital of North Staffordshire

28 National Audit of Percutaneous Coronary Interventions Annual Report 2015
Improve the variety of reports available to individual PCI
Consultant Operators to allow them to monitor their practice
and outcomes
Continue to encourage compliance with the minimum data standard set out by NICOR
in collaboration with BCIS. More detail on the data standard can be found on the
NICOR website: http://www.ucl.ac.uk/nicor
4 The future
High quality information is vital to improve the care, treatment and outcomes for patients undergoing PCI. Our future plans continue to focus on improving the quality of data and timeliness of submission of data to NICOR.
Promote transparency: We will continue to publish process and outcome data for all PCI
Consultant Operators in the UK on the BCIS website. In 2014, all PCI consultant risk adjusted MACCE rates were within the expected range which is extremely reassuring and shows that in the UK a safe and high quality service
is being delivered. We will continue to identify areas where there is scope for improvements
in both processes and outcomes
Improve data quality by encouraging the use of consistent definitions and support
internal audit to assess accuracy. The responsibility for recording adverse events
rests with the PCI operators, the data collection staff and clinical governance teams at the PCI
hospital. These data cannot be validated by NICOR but we can support the process
In 2016/17 we plan to...
29 National Audit of Percutaneous Coronary Interventions Annual Report 2015
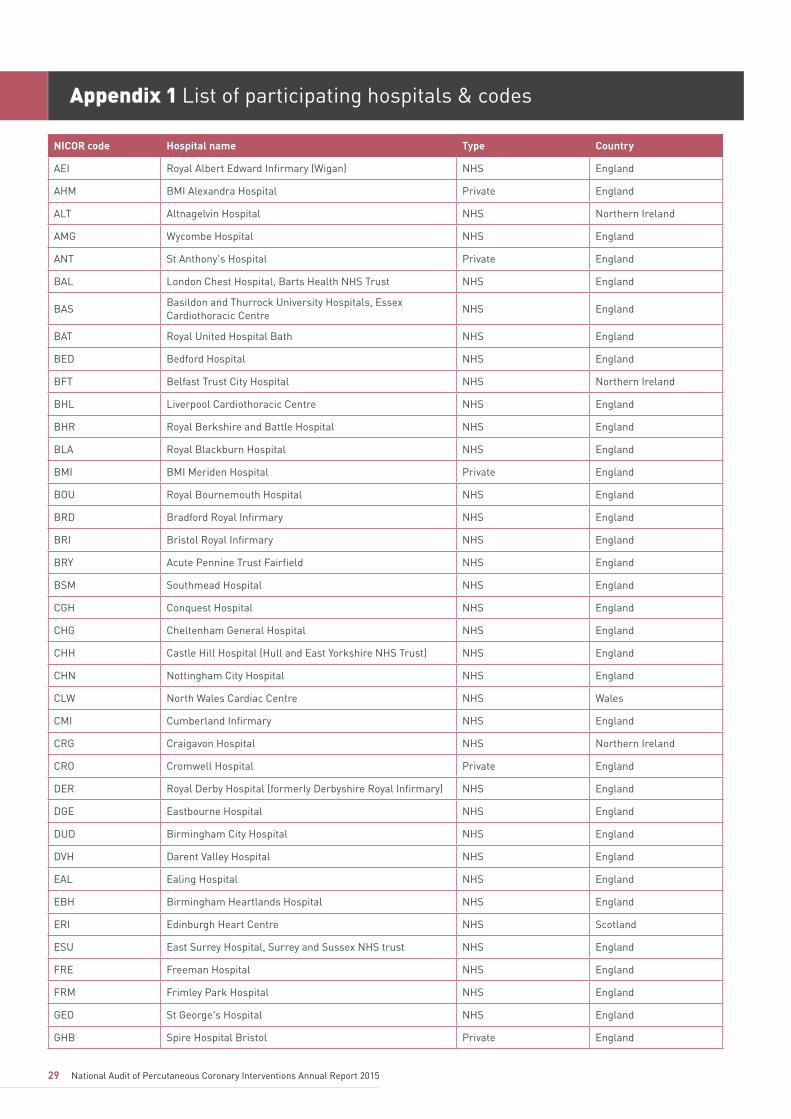
NICOR code Hospital name Type Country
AEI Royal Albert Edward Infirmary (Wigan) NHS England
AHM BMI Alexandra Hospital Private England
ALT Altnagelvin Hospital NHS Northern Ireland
AMG Wycombe Hospital NHS England
ANT St Anthony's Hospital Private England
BAL London Chest Hospital, Barts Health NHS Trust NHS England
BASBasildon and Thurrock University Hospitals, Essex Cardiothoracic Centre
NHS England
BAT Royal United Hospital Bath NHS England
BED Bedford Hospital NHS England
BFT Belfast Trust City Hospital NHS Northern Ireland
BHL Liverpool Cardiothoracic Centre NHS England
BHR Royal Berkshire and Battle Hospital NHS England
BLA Royal Blackburn Hospital NHS England
BMI BMI Meriden Hospital Private England
BOU Royal Bournemouth Hospital NHS England
BRD Bradford Royal Infirmary NHS England
BRI Bristol Royal Infirmary NHS England
BRY Acute Pennine Trust Fairfield NHS England
BSM Southmead Hospital NHS England
CGH Conquest Hospital NHS England
CHG Cheltenham General Hospital NHS England
CHH Castle Hill Hospital (Hull and East Yorkshire NHS Trust) NHS England
CHN Nottingham City Hospital NHS England
CLW North Wales Cardiac Centre NHS Wales
CMI Cumberland Infirmary NHS England
CRG Craigavon Hospital NHS Northern Ireland
CRO Cromwell Hospital Private England
DER Royal Derby Hospital (formerly Derbyshire Royal Infirmary) NHS England
DGE Eastbourne Hospital NHS England
DUD Birmingham City Hospital NHS England
DVH Darent Valley Hospital NHS England
EAL Ealing Hospital NHS England
EBH Birmingham Heartlands Hospital NHS England
ERI Edinburgh Heart Centre NHS Scotland
ESU East Surrey Hospital, Surrey and Sussex NHS trust NHS England
FRE Freeman Hospital NHS England
FRM Frimley Park Hospital NHS England
GEO St George's Hospital NHS England
GHB Spire Hospital Bristol Private England
Appendix 1 List of participating hospitals & codes

30 National Audit of Percutaneous Coronary Interventions Annual Report 2015
GJH Golden Jubilee National Hospital (formerly HCI) NHS Scotland
GRL Glenfield Hospital NHS England
GWE Royal Gwent Hospital NHS Wales
GWH Queen Elizabeth Hospital Woolwich NHS England
HAI Hairmyres Hospital NHS Scotland
HAM Hammersmith Hospital NHS England
HBP Spire Hospital Hull and East Riding Private England
HHRoyal Brompton Hospital and Harefield NHS Trust, Harefield site
NHS England
HHW Wellington Hospital Private England
HSC Harley Street Clinic Private England
IND London Independent Hospital Private England
KCH Kings College Hospital NHS England
KGH Kettering General Hospital NHS England
KMH Kings Mill Hospital NHS England
KSX Tunbridge Wells Hospital NHS England
LBH London Bridge Hospital Private England
LEB Spire Hospital Leeds Private England
LGI Yorkshire Heart Centre (Leeds General Infirmary) NHS England
LIN Lincoln County Hospital NHS England
LIS Lister Hospital NHS England
LNH Leeds Nuffield Hospital Private England
MAY Croydon University Hospital NHS England
MDW Medway Maritime Hospital NHS England
MHO Manor Hospital Oxford Private England
MOR Morriston Hospital NHS Wales
MPH Musgrove Park Hospital NHS England
MRI Manchester Royal Infirmary NHS England
NCR New Cross Hospital NHS England
NGS Northern General Hospital NHS England
NHBRoyal Brompton Hospital and Harefield NHS Trust, Brompton site
NHS England
NHH Basingstoke and North Hampshire Hospital NHS England
NIN Ninewells Hospital NHS Scotland
NOR Norfolk and Norwich University Hospital NHS England
NPH Northwick Park Hospital NHS England
NTH Northampton General Hospital NHS England
PAP Papworth Hospital NHS England
PHB BMI Priory Hospital Private England
PHN BMI Park Hospital Private England
PIN Pinderfields General Hospital NHS England
PLY Derriford Hospital, Southwest Cardiothoracic Centre NHS England
PMS Great Western Hospital, Wiltshire Cardiac Centre NHS England
QAP Queen Alexandra Hospital NHS England
NICOR code Hospital name Type Country

31 National Audit of Percutaneous Coronary Interventions Annual Report 2015
QEB Queen Elizabeth Hospital, Birmingham NHS England
RAD John Radcliffe Hospital NHS England
RAI Raigmore Hospital NHS Scotland
RCH Royal Cornwall Hospital NHS England
RDE Royal Devon & Exeter Hospital NHS England
RFH Royal Free Hospital NHS England
RHH Ross Hall Hospital Private Scotland
RHI Calderdale Royal Hospital NHS England
RIA Aberdeen Royal Infirmary NHS Scotland
RSC Royal Sussex County Hospital NHS England
RVB Royal Victoria Hospital NHS Northern Ireland
SAL Salisbury District Hospital NHS England
SAN Sandwell General Hospital NHS England
SCM James Cook University Hospital NHS England
SCU Scunthorpe General Hospital NHS England
SGH Southampton General Hospital NHS England
SPH St Peter's Hospital NHS England
SSP Spire Shawfair Park Hospital Private Scotland
STH St Thomas' Hospital NHS England
STOCity General Hospital (University Hospital of North Staffordshire)
NHS England
SUN Sunderland Royal Hospital NHS England
TOR Torbay Hospital NHS England
UCL Heart Hospital (UCLH) NHS England
UHW University Hospital of Wales NHS Wales
VIC Blackpool Victoria Hospital NHS England
WAL Walsgrave Hospital (University Hospital Coventry) NHS England
WAT Watford General Hospital NHS England
WDH Dorset County Hospital NHS England
WEX Wexham Park Hospital NHS England
WHH William Harvey Hospital, East Kent Hospitals NHS Trust NHS England
WRC Worcester Royal Hospital NHS England
WRG Worthing Hospital NHS England
WYT Wythenshawe Hospital NHS England
YDH York District General Hospital NHS England
NICOR code Hospital name Type Country

32 National Audit of Percutaneous Coronary Interventions
Appendix 2 Data completeness
Key
This table presents data completeness rates for key variables used for various analyses to measure the process of care and patient outcomes.
Pink - less than 50%; Light Pink - more than 50% but less than 90%; White - more than 90%; 0 = missing data
Hospital name Hospital code
Date of birth
Sex Medical history
Pre procedure shock
Procedure urgency
Vessels treated
Renal disease
Diabetes Discharge date
Discharge status
PCI hospital outcome
NHS number
Creatinine Weight Patient location at the time of STEMI
Aberdeen Royal Infirmary RIA 100 100 99.23 100 100 100 94.25 99.9 100 100 100 n/a 99.9 99.52 94.58
Acute Pennine Trust Fairfield
BRY 100 100 99.57 98.56 100 100 99.79 99.79 99.79 100 100 100 23.08 35.04 100
Altnagelvin Hospital ALT 100 98.29 94.57 99.22 100 100 96.57 98.71 86.57 94.43 100 n/a 42.14 45.71 81.11
Barts and the London BAL 99.22 96.85 97.95 99.36 100 100 97.85 98.86 94.11 97.9 94.42 97.85 0 59.15 0
Basildon Hospital BAS 100 100 88.14 99.45 99.85 100 85.49 97.31 99.62 99.83 99.56 99.49 90.83 40.3 98.92
Basingstoke and North Hampshire Hospital
NHH 100 99.78 100 0.36 100 100 90.93 79.27 0.22 99.57 0.43 99.35 61.77 41.68 85.71
Bedford Hospital BED 100 100 92.65 100 100 100 100 100 100 100 100 100 100 100 100
Belfast City Hospital BFT 100 100 100 100 100 100 71.58 100 100 100 100 n/a 13.93 95.44 50
Birmingham City Hospital DUD 100 99.83 99.66 100 100 100 95.98 98.66 100 100 99.81 98.83 81.74 55.28 96.88
Birmingham Heartlands Hospital
EBH 100 100 95.89 99.82 100 100 97.97 88.88 99.88 98.84 99.94 99.71 67.23 82.74 97.95
Blackpool Victoria Hospital VIC 99.89 99.94 98.93 99.53 99.48 100 99.94 100 98.6 100 91.81 98.93 97.87 97.25 88.54
BMI The Alexandra Hospital
AHM 98.68 100 38.16 0 100 100 59.21 61.84 6.58 97.37 100 0 0 0 100
Bradford Royal Infirmary BRD 100 99.7 100 100 100 100 100 100 95.55 95.55 95.58 97.92 100 99.11 100
Bristol Royal Infirmary BRI 100 100 92.99 95.13 99.08 100 94.69 97.41 99.8 99.93 99.72 99.18 94.96 97.14 97.97
Calderdale Royal Hospital RHI 100 100 94.08 100 99.13 100 90.06 99.37 99.79 98.94 100 99.58 97.89 97.04 0
Castle Hill Hospital CHH 100 100 99.27 100 100 100 100 100 100 100 100 99.14 100 98.94 98.99
Cheltenham General Hospital
CHG 100 99.5 100 100 100 100 99.88 99.75 99.88 99.88 100 99.88 99.88 97.02 100
Conquest Hospital CGH 100 100 100 100 100 100 100 99.54 100 100 100 100 99.54 89.56 100
Craigavon Area Hospital CRG 100 100 100 100 100 100 100 100 99.49 99.87 99.86 n/a 100 99.87 100

Hospital name Hospital code
Date of birth
Sex Medical history
Pre procedure shock
Procedure urgency
Vessels treated
Renal disease
Diabetes Discharge date
Discharge status
PCI hospital outcome
NHS number
Creatinine Weight Patient location at the time of STEMI
Cromwell Hospital CRO 100 100 91.67 100 100 100 93.33 93.33 100 100 100 0 65 73.33 100
Croydon University Hospital MAY 100 100 98.38 100 100 100 99.77 99.77 100 100 100 99.77 99.31 94 100
Cumberland Infirmary CMI 99.85 100 89.94 100 99.84 100 89.32 92.57 97.99 97.83 93.42 96.75 86.22 67.49 77.4
Darent Valley Hospital DVH 100 100 97.45 100 100 100 84.31 99.27 93.07 95.62 100 99.64 99.27 97.81 83.33
Derriford Hospital PLY 100 100 99.74 100 100 100 100 100 100 100 99.87 99.6 97.36 94.86 100
Dorset County Hospital WDH 100 99.35 85.16 100 99.26 100 93.33 97.63 94.19 93.98 97.79 90.32 76.13 96.56 93.75
Ealing Hospital EAL 100 100 100 83.65 100 100 96.15 71.63 98.56 98.56 100 99.52 85.1 81.73 50
East Surrey Hospital ESU 96.46 100 96.23 62.45 100 100 62.5 70.28 96.23 99.53 96.23 100 8.96 29.72 33.33
Eastbourne DGH DGE 100 100 100 100 100 100 100 100 100 100 100 99.72 99.72 90.14 100
Freeman Hospital FRE 100 99.9 97.66 98.78 100 100 97.72 98.11 100 100 100 99.35 96.65 95.54 95.87
Frenchay Hospital FRY 100 100 100 100 100 100 100 100 100 100 100 100 100 100 100
Frimley Park Hospital FRM 100 100 100 100 100 100 100 100 100 100 100 99.52 40.89 39.38 99.3
Glenfield Hospital GRL 99.93 100 99.37 100 100 100 99.02 99.3 100 100 100 99.79 98.25 99.3 100
Golden Jubilee Hospital GJH 100 100 95.54 100 100 100 95.11 97.51 98.66 98.94 98.43 n/a 0.34 93.2 66.46
Hairmyres Hospital HAI 100 100 99.93 11.37 100 100 47.55 63.17 14.82 20.29 97.05 n/a 0 46.47 31.62
Hammersmith Hospital HAM 100 100 100 99.66 99.49 100 99.41 99.71 99.41 100 99.19 97.21 98.02 91.73 99.76
Harefield Hospital HH 100 100 98.55 99.57 100 100 94.53 97.17 99.14 99.93 97.49 93.3 8.43 3.56 94.28
Harley Street Clinic HSC 100 100 95.28 100 100 100 95.28 96.23 100 100 100 0 3.77 99.06 100
James Cook University Hospital
SCM 100 100 99.68 100 100 100 100 99.79 100 100 99.94 99.89 100 99.68 100
John Radcliffe Hospital RAD 100 100 99.75 100 100 100 100 90.39 99.38 99.94 99.87 98.48 98.27 49.6 71.03
Kettering General Hospital KGH 100 100 99.73 100 100 100 100 100 100 100 100 99.59 80.96 90.45 85.67
KIMS Hospital Kent* KIM 100 100 100 0 100 100 100 100 100 100 100 0 100 100 100
King's College Hospital KCH 100 99.94 95 99.88 99.54 100 93.58 96.63 60.35 100 99.28 96.74 60.67 36.08 99.72
Kings Mill Hospital KMH 100 100 100 82.46 87.39 100 95.87 97.52 91.32 90.91 100 96.69 89.26 98.76 100
Leeds General Infirmary LGI 100 100 97.07 100 100 100 96.15 97.99 99.66 99.96 99.52 99.54 93.38 95.81 99.09
Lincoln County Hospital LIN 100 100 69.97 99.88 99.54 100 60.15 85.15 100 100 41.6 99.83 98.15 99.33 83.96
Lister Hospital LIS 100 96.17 98.33 99.79 100 100 98.68 99.28 100 100 100 99.88 99.52 99.52 100
33 National Audit of Percutaneous Coronary Interventions

Hospital name Hospital code
Date of birth
Sex Medical history
Pre procedure shock
Procedure urgency
Vessels treated
Renal disease
Diabetes Discharge date
Discharge status
PCI hospital outcome
NHS number
Creatinine Weight Patient location at the time of STEMI
Liverpool Heart and Chest Hospital
BHL 100 99.12 100 100 100 100 100 99.96 97.18 97.25 99.89 99.4 93.58 87.58 95.02
London Bridge Hospital LBH 100 100 100 100 100 100 100 100 99.46 100 100 6.67 55.98 100 100
Luton & Dunstable Hospital LDH 100 100 95.49 100 100 100 92.48 100 99.25 100 100 100 100 74.44 100
Manchester Royal Infirmary
MRI 100 100 100 100 100 100 81.87 85.18 100 100 100 90.99 100 7.92 81.94
Manor Hospital, Oxford MHO 100 37.5 100 100 100 100 100 100 37.5 29.17 95.45 0 100 100 100
Medway Maritime Hospital MDW 100 100 100 98.85 100 100 95.35 97.67 98.84 99.42 99.42 97.09 2.91 7.56 90.91
Morriston Hospital MOR 100 99.76 97.59 97.53 100 100 96.55 98.23 99.84 100 98.88 99.76 87.08 97.51 95.79
Musgrove Park Hospital MPH 99.46 99.59 100 100 100 100 99.86 99.86 99.05 98.51 99.85 98.64 95.92 99.73 99.46
New Cross Hospital NCR 100 99.85 100 99.89 100 100 100 100 100 100 100 100 95.83 97.81 100
Ninewells Hospital NIN 100 100 99.87 100 100 100 100 100 93.77 100 99.74 n/a 0 4.5 0
Norfolk and Norwich University Hospital
NOR 100 100 99.5 99.4 99.72 100 93.2 99.75 100 100 99.86 99.63 68.56 88.96 99.51
North Wales Cardiac Centre
CLW 100 100 94.27 99.47 100 100 97.13 98.57 77.96 81.36 99.25 94.08 63.98 74.01 96.43
Northampton General Hospital
NTH 100 99.75 99.75 99.14 100 100 98.75 99.5 99 100 99.48 99 93.02 99.75 92.86
Northern General Hospital NGS 100 100 84.72 92.49 100 100 89.33 93.79 100 99.67 94.93 99.67 0 0 95.74
Northwick Park Hospital NPH 100 100 99.86 100 100 100 99.72 99.86 99.86 100 99.5 97.63 99.72 97.08 94.12
Nottingham City Hospital CHN 100 99.91 83.26 100 100 100 66.61 85.81 99.47 99.47 99.43 99.74 71.1 46.96 95.78
Papworth Hospital PAP 99.96 100 100 100 100 100 100 99.96 100 99.96 100 100 65.92 91.61 97.71
Pinderfields General Hospital
PIN 100 100 100 100 100 100 100 100 100 100 100 100 100 99.68 100
Priory Hospital PHB 100 100 100 0 100 100 95.65 100 34.78 43.48 95.65 4.35 65.22 86.96 100
Queen Alexandra Hospital QAP 98.93 99.59 100 100 100 100 99.92 99.75 100 99.92 100 97.11 98.19 82.14 99.23
Queen Elizabeth Hospital Woolwich
GWH 100 99.54 98.62 48.28 99.54 100 87.56 83.87 95.85 95.85 100 99.54 95.39 100 50
Queen Elizabeth Hospital, Edgbaston
QEB 100 100 100 100 100 100 100 100 100 100 100 99.5 99.87 99.87 100
Raigmore Hospital RAI 100 100 95.99 100 100 100 99.47 98.93 100 100 100 n/a 100 100 100
Royal Albert Edward Infirmary
AEI 100 98.69 99.21 98.8 97.67 100 94.75 94.23 98.16 97.9 99.71 98.16 92.91 92.65 0
Royal Berkshire Hospital BHR 100 100 100 100 100 100 100 100 99.63 99.63 99.81 99.25 64.42 55.62 46.32
Royal Blackburn Hospital BLA 100 100 99.86 100 97.4 100 98.91 96.06 91.85 92.66 99.86 96.6 20.11 89.81 91.67
34 National Audit of Percutaneous Coronary Interventions

Hospital name Hospital code
Date of birth
Sex Medical history
Pre procedure shock
Procedure urgency
Vessels treated
Renal disease
Diabetes Discharge date
Discharge status
PCI hospital outcome
NHS number
Creatinine Weight Patient location at the time of STEMI
Royal Bournemouth General Hospital
BOU 100 100 69.77 99.91 100 100 86.06 95.43 44.26 93.25 99.85 99.63 74.45 84.12 93.75
Royal Brompton Hospital NHB 99.87 100 100 98.95 100 100 98.42 98.94 100 100 97.09 95.44 93.8 93.4 82.35
Royal Cornwall Hospital RCH 100 100 99.88 100 100 100 97.42 97.3 100 100 100 100 99.14 70.67 99.56
Royal Derby Hospital DER 100 100 91.44 99.46 100 100 95.4 96.96 93.38 99.72 99.62 97.88 36.52 95.86 97.65
Royal Devon & Exeter Hospital
RDE 100 100 100 100 100 100 100 100 99.89 99.89 100 99.67 98.44 99.44 99.64
Royal Free Hospital RFH 100 100 0.11 100 100 100 100 100 100 100 100 97.7 45.46 34.92 90.48
Royal Gwent Hospital GWE 100 100 99.16 96.94 100 100 99.37 99.16 98.32 98.53 97.09 95.17 43.07 98.32 90.91
Royal Infirmary of Edinburgh
ERI 100 100 68.24 100 100 100 86.57 97.62 62.37 62.74 99.91 n/a 5.87 4.63 71.48
Royal Sussex County Hospital
RSC 100 100 94.91 99.17 100 100 93.67 98.27 99.9 100 98.35 99.9 16.6 85.12 98.21
Royal United Hospital Bath BAT 100 100 73.7 99.71 100 100 90.9 97.69 95.09 95.23 99.81 100 57.51 66.76 81.82
Royal Victoria Hospital RVB 100 100 61.18 100 100 100 82.36 93.57 98.81 98.75 99.71 n/a 32.07 96.73 97.28
Salisbury District Hospital SAL 100 100 100 100 100 100 97.07 99.63 99.82 100 100 98.72 94.32 97.99 100
Sandwell General Hospital SAN 99.8 100 100 100 100 100 97.85 99.22 100 100 99.35 99.41 92.19 91.6 99.2
Scunthorpe General Hospital
SCU 100 100 59.88 98.46 100 100 83.28 84.19 86.63 88.75 99.65 100 95.74 96.96 100
Southampton General Hospital
SGH 99.43 99.86 100 100 100 100 99.57 99.57 99.57 99.72 100 94.11 99.57 99.57 99.63
Southmead Hospital** BSM 100 100 100 100 100 100 100 100 100 100 100 98.96 100 100 100
Spire Bristol GHB 100 96.67 66.67 0 100 100 76.67 93.33 100 96.67 85.71 43.33 70 83.33 100
Spire Shawfair Park Hospital
SSP 100 96.77 90.32 100 100 100 96.77 96.77 87.1 90.32 89.66 0 9.68 83.87 100
St Anthony's Hospital ANT 100 100 99.38 0 100 100 99.38 100 100 100 100 50 99.38 99.38 100
St George's Hospital GEO 100 99.74 95.02 91 99.93 100 94.51 98.91 95.98 96.04 99.87 94.33 89.78 58.49 88.45
St Peter's Hospital SPH 99.39 99.88 100 100 100 100 100 100 99.88 100 100 99.02 96.46 49.08 100
St Thomas Hospital STH 100 100 99.91 100 100 100 100 99.16 100 100 99.89 98.57 98.7 100 100
Sunderland Royal Hospital SUN 100 100 98.44 99.67 99.62 100 99.83 99.48 85.76 83.68 81.47 99.48 90.45 74.13 58.97
The Great Western Hospital PMS 100 100 100 100 100 100 100 100 100 100 100 100 99.67 99.35 90.7
The Ipswich Hospital IPS 100 100 95.57 100 100 100 100 100 79.34 89.3 100 99.63 94.46 98.89 100
Torbay Hospital TOR 100 100 99.77 99.12 100 100 99.08 99.77 100 100 99.76 100 98.39 96.79 96.2
35 National Audit of Percutaneous Coronary Interventions

Hospital name Hospital code
Date of birth
Sex Medical history
Pre procedure shock
Procedure urgency
Vessels treated
Renal disease
Diabetes Discharge date
Discharge status
PCI hospital outcome
NHS number
Creatinine Weight Patient location at the time of STEMI
Tunbridge Wells Hospital KSX 100 100 100 100 100 100 100 79.75 97.93 97.93 100 97.93 85.95 90.5 100
University College Hospital UCL 100 100 99.38 100 100 100 98.89 99.26 99.38 99.75 100 96.47 82.14 81.4 92.8
University Hospital Coventry
WAL 99.9 100 94.47 99.74 100 100 95.44 98.16 95.25 99.13 98.34 98.25 1.26 57.61 94.42
University Hospital of North Staffordshire
STO 99.39 99.76 99.95 100 99.95 100 87.79 98.4 98.44 99.34 100 99.34 37.25 58.7 98.97
University Hospital of Wales
UHW 100 99.94 96.7 99.12 99.8 100 96.58 98.75 96.01 98.26 96.74 79.2 30.95 98.19 83.55
Watford General Hospital WAT 100 100 100 97.96 100 100 99.14 99.43 26.65 26.36 100 97.99 61.89 81.95 75
Wellington Hospital North HHW 100 100 99.4 100 100 100 96.08 97.59 99.7 100 100 2.26 9.04 100 100
Wexham Park Hospital WEX 100 100 100 100 100 100 100 100 99.76 100 100 96.61 21.26 100 7.32
William Harvey Hospital WHH 100 100 89.77 98.25 99.9 100 91.33 93.27 95.81 96.69 97.2 96.27 96.39 95.03 97.98
Worcestershire Royal Hospital
WRC 98.77 99.53 100 100 100 100 97.83 100 99.34 99.24 99.9 98.96 97.83 99.05 100
Worthing Hospital WRG 100 99.85 99.24 100 100 100 93.77 99.39 99.09 99.54 100 100 87.08 76.14 100
Wycombe Hospital AMG 100 100 93.04 99.15 100 100 93.81 94 99.23 99.42 100 99.81 94.39 92.26 92.16
Wythenshawe Hospital WYT 100 100 100 100 100 100 100 100 100 100 100 100 100 84.68 100
York District Hospital YDH 100 100 100 97.42 93.33 100 99.1 96.4 90.09 90.09 100 99.55 100 27.93 100
36 National Audit of Percutaneous Coronary Interventions
**Services from Frenchay Hospital (FRY) were moved to Southmead Hospital (BSM)

Appendix 3 Arterial access
2013 2014
Hospital nameHospital code
Number of records eligible for this analysis
Percentage of procedures where right or left radial artery was used for access
Number of records eligible for this analysis
Percentage of procedures where right or left radial artery was used for access
n % n %
National average Overall 90163 71.20 93143 75.30
Aberdeen Royal Infirmary RIA 1072 81.72 1044 83.52
Acute Pennine Trust Fairfield
BRY 473 61.73 438 56.85
Altnagelvin Hospital ALT 474 92.19 581 94.49
Bart's Heart Centre BAL 2251 68.86 2126 67.50
Basildon Hospital BAS 2132 75.70 2050 77.56
Basingstoke and North Hampshire Hospital
NHH 455 1.98 461 1.95
Bedford Hospital BED 385 71.43 434 81.80
Belfast City Hospital BFT 1034 92.94 1075 94.23
Birmingham City Hospital DUD 475 80.21 528 83.90
Birmingham Heartlands Hospital
EBH 1531 72.18 1598 71.53
Blackpool Victoria Hospital VIC 1531 81.52 1541 82.93
BMI The Alexandra Hospital
AHM 38 44.74 24 70.83
Bradford Royal Infirmary BRD 260 81.92 294 83.67
Bristol Royal Infirmary BRI 1369 76.92 1413 78.63
Calderdale Royal Hospital RHI 459 83.66 460 88.48
Castle Hill Hospital CHH 1503 74.92 1354 79.39
Cheltenham General Hospital
CHG 664 72.59 775 76.39
Conquest Hospital CGH 419 59.19 425 57.41
Craigavon Area Hospital CRG 818 92.42 713 92.99
Cromwell Hospital CRO 58 29.31 52 42.31
37 National Audit of Percutaneous Coronary Interventions

2013 2014
Hospital nameHospital code
Number of records eligible for this analysis
Percentage of procedures where right or left radial artery was used for access
Number of records eligible for this analysis
Percentage of procedures where right or left radial artery was used for access
n % n %
Croydon University Hospital MAY 358 51.12 347 66.57
Cumberland Infirmary CMI 486 81.69 607 85.01
Darent Valley Hospital DVH 260 90.38 247 87.45
Derriford Hospital PLY 743 84.52 755 84.11
Dorset County Hospital WDH 374 85.03 397 85.14
Ealing Hospital EAL 196 15.82 206 22.33
East Surrey Hospital ESU 371 1.62 424 15.57
Eastbourne DGH DGE 334 32.04 347 44.38
Freeman Hospital FRE 2869 79.78 2900 79.83
Frenchay Hospital** FRY 204 33.33 97 36.08
Frimley Park Hospital FRM 998 60.92 1128 78.99
Glenfield Hospital GRL 1472 73.37 1320 71.89
Golden Jubilee Hospital GJH 2604 92.43 2795 93.92
Hairmyres Hospital HAI 1246 86.44 1369 86.41
Hammersmith Hospital HAM 1346 38.34 1360 49.34
Harefield Hospital HH 1516 56.93 1512 60.52
Harley Street Clinic HSC 102 30.39 81 35.80
James Cook University Hospital
SCM 1697 90.87 1766 92.92
John Radcliffe Hospital RAD 1620 77.16 1515 83.50
Kettering General Hospital KGH 1148 72.56 1216 84.54
KIMS Hospital Kent* KIM n/a n/a 9 77.78
King's College Hospital KCH 1211 73.74 1336 76.87
Kings Mill Hospital KMH 288 53.82 138 68.84
Leeds General Infirmary LGI 2201 81.33 2288 85.01
Lincoln County Hospital LIN 951 66.25 1076 77.42
Lister Hospital LIS 583 69.81 734 72.75
38 National Audit of Percutaneous Coronary Interventions

2013 2014
Hospital nameHospital code
Number of records eligible for this analysis
Percentage of procedures where right or left radial artery was used for access
Number of records eligible for this analysis
Percentage of procedures where right or left radial artery was used for access
n % n %Liverpool Heart and Chest Hospital
BHL 2700 85.93 2652 87.48
London Bridge Hospital LBH 154 37.66 126 60.32
Luton & Dunstable Hospital*
LDH n/a n/a 132 83.33
Manchester Royal Infirmary
MRI 1417 63.09 1689 68.09
Manor Hospital, Oxford MHO n/a n/a 22 90.91
Medway Maritime Hospital MDW 110 71.82 168 83.33
Morriston Hospital MOR 1238 81.99 1133 82.44
Musgrove Park Hospital MPH 658 35.41 664 35.09
New Cross Hospital NCR 1337 81.38 1263 80.92
Ninewells Hospital NIN 695 84.89 754 86.87
Norfolk and Norwich University Hospital
NOR 1359 85.43 1401 87.87
North Wales Cardiac Centre
CLW 513 80.12 533 92.68
Northampton General Hospital
NTH 438 81.05 383 81.46
Northern General Hospital NGS 1437 55.74 1737 70.70
Northwick Park Hospital NPH 542 21.40 588 41.33
Nottingham City Hospital CHN 1076 71.84 1054 75.81
Papworth Hospital PAP 2088 74.52 2214 82.16
Pinderfields General Hospital
PIN 308 52.27 314 57.64
Priory Hospital PHB 32 90.62 23 82.61
Queen Alexandra Hospital QAP 1122 86.90 1096 89.96
Queen Elizabeth Hospital Woolwich
GWH 232 68.10 212 60.85
Queen Elizabeth Hospital, Edgbaston
QEB 766 85.51 694 89.77
Raigmore Hospital RAI 318 84.28 364 84.89
Royal Albert Edward Infirmary
AEI 366 92.62 342 91.52
39 National Audit of Percutaneous Coronary Interventions

2013 2014
Hospital nameHospital code
Number of records eligible for this analysis
Percentage of procedures where right or left radial artery was used for access
Number of records eligible for this analysis
Percentage of procedures where right or left radial artery was used for access
n % n %
Royal Berkshire Hospital BHR 300 88.67 390 82.31
Royal Blackburn Hospital BLA 662 94.41 725 96
Royal Bournemouth General Hospital
BOU 1911 79.12 2044 80.53
Royal Brompton Hospital NHB 762 20.34 753 39.44
Royal Cornwall Hospital RCH 856 82.48 810 86.42
Royal Derby Hospital DER 803 49.07 1048 48.95
Royal Devon & Exeter Hospital
RDE 898 19.82 898 50.22
Royal Free Hospital RFH 693 59.45 745 68.59
Royal Gwent Hospital GWE 571 91.42 446 92.83
Royal Infirmary of Edinburgh
ERI 1916 87.11 1653 87.11
Royal Sussex County Hospital
RSC 998 34.77 1023 47.51
Royal United Hospital Bath BAT 533 75.42 519 81.50
Royal Victoria Hospital RVB 1384 92.49 1682 92.03
Salisbury District Hospital SAL 355 87.61 433 89.84
Sandwell General Hospital SAN 367 80.93 461 87.42
Scunthorpe General Hospital
SCU 277 27.44 282 42.20
Southampton General Hospital
SGH 608 43.26 637 46.78
Southmead Hospital** BSM n/a n/a 91 45.05
Spire Bristol GHB 18 61.11 27 44.44
Spire Shawfair Park Hospital
SSP 30 63.33 29 79.31
St Anthony's Hospital ANT 124 23.39 145 37.93
St George's Hospital GEO 1626 31.18 1528 32.98
St Peter's Hospital SPH 632 34.49 704 32.67
St Thomas Hospital STH 864 29.17 946 40.27
Sunderland Royal Hospital SUN 349 83.95 529 80.91
40 National Audit of Percutaneous Coronary Interventions

2013 2014
Hospital nameHospital code
Number of records eligible for this analysis
Percentage of procedures where right or left radial artery was used for access
Number of records eligible for this analysis
Percentage of procedures where right or left radial artery was used for access
n % n %
The Great Western Hospital PMS 398 82.91 306 81.05
The Ipswich Hospital* IPS n/a n/a 242 73.55
Torbay Hospital TOR 407 62.90 414 65.22
Tunbridge Wells Hospital KSX 301 6.98 229 11.35
University College Hospital UCL 788 37.56 714 52.24
University Hospital Coventry
WAL 1029 85.71 1023 85.73
University Hospital of North Staffordshire
STO 1779 79.82 1965 84.58
University Hospital of Wales
UHW 1445 93.77 1532 91.91
Watford General Hospital WAT 238 63.45 240 66.25
Wellington Hospital North HHW 250 57.6 270 68.15
Wexham Park Hospital WEX 299 50.5 355 50.99
William Harvey Hospital WHH 879 66.21 977 67.35
Worcestershire Royal Hospital
WRC 953 92.97 996 94.58
Worthing Hospital WRG 503 29.62 536 37.31
Wycombe Hospital AMG 496 61.49 482 67.84
Wythenshawe Hospital WYT 1158 80.57 1191 90.43
York District Hospital YDH 217 81.11 209 89
41 National Audit of Percutaneous Coronary Interventions
*n/a = no data as the hospital only started performing PCI in 2014
**Services from Frenchay Hospital (FRY) were moved to Southmead Hospital (BSM)

42 National Audit of Percutaneous Coronary Interventions Annual Report 2015
Appendix 4 Membership of NAPCI steering group/data monitoring group
Name Role Organisation
Dr Peter Ludman Chairman, NAPCI Clinical Lead, BCIS Audit Lead; Consultant Cardiologist
University Hospitals Birmingham NHS Foundation Trust
Dr Mark de Belder Consultant Cardiologist South Tees Hospitals NHS Foundation Trust
Dr Rod Stables Consultant Cardiologist; Research Lead for Interventional Cardiology Institute of Cardiovascular Medicine and Science (Liverpool)
Liverpool Heart and Chest Hospital NHS
Foundation Trust
Dr Rob Henderson Consultant Cardiologist Nottingham University Hospitals NHS Trust
Professor Adrian Banning Consultant Cardiologist, BCIS Honorary Secretary
Oxford Radcliffe Hospitals NHS Trust
Lucia Gavalova Committee Secretary, NAPCI Project Manager, NICOR
National Institute for Cardiovascular Outcomes Research (NICOR)
Dr Tim Gilbert Consultant Cardiologist Norfolk and Norwich University Hospitals NHS
Foundation Trust
Dr Andrew Wragg Consultant Cardiologist Barts Health NHS Trust
Professor Simon Redwood President of BCIS; Consultant Cardiologist Guys and St Thomas NHS Foundation Trust
Professor Nick Curzen Consultant Cardiologist University Hospital Southampton NHS Foundation Trust
Dr Darragh O'Neill Information Analyst, NICOR National Institute for Cardiovascular Outcomes Research (NICOR)
Andrew Donald Database Developer, NICOR National Institute for Cardiovascular Outcomes Research (NICOR)
Ronald van Leeven MINAP Project Manager, NICOR National Institute for Cardiovascular Outcomes Research (NICOR)
Dr Clive Weston MINAP Clinical Lead Abertawe Bro Morgannwg University Health Board
Dr David Hildick Smith BCIS Honorary Treasurer Brighton and Sussex University Hospitals NHS Trust
Dr Adam de Belder BCIS Clinical Standards Group Chair Brighton and Sussex University Hospitals NHS Trust
Sheila Jamieson Centre Database Manager/Clinical Effectiveness (Freeman Hospital)
The Newcastle Upon Tyne Hospitals NHS Foundation Trust
Alexander McLaren Senior Medical Device Specialist, MHRA Representative
Medicines & Healthcare Products Regulatory Agency
James Ian Neill Patient Representative Retired
Keith Wilson Patient Representative Liverpool Heart and Chest Hospital NHS Foundation Trust

43 National Audit of Percutaneous Coronary Interventions Annual Report 2015
5 Glossary
Term Abbreviation
Acute coronary syndrome
ACS This term covers all cardiac episodes that result from sudden and spontaneous blockage or near blockage of a coronary artery, often resulting in some degree of cardiac damage. The underlying cause of the clot is rupture of the fine lining of a heart artery (plaque rupture), which allows blood to come in contact with the tissues of the wall of the artery, promoting the development of clot. The degree of damage and the type of syndrome (heart attack) that results from the blockage depends on the size and position of the artery and the amount of clot that develops within the artery. Not all acute coronary syndromes are suitable for treatment with primary angioplasty or thrombolytic drugs, and the decision is mainly guided by the appearances of the ECG.
Angina Symptoms of chest pain that occur when narrowing of the coronary arteries prevent enough oxygen containing blood reaching the heart muscle when its demands are high, such as during exercise.
Angiogram An X-ray investigation performed under a local anaesthetic that produces images of the flow of blood within an artery (in this case the coronary artery). Narrowing and complete blockages within the arteries can be identified during the angiography and this allows decisions to be made regarding treatment. Often an angiogram is an immediate precursor to PCI and stent implantation or to coronary artery bypass grafting.
Atherosclerosis A process where the walls of the arteries develop fatty deposits called atheroma.
Cardioversion Process by which the heart is restored to normal rhythm by using an externally applied electric shock.
Case mix Different types of patients treated by a hospital or an operator
Coronary heart disease
CHD A group of diseases that includes stable and unstable angina, myocardial infarction, and sudden coronary death. It is a results of the narrowing or blockage of the coronary arteries, usually caused by atherosclerosis
Coronary lesions Is a tearing on the internal walls of the artery that can be stable and unstable.
Door-to-balloon time
DTB The interval between the ambulance arriving at a PCI hospital and the performance of primary PCI.
Elective patients Elective surgery or elective procedure is surgery that is scheduled in advance because it does not involve a medical emergency. A stable condition is one in which the condition of the patient is not expected to change in the near future.
Electrocardiogram ECG A test to record the rhythm and electrical activity of the heart. The ECG can often show if a person has had a heart attack, either recently or some time ago. It can also tell if reperfusion therapy is appropriate and if it has been effective.
Funnel plots In essence, each individual value is compared to the overall mean, and the control limits around that mean diminish as the number of subjects (or admissions) increases (as one would expect). A value which falls outside the ‘funnel’ is considered an outlier, and can represent abnormally high performance as well as abnormally low performance.
The width of the control limits is determined by the statistical significance level from which they are calculated. To diminish the risk of a false positive ‘outlier’ we use +/- 3 standard deviations, which means that the chance of an outlier happening ‘accidentally’ (i.e. by random chance) is no more than 0.4%.
The funnel plot was adapted for comparing clinical performance of surgeons, and can also be used to compare measures such as call-to-balloon time.
Heart attack The term applied to the symptoms, usually but not always involving chest pain, which develop when a clot (thrombus) develops within a heart artery as a result of spontaneous damage to the inner lining of the artery (plaque rupture). The heart muscle supplied by the blocked artery suffers permanent damage if the blood supply is not restored quickly. The damage to heart muscle carries a risk of sudden death
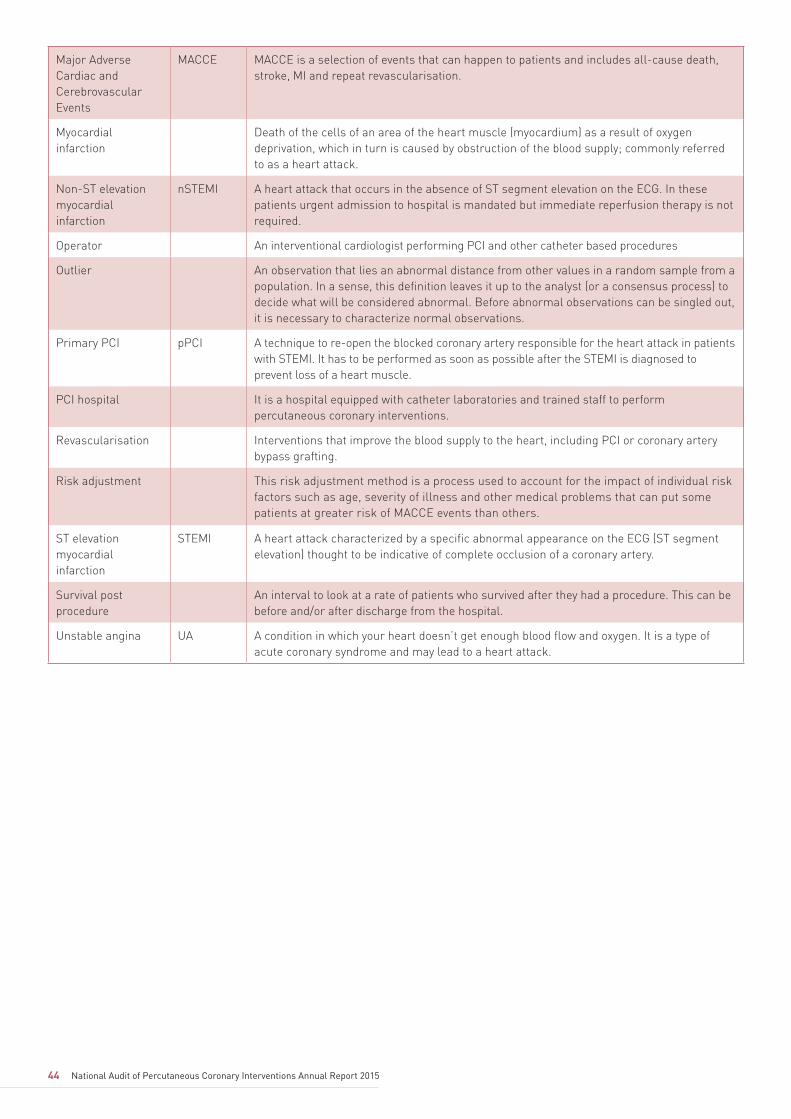
44 National Audit of Percutaneous Coronary Interventions Annual Report 2015
Major Adverse Cardiac and Cerebrovascular Events
MACCE MACCE is a selection of events that can happen to patients and includes all-cause death, stroke, MI and repeat revascularisation.
Myocardial infarction
Death of the cells of an area of the heart muscle (myocardium) as a result of oxygen deprivation, which in turn is caused by obstruction of the blood supply; commonly referred to as a heart attack.
Non-ST elevation myocardial infarction
nSTEMI A heart attack that occurs in the absence of ST segment elevation on the ECG. In these patients urgent admission to hospital is mandated but immediate reperfusion therapy is not required.
Operator An interventional cardiologist performing PCI and other catheter based procedures
Outlier An observation that lies an abnormal distance from other values in a random sample from a population. In a sense, this definition leaves it up to the analyst (or a consensus process) to decide what will be considered abnormal. Before abnormal observations can be singled out, it is necessary to characterize normal observations.
Primary PCI pPCI A technique to re-open the blocked coronary artery responsible for the heart attack in patients with STEMI. It has to be performed as soon as possible after the STEMI is diagnosed to prevent loss of a heart muscle.
PCI hospital It is a hospital equipped with catheter laboratories and trained staff to perform percutaneous coronary interventions.
Revascularisation Interventions that improve the blood supply to the heart, including PCI or coronary artery bypass grafting.
Risk adjustment This risk adjustment method is a process used to account for the impact of individual risk factors such as age, severity of illness and other medical problems that can put some patients at greater risk of MACCE events than others.
ST elevation myocardial infarction
STEMI A heart attack characterized by a specific abnormal appearance on the ECG (ST segment elevation) thought to be indicative of complete occlusion of a coronary artery.
Survival post procedure
An interval to look at a rate of patients who survived after they had a procedure. This can be before and/or after discharge from the hospital.
Unstable angina UA A condition in which your heart doesn’t get enough blood flow and oxygen. It is a type of acute coronary syndrome and may lead to a heart attack.
45 National Audit of Percutaneous Coronary Interventions Annual Report 2015
1. Dawkins KD, Gershlick T, de BM et al. Percutaneous
coronary intervention: recommendations for good practice
and training. Heart 2005; 91 Suppl 6:vi1-27
2. National Institute for Health and Clinical Excellence (2003)
TA 71. Guidance on the use of Coronary Artery Stents.
http://publications.nice.org.uk/guidance-on-the-use-
of-coronary-artery-stents-ta71
3. National Institute for Health and Clinical Excellence (2008)
TA 152. Drug-eluting stents for the treatment of coronary
artery disease. http://publications.nice.org.uk/drug-
eluting-stents-for-the-treatment-of-coronary-artery-
disease-ta152
4. Doshi SN, Ludman PF, Townend JN, Buller N. Estimated
annual requirement for drug eluting stents in a large
tertiary referral centre, according to new NICE criteria.
Heart 2004; 90(Suppl II):A41
5. National Institute for Health and Clinical Excellence (2011)
CG126 Management of Stable angina.
http://publications.nice.org.uk/management-of-stable-
angina-cg126
6. National Institute for Health and Clinical Excellence
(2010) CG94. Unstable angina and nSTEMI: the early
management of unstable angina and non-ST-segment-
elevation myocardial infarction.
http://publications.nice.org.uk/unstable-angina-and-
nstemi-cg94
7. Treatment of Heart Attack. National Guidance. Final
Report of the National Infarct Angioplasty Project
(NIAP) (2008)
8. Myocardial Ischaemia National Audit Project (2014). How
the NHS cares for patients with heart attack. Annual
Public Report. April 2013 - March 2014. http://www.ucl.
ac.uk/nicor/audits/minap/reports
9. Grayson AD, Moore RK, Jackson M et al. Multivariate
prediction of major adverse cardiac events after 9914
percutaneous coronary interventions in the north west of
England. Heart 2006; 92(5):658-663
10. National Institute for Health and Clinical Excellence
(2010). NICE clinical guideline 94. The early management
of unstable angina and non-ST-segment-elevation
myocardial infarction. http://www.nice.org.uk/
nicemedia/live/12949/47924/47924.pdf
6 References

Title
46 National Audit of Percutaneous Coronary Interventions Annual Report 2015
This work remains the sole and exclusive property of UCL and may only be reproduced where there is explicit reference to the ownership of UCL. This work may be re-used by NHS and government organisations without permission. Commercial re-use of this work must be granted by UCL.
Copyright © 2016 UCL, National Audit of Percutaneous Coronary Interventions Public Report. All rights reserved.