Embed Size (px)
Citation preview
PERCUTANEOUS CORONARY INTERVENTIONS (PCI)in New York State2012-2014May 2017
Departmentof Health

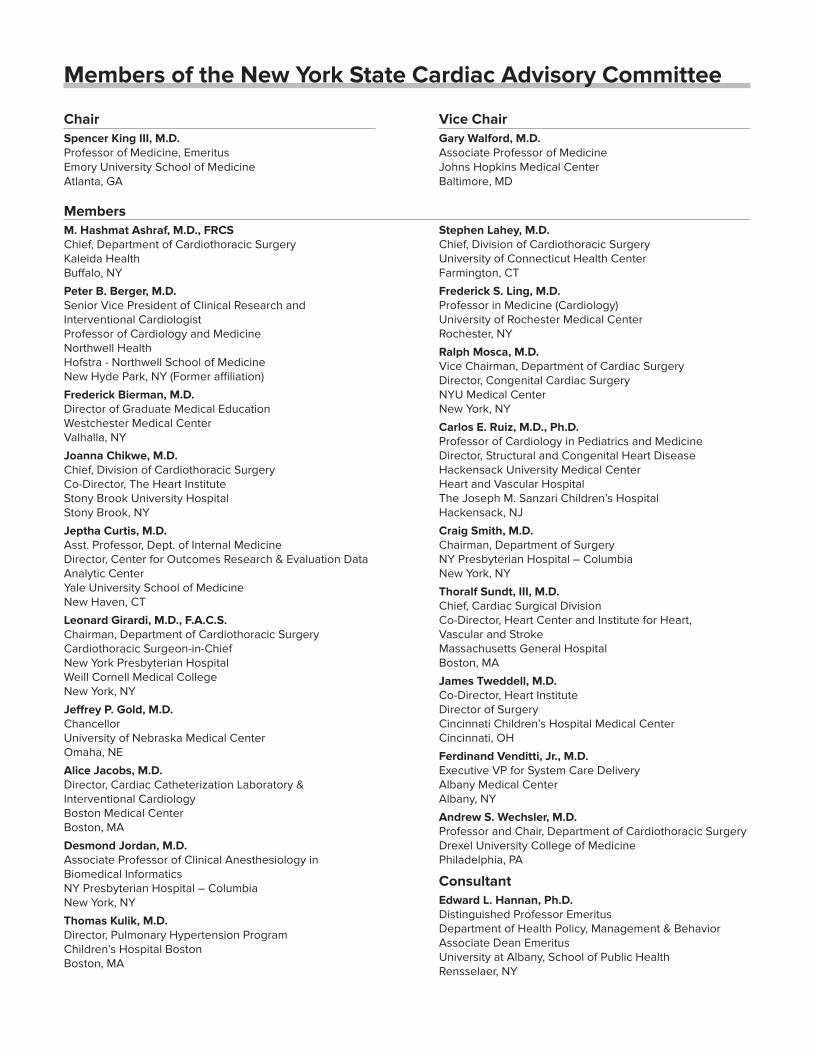
Members of the New York State Cardiac Advisory Committee
ChairSpencer King III, M.D. Professor of Medicine, Emeritus Emory University School of Medicine Atlanta, GA
Vice ChairGary Walford, M.D. Associate Professor of Medicine Johns Hopkins Medical Center Baltimore, MD
MembersM. Hashmat Ashraf, M.D., FRCS Chief, Department of Cardiothoracic Surgery Kaleida Health Buffalo, NY
Peter B. Berger, M.D. Senior Vice President of Clinical Research and Interventional Cardiologist Professor of Cardiology and Medicine Northwell Health Hofstra - Northwell School of Medicine New Hyde Park, NY (Former affiliation)
Frederick Bierman, M.D. Director of Graduate Medical Education Westchester Medical Center Valhalla, NY
Joanna Chikwe, M.D. Chief, Division of Cardiothoracic Surgery Co-Director, The Heart Institute Stony Brook University Hospital Stony Brook, NY
Jeptha Curtis, M.D. Asst. Professor, Dept. of Internal Medicine Director, Center for Outcomes Research & Evaluation Data Analytic Center Yale University School of Medicine New Haven, CT
Leonard Girardi, M.D., F.A.C.S. Chairman, Department of Cardiothoracic Surgery Cardiothoracic Surgeon-in-Chief New York Presbyterian Hospital Weill Cornell Medical College New York, NY
Jeffrey P. Gold, M.D. Chancellor University of Nebraska Medical Center Omaha, NE
Alice Jacobs, M.D. Director, Cardiac Catheterization Laboratory & Interventional Cardiology Boston Medical Center Boston, MA
Desmond Jordan, M.D. Associate Professor of Clinical Anesthesiology in Biomedical Informatics NY Presbyterian Hospital – Columbia New York, NY
Thomas Kulik, M.D. Director, Pulmonary Hypertension Program Children’s Hospital Boston Boston, MA
Stephen Lahey, M.D. Chief, Division of Cardiothoracic Surgery University of Connecticut Health Center Farmington, CT
Frederick S. Ling, M.D. Professor in Medicine (Cardiology) University of Rochester Medical Center Rochester, NY
Ralph Mosca, M.D. Vice Chairman, Department of Cardiac Surgery Director, Congenital Cardiac Surgery NYU Medical Center New York, NY
Carlos E. Ruiz, M.D., Ph.D. Professor of Cardiology in Pediatrics and Medicine Director, Structural and Congenital Heart Disease Hackensack University Medical Center Heart and Vascular Hospital The Joseph M. Sanzari Children’s Hospital Hackensack, NJ
Craig Smith, M.D. Chairman, Department of Surgery NY Presbyterian Hospital – Columbia New York, NY
Thoralf Sundt, III, M.D. Chief, Cardiac Surgical Division Co-Director, Heart Center and Institute for Heart, Vascular and Stroke Massachusetts General Hospital Boston, MA
James Tweddell, M.D. Co-Director, Heart Institute Director of Surgery Cincinnati Children’s Hospital Medical Center Cincinnati, OH
Ferdinand Venditti, Jr., M.D. Executive VP for System Care Delivery Albany Medical Center Albany, NY
Andrew S. Wechsler, M.D. Professor and Chair, Department of Cardiothoracic Surgery Drexel University College of Medicine Philadelphia, PA
ConsultantEdward L. Hannan, Ph.D. Distinguished Professor Emeritus Department of Health Policy, Management & Behavior Associate Dean Emeritus University at Albany, School of Public Health Rensselaer, NY
PCI Reporting System Analysis Workgroup
Members & ConsultantsGary Walford, M.D. (Chair) Associate Professor of Medicine Johns Hopkins Medical Center
Peter B. Berger, M.D. Senior Vice President of Clinical Research and Interventional Cardiologist Professor of Cardiology and Medicine Northwell Health Hofstra - Northwell School of Medicine (former affiliation)
Jeptha Curtis, M.D. Asst. Professor, Dept. of Internal Medicine Director, Center for Outcomes Research & Evaluation Data Analytic Center Yale University School of Medicine
Edward L. Hannan, Ph.D. Distinguished Professor Emeritus, Department of Health Policy, Management & Behavior Associate Dean Emeritus University at Albany, School of Public Health
Alice Jacobs, M.D. Director, Cardiac Catheterization Laboratory and Interventional Cardiology Boston Medical Center
Frederick S. Ling, M.D. Professor in Medicine (Cardiology) University of Rochester Medical Center
Carlos Ruiz, M.D., Ph.D. Professor of Cardiology in Pediatrics and Medicine Director, Structural and Congenital Heart Disease Hackensack University Medical Center Heart and Vascular Hospital The Joseph M. Sanzari Children’s Hospital\
Ferdinand Venditti, Jr., M.D. Executive VP for System Care Delivery Albany Medical Center
Staff to PCIRS Analysis Workgroup – New York State Department of Health
Office of Quality and Patient SafetyFoster C. Gesten, M.D. Chief Medical Officer
Marcus Friedrich, M.D., M.B.A., F.A.C.P. Medical Director
Cardiac Services ProgramKimberly S. Cozzens, M.A Program Manager
Ashraf Al-Hamadani, M.D., MPH Clinical Record Reviewer
Diane Fanuele, M.S. Clinical Data Coordinator
Lori Frazier Project Assistant
Erika Ihara, M.A. Clinical Data Coordinator
Jessica Kincaid Quality Improvement Project Coordinator
Cynthia Johnson PCI and Special Projects Coordinator
Ye Zhong, M.D., M.S. Cardiac Analyst
TABLE OF CONTENTS
MESSAGE FROM COMMISSIONER ZUCKER. . . . . . . . . . . . . . . . . . . . . . . . . . . . . . . . . . . 1
INTRODUCTION . . . . . . . . . . . . . . . . . . . . . . . . . . . . . . . . . . . . . . . . . . . . . . . . . . 3
DEPARTMENT OF HEALTH PROGRAM . . . . . . . . . . . . . . . . . . . . . . . . . . . . . . . . . . . . . . 4
PATIENT POPULATION . . . . . . . . . . . . . . . . . . . . . . . . . . . . . . . . . . . . . . . . . . . . . . . 4
RISK ADJUSTMENT FOR ASSESSING PROVIDER PERFORMANCE . . . . . . . . . . . . . . . . . . . . . . 6
Data Collection, Data Validation and Identifying In-Hospital/30-Day Deaths and 30-Day Readmission . . 6
Assessing Patient Risk . . . . . . . . . . . . . . . . . . . . . . . . . . . . . . . . . . . . . . . . . . . . . . . 7
Predicting Patient Mortality Rates for Providers . . . . . . . . . . . . . . . . . . . . . . . . . . . . . . . . . 7
Computing the Risk-Adjusted Mortality Rate . . . . . . . . . . . . . . . . . . . . . . . . . . . . . . . . . . . 7
Interpreting the Risk-Adjusted Mortality Rate . . . . . . . . . . . . . . . . . . . . . . . . . . . . . . . . . . 7
Predicting Patient Readmission and Computing and Interpreting Risk-Adjusted Readmission Rates . . . 8
How this Initiative Contributes to Quality Improvement. . . . . . . . . . . . . . . . . . . . . . . . . . . . . 8
DEFINITION OF KEY TERMS . . . . . . . . . . . . . . . . . . . . . . . . . . . . . . . . . . . . . . . . . . . . 9
2014 HOSPITAL OUTCOMES FOR PCI . . . . . . . . . . . . . . . . . . . . . . . . . . . . . . . . . . . . . . 10
Table 1 In-Hospital/30-Day Observed, Expected and Risk-Adjusted Mortality Rates for PCI in New York State, 2014 Discharges . . . . . . . . . . . . . . . . . . . . . . . . . . . . . . . . . 12
Figure 1 In-Hospital/30-Day Risk-Adjusted Mortality Rates for PCI in New York State, 2014 Discharges (All Cases) . . . . . . . . . . . . . . . . . . . . . . . . . . . . . . . . . . . . . 13
Figure 2 In-Hospital/30-Day Risk-Adjusted Mortality Rates for PCI in New York State, 2014 Discharges (Non-Emergency Cases) . . . . . . . . . . . . . . . . . . . . . . . . . . . . . 14
Table 2 Hospital Observed, Expected and Risk-Adjusted Readmission Rates for PCI in New York State, 2014 Discharges . . . . . . . . . . . . . . . . . . . . . . . . . . . . . . . . . 15
Figure 3 30-Day Risk-Adjusted Readmission Rates for PCI in New York State, 2014 Discharges (All Cases) . . . . . . . . . . . . . . . . . . . . . . . . . . . . . . . . . . . . . 16
2012–2014 HOSPITAL DATA FOR PCI . . . . . . . . . . . . . . . . . . . . . . . . . . . . . . . . . . . . . . 17
Table 3 In-Hospital/30-Day Observed and Risk-Adjusted Mortality Rates for PCI in New York State, 2012-2014 Discharges . . . . . . . . . . . . . . . . . . . . . . . . . . . . . . . 19
Table 4 In-Hospital/30-Day Observed, Expected and Risk-Adjusted Mortality Rates for Transcatheter Aortic Valve Replacement in New York State, 2012-2014 Discharges . . . . . . . . . . . . . 20
2012–2014 HOSPITAL AND CARDIOLOGIST DATA FOR PCI. . . . . . . . . . . . . . . . . . . . . . . . . . 21
Table 5 Cardiologist In-Hospital/30-Day Observed, Expected and Risk-Adjusted Mortality Rates for PCI in New York State, 2012–2014 Discharges . . . . . . . . . . . . . . . . . . . . 22
Table 6 Summary Information for Cardiologists Practicing at More Than One Hospital, 2012–2014 Discharges . . . . . . . . . . . . . . . . . . . . . . . . . . . . . . . . . . . . . . . 36
CRITERIA USED IN REPORTING SIGNIFICANT RISK FACTORS (2014) . . . . . . . . . . . . . . . . . . . . 51
MEDICAL TERMINOLOGY . . . . . . . . . . . . . . . . . . . . . . . . . . . . . . . . . . . . . . . . . . . . 55
6
Appendix 1 2014 Risk Factors For PCI In-Hospital/30-Day Mortality (ALL CASES) . . . . . . . . . . . . 56
Appendix 2 2014 Risk Factors For In-Hospital/30-Day Mortality for Non-Emergency PCI . . . . . . . . 58
Appendix 3 2014 Risk Factors for 30-Day Readmissions for All PCI . . . . . . . . . . . . . . . . . . . . 60
Appendix 4 2012–2014 Risk Factors for PCI In-Hospital/30-Day Mortality (ALL CASES). . . . . . . . . 62
Appendix 5 2012-2014 Risk Factors for In-Hospital/30-Day Mortality for Non-Emergency PCI . . . . . 64
Appendix 6 2012-2014 Risk Factors for In-Hospital/30-Day Mortality for Emergency PCI . . . . . . . . 66
Appendix 7 2012-2014 Risk Factors for TAVR In-Hospital/30-Day Mortality . . . . . . . . . . . . . . . 68
NEW YORK STATE PERCUTANEOUS CORONARY INTERVENTION CENTERS. . . . . . . . . . . . . . . 69
1
Message from Commissioner Zucker
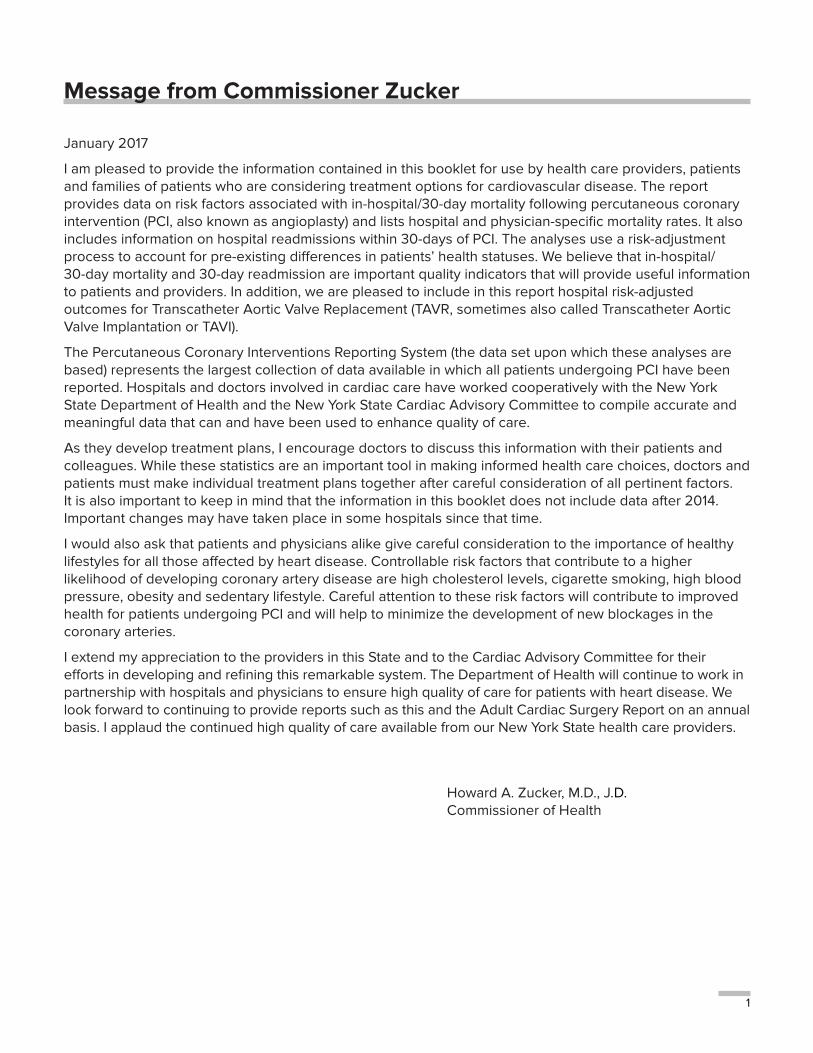
January 2017
I am pleased to provide the information contained in this booklet for use by health care providers, patients and families of patients who are considering treatment options for cardiovascular disease. The report provides data on risk factors associated with in-hospital/30-day mortality following percutaneous coronary intervention (PCI, also known as angioplasty) and lists hospital and physician-specific mortality rates. It also includes information on hospital readmissions within 30-days of PCI. The analyses use a risk-adjustment process to account for pre-existing differences in patients’ health statuses. We believe that in-hospital/ 30-day mortality and 30-day readmission are important quality indicators that will provide useful information to patients and providers. In addition, we are pleased to include in this report hospital risk-adjusted outcomes for Transcatheter Aortic Valve Replacement (TAVR, sometimes also called Transcatheter Aortic Valve Implantation or TAVI).
The Percutaneous Coronary Interventions Reporting System (the data set upon which these analyses are based) represents the largest collection of data available in which all patients undergoing PCI have been reported. Hospitals and doctors involved in cardiac care have worked cooperatively with the New York State Department of Health and the New York State Cardiac Advisory Committee to compile accurate and meaningful data that can and have been used to enhance quality of care.
As they develop treatment plans, I encourage doctors to discuss this information with their patients and colleagues. While these statistics are an important tool in making informed health care choices, doctors and patients must make individual treatment plans together after careful consideration of all pertinent factors. It is also important to keep in mind that the information in this booklet does not include data after 2014. Important changes may have taken place in some hospitals since that time.
I would also ask that patients and physicians alike give careful consideration to the importance of healthy lifestyles for all those affected by heart disease. Controllable risk factors that contribute to a higher likelihood of developing coronary artery disease are high cholesterol levels, cigarette smoking, high blood pressure, obesity and sedentary lifestyle. Careful attention to these risk factors will contribute to improved health for patients undergoing PCI and will help to minimize the development of new blockages in the coronary arteries.
I extend my appreciation to the providers in this State and to the Cardiac Advisory Committee for their efforts in developing and refining this remarkable system. The Department of Health will continue to work in partnership with hospitals and physicians to ensure high quality of care for patients with heart disease. We look forward to continuing to provide reports such as this and the Adult Cardiac Surgery Report on an annual basis. I applaud the continued high quality of care available from our New York State health care providers.
Howard A. Zucker, M.D., J.D.Commissioner of Health

2
3
INTRODUCTIONHeart disease is the leading cause of death in New York State (NYS), and the most common form of heart disease is atherosclerotic coronary artery disease. Various treatments are recommended for patients with coronary artery disease. For some people, changes in lifestyle, such as dietary changes, not smoking and regular exercise, can result in great improvements in health. In other cases, medication prescribed for high blood pressure or other conditions can make a significant difference.
Sometimes, however, an interventional procedure is recommended. The two most common procedures performed on patients with coronary artery disease are percutaneous coronary intervention (PCI), also known as percutaneous transluminal coronary angioplasty (PTCA), and coronary artery bypass graft surgery (CABG).
During a PCI procedure, a catheter is threaded up to the site of the blockage in a coronary artery. In conjunction with the catheter, devices are used to open the blockage. In some cases, PCI is used as an emergency treatment for patients who are experiencing a heart attack or who may be in shock. Most cases, however, are not done on an emergency basis.
Those who have a PCI procedure are not cured of coronary artery disease; the disease can still occur in the treated blood vessels or other coronary arteries. In order to minimize new blockages, patients should continue to reduce their risk factors for heart disease.
The analyses contained in this report are based on the information collected on each of the 143,535 patients who underwent PCI in NYS hospitals and were discharged between December 1, 2011, and November 30, 2014. The analysis period for this report includes patients discharged in December 2011 but not those discharged in December 2014. This strategy allows for more timely report publication by eliminating the need to track patients for 30-day mortality into the following calendar year. Inclusion of cases from the previous December allows for meaningful comparison of 12-month volume as found in previous reports. The single year analysis for 2014 cases includes patients discharged from December 1, 2013 through November 30, 2014. Analyses of risk-adjusted mortality rates and associated risk factors for all cases, non-emergency cases (which represent the majority of procedures) and emergency cases are included.
4
DEPARTMENT OF HEALTH PROGRAMThe New York State Department of Health (Department of Health) has been studying the effects of patient and treatment characteristics on outcomes for patients with heart disease for over 20 years. Detailed statistical analyses of the information received from the study have been conducted under the guidance of the Cardiac Advisory Committee, a group of independent practicing cardiac surgeons, cardiologists and other professionals in related fields.
The results have been used to create a cardiac profile system that assesses the performance of hospitals and doctors over time, taking into account the severity of each individual patient’s pre-operative conditions. Coronary artery
bypass surgery results have been assessed since 1989; PCI results were released in 1996 for the first time.
Designed to improve health in people with heart disease, this program is aimed at:
• understanding the health risks of patients that adversely affect how they will fare during and after PCI;
• improving the results of different treatments of heart disease;
• improving cardiac care; and
• providing information to help patients make better decisions about their own care.
PATIENT POPULATIONThis report is based on data for patients discharged between December 1, 2011, and November 30, 2014, provided by all 62 non-federal hospitals in NYS where PCI was performed. In total there were 143,535 PCI procedures performed during this time period. The annual number of PCI discharges was: 47,396 in 2012; 48,495 in 2013; and 47,644 in 2014. For various reasons, some of these cases are excluded from analysis in this report. The reasons for exclusion and number of cases affected are described below.
At the time Long Island College Hospital closed in April of 2014, the cardiac data validation process for 2014 cases was incomplete. Because the accuracy of risk factors, procedural information and outcomes for these cases cannot be verified, the 349 cases reported by this hospital with a discharge in the analysis time period are excluded from all analyses.
In addition, 302 records were excluded from the 2012–2014 data because they belong to patients residing outside the United States and these patients could not be followed after hospital discharge. There were an additional 37 cases excluded from analysis because each 30-day mortality can only be associated with a single PCI.
There were two additional groups of patients excluded based on clinical factors. There were 739 cases with pre-procedure cardiogenic shock excluded from analysis. Beginning with 2010 discharges, patients with hypoxic brain injury who expired under certain conditions were also excluded from analysis. This accounted for 137 cases excluded from analysis. The following two paragraphs provide further details on these clinical exclusion criteria.
Beginning with patients discharged in 2006, the Department of Health, with the advice of the Cardiac Advisory Committee, began a trial period of excluding any patients meeting the NYS Cardiac Data System definition of preoperative cardiogenic shock from publicly released reports and analyses. Cardiogenic shock is a condition associated with severe hypotension (very low blood pressure); the technical definition used in this report can be found on Page 51. Patients in cardiogenic shock are extremely high-risk, but for some, PCI may be their best chance for survival. Furthermore, the magnitude of the risk is not always easily determined using registry data. These cases were excluded after careful deliberation and input from NYS providers and others in an effort to ensure that physicians could accept these cases where appropriate without concern over a
5
detrimental impact on their reported outcomes. These 739 cases account for 0.52 percent of all PCI cases in the three years.
Patients were also excluded from analysis when very specific NYS Cardiac Data System criteria for hypoxic brain injury were met. Cases excluded for this reason all involved a pre-PCI cardiac arrest and acute MI (myocardial infarction, aka heart attack) with the patient in a coma-like neurological state prior to the PCI. In some cases, patients in this condition recover neurologically, although it may be days after the initial event before their neurological status improves. Treating the cardiac condition with PCI can be a lifesaving intervention. However, some patients will never regain consciousness because the injury to the brain caused by lack of oxygen at the time of their cardiac arrest is too severe. After consulting with physicians treating this condition, including the Cardiac Advisory Committee, the Department of Health determined that under certain circumstances these mortalities should be excluded from analyses. The specific criteria for exclusion under this policy can be found on Page 53.
While there were 47,196 PCI cases included in the mortality analysis for 2014 discharges, some additional exclusions were required for the readmission analysis. The reasons for exclusion and number of cases affected are described below.
Records belonging to patients residing outside NYS were excluded because there is no reliable way to track out-of state readmissions. This accounted for 1,957 cases. Another 313 patients were excluded because they died in the same admission as their index PCI, so readmission was impossible. Two hundred and fifty-five patients were transferred to another hospital and were thus excluded from readmission analysis.
In some cases, patients were readmitted for PCI and then also had a third admission within 30 days of that procedure. No case was counted as both a readmission and an index PCI, resulting in an additional 1,819 exclusions.
In total, the number of exclusions was 4,344, leaving 42,852 cases to be examined for 30-day readmission.
NOTE ON HOSPITALS PERFORMING PCI DURING 2012–2014 PERIOD
In the 2012-2014 time period there were 22 hospitals approved to perform PCI without cardiac surgery on-site. Bronx Lebanon - Concourse Division performed PCI only on patients with an ST segment elevation myocardial infarction (a specific kind of heart attack also known as STEMI) until June of 2013. The other 21 hospitals were approved to perform Primary or Elective PCI. Hospitals currently performing PCI without cardiac surgery on-site are noted on the final page of this report.
Several hospitals began performing PCI during the 2012-2014 time period. The hospital name and the month of the first PCI performed are as follows: Samaritan Hospital - January 2012; Brookhaven Memorial Hospital Medical Center - December 2013; Olean General Hospital - October 2014; Richmond University Medical Center - November 2014.
As previously mentioned, Long Island College Hospital closed in 2014 and data from this hospital is not included in this report due to incomplete validation. In addition, Millard Fillmore Hospital closed in 2012 and performed the last PCI in March of that year. The last PCI was performed at Erie County Medical Center in February of 2013.
6
RISK ADJUSTMENT FOR ASSESSING PROVIDER PERFORMANCEHospital or physician performance is an important factor that directly relates to patient outcomes. Whether patients recover quickly, experience complications, are readmitted to a hospital, or die following a procedure is in part a result of the kind of medical care they receive. It is difficult, however, to compare outcomes among hospitals when assessing performance because different hospitals treat different types of patients. Hospitals with sicker patients may have higher rates of readmission and death than other hospitals in the state. The following describes how the Department of Health adjusts for patient risk in assessing outcomes of care in different hospitals.
Data Collection, Data Validation and Identifying In-Hospital/30-Day Deaths and 30-Day Readmissions
As part of the risk-adjustment process, hospitals in NYS where PCI or TAVR is performed provide information to the Department of Health for each patient undergoing those procedures. Data concerning patients’ demographic and clinical characteristics are collected by hospitals’ cardiac catheterization laboratories and/or cardiac surgery departments. Approximately 40 of these characteristics (risk factors) are collected for each patient. Along with information about the hospital, physician and the patient’s status at discharge, these data are entered into a computer and sent to the Department of Health for analysis.
Data are verified through review of unusual reporting frequencies, cross-matching of cardiac registry data with other Department of Health databases and a review of medical records for a selected sample of cases. These activities are extremely helpful in ensuring consistent interpretation of data elements across hospitals.
The analysis bases mortality on deaths occurring during the same hospital stay in which a patient underwent PCI or TAVR and on deaths that occur after hospital discharge but within 30 days of the procedure. In this report, an in-hospital death is defined as a patient who died
subsequent to PCI or TAVR during the same acute care admission or was discharged to hospice care and expired within 30 days. Data on deaths occurring after discharge from the hospital are made available by the Department of Health, the New York City Department of Health and Mental Hygiene Bureau of Vital Statistics, and the National Death Index.
Data on readmission are obtained from the Department of Health’s acute care hospital dataset, the Statewide Planning and Research Cooperative System (SPARCS), which contains data pertaining to all acute care hospital discharges in the state. In addition, PCIRS is used to identify patients who underwent repeat PCI within 30 days but were not recorded in SPARCS because the procedure was technically considered an outpatient procedure.
Thirty-day readmission is defined as admission to a NYS non-Federal hospital within 30 days of discharge from the index hospitalization when the second admission is not for the purpose of staged PCI or CABG. Also categorized as readmission is any non-staged PCI within 30 days of discharge, even if the second procedure is technically performed on an outpatient basis.
Admission for staged PCI or CABG is not counted in this analysis as a readmission. Staged PCI or CABG occurs when the overall treatment plan at the time of the first procedure includes an expectation for the patient to return at a later date for an additional PCI or to have bypass surgery. To classify a subsequent PCI as part of a staged procedure, the hospital must be able to demonstrate the following: 1) At the time of the first PCI there was a plan for the patient to return for another PCI as part of the overall treatment strategy, 2) At the time of the second PCI there is an indication that the procedure is in follow-up to an earlier PCI as part of a staged treatment strategy, 3) None of the lesions treated in the first PCI are treated again in the second PCI, 4) The second PCI is not performed on an emergency basis due to a myocardial infarction (heart attack) or other cardiac emergency. Staged procedures involving PCI followed by CABG are much more
7
rare, but the definition of staging is similar. There were 830 staged PCIs and 37 staged CABGs that were not counted as readmissions.
Assessing Patient Risk
Each person who develops coronary artery disease has a unique health history. A cardiac profile system has been developed to evaluate the risk of treatment for each individual patient based on his or her history, weighing the important health facts for that person based on the experiences of thousands of patients who have undergone the same procedures in recent years. All important risk factors for each patient are combined to create his or her risk profile. For example, an 80-year-old patient with a heart attack in the past six hours has a very different risk profile than a 40-year-old who has never suffered a heart attack. The statistical analyses conducted by the Department of Health consist of determining which of the risk factors collected are significantly related to death or readmission and determining how to weight the significant risk factors to predict the chance each patient will have of dying or being readmitted given his or her specific characteristics.
Predicting Patient Mortality Rates for Providers
The statistical methods used to predict mortality on the basis of the significant risk factors are tested to determine whether they are sufficiently accurate in predicting mortality for patients who are extremely ill prior to undergoing the procedure as well as for patients who are relatively healthy. These tests have confirmed that the models are reasonably accurate in predicting how patients of all different risk levels will fare when undergoing PCI.
The mortality rate for each hospital and cardiologist is also predicted using the statistical model. This is accomplished by adding the predicted probabilities of death for each of the provider’s patients and dividing by the number of patients. The resulting rate is an estimate of what the provider’s mortality rate would have been if the hospital’s performance was identical to the state performance. The percentage is called the predicted or expected mortality rate (EMR). A hospital’s EMR is contrasted with its observed mortality rate (OMR), which is the number of PCI patients who died divided by the total number of PCI patients.
Computing the Risk-Adjusted Mortality Rate
The risk-adjusted mortality rate (RAMR) represents the best estimate, based on the associated statistical model, of what the provider’s mortality rate would have been if the provider had a mix of patients identical to the statewide mix. Thus, the RAMR has, to the extent possible, ironed out differences among providers in patient severity of illness, since it arrives at a mortality rate for each provider based on an identical group of patients.
To get the RAMR, the OMR is first divided by the provider’s EMR. If the resulting ratio is larger than one, the provider has a higher mortality rate than expected on the basis of its patient mix; if it is smaller than one, the provider has a lower mortality rate than expected from its patient mix. The ratio is then multiplied by the overall statewide rate (1.18 percent in-hospital/30-day in 2014) to obtain the provider’s RAMR. There is no Statewide EMR or RAMR, because the statewide data is not risk-adjusted since it comprises the entire population of interest. The Statewide OMR (number of total cases divided by number of total deaths) serves as the basis for comparison for each hospital’s EMR and RAMR.
Interpreting the Risk-Adjusted Mortality Rate
If the RAMR is significantly lower than the statewide mortality rate, the hospital has a better performance than the state as a whole; if the RAMR is significantly higher than the statewide mortality rate, the hospital has a worse performance than the state as a whole.
The RAMR is used in this report as a measure of quality of care provided by hospitals and cardiologists. However, there are reasons that a provider’s RAMR may not be indicative of its true quality. For example, extreme outcome rates may occur due to chance alone. This is particularly true for low-volume providers, for whom very high or very low rates are more likely to occur than for high-volume providers. To prevent misinterpretation of differences caused by chance variation, expected ranges (confidence intervals) are included in the reported results.
Differences in hospital coding of risk factors could be an additional reason that a hospital’s RAMR may not be reflective of quality of care.
8
The Department of Health monitors the quality of coded data by reviewing patients’ medical records to ascertain the presence of key risk factors. When significant coding problems are discovered, hospitals are required to correct these data and are subject to subsequent monitoring.
Predicting Patient Readmission and Computing and Interpreting Risk-Adjusted Readmission Rates
Patient risk of 30-day readmission is assessed using the same methods used for assessing mortality risk as described above. All potential risk factors are considered and those that are independently related to readmission are identified and given weights so as to best predict the risk of 30-day readmission for each patient. Observed readmission rates (ORR), expected readmission rates (ERR) and risk-adjusted readmission rates (RARR) are calculated in the same way that OMR, EMR and RAMR are calculated. ERR and RARR are compared to the statewide observed readmission rate (9.85 percent in 2014).
This analysis is based on all-cause readmission, not just readmission directly related to the PCI procedure. Not all readmissions represent a poor patient outcome or reflect poor patient care. However, by risk-adjusting and comparing the results across the many hospitals that perform this procedure we are able to look for meaningful differences from the overall statewide experience. If the RARR is significantly lower than the statewide
readmission rate, the hospital has a better performance than the state as a whole; if the RARR is significantly higher than the statewide readmission rate, the hospital has a worse performance than the state as a whole.
As described above for mortality, there are reasons that a provider’s RARR may not be indicative of its true quality. Confidence intervals and careful attention to data quality are used in the same way for readmission that they are for mortality.
How This Initiative Contributes to Quality Improvement
One goal of the Department of Health and the Cardiac Advisory Committee is to improve the quality of care in relation to cardiac surgery and angioplasty in NYS. Providing the hospitals, cardiac surgeons (who perform cardiac surgery) and cardiologists (who perform PCI) in NYS with data about their own outcomes for these procedures allows them to examine the quality of their own care and to identify opportunities to improve that care.
The data collected and analyzed in this program are reviewed by the Cardiac Advisory Committee, which assists with interpretation and advises the Department of Health regarding which hospitals and physicians may need special attention. Committee members have also conducted site visits to particular hospitals and have recommended that some hospitals obtain the expertise of outside consultants to design improvements for their programs.
9
DEFINITION OF KEY TERMS
Definitions of key terms are as follows:The observed mortality rate (OMR) is the observed number of deaths divided by the total number of cases.
The expected mortality rate (EMR) is the sum of the predicted probabilities of death for all patients divided by the total number of patients.
The risk-adjusted mortality rate (RAMR) is the best estimate, based on the statistical model, of what the provider’s mortality rate would have been if the provider had a mix of patients similar to the statewide mix. It is obtained by first dividing the OMR by the EMR, and then multiplying that quotient by the statewide mortality rate (1.18 percent in-hospital/30-day mortality for all PCI patients discharged in 2014).
The observed readmission rate (ORR) is the observed number of 30-day readmissions divided by the total number of analyzed cases.
The expected readmission rate (ERR) is the sum of the predicted probabilities of readmission for all patients divided by the total number of analyzed cases.
The risk-adjusted readmission rate (RARR) is the best estimate, based on the statistical model, of what the provider’s readmission rate would have been if the provider had a mix of patients similar to the statewide mix. It is obtained by first dividing the ORR by the ERR, and then multiplying that quotient by the statewide readmission rate (9.85 percent 30-day readmission rate for all PCI patients discharged in 2014).
Confidence intervals indicate which hospitals had significantly more or fewer deaths or readmissions than expected given the risk factors of their patients. Hospitals with significantly higher rates than expected after adjusting for risk are those with confidence intervals entirely above the statewide rate. Hospitals with significantly lower rates than expected, given the severity of illness of their patients before the procedure, have confidence intervals entirely below the statewide rate.
10
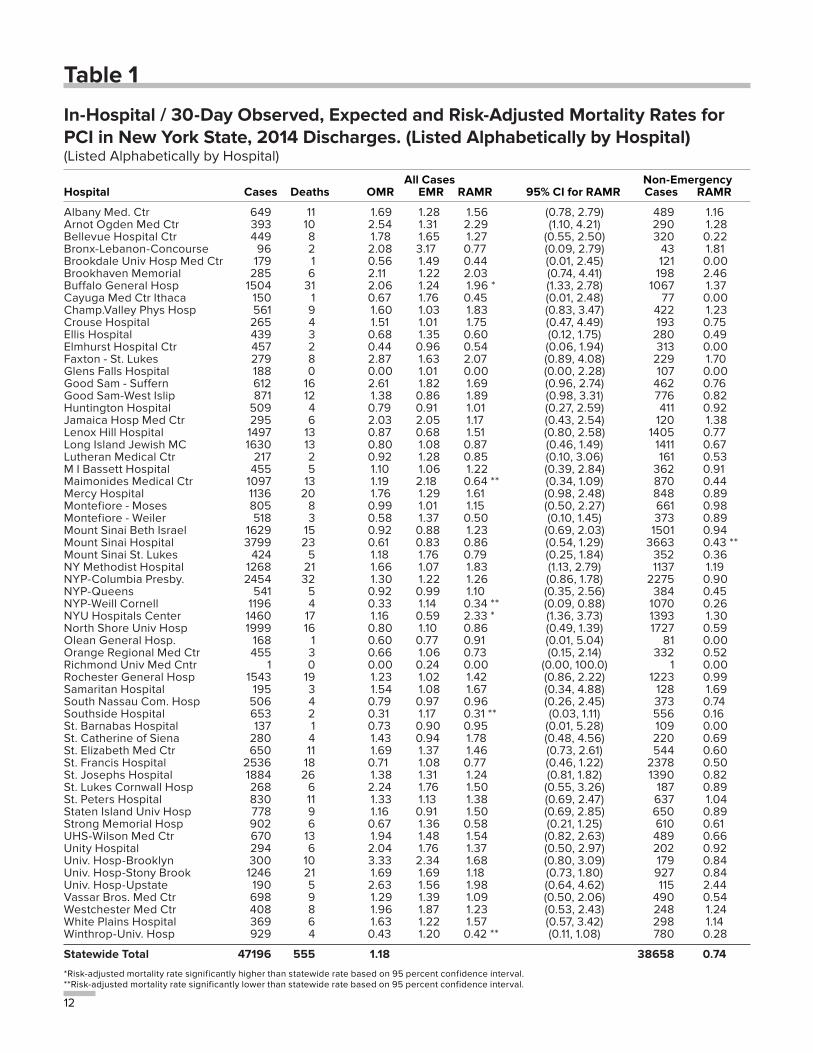
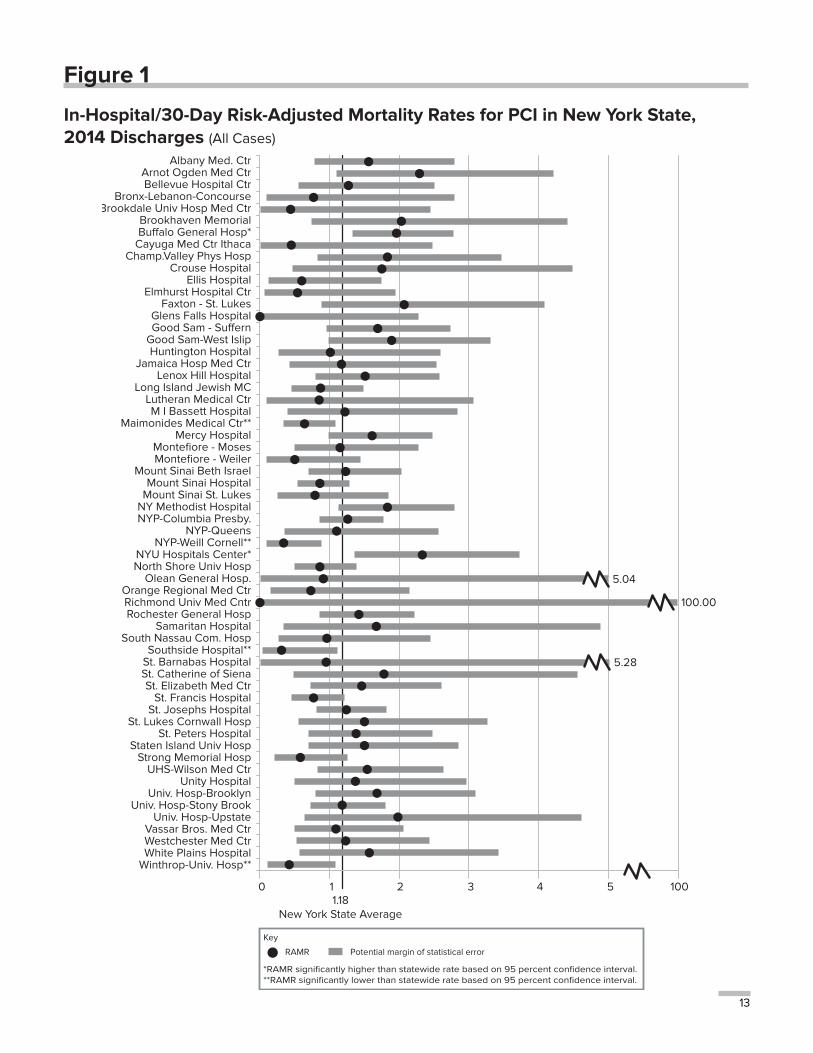
2014 HOSPITAL OUTCOMES FOR PCITable 1 and Figures 1 and 2 present the PCI mortality results for the 60 hospitals performing PCI in NYS in 2014 for which data could be analyzed. The table contains, for each hospital, the number of PCIs resulting in 2014 discharges, the number of in-hospital/30-day deaths, the OMR, the EMR based on the statistical model presented in Appendix 1, the RAMR and a 95 percent confidence interval for the RAMR. It also contains each hospital’s volume of cases and RAMR for non-emergency patients. Emergency patients are defined to be patients in a state of hemodynamic instability (typically associated with very low blood pressure), or patients who experienced a heart attack within 24 hours prior to undergoing PCI. The hospital RAMRs for non-emergency PCI patients are provided because many studies are confined to this group of patients and because these patients comprise the majority of all PCI patients (81.91 percent in 2014).
The overall in-hospital/30-day OMR for the 47,196 PCIs included in this 2014 analysis was 1.18 percent. Observed mortality rates ranged from 0.00 percent to 3.33 percent. The range in EMRs, which measure patient severity of illness, was between 0.24 percent and 3.17 percent. The RAMRs, which measure hospital performance, range from 0.00 percent to 2.33 percent. Based on confidence intervals for RAMRs, two hospitals (Buffalo General Hospital and NYU Hospital in Manhattan) had RAMRs that were significantly higher than the statewide average. Four hospitals (Maimonides Medical Center in Brooklyn, NY Presbyterian at Cornell in Manhattan, Southside Hospital in Bayshore, and Winthrop University Hospital in Mineola) had RAMRs that were significantly lower than the statewide average.
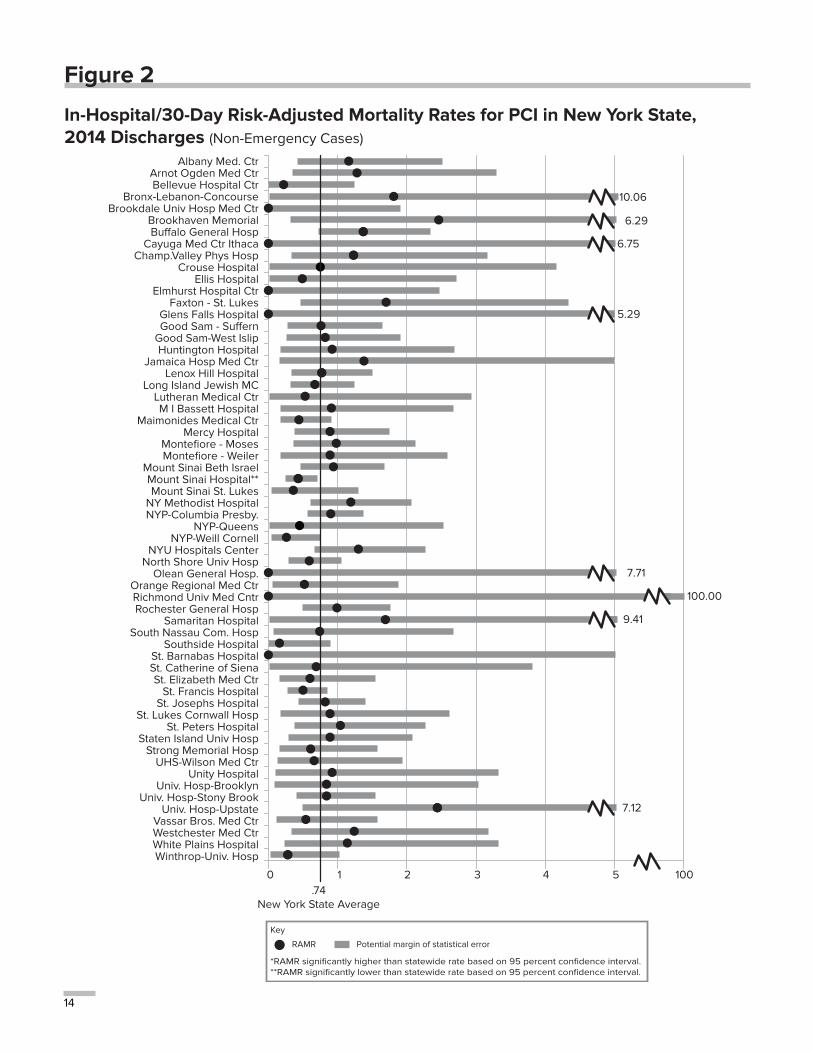
The last column of Table 1 presents the hospital RAMRs for non-emergency cases (based on the statistical model presented in Appendix 2). As presented in the last row, the statewide in-hospital/30-day mortality rate for non-emergency cases is 0.74 percent. The range of RAMRs was from 0.00 percent to 2.46 percent. No hospitals had RAMRs that were significantly higher than the statewide average. One hospital
(Mt. Sinai Medical Center in Manhattan) had a RAMR that was significantly lower than the statewide rate.
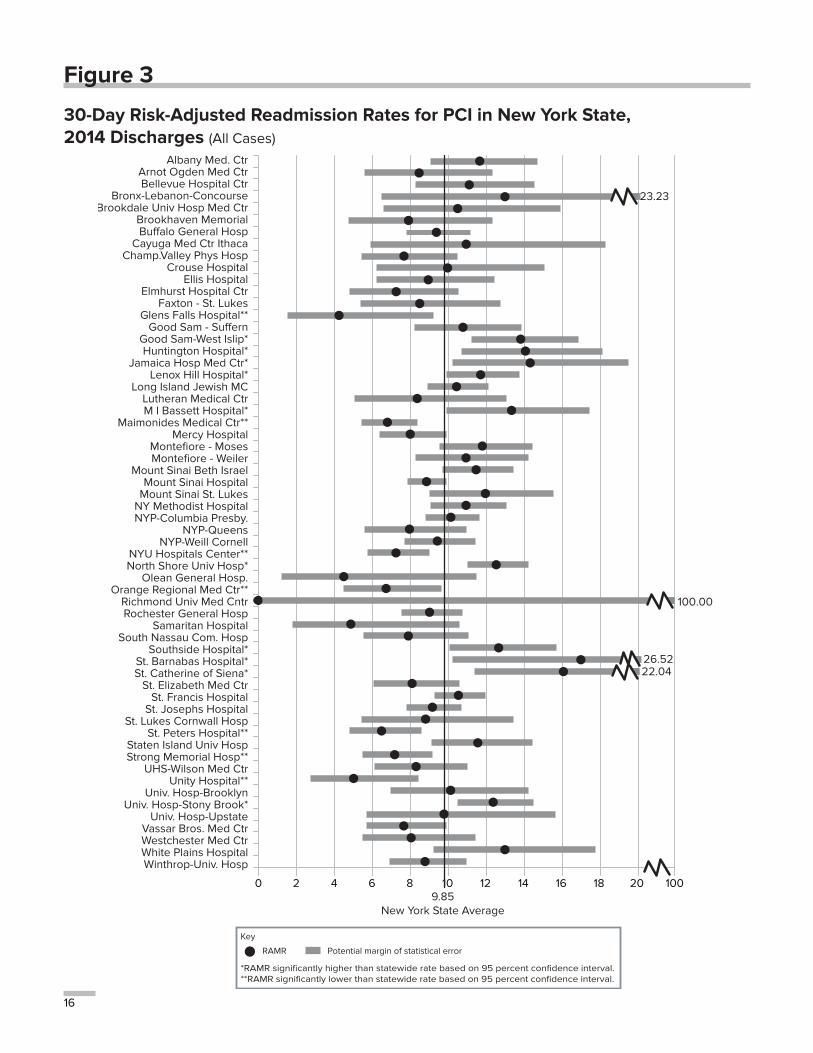
Figures 1 and 2 provide a visual representation of the data displayed in Table 1. For each hospital, the black dot represents the RAMR and the gray bar represents the confidence interval, or potential statistical error, for the RAMR. The black vertical line is the NYS in-hospital/30-day mortality rate. For any hospital where the gray bar crosses the statewide average line, the RAMR is not statistically different from the state as a whole. A gray bar that extends far above and/or below the statewide average indicates that a hospital has a wide confidence interval. This is common when the hospital has a very small number of cases. It does not necessarily mean that the risk-adjusted mortality rate is very high or very low. Hospitals that are statistical outliers will have gray bars (confidence intervals) that are either entirely above or entirely below the line for the statewide rate.
Since the 2014 PCI analysis is based on in-hospital/30-day mortality and excludes shock cases and hypoxic brain injury deaths, the associated mortality rates cannot be compared directly to some previous NYS publications which are based on only in-hospital mortality and include all cases. The observed in-hospital mortality rate (not shown in Table 1) for 2014 PCI discharges was 0.68 percent for the 47,196 patients included in Table 1. For the non-emergency analysis, there were 38,658 patients with an in-hospital mortality rate of 0.32 percent.
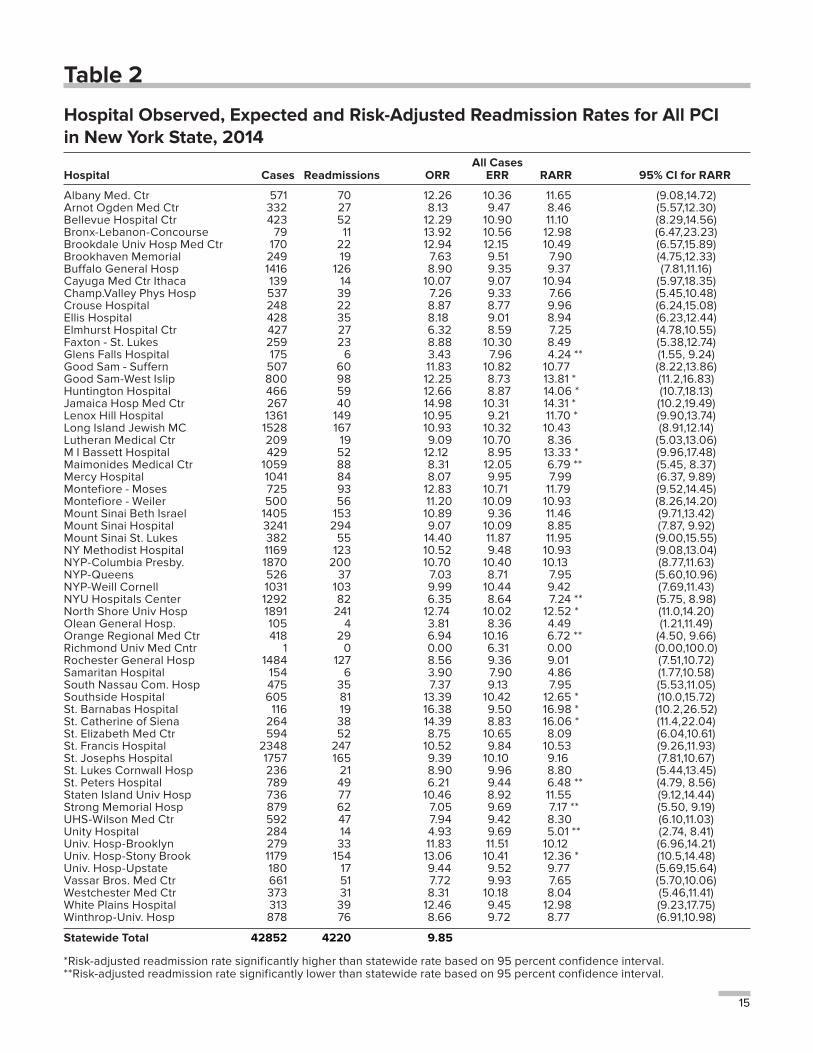
Table 2 presents the PCI 30-day readmission results for the 60 hospitals performing PCI in NYS in 2014 for which data could be analyzed. The table contains, for each hospital, the number of PCIs resulting in 2014 discharges, the number of 30-day readmissions, the ORR, the ERR based on the statistical model presented in Appendix 3, the RARR and a 95 percent confidence interval for the RARR. The overall 30-day ORR for the 42,852 PCIs included in this 2014 analysis was 9.85 percent. Observed readmission rates ranged from 0.00 percent to 16.38 percent. The range in ERRs, which measure patient severity of illness, was between
11
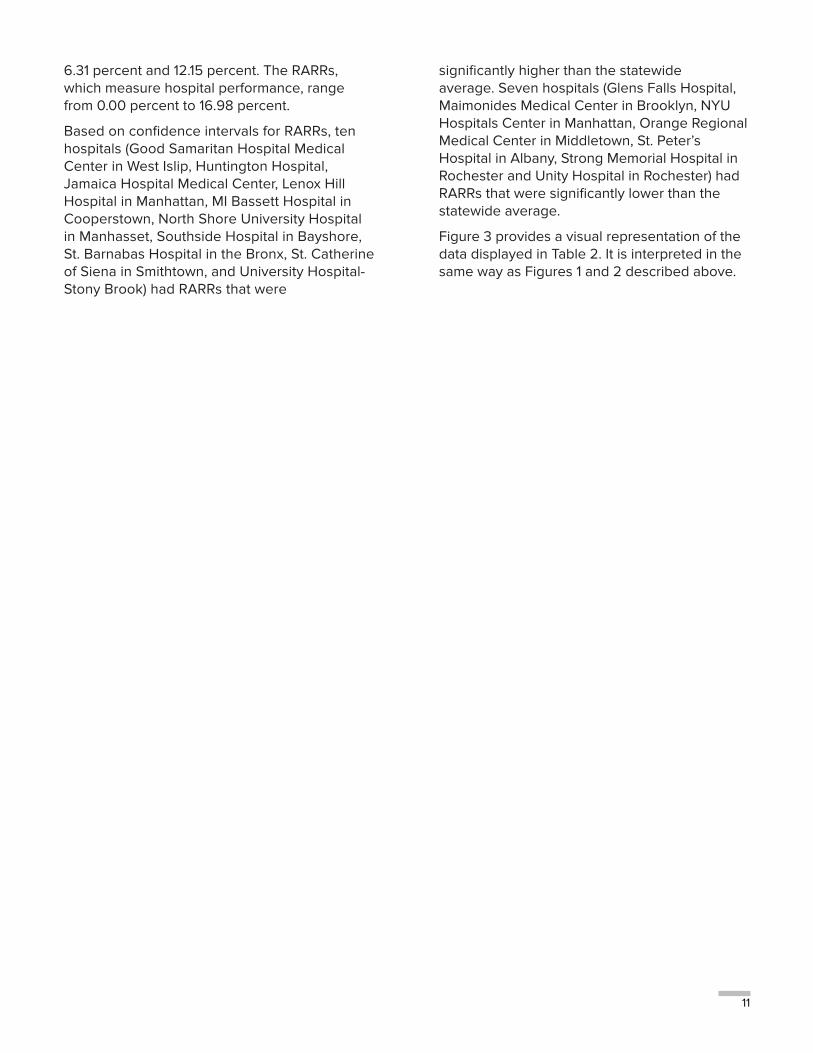
6.31 percent and 12.15 percent. The RARRs, which measure hospital performance, range from 0.00 percent to 16.98 percent.
Based on confidence intervals for RARRs, ten hospitals (Good Samaritan Hospital Medical Center in West Islip, Huntington Hospital, Jamaica Hospital Medical Center, Lenox Hill Hospital in Manhattan, MI Bassett Hospital in Cooperstown, North Shore University Hospital in Manhasset, Southside Hospital in Bayshore, St. Barnabas Hospital in the Bronx, St. Catherine of Siena in Smithtown, and University Hospital-Stony Brook) had RARRs that were
significantly higher than the statewide average. Seven hospitals (Glens Falls Hospital, Maimonides Medical Center in Brooklyn, NYU Hospitals Center in Manhattan, Orange Regional Medical Center in Middletown, St. Peter’s Hospital in Albany, Strong Memorial Hospital in Rochester and Unity Hospital in Rochester) had RARRs that were significantly lower than the statewide average.
Figure 3 provides a visual representation of the data displayed in Table 2. It is interpreted in the same way as Figures 1 and 2 described above.
12
Table 1
In-Hospital / 30-Day Observed, Expected and Risk-Adjusted Mortality Rates for PCI in New York State, 2014 Discharges. (Listed Alphabetically by Hospital) (Listed Alphabetically by Hospital)
All Cases Non-EmergencyHospital Cases Deaths OMR EMR RAMR 95% CI for RAMR Cases RAMR
Albany Med. Ctr 649 11 1.69 1.28 1.56 (0.78, 2.79) 489 1.16Arnot Ogden Med Ctr 393 10 2.54 1.31 2.29 (1.10, 4.21) 290 1.28Bellevue Hospital Ctr 449 8 1.78 1.65 1.27 (0.55, 2.50) 320 0.22Bronx-Lebanon-Concourse 96 2 2.08 3.17 0.77 (0.09, 2.79) 43 1.81Brookdale Univ Hosp Med Ctr 179 1 0.56 1.49 0.44 (0.01, 2.45) 121 0.00Brookhaven Memorial 285 6 2.11 1.22 2.03 (0.74, 4.41) 198 2.46Buffalo General Hosp 1504 31 2.06 1.24 1.96 * (1.33, 2.78) 1067 1.37Cayuga Med Ctr Ithaca 150 1 0.67 1.76 0.45 (0.01, 2.48) 77 0.00Champ.Valley Phys Hosp 561 9 1.60 1.03 1.83 (0.83, 3.47) 422 1.23Crouse Hospital 265 4 1.51 1.01 1.75 (0.47, 4.49) 193 0.75Ellis Hospital 439 3 0.68 1.35 0.60 (0.12, 1.75) 280 0.49Elmhurst Hospital Ctr 457 2 0.44 0.96 0.54 (0.06, 1.94) 313 0.00Faxton - St. Lukes 279 8 2.87 1.63 2.07 (0.89, 4.08) 229 1.70Glens Falls Hospital 188 0 0.00 1.01 0.00 (0.00, 2.28) 107 0.00Good Sam - Suffern 612 16 2.61 1.82 1.69 (0.96, 2.74) 462 0.76Good Sam-West Islip 871 12 1.38 0.86 1.89 (0.98, 3.31) 776 0.82Huntington Hospital 509 4 0.79 0.91 1.01 (0.27, 2.59) 411 0.92Jamaica Hosp Med Ctr 295 6 2.03 2.05 1.17 (0.43, 2.54) 120 1.38Lenox Hill Hospital 1497 13 0.87 0.68 1.51 (0.80, 2.58) 1405 0.77Long Island Jewish MC 1630 13 0.80 1.08 0.87 (0.46, 1.49) 1411 0.67Lutheran Medical Ctr 217 2 0.92 1.28 0.85 (0.10, 3.06) 161 0.53M I Bassett Hospital 455 5 1.10 1.06 1.22 (0.39, 2.84) 362 0.91Maimonides Medical Ctr 1097 13 1.19 2.18 0.64 ** (0.34, 1.09) 870 0.44Mercy Hospital 1136 20 1.76 1.29 1.61 (0.98, 2.48) 848 0.89Montefiore - Moses 805 8 0.99 1.01 1.15 (0.50, 2.27) 661 0.98Montefiore - Weiler 518 3 0.58 1.37 0.50 (0.10, 1.45) 373 0.89Mount Sinai Beth Israel 1629 15 0.92 0.88 1.23 (0.69, 2.03) 1501 0.94Mount Sinai Hospital 3799 23 0.61 0.83 0.86 (0.54, 1.29) 3663 0.43 **Mount Sinai St. Lukes 424 5 1.18 1.76 0.79 (0.25, 1.84) 352 0.36NY Methodist Hospital 1268 21 1.66 1.07 1.83 (1.13, 2.79) 1137 1.19NYP-Columbia Presby. 2454 32 1.30 1.22 1.26 (0.86, 1.78) 2275 0.90NYP-Queens 541 5 0.92 0.99 1.10 (0.35, 2.56) 384 0.45NYP-Weill Cornell 1196 4 0.33 1.14 0.34 ** (0.09, 0.88) 1070 0.26NYU Hospitals Center 1460 17 1.16 0.59 2.33 * (1.36, 3.73) 1393 1.30North Shore Univ Hosp 1999 16 0.80 1.10 0.86 (0.49, 1.39) 1727 0.59Olean General Hosp. 168 1 0.60 0.77 0.91 (0.01, 5.04) 81 0.00Orange Regional Med Ctr 455 3 0.66 1.06 0.73 (0.15, 2.14) 332 0.52Richmond Univ Med Cntr 1 0 0.00 0.24 0.00 (0.00, 100.0) 1 0.00Rochester General Hosp 1543 19 1.23 1.02 1.42 (0.86, 2.22) 1223 0.99Samaritan Hospital 195 3 1.54 1.08 1.67 (0.34, 4.88) 128 1.69South Nassau Com. Hosp 506 4 0.79 0.97 0.96 (0.26, 2.45) 373 0.74Southside Hospital 653 2 0.31 1.17 0.31 ** (0.03, 1.11) 556 0.16St. Barnabas Hospital 137 1 0.73 0.90 0.95 (0.01, 5.28) 109 0.00St. Catherine of Siena 280 4 1.43 0.94 1.78 (0.48, 4.56) 220 0.69St. Elizabeth Med Ctr 650 11 1.69 1.37 1.46 (0.73, 2.61) 544 0.60St. Francis Hospital 2536 18 0.71 1.08 0.77 (0.46, 1.22) 2378 0.50St. Josephs Hospital 1884 26 1.38 1.31 1.24 (0.81, 1.82) 1390 0.82St. Lukes Cornwall Hosp 268 6 2.24 1.76 1.50 (0.55, 3.26) 187 0.89St. Peters Hospital 830 11 1.33 1.13 1.38 (0.69, 2.47) 637 1.04Staten Island Univ Hosp 778 9 1.16 0.91 1.50 (0.69, 2.85) 650 0.89Strong Memorial Hosp 902 6 0.67 1.36 0.58 (0.21, 1.25) 610 0.61UHS-Wilson Med Ctr 670 13 1.94 1.48 1.54 (0.82, 2.63) 489 0.66Unity Hospital 294 6 2.04 1.76 1.37 (0.50, 2.97) 202 0.92Univ. Hosp-Brooklyn 300 10 3.33 2.34 1.68 (0.80, 3.09) 179 0.84Univ. Hosp-Stony Brook 1246 21 1.69 1.69 1.18 (0.73, 1.80) 927 0.84Univ. Hosp-Upstate 190 5 2.63 1.56 1.98 (0.64, 4.62) 115 2.44Vassar Bros. Med Ctr 698 9 1.29 1.39 1.09 (0.50, 2.06) 490 0.54Westchester Med Ctr 408 8 1.96 1.87 1.23 (0.53, 2.43) 248 1.24White Plains Hospital 369 6 1.63 1.22 1.57 (0.57, 3.42) 298 1.14Winthrop-Univ. Hosp 929 4 0.43 1.20 0.42 ** (0.11, 1.08) 780 0.28
Statewide Total 47196 555 1.18 38658 0.74
*Risk-adjusted mortality rate significantly higher than statewide rate based on 95 percent confidence interval. **Risk-adjusted mortality rate significantly lower than statewide rate based on 95 percent confidence interval.
13
Figure 1
In-Hospital/30-Day Risk-Adjusted Mortality Rates for PCI in New York State, 2014 Discharges (All Cases)
1.18New York State Average
Key
RAMR Potential margin of statistical error
*RAMR significantly higher than statewide rate based on 95 percent confidence interval.** RAMR significantly lower than statewide rate based on 95 percent confidence interval.
Albany Med. CtrArnot Ogden Med CtrBellevue Hospital Ctr
Bronx-Lebanon-ConcourseBrookdale Univ Hosp Med Ctr
Brookhaven MemorialBu�alo General Hosp*
Cayuga Med Ctr IthacaChamp.Valley Phys Hosp
Crouse HospitalEllis Hospital
Elmhurst Hospital CtrFaxton - St. Lukes
Glens Falls HospitalGood Sam - Su�ern
Good Sam-West IslipHuntington Hospital
Jamaica Hosp Med CtrLenox Hill Hospital
Long Island Jewish MCLutheran Medical CtrM I Bassett Hospital
Maimonides Medical Ctr**Mercy Hospital
Montefiore - MosesMontefiore - Weiler
Mount Sinai Beth IsraelMount Sinai Hospital
Mount Sinai St. LukesNY Methodist HospitalNYP-Columbia Presby.
NYP-QueensNYP-Weill Cornell**
NYU Hospitals Center*North Shore Univ Hosp
Olean General Hosp.Orange Regional Med CtrRichmond Univ Med CntrRochester General Hosp
Samaritan HospitalSouth Nassau Com. Hosp
Southside Hospital**St. Barnabas HospitalSt. Catherine of SienaSt. Elizabeth Med Ctr
St. Francis HospitalSt. Josephs Hospital
St. Lukes Cornwall HospSt. Peters Hospital
Staten Island Univ HospStrong Memorial Hosp
UHS-Wilson Med CtrUnity Hospital
Univ. Hosp-BrooklynUniv. Hosp-Stony Brook
Univ. Hosp-UpstateVassar Bros. Med CtrWestchester Med CtrWhite Plains Hospital
Winthrop-Univ. Hosp**
0 1 2 3 4 5 100
100.00
5.04
5.28
14
Figure 2
In-Hospital/30-Day Risk-Adjusted Mortality Rates for PCI in New York State, 2014 Discharges (Non-Emergency Cases)
Albany Med. CtrArnot Ogden Med CtrBellevue Hospital Ctr
Bronx-Lebanon-ConcourseBrookdale Univ Hosp Med Ctr
Brookhaven MemorialBu�alo General Hosp
Cayuga Med Ctr IthacaChamp.Valley Phys Hosp
Crouse HospitalEllis Hospital
Elmhurst Hospital CtrFaxton - St. Lukes
Glens Falls HospitalGood Sam - Su�ern
Good Sam-West IslipHuntington Hospital
Jamaica Hosp Med CtrLenox Hill Hospital
Long Island Jewish MCLutheran Medical CtrM I Bassett Hospital
Maimonides Medical CtrMercy Hospital
Montefiore - MosesMontefiore - Weiler
Mount Sinai Beth IsraelMount Sinai Hospital**Mount Sinai St. Lukes
NY Methodist HospitalNYP-Columbia Presby.
NYP-QueensNYP-Weill Cornell
NYU Hospitals CenterNorth Shore Univ Hosp
Olean General Hosp.Orange Regional Med CtrRichmond Univ Med CntrRochester General Hosp
Samaritan HospitalSouth Nassau Com. Hosp
Southside HospitalSt. Barnabas HospitalSt. Catherine of SienaSt. Elizabeth Med Ctr
St. Francis HospitalSt. Josephs Hospital
St. Lukes Cornwall HospSt. Peters Hospital
Staten Island Univ HospStrong Memorial Hosp
UHS-Wilson Med CtrUnity Hospital
Univ. Hosp-BrooklynUniv. Hosp-Stony Brook
Univ. Hosp-UpstateVassar Bros. Med CtrWestchester Med CtrWhite Plains HospitalWinthrop-Univ. Hosp
0 1 2 3 4 5 100
10.06
100.00
6.29
5.29
6.75
7.71
.74New York State Average
Key
RAMR Potential margin of statistical error
*RAMR significantly higher than statewide rate based on 95 percent confidence interval.** RAMR significantly lower than statewide rate based on 95 percent confidence interval.
9.41
7.12
15
Table 2
Hospital Observed, Expected and Risk-Adjusted Readmission Rates for All PCI in New York State, 2014 All CasesHospital Cases Readmissions ORR ERR RARR 95% CI for RARR
Albany Med. Ctr 571 70 12.26 10.36 11.65 (9.08,14.72)Arnot Ogden Med Ctr 332 27 8.13 9.47 8.46 (5.57,12.30)Bellevue Hospital Ctr 423 52 12.29 10.90 11.10 (8.29,14.56)Bronx-Lebanon-Concourse 79 11 13.92 10.56 12.98 (6.47,23.23)Brookdale Univ Hosp Med Ctr 170 22 12.94 12.15 10.49 (6.57,15.89)Brookhaven Memorial 249 19 7.63 9.51 7.90 (4.75,12.33)Buffalo General Hosp 1416 126 8.90 9.35 9.37 (7.81,11.16)Cayuga Med Ctr Ithaca 139 14 10.07 9.07 10.94 (5.97,18.35)Champ.Valley Phys Hosp 537 39 7.26 9.33 7.66 (5.45,10.48)Crouse Hospital 248 22 8.87 8.77 9.96 (6.24,15.08)Ellis Hospital 428 35 8.18 9.01 8.94 (6.23,12.44)Elmhurst Hospital Ctr 427 27 6.32 8.59 7.25 (4.78,10.55)Faxton - St. Lukes 259 23 8.88 10.30 8.49 (5.38,12.74)Glens Falls Hospital 175 6 3.43 7.96 4.24 ** (1.55, 9.24)Good Sam - Suffern 507 60 11.83 10.82 10.77 (8.22,13.86)Good Sam-West Islip 800 98 12.25 8.73 13.81 * (11.2,16.83)Huntington Hospital 466 59 12.66 8.87 14.06 * (10.7,18.13)Jamaica Hosp Med Ctr 267 40 14.98 10.31 14.31 * (10.2,19.49)Lenox Hill Hospital 1361 149 10.95 9.21 11.70 * (9.90,13.74)Long Island Jewish MC 1528 167 10.93 10.32 10.43 (8.91,12.14)Lutheran Medical Ctr 209 19 9.09 10.70 8.36 (5.03,13.06)M I Bassett Hospital 429 52 12.12 8.95 13.33 * (9.96,17.48)Maimonides Medical Ctr 1059 88 8.31 12.05 6.79 ** (5.45, 8.37)Mercy Hospital 1041 84 8.07 9.95 7.99 (6.37, 9.89)Montefiore - Moses 725 93 12.83 10.71 11.79 (9.52,14.45)Montefiore - Weiler 500 56 11.20 10.09 10.93 (8.26,14.20)Mount Sinai Beth Israel 1405 153 10.89 9.36 11.46 (9.71,13.42)Mount Sinai Hospital 3241 294 9.07 10.09 8.85 (7.87, 9.92)Mount Sinai St. Lukes 382 55 14.40 11.87 11.95 (9.00,15.55)NY Methodist Hospital 1169 123 10.52 9.48 10.93 (9.08,13.04)NYP-Columbia Presby. 1870 200 10.70 10.40 10.13 (8.77,11.63)NYP-Queens 526 37 7.03 8.71 7.95 (5.60,10.96)NYP-Weill Cornell 1031 103 9.99 10.44 9.42 (7.69,11.43)NYU Hospitals Center 1292 82 6.35 8.64 7.24 ** (5.75, 8.98)North Shore Univ Hosp 1891 241 12.74 10.02 12.52 * (11.0,14.20)Olean General Hosp. 105 4 3.81 8.36 4.49 (1.21,11.49)Orange Regional Med Ctr 418 29 6.94 10.16 6.72 ** (4.50, 9.66)Richmond Univ Med Cntr 1 0 0.00 6.31 0.00 (0.00,100.0)Rochester General Hosp 1484 127 8.56 9.36 9.01 (7.51,10.72)Samaritan Hospital 154 6 3.90 7.90 4.86 (1.77,10.58)South Nassau Com. Hosp 475 35 7.37 9.13 7.95 (5.53,11.05)Southside Hospital 605 81 13.39 10.42 12.65 * (10.0,15.72)St. Barnabas Hospital 116 19 16.38 9.50 16.98 * (10.2,26.52)St. Catherine of Siena 264 38 14.39 8.83 16.06 * (11.4,22.04)St. Elizabeth Med Ctr 594 52 8.75 10.65 8.09 (6.04,10.61)St. Francis Hospital 2348 247 10.52 9.84 10.53 (9.26,11.93)St. Josephs Hospital 1757 165 9.39 10.10 9.16 (7.81,10.67)St. Lukes Cornwall Hosp 236 21 8.90 9.96 8.80 (5.44,13.45)St. Peters Hospital 789 49 6.21 9.44 6.48 ** (4.79, 8.56)Staten Island Univ Hosp 736 77 10.46 8.92 11.55 (9.12,14.44)Strong Memorial Hosp 879 62 7.05 9.69 7.17 ** (5.50, 9.19)UHS-Wilson Med Ctr 592 47 7.94 9.42 8.30 (6.10,11.03)Unity Hospital 284 14 4.93 9.69 5.01 ** (2.74, 8.41)Univ. Hosp-Brooklyn 279 33 11.83 11.51 10.12 (6.96,14.21)Univ. Hosp-Stony Brook 1179 154 13.06 10.41 12.36 * (10.5,14.48)Univ. Hosp-Upstate 180 17 9.44 9.52 9.77 (5.69,15.64)Vassar Bros. Med Ctr 661 51 7.72 9.93 7.65 (5.70,10.06)Westchester Med Ctr 373 31 8.31 10.18 8.04 (5.46,11.41)White Plains Hospital 313 39 12.46 9.45 12.98 (9.23,17.75)Winthrop-Univ. Hosp 878 76 8.66 9.72 8.77 (6.91,10.98)
Statewide Total 42852 4220 9.85
*Risk-adjusted readmission rate significantly higher than statewide rate based on 95 percent confidence interval. **Risk-adjusted readmission rate significantly lower than statewide rate based on 95 percent confidence interval.
16
Figure 3
30-Day Risk-Adjusted Readmission Rates for PCI in New York State, 2014 Discharges (All Cases)
Albany Med. CtrArnot Ogden Med CtrBellevue Hospital Ctr
Bronx-Lebanon-ConcourseBrookdale Univ Hosp Med Ctr
Brookhaven MemorialBu�alo General Hosp
Cayuga Med Ctr IthacaChamp.Valley Phys Hosp
Crouse HospitalEllis Hospital
Elmhurst Hospital CtrFaxton - St. Lukes
Glens Falls Hospital**Good Sam - Su�ern
Good Sam-West Islip*Huntington Hospital*
Jamaica Hosp Med Ctr*Lenox Hill Hospital*
Long Island Jewish MCLutheran Medical CtrM I Bassett Hospital*
Maimonides Medical Ctr**Mercy Hospital
Montefiore - MosesMontefiore - Weiler
Mount Sinai Beth IsraelMount Sinai Hospital
Mount Sinai St. LukesNY Methodist HospitalNYP-Columbia Presby.
NYP-QueensNYP-Weill Cornell
NYU Hospitals Center**North Shore Univ Hosp*
Olean General Hosp.Orange Regional Med Ctr**
Richmond Univ Med CntrRochester General Hosp
Samaritan HospitalSouth Nassau Com. Hosp
Southside Hospital*St. Barnabas Hospital*St. Catherine of Siena*
St. Elizabeth Med CtrSt. Francis Hospital
St. Josephs HospitalSt. Lukes Cornwall Hosp
St. Peters Hospital**Staten Island Univ HospStrong Memorial Hosp**
UHS-Wilson Med CtrUnity Hospital**
Univ. Hosp-BrooklynUniv. Hosp-Stony Brook*
Univ. Hosp-UpstateVassar Bros. Med CtrWestchester Med CtrWhite Plains HospitalWinthrop-Univ. Hosp
0 2 4 6 8 10 12 14 16 18 20 100
23.23
22.04
9.85New York State Average
Key
RAMR Potential margin of statistical error
*RAMR significantly higher than statewide rate based on 95 percent confidence interval.** RAMR significantly lower than statewide rate based on 95 percent confidence interval.
26.52
100.00
17
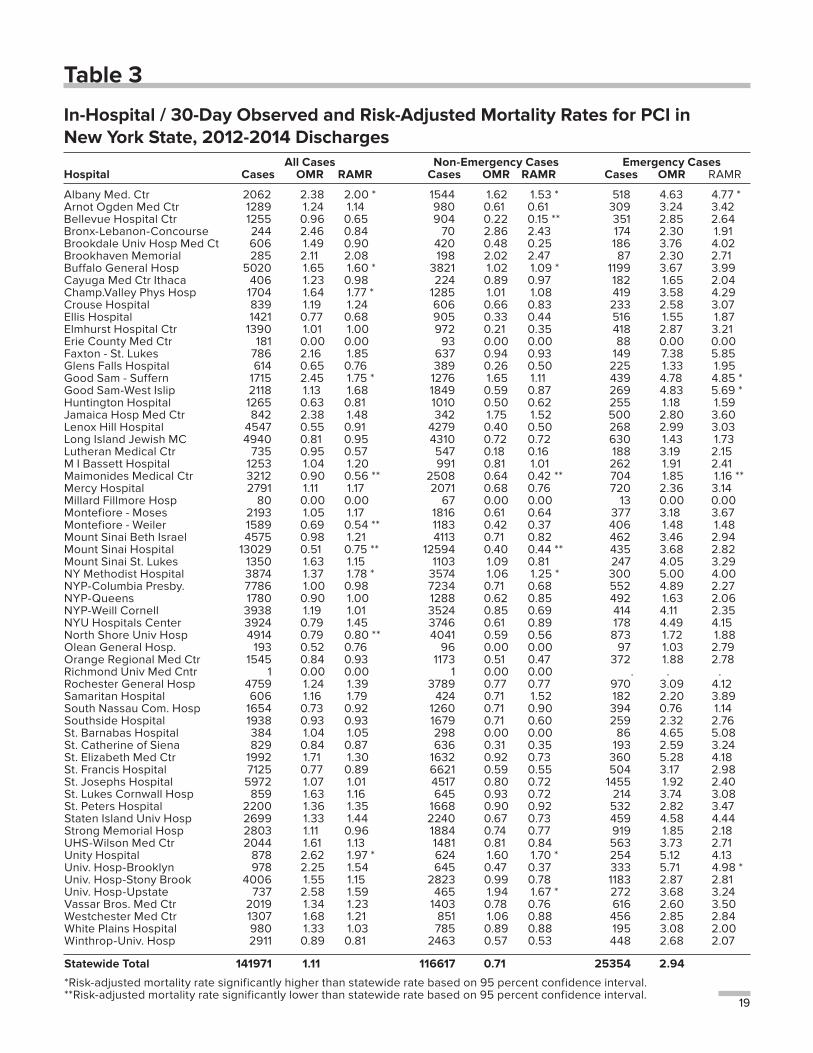
2012-2014 HOSPITAL DATA FOR PCI AND TAVRTable 3 provides the number of PCIs, the in-hospital/30-day OMR and RAMR for 2012-2014 for each of three types of PCI patients in the 62 hospitals performing PCI during the time period. The three types of patients are: all patients, non-emergency patients and emergency patients (patients in a state of hemodynamic instability, typically associated with very low blood pressure, or patients who experienced a heart attack within 24 hours prior to undergoing PCI). The statistical models that are the basis for all patients, non-emergency patients and emergency patients in 2012-2014 are presented in Appendices 4-6, respectively.
As indicated in Table 3, the three-year observed in-hospital/30-day mortality rates for all PCI patients ranged from 0.00 percent to 2.62 percent, and the RAMRs ranged from 0.00 percent to 2.08 percent. Six hospitals (Albany Medical Center, Buffalo General Hospital, Champlain Valley Physicians Hospital in Plattsburgh, Good Samaritan Hospital in Suffern, New York Methodist Hospital in Brooklyn, and Unity Hospital in Rochester) had RAMRs that were significantly higher than the statewide rate. Four hospitals (Maimonides Medical Center in Brooklyn, Montefiore Medical Center - Weiler Division in the Bronx, Mount Sinai Hospital in Manhattan and North Shore University Hospital in Manhasset) had RAMRs that were significantly lower than the statewide rate. It should be noted that hospitals are more likely to have results that show a statistically significant difference from the statewide rate when three years of data are used than when one year of data is used because the three-year volumes are higher.
Table 3 also presents the three-year in-hospital/30-day RAMRs for non-emergency cases based on the model in Appendix 5. Non-emergency cases comprise 82.14 percent of cases for the period 2012-2014. The statewide in-hospital/30-day mortality rate for the 116,617 non-emergency cases during the 3-year period was 0.71 percent. Observed mortality rates for this group of patients ranged from 0.00 percent to 2.86 percent and the RAMRs ranged from 0.00 to 2.47 percent. Five hospitals (Albany Medical Center, Buffalo General Hospital, New York Methodist Hospital in Brooklyn, Unity
Hospital in Rochester and University Hospital - Upstate in Syracuse) had RAMRs that were significantly higher than the statewide rate. Three hospitals (Bellevue Hospital in Manhattan, Maimonides Medical Center in Brooklyn, and Mount Sinai Hospital in Manhattan) had RAMRs that were significantly lower than the statewide average for non-emergency cases.
The last three columns in Table 3 present data on emergency cases based on the model in Appendix 6. Emergency cases represented 17.86 percent of cases for the period 2012-2014. The statewide in-hospital/30-day mortality rate for the 25,354 emergency PCI cases during the 3-year period was 2.94 percent. Observed mortality rates for this group ranged from 0.00 percent to 7.38 percent and the RAMRs ranged from 0.00 percent to 5.85 percent. Four hospitals (Albany Medical Center, Good Samaritan Hospital in Suffern, Good Samaritan Hospital in West Islip, and University Hospital-Brooklyn) had RAMRs that were significantly above the statewide average for emergency cases. One hospital (Maimonides Medical Center in Brooklyn) had a RAMR that was significantly below the statewide average for emergency cases.
The observed in-hospital mortality rate (not shown in Table 3) for all 141,971 cases included in Table 3 was 0.65 percent. The in-hospital mortality rate was 0.31 percent for the 116,617 non-emergency cases and 2.20 percent for the 25,354 emergency cases. As stated above, all cases with shock and hypoxic brain injury mortalities discharged in 2012-2014 are excluded from these analyses. Therefore, volume and mortality rates for the all cases and emergency cases analyses are not directly comparable to some previously published by the Department of Health.
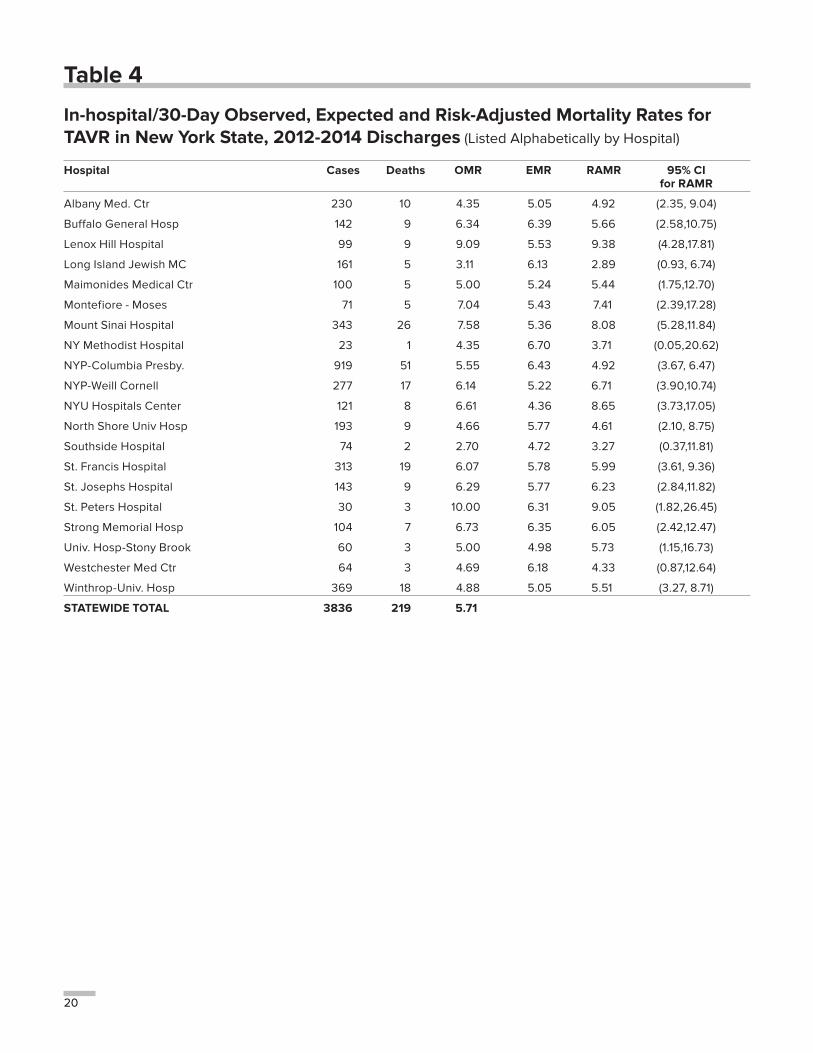
Table 4 presents the results for transcatheter aortic valve replacement (TAVR) procedures performed at the 20 hospitals performing TAVR during the 2012-2014 discharge period. The table contains, for each hospital, the number of TAVR procedures resulting in 2012-2014 discharges, the number of in-hospital/30-day deaths, the OMR, the EMR based on the statistical model presented in Appendix 7, the RAMR and a 95 percent confidence interval for

18
the RAMR. Please note, some hospitals listed in Table 4 began performing the procedure during the 2012-2014 reporting period and the number of cases listed does not represent a full three year’s program activity. Other hospitals have begun performing the procedure more recently.
As indicated in Table 4, the overall in-hospital/30-day mortality rate for the 3836 TAVR procedures performed at the 20 hospitals
was 5.71 percent. The OMRs ranged from 2.70 percent to 10.00 percent. The range of EMRs, which measure patient severity of illness, was 4.36 percent to 6.70 percent.
The RAMRs, which are used to measure performance, ranged from 2.89 percent to 9.38 percent. No hospitals had RAMRs that were statistically higher or lower than the statewide rate.
19
Table 3
In-Hospital / 30-Day Observed and Risk-Adjusted Mortality Rates for PCI in New York State, 2012-2014 Discharges All Cases Non-Emergency Cases Emergency CasesHospital Cases OMR RAMR Cases OMR RAMR Cases OMR RAMR
Albany Med. Ctr 2062 2.38 2.00 * 1544 1.62 1.53 * 518 4.63 4.77 *Arnot Ogden Med Ctr 1289 1.24 1.14 980 0.61 0.61 309 3.24 3.42Bellevue Hospital Ctr 1255 0.96 0.65 904 0.22 0.15 ** 351 2.85 2.64Bronx-Lebanon-Concourse 244 2.46 0.84 70 2.86 2.43 174 2.30 1.91Brookdale Univ Hosp Med Ct 606 1.49 0.90 420 0.48 0.25 186 3.76 4.02Brookhaven Memorial 285 2.11 2.08 198 2.02 2.47 87 2.30 2.71Buffalo General Hosp 5020 1.65 1.60 * 3821 1.02 1.09 * 1199 3.67 3.99Cayuga Med Ctr Ithaca 406 1.23 0.98 224 0.89 0.97 182 1.65 2.04Champ.Valley Phys Hosp 1704 1.64 1.77 * 1285 1.01 1.08 419 3.58 4.29Crouse Hospital 839 1.19 1.24 606 0.66 0.83 233 2.58 3.07Ellis Hospital 1421 0.77 0.68 905 0.33 0.44 516 1.55 1.87Elmhurst Hospital Ctr 1390 1.01 1.00 972 0.21 0.35 418 2.87 3.21Erie County Med Ctr 181 0.00 0.00 93 0.00 0.00 88 0.00 0.00Faxton - St. Lukes 786 2.16 1.85 637 0.94 0.93 149 7.38 5.85Glens Falls Hospital 614 0.65 0.76 389 0.26 0.50 225 1.33 1.95Good Sam - Suffern 1715 2.45 1.75 * 1276 1.65 1.11 439 4.78 4.85 *Good Sam-West Islip 2118 1.13 1.68 1849 0.59 0.87 269 4.83 5.69 *Huntington Hospital 1265 0.63 0.81 1010 0.50 0.62 255 1.18 1.59Jamaica Hosp Med Ctr 842 2.38 1.48 342 1.75 1.52 500 2.80 3.60Lenox Hill Hospital 4547 0.55 0.91 4279 0.40 0.50 268 2.99 3.03Long Island Jewish MC 4940 0.81 0.95 4310 0.72 0.72 630 1.43 1.73Lutheran Medical Ctr 735 0.95 0.57 547 0.18 0.16 188 3.19 2.15M I Bassett Hospital 1253 1.04 1.20 991 0.81 1.01 262 1.91 2.41Maimonides Medical Ctr 3212 0.90 0.56 ** 2508 0.64 0.42 ** 704 1.85 1.16 **Mercy Hospital 2791 1.11 1.17 2071 0.68 0.76 720 2.36 3.14Millard Fillmore Hosp 80 0.00 0.00 67 0.00 0.00 13 0.00 0.00Montefiore - Moses 2193 1.05 1.17 1816 0.61 0.64 377 3.18 3.67Montefiore - Weiler 1589 0.69 0.54 ** 1183 0.42 0.37 406 1.48 1.48Mount Sinai Beth Israel 4575 0.98 1.21 4113 0.71 0.82 462 3.46 2.94Mount Sinai Hospital 13029 0.51 0.75 ** 12594 0.40 0.44 ** 435 3.68 2.82Mount Sinai St. Lukes 1350 1.63 1.15 1103 1.09 0.81 247 4.05 3.29NY Methodist Hospital 3874 1.37 1.78 * 3574 1.06 1.25 * 300 5.00 4.00NYP-Columbia Presby. 7786 1.00 0.98 7234 0.71 0.68 552 4.89 2.27NYP-Queens 1780 0.90 1.00 1288 0.62 0.85 492 1.63 2.06NYP-Weill Cornell 3938 1.19 1.01 3524 0.85 0.69 414 4.11 2.35NYU Hospitals Center 3924 0.79 1.45 3746 0.61 0.89 178 4.49 4.15North Shore Univ Hosp 4914 0.79 0.80 ** 4041 0.59 0.56 873 1.72 1.88Olean General Hosp. 193 0.52 0.76 96 0.00 0.00 97 1.03 2.79Orange Regional Med Ctr 1545 0.84 0.93 1173 0.51 0.47 372 1.88 2.78Richmond Univ Med Cntr 1 0.00 0.00 1 0.00 0.00 . . .Rochester General Hosp 4759 1.24 1.39 3789 0.77 0.77 970 3.09 4.12Samaritan Hospital 606 1.16 1.79 424 0.71 1.52 182 2.20 3.89South Nassau Com. Hosp 1654 0.73 0.92 1260 0.71 0.90 394 0.76 1.14Southside Hospital 1938 0.93 0.93 1679 0.71 0.60 259 2.32 2.76St. Barnabas Hospital 384 1.04 1.05 298 0.00 0.00 86 4.65 5.08St. Catherine of Siena 829 0.84 0.87 636 0.31 0.35 193 2.59 3.24St. Elizabeth Med Ctr 1992 1.71 1.30 1632 0.92 0.73 360 5.28 4.18St. Francis Hospital 7125 0.77 0.89 6621 0.59 0.55 504 3.17 2.98St. Josephs Hospital 5972 1.07 1.01 4517 0.80 0.72 1455 1.92 2.40St. Lukes Cornwall Hosp 859 1.63 1.16 645 0.93 0.72 214 3.74 3.08St. Peters Hospital 2200 1.36 1.35 1668 0.90 0.92 532 2.82 3.47Staten Island Univ Hosp 2699 1.33 1.44 2240 0.67 0.73 459 4.58 4.44Strong Memorial Hosp 2803 1.11 0.96 1884 0.74 0.77 919 1.85 2.18UHS-Wilson Med Ctr 2044 1.61 1.13 1481 0.81 0.84 563 3.73 2.71Unity Hospital 878 2.62 1.97 * 624 1.60 1.70 * 254 5.12 4.13Univ. Hosp-Brooklyn 978 2.25 1.54 645 0.47 0.37 333 5.71 4.98 *Univ. Hosp-Stony Brook 4006 1.55 1.15 2823 0.99 0.78 1183 2.87 2.81Univ. Hosp-Upstate 737 2.58 1.59 465 1.94 1.67 * 272 3.68 3.24Vassar Bros. Med Ctr 2019 1.34 1.23 1403 0.78 0.76 616 2.60 3.50Westchester Med Ctr 1307 1.68 1.21 851 1.06 0.88 456 2.85 2.84White Plains Hospital 980 1.33 1.03 785 0.89 0.88 195 3.08 2.00Winthrop-Univ. Hosp 2911 0.89 0.81 2463 0.57 0.53 448 2.68 2.07
Statewide Total 141971 1.11 116617 0.71 25354 2.94
*Risk-adjusted mortality rate significantly higher than statewide rate based on 95 percent confidence interval. **Risk-adjusted mortality rate significantly lower than statewide rate based on 95 percent confidence interval.
20
Table 4
In-hospital/30-Day Observed, Expected and Risk-Adjusted Mortality Rates for TAVR in New York State, 2012-2014 Discharges (Listed Alphabetically by Hospital)
Hospital Cases Deaths OMR EMR RAMR 95% CI for RAMR
Albany Med. Ctr 230 10 4.35 5.05 4.92 (2.35, 9.04)
Buffalo General Hosp 142 9 6.34 6.39 5.66 (2.58,10.75)
Lenox Hill Hospital 99 9 9.09 5.53 9.38 (4.28,17.81)
Long Island Jewish MC 161 5 3.11 6.13 2.89 (0.93, 6.74)
Maimonides Medical Ctr 100 5 5.00 5.24 5.44 (1.75,12.70)
Montefiore - Moses 71 5 7.04 5.43 7.41 (2.39,17.28)
Mount Sinai Hospital 343 26 7.58 5.36 8.08 (5.28,11.84)
NY Methodist Hospital 23 1 4.35 6.70 3.71 (0.05,20.62)
NYP-Columbia Presby. 919 51 5.55 6.43 4.92 (3.67, 6.47)
NYP-Weill Cornell 277 17 6.14 5.22 6.71 (3.90,10.74)
NYU Hospitals Center 121 8 6.61 4.36 8.65 (3.73,17.05)
North Shore Univ Hosp 193 9 4.66 5.77 4.61 (2.10, 8.75)
Southside Hospital 74 2 2.70 4.72 3.27 (0.37,11.81)
St. Francis Hospital 313 19 6.07 5.78 5.99 (3.61, 9.36)
St. Josephs Hospital 143 9 6.29 5.77 6.23 (2.84,11.82)
St. Peters Hospital 30 3 10.00 6.31 9.05 (1.82,26.45)
Strong Memorial Hosp 104 7 6.73 6.35 6.05 (2.42,12.47)
Univ. Hosp-Stony Brook 60 3 5.00 4.98 5.73 (1.15,16.73)
Westchester Med Ctr 64 3 4.69 6.18 4.33 (0.87,12.64)
Winthrop-Univ. Hosp 369 18 4.88 5.05 5.51 (3.27, 8.71)
STATEWIDE TOTAL 3836 219 5.71
21
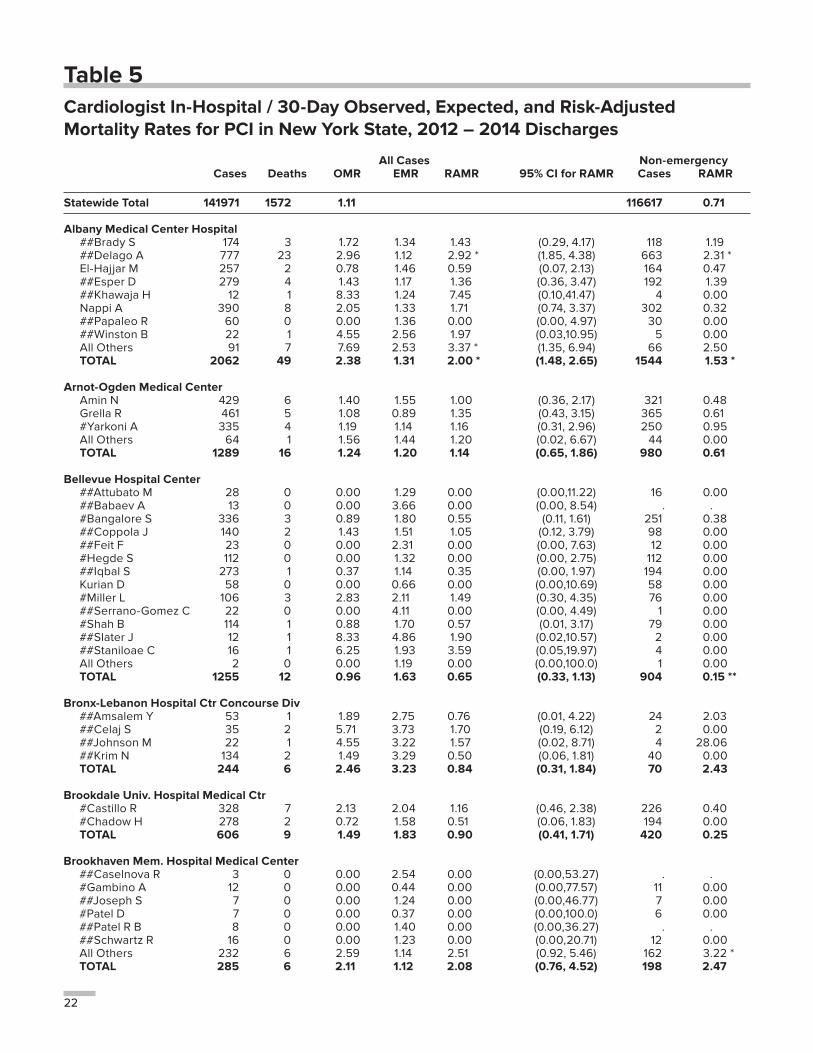
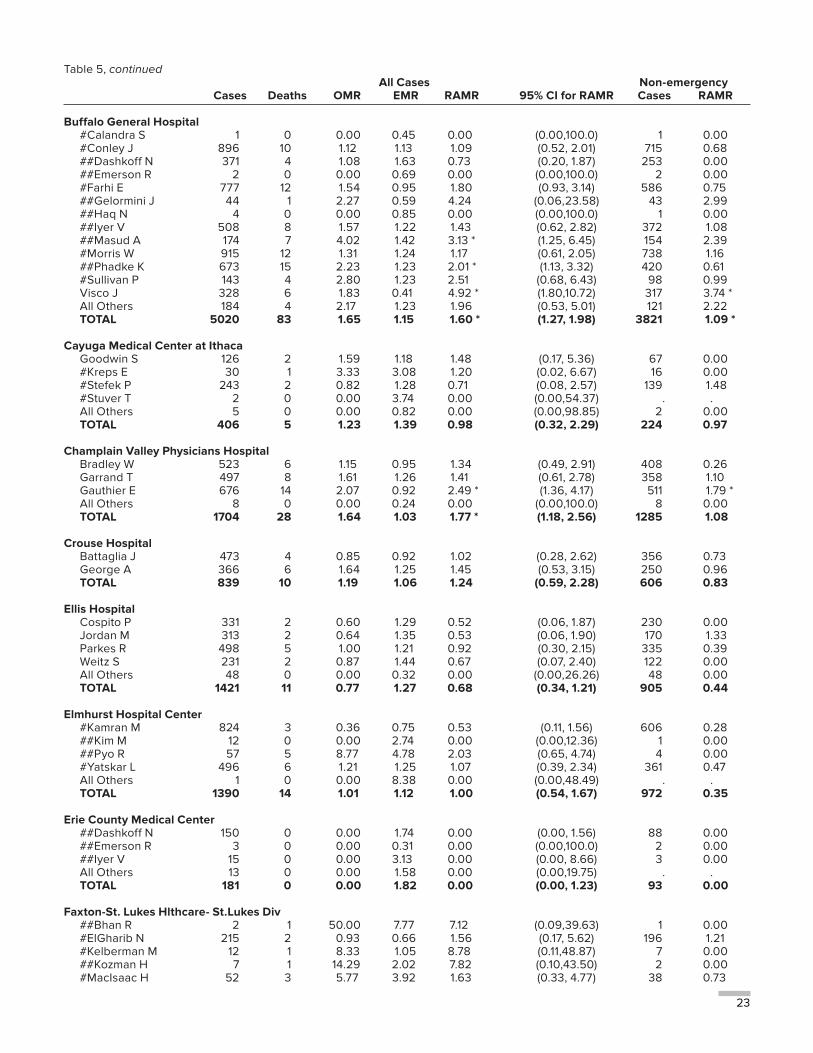
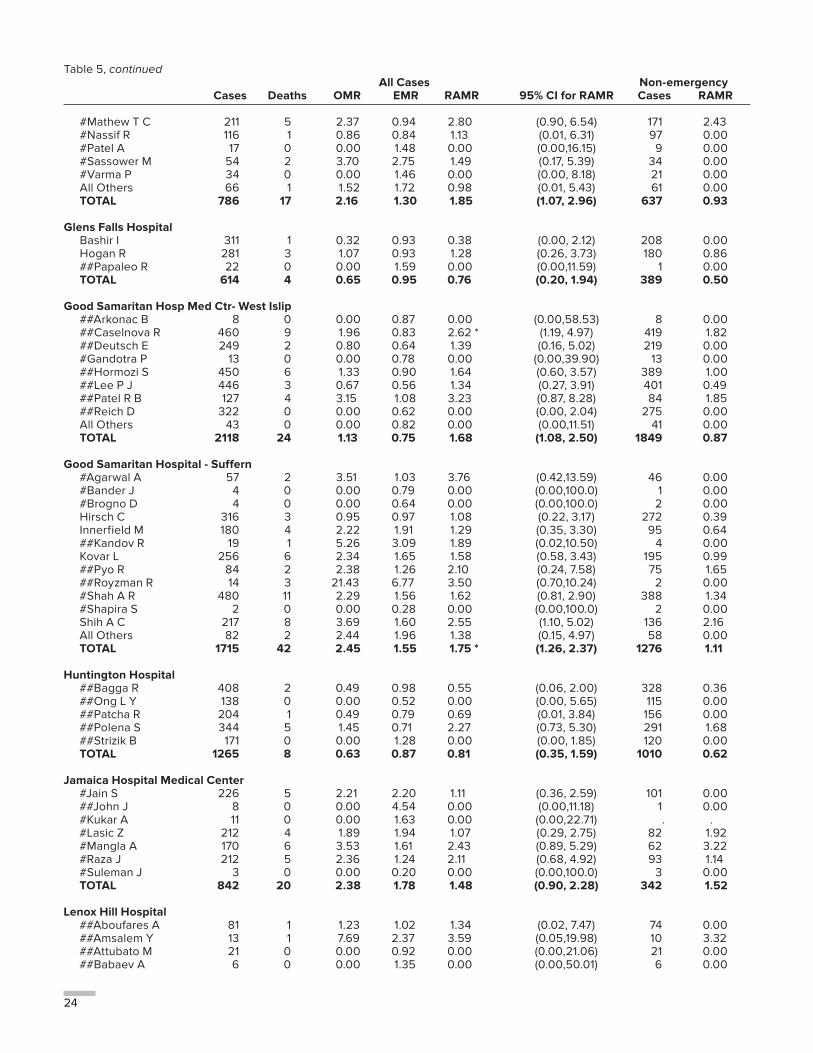
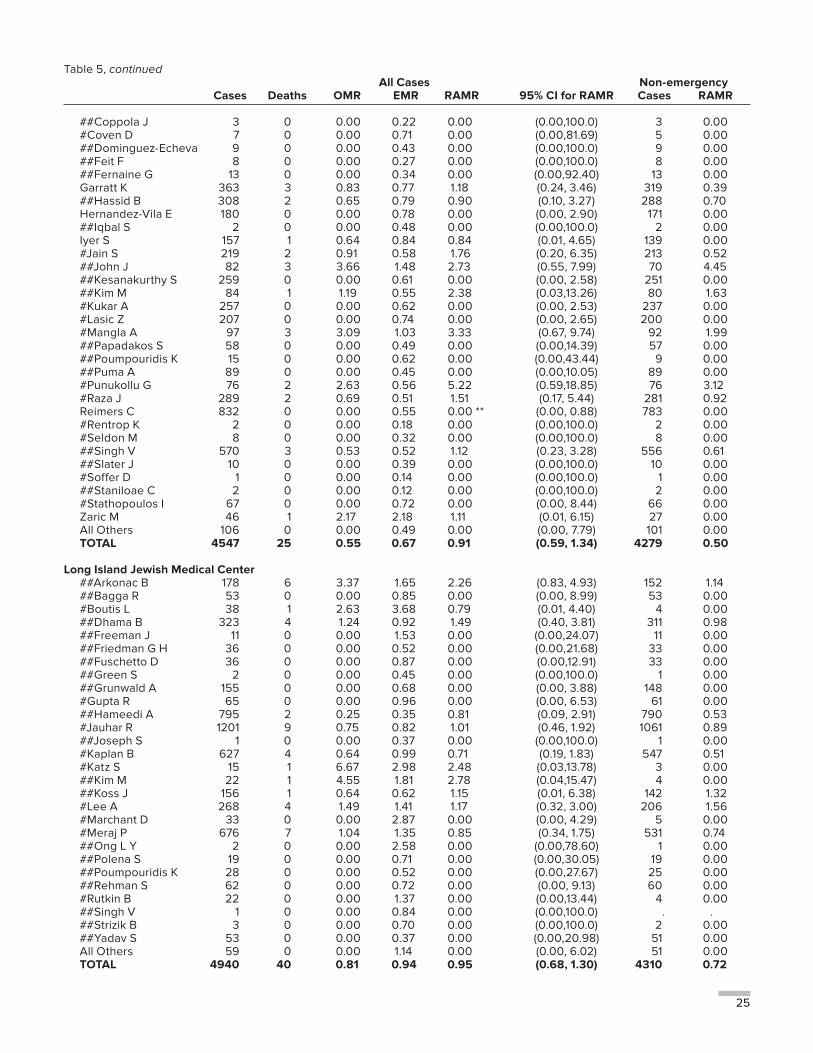
2012-2014 HOSPITAL AND CARDIOLOGIST DATA FOR PCITable 5 provides the number of PCIs, number of PCI patients who died in the hospital or after discharge but within 30 days, OMR, EMR, RAMR and the 95 percent confidence interval for the RAMR for 2012-2014 for cardiologists in each of the 62 hospitals performing PCI during the time period and for each of the hospitals. Table 5 also contains the volume and RAMR for cardiologists and hospitals for non-emergency cases.
This information is presented for each cardiologist who (a) performed 200 or more PCIs during 2012-2014, and/or (b) performed at least one PCI in each of the years 2012-2014. The results for cardiologists not meeting the above criteria are grouped together and reported as “All Others” in the hospital in which the procedures were performed. Cardiologists who met criterion (a) or (b) above and performed procedures in more than one hospital are noted in the table and are listed in all hospitals in which they performed procedures during 2012-2014.
Also, cardiologists who met criterion (a) or (b) above and have performed PCI in two or more NYS hospitals are listed separately in Table 6.
For these cardiologists, the table presents the number of PCIs, the number of in-hospital/30-day deaths, OMR, EMR and RAMR with its 95 percent confidence interval for each hospital in which the cardiologist performed PCI, as well as the aggregate numbers (across all hospitals in which the cardiologist performed procedures). In addition, cardiologists and hospitals with RAMRs that are significantly lower or higher than the statewide mortality rate (as judged by a 95 percent confidence interval) are noted in Tables 5 and 6.
It should be noted that myocardial infarction (MI) less than 24 hours before the procedure and hemodynamic instability are significant risk factors in the All Cases model. However, patients with these conditions are excluded from the non-emergency analysis. The outcomes models for the two groups can, therefore, yield substantially different RAMRs. It is important to compare providers’ RAMRs to the statewide average mortality rate for the specific group of patients analyzed.
22
Table 5Cardiologist In-Hospital / 30-Day Observed, Expected, and Risk-Adjusted Mortality Rates for PCI in New York State, 2012 – 2014 Discharges
All Cases Non-emergency Cases Deaths OMR EMR RAMR 95% CI for RAMR Cases RAMR
Statewide Total 141971 1572 1.11 116617 0.71
Albany Medical Center Hospital ##Brady S 174 3 1.72 1.34 1.43 (0.29, 4.17) 118 1.19 ##Delago A 777 23 2.96 1.12 2.92 * (1.85, 4.38) 663 2.31 * El-Hajjar M 257 2 0.78 1.46 0.59 (0.07, 2.13) 164 0.47 ##Esper D 279 4 1.43 1.17 1.36 (0.36, 3.47) 192 1.39 ##Khawaja H 12 1 8.33 1.24 7.45 (0.10,41.47) 4 0.00 Nappi A 390 8 2.05 1.33 1.71 (0.74, 3.37) 302 0.32 ##Papaleo R 60 0 0.00 1.36 0.00 (0.00, 4.97) 30 0.00 ##Winston B 22 1 4.55 2.56 1.97 (0.03,10.95) 5 0.00 All Others 91 7 7.69 2.53 3.37 * (1.35, 6.94) 66 2.50 TOTAL 2062 49 2.38 1.31 2.00 * (1.48, 2.65) 1544 1.53 *
Arnot-Ogden Medical Center Amin N 429 6 1.40 1.55 1.00 (0.36, 2.17) 321 0.48 Grella R 461 5 1.08 0.89 1.35 (0.43, 3.15) 365 0.61 #Yarkoni A 335 4 1.19 1.14 1.16 (0.31, 2.96) 250 0.95 All Others 64 1 1.56 1.44 1.20 (0.02, 6.67) 44 0.00 TOTAL 1289 16 1.24 1.20 1.14 (0.65, 1.86) 980 0.61
Bellevue Hospital Center ##Attubato M 28 0 0.00 1.29 0.00 (0.00,11.22) 16 0.00 ##Babaev A 13 0 0.00 3.66 0.00 (0.00, 8.54) . . #Bangalore S 336 3 0.89 1.80 0.55 (0.11, 1.61) 251 0.38 ##Coppola J 140 2 1.43 1.51 1.05 (0.12, 3.79) 98 0.00 ##Feit F 23 0 0.00 2.31 0.00 (0.00, 7.63) 12 0.00 #Hegde S 112 0 0.00 1.32 0.00 (0.00, 2.75) 112 0.00 ##Iqbal S 273 1 0.37 1.14 0.35 (0.00, 1.97) 194 0.00 Kurian D 58 0 0.00 0.66 0.00 (0.00,10.69) 58 0.00 #Miller L 106 3 2.83 2.11 1.49 (0.30, 4.35) 76 0.00 ##Serrano-Gomez C 22 0 0.00 4.11 0.00 (0.00, 4.49) 1 0.00 #Shah B 114 1 0.88 1.70 0.57 (0.01, 3.17) 79 0.00 ##Slater J 12 1 8.33 4.86 1.90 (0.02,10.57) 2 0.00 ##Staniloae C 16 1 6.25 1.93 3.59 (0.05,19.97) 4 0.00 All Others 2 0 0.00 1.19 0.00 (0.00,100.0) 1 0.00 TOTAL 1255 12 0.96 1.63 0.65 (0.33, 1.13) 904 0.15 **
Bronx-Lebanon Hospital Ctr Concourse Div ##Amsalem Y 53 1 1.89 2.75 0.76 (0.01, 4.22) 24 2.03 ##Celaj S 35 2 5.71 3.73 1.70 (0.19, 6.12) 2 0.00 ##Johnson M 22 1 4.55 3.22 1.57 (0.02, 8.71) 4 28.06 ##Krim N 134 2 1.49 3.29 0.50 (0.06, 1.81) 40 0.00 TOTAL 244 6 2.46 3.23 0.84 (0.31, 1.84) 70 2.43
Brookdale Univ. Hospital Medical Ctr #Castillo R 328 7 2.13 2.04 1.16 (0.46, 2.38) 226 0.40 #Chadow H 278 2 0.72 1.58 0.51 (0.06, 1.83) 194 0.00 TOTAL 606 9 1.49 1.83 0.90 (0.41, 1.71) 420 0.25
Brookhaven Mem. Hospital Medical Center ##Caselnova R 3 0 0.00 2.54 0.00 (0.00,53.27) . . #Gambino A 12 0 0.00 0.44 0.00 (0.00,77.57) 11 0.00 ##Joseph S 7 0 0.00 1.24 0.00 (0.00,46.77) 7 0.00 #Patel D 7 0 0.00 0.37 0.00 (0.00,100.0) 6 0.00 ##Patel R B 8 0 0.00 1.40 0.00 (0.00,36.27) . . ##Schwartz R 16 0 0.00 1.23 0.00 (0.00,20.71) 12 0.00 All Others 232 6 2.59 1.14 2.51 (0.92, 5.46) 162 3.22 * TOTAL 285 6 2.11 1.12 2.08 (0.76, 4.52) 198 2.47
23
Table 5, continued All Cases Non-emergency Cases Deaths OMR EMR RAMR 95% CI for RAMR Cases RAMR
Buffalo General Hospital #Calandra S 1 0 0.00 0.45 0.00 (0.00,100.0) 1 0.00 #Conley J 896 10 1.12 1.13 1.09 (0.52, 2.01) 715 0.68 ##Dashkoff N 371 4 1.08 1.63 0.73 (0.20, 1.87) 253 0.00 ##Emerson R 2 0 0.00 0.69 0.00 (0.00,100.0) 2 0.00 #Farhi E 777 12 1.54 0.95 1.80 (0.93, 3.14) 586 0.75 ##Gelormini J 44 1 2.27 0.59 4.24 (0.06,23.58) 43 2.99 ##Haq N 4 0 0.00 0.85 0.00 (0.00,100.0) 1 0.00 ##Iyer V 508 8 1.57 1.22 1.43 (0.62, 2.82) 372 1.08 ##Masud A 174 7 4.02 1.42 3.13 * (1.25, 6.45) 154 2.39 #Morris W 915 12 1.31 1.24 1.17 (0.61, 2.05) 738 1.16 ##Phadke K 673 15 2.23 1.23 2.01 * (1.13, 3.32) 420 0.61 #Sullivan P 143 4 2.80 1.23 2.51 (0.68, 6.43) 98 0.99 Visco J 328 6 1.83 0.41 4.92 * (1.80,10.72) 317 3.74 * All Others 184 4 2.17 1.23 1.96 (0.53, 5.01) 121 2.22 TOTAL 5020 83 1.65 1.15 1.60 * (1.27, 1.98) 3821 1.09 *
Cayuga Medical Center at Ithaca Goodwin S 126 2 1.59 1.18 1.48 (0.17, 5.36) 67 0.00 #Kreps E 30 1 3.33 3.08 1.20 (0.02, 6.67) 16 0.00 #Stefek P 243 2 0.82 1.28 0.71 (0.08, 2.57) 139 1.48 #Stuver T 2 0 0.00 3.74 0.00 (0.00,54.37) . . All Others 5 0 0.00 0.82 0.00 (0.00,98.85) 2 0.00 TOTAL 406 5 1.23 1.39 0.98 (0.32, 2.29) 224 0.97
Champlain Valley Physicians Hospital Bradley W 523 6 1.15 0.95 1.34 (0.49, 2.91) 408 0.26 Garrand T 497 8 1.61 1.26 1.41 (0.61, 2.78) 358 1.10 Gauthier E 676 14 2.07 0.92 2.49 * (1.36, 4.17) 511 1.79 * All Others 8 0 0.00 0.24 0.00 (0.00,100.0) 8 0.00 TOTAL 1704 28 1.64 1.03 1.77 * (1.18, 2.56) 1285 1.08
Crouse Hospital Battaglia J 473 4 0.85 0.92 1.02 (0.28, 2.62) 356 0.73 George A 366 6 1.64 1.25 1.45 (0.53, 3.15) 250 0.96 TOTAL 839 10 1.19 1.06 1.24 (0.59, 2.28) 606 0.83
Ellis Hospital Cospito P 331 2 0.60 1.29 0.52 (0.06, 1.87) 230 0.00 Jordan M 313 2 0.64 1.35 0.53 (0.06, 1.90) 170 1.33 Parkes R 498 5 1.00 1.21 0.92 (0.30, 2.15) 335 0.39 Weitz S 231 2 0.87 1.44 0.67 (0.07, 2.40) 122 0.00 All Others 48 0 0.00 0.32 0.00 (0.00,26.26) 48 0.00 TOTAL 1421 11 0.77 1.27 0.68 (0.34, 1.21) 905 0.44
Elmhurst Hospital Center #Kamran M 824 3 0.36 0.75 0.53 (0.11, 1.56) 606 0.28 ##Kim M 12 0 0.00 2.74 0.00 (0.00,12.36) 1 0.00 ##Pyo R 57 5 8.77 4.78 2.03 (0.65, 4.74) 4 0.00 #Yatskar L 496 6 1.21 1.25 1.07 (0.39, 2.34) 361 0.47 All Others 1 0 0.00 8.38 0.00 (0.00,48.49) . . TOTAL 1390 14 1.01 1.12 1.00 (0.54, 1.67) 972 0.35
Erie County Medical Center ##Dashkoff N 150 0 0.00 1.74 0.00 (0.00, 1.56) 88 0.00 ##Emerson R 3 0 0.00 0.31 0.00 (0.00,100.0) 2 0.00 ##Iyer V 15 0 0.00 3.13 0.00 (0.00, 8.66) 3 0.00 All Others 13 0 0.00 1.58 0.00 (0.00,19.75) . . TOTAL 181 0 0.00 1.82 0.00 (0.00, 1.23) 93 0.00
Faxton-St. Lukes Hlthcare- St.Lukes Div ##Bhan R 2 1 50.00 7.77 7.12 (0.09,39.63) 1 0.00 #ElGharib N 215 2 0.93 0.66 1.56 (0.17, 5.62) 196 1.21 #Kelberman M 12 1 8.33 1.05 8.78 (0.11,48.87) 7 0.00 ##Kozman H 7 1 14.29 2.02 7.82 (0.10,43.50) 2 0.00 #MacIsaac H 52 3 5.77 3.92 1.63 (0.33, 4.77) 38 0.73
24
Table 5, continued All Cases Non-emergency Cases Deaths OMR EMR RAMR 95% CI for RAMR Cases RAMR
#Mathew T C 211 5 2.37 0.94 2.80 (0.90, 6.54) 171 2.43 #Nassif R 116 1 0.86 0.84 1.13 (0.01, 6.31) 97 0.00 #Patel A 17 0 0.00 1.48 0.00 (0.00,16.15) 9 0.00 #Sassower M 54 2 3.70 2.75 1.49 (0.17, 5.39) 34 0.00 #Varma P 34 0 0.00 1.46 0.00 (0.00, 8.18) 21 0.00 All Others 66 1 1.52 1.72 0.98 (0.01, 5.43) 61 0.00 TOTAL 786 17 2.16 1.30 1.85 (1.07, 2.96) 637 0.93
Glens Falls Hospital Bashir I 311 1 0.32 0.93 0.38 (0.00, 2.12) 208 0.00 Hogan R 281 3 1.07 0.93 1.28 (0.26, 3.73) 180 0.86 ##Papaleo R 22 0 0.00 1.59 0.00 (0.00,11.59) 1 0.00 TOTAL 614 4 0.65 0.95 0.76 (0.20, 1.94) 389 0.50
Good Samaritan Hosp Med Ctr- West Islip ##Arkonac B 8 0 0.00 0.87 0.00 (0.00,58.53) 8 0.00 ##Caselnova R 460 9 1.96 0.83 2.62 * (1.19, 4.97) 419 1.82 ##Deutsch E 249 2 0.80 0.64 1.39 (0.16, 5.02) 219 0.00 #Gandotra P 13 0 0.00 0.78 0.00 (0.00,39.90) 13 0.00 ##Hormozi S 450 6 1.33 0.90 1.64 (0.60, 3.57) 389 1.00 ##Lee P J 446 3 0.67 0.56 1.34 (0.27, 3.91) 401 0.49 ##Patel R B 127 4 3.15 1.08 3.23 (0.87, 8.28) 84 1.85 ##Reich D 322 0 0.00 0.62 0.00 (0.00, 2.04) 275 0.00 All Others 43 0 0.00 0.82 0.00 (0.00,11.51) 41 0.00 TOTAL 2118 24 1.13 0.75 1.68 (1.08, 2.50) 1849 0.87
Good Samaritan Hospital - Suffern #Agarwal A 57 2 3.51 1.03 3.76 (0.42,13.59) 46 0.00 #Bander J 4 0 0.00 0.79 0.00 (0.00,100.0) 1 0.00 #Brogno D 4 0 0.00 0.64 0.00 (0.00,100.0) 2 0.00 Hirsch C 316 3 0.95 0.97 1.08 (0.22, 3.17) 272 0.39 Innerfield M 180 4 2.22 1.91 1.29 (0.35, 3.30) 95 0.64 ##Kandov R 19 1 5.26 3.09 1.89 (0.02,10.50) 4 0.00 Kovar L 256 6 2.34 1.65 1.58 (0.58, 3.43) 195 0.99 ##Pyo R 84 2 2.38 1.26 2.10 (0.24, 7.58) 75 1.65 ##Royzman R 14 3 21.43 6.77 3.50 (0.70,10.24) 2 0.00 #Shah A R 480 11 2.29 1.56 1.62 (0.81, 2.90) 388 1.34 #Shapira S 2 0 0.00 0.28 0.00 (0.00,100.0) 2 0.00 Shih A C 217 8 3.69 1.60 2.55 (1.10, 5.02) 136 2.16 All Others 82 2 2.44 1.96 1.38 (0.15, 4.97) 58 0.00 TOTAL 1715 42 2.45 1.55 1.75 * (1.26, 2.37) 1276 1.11
Huntington Hospital ##Bagga R 408 2 0.49 0.98 0.55 (0.06, 2.00) 328 0.36 ##Ong L Y 138 0 0.00 0.52 0.00 (0.00, 5.65) 115 0.00 ##Patcha R 204 1 0.49 0.79 0.69 (0.01, 3.84) 156 0.00 ##Polena S 344 5 1.45 0.71 2.27 (0.73, 5.30) 291 1.68 ##Strizik B 171 0 0.00 1.28 0.00 (0.00, 1.85) 120 0.00 TOTAL 1265 8 0.63 0.87 0.81 (0.35, 1.59) 1010 0.62
Jamaica Hospital Medical Center #Jain S 226 5 2.21 2.20 1.11 (0.36, 2.59) 101 0.00 ##John J 8 0 0.00 4.54 0.00 (0.00,11.18) 1 0.00 #Kukar A 11 0 0.00 1.63 0.00 (0.00,22.71) . . #Lasic Z 212 4 1.89 1.94 1.07 (0.29, 2.75) 82 1.92 #Mangla A 170 6 3.53 1.61 2.43 (0.89, 5.29) 62 3.22 #Raza J 212 5 2.36 1.24 2.11 (0.68, 4.92) 93 1.14 #Suleman J 3 0 0.00 0.20 0.00 (0.00,100.0) 3 0.00 TOTAL 842 20 2.38 1.78 1.48 (0.90, 2.28) 342 1.52
Lenox Hill Hospital ##Aboufares A 81 1 1.23 1.02 1.34 (0.02, 7.47) 74 0.00 ##Amsalem Y 13 1 7.69 2.37 3.59 (0.05,19.98) 10 3.32 ##Attubato M 21 0 0.00 0.92 0.00 (0.00,21.06) 21 0.00 ##Babaev A 6 0 0.00 1.35 0.00 (0.00,50.01) 6 0.00
25
Table 5, continued All Cases Non-emergency Cases Deaths OMR EMR RAMR 95% CI for RAMR Cases RAMR
##Coppola J 3 0 0.00 0.22 0.00 (0.00,100.0) 3 0.00 #Coven D 7 0 0.00 0.71 0.00 (0.00,81.69) 5 0.00 ##Dominguez-Echeva 9 0 0.00 0.43 0.00 (0.00,100.0) 9 0.00 ##Feit F 8 0 0.00 0.27 0.00 (0.00,100.0) 8 0.00 ##Fernaine G 13 0 0.00 0.34 0.00 (0.00,92.40) 13 0.00 Garratt K 363 3 0.83 0.77 1.18 (0.24, 3.46) 319 0.39 ##Hassid B 308 2 0.65 0.79 0.90 (0.10, 3.27) 288 0.70 Hernandez-Vila E 180 0 0.00 0.78 0.00 (0.00, 2.90) 171 0.00 ##Iqbal S 2 0 0.00 0.48 0.00 (0.00,100.0) 2 0.00 Iyer S 157 1 0.64 0.84 0.84 (0.01, 4.65) 139 0.00 #Jain S 219 2 0.91 0.58 1.76 (0.20, 6.35) 213 0.52 ##John J 82 3 3.66 1.48 2.73 (0.55, 7.99) 70 4.45 ##Kesanakurthy S 259 0 0.00 0.61 0.00 (0.00, 2.58) 251 0.00 ##Kim M 84 1 1.19 0.55 2.38 (0.03,13.26) 80 1.63 #Kukar A 257 0 0.00 0.62 0.00 (0.00, 2.53) 237 0.00 #Lasic Z 207 0 0.00 0.74 0.00 (0.00, 2.65) 200 0.00 #Mangla A 97 3 3.09 1.03 3.33 (0.67, 9.74) 92 1.99 ##Papadakos S 58 0 0.00 0.49 0.00 (0.00,14.39) 57 0.00 ##Poumpouridis K 15 0 0.00 0.62 0.00 (0.00,43.44) 9 0.00 ##Puma A 89 0 0.00 0.45 0.00 (0.00,10.05) 89 0.00 #Punukollu G 76 2 2.63 0.56 5.22 (0.59,18.85) 76 3.12 #Raza J 289 2 0.69 0.51 1.51 (0.17, 5.44) 281 0.92 Reimers C 832 0 0.00 0.55 0.00 ** (0.00, 0.88) 783 0.00 #Rentrop K 2 0 0.00 0.18 0.00 (0.00,100.0) 2 0.00 #Seldon M 8 0 0.00 0.32 0.00 (0.00,100.0) 8 0.00 ##Singh V 570 3 0.53 0.52 1.12 (0.23, 3.28) 556 0.61 ##Slater J 10 0 0.00 0.39 0.00 (0.00,100.0) 10 0.00 #Soffer D 1 0 0.00 0.14 0.00 (0.00,100.0) 1 0.00 ##Staniloae C 2 0 0.00 0.12 0.00 (0.00,100.0) 2 0.00 #Stathopoulos I 67 0 0.00 0.72 0.00 (0.00, 8.44) 66 0.00 Zaric M 46 1 2.17 2.18 1.11 (0.01, 6.15) 27 0.00 All Others 106 0 0.00 0.49 0.00 (0.00, 7.79) 101 0.00 TOTAL 4547 25 0.55 0.67 0.91 (0.59, 1.34) 4279 0.50
Long Island Jewish Medical Center ##Arkonac B 178 6 3.37 1.65 2.26 (0.83, 4.93) 152 1.14 ##Bagga R 53 0 0.00 0.85 0.00 (0.00, 8.99) 53 0.00 #Boutis L 38 1 2.63 3.68 0.79 (0.01, 4.40) 4 0.00 ##Dhama B 323 4 1.24 0.92 1.49 (0.40, 3.81) 311 0.98 ##Freeman J 11 0 0.00 1.53 0.00 (0.00,24.07) 11 0.00 ##Friedman G H 36 0 0.00 0.52 0.00 (0.00,21.68) 33 0.00 ##Fuschetto D 36 0 0.00 0.87 0.00 (0.00,12.91) 33 0.00 ##Green S 2 0 0.00 0.45 0.00 (0.00,100.0) 1 0.00 ##Grunwald A 155 0 0.00 0.68 0.00 (0.00, 3.88) 148 0.00 #Gupta R 65 0 0.00 0.96 0.00 (0.00, 6.53) 61 0.00 ##Hameedi A 795 2 0.25 0.35 0.81 (0.09, 2.91) 790 0.53 #Jauhar R 1201 9 0.75 0.82 1.01 (0.46, 1.92) 1061 0.89 ##Joseph S 1 0 0.00 0.37 0.00 (0.00,100.0) 1 0.00 #Kaplan B 627 4 0.64 0.99 0.71 (0.19, 1.83) 547 0.51 #Katz S 15 1 6.67 2.98 2.48 (0.03,13.78) 3 0.00 ##Kim M 22 1 4.55 1.81 2.78 (0.04,15.47) 4 0.00 ##Koss J 156 1 0.64 0.62 1.15 (0.01, 6.38) 142 1.32 #Lee A 268 4 1.49 1.41 1.17 (0.32, 3.00) 206 1.56 #Marchant D 33 0 0.00 2.87 0.00 (0.00, 4.29) 5 0.00 #Meraj P 676 7 1.04 1.35 0.85 (0.34, 1.75) 531 0.74 ##Ong L Y 2 0 0.00 2.58 0.00 (0.00,78.60) 1 0.00 ##Polena S 19 0 0.00 0.71 0.00 (0.00,30.05) 19 0.00 ##Poumpouridis K 28 0 0.00 0.52 0.00 (0.00,27.67) 25 0.00 ##Rehman S 62 0 0.00 0.72 0.00 (0.00, 9.13) 60 0.00 #Rutkin B 22 0 0.00 1.37 0.00 (0.00,13.44) 4 0.00 ##Singh V 1 0 0.00 0.84 0.00 (0.00,100.0) . . ##Strizik B 3 0 0.00 0.70 0.00 (0.00,100.0) 2 0.00 ##Yadav S 53 0 0.00 0.37 0.00 (0.00,20.98) 51 0.00 All Others 59 0 0.00 1.14 0.00 (0.00, 6.02) 51 0.00 TOTAL 4940 40 0.81 0.94 0.95 (0.68, 1.30) 4310 0.72
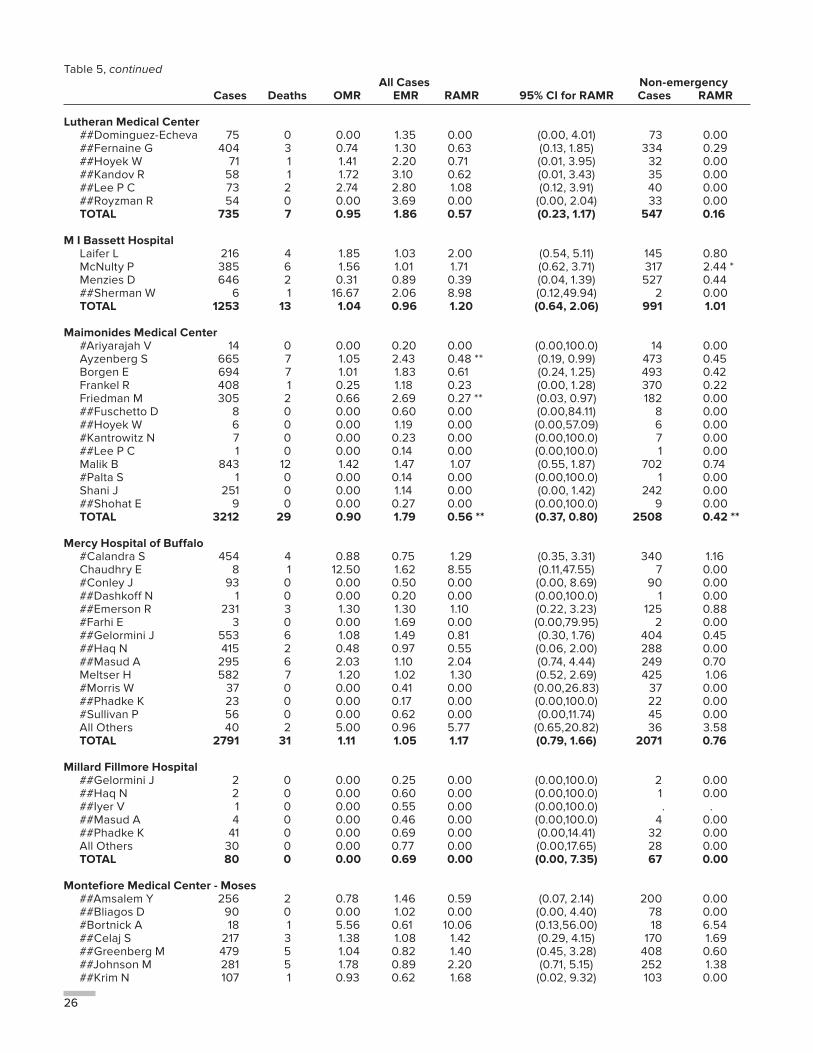
26
Table 5, continued All Cases Non-emergency Cases Deaths OMR EMR RAMR 95% CI for RAMR Cases RAMR
Lutheran Medical Center ##Dominguez-Echeva 75 0 0.00 1.35 0.00 (0.00, 4.01) 73 0.00 ##Fernaine G 404 3 0.74 1.30 0.63 (0.13, 1.85) 334 0.29 ##Hoyek W 71 1 1.41 2.20 0.71 (0.01, 3.95) 32 0.00 ##Kandov R 58 1 1.72 3.10 0.62 (0.01, 3.43) 35 0.00 ##Lee P C 73 2 2.74 2.80 1.08 (0.12, 3.91) 40 0.00 ##Royzman R 54 0 0.00 3.69 0.00 (0.00, 2.04) 33 0.00 TOTAL 735 7 0.95 1.86 0.57 (0.23, 1.17) 547 0.16
M I Bassett Hospital Laifer L 216 4 1.85 1.03 2.00 (0.54, 5.11) 145 0.80 McNulty P 385 6 1.56 1.01 1.71 (0.62, 3.71) 317 2.44 * Menzies D 646 2 0.31 0.89 0.39 (0.04, 1.39) 527 0.44 ##Sherman W 6 1 16.67 2.06 8.98 (0.12,49.94) 2 0.00 TOTAL 1253 13 1.04 0.96 1.20 (0.64, 2.06) 991 1.01
Maimonides Medical Center #Ariyarajah V 14 0 0.00 0.20 0.00 (0.00,100.0) 14 0.00 Ayzenberg S 665 7 1.05 2.43 0.48 ** (0.19, 0.99) 473 0.45 Borgen E 694 7 1.01 1.83 0.61 (0.24, 1.25) 493 0.42 Frankel R 408 1 0.25 1.18 0.23 (0.00, 1.28) 370 0.22 Friedman M 305 2 0.66 2.69 0.27 ** (0.03, 0.97) 182 0.00 ##Fuschetto D 8 0 0.00 0.60 0.00 (0.00,84.11) 8 0.00 ##Hoyek W 6 0 0.00 1.19 0.00 (0.00,57.09) 6 0.00 #Kantrowitz N 7 0 0.00 0.23 0.00 (0.00,100.0) 7 0.00 ##Lee P C 1 0 0.00 0.14 0.00 (0.00,100.0) 1 0.00 Malik B 843 12 1.42 1.47 1.07 (0.55, 1.87) 702 0.74 #Palta S 1 0 0.00 0.14 0.00 (0.00,100.0) 1 0.00 Shani J 251 0 0.00 1.14 0.00 (0.00, 1.42) 242 0.00 ##Shohat E 9 0 0.00 0.27 0.00 (0.00,100.0) 9 0.00 TOTAL 3212 29 0.90 1.79 0.56 ** (0.37, 0.80) 2508 0.42 **
Mercy Hospital of Buffalo #Calandra S 454 4 0.88 0.75 1.29 (0.35, 3.31) 340 1.16 Chaudhry E 8 1 12.50 1.62 8.55 (0.11,47.55) 7 0.00 #Conley J 93 0 0.00 0.50 0.00 (0.00, 8.69) 90 0.00 ##Dashkoff N 1 0 0.00 0.20 0.00 (0.00,100.0) 1 0.00 ##Emerson R 231 3 1.30 1.30 1.10 (0.22, 3.23) 125 0.88 #Farhi E 3 0 0.00 1.69 0.00 (0.00,79.95) 2 0.00 ##Gelormini J 553 6 1.08 1.49 0.81 (0.30, 1.76) 404 0.45 ##Haq N 415 2 0.48 0.97 0.55 (0.06, 2.00) 288 0.00 ##Masud A 295 6 2.03 1.10 2.04 (0.74, 4.44) 249 0.70 Meltser H 582 7 1.20 1.02 1.30 (0.52, 2.69) 425 1.06 #Morris W 37 0 0.00 0.41 0.00 (0.00,26.83) 37 0.00 ##Phadke K 23 0 0.00 0.17 0.00 (0.00,100.0) 22 0.00 #Sullivan P 56 0 0.00 0.62 0.00 (0.00,11.74) 45 0.00 All Others 40 2 5.00 0.96 5.77 (0.65,20.82) 36 3.58 TOTAL 2791 31 1.11 1.05 1.17 (0.79, 1.66) 2071 0.76
Millard Fillmore Hospital ##Gelormini J 2 0 0.00 0.25 0.00 (0.00,100.0) 2 0.00 ##Haq N 2 0 0.00 0.60 0.00 (0.00,100.0) 1 0.00 ##Iyer V 1 0 0.00 0.55 0.00 (0.00,100.0) . . ##Masud A 4 0 0.00 0.46 0.00 (0.00,100.0) 4 0.00 ##Phadke K 41 0 0.00 0.69 0.00 (0.00,14.41) 32 0.00 All Others 30 0 0.00 0.77 0.00 (0.00,17.65) 28 0.00 TOTAL 80 0 0.00 0.69 0.00 (0.00, 7.35) 67 0.00
Montefiore Medical Center - Moses ##Amsalem Y 256 2 0.78 1.46 0.59 (0.07, 2.14) 200 0.00 ##Bliagos D 90 0 0.00 1.02 0.00 (0.00, 4.40) 78 0.00 #Bortnick A 18 1 5.56 0.61 10.06 (0.13,56.00) 18 6.54 ##Celaj S 217 3 1.38 1.08 1.42 (0.29, 4.15) 170 1.69 ##Greenberg M 479 5 1.04 0.82 1.40 (0.45, 3.28) 408 0.60 ##Johnson M 281 5 1.78 0.89 2.20 (0.71, 5.15) 252 1.38 ##Krim N 107 1 0.93 0.62 1.68 (0.02, 9.32) 103 0.00
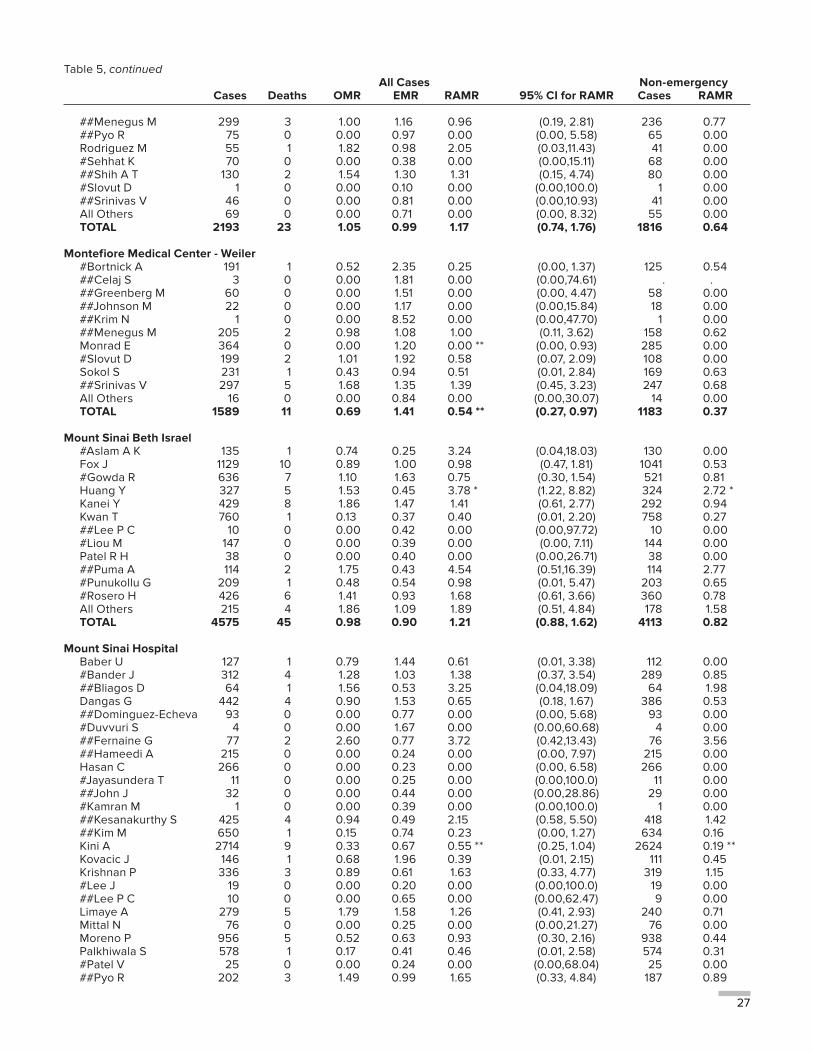
27
Table 5, continued All Cases Non-emergency Cases Deaths OMR EMR RAMR 95% CI for RAMR Cases RAMR
##Menegus M 299 3 1.00 1.16 0.96 (0.19, 2.81) 236 0.77 ##Pyo R 75 0 0.00 0.97 0.00 (0.00, 5.58) 65 0.00 Rodriguez M 55 1 1.82 0.98 2.05 (0.03,11.43) 41 0.00 #Sehhat K 70 0 0.00 0.38 0.00 (0.00,15.11) 68 0.00 ##Shih A T 130 2 1.54 1.30 1.31 (0.15, 4.74) 80 0.00 #Slovut D 1 0 0.00 0.10 0.00 (0.00,100.0) 1 0.00 ##Srinivas V 46 0 0.00 0.81 0.00 (0.00,10.93) 41 0.00 All Others 69 0 0.00 0.71 0.00 (0.00, 8.32) 55 0.00 TOTAL 2193 23 1.05 0.99 1.17 (0.74, 1.76) 1816 0.64
Montefiore Medical Center - Weiler #Bortnick A 191 1 0.52 2.35 0.25 (0.00, 1.37) 125 0.54 ##Celaj S 3 0 0.00 1.81 0.00 (0.00,74.61) . . ##Greenberg M 60 0 0.00 1.51 0.00 (0.00, 4.47) 58 0.00 ##Johnson M 22 0 0.00 1.17 0.00 (0.00,15.84) 18 0.00 ##Krim N 1 0 0.00 8.52 0.00 (0.00,47.70) 1 0.00 ##Menegus M 205 2 0.98 1.08 1.00 (0.11, 3.62) 158 0.62 Monrad E 364 0 0.00 1.20 0.00 ** (0.00, 0.93) 285 0.00 #Slovut D 199 2 1.01 1.92 0.58 (0.07, 2.09) 108 0.00 Sokol S 231 1 0.43 0.94 0.51 (0.01, 2.84) 169 0.63 ##Srinivas V 297 5 1.68 1.35 1.39 (0.45, 3.23) 247 0.68 All Others 16 0 0.00 0.84 0.00 (0.00,30.07) 14 0.00 TOTAL 1589 11 0.69 1.41 0.54 ** (0.27, 0.97) 1183 0.37
Mount Sinai Beth Israel #Aslam A K 135 1 0.74 0.25 3.24 (0.04,18.03) 130 0.00 Fox J 1129 10 0.89 1.00 0.98 (0.47, 1.81) 1041 0.53 #Gowda R 636 7 1.10 1.63 0.75 (0.30, 1.54) 521 0.81 Huang Y 327 5 1.53 0.45 3.78 * (1.22, 8.82) 324 2.72 * Kanei Y 429 8 1.86 1.47 1.41 (0.61, 2.77) 292 0.94 Kwan T 760 1 0.13 0.37 0.40 (0.01, 2.20) 758 0.27 ##Lee P C 10 0 0.00 0.42 0.00 (0.00,97.72) 10 0.00 #Liou M 147 0 0.00 0.39 0.00 (0.00, 7.11) 144 0.00 Patel R H 38 0 0.00 0.40 0.00 (0.00,26.71) 38 0.00 ##Puma A 114 2 1.75 0.43 4.54 (0.51,16.39) 114 2.77 #Punukollu G 209 1 0.48 0.54 0.98 (0.01, 5.47) 203 0.65 #Rosero H 426 6 1.41 0.93 1.68 (0.61, 3.66) 360 0.78 All Others 215 4 1.86 1.09 1.89 (0.51, 4.84) 178 1.58 TOTAL 4575 45 0.98 0.90 1.21 (0.88, 1.62) 4113 0.82
Mount Sinai Hospital Baber U 127 1 0.79 1.44 0.61 (0.01, 3.38) 112 0.00 #Bander J 312 4 1.28 1.03 1.38 (0.37, 3.54) 289 0.85 ##Bliagos D 64 1 1.56 0.53 3.25 (0.04,18.09) 64 1.98 Dangas G 442 4 0.90 1.53 0.65 (0.18, 1.67) 386 0.53 ##Dominguez-Echeva 93 0 0.00 0.77 0.00 (0.00, 5.68) 93 0.00 #Duvvuri S 4 0 0.00 1.67 0.00 (0.00,60.68) 4 0.00 ##Fernaine G 77 2 2.60 0.77 3.72 (0.42,13.43) 76 3.56 ##Hameedi A 215 0 0.00 0.24 0.00 (0.00, 7.97) 215 0.00 Hasan C 266 0 0.00 0.23 0.00 (0.00, 6.58) 266 0.00 #Jayasundera T 11 0 0.00 0.25 0.00 (0.00,100.0) 11 0.00 ##John J 32 0 0.00 0.44 0.00 (0.00,28.86) 29 0.00 #Kamran M 1 0 0.00 0.39 0.00 (0.00,100.0) 1 0.00 ##Kesanakurthy S 425 4 0.94 0.49 2.15 (0.58, 5.50) 418 1.42 ##Kim M 650 1 0.15 0.74 0.23 (0.00, 1.27) 634 0.16 Kini A 2714 9 0.33 0.67 0.55 ** (0.25, 1.04) 2624 0.19 ** Kovacic J 146 1 0.68 1.96 0.39 (0.01, 2.15) 111 0.45 Krishnan P 336 3 0.89 0.61 1.63 (0.33, 4.77) 319 1.15 #Lee J 19 0 0.00 0.20 0.00 (0.00,100.0) 19 0.00 ##Lee P C 10 0 0.00 0.65 0.00 (0.00,62.47) 9 0.00 Limaye A 279 5 1.79 1.58 1.26 (0.41, 2.93) 240 0.71 Mittal N 76 0 0.00 0.25 0.00 (0.00,21.27) 76 0.00 Moreno P 956 5 0.52 0.63 0.93 (0.30, 2.16) 938 0.44 Palkhiwala S 578 1 0.17 0.41 0.46 (0.01, 2.58) 574 0.31 #Patel V 25 0 0.00 0.24 0.00 (0.00,68.04) 25 0.00 ##Pyo R 202 3 1.49 0.99 1.65 (0.33, 4.84) 187 0.89
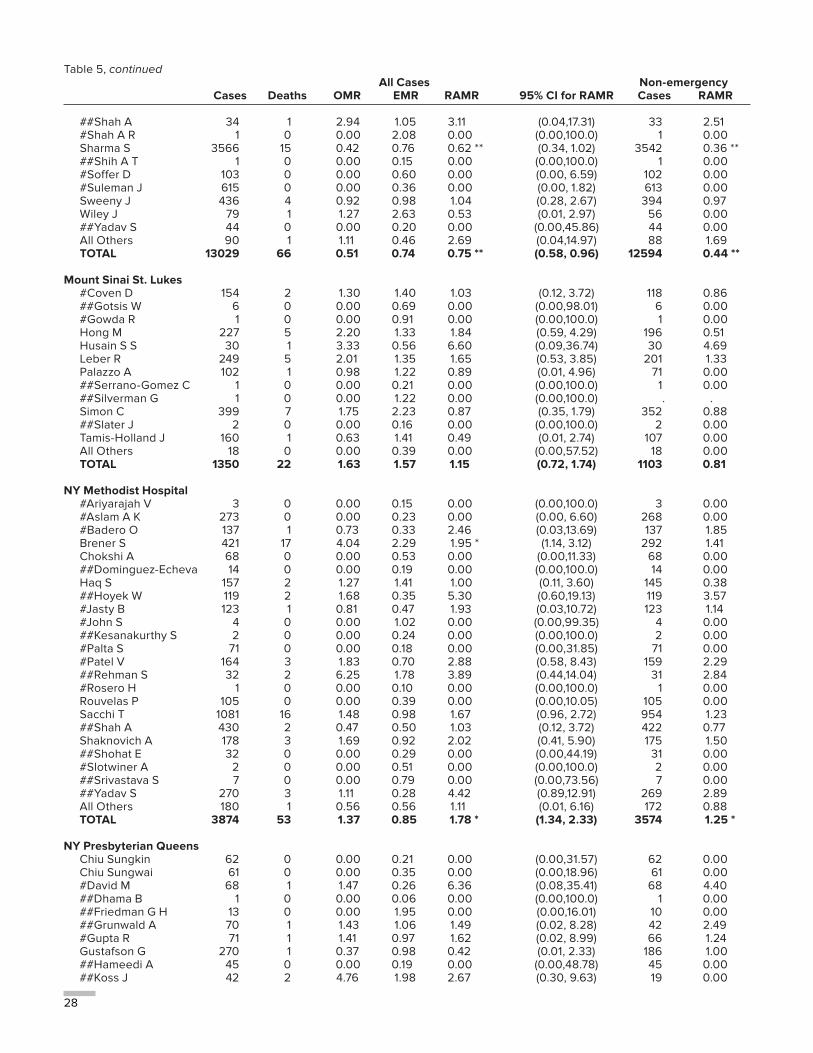
28
Table 5, continued All Cases Non-emergency Cases Deaths OMR EMR RAMR 95% CI for RAMR Cases RAMR
##Shah A 34 1 2.94 1.05 3.11 (0.04,17.31) 33 2.51 #Shah A R 1 0 0.00 2.08 0.00 (0.00,100.0) 1 0.00 Sharma S 3566 15 0.42 0.76 0.62 ** (0.34, 1.02) 3542 0.36 ** ##Shih A T 1 0 0.00 0.15 0.00 (0.00,100.0) 1 0.00 #Soffer D 103 0 0.00 0.60 0.00 (0.00, 6.59) 102 0.00 #Suleman J 615 0 0.00 0.36 0.00 (0.00, 1.82) 613 0.00 Sweeny J 436 4 0.92 0.98 1.04 (0.28, 2.67) 394 0.97 Wiley J 79 1 1.27 2.63 0.53 (0.01, 2.97) 56 0.00 ##Yadav S 44 0 0.00 0.20 0.00 (0.00,45.86) 44 0.00 All Others 90 1 1.11 0.46 2.69 (0.04,14.97) 88 1.69 TOTAL 13029 66 0.51 0.74 0.75 ** (0.58, 0.96) 12594 0.44 **
Mount Sinai St. Lukes #Coven D 154 2 1.30 1.40 1.03 (0.12, 3.72) 118 0.86 ##Gotsis W 6 0 0.00 0.69 0.00 (0.00,98.01) 6 0.00 #Gowda R 1 0 0.00 0.91 0.00 (0.00,100.0) 1 0.00 Hong M 227 5 2.20 1.33 1.84 (0.59, 4.29) 196 0.51 Husain S S 30 1 3.33 0.56 6.60 (0.09,36.74) 30 4.69 Leber R 249 5 2.01 1.35 1.65 (0.53, 3.85) 201 1.33 Palazzo A 102 1 0.98 1.22 0.89 (0.01, 4.96) 71 0.00 ##Serrano-Gomez C 1 0 0.00 0.21 0.00 (0.00,100.0) 1 0.00 ##Silverman G 1 0 0.00 1.22 0.00 (0.00,100.0) . . Simon C 399 7 1.75 2.23 0.87 (0.35, 1.79) 352 0.88 ##Slater J 2 0 0.00 0.16 0.00 (0.00,100.0) 2 0.00 Tamis-Holland J 160 1 0.63 1.41 0.49 (0.01, 2.74) 107 0.00 All Others 18 0 0.00 0.39 0.00 (0.00,57.52) 18 0.00 TOTAL 1350 22 1.63 1.57 1.15 (0.72, 1.74) 1103 0.81
NY Methodist Hospital #Ariyarajah V 3 0 0.00 0.15 0.00 (0.00,100.0) 3 0.00 #Aslam A K 273 0 0.00 0.23 0.00 (0.00, 6.60) 268 0.00 #Badero O 137 1 0.73 0.33 2.46 (0.03,13.69) 137 1.85 Brener S 421 17 4.04 2.29 1.95 * (1.14, 3.12) 292 1.41 Chokshi A 68 0 0.00 0.53 0.00 (0.00,11.33) 68 0.00 ##Dominguez-Echeva 14 0 0.00 0.19 0.00 (0.00,100.0) 14 0.00 Haq S 157 2 1.27 1.41 1.00 (0.11, 3.60) 145 0.38 ##Hoyek W 119 2 1.68 0.35 5.30 (0.60,19.13) 119 3.57 #Jasty B 123 1 0.81 0.47 1.93 (0.03,10.72) 123 1.14 #John S 4 0 0.00 1.02 0.00 (0.00,99.35) 4 0.00 ##Kesanakurthy S 2 0 0.00 0.24 0.00 (0.00,100.0) 2 0.00 #Palta S 71 0 0.00 0.18 0.00 (0.00,31.85) 71 0.00 #Patel V 164 3 1.83 0.70 2.88 (0.58, 8.43) 159 2.29 ##Rehman S 32 2 6.25 1.78 3.89 (0.44,14.04) 31 2.84 #Rosero H 1 0 0.00 0.10 0.00 (0.00,100.0) 1 0.00 Rouvelas P 105 0 0.00 0.39 0.00 (0.00,10.05) 105 0.00 Sacchi T 1081 16 1.48 0.98 1.67 (0.96, 2.72) 954 1.23 ##Shah A 430 2 0.47 0.50 1.03 (0.12, 3.72) 422 0.77 Shaknovich A 178 3 1.69 0.92 2.02 (0.41, 5.90) 175 1.50 ##Shohat E 32 0 0.00 0.29 0.00 (0.00,44.19) 31 0.00 #Slotwiner A 2 0 0.00 0.51 0.00 (0.00,100.0) 2 0.00 ##Srivastava S 7 0 0.00 0.79 0.00 (0.00,73.56) 7 0.00 ##Yadav S 270 3 1.11 0.28 4.42 (0.89,12.91) 269 2.89 All Others 180 1 0.56 0.56 1.11 (0.01, 6.16) 172 0.88 TOTAL 3874 53 1.37 0.85 1.78 * (1.34, 2.33) 3574 1.25 *
NY Presbyterian Queens Chiu Sungkin 62 0 0.00 0.21 0.00 (0.00,31.57) 62 0.00 Chiu Sungwai 61 0 0.00 0.35 0.00 (0.00,18.96) 61 0.00 #David M 68 1 1.47 0.26 6.36 (0.08,35.41) 68 4.40 ##Dhama B 1 0 0.00 0.06 0.00 (0.00,100.0) 1 0.00 ##Friedman G H 13 0 0.00 1.95 0.00 (0.00,16.01) 10 0.00 ##Grunwald A 70 1 1.43 1.06 1.49 (0.02, 8.28) 42 2.49 #Gupta R 71 1 1.41 0.97 1.62 (0.02, 8.99) 66 1.24 Gustafson G 270 1 0.37 0.98 0.42 (0.01, 2.33) 186 1.00 ##Hameedi A 45 0 0.00 0.19 0.00 (0.00,48.78) 45 0.00 ##Koss J 42 2 4.76 1.98 2.67 (0.30, 9.63) 19 0.00
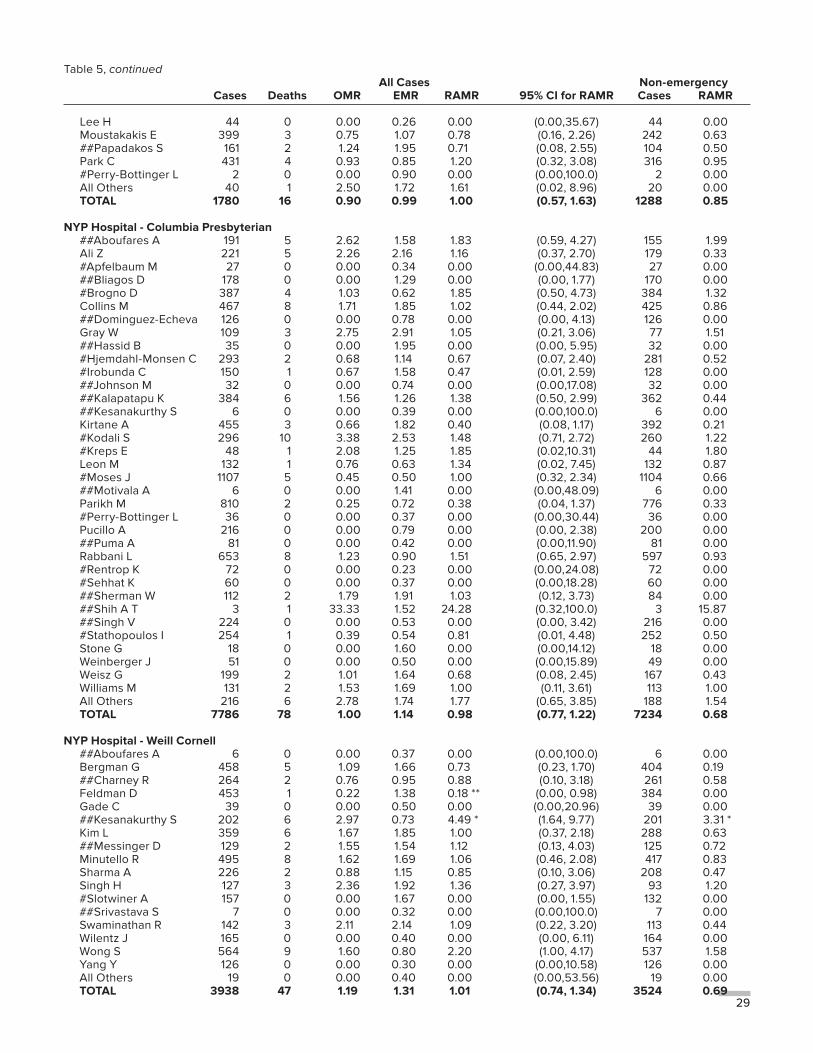
29
Table 5, continued All Cases Non-emergency Cases Deaths OMR EMR RAMR 95% CI for RAMR Cases RAMR
Lee H 44 0 0.00 0.26 0.00 (0.00,35.67) 44 0.00 Moustakakis E 399 3 0.75 1.07 0.78 (0.16, 2.26) 242 0.63 ##Papadakos S 161 2 1.24 1.95 0.71 (0.08, 2.55) 104 0.50 Park C 431 4 0.93 0.85 1.20 (0.32, 3.08) 316 0.95 #Perry-Bottinger L 2 0 0.00 0.90 0.00 (0.00,100.0) 2 0.00 All Others 40 1 2.50 1.72 1.61 (0.02, 8.96) 20 0.00 TOTAL 1780 16 0.90 0.99 1.00 (0.57, 1.63) 1288 0.85
NYP Hospital - Columbia Presbyterian ##Aboufares A 191 5 2.62 1.58 1.83 (0.59, 4.27) 155 1.99 Ali Z 221 5 2.26 2.16 1.16 (0.37, 2.70) 179 0.33 #Apfelbaum M 27 0 0.00 0.34 0.00 (0.00,44.83) 27 0.00 ##Bliagos D 178 0 0.00 1.29 0.00 (0.00, 1.77) 170 0.00 #Brogno D 387 4 1.03 0.62 1.85 (0.50, 4.73) 384 1.32 Collins M 467 8 1.71 1.85 1.02 (0.44, 2.02) 425 0.86 ##Dominguez-Echeva 126 0 0.00 0.78 0.00 (0.00, 4.13) 126 0.00 Gray W 109 3 2.75 2.91 1.05 (0.21, 3.06) 77 1.51 ##Hassid B 35 0 0.00 1.95 0.00 (0.00, 5.95) 32 0.00 #Hjemdahl-Monsen C 293 2 0.68 1.14 0.67 (0.07, 2.40) 281 0.52 #Irobunda C 150 1 0.67 1.58 0.47 (0.01, 2.59) 128 0.00 ##Johnson M 32 0 0.00 0.74 0.00 (0.00,17.08) 32 0.00 ##Kalapatapu K 384 6 1.56 1.26 1.38 (0.50, 2.99) 362 0.44 ##Kesanakurthy S 6 0 0.00 0.39 0.00 (0.00,100.0) 6 0.00 Kirtane A 455 3 0.66 1.82 0.40 (0.08, 1.17) 392 0.21 #Kodali S 296 10 3.38 2.53 1.48 (0.71, 2.72) 260 1.22 #Kreps E 48 1 2.08 1.25 1.85 (0.02,10.31) 44 1.80 Leon M 132 1 0.76 0.63 1.34 (0.02, 7.45) 132 0.87 #Moses J 1107 5 0.45 0.50 1.00 (0.32, 2.34) 1104 0.66 ##Motivala A 6 0 0.00 1.41 0.00 (0.00,48.09) 6 0.00 Parikh M 810 2 0.25 0.72 0.38 (0.04, 1.37) 776 0.33 #Perry-Bottinger L 36 0 0.00 0.37 0.00 (0.00,30.44) 36 0.00 Pucillo A 216 0 0.00 0.79 0.00 (0.00, 2.38) 200 0.00 ##Puma A 81 0 0.00 0.42 0.00 (0.00,11.90) 81 0.00 Rabbani L 653 8 1.23 0.90 1.51 (0.65, 2.97) 597 0.93 #Rentrop K 72 0 0.00 0.23 0.00 (0.00,24.08) 72 0.00 #Sehhat K 60 0 0.00 0.37 0.00 (0.00,18.28) 60 0.00 ##Sherman W 112 2 1.79 1.91 1.03 (0.12, 3.73) 84 0.00 ##Shih A T 3 1 33.33 1.52 24.28 (0.32,100.0) 3 15.87 ##Singh V 224 0 0.00 0.53 0.00 (0.00, 3.42) 216 0.00 #Stathopoulos I 254 1 0.39 0.54 0.81 (0.01, 4.48) 252 0.50 Stone G 18 0 0.00 1.60 0.00 (0.00,14.12) 18 0.00 Weinberger J 51 0 0.00 0.50 0.00 (0.00,15.89) 49 0.00 Weisz G 199 2 1.01 1.64 0.68 (0.08, 2.45) 167 0.43 Williams M 131 2 1.53 1.69 1.00 (0.11, 3.61) 113 1.00 All Others 216 6 2.78 1.74 1.77 (0.65, 3.85) 188 1.54 TOTAL 7786 78 1.00 1.14 0.98 (0.77, 1.22) 7234 0.68
NYP Hospital - Weill Cornell ##Aboufares A 6 0 0.00 0.37 0.00 (0.00,100.0) 6 0.00 Bergman G 458 5 1.09 1.66 0.73 (0.23, 1.70) 404 0.19 ##Charney R 264 2 0.76 0.95 0.88 (0.10, 3.18) 261 0.58 Feldman D 453 1 0.22 1.38 0.18 ** (0.00, 0.98) 384 0.00 Gade C 39 0 0.00 0.50 0.00 (0.00,20.96) 39 0.00 ##Kesanakurthy S 202 6 2.97 0.73 4.49 * (1.64, 9.77) 201 3.31 * Kim L 359 6 1.67 1.85 1.00 (0.37, 2.18) 288 0.63 ##Messinger D 129 2 1.55 1.54 1.12 (0.13, 4.03) 125 0.72 Minutello R 495 8 1.62 1.69 1.06 (0.46, 2.08) 417 0.83 Sharma A 226 2 0.88 1.15 0.85 (0.10, 3.06) 208 0.47 Singh H 127 3 2.36 1.92 1.36 (0.27, 3.97) 93 1.20 #Slotwiner A 157 0 0.00 1.67 0.00 (0.00, 1.55) 132 0.00 ##Srivastava S 7 0 0.00 0.32 0.00 (0.00,100.0) 7 0.00 Swaminathan R 142 3 2.11 2.14 1.09 (0.22, 3.20) 113 0.44 Wilentz J 165 0 0.00 0.40 0.00 (0.00, 6.11) 164 0.00 Wong S 564 9 1.60 0.80 2.20 (1.00, 4.17) 537 1.58 Yang Y 126 0 0.00 0.30 0.00 (0.00,10.58) 126 0.00 All Others 19 0 0.00 0.40 0.00 (0.00,53.56) 19 0.00 TOTAL 3938 47 1.19 1.31 1.01 (0.74, 1.34) 3524 0.69
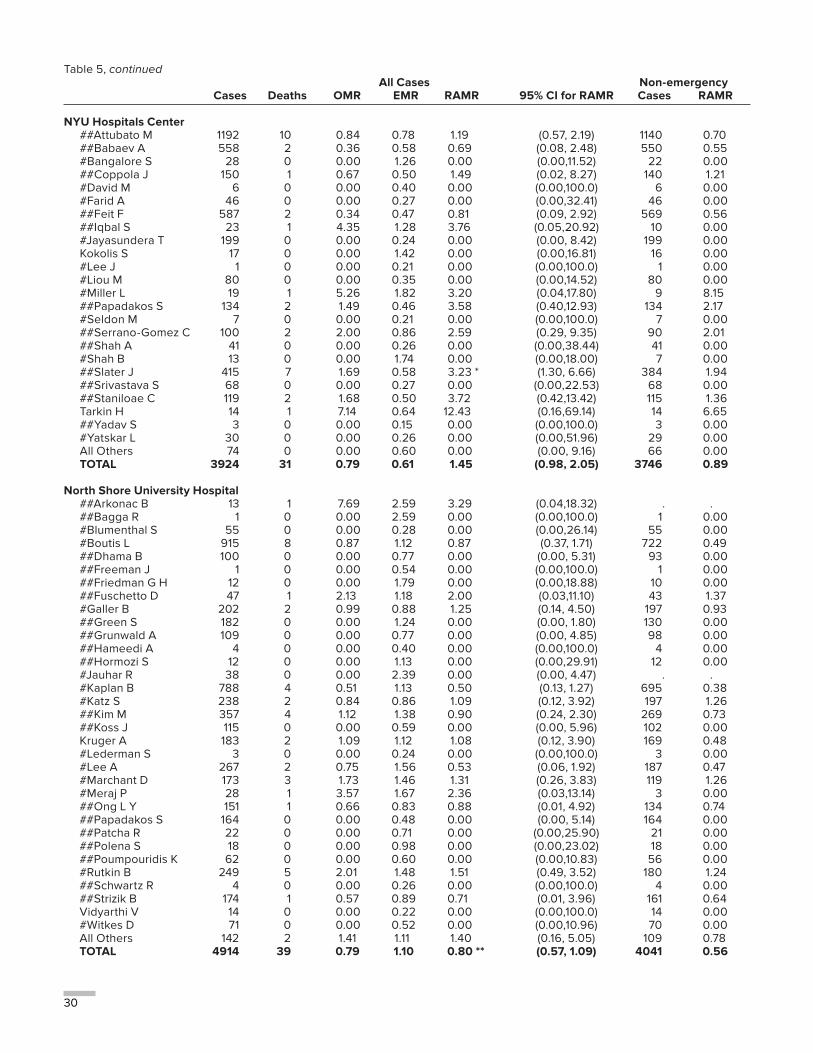
30
Table 5, continued All Cases Non-emergency Cases Deaths OMR EMR RAMR 95% CI for RAMR Cases RAMR
NYU Hospitals Center ##Attubato M 1192 10 0.84 0.78 1.19 (0.57, 2.19) 1140 0.70 ##Babaev A 558 2 0.36 0.58 0.69 (0.08, 2.48) 550 0.55 #Bangalore S 28 0 0.00 1.26 0.00 (0.00,11.52) 22 0.00 ##Coppola J 150 1 0.67 0.50 1.49 (0.02, 8.27) 140 1.21 #David M 6 0 0.00 0.40 0.00 (0.00,100.0) 6 0.00 #Farid A 46 0 0.00 0.27 0.00 (0.00,32.41) 46 0.00 ##Feit F 587 2 0.34 0.47 0.81 (0.09, 2.92) 569 0.56 ##Iqbal S 23 1 4.35 1.28 3.76 (0.05,20.92) 10 0.00 #Jayasundera T 199 0 0.00 0.24 0.00 (0.00, 8.42) 199 0.00 Kokolis S 17 0 0.00 1.42 0.00 (0.00,16.81) 16 0.00 #Lee J 1 0 0.00 0.21 0.00 (0.00,100.0) 1 0.00 #Liou M 80 0 0.00 0.35 0.00 (0.00,14.52) 80 0.00 #Miller L 19 1 5.26 1.82 3.20 (0.04,17.80) 9 8.15 ##Papadakos S 134 2 1.49 0.46 3.58 (0.40,12.93) 134 2.17 #Seldon M 7 0 0.00 0.21 0.00 (0.00,100.0) 7 0.00 ##Serrano-Gomez C 100 2 2.00 0.86 2.59 (0.29, 9.35) 90 2.01 ##Shah A 41 0 0.00 0.26 0.00 (0.00,38.44) 41 0.00 #Shah B 13 0 0.00 1.74 0.00 (0.00,18.00) 7 0.00 ##Slater J 415 7 1.69 0.58 3.23 * (1.30, 6.66) 384 1.94 ##Srivastava S 68 0 0.00 0.27 0.00 (0.00,22.53) 68 0.00 ##Staniloae C 119 2 1.68 0.50 3.72 (0.42,13.42) 115 1.36 Tarkin H 14 1 7.14 0.64 12.43 (0.16,69.14) 14 6.65 ##Yadav S 3 0 0.00 0.15 0.00 (0.00,100.0) 3 0.00 #Yatskar L 30 0 0.00 0.26 0.00 (0.00,51.96) 29 0.00 All Others 74 0 0.00 0.60 0.00 (0.00, 9.16) 66 0.00 TOTAL 3924 31 0.79 0.61 1.45 (0.98, 2.05) 3746 0.89
North Shore University Hospital ##Arkonac B 13 1 7.69 2.59 3.29 (0.04,18.32) . . ##Bagga R 1 0 0.00 2.59 0.00 (0.00,100.0) 1 0.00 #Blumenthal S 55 0 0.00 0.28 0.00 (0.00,26.14) 55 0.00 #Boutis L 915 8 0.87 1.12 0.87 (0.37, 1.71) 722 0.49 ##Dhama B 100 0 0.00 0.77 0.00 (0.00, 5.31) 93 0.00 ##Freeman J 1 0 0.00 0.54 0.00 (0.00,100.0) 1 0.00 ##Friedman G H 12 0 0.00 1.79 0.00 (0.00,18.88) 10 0.00 ##Fuschetto D 47 1 2.13 1.18 2.00 (0.03,11.10) 43 1.37 #Galler B 202 2 0.99 0.88 1.25 (0.14, 4.50) 197 0.93 ##Green S 182 0 0.00 1.24 0.00 (0.00, 1.80) 130 0.00 ##Grunwald A 109 0 0.00 0.77 0.00 (0.00, 4.85) 98 0.00 ##Hameedi A 4 0 0.00 0.40 0.00 (0.00,100.0) 4 0.00 ##Hormozi S 12 0 0.00 1.13 0.00 (0.00,29.91) 12 0.00 #Jauhar R 38 0 0.00 2.39 0.00 (0.00, 4.47) . . #Kaplan B 788 4 0.51 1.13 0.50 (0.13, 1.27) 695 0.38 #Katz S 238 2 0.84 0.86 1.09 (0.12, 3.92) 197 1.26 ##Kim M 357 4 1.12 1.38 0.90 (0.24, 2.30) 269 0.73 ##Koss J 115 0 0.00 0.59 0.00 (0.00, 5.96) 102 0.00 Kruger A 183 2 1.09 1.12 1.08 (0.12, 3.90) 169 0.48 #Lederman S 3 0 0.00 0.24 0.00 (0.00,100.0) 3 0.00 #Lee A 267 2 0.75 1.56 0.53 (0.06, 1.92) 187 0.47 #Marchant D 173 3 1.73 1.46 1.31 (0.26, 3.83) 119 1.26 #Meraj P 28 1 3.57 1.67 2.36 (0.03,13.14) 3 0.00 ##Ong L Y 151 1 0.66 0.83 0.88 (0.01, 4.92) 134 0.74 ##Papadakos S 164 0 0.00 0.48 0.00 (0.00, 5.14) 164 0.00 ##Patcha R 22 0 0.00 0.71 0.00 (0.00,25.90) 21 0.00 ##Polena S 18 0 0.00 0.98 0.00 (0.00,23.02) 18 0.00 ##Poumpouridis K 62 0 0.00 0.60 0.00 (0.00,10.83) 56 0.00 #Rutkin B 249 5 2.01 1.48 1.51 (0.49, 3.52) 180 1.24 ##Schwartz R 4 0 0.00 0.26 0.00 (0.00,100.0) 4 0.00 ##Strizik B 174 1 0.57 0.89 0.71 (0.01, 3.96) 161 0.64 Vidyarthi V 14 0 0.00 0.22 0.00 (0.00,100.0) 14 0.00 #Witkes D 71 0 0.00 0.52 0.00 (0.00,10.96) 70 0.00 All Others 142 2 1.41 1.11 1.40 (0.16, 5.05) 109 0.78 TOTAL 4914 39 0.79 1.10 0.80 ** (0.57, 1.09) 4041 0.56
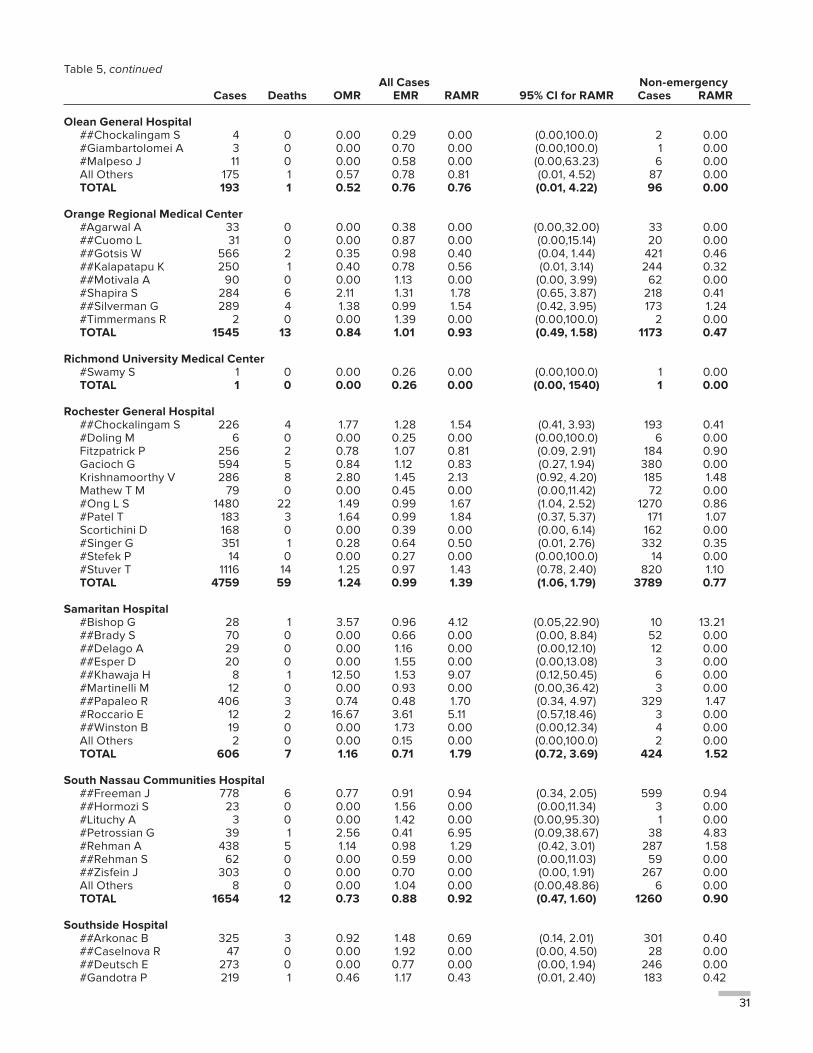
31
Table 5, continued All Cases Non-emergency Cases Deaths OMR EMR RAMR 95% CI for RAMR Cases RAMR
Olean General Hospital ##Chockalingam S 4 0 0.00 0.29 0.00 (0.00,100.0) 2 0.00 #Giambartolomei A 3 0 0.00 0.70 0.00 (0.00,100.0) 1 0.00 #Malpeso J 11 0 0.00 0.58 0.00 (0.00,63.23) 6 0.00 All Others 175 1 0.57 0.78 0.81 (0.01, 4.52) 87 0.00 TOTAL 193 1 0.52 0.76 0.76 (0.01, 4.22) 96 0.00
Orange Regional Medical Center #Agarwal A 33 0 0.00 0.38 0.00 (0.00,32.00) 33 0.00 ##Cuomo L 31 0 0.00 0.87 0.00 (0.00,15.14) 20 0.00 ##Gotsis W 566 2 0.35 0.98 0.40 (0.04, 1.44) 421 0.46 ##Kalapatapu K 250 1 0.40 0.78 0.56 (0.01, 3.14) 244 0.32 ##Motivala A 90 0 0.00 1.13 0.00 (0.00, 3.99) 62 0.00 #Shapira S 284 6 2.11 1.31 1.78 (0.65, 3.87) 218 0.41 ##Silverman G 289 4 1.38 0.99 1.54 (0.42, 3.95) 173 1.24 #Timmermans R 2 0 0.00 1.39 0.00 (0.00,100.0) 2 0.00 TOTAL 1545 13 0.84 1.01 0.93 (0.49, 1.58) 1173 0.47
Richmond University Medical Center #Swamy S 1 0 0.00 0.26 0.00 (0.00,100.0) 1 0.00 TOTAL 1 0 0.00 0.26 0.00 (0.00, 1540) 1 0.00
Rochester General Hospital ##Chockalingam S 226 4 1.77 1.28 1.54 (0.41, 3.93) 193 0.41 #Doling M 6 0 0.00 0.25 0.00 (0.00,100.0) 6 0.00 Fitzpatrick P 256 2 0.78 1.07 0.81 (0.09, 2.91) 184 0.90 Gacioch G 594 5 0.84 1.12 0.83 (0.27, 1.94) 380 0.00 Krishnamoorthy V 286 8 2.80 1.45 2.13 (0.92, 4.20) 185 1.48 Mathew T M 79 0 0.00 0.45 0.00 (0.00,11.42) 72 0.00 #Ong L S 1480 22 1.49 0.99 1.67 (1.04, 2.52) 1270 0.86 #Patel T 183 3 1.64 0.99 1.84 (0.37, 5.37) 171 1.07 Scortichini D 168 0 0.00 0.39 0.00 (0.00, 6.14) 162 0.00 #Singer G 351 1 0.28 0.64 0.50 (0.01, 2.76) 332 0.35 #Stefek P 14 0 0.00 0.27 0.00 (0.00,100.0) 14 0.00 #Stuver T 1116 14 1.25 0.97 1.43 (0.78, 2.40) 820 1.10 TOTAL 4759 59 1.24 0.99 1.39 (1.06, 1.79) 3789 0.77
Samaritan Hospital #Bishop G 28 1 3.57 0.96 4.12 (0.05,22.90) 10 13.21 ##Brady S 70 0 0.00 0.66 0.00 (0.00, 8.84) 52 0.00 ##Delago A 29 0 0.00 1.16 0.00 (0.00,12.10) 12 0.00 ##Esper D 20 0 0.00 1.55 0.00 (0.00,13.08) 3 0.00 ##Khawaja H 8 1 12.50 1.53 9.07 (0.12,50.45) 6 0.00 #Martinelli M 12 0 0.00 0.93 0.00 (0.00,36.42) 3 0.00 ##Papaleo R 406 3 0.74 0.48 1.70 (0.34, 4.97) 329 1.47 #Roccario E 12 2 16.67 3.61 5.11 (0.57,18.46) 3 0.00 ##Winston B 19 0 0.00 1.73 0.00 (0.00,12.34) 4 0.00 All Others 2 0 0.00 0.15 0.00 (0.00,100.0) 2 0.00 TOTAL 606 7 1.16 0.71 1.79 (0.72, 3.69) 424 1.52
South Nassau Communities Hospital ##Freeman J 778 6 0.77 0.91 0.94 (0.34, 2.05) 599 0.94 ##Hormozi S 23 0 0.00 1.56 0.00 (0.00,11.34) 3 0.00 #Lituchy A 3 0 0.00 1.42 0.00 (0.00,95.30) 1 0.00 #Petrossian G 39 1 2.56 0.41 6.95 (0.09,38.67) 38 4.83 #Rehman A 438 5 1.14 0.98 1.29 (0.42, 3.01) 287 1.58 ##Rehman S 62 0 0.00 0.59 0.00 (0.00,11.03) 59 0.00 ##Zisfein J 303 0 0.00 0.70 0.00 (0.00, 1.91) 267 0.00 All Others 8 0 0.00 1.04 0.00 (0.00,48.86) 6 0.00 TOTAL 1654 12 0.73 0.88 0.92 (0.47, 1.60) 1260 0.90
Southside Hospital ##Arkonac B 325 3 0.92 1.48 0.69 (0.14, 2.01) 301 0.40 ##Caselnova R 47 0 0.00 1.92 0.00 (0.00, 4.50) 28 0.00 ##Deutsch E 273 0 0.00 0.77 0.00 (0.00, 1.94) 246 0.00 #Gandotra P 219 1 0.46 1.17 0.43 (0.01, 2.40) 183 0.42
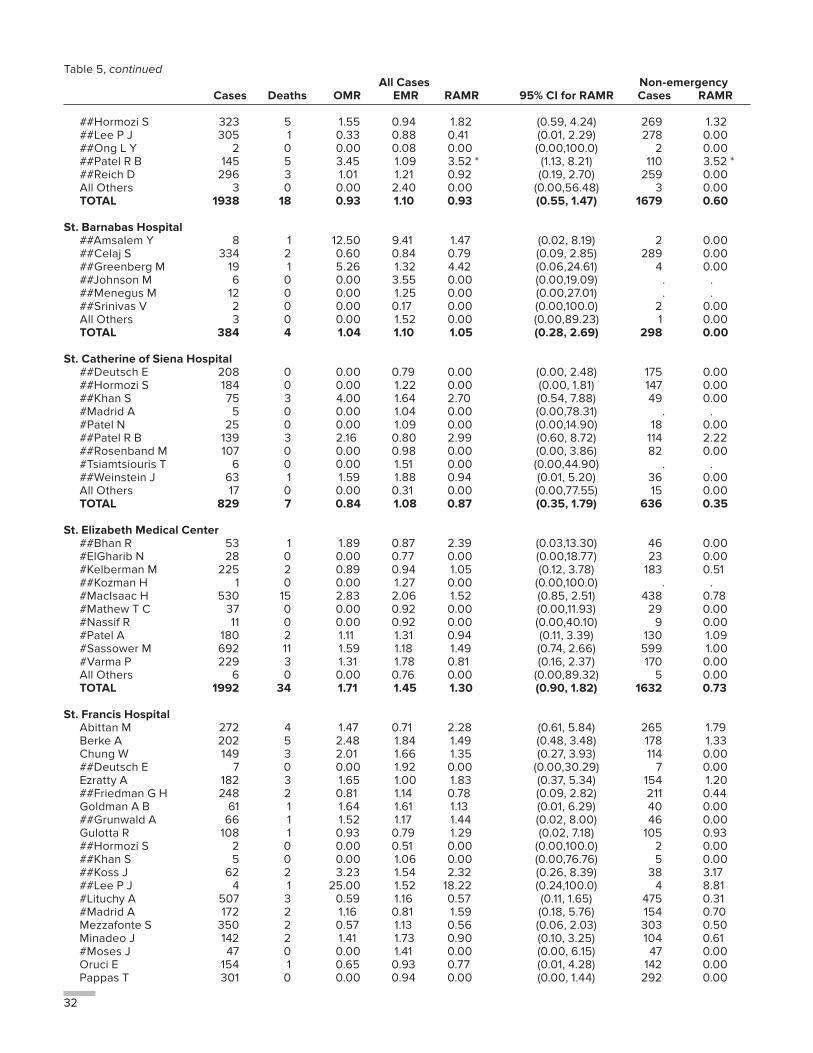
32
Table 5, continued All Cases Non-emergency Cases Deaths OMR EMR RAMR 95% CI for RAMR Cases RAMR
##Hormozi S 323 5 1.55 0.94 1.82 (0.59, 4.24) 269 1.32 ##Lee P J 305 1 0.33 0.88 0.41 (0.01, 2.29) 278 0.00 ##Ong L Y 2 0 0.00 0.08 0.00 (0.00,100.0) 2 0.00 ##Patel R B 145 5 3.45 1.09 3.52 * (1.13, 8.21) 110 3.52 * ##Reich D 296 3 1.01 1.21 0.92 (0.19, 2.70) 259 0.00 All Others 3 0 0.00 2.40 0.00 (0.00,56.48) 3 0.00 TOTAL 1938 18 0.93 1.10 0.93 (0.55, 1.47) 1679 0.60
St. Barnabas Hospital ##Amsalem Y 8 1 12.50 9.41 1.47 (0.02, 8.19) 2 0.00 ##Celaj S 334 2 0.60 0.84 0.79 (0.09, 2.85) 289 0.00 ##Greenberg M 19 1 5.26 1.32 4.42 (0.06,24.61) 4 0.00 ##Johnson M 6 0 0.00 3.55 0.00 (0.00,19.09) . . ##Menegus M 12 0 0.00 1.25 0.00 (0.00,27.01) . . ##Srinivas V 2 0 0.00 0.17 0.00 (0.00,100.0) 2 0.00 All Others 3 0 0.00 1.52 0.00 (0.00,89.23) 1 0.00 TOTAL 384 4 1.04 1.10 1.05 (0.28, 2.69) 298 0.00
St. Catherine of Siena Hospital ##Deutsch E 208 0 0.00 0.79 0.00 (0.00, 2.48) 175 0.00 ##Hormozi S 184 0 0.00 1.22 0.00 (0.00, 1.81) 147 0.00 ##Khan S 75 3 4.00 1.64 2.70 (0.54, 7.88) 49 0.00 #Madrid A 5 0 0.00 1.04 0.00 (0.00,78.31) . . #Patel N 25 0 0.00 1.09 0.00 (0.00,14.90) 18 0.00 ##Patel R B 139 3 2.16 0.80 2.99 (0.60, 8.72) 114 2.22 ##Rosenband M 107 0 0.00 0.98 0.00 (0.00, 3.86) 82 0.00 #Tsiamtsiouris T 6 0 0.00 1.51 0.00 (0.00,44.90) . . ##Weinstein J 63 1 1.59 1.88 0.94 (0.01, 5.20) 36 0.00 All Others 17 0 0.00 0.31 0.00 (0.00,77.55) 15 0.00 TOTAL 829 7 0.84 1.08 0.87 (0.35, 1.79) 636 0.35
St. Elizabeth Medical Center ##Bhan R 53 1 1.89 0.87 2.39 (0.03,13.30) 46 0.00 #ElGharib N 28 0 0.00 0.77 0.00 (0.00,18.77) 23 0.00 #Kelberman M 225 2 0.89 0.94 1.05 (0.12, 3.78) 183 0.51 ##Kozman H 1 0 0.00 1.27 0.00 (0.00,100.0) . . #MacIsaac H 530 15 2.83 2.06 1.52 (0.85, 2.51) 438 0.78 #Mathew T C 37 0 0.00 0.92 0.00 (0.00,11.93) 29 0.00 #Nassif R 11 0 0.00 0.92 0.00 (0.00,40.10) 9 0.00 #Patel A 180 2 1.11 1.31 0.94 (0.11, 3.39) 130 1.09 #Sassower M 692 11 1.59 1.18 1.49 (0.74, 2.66) 599 1.00 #Varma P 229 3 1.31 1.78 0.81 (0.16, 2.37) 170 0.00 All Others 6 0 0.00 0.76 0.00 (0.00,89.32) 5 0.00 TOTAL 1992 34 1.71 1.45 1.30 (0.90, 1.82) 1632 0.73
St. Francis Hospital Abittan M 272 4 1.47 0.71 2.28 (0.61, 5.84) 265 1.79 Berke A 202 5 2.48 1.84 1.49 (0.48, 3.48) 178 1.33 Chung W 149 3 2.01 1.66 1.35 (0.27, 3.93) 114 0.00 ##Deutsch E 7 0 0.00 1.92 0.00 (0.00,30.29) 7 0.00 Ezratty A 182 3 1.65 1.00 1.83 (0.37, 5.34) 154 1.20 ##Friedman G H 248 2 0.81 1.14 0.78 (0.09, 2.82) 211 0.44 Goldman A B 61 1 1.64 1.61 1.13 (0.01, 6.29) 40 0.00 ##Grunwald A 66 1 1.52 1.17 1.44 (0.02, 8.00) 46 0.00 Gulotta R 108 1 0.93 0.79 1.29 (0.02, 7.18) 105 0.93 ##Hormozi S 2 0 0.00 0.51 0.00 (0.00,100.0) 2 0.00 ##Khan S 5 0 0.00 1.06 0.00 (0.00,76.76) 5 0.00 ##Koss J 62 2 3.23 1.54 2.32 (0.26, 8.39) 38 3.17 ##Lee P J 4 1 25.00 1.52 18.22 (0.24,100.0) 4 8.81 #Lituchy A 507 3 0.59 1.16 0.57 (0.11, 1.65) 475 0.31 #Madrid A 172 2 1.16 0.81 1.59 (0.18, 5.76) 154 0.70 Mezzafonte S 350 2 0.57 1.13 0.56 (0.06, 2.03) 303 0.50 Minadeo J 142 2 1.41 1.73 0.90 (0.10, 3.25) 104 0.61 #Moses J 47 0 0.00 1.41 0.00 (0.00, 6.15) 47 0.00 Oruci E 154 1 0.65 0.93 0.77 (0.01, 4.28) 142 0.00 Pappas T 301 0 0.00 0.94 0.00 (0.00, 1.44) 292 0.00
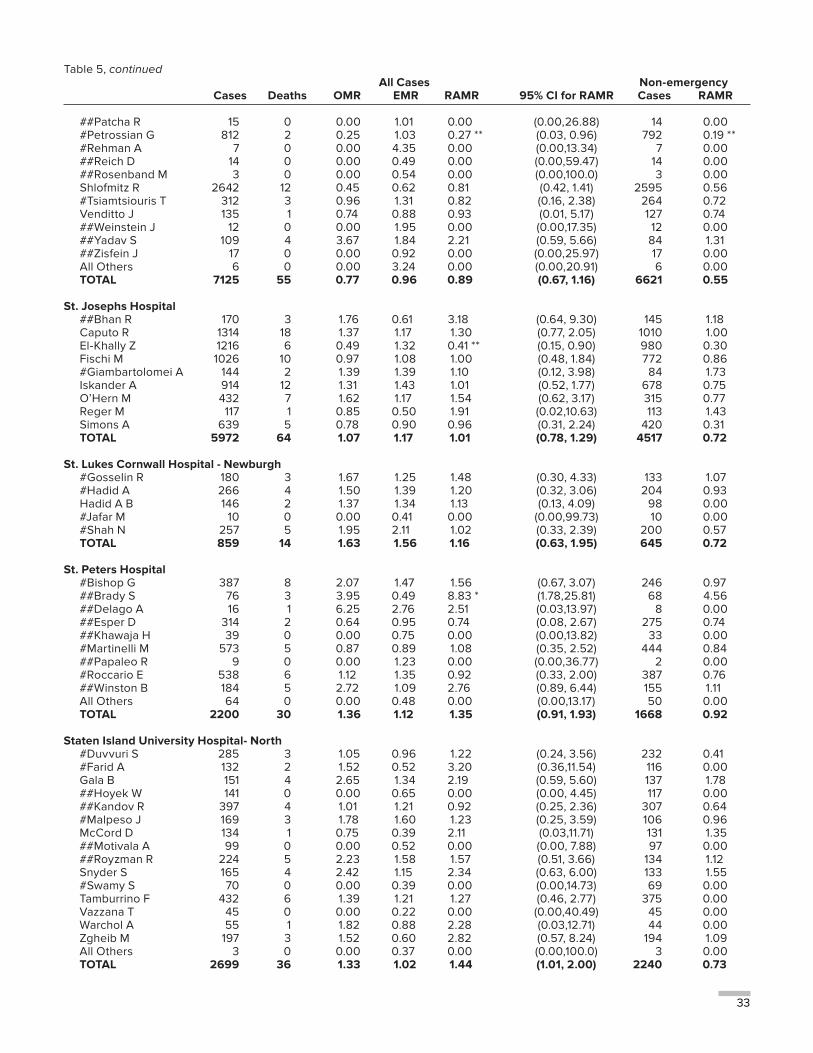
33
Table 5, continued All Cases Non-emergency Cases Deaths OMR EMR RAMR 95% CI for RAMR Cases RAMR
##Patcha R 15 0 0.00 1.01 0.00 (0.00,26.88) 14 0.00 #Petrossian G 812 2 0.25 1.03 0.27 ** (0.03, 0.96) 792 0.19 ** #Rehman A 7 0 0.00 4.35 0.00 (0.00,13.34) 7 0.00 ##Reich D 14 0 0.00 0.49 0.00 (0.00,59.47) 14 0.00 ##Rosenband M 3 0 0.00 0.54 0.00 (0.00,100.0) 3 0.00 Shlofmitz R 2642 12 0.45 0.62 0.81 (0.42, 1.41) 2595 0.56 #Tsiamtsiouris T 312 3 0.96 1.31 0.82 (0.16, 2.38) 264 0.72 Venditto J 135 1 0.74 0.88 0.93 (0.01, 5.17) 127 0.74 ##Weinstein J 12 0 0.00 1.95 0.00 (0.00,17.35) 12 0.00 ##Yadav S 109 4 3.67 1.84 2.21 (0.59, 5.66) 84 1.31 ##Zisfein J 17 0 0.00 0.92 0.00 (0.00,25.97) 17 0.00 All Others 6 0 0.00 3.24 0.00 (0.00,20.91) 6 0.00 TOTAL 7125 55 0.77 0.96 0.89 (0.67, 1.16) 6621 0.55
St. Josephs Hospital ##Bhan R 170 3 1.76 0.61 3.18 (0.64, 9.30) 145 1.18 Caputo R 1314 18 1.37 1.17 1.30 (0.77, 2.05) 1010 1.00 El-Khally Z 1216 6 0.49 1.32 0.41 ** (0.15, 0.90) 980 0.30 Fischi M 1026 10 0.97 1.08 1.00 (0.48, 1.84) 772 0.86 #Giambartolomei A 144 2 1.39 1.39 1.10 (0.12, 3.98) 84 1.73 Iskander A 914 12 1.31 1.43 1.01 (0.52, 1.77) 678 0.75 O’Hern M 432 7 1.62 1.17 1.54 (0.62, 3.17) 315 0.77 Reger M 117 1 0.85 0.50 1.91 (0.02,10.63) 113 1.43 Simons A 639 5 0.78 0.90 0.96 (0.31, 2.24) 420 0.31 TOTAL 5972 64 1.07 1.17 1.01 (0.78, 1.29) 4517 0.72
St. Lukes Cornwall Hospital - Newburgh #Gosselin R 180 3 1.67 1.25 1.48 (0.30, 4.33) 133 1.07 #Hadid A 266 4 1.50 1.39 1.20 (0.32, 3.06) 204 0.93 Hadid A B 146 2 1.37 1.34 1.13 (0.13, 4.09) 98 0.00 #Jafar M 10 0 0.00 0.41 0.00 (0.00,99.73) 10 0.00 #Shah N 257 5 1.95 2.11 1.02 (0.33, 2.39) 200 0.57 TOTAL 859 14 1.63 1.56 1.16 (0.63, 1.95) 645 0.72
St. Peters Hospital #Bishop G 387 8 2.07 1.47 1.56 (0.67, 3.07) 246 0.97 ##Brady S 76 3 3.95 0.49 8.83 * (1.78,25.81) 68 4.56 ##Delago A 16 1 6.25 2.76 2.51 (0.03,13.97) 8 0.00 ##Esper D 314 2 0.64 0.95 0.74 (0.08, 2.67) 275 0.74 ##Khawaja H 39 0 0.00 0.75 0.00 (0.00,13.82) 33 0.00 #Martinelli M 573 5 0.87 0.89 1.08 (0.35, 2.52) 444 0.84 ##Papaleo R 9 0 0.00 1.23 0.00 (0.00,36.77) 2 0.00 #Roccario E 538 6 1.12 1.35 0.92 (0.33, 2.00) 387 0.76 ##Winston B 184 5 2.72 1.09 2.76 (0.89, 6.44) 155 1.11 All Others 64 0 0.00 0.48 0.00 (0.00,13.17) 50 0.00 TOTAL 2200 30 1.36 1.12 1.35 (0.91, 1.93) 1668 0.92
Staten Island University Hospital- North #Duvvuri S 285 3 1.05 0.96 1.22 (0.24, 3.56) 232 0.41 #Farid A 132 2 1.52 0.52 3.20 (0.36,11.54) 116 0.00 Gala B 151 4 2.65 1.34 2.19 (0.59, 5.60) 137 1.78 ##Hoyek W 141 0 0.00 0.65 0.00 (0.00, 4.45) 117 0.00 ##Kandov R 397 4 1.01 1.21 0.92 (0.25, 2.36) 307 0.64 #Malpeso J 169 3 1.78 1.60 1.23 (0.25, 3.59) 106 0.96 McCord D 134 1 0.75 0.39 2.11 (0.03,11.71) 131 1.35 ##Motivala A 99 0 0.00 0.52 0.00 (0.00, 7.88) 97 0.00 ##Royzman R 224 5 2.23 1.58 1.57 (0.51, 3.66) 134 1.12 Snyder S 165 4 2.42 1.15 2.34 (0.63, 6.00) 133 1.55 #Swamy S 70 0 0.00 0.39 0.00 (0.00,14.73) 69 0.00 Tamburrino F 432 6 1.39 1.21 1.27 (0.46, 2.77) 375 0.00 Vazzana T 45 0 0.00 0.22 0.00 (0.00,40.49) 45 0.00 Warchol A 55 1 1.82 0.88 2.28 (0.03,12.71) 44 0.00 Zgheib M 197 3 1.52 0.60 2.82 (0.57, 8.24) 194 1.09 All Others 3 0 0.00 0.37 0.00 (0.00,100.0) 3 0.00 TOTAL 2699 36 1.33 1.02 1.44 (1.01, 2.00) 2240 0.73
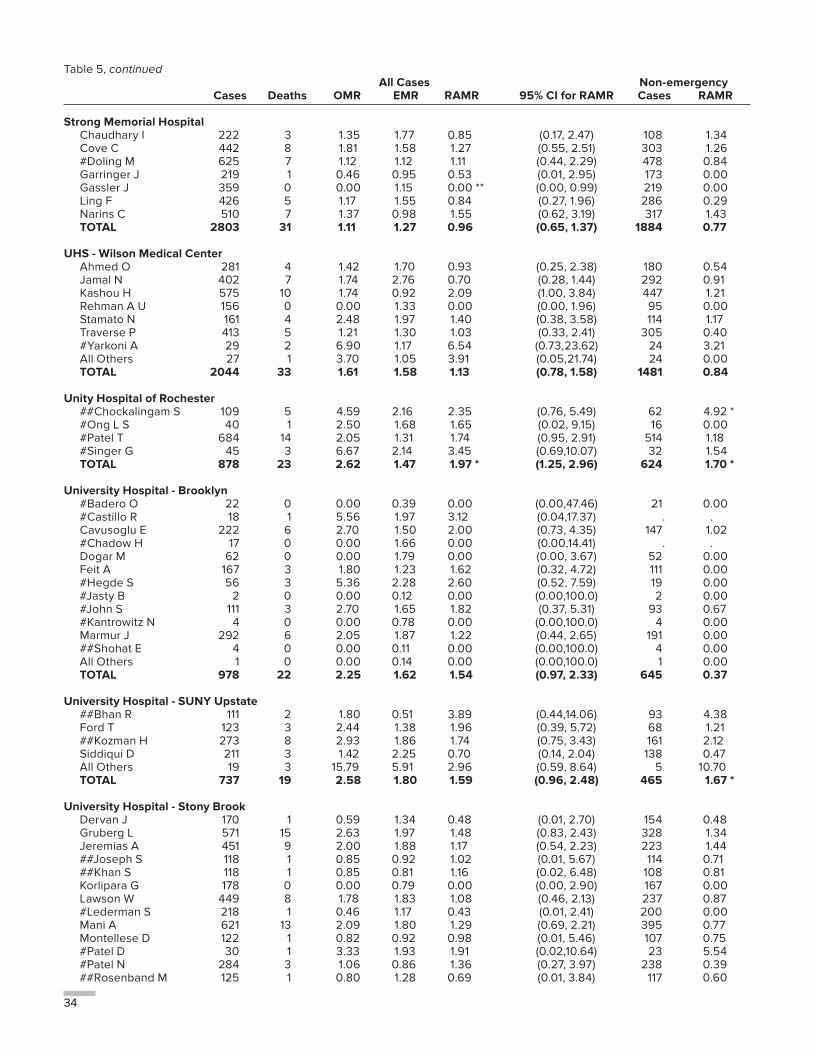
34
Table 5, continued All Cases Non-emergency Cases Deaths OMR EMR RAMR 95% CI for RAMR Cases RAMR
Strong Memorial Hospital Chaudhary I 222 3 1.35 1.77 0.85 (0.17, 2.47) 108 1.34 Cove C 442 8 1.81 1.58 1.27 (0.55, 2.51) 303 1.26 #Doling M 625 7 1.12 1.12 1.11 (0.44, 2.29) 478 0.84 Garringer J 219 1 0.46 0.95 0.53 (0.01, 2.95) 173 0.00 Gassler J 359 0 0.00 1.15 0.00 ** (0.00, 0.99) 219 0.00 Ling F 426 5 1.17 1.55 0.84 (0.27, 1.96) 286 0.29 Narins C 510 7 1.37 0.98 1.55 (0.62, 3.19) 317 1.43 TOTAL 2803 31 1.11 1.27 0.96 (0.65, 1.37) 1884 0.77
UHS - Wilson Medical Center Ahmed O 281 4 1.42 1.70 0.93 (0.25, 2.38) 180 0.54 Jamal N 402 7 1.74 2.76 0.70 (0.28, 1.44) 292 0.91 Kashou H 575 10 1.74 0.92 2.09 (1.00, 3.84) 447 1.21 Rehman A U 156 0 0.00 1.33 0.00 (0.00, 1.96) 95 0.00 Stamato N 161 4 2.48 1.97 1.40 (0.38, 3.58) 114 1.17 Traverse P 413 5 1.21 1.30 1.03 (0.33, 2.41) 305 0.40 #Yarkoni A 29 2 6.90 1.17 6.54 (0.73,23.62) 24 3.21 All Others 27 1 3.70 1.05 3.91 (0.05,21.74) 24 0.00 TOTAL 2044 33 1.61 1.58 1.13 (0.78, 1.58) 1481 0.84
Unity Hospital of Rochester ##Chockalingam S 109 5 4.59 2.16 2.35 (0.76, 5.49) 62 4.92 * #Ong L S 40 1 2.50 1.68 1.65 (0.02, 9.15) 16 0.00 #Patel T 684 14 2.05 1.31 1.74 (0.95, 2.91) 514 1.18 #Singer G 45 3 6.67 2.14 3.45 (0.69,10.07) 32 1.54 TOTAL 878 23 2.62 1.47 1.97 * (1.25, 2.96) 624 1.70 *
University Hospital - Brooklyn #Badero O 22 0 0.00 0.39 0.00 (0.00,47.46) 21 0.00 #Castillo R 18 1 5.56 1.97 3.12 (0.04,17.37) . . Cavusoglu E 222 6 2.70 1.50 2.00 (0.73, 4.35) 147 1.02 #Chadow H 17 0 0.00 1.66 0.00 (0.00,14.41) . . Dogar M 62 0 0.00 1.79 0.00 (0.00, 3.67) 52 0.00 Feit A 167 3 1.80 1.23 1.62 (0.32, 4.72) 111 0.00 #Hegde S 56 3 5.36 2.28 2.60 (0.52, 7.59) 19 0.00 #Jasty B 2 0 0.00 0.12 0.00 (0.00,100.0) 2 0.00 #John S 111 3 2.70 1.65 1.82 (0.37, 5.31) 93 0.67 #Kantrowitz N 4 0 0.00 0.78 0.00 (0.00,100.0) 4 0.00 Marmur J 292 6 2.05 1.87 1.22 (0.44, 2.65) 191 0.00 ##Shohat E 4 0 0.00 0.11 0.00 (0.00,100.0) 4 0.00 All Others 1 0 0.00 0.14 0.00 (0.00,100.0) 1 0.00 TOTAL 978 22 2.25 1.62 1.54 (0.97, 2.33) 645 0.37
University Hospital - SUNY Upstate ##Bhan R 111 2 1.80 0.51 3.89 (0.44,14.06) 93 4.38 Ford T 123 3 2.44 1.38 1.96 (0.39, 5.72) 68 1.21 ##Kozman H 273 8 2.93 1.86 1.74 (0.75, 3.43) 161 2.12 Siddiqui D 211 3 1.42 2.25 0.70 (0.14, 2.04) 138 0.47 All Others 19 3 15.79 5.91 2.96 (0.59, 8.64) 5 10.70 TOTAL 737 19 2.58 1.80 1.59 (0.96, 2.48) 465 1.67 *
University Hospital - Stony Brook Dervan J 170 1 0.59 1.34 0.48 (0.01, 2.70) 154 0.48 Gruberg L 571 15 2.63 1.97 1.48 (0.83, 2.43) 328 1.34 Jeremias A 451 9 2.00 1.88 1.17 (0.54, 2.23) 223 1.44 ##Joseph S 118 1 0.85 0.92 1.02 (0.01, 5.67) 114 0.71 ##Khan S 118 1 0.85 0.81 1.16 (0.02, 6.48) 108 0.81 Korlipara G 178 0 0.00 0.79 0.00 (0.00, 2.90) 167 0.00 Lawson W 449 8 1.78 1.83 1.08 (0.46, 2.13) 237 0.87 #Lederman S 218 1 0.46 1.17 0.43 (0.01, 2.41) 200 0.00 Mani A 621 13 2.09 1.80 1.29 (0.69, 2.21) 395 0.77 Montellese D 122 1 0.82 0.92 0.98 (0.01, 5.46) 107 0.75 #Patel D 30 1 3.33 1.93 1.91 (0.02,10.64) 23 5.54 #Patel N 284 3 1.06 0.86 1.36 (0.27, 3.97) 238 0.39 ##Rosenband M 125 1 0.80 1.28 0.69 (0.01, 3.84) 117 0.60
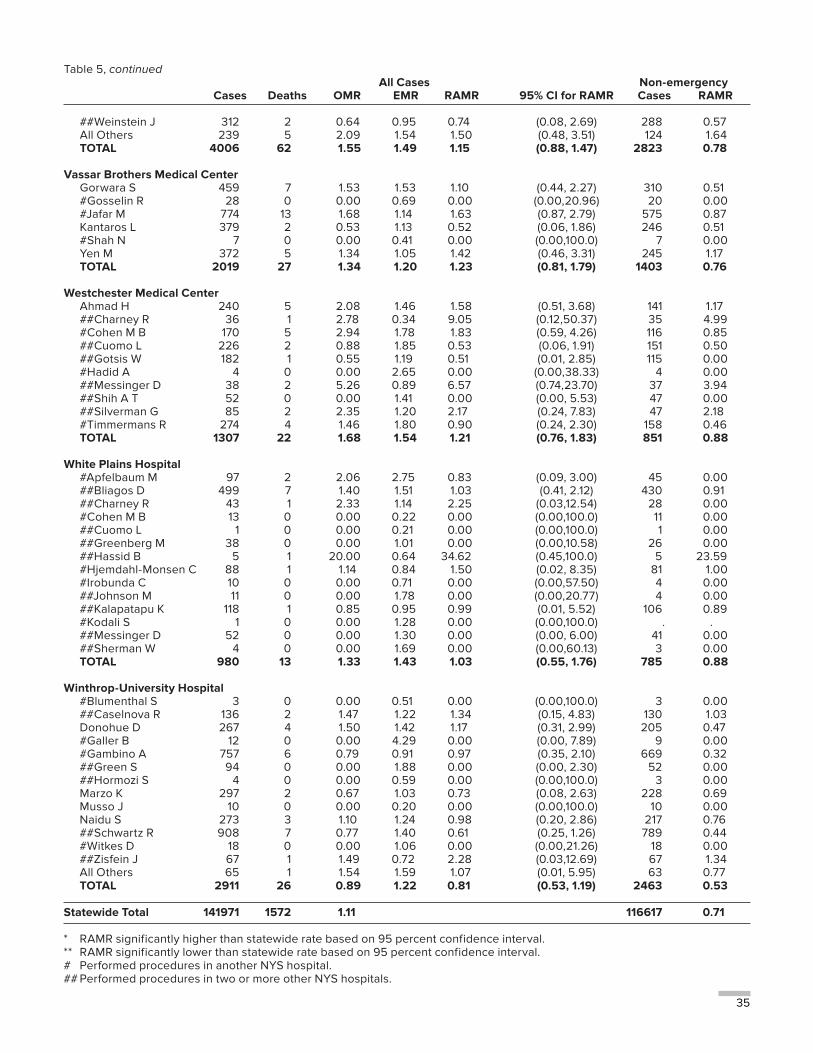
35
Table 5, continued All Cases Non-emergency Cases Deaths OMR EMR RAMR 95% CI for RAMR Cases RAMR
##Weinstein J 312 2 0.64 0.95 0.74 (0.08, 2.69) 288 0.57 All Others 239 5 2.09 1.54 1.50 (0.48, 3.51) 124 1.64 TOTAL 4006 62 1.55 1.49 1.15 (0.88, 1.47) 2823 0.78
Vassar Brothers Medical Center Gorwara S 459 7 1.53 1.53 1.10 (0.44, 2.27) 310 0.51 #Gosselin R 28 0 0.00 0.69 0.00 (0.00,20.96) 20 0.00 #Jafar M 774 13 1.68 1.14 1.63 (0.87, 2.79) 575 0.87 Kantaros L 379 2 0.53 1.13 0.52 (0.06, 1.86) 246 0.51 #Shah N 7 0 0.00 0.41 0.00 (0.00,100.0) 7 0.00 Yen M 372 5 1.34 1.05 1.42 (0.46, 3.31) 245 1.17 TOTAL 2019 27 1.34 1.20 1.23 (0.81, 1.79) 1403 0.76
Westchester Medical Center Ahmad H 240 5 2.08 1.46 1.58 (0.51, 3.68) 141 1.17 ##Charney R 36 1 2.78 0.34 9.05 (0.12,50.37) 35 4.99 #Cohen M B 170 5 2.94 1.78 1.83 (0.59, 4.26) 116 0.85 ##Cuomo L 226 2 0.88 1.85 0.53 (0.06, 1.91) 151 0.50 ##Gotsis W 182 1 0.55 1.19 0.51 (0.01, 2.85) 115 0.00 #Hadid A 4 0 0.00 2.65 0.00 (0.00,38.33) 4 0.00 ##Messinger D 38 2 5.26 0.89 6.57 (0.74,23.70) 37 3.94 ##Shih A T 52 0 0.00 1.41 0.00 (0.00, 5.53) 47 0.00 ##Silverman G 85 2 2.35 1.20 2.17 (0.24, 7.83) 47 2.18 #Timmermans R 274 4 1.46 1.80 0.90 (0.24, 2.30) 158 0.46 TOTAL 1307 22 1.68 1.54 1.21 (0.76, 1.83) 851 0.88
White Plains Hospital #Apfelbaum M 97 2 2.06 2.75 0.83 (0.09, 3.00) 45 0.00 ##Bliagos D 499 7 1.40 1.51 1.03 (0.41, 2.12) 430 0.91 ##Charney R 43 1 2.33 1.14 2.25 (0.03,12.54) 28 0.00 #Cohen M B 13 0 0.00 0.22 0.00 (0.00,100.0) 11 0.00 ##Cuomo L 1 0 0.00 0.21 0.00 (0.00,100.0) 1 0.00 ##Greenberg M 38 0 0.00 1.01 0.00 (0.00,10.58) 26 0.00 ##Hassid B 5 1 20.00 0.64 34.62 (0.45,100.0) 5 23.59 #Hjemdahl-Monsen C 88 1 1.14 0.84 1.50 (0.02, 8.35) 81 1.00 #Irobunda C 10 0 0.00 0.71 0.00 (0.00,57.50) 4 0.00 ##Johnson M 11 0 0.00 1.78 0.00 (0.00,20.77) 4 0.00 ##Kalapatapu K 118 1 0.85 0.95 0.99 (0.01, 5.52) 106 0.89 #Kodali S 1 0 0.00 1.28 0.00 (0.00,100.0) . . ##Messinger D 52 0 0.00 1.30 0.00 (0.00, 6.00) 41 0.00 ##Sherman W 4 0 0.00 1.69 0.00 (0.00,60.13) 3 0.00 TOTAL 980 13 1.33 1.43 1.03 (0.55, 1.76) 785 0.88
Winthrop-University Hospital #Blumenthal S 3 0 0.00 0.51 0.00 (0.00,100.0) 3 0.00 ##Caselnova R 136 2 1.47 1.22 1.34 (0.15, 4.83) 130 1.03 Donohue D 267 4 1.50 1.42 1.17 (0.31, 2.99) 205 0.47 #Galler B 12 0 0.00 4.29 0.00 (0.00, 7.89) 9 0.00 #Gambino A 757 6 0.79 0.91 0.97 (0.35, 2.10) 669 0.32 ##Green S 94 0 0.00 1.88 0.00 (0.00, 2.30) 52 0.00 ##Hormozi S 4 0 0.00 0.59 0.00 (0.00,100.0) 3 0.00 Marzo K 297 2 0.67 1.03 0.73 (0.08, 2.63) 228 0.69 Musso J 10 0 0.00 0.20 0.00 (0.00,100.0) 10 0.00 Naidu S 273 3 1.10 1.24 0.98 (0.20, 2.86) 217 0.76 ##Schwartz R 908 7 0.77 1.40 0.61 (0.25, 1.26) 789 0.44 #Witkes D 18 0 0.00 1.06 0.00 (0.00,21.26) 18 0.00 ##Zisfein J 67 1 1.49 0.72 2.28 (0.03,12.69) 67 1.34 All Others 65 1 1.54 1.59 1.07 (0.01, 5.95) 63 0.77 TOTAL 2911 26 0.89 1.22 0.81 (0.53, 1.19) 2463 0.53
Statewide Total 141971 1572 1.11 116617 0.71
* RAMR significantly higher than statewide rate based on 95 percent confidence interval.** RAMR significantly lower than statewide rate based on 95 percent confidence interval.# Performed procedures in another NYS hospital.## Performed procedures in two or more other NYS hospitals.
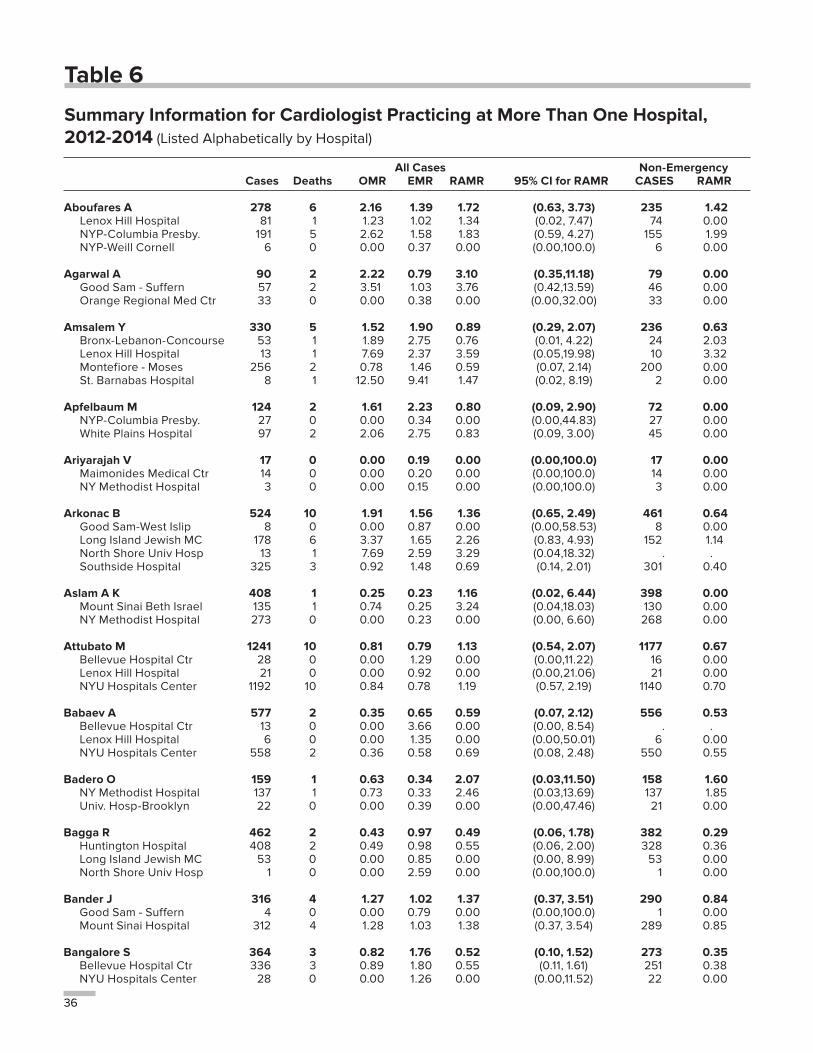
36
Table 6
Summary Information for Cardiologist Practicing at More Than One Hospital, 2012-2014 (Listed Alphabetically by Hospital)
All Cases Non-Emergency Cases Deaths OMR EMR RAMR 95% CI for RAMR CASES RAMR
Aboufares A 278 6 2.16 1.39 1.72 (0.63, 3.73) 235 1.42 Lenox Hill Hospital 81 1 1.23 1.02 1.34 (0.02, 7.47) 74 0.00 NYP-Columbia Presby. 191 5 2.62 1.58 1.83 (0.59, 4.27) 155 1.99 NYP-Weill Cornell 6 0 0.00 0.37 0.00 (0.00,100.0) 6 0.00
Agarwal A 90 2 2.22 0.79 3.10 (0.35,11.18) 79 0.00 Good Sam - Suffern 57 2 3.51 1.03 3.76 (0.42,13.59) 46 0.00 Orange Regional Med Ctr 33 0 0.00 0.38 0.00 (0.00,32.00) 33 0.00
Amsalem Y 330 5 1.52 1.90 0.89 (0.29, 2.07) 236 0.63 Bronx-Lebanon-Concourse 53 1 1.89 2.75 0.76 (0.01, 4.22) 24 2.03 Lenox Hill Hospital 13 1 7.69 2.37 3.59 (0.05,19.98) 10 3.32 Montefiore - Moses 256 2 0.78 1.46 0.59 (0.07, 2.14) 200 0.00 St. Barnabas Hospital 8 1 12.50 9.41 1.47 (0.02, 8.19) 2 0.00
Apfelbaum M 124 2 1.61 2.23 0.80 (0.09, 2.90) 72 0.00 NYP-Columbia Presby. 27 0 0.00 0.34 0.00 (0.00,44.83) 27 0.00 White Plains Hospital 97 2 2.06 2.75 0.83 (0.09, 3.00) 45 0.00
Ariyarajah V 17 0 0.00 0.19 0.00 (0.00,100.0) 17 0.00 Maimonides Medical Ctr 14 0 0.00 0.20 0.00 (0.00,100.0) 14 0.00 NY Methodist Hospital 3 0 0.00 0.15 0.00 (0.00,100.0) 3 0.00
Arkonac B 524 10 1.91 1.56 1.36 (0.65, 2.49) 461 0.64 Good Sam-West Islip 8 0 0.00 0.87 0.00 (0.00,58.53) 8 0.00 Long Island Jewish MC 178 6 3.37 1.65 2.26 (0.83, 4.93) 152 1.14 North Shore Univ Hosp 13 1 7.69 2.59 3.29 (0.04,18.32) . . Southside Hospital 325 3 0.92 1.48 0.69 (0.14, 2.01) 301 0.40
Aslam A K 408 1 0.25 0.23 1.16 (0.02, 6.44) 398 0.00 Mount Sinai Beth Israel 135 1 0.74 0.25 3.24 (0.04,18.03) 130 0.00 NY Methodist Hospital 273 0 0.00 0.23 0.00 (0.00, 6.60) 268 0.00
Attubato M 1241 10 0.81 0.79 1.13 (0.54, 2.07) 1177 0.67 Bellevue Hospital Ctr 28 0 0.00 1.29 0.00 (0.00,11.22) 16 0.00 Lenox Hill Hospital 21 0 0.00 0.92 0.00 (0.00,21.06) 21 0.00 NYU Hospitals Center 1192 10 0.84 0.78 1.19 (0.57, 2.19) 1140 0.70
Babaev A 577 2 0.35 0.65 0.59 (0.07, 2.12) 556 0.53 Bellevue Hospital Ctr 13 0 0.00 3.66 0.00 (0.00, 8.54) . . Lenox Hill Hospital 6 0 0.00 1.35 0.00 (0.00,50.01) 6 0.00 NYU Hospitals Center 558 2 0.36 0.58 0.69 (0.08, 2.48) 550 0.55
Badero O 159 1 0.63 0.34 2.07 (0.03,11.50) 158 1.60 NY Methodist Hospital 137 1 0.73 0.33 2.46 (0.03,13.69) 137 1.85 Univ. Hosp-Brooklyn 22 0 0.00 0.39 0.00 (0.00,47.46) 21 0.00
Bagga R 462 2 0.43 0.97 0.49 (0.06, 1.78) 382 0.29 Huntington Hospital 408 2 0.49 0.98 0.55 (0.06, 2.00) 328 0.36 Long Island Jewish MC 53 0 0.00 0.85 0.00 (0.00, 8.99) 53 0.00 North Shore Univ Hosp 1 0 0.00 2.59 0.00 (0.00,100.0) 1 0.00
Bander J 316 4 1.27 1.02 1.37 (0.37, 3.51) 290 0.84 Good Sam - Suffern 4 0 0.00 0.79 0.00 (0.00,100.0) 1 0.00 Mount Sinai Hospital 312 4 1.28 1.03 1.38 (0.37, 3.54) 289 0.85
Bangalore S 364 3 0.82 1.76 0.52 (0.10, 1.52) 273 0.35 Bellevue Hospital Ctr 336 3 0.89 1.80 0.55 (0.11, 1.61) 251 0.38 NYU Hospitals Center 28 0 0.00 1.26 0.00 (0.00,11.52) 22 0.00
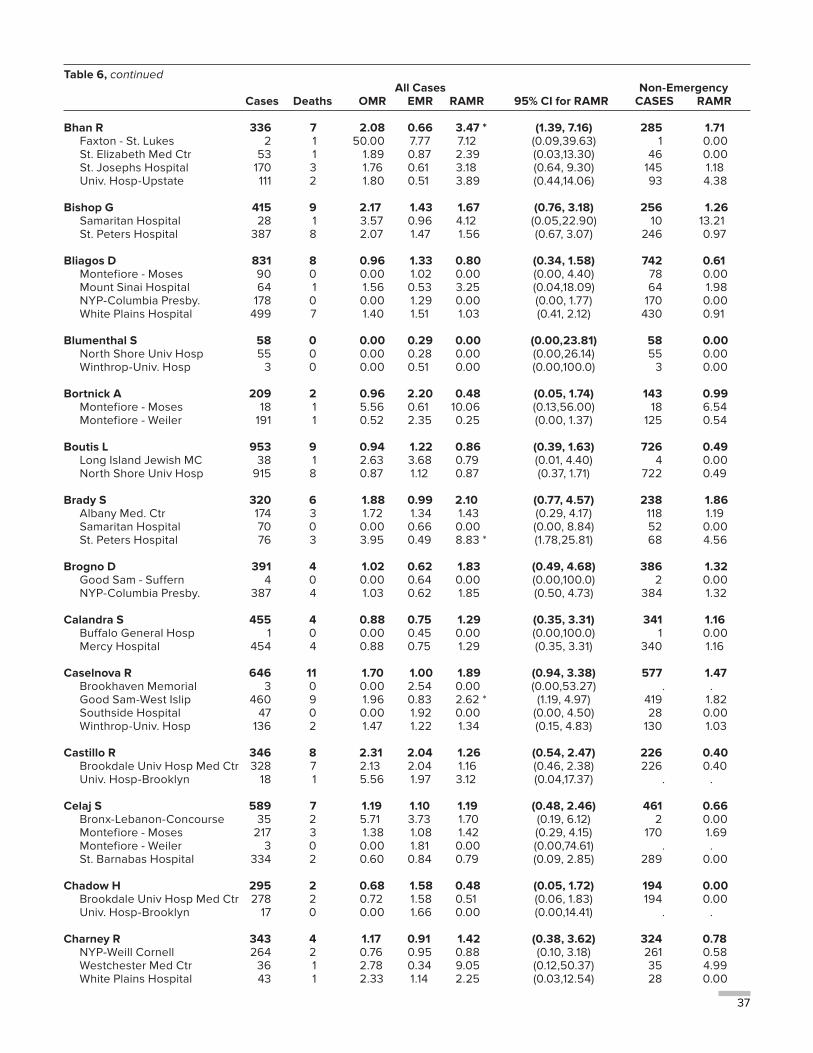
37
Table 6, continued All Cases Non-Emergency Cases Deaths OMR EMR RAMR 95% CI for RAMR CASES RAMR
Bhan R 336 7 2.08 0.66 3.47 * (1.39, 7.16) 285 1.71 Faxton - St. Lukes 2 1 50.00 7.77 7.12 (0.09,39.63) 1 0.00 St. Elizabeth Med Ctr 53 1 1.89 0.87 2.39 (0.03,13.30) 46 0.00 St. Josephs Hospital 170 3 1.76 0.61 3.18 (0.64, 9.30) 145 1.18 Univ. Hosp-Upstate 111 2 1.80 0.51 3.89 (0.44,14.06) 93 4.38
Bishop G 415 9 2.17 1.43 1.67 (0.76, 3.18) 256 1.26 Samaritan Hospital 28 1 3.57 0.96 4.12 (0.05,22.90) 10 13.21 St. Peters Hospital 387 8 2.07 1.47 1.56 (0.67, 3.07) 246 0.97
Bliagos D 831 8 0.96 1.33 0.80 (0.34, 1.58) 742 0.61 Montefiore - Moses 90 0 0.00 1.02 0.00 (0.00, 4.40) 78 0.00 Mount Sinai Hospital 64 1 1.56 0.53 3.25 (0.04,18.09) 64 1.98 NYP-Columbia Presby. 178 0 0.00 1.29 0.00 (0.00, 1.77) 170 0.00 White Plains Hospital 499 7 1.40 1.51 1.03 (0.41, 2.12) 430 0.91
Blumenthal S 58 0 0.00 0.29 0.00 (0.00,23.81) 58 0.00 North Shore Univ Hosp 55 0 0.00 0.28 0.00 (0.00,26.14) 55 0.00 Winthrop-Univ. Hosp 3 0 0.00 0.51 0.00 (0.00,100.0) 3 0.00
Bortnick A 209 2 0.96 2.20 0.48 (0.05, 1.74) 143 0.99 Montefiore - Moses 18 1 5.56 0.61 10.06 (0.13,56.00) 18 6.54 Montefiore - Weiler 191 1 0.52 2.35 0.25 (0.00, 1.37) 125 0.54
Boutis L 953 9 0.94 1.22 0.86 (0.39, 1.63) 726 0.49 Long Island Jewish MC 38 1 2.63 3.68 0.79 (0.01, 4.40) 4 0.00 North Shore Univ Hosp 915 8 0.87 1.12 0.87 (0.37, 1.71) 722 0.49
Brady S 320 6 1.88 0.99 2.10 (0.77, 4.57) 238 1.86 Albany Med. Ctr 174 3 1.72 1.34 1.43 (0.29, 4.17) 118 1.19 Samaritan Hospital 70 0 0.00 0.66 0.00 (0.00, 8.84) 52 0.00 St. Peters Hospital 76 3 3.95 0.49 8.83 * (1.78,25.81) 68 4.56
Brogno D 391 4 1.02 0.62 1.83 (0.49, 4.68) 386 1.32 Good Sam - Suffern 4 0 0.00 0.64 0.00 (0.00,100.0) 2 0.00 NYP-Columbia Presby. 387 4 1.03 0.62 1.85 (0.50, 4.73) 384 1.32
Calandra S 455 4 0.88 0.75 1.29 (0.35, 3.31) 341 1.16 Buffalo General Hosp 1 0 0.00 0.45 0.00 (0.00,100.0) 1 0.00 Mercy Hospital 454 4 0.88 0.75 1.29 (0.35, 3.31) 340 1.16
Caselnova R 646 11 1.70 1.00 1.89 (0.94, 3.38) 577 1.47 Brookhaven Memorial 3 0 0.00 2.54 0.00 (0.00,53.27) . . Good Sam-West Islip 460 9 1.96 0.83 2.62 * (1.19, 4.97) 419 1.82 Southside Hospital 47 0 0.00 1.92 0.00 (0.00, 4.50) 28 0.00 Winthrop-Univ. Hosp 136 2 1.47 1.22 1.34 (0.15, 4.83) 130 1.03
Castillo R 346 8 2.31 2.04 1.26 (0.54, 2.47) 226 0.40 Brookdale Univ Hosp Med Ctr 328 7 2.13 2.04 1.16 (0.46, 2.38) 226 0.40 Univ. Hosp-Brooklyn 18 1 5.56 1.97 3.12 (0.04,17.37) . .
Celaj S 589 7 1.19 1.10 1.19 (0.48, 2.46) 461 0.66 Bronx-Lebanon-Concourse 35 2 5.71 3.73 1.70 (0.19, 6.12) 2 0.00 Montefiore - Moses 217 3 1.38 1.08 1.42 (0.29, 4.15) 170 1.69 Montefiore - Weiler 3 0 0.00 1.81 0.00 (0.00,74.61) . . St. Barnabas Hospital 334 2 0.60 0.84 0.79 (0.09, 2.85) 289 0.00
Chadow H 295 2 0.68 1.58 0.48 (0.05, 1.72) 194 0.00 Brookdale Univ Hosp Med Ctr 278 2 0.72 1.58 0.51 (0.06, 1.83) 194 0.00 Univ. Hosp-Brooklyn 17 0 0.00 1.66 0.00 (0.00,14.41) . .
Charney R 343 4 1.17 0.91 1.42 (0.38, 3.62) 324 0.78 NYP-Weill Cornell 264 2 0.76 0.95 0.88 (0.10, 3.18) 261 0.58 Westchester Med Ctr 36 1 2.78 0.34 9.05 (0.12,50.37) 35 4.99 White Plains Hospital 43 1 2.33 1.14 2.25 (0.03,12.54) 28 0.00
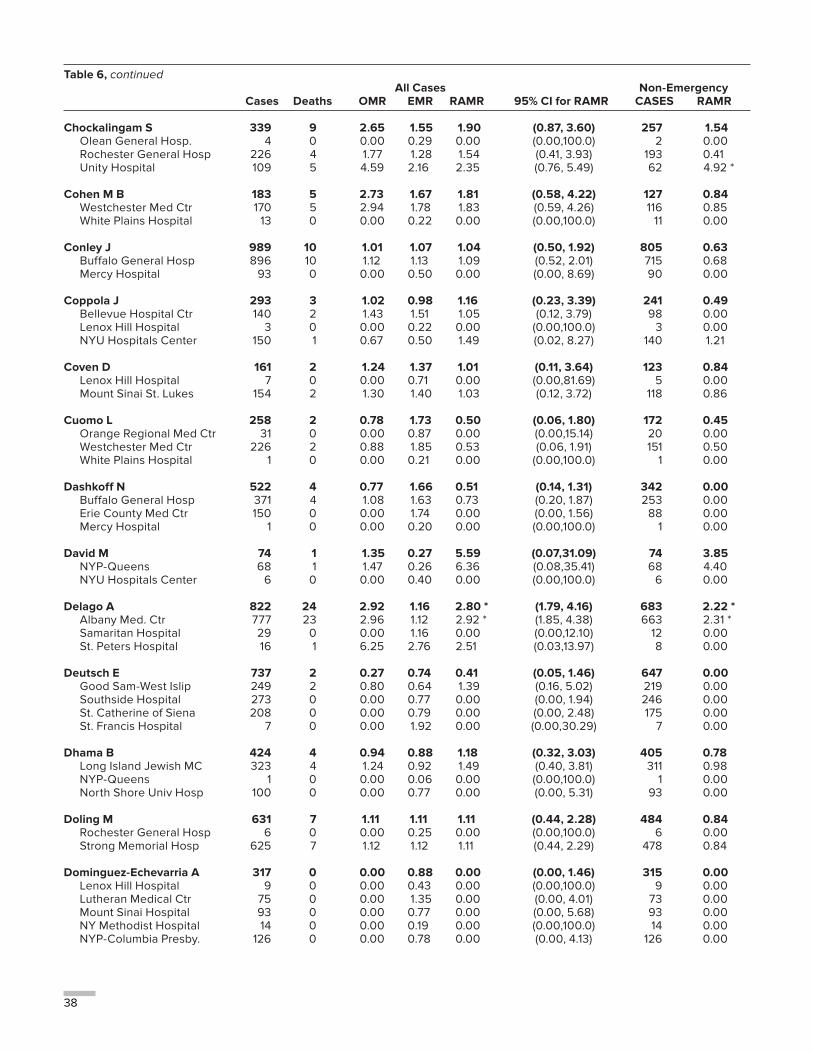
38
Table 6, continued All Cases Non-Emergency Cases Deaths OMR EMR RAMR 95% CI for RAMR CASES RAMR
Chockalingam S 339 9 2.65 1.55 1.90 (0.87, 3.60) 257 1.54 Olean General Hosp. 4 0 0.00 0.29 0.00 (0.00,100.0) 2 0.00 Rochester General Hosp 226 4 1.77 1.28 1.54 (0.41, 3.93) 193 0.41 Unity Hospital 109 5 4.59 2.16 2.35 (0.76, 5.49) 62 4.92 *
Cohen M B 183 5 2.73 1.67 1.81 (0.58, 4.22) 127 0.84 Westchester Med Ctr 170 5 2.94 1.78 1.83 (0.59, 4.26) 116 0.85 White Plains Hospital 13 0 0.00 0.22 0.00 (0.00,100.0) 11 0.00
Conley J 989 10 1.01 1.07 1.04 (0.50, 1.92) 805 0.63 Buffalo General Hosp 896 10 1.12 1.13 1.09 (0.52, 2.01) 715 0.68 Mercy Hospital 93 0 0.00 0.50 0.00 (0.00, 8.69) 90 0.00
Coppola J 293 3 1.02 0.98 1.16 (0.23, 3.39) 241 0.49 Bellevue Hospital Ctr 140 2 1.43 1.51 1.05 (0.12, 3.79) 98 0.00 Lenox Hill Hospital 3 0 0.00 0.22 0.00 (0.00,100.0) 3 0.00 NYU Hospitals Center 150 1 0.67 0.50 1.49 (0.02, 8.27) 140 1.21
Coven D 161 2 1.24 1.37 1.01 (0.11, 3.64) 123 0.84 Lenox Hill Hospital 7 0 0.00 0.71 0.00 (0.00,81.69) 5 0.00 Mount Sinai St. Lukes 154 2 1.30 1.40 1.03 (0.12, 3.72) 118 0.86
Cuomo L 258 2 0.78 1.73 0.50 (0.06, 1.80) 172 0.45 Orange Regional Med Ctr 31 0 0.00 0.87 0.00 (0.00,15.14) 20 0.00 Westchester Med Ctr 226 2 0.88 1.85 0.53 (0.06, 1.91) 151 0.50 White Plains Hospital 1 0 0.00 0.21 0.00 (0.00,100.0) 1 0.00
Dashkoff N 522 4 0.77 1.66 0.51 (0.14, 1.31) 342 0.00 Buffalo General Hosp 371 4 1.08 1.63 0.73 (0.20, 1.87) 253 0.00 Erie County Med Ctr 150 0 0.00 1.74 0.00 (0.00, 1.56) 88 0.00 Mercy Hospital 1 0 0.00 0.20 0.00 (0.00,100.0) 1 0.00
David M 74 1 1.35 0.27 5.59 (0.07,31.09) 74 3.85 NYP-Queens 68 1 1.47 0.26 6.36 (0.08,35.41) 68 4.40 NYU Hospitals Center 6 0 0.00 0.40 0.00 (0.00,100.0) 6 0.00
Delago A 822 24 2.92 1.16 2.80 * (1.79, 4.16) 683 2.22 * Albany Med. Ctr 777 23 2.96 1.12 2.92 * (1.85, 4.38) 663 2.31 * Samaritan Hospital 29 0 0.00 1.16 0.00 (0.00,12.10) 12 0.00 St. Peters Hospital 16 1 6.25 2.76 2.51 (0.03,13.97) 8 0.00
Deutsch E 737 2 0.27 0.74 0.41 (0.05, 1.46) 647 0.00 Good Sam-West Islip 249 2 0.80 0.64 1.39 (0.16, 5.02) 219 0.00 Southside Hospital 273 0 0.00 0.77 0.00 (0.00, 1.94) 246 0.00 St. Catherine of Siena 208 0 0.00 0.79 0.00 (0.00, 2.48) 175 0.00 St. Francis Hospital 7 0 0.00 1.92 0.00 (0.00,30.29) 7 0.00
Dhama B 424 4 0.94 0.88 1.18 (0.32, 3.03) 405 0.78 Long Island Jewish MC 323 4 1.24 0.92 1.49 (0.40, 3.81) 311 0.98 NYP-Queens 1 0 0.00 0.06 0.00 (0.00,100.0) 1 0.00 North Shore Univ Hosp 100 0 0.00 0.77 0.00 (0.00, 5.31) 93 0.00
Doling M 631 7 1.11 1.11 1.11 (0.44, 2.28) 484 0.84 Rochester General Hosp 6 0 0.00 0.25 0.00 (0.00,100.0) 6 0.00 Strong Memorial Hosp 625 7 1.12 1.12 1.11 (0.44, 2.29) 478 0.84
Dominguez-Echevarria A 317 0 0.00 0.88 0.00 (0.00, 1.46) 315 0.00 Lenox Hill Hospital 9 0 0.00 0.43 0.00 (0.00,100.0) 9 0.00 Lutheran Medical Ctr 75 0 0.00 1.35 0.00 (0.00, 4.01) 73 0.00 Mount Sinai Hospital 93 0 0.00 0.77 0.00 (0.00, 5.68) 93 0.00 NY Methodist Hospital 14 0 0.00 0.19 0.00 (0.00,100.0) 14 0.00 NYP-Columbia Presby. 126 0 0.00 0.78 0.00 (0.00, 4.13) 126 0.00
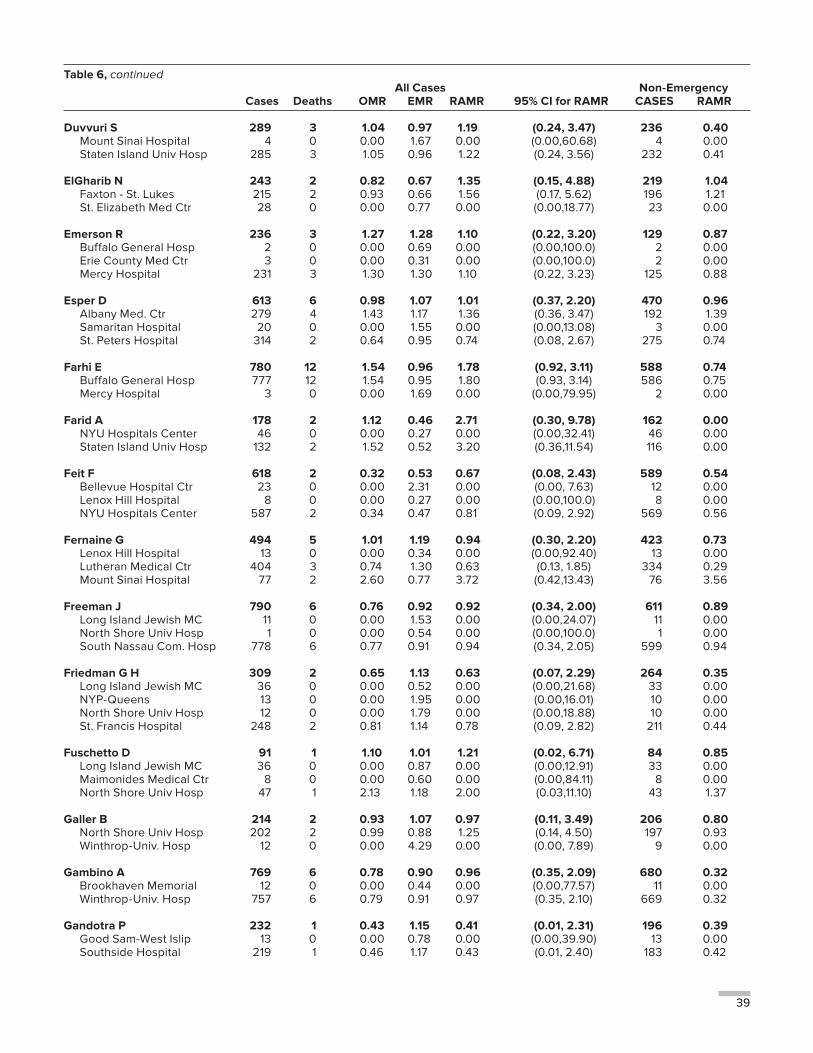
39
Table 6, continued All Cases Non-Emergency Cases Deaths OMR EMR RAMR 95% CI for RAMR CASES RAMR
Duvvuri S 289 3 1.04 0.97 1.19 (0.24, 3.47) 236 0.40 Mount Sinai Hospital 4 0 0.00 1.67 0.00 (0.00,60.68) 4 0.00 Staten Island Univ Hosp 285 3 1.05 0.96 1.22 (0.24, 3.56) 232 0.41
ElGharib N 243 2 0.82 0.67 1.35 (0.15, 4.88) 219 1.04 Faxton - St. Lukes 215 2 0.93 0.66 1.56 (0.17, 5.62) 196 1.21 St. Elizabeth Med Ctr 28 0 0.00 0.77 0.00 (0.00,18.77) 23 0.00
Emerson R 236 3 1.27 1.28 1.10 (0.22, 3.20) 129 0.87 Buffalo General Hosp 2 0 0.00 0.69 0.00 (0.00,100.0) 2 0.00 Erie County Med Ctr 3 0 0.00 0.31 0.00 (0.00,100.0) 2 0.00 Mercy Hospital 231 3 1.30 1.30 1.10 (0.22, 3.23) 125 0.88
Esper D 613 6 0.98 1.07 1.01 (0.37, 2.20) 470 0.96 Albany Med. Ctr 279 4 1.43 1.17 1.36 (0.36, 3.47) 192 1.39 Samaritan Hospital 20 0 0.00 1.55 0.00 (0.00,13.08) 3 0.00 St. Peters Hospital 314 2 0.64 0.95 0.74 (0.08, 2.67) 275 0.74
Farhi E 780 12 1.54 0.96 1.78 (0.92, 3.11) 588 0.74 Buffalo General Hosp 777 12 1.54 0.95 1.80 (0.93, 3.14) 586 0.75 Mercy Hospital 3 0 0.00 1.69 0.00 (0.00,79.95) 2 0.00
Farid A 178 2 1.12 0.46 2.71 (0.30, 9.78) 162 0.00 NYU Hospitals Center 46 0 0.00 0.27 0.00 (0.00,32.41) 46 0.00 Staten Island Univ Hosp 132 2 1.52 0.52 3.20 (0.36,11.54) 116 0.00
Feit F 618 2 0.32 0.53 0.67 (0.08, 2.43) 589 0.54 Bellevue Hospital Ctr 23 0 0.00 2.31 0.00 (0.00, 7.63) 12 0.00 Lenox Hill Hospital 8 0 0.00 0.27 0.00 (0.00,100.0) 8 0.00 NYU Hospitals Center 587 2 0.34 0.47 0.81 (0.09, 2.92) 569 0.56
Fernaine G 494 5 1.01 1.19 0.94 (0.30, 2.20) 423 0.73 Lenox Hill Hospital 13 0 0.00 0.34 0.00 (0.00,92.40) 13 0.00 Lutheran Medical Ctr 404 3 0.74 1.30 0.63 (0.13, 1.85) 334 0.29 Mount Sinai Hospital 77 2 2.60 0.77 3.72 (0.42,13.43) 76 3.56
Freeman J 790 6 0.76 0.92 0.92 (0.34, 2.00) 611 0.89 Long Island Jewish MC 11 0 0.00 1.53 0.00 (0.00,24.07) 11 0.00 North Shore Univ Hosp 1 0 0.00 0.54 0.00 (0.00,100.0) 1 0.00 South Nassau Com. Hosp 778 6 0.77 0.91 0.94 (0.34, 2.05) 599 0.94
Friedman G H 309 2 0.65 1.13 0.63 (0.07, 2.29) 264 0.35 Long Island Jewish MC 36 0 0.00 0.52 0.00 (0.00,21.68) 33 0.00 NYP-Queens 13 0 0.00 1.95 0.00 (0.00,16.01) 10 0.00 North Shore Univ Hosp 12 0 0.00 1.79 0.00 (0.00,18.88) 10 0.00 St. Francis Hospital 248 2 0.81 1.14 0.78 (0.09, 2.82) 211 0.44
Fuschetto D 91 1 1.10 1.01 1.21 (0.02, 6.71) 84 0.85 Long Island Jewish MC 36 0 0.00 0.87 0.00 (0.00,12.91) 33 0.00 Maimonides Medical Ctr 8 0 0.00 0.60 0.00 (0.00,84.11) 8 0.00 North Shore Univ Hosp 47 1 2.13 1.18 2.00 (0.03,11.10) 43 1.37
Galler B 214 2 0.93 1.07 0.97 (0.11, 3.49) 206 0.80 North Shore Univ Hosp 202 2 0.99 0.88 1.25 (0.14, 4.50) 197 0.93 Winthrop-Univ. Hosp 12 0 0.00 4.29 0.00 (0.00, 7.89) 9 0.00
Gambino A 769 6 0.78 0.90 0.96 (0.35, 2.09) 680 0.32 Brookhaven Memorial 12 0 0.00 0.44 0.00 (0.00,77.57) 11 0.00 Winthrop-Univ. Hosp 757 6 0.79 0.91 0.97 (0.35, 2.10) 669 0.32
Gandotra P 232 1 0.43 1.15 0.41 (0.01, 2.31) 196 0.39 Good Sam-West Islip 13 0 0.00 0.78 0.00 (0.00,39.90) 13 0.00 Southside Hospital 219 1 0.46 1.17 0.43 (0.01, 2.40) 183 0.42
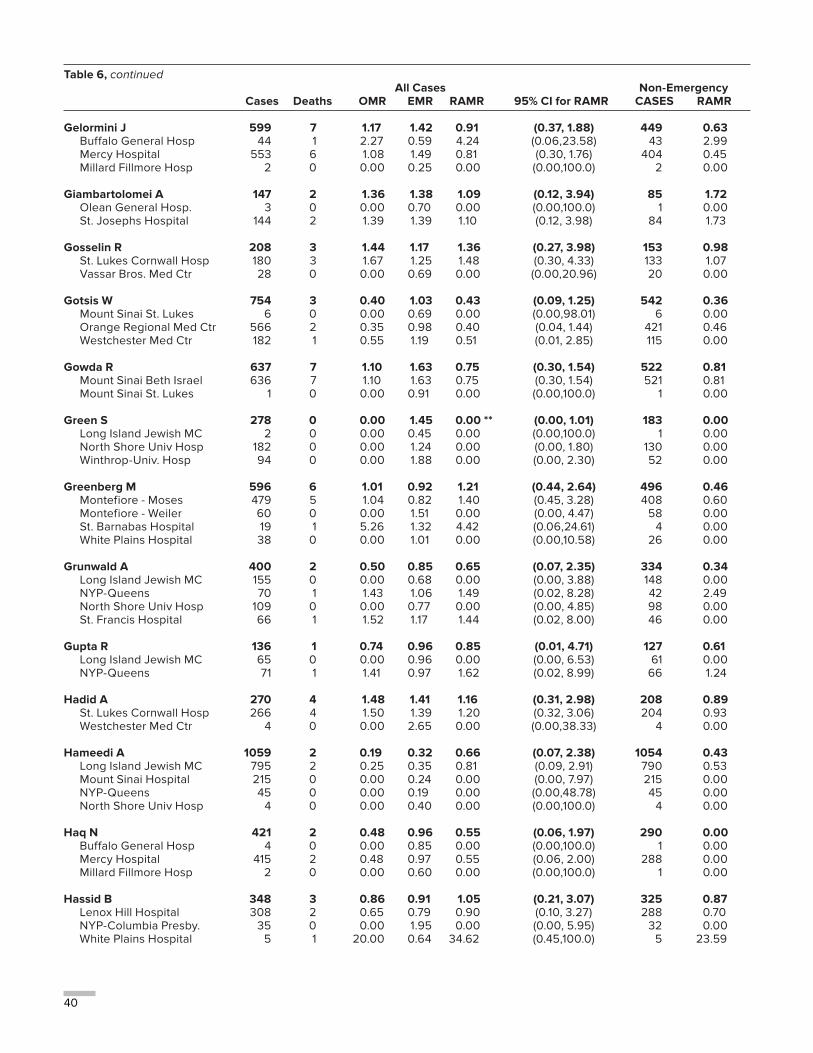
40
Table 6, continued All Cases Non-Emergency Cases Deaths OMR EMR RAMR 95% CI for RAMR CASES RAMR
Gelormini J 599 7 1.17 1.42 0.91 (0.37, 1.88) 449 0.63 Buffalo General Hosp 44 1 2.27 0.59 4.24 (0.06,23.58) 43 2.99 Mercy Hospital 553 6 1.08 1.49 0.81 (0.30, 1.76) 404 0.45 Millard Fillmore Hosp 2 0 0.00 0.25 0.00 (0.00,100.0) 2 0.00
Giambartolomei A 147 2 1.36 1.38 1.09 (0.12, 3.94) 85 1.72 Olean General Hosp. 3 0 0.00 0.70 0.00 (0.00,100.0) 1 0.00 St. Josephs Hospital 144 2 1.39 1.39 1.10 (0.12, 3.98) 84 1.73
Gosselin R 208 3 1.44 1.17 1.36 (0.27, 3.98) 153 0.98 St. Lukes Cornwall Hosp 180 3 1.67 1.25 1.48 (0.30, 4.33) 133 1.07 Vassar Bros. Med Ctr 28 0 0.00 0.69 0.00 (0.00,20.96) 20 0.00
Gotsis W 754 3 0.40 1.03 0.43 (0.09, 1.25) 542 0.36 Mount Sinai St. Lukes 6 0 0.00 0.69 0.00 (0.00,98.01) 6 0.00 Orange Regional Med Ctr 566 2 0.35 0.98 0.40 (0.04, 1.44) 421 0.46 Westchester Med Ctr 182 1 0.55 1.19 0.51 (0.01, 2.85) 115 0.00
Gowda R 637 7 1.10 1.63 0.75 (0.30, 1.54) 522 0.81 Mount Sinai Beth Israel 636 7 1.10 1.63 0.75 (0.30, 1.54) 521 0.81 Mount Sinai St. Lukes 1 0 0.00 0.91 0.00 (0.00,100.0) 1 0.00
Green S 278 0 0.00 1.45 0.00 ** (0.00, 1.01) 183 0.00 Long Island Jewish MC 2 0 0.00 0.45 0.00 (0.00,100.0) 1 0.00 North Shore Univ Hosp 182 0 0.00 1.24 0.00 (0.00, 1.80) 130 0.00 Winthrop-Univ. Hosp 94 0 0.00 1.88 0.00 (0.00, 2.30) 52 0.00
Greenberg M 596 6 1.01 0.92 1.21 (0.44, 2.64) 496 0.46 Montefiore - Moses 479 5 1.04 0.82 1.40 (0.45, 3.28) 408 0.60 Montefiore - Weiler 60 0 0.00 1.51 0.00 (0.00, 4.47) 58 0.00 St. Barnabas Hospital 19 1 5.26 1.32 4.42 (0.06,24.61) 4 0.00 White Plains Hospital 38 0 0.00 1.01 0.00 (0.00,10.58) 26 0.00
Grunwald A 400 2 0.50 0.85 0.65 (0.07, 2.35) 334 0.34 Long Island Jewish MC 155 0 0.00 0.68 0.00 (0.00, 3.88) 148 0.00 NYP-Queens 70 1 1.43 1.06 1.49 (0.02, 8.28) 42 2.49 North Shore Univ Hosp 109 0 0.00 0.77 0.00 (0.00, 4.85) 98 0.00 St. Francis Hospital 66 1 1.52 1.17 1.44 (0.02, 8.00) 46 0.00
Gupta R 136 1 0.74 0.96 0.85 (0.01, 4.71) 127 0.61 Long Island Jewish MC 65 0 0.00 0.96 0.00 (0.00, 6.53) 61 0.00 NYP-Queens 71 1 1.41 0.97 1.62 (0.02, 8.99) 66 1.24
Hadid A 270 4 1.48 1.41 1.16 (0.31, 2.98) 208 0.89 St. Lukes Cornwall Hosp 266 4 1.50 1.39 1.20 (0.32, 3.06) 204 0.93 Westchester Med Ctr 4 0 0.00 2.65 0.00 (0.00,38.33) 4 0.00
Hameedi A 1059 2 0.19 0.32 0.66 (0.07, 2.38) 1054 0.43 Long Island Jewish MC 795 2 0.25 0.35 0.81 (0.09, 2.91) 790 0.53 Mount Sinai Hospital 215 0 0.00 0.24 0.00 (0.00, 7.97) 215 0.00 NYP-Queens 45 0 0.00 0.19 0.00 (0.00,48.78) 45 0.00 North Shore Univ Hosp 4 0 0.00 0.40 0.00 (0.00,100.0) 4 0.00
Haq N 421 2 0.48 0.96 0.55 (0.06, 1.97) 290 0.00 Buffalo General Hosp 4 0 0.00 0.85 0.00 (0.00,100.0) 1 0.00 Mercy Hospital 415 2 0.48 0.97 0.55 (0.06, 2.00) 288 0.00 Millard Fillmore Hosp 2 0 0.00 0.60 0.00 (0.00,100.0) 1 0.00
Hassid B 348 3 0.86 0.91 1.05 (0.21, 3.07) 325 0.87 Lenox Hill Hospital 308 2 0.65 0.79 0.90 (0.10, 3.27) 288 0.70 NYP-Columbia Presby. 35 0 0.00 1.95 0.00 (0.00, 5.95) 32 0.00 White Plains Hospital 5 1 20.00 0.64 34.62 (0.45,100.0) 5 23.59
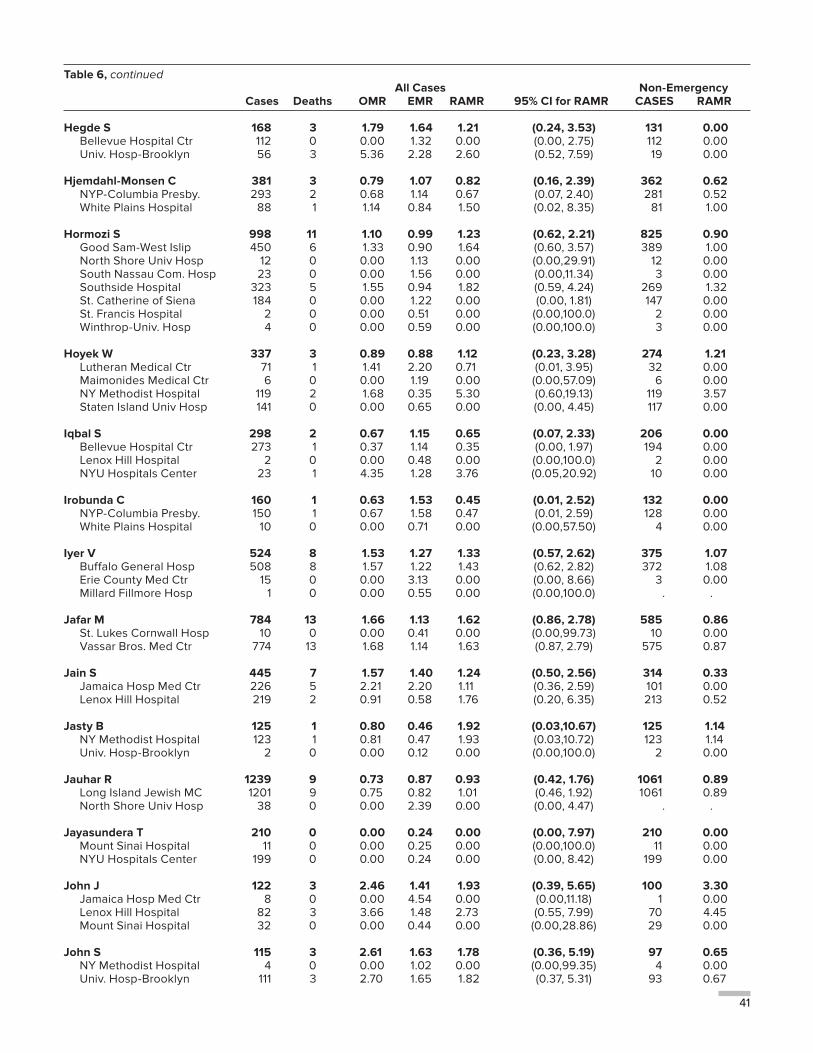
41
Table 6, continued All Cases Non-Emergency Cases Deaths OMR EMR RAMR 95% CI for RAMR CASES RAMR
Hegde S 168 3 1.79 1.64 1.21 (0.24, 3.53) 131 0.00 Bellevue Hospital Ctr 112 0 0.00 1.32 0.00 (0.00, 2.75) 112 0.00 Univ. Hosp-Brooklyn 56 3 5.36 2.28 2.60 (0.52, 7.59) 19 0.00
Hjemdahl-Monsen C 381 3 0.79 1.07 0.82 (0.16, 2.39) 362 0.62 NYP-Columbia Presby. 293 2 0.68 1.14 0.67 (0.07, 2.40) 281 0.52 White Plains Hospital 88 1 1.14 0.84 1.50 (0.02, 8.35) 81 1.00
Hormozi S 998 11 1.10 0.99 1.23 (0.62, 2.21) 825 0.90 Good Sam-West Islip 450 6 1.33 0.90 1.64 (0.60, 3.57) 389 1.00 North Shore Univ Hosp 12 0 0.00 1.13 0.00 (0.00,29.91) 12 0.00 South Nassau Com. Hosp 23 0 0.00 1.56 0.00 (0.00,11.34) 3 0.00 Southside Hospital 323 5 1.55 0.94 1.82 (0.59, 4.24) 269 1.32 St. Catherine of Siena 184 0 0.00 1.22 0.00 (0.00, 1.81) 147 0.00 St. Francis Hospital 2 0 0.00 0.51 0.00 (0.00,100.0) 2 0.00 Winthrop-Univ. Hosp 4 0 0.00 0.59 0.00 (0.00,100.0) 3 0.00
Hoyek W 337 3 0.89 0.88 1.12 (0.23, 3.28) 274 1.21 Lutheran Medical Ctr 71 1 1.41 2.20 0.71 (0.01, 3.95) 32 0.00 Maimonides Medical Ctr 6 0 0.00 1.19 0.00 (0.00,57.09) 6 0.00 NY Methodist Hospital 119 2 1.68 0.35 5.30 (0.60,19.13) 119 3.57 Staten Island Univ Hosp 141 0 0.00 0.65 0.00 (0.00, 4.45) 117 0.00
Iqbal S 298 2 0.67 1.15 0.65 (0.07, 2.33) 206 0.00 Bellevue Hospital Ctr 273 1 0.37 1.14 0.35 (0.00, 1.97) 194 0.00 Lenox Hill Hospital 2 0 0.00 0.48 0.00 (0.00,100.0) 2 0.00 NYU Hospitals Center 23 1 4.35 1.28 3.76 (0.05,20.92) 10 0.00
Irobunda C 160 1 0.63 1.53 0.45 (0.01, 2.52) 132 0.00 NYP-Columbia Presby. 150 1 0.67 1.58 0.47 (0.01, 2.59) 128 0.00 White Plains Hospital 10 0 0.00 0.71 0.00 (0.00,57.50) 4 0.00
Iyer V 524 8 1.53 1.27 1.33 (0.57, 2.62) 375 1.07 Buffalo General Hosp 508 8 1.57 1.22 1.43 (0.62, 2.82) 372 1.08 Erie County Med Ctr 15 0 0.00 3.13 0.00 (0.00, 8.66) 3 0.00 Millard Fillmore Hosp 1 0 0.00 0.55 0.00 (0.00,100.0) . .
Jafar M 784 13 1.66 1.13 1.62 (0.86, 2.78) 585 0.86 St. Lukes Cornwall Hosp 10 0 0.00 0.41 0.00 (0.00,99.73) 10 0.00 Vassar Bros. Med Ctr 774 13 1.68 1.14 1.63 (0.87, 2.79) 575 0.87
Jain S 445 7 1.57 1.40 1.24 (0.50, 2.56) 314 0.33 Jamaica Hosp Med Ctr 226 5 2.21 2.20 1.11 (0.36, 2.59) 101 0.00 Lenox Hill Hospital 219 2 0.91 0.58 1.76 (0.20, 6.35) 213 0.52
Jasty B 125 1 0.80 0.46 1.92 (0.03,10.67) 125 1.14 NY Methodist Hospital 123 1 0.81 0.47 1.93 (0.03,10.72) 123 1.14 Univ. Hosp-Brooklyn 2 0 0.00 0.12 0.00 (0.00,100.0) 2 0.00
Jauhar R 1239 9 0.73 0.87 0.93 (0.42, 1.76) 1061 0.89 Long Island Jewish MC 1201 9 0.75 0.82 1.01 (0.46, 1.92) 1061 0.89 North Shore Univ Hosp 38 0 0.00 2.39 0.00 (0.00, 4.47) . .
Jayasundera T 210 0 0.00 0.24 0.00 (0.00, 7.97) 210 0.00 Mount Sinai Hospital 11 0 0.00 0.25 0.00 (0.00,100.0) 11 0.00 NYU Hospitals Center 199 0 0.00 0.24 0.00 (0.00, 8.42) 199 0.00
John J 122 3 2.46 1.41 1.93 (0.39, 5.65) 100 3.30 Jamaica Hosp Med Ctr 8 0 0.00 4.54 0.00 (0.00,11.18) 1 0.00 Lenox Hill Hospital 82 3 3.66 1.48 2.73 (0.55, 7.99) 70 4.45 Mount Sinai Hospital 32 0 0.00 0.44 0.00 (0.00,28.86) 29 0.00
John S 115 3 2.61 1.63 1.78 (0.36, 5.19) 97 0.65 NY Methodist Hospital 4 0 0.00 1.02 0.00 (0.00,99.35) 4 0.00 Univ. Hosp-Brooklyn 111 3 2.70 1.65 1.82 (0.37, 5.31) 93 0.67
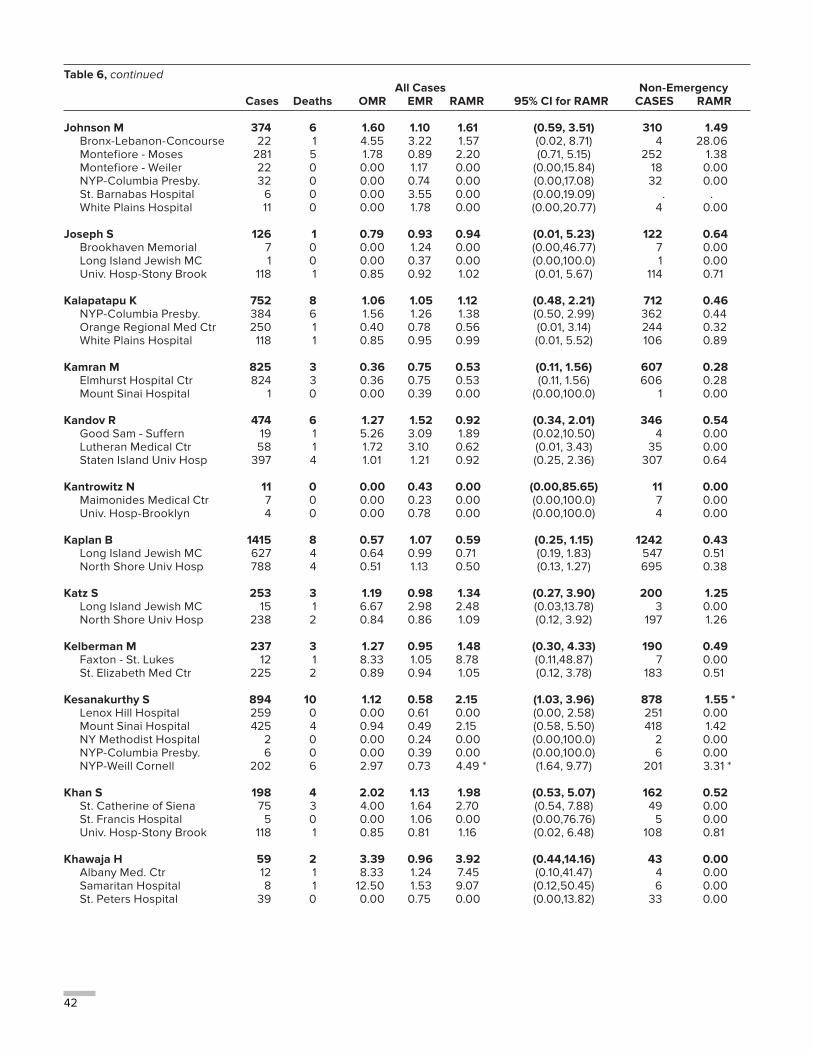
42
Table 6, continued All Cases Non-Emergency Cases Deaths OMR EMR RAMR 95% CI for RAMR CASES RAMR
Johnson M 374 6 1.60 1.10 1.61 (0.59, 3.51) 310 1.49 Bronx-Lebanon-Concourse 22 1 4.55 3.22 1.57 (0.02, 8.71) 4 28.06 Montefiore - Moses 281 5 1.78 0.89 2.20 (0.71, 5.15) 252 1.38 Montefiore - Weiler 22 0 0.00 1.17 0.00 (0.00,15.84) 18 0.00 NYP-Columbia Presby. 32 0 0.00 0.74 0.00 (0.00,17.08) 32 0.00 St. Barnabas Hospital 6 0 0.00 3.55 0.00 (0.00,19.09) . . White Plains Hospital 11 0 0.00 1.78 0.00 (0.00,20.77) 4 0.00
Joseph S 126 1 0.79 0.93 0.94 (0.01, 5.23) 122 0.64 Brookhaven Memorial 7 0 0.00 1.24 0.00 (0.00,46.77) 7 0.00 Long Island Jewish MC 1 0 0.00 0.37 0.00 (0.00,100.0) 1 0.00 Univ. Hosp-Stony Brook 118 1 0.85 0.92 1.02 (0.01, 5.67) 114 0.71
Kalapatapu K 752 8 1.06 1.05 1.12 (0.48, 2.21) 712 0.46 NYP-Columbia Presby. 384 6 1.56 1.26 1.38 (0.50, 2.99) 362 0.44 Orange Regional Med Ctr 250 1 0.40 0.78 0.56 (0.01, 3.14) 244 0.32 White Plains Hospital 118 1 0.85 0.95 0.99 (0.01, 5.52) 106 0.89
Kamran M 825 3 0.36 0.75 0.53 (0.11, 1.56) 607 0.28 Elmhurst Hospital Ctr 824 3 0.36 0.75 0.53 (0.11, 1.56) 606 0.28 Mount Sinai Hospital 1 0 0.00 0.39 0.00 (0.00,100.0) 1 0.00
Kandov R 474 6 1.27 1.52 0.92 (0.34, 2.01) 346 0.54 Good Sam - Suffern 19 1 5.26 3.09 1.89 (0.02,10.50) 4 0.00 Lutheran Medical Ctr 58 1 1.72 3.10 0.62 (0.01, 3.43) 35 0.00 Staten Island Univ Hosp 397 4 1.01 1.21 0.92 (0.25, 2.36) 307 0.64
Kantrowitz N 11 0 0.00 0.43 0.00 (0.00,85.65) 11 0.00 Maimonides Medical Ctr 7 0 0.00 0.23 0.00 (0.00,100.0) 7 0.00 Univ. Hosp-Brooklyn 4 0 0.00 0.78 0.00 (0.00,100.0) 4 0.00
Kaplan B 1415 8 0.57 1.07 0.59 (0.25, 1.15) 1242 0.43 Long Island Jewish MC 627 4 0.64 0.99 0.71 (0.19, 1.83) 547 0.51 North Shore Univ Hosp 788 4 0.51 1.13 0.50 (0.13, 1.27) 695 0.38
Katz S 253 3 1.19 0.98 1.34 (0.27, 3.90) 200 1.25 Long Island Jewish MC 15 1 6.67 2.98 2.48 (0.03,13.78) 3 0.00 North Shore Univ Hosp 238 2 0.84 0.86 1.09 (0.12, 3.92) 197 1.26
Kelberman M 237 3 1.27 0.95 1.48 (0.30, 4.33) 190 0.49 Faxton - St. Lukes 12 1 8.33 1.05 8.78 (0.11,48.87) 7 0.00 St. Elizabeth Med Ctr 225 2 0.89 0.94 1.05 (0.12, 3.78) 183 0.51
Kesanakurthy S 894 10 1.12 0.58 2.15 (1.03, 3.96) 878 1.55 * Lenox Hill Hospital 259 0 0.00 0.61 0.00 (0.00, 2.58) 251 0.00 Mount Sinai Hospital 425 4 0.94 0.49 2.15 (0.58, 5.50) 418 1.42 NY Methodist Hospital 2 0 0.00 0.24 0.00 (0.00,100.0) 2 0.00 NYP-Columbia Presby. 6 0 0.00 0.39 0.00 (0.00,100.0) 6 0.00 NYP-Weill Cornell 202 6 2.97 0.73 4.49 * (1.64, 9.77) 201 3.31 *
Khan S 198 4 2.02 1.13 1.98 (0.53, 5.07) 162 0.52 St. Catherine of Siena 75 3 4.00 1.64 2.70 (0.54, 7.88) 49 0.00 St. Francis Hospital 5 0 0.00 1.06 0.00 (0.00,76.76) 5 0.00 Univ. Hosp-Stony Brook 118 1 0.85 0.81 1.16 (0.02, 6.48) 108 0.81
Khawaja H 59 2 3.39 0.96 3.92 (0.44,14.16) 43 0.00 Albany Med. Ctr 12 1 8.33 1.24 7.45 (0.10,41.47) 4 0.00 Samaritan Hospital 8 1 12.50 1.53 9.07 (0.12,50.45) 6 0.00 St. Peters Hospital 39 0 0.00 0.75 0.00 (0.00,13.82) 33 0.00
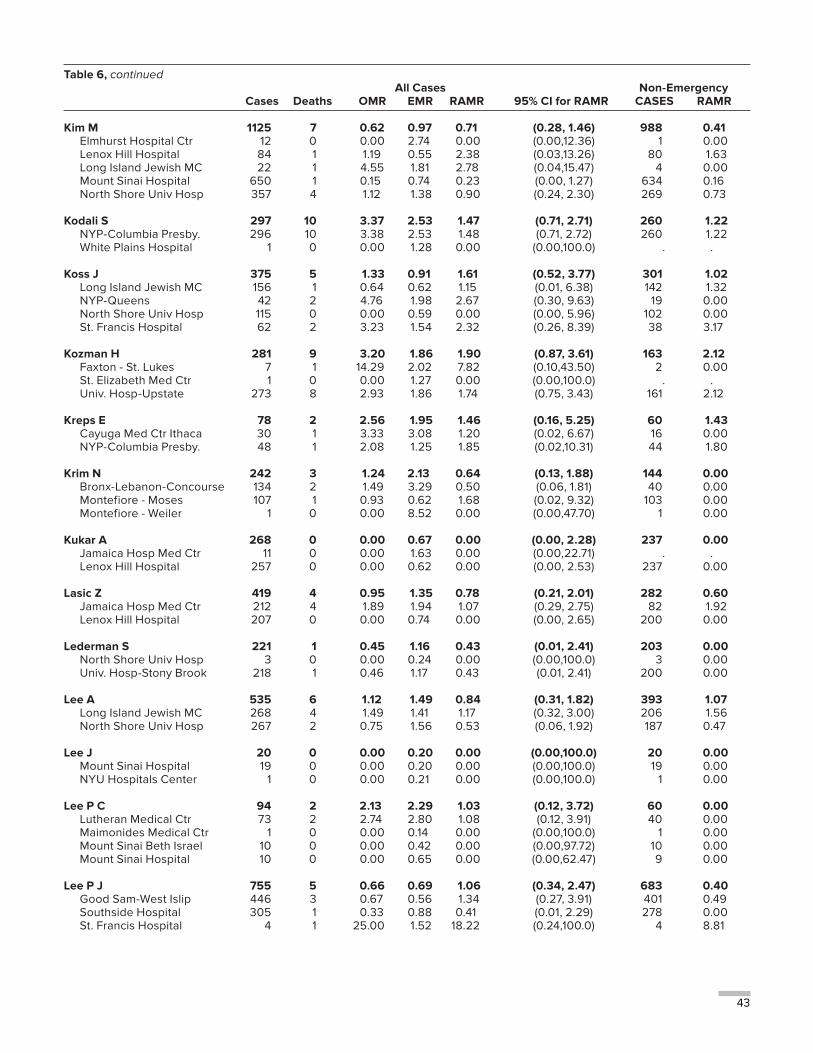
43
Table 6, continued All Cases Non-Emergency Cases Deaths OMR EMR RAMR 95% CI for RAMR CASES RAMR
Kim M 1125 7 0.62 0.97 0.71 (0.28, 1.46) 988 0.41 Elmhurst Hospital Ctr 12 0 0.00 2.74 0.00 (0.00,12.36) 1 0.00 Lenox Hill Hospital 84 1 1.19 0.55 2.38 (0.03,13.26) 80 1.63 Long Island Jewish MC 22 1 4.55 1.81 2.78 (0.04,15.47) 4 0.00 Mount Sinai Hospital 650 1 0.15 0.74 0.23 (0.00, 1.27) 634 0.16 North Shore Univ Hosp 357 4 1.12 1.38 0.90 (0.24, 2.30) 269 0.73
Kodali S 297 10 3.37 2.53 1.47 (0.71, 2.71) 260 1.22 NYP-Columbia Presby. 296 10 3.38 2.53 1.48 (0.71, 2.72) 260 1.22 White Plains Hospital 1 0 0.00 1.28 0.00 (0.00,100.0) . .
Koss J 375 5 1.33 0.91 1.61 (0.52, 3.77) 301 1.02 Long Island Jewish MC 156 1 0.64 0.62 1.15 (0.01, 6.38) 142 1.32 NYP-Queens 42 2 4.76 1.98 2.67 (0.30, 9.63) 19 0.00 North Shore Univ Hosp 115 0 0.00 0.59 0.00 (0.00, 5.96) 102 0.00 St. Francis Hospital 62 2 3.23 1.54 2.32 (0.26, 8.39) 38 3.17
Kozman H 281 9 3.20 1.86 1.90 (0.87, 3.61) 163 2.12 Faxton - St. Lukes 7 1 14.29 2.02 7.82 (0.10,43.50) 2 0.00 St. Elizabeth Med Ctr 1 0 0.00 1.27 0.00 (0.00,100.0) . . Univ. Hosp-Upstate 273 8 2.93 1.86 1.74 (0.75, 3.43) 161 2.12
Kreps E 78 2 2.56 1.95 1.46 (0.16, 5.25) 60 1.43 Cayuga Med Ctr Ithaca 30 1 3.33 3.08 1.20 (0.02, 6.67) 16 0.00 NYP-Columbia Presby. 48 1 2.08 1.25 1.85 (0.02,10.31) 44 1.80
Krim N 242 3 1.24 2.13 0.64 (0.13, 1.88) 144 0.00 Bronx-Lebanon-Concourse 134 2 1.49 3.29 0.50 (0.06, 1.81) 40 0.00 Montefiore - Moses 107 1 0.93 0.62 1.68 (0.02, 9.32) 103 0.00 Montefiore - Weiler 1 0 0.00 8.52 0.00 (0.00,47.70) 1 0.00
Kukar A 268 0 0.00 0.67 0.00 (0.00, 2.28) 237 0.00 Jamaica Hosp Med Ctr 11 0 0.00 1.63 0.00 (0.00,22.71) . . Lenox Hill Hospital 257 0 0.00 0.62 0.00 (0.00, 2.53) 237 0.00
Lasic Z 419 4 0.95 1.35 0.78 (0.21, 2.01) 282 0.60 Jamaica Hosp Med Ctr 212 4 1.89 1.94 1.07 (0.29, 2.75) 82 1.92 Lenox Hill Hospital 207 0 0.00 0.74 0.00 (0.00, 2.65) 200 0.00
Lederman S 221 1 0.45 1.16 0.43 (0.01, 2.41) 203 0.00 North Shore Univ Hosp 3 0 0.00 0.24 0.00 (0.00,100.0) 3 0.00 Univ. Hosp-Stony Brook 218 1 0.46 1.17 0.43 (0.01, 2.41) 200 0.00
Lee A 535 6 1.12 1.49 0.84 (0.31, 1.82) 393 1.07 Long Island Jewish MC 268 4 1.49 1.41 1.17 (0.32, 3.00) 206 1.56 North Shore Univ Hosp 267 2 0.75 1.56 0.53 (0.06, 1.92) 187 0.47
Lee J 20 0 0.00 0.20 0.00 (0.00,100.0) 20 0.00 Mount Sinai Hospital 19 0 0.00 0.20 0.00 (0.00,100.0) 19 0.00 NYU Hospitals Center 1 0 0.00 0.21 0.00 (0.00,100.0) 1 0.00
Lee P C 94 2 2.13 2.29 1.03 (0.12, 3.72) 60 0.00 Lutheran Medical Ctr 73 2 2.74 2.80 1.08 (0.12, 3.91) 40 0.00 Maimonides Medical Ctr 1 0 0.00 0.14 0.00 (0.00,100.0) 1 0.00 Mount Sinai Beth Israel 10 0 0.00 0.42 0.00 (0.00,97.72) 10 0.00 Mount Sinai Hospital 10 0 0.00 0.65 0.00 (0.00,62.47) 9 0.00
Lee P J 755 5 0.66 0.69 1.06 (0.34, 2.47) 683 0.40 Good Sam-West Islip 446 3 0.67 0.56 1.34 (0.27, 3.91) 401 0.49 Southside Hospital 305 1 0.33 0.88 0.41 (0.01, 2.29) 278 0.00 St. Francis Hospital 4 1 25.00 1.52 18.22 (0.24,100.0) 4 8.81
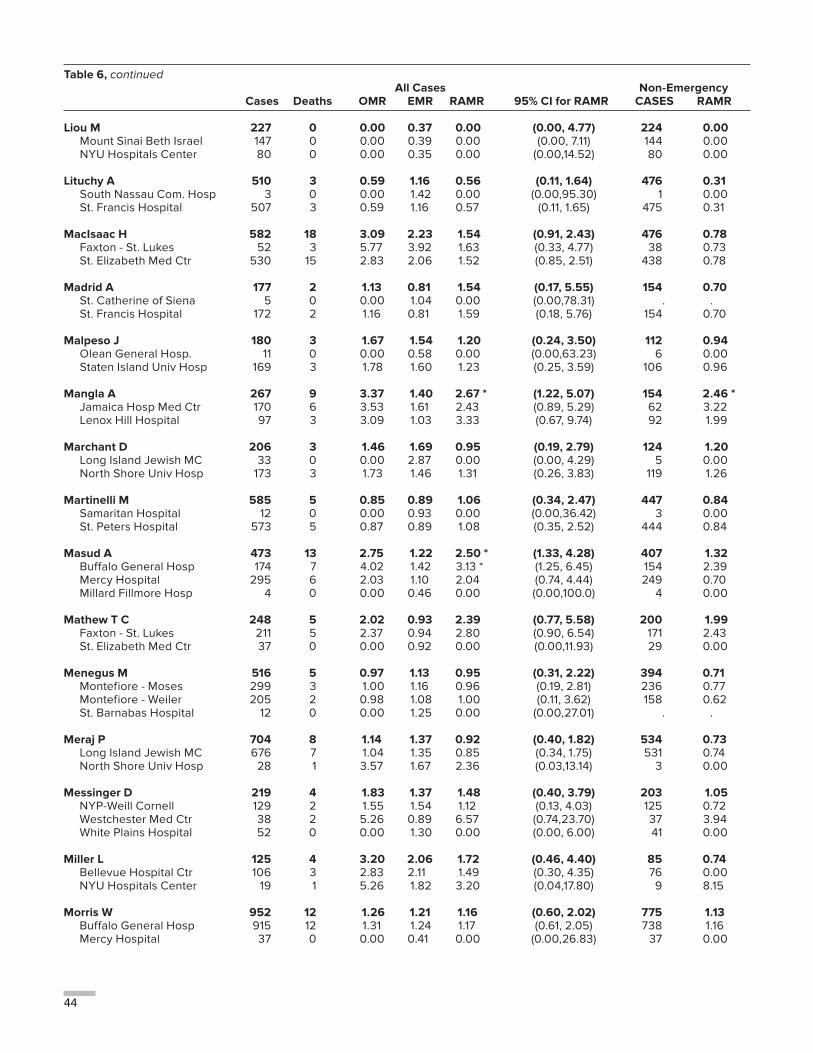
44
Table 6, continued All Cases Non-Emergency Cases Deaths OMR EMR RAMR 95% CI for RAMR CASES RAMR
Liou M 227 0 0.00 0.37 0.00 (0.00, 4.77) 224 0.00 Mount Sinai Beth Israel 147 0 0.00 0.39 0.00 (0.00, 7.11) 144 0.00 NYU Hospitals Center 80 0 0.00 0.35 0.00 (0.00,14.52) 80 0.00
Lituchy A 510 3 0.59 1.16 0.56 (0.11, 1.64) 476 0.31 South Nassau Com. Hosp 3 0 0.00 1.42 0.00 (0.00,95.30) 1 0.00 St. Francis Hospital 507 3 0.59 1.16 0.57 (0.11, 1.65) 475 0.31
MacIsaac H 582 18 3.09 2.23 1.54 (0.91, 2.43) 476 0.78 Faxton - St. Lukes 52 3 5.77 3.92 1.63 (0.33, 4.77) 38 0.73 St. Elizabeth Med Ctr 530 15 2.83 2.06 1.52 (0.85, 2.51) 438 0.78
Madrid A 177 2 1.13 0.81 1.54 (0.17, 5.55) 154 0.70 St. Catherine of Siena 5 0 0.00 1.04 0.00 (0.00,78.31) . . St. Francis Hospital 172 2 1.16 0.81 1.59 (0.18, 5.76) 154 0.70
Malpeso J 180 3 1.67 1.54 1.20 (0.24, 3.50) 112 0.94 Olean General Hosp. 11 0 0.00 0.58 0.00 (0.00,63.23) 6 0.00 Staten Island Univ Hosp 169 3 1.78 1.60 1.23 (0.25, 3.59) 106 0.96
Mangla A 267 9 3.37 1.40 2.67 * (1.22, 5.07) 154 2.46 * Jamaica Hosp Med Ctr 170 6 3.53 1.61 2.43 (0.89, 5.29) 62 3.22 Lenox Hill Hospital 97 3 3.09 1.03 3.33 (0.67, 9.74) 92 1.99
Marchant D 206 3 1.46 1.69 0.95 (0.19, 2.79) 124 1.20 Long Island Jewish MC 33 0 0.00 2.87 0.00 (0.00, 4.29) 5 0.00 North Shore Univ Hosp 173 3 1.73 1.46 1.31 (0.26, 3.83) 119 1.26
Martinelli M 585 5 0.85 0.89 1.06 (0.34, 2.47) 447 0.84 Samaritan Hospital 12 0 0.00 0.93 0.00 (0.00,36.42) 3 0.00 St. Peters Hospital 573 5 0.87 0.89 1.08 (0.35, 2.52) 444 0.84
Masud A 473 13 2.75 1.22 2.50 * (1.33, 4.28) 407 1.32 Buffalo General Hosp 174 7 4.02 1.42 3.13 * (1.25, 6.45) 154 2.39 Mercy Hospital 295 6 2.03 1.10 2.04 (0.74, 4.44) 249 0.70 Millard Fillmore Hosp 4 0 0.00 0.46 0.00 (0.00,100.0) 4 0.00
Mathew T C 248 5 2.02 0.93 2.39 (0.77, 5.58) 200 1.99 Faxton - St. Lukes 211 5 2.37 0.94 2.80 (0.90, 6.54) 171 2.43 St. Elizabeth Med Ctr 37 0 0.00 0.92 0.00 (0.00,11.93) 29 0.00
Menegus M 516 5 0.97 1.13 0.95 (0.31, 2.22) 394 0.71 Montefiore - Moses 299 3 1.00 1.16 0.96 (0.19, 2.81) 236 0.77 Montefiore - Weiler 205 2 0.98 1.08 1.00 (0.11, 3.62) 158 0.62 St. Barnabas Hospital 12 0 0.00 1.25 0.00 (0.00,27.01) . .
Meraj P 704 8 1.14 1.37 0.92 (0.40, 1.82) 534 0.73 Long Island Jewish MC 676 7 1.04 1.35 0.85 (0.34, 1.75) 531 0.74 North Shore Univ Hosp 28 1 3.57 1.67 2.36 (0.03,13.14) 3 0.00
Messinger D 219 4 1.83 1.37 1.48 (0.40, 3.79) 203 1.05 NYP-Weill Cornell 129 2 1.55 1.54 1.12 (0.13, 4.03) 125 0.72 Westchester Med Ctr 38 2 5.26 0.89 6.57 (0.74,23.70) 37 3.94 White Plains Hospital 52 0 0.00 1.30 0.00 (0.00, 6.00) 41 0.00
Miller L 125 4 3.20 2.06 1.72 (0.46, 4.40) 85 0.74 Bellevue Hospital Ctr 106 3 2.83 2.11 1.49 (0.30, 4.35) 76 0.00 NYU Hospitals Center 19 1 5.26 1.82 3.20 (0.04,17.80) 9 8.15
Morris W 952 12 1.26 1.21 1.16 (0.60, 2.02) 775 1.13 Buffalo General Hosp 915 12 1.31 1.24 1.17 (0.61, 2.05) 738 1.16 Mercy Hospital 37 0 0.00 0.41 0.00 (0.00,26.83) 37 0.00
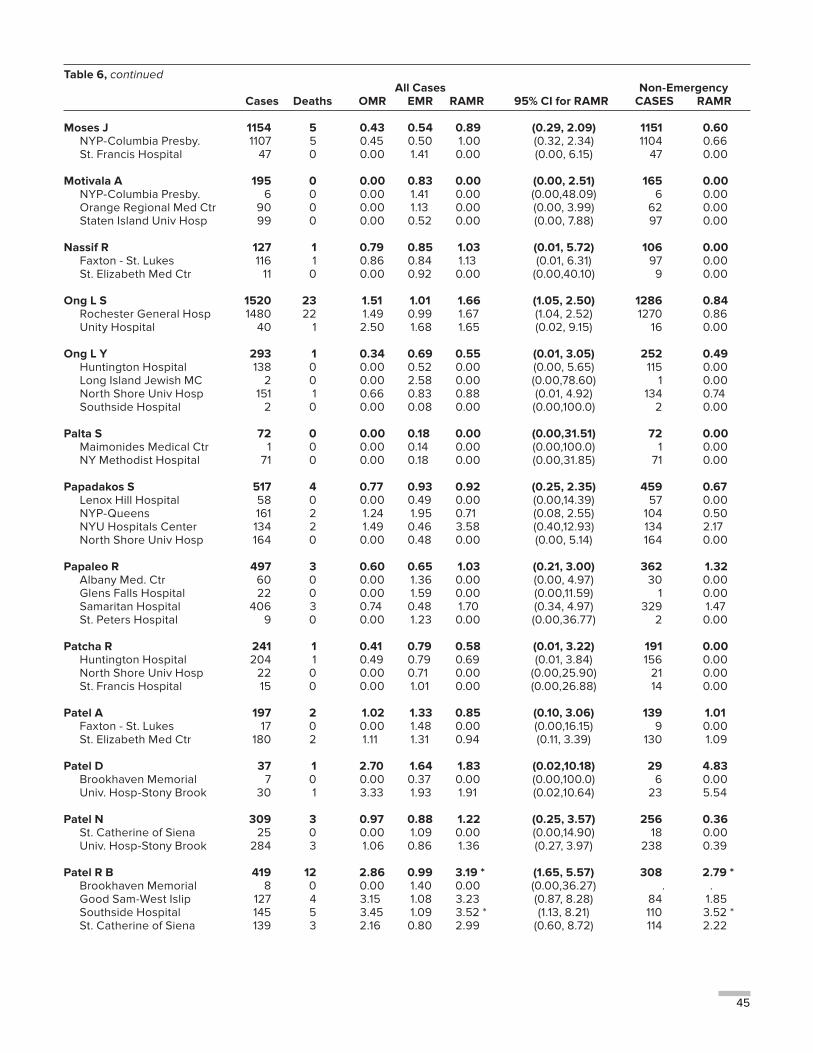
45
Table 6, continued All Cases Non-Emergency Cases Deaths OMR EMR RAMR 95% CI for RAMR CASES RAMR
Moses J 1154 5 0.43 0.54 0.89 (0.29, 2.09) 1151 0.60 NYP-Columbia Presby. 1107 5 0.45 0.50 1.00 (0.32, 2.34) 1104 0.66 St. Francis Hospital 47 0 0.00 1.41 0.00 (0.00, 6.15) 47 0.00
Motivala A 195 0 0.00 0.83 0.00 (0.00, 2.51) 165 0.00 NYP-Columbia Presby. 6 0 0.00 1.41 0.00 (0.00,48.09) 6 0.00 Orange Regional Med Ctr 90 0 0.00 1.13 0.00 (0.00, 3.99) 62 0.00 Staten Island Univ Hosp 99 0 0.00 0.52 0.00 (0.00, 7.88) 97 0.00
Nassif R 127 1 0.79 0.85 1.03 (0.01, 5.72) 106 0.00 Faxton - St. Lukes 116 1 0.86 0.84 1.13 (0.01, 6.31) 97 0.00 St. Elizabeth Med Ctr 11 0 0.00 0.92 0.00 (0.00,40.10) 9 0.00
Ong L S 1520 23 1.51 1.01 1.66 (1.05, 2.50) 1286 0.84 Rochester General Hosp 1480 22 1.49 0.99 1.67 (1.04, 2.52) 1270 0.86 Unity Hospital 40 1 2.50 1.68 1.65 (0.02, 9.15) 16 0.00
Ong L Y 293 1 0.34 0.69 0.55 (0.01, 3.05) 252 0.49 Huntington Hospital 138 0 0.00 0.52 0.00 (0.00, 5.65) 115 0.00 Long Island Jewish MC 2 0 0.00 2.58 0.00 (0.00,78.60) 1 0.00 North Shore Univ Hosp 151 1 0.66 0.83 0.88 (0.01, 4.92) 134 0.74 Southside Hospital 2 0 0.00 0.08 0.00 (0.00,100.0) 2 0.00
Palta S 72 0 0.00 0.18 0.00 (0.00,31.51) 72 0.00 Maimonides Medical Ctr 1 0 0.00 0.14 0.00 (0.00,100.0) 1 0.00 NY Methodist Hospital 71 0 0.00 0.18 0.00 (0.00,31.85) 71 0.00
Papadakos S 517 4 0.77 0.93 0.92 (0.25, 2.35) 459 0.67 Lenox Hill Hospital 58 0 0.00 0.49 0.00 (0.00,14.39) 57 0.00 NYP-Queens 161 2 1.24 1.95 0.71 (0.08, 2.55) 104 0.50 NYU Hospitals Center 134 2 1.49 0.46 3.58 (0.40,12.93) 134 2.17 North Shore Univ Hosp 164 0 0.00 0.48 0.00 (0.00, 5.14) 164 0.00
Papaleo R 497 3 0.60 0.65 1.03 (0.21, 3.00) 362 1.32 Albany Med. Ctr 60 0 0.00 1.36 0.00 (0.00, 4.97) 30 0.00 Glens Falls Hospital 22 0 0.00 1.59 0.00 (0.00,11.59) 1 0.00 Samaritan Hospital 406 3 0.74 0.48 1.70 (0.34, 4.97) 329 1.47 St. Peters Hospital 9 0 0.00 1.23 0.00 (0.00,36.77) 2 0.00
Patcha R 241 1 0.41 0.79 0.58 (0.01, 3.22) 191 0.00 Huntington Hospital 204 1 0.49 0.79 0.69 (0.01, 3.84) 156 0.00 North Shore Univ Hosp 22 0 0.00 0.71 0.00 (0.00,25.90) 21 0.00 St. Francis Hospital 15 0 0.00 1.01 0.00 (0.00,26.88) 14 0.00
Patel A 197 2 1.02 1.33 0.85 (0.10, 3.06) 139 1.01 Faxton - St. Lukes 17 0 0.00 1.48 0.00 (0.00,16.15) 9 0.00 St. Elizabeth Med Ctr 180 2 1.11 1.31 0.94 (0.11, 3.39) 130 1.09
Patel D 37 1 2.70 1.64 1.83 (0.02,10.18) 29 4.83 Brookhaven Memorial 7 0 0.00 0.37 0.00 (0.00,100.0) 6 0.00 Univ. Hosp-Stony Brook 30 1 3.33 1.93 1.91 (0.02,10.64) 23 5.54
Patel N 309 3 0.97 0.88 1.22 (0.25, 3.57) 256 0.36 St. Catherine of Siena 25 0 0.00 1.09 0.00 (0.00,14.90) 18 0.00 Univ. Hosp-Stony Brook 284 3 1.06 0.86 1.36 (0.27, 3.97) 238 0.39
Patel R B 419 12 2.86 0.99 3.19 * (1.65, 5.57) 308 2.79 * Brookhaven Memorial 8 0 0.00 1.40 0.00 (0.00,36.27) . . Good Sam-West Islip 127 4 3.15 1.08 3.23 (0.87, 8.28) 84 1.85 Southside Hospital 145 5 3.45 1.09 3.52 * (1.13, 8.21) 110 3.52 * St. Catherine of Siena 139 3 2.16 0.80 2.99 (0.60, 8.72) 114 2.22
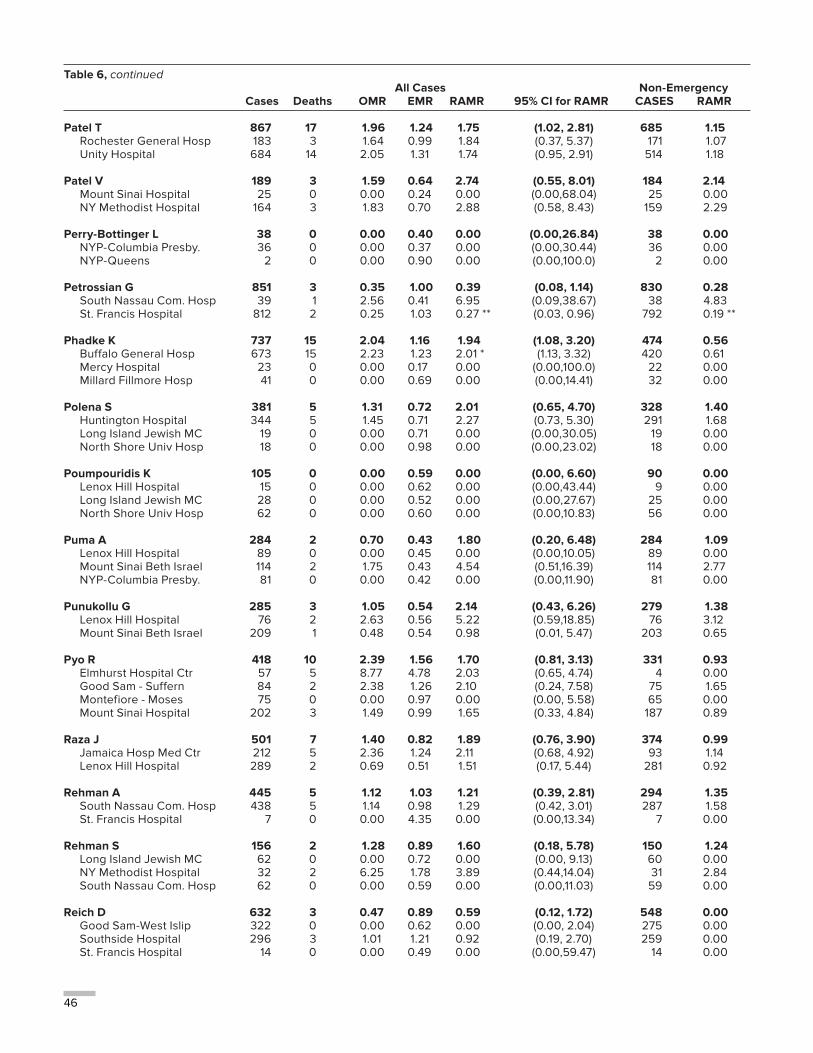
46
Table 6, continued All Cases Non-Emergency Cases Deaths OMR EMR RAMR 95% CI for RAMR CASES RAMR
Patel T 867 17 1.96 1.24 1.75 (1.02, 2.81) 685 1.15 Rochester General Hosp 183 3 1.64 0.99 1.84 (0.37, 5.37) 171 1.07 Unity Hospital 684 14 2.05 1.31 1.74 (0.95, 2.91) 514 1.18
Patel V 189 3 1.59 0.64 2.74 (0.55, 8.01) 184 2.14 Mount Sinai Hospital 25 0 0.00 0.24 0.00 (0.00,68.04) 25 0.00 NY Methodist Hospital 164 3 1.83 0.70 2.88 (0.58, 8.43) 159 2.29
Perry-Bottinger L 38 0 0.00 0.40 0.00 (0.00,26.84) 38 0.00 NYP-Columbia Presby. 36 0 0.00 0.37 0.00 (0.00,30.44) 36 0.00 NYP-Queens 2 0 0.00 0.90 0.00 (0.00,100.0) 2 0.00
Petrossian G 851 3 0.35 1.00 0.39 (0.08, 1.14) 830 0.28 South Nassau Com. Hosp 39 1 2.56 0.41 6.95 (0.09,38.67) 38 4.83 St. Francis Hospital 812 2 0.25 1.03 0.27 ** (0.03, 0.96) 792 0.19 **
Phadke K 737 15 2.04 1.16 1.94 (1.08, 3.20) 474 0.56 Buffalo General Hosp 673 15 2.23 1.23 2.01 * (1.13, 3.32) 420 0.61 Mercy Hospital 23 0 0.00 0.17 0.00 (0.00,100.0) 22 0.00 Millard Fillmore Hosp 41 0 0.00 0.69 0.00 (0.00,14.41) 32 0.00
Polena S 381 5 1.31 0.72 2.01 (0.65, 4.70) 328 1.40 Huntington Hospital 344 5 1.45 0.71 2.27 (0.73, 5.30) 291 1.68 Long Island Jewish MC 19 0 0.00 0.71 0.00 (0.00,30.05) 19 0.00 North Shore Univ Hosp 18 0 0.00 0.98 0.00 (0.00,23.02) 18 0.00
Poumpouridis K 105 0 0.00 0.59 0.00 (0.00, 6.60) 90 0.00 Lenox Hill Hospital 15 0 0.00 0.62 0.00 (0.00,43.44) 9 0.00 Long Island Jewish MC 28 0 0.00 0.52 0.00 (0.00,27.67) 25 0.00 North Shore Univ Hosp 62 0 0.00 0.60 0.00 (0.00,10.83) 56 0.00
Puma A 284 2 0.70 0.43 1.80 (0.20, 6.48) 284 1.09 Lenox Hill Hospital 89 0 0.00 0.45 0.00 (0.00,10.05) 89 0.00 Mount Sinai Beth Israel 114 2 1.75 0.43 4.54 (0.51,16.39) 114 2.77 NYP-Columbia Presby. 81 0 0.00 0.42 0.00 (0.00,11.90) 81 0.00
Punukollu G 285 3 1.05 0.54 2.14 (0.43, 6.26) 279 1.38 Lenox Hill Hospital 76 2 2.63 0.56 5.22 (0.59,18.85) 76 3.12 Mount Sinai Beth Israel 209 1 0.48 0.54 0.98 (0.01, 5.47) 203 0.65
Pyo R 418 10 2.39 1.56 1.70 (0.81, 3.13) 331 0.93 Elmhurst Hospital Ctr 57 5 8.77 4.78 2.03 (0.65, 4.74) 4 0.00 Good Sam - Suffern 84 2 2.38 1.26 2.10 (0.24, 7.58) 75 1.65 Montefiore - Moses 75 0 0.00 0.97 0.00 (0.00, 5.58) 65 0.00 Mount Sinai Hospital 202 3 1.49 0.99 1.65 (0.33, 4.84) 187 0.89
Raza J 501 7 1.40 0.82 1.89 (0.76, 3.90) 374 0.99 Jamaica Hosp Med Ctr 212 5 2.36 1.24 2.11 (0.68, 4.92) 93 1.14 Lenox Hill Hospital 289 2 0.69 0.51 1.51 (0.17, 5.44) 281 0.92
Rehman A 445 5 1.12 1.03 1.21 (0.39, 2.81) 294 1.35 South Nassau Com. Hosp 438 5 1.14 0.98 1.29 (0.42, 3.01) 287 1.58 St. Francis Hospital 7 0 0.00 4.35 0.00 (0.00,13.34) 7 0.00
Rehman S 156 2 1.28 0.89 1.60 (0.18, 5.78) 150 1.24 Long Island Jewish MC 62 0 0.00 0.72 0.00 (0.00, 9.13) 60 0.00 NY Methodist Hospital 32 2 6.25 1.78 3.89 (0.44,14.04) 31 2.84 South Nassau Com. Hosp 62 0 0.00 0.59 0.00 (0.00,11.03) 59 0.00
Reich D 632 3 0.47 0.89 0.59 (0.12, 1.72) 548 0.00 Good Sam-West Islip 322 0 0.00 0.62 0.00 (0.00, 2.04) 275 0.00 Southside Hospital 296 3 1.01 1.21 0.92 (0.19, 2.70) 259 0.00 St. Francis Hospital 14 0 0.00 0.49 0.00 (0.00,59.47) 14 0.00
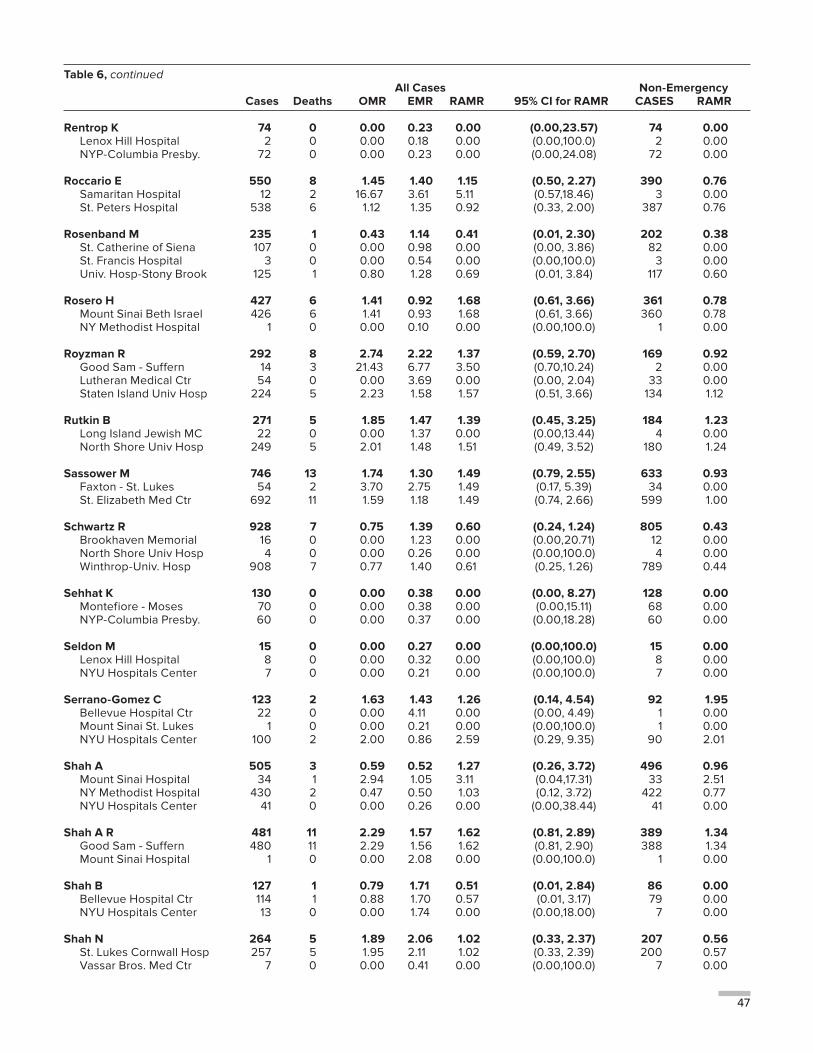
47
Table 6, continued All Cases Non-Emergency Cases Deaths OMR EMR RAMR 95% CI for RAMR CASES RAMR
Rentrop K 74 0 0.00 0.23 0.00 (0.00,23.57) 74 0.00 Lenox Hill Hospital 2 0 0.00 0.18 0.00 (0.00,100.0) 2 0.00 NYP-Columbia Presby. 72 0 0.00 0.23 0.00 (0.00,24.08) 72 0.00
Roccario E 550 8 1.45 1.40 1.15 (0.50, 2.27) 390 0.76 Samaritan Hospital 12 2 16.67 3.61 5.11 (0.57,18.46) 3 0.00 St. Peters Hospital 538 6 1.12 1.35 0.92 (0.33, 2.00) 387 0.76
Rosenband M 235 1 0.43 1.14 0.41 (0.01, 2.30) 202 0.38 St. Catherine of Siena 107 0 0.00 0.98 0.00 (0.00, 3.86) 82 0.00 St. Francis Hospital 3 0 0.00 0.54 0.00 (0.00,100.0) 3 0.00 Univ. Hosp-Stony Brook 125 1 0.80 1.28 0.69 (0.01, 3.84) 117 0.60
Rosero H 427 6 1.41 0.92 1.68 (0.61, 3.66) 361 0.78 Mount Sinai Beth Israel 426 6 1.41 0.93 1.68 (0.61, 3.66) 360 0.78 NY Methodist Hospital 1 0 0.00 0.10 0.00 (0.00,100.0) 1 0.00
Royzman R 292 8 2.74 2.22 1.37 (0.59, 2.70) 169 0.92 Good Sam - Suffern 14 3 21.43 6.77 3.50 (0.70,10.24) 2 0.00 Lutheran Medical Ctr 54 0 0.00 3.69 0.00 (0.00, 2.04) 33 0.00 Staten Island Univ Hosp 224 5 2.23 1.58 1.57 (0.51, 3.66) 134 1.12
Rutkin B 271 5 1.85 1.47 1.39 (0.45, 3.25) 184 1.23 Long Island Jewish MC 22 0 0.00 1.37 0.00 (0.00,13.44) 4 0.00 North Shore Univ Hosp 249 5 2.01 1.48 1.51 (0.49, 3.52) 180 1.24
Sassower M 746 13 1.74 1.30 1.49 (0.79, 2.55) 633 0.93 Faxton - St. Lukes 54 2 3.70 2.75 1.49 (0.17, 5.39) 34 0.00 St. Elizabeth Med Ctr 692 11 1.59 1.18 1.49 (0.74, 2.66) 599 1.00
Schwartz R 928 7 0.75 1.39 0.60 (0.24, 1.24) 805 0.43 Brookhaven Memorial 16 0 0.00 1.23 0.00 (0.00,20.71) 12 0.00 North Shore Univ Hosp 4 0 0.00 0.26 0.00 (0.00,100.0) 4 0.00 Winthrop-Univ. Hosp 908 7 0.77 1.40 0.61 (0.25, 1.26) 789 0.44
Sehhat K 130 0 0.00 0.38 0.00 (0.00, 8.27) 128 0.00 Montefiore - Moses 70 0 0.00 0.38 0.00 (0.00,15.11) 68 0.00 NYP-Columbia Presby. 60 0 0.00 0.37 0.00 (0.00,18.28) 60 0.00
Seldon M 15 0 0.00 0.27 0.00 (0.00,100.0) 15 0.00 Lenox Hill Hospital 8 0 0.00 0.32 0.00 (0.00,100.0) 8 0.00 NYU Hospitals Center 7 0 0.00 0.21 0.00 (0.00,100.0) 7 0.00
Serrano-Gomez C 123 2 1.63 1.43 1.26 (0.14, 4.54) 92 1.95 Bellevue Hospital Ctr 22 0 0.00 4.11 0.00 (0.00, 4.49) 1 0.00 Mount Sinai St. Lukes 1 0 0.00 0.21 0.00 (0.00,100.0) 1 0.00 NYU Hospitals Center 100 2 2.00 0.86 2.59 (0.29, 9.35) 90 2.01
Shah A 505 3 0.59 0.52 1.27 (0.26, 3.72) 496 0.96 Mount Sinai Hospital 34 1 2.94 1.05 3.11 (0.04,17.31) 33 2.51 NY Methodist Hospital 430 2 0.47 0.50 1.03 (0.12, 3.72) 422 0.77 NYU Hospitals Center 41 0 0.00 0.26 0.00 (0.00,38.44) 41 0.00
Shah A R 481 11 2.29 1.57 1.62 (0.81, 2.89) 389 1.34 Good Sam - Suffern 480 11 2.29 1.56 1.62 (0.81, 2.90) 388 1.34 Mount Sinai Hospital 1 0 0.00 2.08 0.00 (0.00,100.0) 1 0.00
Shah B 127 1 0.79 1.71 0.51 (0.01, 2.84) 86 0.00 Bellevue Hospital Ctr 114 1 0.88 1.70 0.57 (0.01, 3.17) 79 0.00 NYU Hospitals Center 13 0 0.00 1.74 0.00 (0.00,18.00) 7 0.00
Shah N 264 5 1.89 2.06 1.02 (0.33, 2.37) 207 0.56 St. Lukes Cornwall Hosp 257 5 1.95 2.11 1.02 (0.33, 2.39) 200 0.57 Vassar Bros. Med Ctr 7 0 0.00 0.41 0.00 (0.00,100.0) 7 0.00
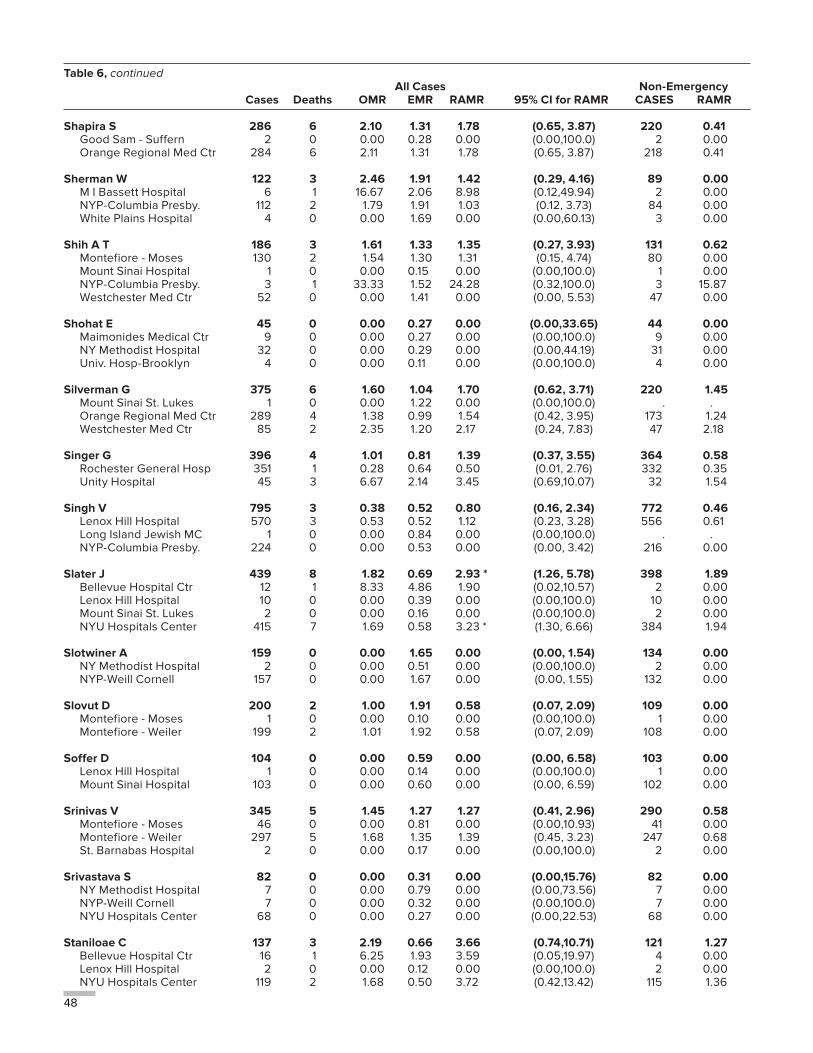
48
Table 6, continued All Cases Non-Emergency Cases Deaths OMR EMR RAMR 95% CI for RAMR CASES RAMR
Shapira S 286 6 2.10 1.31 1.78 (0.65, 3.87) 220 0.41 Good Sam - Suffern 2 0 0.00 0.28 0.00 (0.00,100.0) 2 0.00 Orange Regional Med Ctr 284 6 2.11 1.31 1.78 (0.65, 3.87) 218 0.41
Sherman W 122 3 2.46 1.91 1.42 (0.29, 4.16) 89 0.00 M I Bassett Hospital 6 1 16.67 2.06 8.98 (0.12,49.94) 2 0.00 NYP-Columbia Presby. 112 2 1.79 1.91 1.03 (0.12, 3.73) 84 0.00 White Plains Hospital 4 0 0.00 1.69 0.00 (0.00,60.13) 3 0.00
Shih A T 186 3 1.61 1.33 1.35 (0.27, 3.93) 131 0.62 Montefiore - Moses 130 2 1.54 1.30 1.31 (0.15, 4.74) 80 0.00 Mount Sinai Hospital 1 0 0.00 0.15 0.00 (0.00,100.0) 1 0.00 NYP-Columbia Presby. 3 1 33.33 1.52 24.28 (0.32,100.0) 3 15.87 Westchester Med Ctr 52 0 0.00 1.41 0.00 (0.00, 5.53) 47 0.00
Shohat E 45 0 0.00 0.27 0.00 (0.00,33.65) 44 0.00 Maimonides Medical Ctr 9 0 0.00 0.27 0.00 (0.00,100.0) 9 0.00 NY Methodist Hospital 32 0 0.00 0.29 0.00 (0.00,44.19) 31 0.00 Univ. Hosp-Brooklyn 4 0 0.00 0.11 0.00 (0.00,100.0) 4 0.00
Silverman G 375 6 1.60 1.04 1.70 (0.62, 3.71) 220 1.45 Mount Sinai St. Lukes 1 0 0.00 1.22 0.00 (0.00,100.0) . . Orange Regional Med Ctr 289 4 1.38 0.99 1.54 (0.42, 3.95) 173 1.24 Westchester Med Ctr 85 2 2.35 1.20 2.17 (0.24, 7.83) 47 2.18
Singer G 396 4 1.01 0.81 1.39 (0.37, 3.55) 364 0.58 Rochester General Hosp 351 1 0.28 0.64 0.50 (0.01, 2.76) 332 0.35 Unity Hospital 45 3 6.67 2.14 3.45 (0.69,10.07) 32 1.54
Singh V 795 3 0.38 0.52 0.80 (0.16, 2.34) 772 0.46 Lenox Hill Hospital 570 3 0.53 0.52 1.12 (0.23, 3.28) 556 0.61 Long Island Jewish MC 1 0 0.00 0.84 0.00 (0.00,100.0) . . NYP-Columbia Presby. 224 0 0.00 0.53 0.00 (0.00, 3.42) 216 0.00
Slater J 439 8 1.82 0.69 2.93 * (1.26, 5.78) 398 1.89 Bellevue Hospital Ctr 12 1 8.33 4.86 1.90 (0.02,10.57) 2 0.00 Lenox Hill Hospital 10 0 0.00 0.39 0.00 (0.00,100.0) 10 0.00 Mount Sinai St. Lukes 2 0 0.00 0.16 0.00 (0.00,100.0) 2 0.00 NYU Hospitals Center 415 7 1.69 0.58 3.23 * (1.30, 6.66) 384 1.94
Slotwiner A 159 0 0.00 1.65 0.00 (0.00, 1.54) 134 0.00 NY Methodist Hospital 2 0 0.00 0.51 0.00 (0.00,100.0) 2 0.00 NYP-Weill Cornell 157 0 0.00 1.67 0.00 (0.00, 1.55) 132 0.00
Slovut D 200 2 1.00 1.91 0.58 (0.07, 2.09) 109 0.00 Montefiore - Moses 1 0 0.00 0.10 0.00 (0.00,100.0) 1 0.00 Montefiore - Weiler 199 2 1.01 1.92 0.58 (0.07, 2.09) 108 0.00
Soffer D 104 0 0.00 0.59 0.00 (0.00, 6.58) 103 0.00 Lenox Hill Hospital 1 0 0.00 0.14 0.00 (0.00,100.0) 1 0.00 Mount Sinai Hospital 103 0 0.00 0.60 0.00 (0.00, 6.59) 102 0.00
Srinivas V 345 5 1.45 1.27 1.27 (0.41, 2.96) 290 0.58 Montefiore - Moses 46 0 0.00 0.81 0.00 (0.00,10.93) 41 0.00 Montefiore - Weiler 297 5 1.68 1.35 1.39 (0.45, 3.23) 247 0.68 St. Barnabas Hospital 2 0 0.00 0.17 0.00 (0.00,100.0) 2 0.00
Srivastava S 82 0 0.00 0.31 0.00 (0.00,15.76) 82 0.00 NY Methodist Hospital 7 0 0.00 0.79 0.00 (0.00,73.56) 7 0.00 NYP-Weill Cornell 7 0 0.00 0.32 0.00 (0.00,100.0) 7 0.00 NYU Hospitals Center 68 0 0.00 0.27 0.00 (0.00,22.53) 68 0.00
Staniloae C 137 3 2.19 0.66 3.66 (0.74,10.71) 121 1.27 Bellevue Hospital Ctr 16 1 6.25 1.93 3.59 (0.05,19.97) 4 0.00 Lenox Hill Hospital 2 0 0.00 0.12 0.00 (0.00,100.0) 2 0.00 NYU Hospitals Center 119 2 1.68 0.50 3.72 (0.42,13.42) 115 1.36
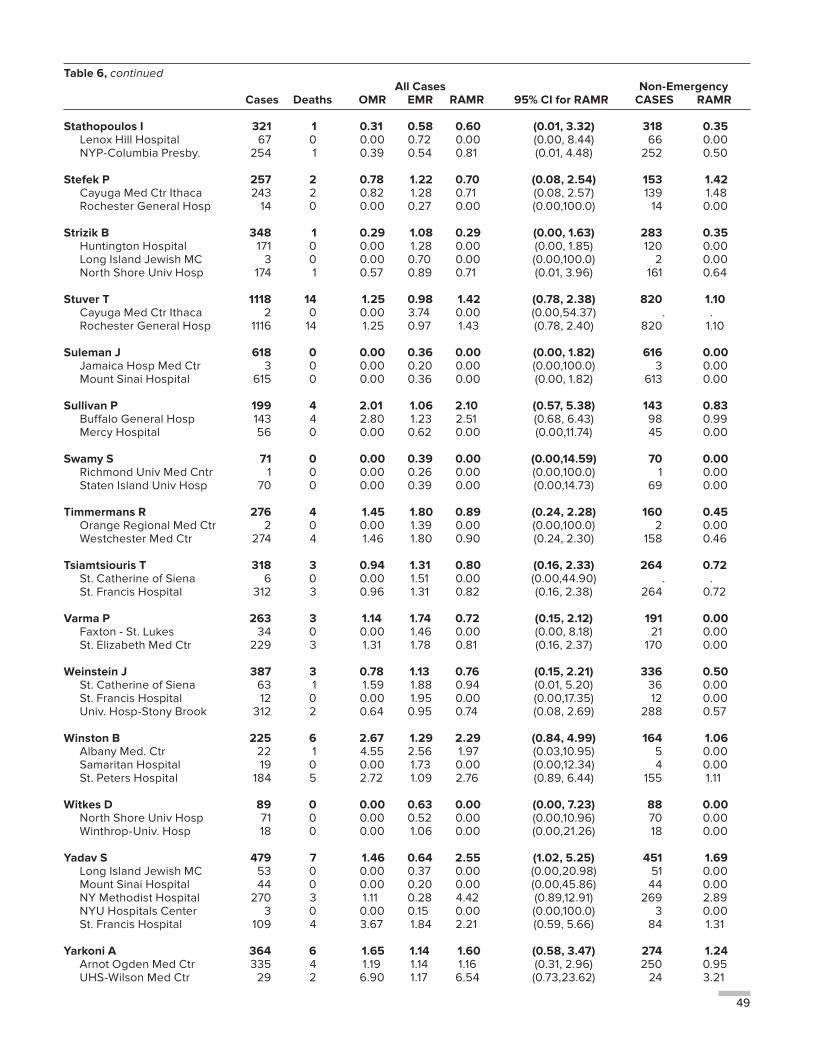
49
Table 6, continued All Cases Non-Emergency Cases Deaths OMR EMR RAMR 95% CI for RAMR CASES RAMR
Stathopoulos I 321 1 0.31 0.58 0.60 (0.01, 3.32) 318 0.35 Lenox Hill Hospital 67 0 0.00 0.72 0.00 (0.00, 8.44) 66 0.00 NYP-Columbia Presby. 254 1 0.39 0.54 0.81 (0.01, 4.48) 252 0.50
Stefek P 257 2 0.78 1.22 0.70 (0.08, 2.54) 153 1.42 Cayuga Med Ctr Ithaca 243 2 0.82 1.28 0.71 (0.08, 2.57) 139 1.48 Rochester General Hosp 14 0 0.00 0.27 0.00 (0.00,100.0) 14 0.00
Strizik B 348 1 0.29 1.08 0.29 (0.00, 1.63) 283 0.35 Huntington Hospital 171 0 0.00 1.28 0.00 (0.00, 1.85) 120 0.00 Long Island Jewish MC 3 0 0.00 0.70 0.00 (0.00,100.0) 2 0.00 North Shore Univ Hosp 174 1 0.57 0.89 0.71 (0.01, 3.96) 161 0.64
Stuver T 1118 14 1.25 0.98 1.42 (0.78, 2.38) 820 1.10 Cayuga Med Ctr Ithaca 2 0 0.00 3.74 0.00 (0.00,54.37) . . Rochester General Hosp 1116 14 1.25 0.97 1.43 (0.78, 2.40) 820 1.10
Suleman J 618 0 0.00 0.36 0.00 (0.00, 1.82) 616 0.00 Jamaica Hosp Med Ctr 3 0 0.00 0.20 0.00 (0.00,100.0) 3 0.00 Mount Sinai Hospital 615 0 0.00 0.36 0.00 (0.00, 1.82) 613 0.00
Sullivan P 199 4 2.01 1.06 2.10 (0.57, 5.38) 143 0.83 Buffalo General Hosp 143 4 2.80 1.23 2.51 (0.68, 6.43) 98 0.99 Mercy Hospital 56 0 0.00 0.62 0.00 (0.00,11.74) 45 0.00
Swamy S 71 0 0.00 0.39 0.00 (0.00,14.59) 70 0.00 Richmond Univ Med Cntr 1 0 0.00 0.26 0.00 (0.00,100.0) 1 0.00 Staten Island Univ Hosp 70 0 0.00 0.39 0.00 (0.00,14.73) 69 0.00
Timmermans R 276 4 1.45 1.80 0.89 (0.24, 2.28) 160 0.45 Orange Regional Med Ctr 2 0 0.00 1.39 0.00 (0.00,100.0) 2 0.00 Westchester Med Ctr 274 4 1.46 1.80 0.90 (0.24, 2.30) 158 0.46
Tsiamtsiouris T 318 3 0.94 1.31 0.80 (0.16, 2.33) 264 0.72 St. Catherine of Siena 6 0 0.00 1.51 0.00 (0.00,44.90) . . St. Francis Hospital 312 3 0.96 1.31 0.82 (0.16, 2.38) 264 0.72
Varma P 263 3 1.14 1.74 0.72 (0.15, 2.12) 191 0.00 Faxton - St. Lukes 34 0 0.00 1.46 0.00 (0.00, 8.18) 21 0.00 St. Elizabeth Med Ctr 229 3 1.31 1.78 0.81 (0.16, 2.37) 170 0.00
Weinstein J 387 3 0.78 1.13 0.76 (0.15, 2.21) 336 0.50 St. Catherine of Siena 63 1 1.59 1.88 0.94 (0.01, 5.20) 36 0.00 St. Francis Hospital 12 0 0.00 1.95 0.00 (0.00,17.35) 12 0.00 Univ. Hosp-Stony Brook 312 2 0.64 0.95 0.74 (0.08, 2.69) 288 0.57
Winston B 225 6 2.67 1.29 2.29 (0.84, 4.99) 164 1.06 Albany Med. Ctr 22 1 4.55 2.56 1.97 (0.03,10.95) 5 0.00 Samaritan Hospital 19 0 0.00 1.73 0.00 (0.00,12.34) 4 0.00 St. Peters Hospital 184 5 2.72 1.09 2.76 (0.89, 6.44) 155 1.11
Witkes D 89 0 0.00 0.63 0.00 (0.00, 7.23) 88 0.00 North Shore Univ Hosp 71 0 0.00 0.52 0.00 (0.00,10.96) 70 0.00 Winthrop-Univ. Hosp 18 0 0.00 1.06 0.00 (0.00,21.26) 18 0.00
Yadav S 479 7 1.46 0.64 2.55 (1.02, 5.25) 451 1.69 Long Island Jewish MC 53 0 0.00 0.37 0.00 (0.00,20.98) 51 0.00 Mount Sinai Hospital 44 0 0.00 0.20 0.00 (0.00,45.86) 44 0.00 NY Methodist Hospital 270 3 1.11 0.28 4.42 (0.89,12.91) 269 2.89 NYU Hospitals Center 3 0 0.00 0.15 0.00 (0.00,100.0) 3 0.00 St. Francis Hospital 109 4 3.67 1.84 2.21 (0.59, 5.66) 84 1.31
Yarkoni A 364 6 1.65 1.14 1.60 (0.58, 3.47) 274 1.24 Arnot Ogden Med Ctr 335 4 1.19 1.14 1.16 (0.31, 2.96) 250 0.95 UHS-Wilson Med Ctr 29 2 6.90 1.17 6.54 (0.73,23.62) 24 3.21
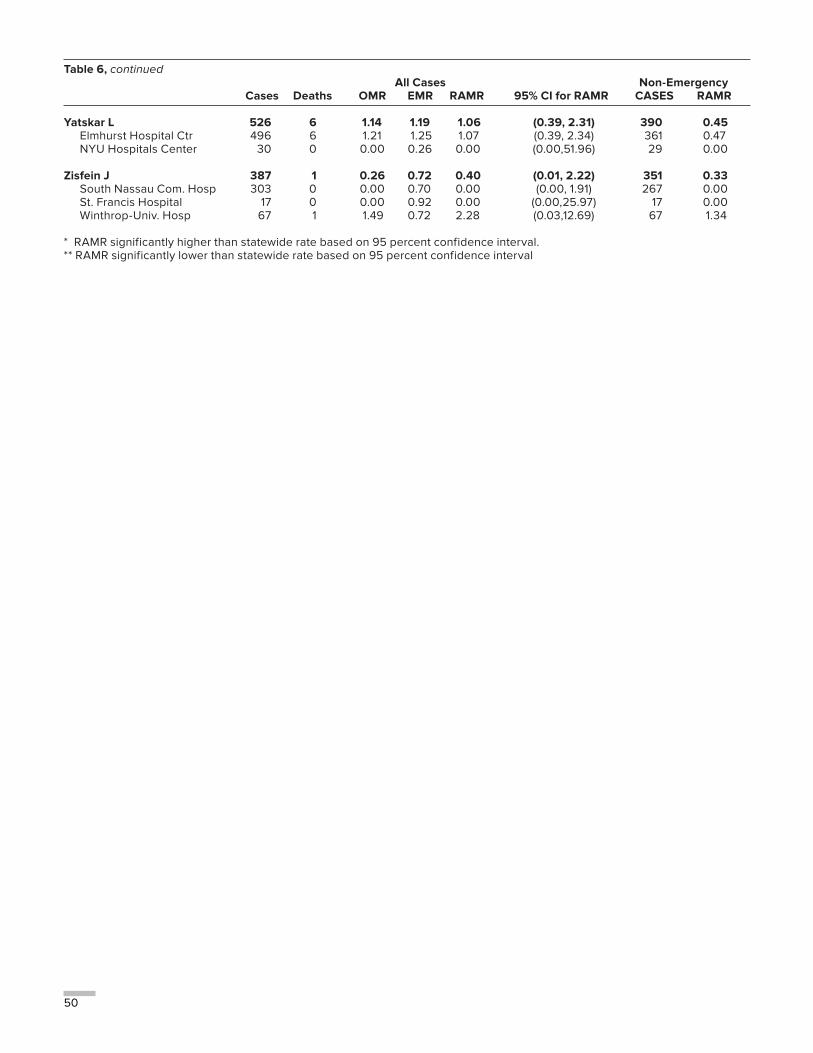
50
Table 6, continued All Cases Non-Emergency Cases Deaths OMR EMR RAMR 95% CI for RAMR CASES RAMR
Yatskar L 526 6 1.14 1.19 1.06 (0.39, 2.31) 390 0.45 Elmhurst Hospital Ctr 496 6 1.21 1.25 1.07 (0.39, 2.34) 361 0.47 NYU Hospitals Center 30 0 0.00 0.26 0.00 (0.00,51.96) 29 0.00
Zisfein J 387 1 0.26 0.72 0.40 (0.01, 2.22) 351 0.33 South Nassau Com. Hosp 303 0 0.00 0.70 0.00 (0.00, 1.91) 267 0.00 St. Francis Hospital 17 0 0.00 0.92 0.00 (0.00,25.97) 17 0.00 Winthrop-Univ. Hosp 67 1 1.49 0.72 2.28 (0.03,12.69) 67 1.34
* RAMR significantly higher than statewide rate based on 95 percent confidence interval.** RAMR significantly lower than statewide rate based on 95 percent confidence interval
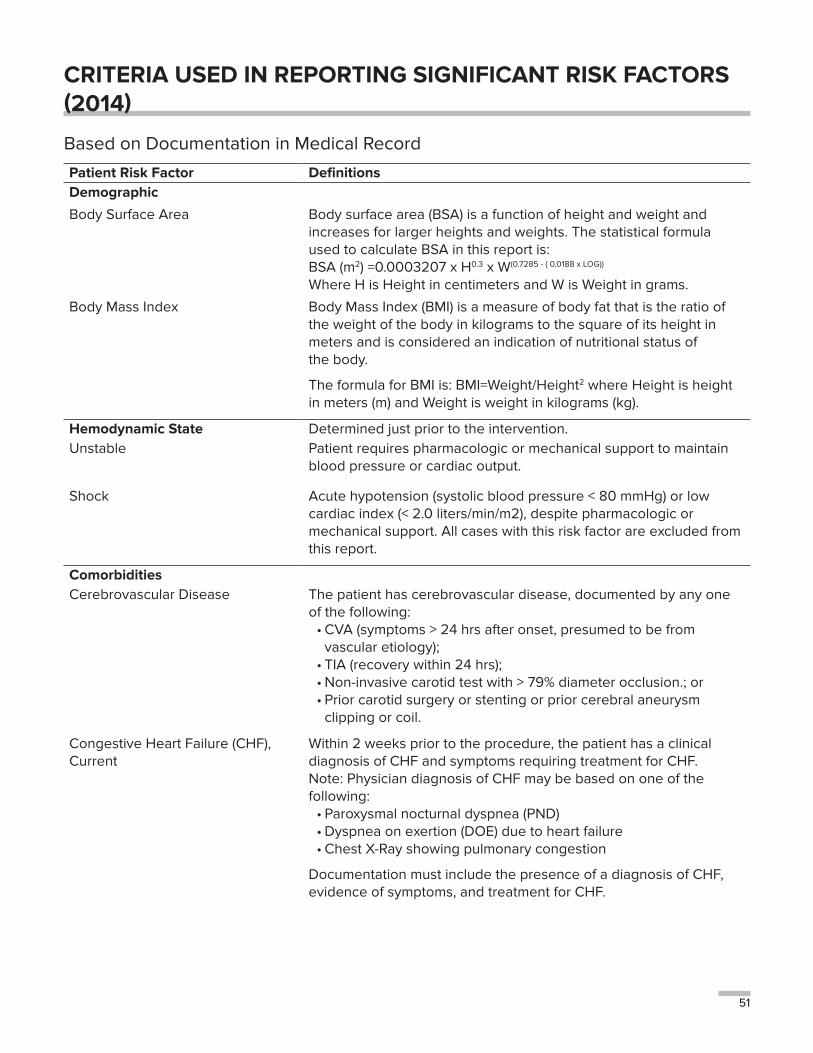
51
CRITERIA USED IN REPORTING SIGNIFICANT RISK FACTORS (2014)
Based on Documentation in Medical Record
Patient Risk Factor DefinitionsDemographic
Body Surface Area Body surface area (BSA) is a function of height and weight and increases for larger heights and weights. The statistical formula used to calculate BSA in this report is: BSA (m2) =0.0003207 x H0.3 x W(0.7285 - ( 0.0188 x LOG))
Where H is Height in centimeters and W is Weight in grams.
Body Mass Index Body Mass Index (BMI) is a measure of body fat that is the ratio of the weight of the body in kilograms to the square of its height in meters and is considered an indication of nutritional status of the body.
The formula for BMI is: BMI=Weight/Height2 where Height is height in meters (m) and Weight is weight in kilograms (kg).
Hemodynamic State Determined just prior to the intervention.Unstable Patient requires pharmacologic or mechanical support to maintain
blood pressure or cardiac output.
Shock Acute hypotension (systolic blood pressure < 80 mmHg) or low cardiac index (< 2.0 liters/min/m2), despite pharmacologic or mechanical support. All cases with this risk factor are excluded from this report.
ComorbiditiesCerebrovascular Disease The patient has cerebrovascular disease, documented by any one
of the following:• CVA (symptoms > 24 hrs after onset, presumed to be from
vascular etiology); • TIA (recovery within 24 hrs); • Non-invasive carotid test with > 79% diameter occlusion.; or • Prior carotid surgery or stenting or prior cerebral aneurysm
clipping or coil.
Congestive Heart Failure (CHF), Current
Within 2 weeks prior to the procedure, the patient has a clinical diagnosis of CHF and symptoms requiring treatment for CHF. Note: Physician diagnosis of CHF may be based on one of the following:
• Paroxysmal nocturnal dyspnea (PND) • Dyspnea on exertion (DOE) due to heart failure • Chest X-Ray showing pulmonary congestion
Documentation must include the presence of a diagnosis of CHF, evidence of symptoms, and treatment for CHF.
52
Comorbidities, continuedCongestive Heart Failure (CHF), Past
Between 2 weeks and 6 months prior to the procedure, the patient has a clinical diagnosis / past medical history of CHF and ongoing treatment for CHF. Note: Physician diagnosis of CHF may be based on one of the following:
• Paroxysmal nocturnal dyspnea (PND)• Dyspnea on exertion (DOE) due to heart failure• Chest X-Ray showing pulmonary congestion
Documentation must include a diagnosis of CHF and evidence of treatment for CHF. Patient’s clinical status may be compensated.
Chronic Lung Disease The patient has chronic lung disease, and the severity level according to the following classification:
• Mild - FEV1 60% to 75% of predicted, and/or on chronic inhaled or oral bronchodilator therapy.
• Moderate - FEV1 50% to 59% of predicted, and/or on chronic steroid therapy aimed at lung disease.
• Severe - FEV1 <50% predicted, and/or Room Air pO2 < 60 or Room Air pCO2 > 50.
Diabetes with Insulin therapy The patient has a diagnosis of Diabetes Mellitus and is taking insulin prior to admission.
Diabetes requiring medication The patient has a diagnosis of Diabetes Mellitus and is taking either Insulin or Oral medication.
Malignant Ventricular Arrhythmia Recent (within the past 14 days) sustained ventricular tachycardia requiring electrical defibrillation or conversion with intravenous antiarrhythmic agents or ventricular fibrillation requiring electrical defibrillation. Excludes V-Tach or V-Fib occurring within 6 hours of the diagnosis of a myocardial infarction and responding well to treatment.
Peripheral Vascular Disease Angiographic demonstration of at least 50% narrowing in a major aortoiliac or femoral/popliteal vessel, previous surgery for such disease, absent femoral or pedal pulses, or the inability to insert a catheter or intra-aortic balloon due to iliac aneurysm or obstruction of the aortoiliac or femoral arteries. Ankle-Brachial Index <0.9 is also acceptable documentation.
Renal Failure, Creatinine Pre-PCI creatinine during the hospital admission was within the indicated range.
Note: For December 2011 discharges, creatinine values were for the highest pre-PCI value in the admission. For 2012-2013, the pre-PCI value closest to the procedure is reported.
Renal Failure, Dialysis The patient is on chronic peritoneal or hemodialysis.
53
Ventricular FunctionPrevious MI Most recent myocardial infarction (MI) occurred in the specified time
period before the intervention.
ST Elevation EKG evidence of STEMI and cardiac biomarkers exceeding the upper limit of normal.
Ejection Fraction The percentage of blood in the heart’s left ventricle that is expelled when it contracts, with more denoting a healthier heart. Report the value of the ejection fraction taken closest to, but before, the procedure. When a calculated measure is unavailable the ejection fraction should be estimated visually from the ventriculogram or by echocardiography.
Previous PCI The patient has had one or more previous PCIs.
Vessels DiseasedLeft Main Disease The patient has at least a 50 percent blockage in the Left Main
Coronary Artery.Three Vessels Diseased The patient has at least a 70 percent blockage in each of the three
native coronary arteries including the Left Anterior Descending (LAD), the Right Coronary Artery (RCA) and the Left Circumflex (LCX) or their major branches.
Two Vessels Diseased The patient has at least a 70 percent blockage in two of the native coronary arteries including the Left Anterior Descending (LAD), the Right Coronary Artery (RCA), and the Left Circumflex (LCX) or their major branches.
2014 Hypoxic Brain InjuryCriteria for Hypoxic Brain Injury Mortality Exclusion
Pre-PCI Criteria
1. AMI: PCI is done for Acute Myocardial Infarction;
2. CARDIAC ARREST: Documented cardiac arrest has occurred as part of initial presentation for the AMI and before the patient is brought to the cardiac catheterization laboratory (typically out-of-hospital cardiac arrest);
3. COMA: The patient had normal consciousness before the cardiac arrest, but becomes comatose, broadly defined as the failure to exhibit adequate responsiveness to external stimuli with the understanding that early after cardiac arrest this can be due to multiple factors and not just prolonged hypoxia. There is no need to “prove” anoxic/hypoxic encephalopathy at this time and indeed it cannot be “proven”;
54
Procedural Criteria NO IN-LAB DEATH: The patient survives the procedure, even if emergency surgery is done.
Post-PCI Criteria
1. The patient has persistent, severe hypoxic encephalopathy which is present at the time of death or at the time of a decision to withdraw or withhold care. (The withdrawal of care or withholding of care may refer to cardiac or non-cardiac care.)
2. There is medical record documentation of a post-PCI consultation by Neurology or Critical Care (not a PCI physician) documenting the presence and severity of anoxic/hypoxic encephalopathy. There should be medical record documentation of at least one of the following: the consulting physician is involved in the treatment plan and supports withdrawing or withholding care around the same time that the decisions are made; the consulting physician agrees with the diagnosis of severe brain injury and notes a poor prognosis for recovery; the family requests that care be withdrawn or withheld.
55
MEDICAL TERMINOLOGYangina pectoris – The pain or discomfort felt when blood flow to the heart muscle is impeded by blockages in the coronary arteries. This can also be caused by an arterial spasm.
arteriosclerosis – The group of diseases characterized by thickening and loss of elasticity of the arterial walls, popularly called “hardening of the arteries.” Also called atherosclerotic coronary artery disease or coronary artery disease.
atherosclerosis – One form of arteriosclerosis in which plaques or fatty deposits form in the inner layer of the arteries.
cardiac catheterization – Also known as coronary angiography, a procedure for diagnosing the condition of the heart and the arteries connecting to it. A thin tube threaded through an artery to the heart releases a dye, which allows doctors to observe blockages with an X-ray camera. This procedure is required before PCI is performed.
cardiovascular disease – Disease of the heart and blood vessels, the most common form is coronary artery disease.
coronary arteries – The arteries that supply the heart muscle with blood. When they are narrowed or blocked, oxygen-rich blood cannot flow freely to the heart muscle or myocardium.
coronary artery bypass graft surgery (CABG) – A procedure in which a vein or artery from another part of the body is used to create an alternate path for blood to flow to the heart, bypassing the arterial blockage. Typically, a section of one of the large saphenous veins in the leg, the radial artery in the arm or the mammary artery in the chest is used to construct the bypass. One or more bypasses may be performed during a single operation. When no other major heart surgery (such as valve replacement) is included, the operation is referred to as an isolated CABG.
ischemic heart disease (ischemia) – Heart disease that occurs as a result of inadequate blood supply to the heart muscle or myocardium.
lesion – An irregular growth of fiber and tissue.
myocardial infarction – Partial destruction of the heart muscle due to interrupted blood supply, also called a heart attack.
percutaneous coronary intervention (PCI) (angioplasty or percutaneous transluminal coronary angioplasty) – Typically in this procedure, a balloon catheter is threaded up to the site of blockage in an artery in the heart, and is then inflated to push arterial plaque against the wall of the artery to create a wider channel in the artery. Other procedures or devices are frequently used in conjunction with the catheter to remove plaque. In particular, stents are used for most patients and procedures such as atherectomies and thrombectomy are sometimes used.
plaque – Also called atheroma, this is the fatty deposit in the coronary artery that can block blood flow.
risk factors for heart disease – Certain risk factors have been found to increase the likelihood of developing heart disease. Some are controllable or avoidable and some cannot be controlled. The biggest heart disease risk factors are heredity, gender and age, all of which cannot be controlled. Men are much more likely to develop heart disease than women before the age of 55, although it is the number one killer of both men and women. Some controllable risk factors that contribute to a higher likelihood of developing coronary artery disease are high cholesterol levels, cigarette smoking, high blood pressure (hypertension), obesity, a sedentary lifestyle or lack of exercise, diabetes and poor stress management.
ST segment elevation myocardial infarction (STEMI) – This heart attack, or MI, is caused by a prolonged period of blocked blood supply and affects a large area of the heart muscle, and so causes changes on the EKG as well as in blood levels of key chemical markers.
stenosis – The narrowing of an artery due to blockage. Restenosis is when the narrowing recurs after PCI or surgery.
56
Appendix 1
2014 Risk Factors For PCI In-Hospital/30-Day Mortality (ALL CASES)The significant pre-procedural risk factors for in-hospital/30-day mortality following PCI in 2014 are presented in the table that follows. Roughly speaking, the odds ratio for a risk factor represents the number of times more likely to die in the hospital during or after PCI or after hospital discharge but within 30 days of the PCI a patient with that risk factor is than a patient without the risk factor, all other risk factors being the same. For example, the odds ratio for the risk factor “Peripheral Vascular Disease” is 1.867. This means that a patient with Peripheral Vascular Disease is approximately 1.867 times as likely to die in the hospital during the same admission as PCI or after hospital discharge but within 30 days of the PCI as a patient without Peripheral Vascular Disease who has the same other significant risk factors. The risk factors Female, Hemodynamically Unstable, Congestive Heart Failure (Current), Left Main Disease and Three Vessels Diseased are also interpreted in the same way.
Age is represented by both a linear and a quadratic (squared) term. This represents the fact that as patients age, their risk of 30-day mortality increases at an increasing rate. This functional form is used to improve the model’s ability to predict mortality, but it means that the odds ratios for these terms do not have a straightforward interpretation. Therefore these odds ratios are not contained in the table.
Ejection Fraction, which is the percentage of blood in the heart’s left ventricle that is expelled when it contracts (with more denoting a healthier heart), is subdivided into five ranges (less than 20 percent, 20 percent to 29 percent, 30 percent to 39 percent, 40 percent to 49
percent and 50 percent or more). The last range is referred to as the reference category. This means that the odds ratio that appears for the other Ejection Fraction categories in the table is relative to patients with an ejection fraction of 50 percent or more. Thus, a PCI patient with an ejection fraction of less than 20 percent is about 6.723 times as likely to die in the hospital or within 30 days as a patient with an ejection fraction of 50 percent or higher, all other significant risk factors being the same.
Previous MI is subdivided into nine ranges (with ST Elevation present, occurring less than six hours prior, six to eleven hours prior, twelve to twenty-three hours prior; without ST Elevation, less than six hours prior, six to eleven hours prior, twelve to twenty-three hours prior; with or without ST Elevation, one to seven days prior, eight to fourteen days prior; and no MI within fourteen days prior to the procedure). The last range is referred to as the reference category. The odds ratio for the Previous MI ranges are relative to patients who have not had an MI within fourteen days prior to PCI.
In this model Chronic Lung Disease is divided into three categories: Moderate, Severe, and Mild or None. The odds ratios for patients with each of the first two levels are compared to patients with either no or mild chronic lung disease.
Renal Failure is subdivided into four groups. Two categories represent patients with various levels of elevated creatinine, but no dialysis. The third category includes patients with renal failure on dialysis. These groups are relative to patients who are not on dialysis and had no pre-PCI creatinine values greater than 1.5 mg/dL.
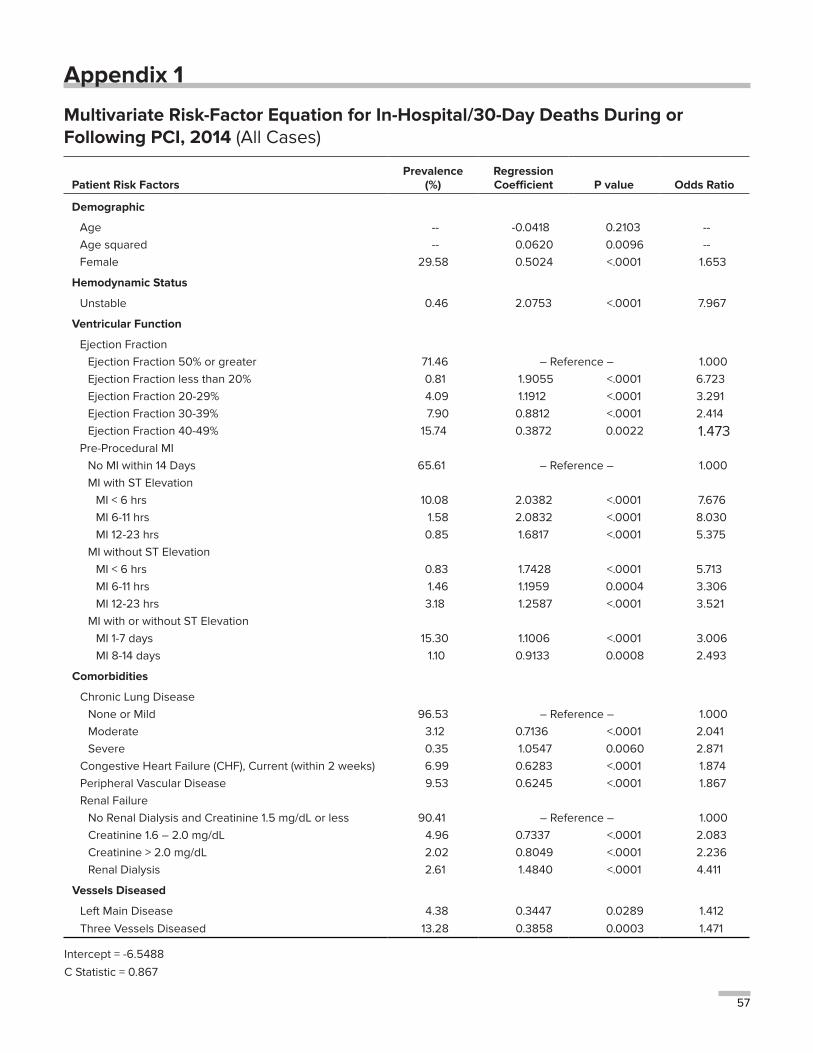
57
Appendix 1
Multivariate Risk-Factor Equation for In-Hospital/30-Day Deaths During or Following PCI, 2014 (All Cases)
Patient Risk FactorsPrevalence
(%)Regression Coefficient P value Odds Ratio
Demographic
Age -- -0.0418 0.2103 --Age squared -- 0.0620 0.0096 --Female 29.58 0.5024 <.0001 1.653
Hemodynamic Status
Unstable 0.46 2.0753 <.0001 7.967
Ventricular Function
Ejection FractionEjection Fraction 50% or greater 71.46 – Reference – 1.000Ejection Fraction less than 20% 0.81 1.9055 <.0001 6.723Ejection Fraction 20-29% 4.09 1.1912 <.0001 3.291Ejection Fraction 30-39% 7.90 0.8812 <.0001 2.414Ejection Fraction 40-49% 15.74 0.3872 0.0022 1.473
Pre-Procedural MI No MI within 14 Days 65.61 – Reference – 1.000MI with ST Elevation
MI < 6 hrs 10.08 2.0382 <.0001 7.676MI 6-11 hrs 1.58 2.0832 <.0001 8.030MI 12-23 hrs 0.85 1.6817 <.0001 5.375
MI without ST ElevationMI < 6 hrs 0.83 1.7428 <.0001 5.713MI 6-11 hrs 1.46 1.1959 0.0004 3.306MI 12-23 hrs 3.18 1.2587 <.0001 3.521
MI with or without ST ElevationMI 1-7 days 15.30 1.1006 <.0001 3.006MI 8-14 days 1.10 0.9133 0.0008 2.493
Comorbidities
Chronic Lung DiseaseNone or Mild 96.53 – Reference – 1.000Moderate 3.12 0.7136 <.0001 2.041Severe 0.35 1.0547 0.0060 2.871
Congestive Heart Failure (CHF), Current (within 2 weeks) 6.99 0.6283 <.0001 1.874Peripheral Vascular Disease 9.53 0.6245 <.0001 1.867Renal Failure
No Renal Dialysis and Creatinine 1.5 mg/dL or less 90.41 – Reference – 1.000Creatinine 1.6 – 2.0 mg/dL 4.96 0.7337 <.0001 2.083Creatinine > 2.0 mg/dL 2.02 0.8049 <.0001 2.236Renal Dialysis 2.61 1.4840 <.0001 4.411
Vessels Diseased
Left Main Disease 4.38 0.3447 0.0289 1.412Three Vessels Diseased 13.28 0.3858 0.0003 1.471
Intercept = -6.5488
C Statistic = 0.867
58
Appendix 2
2014 Risk Factors For In-Hospital/30-Day Mortality For Non-Emergency PCIAppendix 2 contains the significant pre-procedural risk factors for 2014 New York State PCI patients who were not emergency patients (were not hemodynamically unstable and who did not suffer a heart attack within 24 hours prior to the PCI being performed).
The interpretation for Ejection Fraction, Chronic Lung Disease, Peripheral Vascular Disease and Three Vessels Diseased are the same as presented in Appendix 1.
With regard to age, the odds ratio roughly represents the number of times more likely a patient who is over age 65 is to die than another patient who is one year younger, all other significant risk factors being the same. Thus, a patient undergoing PCI who is 67 years old has approximately 1.050 times the chance of dying
in the hospital or within 30 days that a 67 year-old patient has, all other risk factors being the same. All patients aged 65 years or younger have roughly the same odds of dying in the hospital or after discharge but within 30 days, if their other risk factors are identical.
In this model, there are three categories for Previous MI, one to seven days prior to PCI, eight to fourteen days prior to MI and no MI within fourteen days prior to the PCI. The odds ratio for the first two groups are relative to patients who have not had an MI within fourteen days prior to PCI.
Renal Failure is interpreted in the same way as Appendix 1, although there are only three categories in this model.
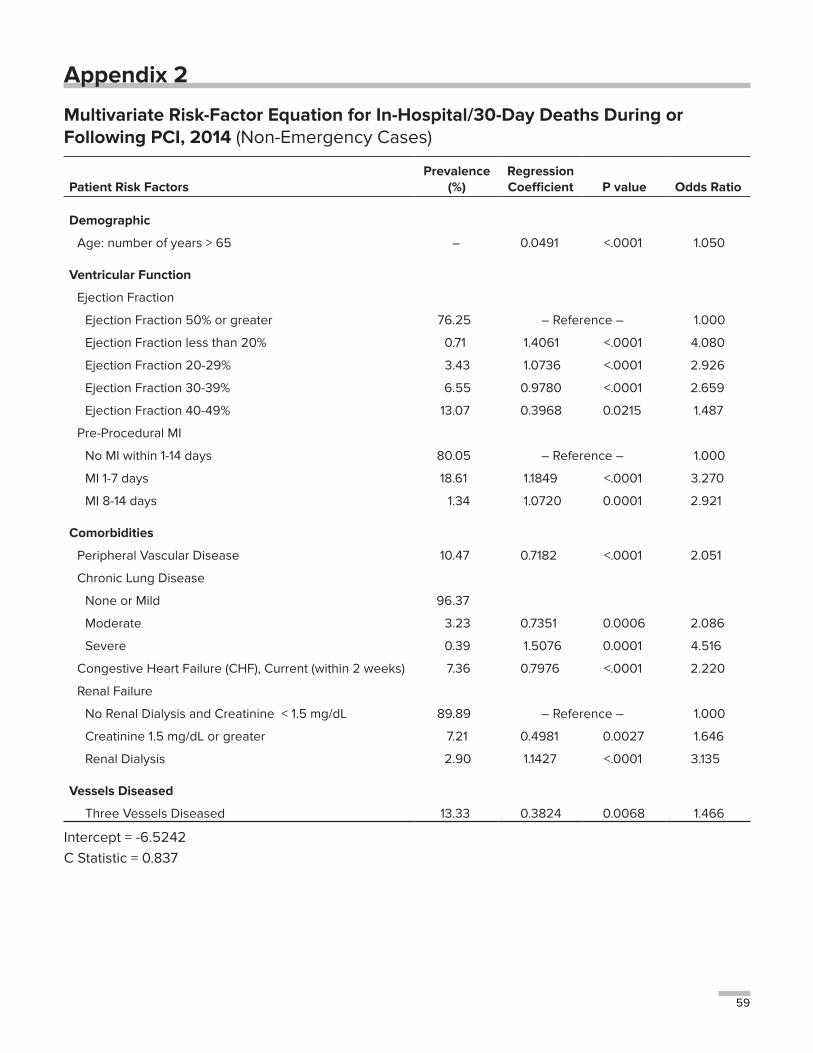
59
Appendix 2
Multivariate Risk-Factor Equation for In-Hospital/30-Day Deaths During or Following PCI, 2014 (Non-Emergency Cases)
Patient Risk FactorsPrevalence
(%)Regression Coefficient P value Odds Ratio
Demographic
Age: number of years > 65 – 0.0491 <.0001 1.050
Ventricular Function
Ejection Fraction
Ejection Fraction 50% or greater 76.25 – Reference – 1.000
Ejection Fraction less than 20% 0.71 1.4061 <.0001 4.080
Ejection Fraction 20-29% 3.43 1.0736 <.0001 2.926
Ejection Fraction 30-39% 6.55 0.9780 <.0001 2.659
Ejection Fraction 40-49% 13.07 0.3968 0.0215 1.487
Pre-Procedural MI
No MI within 1-14 days 80.05 – Reference – 1.000
MI 1-7 days 18.61 1.1849 <.0001 3.270
MI 8-14 days 1.34 1.0720 0.0001 2.921
Comorbidities
Peripheral Vascular Disease 10.47 0.7182 <.0001 2.051
Chronic Lung Disease
None or Mild 96.37
Moderate 3.23 0.7351 0.0006 2.086
Severe 0.39 1.5076 0.0001 4.516
Congestive Heart Failure (CHF), Current (within 2 weeks) 7.36 0.7976 <.0001 2.220
Renal Failure
No Renal Dialysis and Creatinine < 1.5 mg/dL 89.89 – Reference – 1.000
Creatinine 1.5 mg/dL or greater 7.21 0.4981 0.0027 1.646
Renal Dialysis 2.90 1.1427 <.0001 3.135
Vessels Diseased
Three Vessels Diseased 13.33 0.3824 0.0068 1.466
Intercept = -6.5242C Statistic = 0.837
60
Appendix 3
2014 Risk Factors For 30-Day Readmission For PCIThe significant pre-procedural risk factors for 30-day readmissions following PCI in 2014 are presented in the table that follows. The interpretation for many of the variables in this model was described in Appendix 1 or 2. This includes Age, Female, Unstable, Ejection Fraction, Pre-Procedural MI, Congestive Heart Failure (Current), Peripheral Vascular Disease, Renal Failure, and Number of Vessels Diseased.
The interpretation for Cerebrovascular Disease, is similar to that described for Peripheral Vascular Disease in Appendix 1.
Body Mass Index (BMI) is a relationship of weight to height. It is a measure of body fat that is the ratio of the weight of the body in kilograms to the square of its height in meters and is considered an indication of nutritional status of the body.
This model shows that patient with a BMI of 30 kg/m2 or less have odds of readmission that are 1.144 times that of otherwise identical patients with a BMI greater than 30 kg/m2.
Chronic Lung Disease is represented by four groups in this model: Mild, Moderate, Severe, and None. The interpretation is similar to that
presented in Appendix 1 except in this case the reference group is patients who do not have Chronic Lung Disease.
In this model, Diabetes is represented by three categories: Diabetes with Oral Treatment, Diabetes with Insulin Treatment, and No Diabetes with Oral or Insulin Treatment. The last group includes patients without diabetes as well as those with diabetes not treated with oral medication or insulin. This is the reference group and the odds ratios for the other two categories are relative to patients in this group.
Number of vessels diseased is comprised of three categories in this model (fewer than two vessels diseased, two vessels diseased and three vessels diseased). Two and three vessels diseased refers to patients with at least a 70 percent blockage in two or three of the native coronary arteries including the Left Anterior Descending (LAD), the Right Coronary Artery (RCA) and the Left Circumflex (LCX) or their major branches, respectively. The reference category for this group includes patients who have fewer than two vessels diseased.
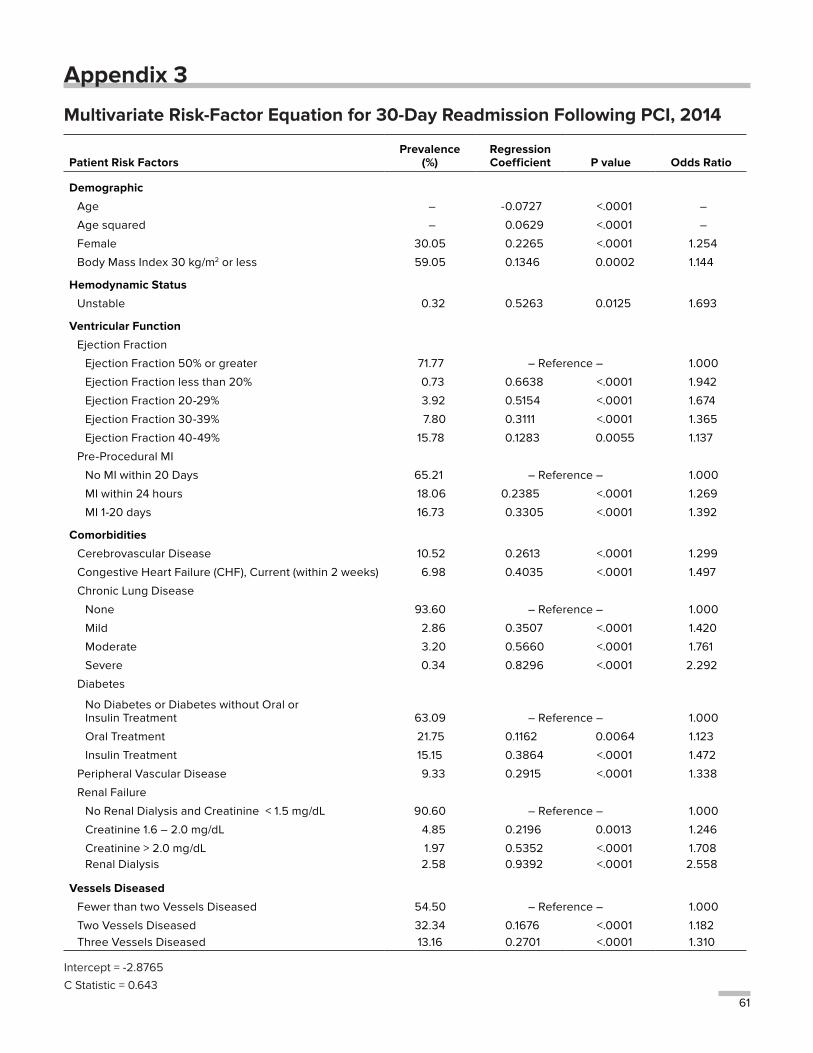
61
Appendix 3
Multivariate Risk-Factor Equation for 30-Day Readmission Following PCI, 2014
Patient Risk FactorsPrevalence
(%)Regression Coefficient P value Odds Ratio
Demographic
Age – -0.0727 <.0001 –
Age squared – 0.0629 <.0001 –
Female 30.05 0.2265 <.0001 1.254
Body Mass Index 30 kg/m2 or less 59.05 0.1346 0.0002 1.144
Hemodynamic Status
Unstable 0.32 0.5263 0.0125 1.693
Ventricular Function
Ejection Fraction
Ejection Fraction 50% or greater 71.77 – Reference – 1.000
Ejection Fraction less than 20% 0.73 0.6638 <.0001 1.942
Ejection Fraction 20-29% 3.92 0.5154 <.0001 1.674
Ejection Fraction 30-39% 7.80 0.3111 <.0001 1.365
Ejection Fraction 40-49% 15.78 0.1283 0.0055 1.137
Pre-Procedural MI
No MI within 20 Days 65.21 – Reference – 1.000
MI within 24 hours 18.06 0.2385 <.0001 1.269
MI 1-20 days 16.73 0.3305 <.0001 1.392
Comorbidities
Cerebrovascular Disease 10.52 0.2613 <.0001 1.299
Congestive Heart Failure (CHF), Current (within 2 weeks) 6.98 0.4035 <.0001 1.497
Chronic Lung Disease
None 93.60 – Reference – 1.000
Mild 2.86 0.3507 <.0001 1.420
Moderate 3.20 0.5660 <.0001 1.761
Severe 0.34 0.8296 <.0001 2.292
Diabetes
No Diabetes or Diabetes without Oral or Insulin Treatment 63.09 – Reference – 1.000
Oral Treatment 21.75 0.1162 0.0064 1.123
Insulin Treatment 15.15 0.3864 <.0001 1.472
Peripheral Vascular Disease 9.33 0.2915 <.0001 1.338
Renal Failure
No Renal Dialysis and Creatinine < 1.5 mg/dL 90.60 – Reference – 1.000
Creatinine 1.6 – 2.0 mg/dL 4.85 0.2196 0.0013 1.246
Creatinine > 2.0 mg/dL 1.97 0.5352 <.0001 1.708Renal Dialysis 2.58 0.9392 <.0001 2.558
Vessels Diseased
Fewer than two Vessels Diseased 54.50 – Reference – 1.000
Two Vessels Diseased 32.34 0.1676 <.0001 1.182Three Vessels Diseased 13.16 0.2701 <.0001 1.310
Intercept = -2.8765
C Statistic = 0.643
62
Appendix 4
2012-2014 Risk Factors for PCI In-Hospital/30-Day Mortality (ALL CASES)The significant pre-procedural risk factors for in-hospital/30-day mortality following PCI in the 2012-2014 time period are presented in the table that follows. The interpretation of this table is similar to the interpretation of Appendices 1-3 that are described previously. Female, Unstable, Ejection Fraction, Pre-Procedural MI, Left Main Disease, Renal Failure and Number of Vessels Diseased are interpreted in the same way as previously described.
Chronic Lung Disease, Diabetes requiring medication, Malignant Ventricular Arrhythmia, and One or More Previous PCIs are interpreted
in the same way as Peripheral Vascular Disease therapy in Appendix 1.
Body Mass Index is divided into four groups representing various levels of BMI. The reference group is patients with BMI of at least 25 kg/m2 but less than 34 kg/m2.
Congestive Heart Failure (CHF) is divided into three groups (patients with CHF in the past two weeks, patients with CHF within six months but not within the past two weeks, and patients with no CHF within 6 months). The odds ratios for CHF-Current and CHF-Past are relative to patients with no CHF within the past 6 months.
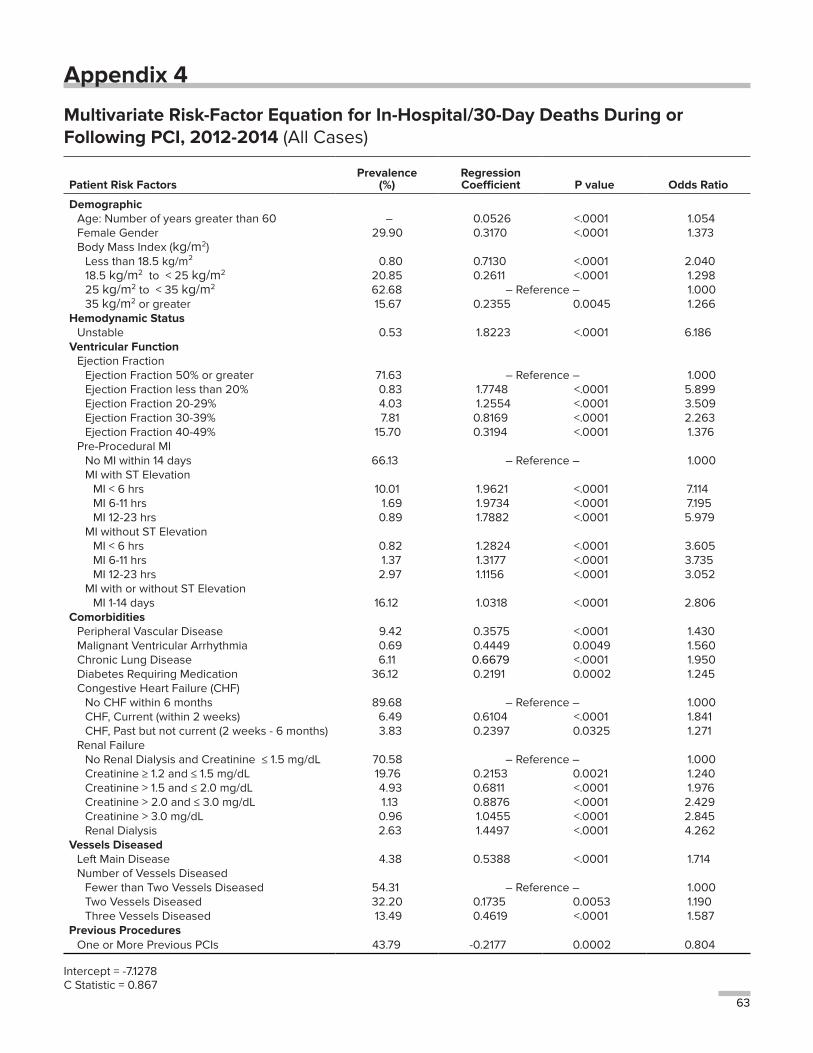
63
Appendix 4
Multivariate Risk-Factor Equation for In-Hospital/30-Day Deaths During or Following PCI, 2012-2014 (All Cases)
Patient Risk FactorsPrevalence
(%)Regression Coefficient P value Odds Ratio
Demographic Age: Number of years greater than 60 – 0.0526 <.0001 1.054Female Gender 29.90 0.3170 <.0001 1.373Body Mass Index (kg/m2)
Less than 18.5 kg/m² 0.80 0.7130 <.0001 2.04018.5 kg/m2 to < 25 kg/m2 20.85 0.2611 <.0001 1.29825 kg/m2 to < 35 kg/m2 62.68 – Reference – 1.00035 kg/m2 or greater 15.67 0.2355 0.0045 1.266
Hemodynamic StatusUnstable 0.53 1.8223 <.0001 6.186
Ventricular FunctionEjection Fraction
Ejection Fraction 50% or greater 71.63 – Reference – 1.000Ejection Fraction less than 20% 0.83 1.7748 <.0001 5.899Ejection Fraction 20-29% 4.03 1.2554 <.0001 3.509Ejection Fraction 30-39% 7.81 0.8169 <.0001 2.263Ejection Fraction 40-49% 15.70 0.3194 <.0001 1.376
Pre-Procedural MI No MI within 14 days 66.13 – Reference – 1.000MI with ST Elevation
MI < 6 hrs 10.01 1.9621 <.0001 7.114MI 6-11 hrs 1.69 1.9734 <.0001 7.195MI 12-23 hrs 0.89 1.7882 <.0001 5.979
MI without ST ElevationMI < 6 hrs 0.82 1.2824 <.0001 3.605MI 6-11 hrs 1.37 1.3177 <.0001 3.735MI 12-23 hrs 2.97 1.1156 <.0001 3.052
MI with or without ST ElevationMI 1-14 days 16.12 1.0318 <.0001 2.806
ComorbiditiesPeripheral Vascular Disease 9.42 0.3575 <.0001 1.430Malignant Ventricular Arrhythmia 0.69 0.4449 0.0049 1.560Chronic Lung Disease 6.11 0.6679 <.0001 1.950Diabetes Requiring Medication 36.12 0.2191 0.0002 1.245Congestive Heart Failure (CHF)
No CHF within 6 months 89.68 – Reference – 1.000CHF, Current (within 2 weeks) 6.49 0.6104 <.0001 1.841CHF, Past but not current (2 weeks - 6 months) 3.83 0.2397 0.0325 1.271
Renal FailureNo Renal Dialysis and Creatinine ≤ 1.5 mg/dL 70.58 – Reference – 1.000Creatinine ≥ 1.2 and ≤ 1.5 mg/dL 19.76 0.2153 0.0021 1.240Creatinine > 1.5 and ≤ 2.0 mg/dL 4.93 0.6811 <.0001 1.976Creatinine > 2.0 and ≤ 3.0 mg/dL 1.13 0.8876 <.0001 2.429Creatinine > 3.0 mg/dL 0.96 1.0455 <.0001 2.845Renal Dialysis 2.63 1.4497 <.0001 4.262
Vessels DiseasedLeft Main Disease 4.38 0.5388 <.0001 1.714Number of Vessels Diseased
Fewer than Two Vessels Diseased 54.31 – Reference – 1.000Two Vessels Diseased 32.20 0.1735 0.0053 1.190Three Vessels Diseased 13.49 0.4619 <.0001 1.587
Previous ProceduresOne or More Previous PCIs 43.79 -0.2177 0.0002 0.804
Intercept = -7.1278C Statistic = 0.867
64
Appendix 5
2012-2014 Risk Factors for In-Hospital/30-Day Mortality for Non-Emergency PCIThe significant pre-procedural risk factors for in-hospital/30-day mortality following Non-Emergency PCI in the 2012-2014 time period are presented in the Appendix 5 table below. The interpretation for this appendix is similar to the interpretation of Appendices 1-4 described previously.
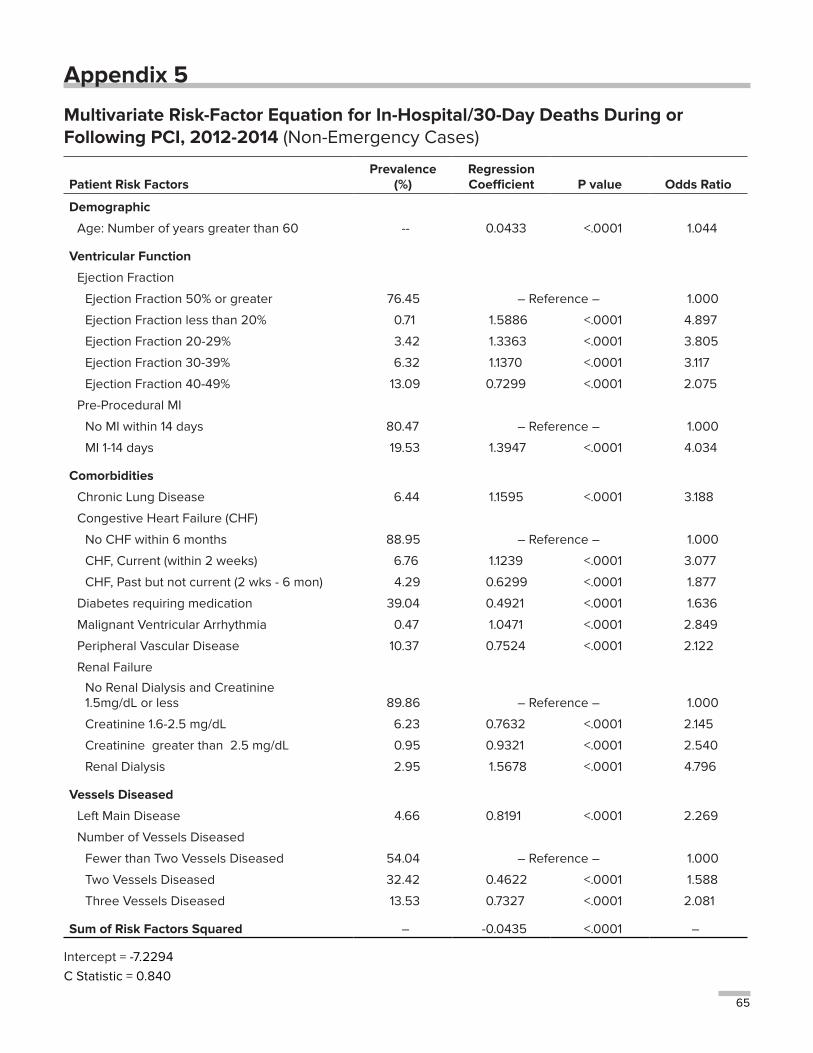
65
Appendix 5
Multivariate Risk-Factor Equation for In-Hospital/30-Day Deaths During or Following PCI, 2012-2014 (Non-Emergency Cases)
Patient Risk FactorsPrevalence
(%)Regression Coefficient P value Odds Ratio
Demographic
Age: Number of years greater than 60 -- 0.0433 <.0001 1.044
Ventricular Function
Ejection Fraction
Ejection Fraction 50% or greater 76.45 – Reference – 1.000
Ejection Fraction less than 20% 0.71 1.5886 <.0001 4.897
Ejection Fraction 20-29% 3.42 1.3363 <.0001 3.805
Ejection Fraction 30-39% 6.32 1.1370 <.0001 3.117
Ejection Fraction 40-49% 13.09 0.7299 <.0001 2.075
Pre-Procedural MI
No MI within 14 days 80.47 – Reference – 1.000
MI 1-14 days 19.53 1.3947 <.0001 4.034
Comorbidities
Chronic Lung Disease 6.44 1.1595 <.0001 3.188
Congestive Heart Failure (CHF)
No CHF within 6 months 88.95 – Reference – 1.000
CHF, Current (within 2 weeks) 6.76 1.1239 <.0001 3.077
CHF, Past but not current (2 wks - 6 mon) 4.29 0.6299 <.0001 1.877
Diabetes requiring medication 39.04 0.4921 <.0001 1.636
Malignant Ventricular Arrhythmia 0.47 1.0471 <.0001 2.849
Peripheral Vascular Disease 10.37 0.7524 <.0001 2.122
Renal Failure
No Renal Dialysis and Creatinine 1.5mg/dL or less 89.86 – Reference – 1.000
Creatinine 1.6-2.5 mg/dL 6.23 0.7632 <.0001 2.145
Creatinine greater than 2.5 mg/dL 0.95 0.9321 <.0001 2.540
Renal Dialysis 2.95 1.5678 <.0001 4.796
Vessels Diseased
Left Main Disease 4.66 0.8191 <.0001 2.269
Number of Vessels Diseased
Fewer than Two Vessels Diseased 54.04 – Reference – 1.000
Two Vessels Diseased 32.42 0.4622 <.0001 1.588
Three Vessels Diseased 13.53 0.7327 <.0001 2.081
Sum of Risk Factors Squared – -0.0435 <.0001 –
Intercept = -7.2294C Statistic = 0.840
66
Appendix 6
2012-2014 Risk Factors for In-Hospital/30-Day Mortality for Emergency PCIThe significant pre-procedural risk factors for in-hospital/30-day mortality following Emergency PCI in the 2012-2014 time period are presented in the Appendix 6 table below. The interpretation of this table is similar to the interpretation of Appendices 1-5.
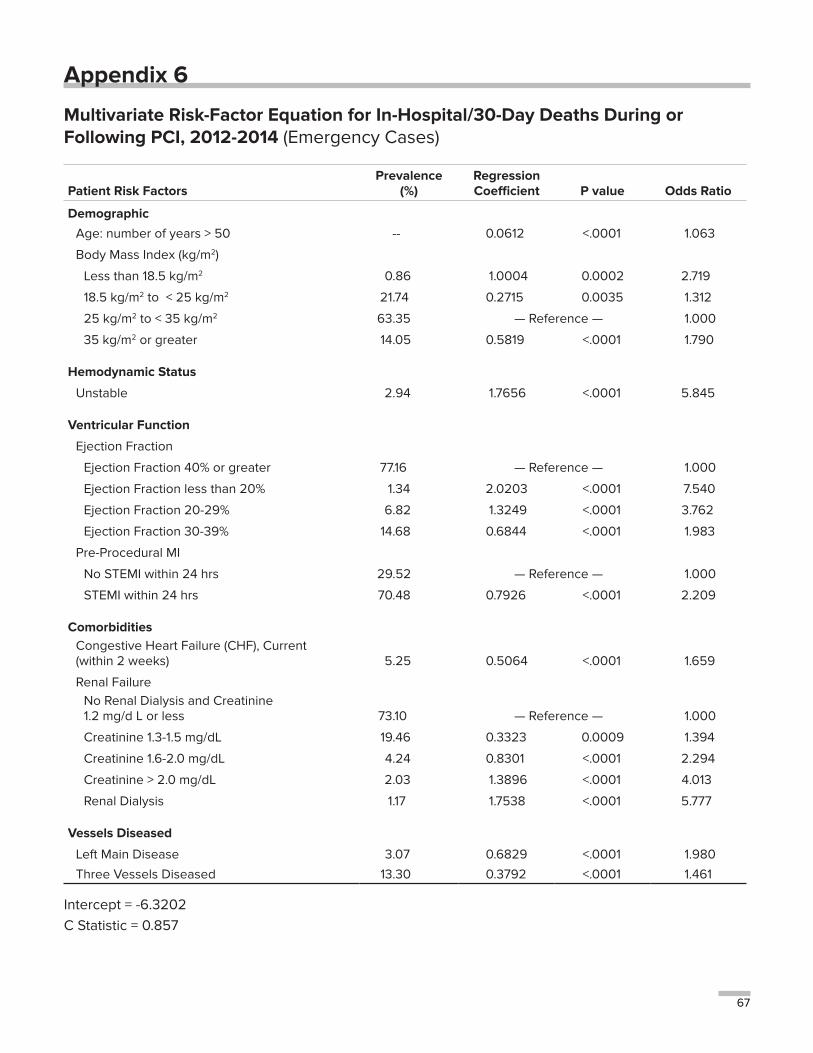
67
Appendix 6
Multivariate Risk-Factor Equation for In-Hospital/30-Day Deaths During or Following PCI, 2012-2014 (Emergency Cases)
Patient Risk FactorsPrevalence
(%)Regression Coefficient P value Odds Ratio
Demographic
Age: number of years > 50 -- 0.0612 <.0001 1.063
Body Mass Index (kg/m2)
Less than 18.5 kg/m2 0.86 1.0004 0.0002 2.719
18.5 kg/m2 to < 25 kg/m2 21.74 0.2715 0.0035 1.312
25 kg/m2 to < 35 kg/m2 63.35 — Reference — 1.000
35 kg/m2 or greater 14.05 0.5819 <.0001 1.790
Hemodynamic Status
Unstable 2.94 1.7656 <.0001 5.845
Ventricular Function
Ejection Fraction
Ejection Fraction 40% or greater 77.16 — Reference — 1.000
Ejection Fraction less than 20% 1.34 2.0203 <.0001 7.540
Ejection Fraction 20-29% 6.82 1.3249 <.0001 3.762
Ejection Fraction 30-39% 14.68 0.6844 <.0001 1.983
Pre-Procedural MI
No STEMI within 24 hrs 29.52 — Reference — 1.000
STEMI within 24 hrs 70.48 0.7926 <.0001 2.209
ComorbiditiesCongestive Heart Failure (CHF), Current (within 2 weeks) 5.25 0.5064 <.0001 1.659
Renal FailureNo Renal Dialysis and Creatinine 1.2 mg/d L or less 73.10 — Reference — 1.000
Creatinine 1.3-1.5 mg/dL 19.46 0.3323 0.0009 1.394
Creatinine 1.6-2.0 mg/dL 4.24 0.8301 <.0001 2.294
Creatinine > 2.0 mg/dL 2.03 1.3896 <.0001 4.013
Renal Dialysis 1.17 1.7538 <.0001 5.777
Vessels Diseased
Left Main Disease 3.07 0.6829 <.0001 1.980
Three Vessels Diseased 13.30 0.3792 <.0001 1.461
Intercept = -6.3202C Statistic = 0.857
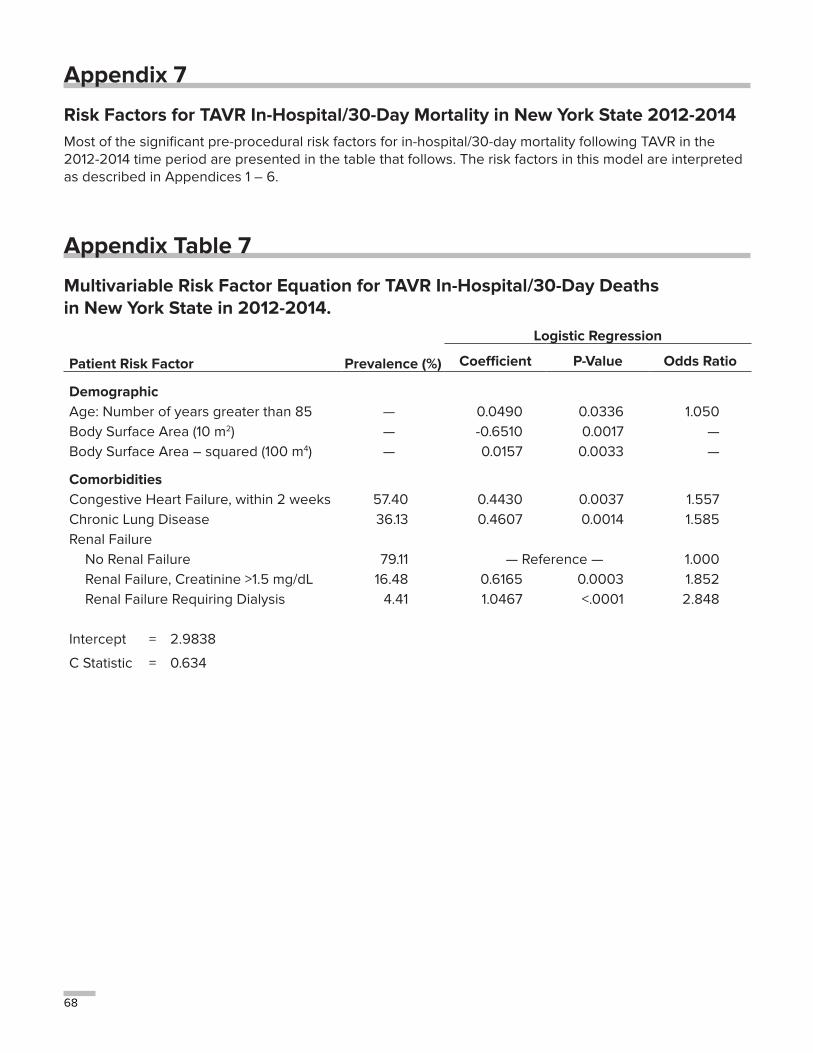
68
Appendix 7
Risk Factors for TAVR In-Hospital/30-Day Mortality in New York State 2012-2014 Most of the significant pre-procedural risk factors for in-hospital/30-day mortality following TAVR in the 2012-2014 time period are presented in the table that follows. The risk factors in this model are interpreted as described in Appendices 1 – 6.
Appendix Table 7
Multivariable Risk Factor Equation for TAVR In-Hospital/30-Day Deaths in New York State in 2012-2014.
Patient Risk Factor Prevalence (%)
Logistic Regression
Coefficient P-Value Odds Ratio
DemographicAge: Number of years greater than 85 — 0.0490 0.0336 1.050Body Surface Area (10 m2) — -0.6510 0.0017 —Body Surface Area – squared (100 m4) — 0.0157 0.0033 —
ComorbiditiesCongestive Heart Failure, within 2 weeks 57.40 0.4430 0.0037 1.557Chronic Lung Disease 36.13 0.4607 0.0014 1.585Renal Failure
No Renal Failure 79.11 — Reference — 1.000Renal Failure, Creatinine >1.5 mg/dL 16.48 0.6165 0.0003 1.852Renal Failure Requiring Dialysis 4.41 1.0467 <.0001 2.848
Intercept = 2.9838
C Statistic = 0.634

69
NEW YORK STATE PERCUTANEOUS CORONARY INTERVENTION CENTERSAlbany Medical Center New Scotland Avenue Albany, New York 12208
Arnot Ogden Medical Center 600 Roe Avenue Elmira, New York 14905
Bassett Medical Center Atwell Road Cooperstown, New York 13326
Bellevue Hospital Center First Avenue and 27th Street New York, New York 10016
Bronx-Lebanon Hospital Center* 1650 Grand Concourse Bronx, New York 10456
Brookdale University Hospital* and Medical Center Linden Boulevard @ Brookdale Plaza Brooklyn, New York 11212
Brookhaven Memorial Hospital Medical Center* 101 Hospital Road Patchogue, New York 11772
Buffalo General Medical Center 100 High Street Buffalo, New York 14203
Cayuga Medical Center at Ithaca* 101 Dates Drive Ithaca, New York 14850
Champlain Valley Physicians Hospital* 75 Beekman Street Plattsburgh, New York 12901
Crouse Hospital 736 Irving Avenue Syracuse, New York 13210
Ellis Hospital 1101 Nott Street Schenectady, New York 12308
Elmhurst Hospital Center* 79-01 Broadway Elmhurst, New York 11373
Erie County Medical Center** 462 Grider Street Buffalo, New York 14215
Faxton-St. Luke’s Healthcare (St. Luke’s Division) ** Box 479 Utica, New York 13503
Glens Falls Hospital* 100 Park Street Glens Falls, New York 12801
Good Samaritan Hospital Medical Center* 1000 Montauk Highway West Islip, New York 11795
Good Samaritan Hospital of Suffern 255 Lafayette Avenue Suffern, New York 10901
Huntington Hospital* 270 Park Avenue Huntington, New York 11743
Jamaica Hospital Medical Center* 89th Avenue and Van Wyck Expressway Jamaica, New York 11418
Lenox Hill Hospital 100 East 77th Street New York, New York 10021
Long Island Jewish Medical Center 270-05 76th Avenue New Hyde Park, New York 11040
Lutheran Medical Center* 150 55th Street Brooklyn, New York 11220
Maimonides Medical Center 4802 Tenth Avenue Brooklyn, New York 11219
Mercy Hospital of Buffalo 565 Abbott Road Buffalo, New York 14220
Millard Fillmore Hospital** 3 Gates Circle Buffalo, New York 14209
Montefiore Medical Center @ Henry & Lucy Moses Division 111 East 210th Street Bronx, New York 11219
70
Montefiore Medical Center @ Jack D. Weiler Hospital of A. Einstein College 1825 Eastchester Road Bronx, New York 10461
Mount Sinai Beth Israel 10 Nathan D. Perlman Place New York, New York 10003
Mount Sinai Hospital One Gustave L. Levy Place New York, New York 10019
Mount Sinai St. Luke’s 11-11 Amsterdam Avenue at 114th Street New York, New York 10025
New York Methodist Hospital 506 Sixth Street Brooklyn, New York 11215
NY Presbyterian Hospital @ Columbia Presbyterian Center 161 Fort Washington Avenue New York, New York 10032
NY Presbyterian @ Lawrence Hospital†† 55 Palmer Avenue Bronxville, New York 10708
NY Presbyterian – Queens 56-45 Main Street Flushing, New York 11355
NY Presbyterian Hospital @ New York Weill Cornell College 525 East 68th Street New York, New York 10021
NYU Hospitals Center 550 First Avenue New York, New York 10016
North Shore University Hospital 300 Community Drive Manhasset, New York 11030
Olean General Hospital* 515 Main Street Olean, New York 14760
Orange Regional Medical Center* 707 East Main Street Middletown, New York 10940
Richmond University Medical Center* 355 Bard Avenue Staten Island, New York 10310
Rochester General Hospital 1425 Portland Avenue Rochester, New York 14621
Samaritan Hospital* 2215 Burdett Avenue Troy, NY 12180
Saratoga Hospital*†† 211 Church Street Saratoga Springs, New York 12866
South Nassau Communities Hospital* One Healthy Way Oceanside, New York 11572
Southside Hospital 301 East Main Street Bayshore, New York 11706
St. Barnabas Hospital* 4422 3rd Avenue Bronx, New York 10457
St. Catherine of Siena Medical Center* 50 Route 25A Smithtown, New York 11787
St. Elizabeth Medical Center 2209 Genesee Street Utica, New York 13413
St. Francis Hospital Port Washington Boulevard Roslyn, New York 11576
St. Joseph’s Hospital Health Center 301 Prospect Avenue Syracuse, New York 13203
St. Luke’s Cornwall Hospital* 70 Dubois Street Newburgh, New York 12550
St. Peter’s Hospital 315 South Manning Boulevard Albany, New York 12208
Staten Island University Hospital – North 475 Seaview Avenue Staten Island, New York 10305
Strong Memorial Hospital 601 Elmwood Avenue Rochester, New York 14642
SUNY Downstate Medical Center at Long Island College Hospital** 340 Henry Street Brooklyn, New York 11201
71
UHS Wilson Medical Center 33-57 Harrison Street Johnson City, New York 13790
The Unity Hospital of Rochester* 1555 Long Pond Road Rochester, New York 14626
University Hospital at Stony Brook Stony Brook, New York 11794-8410
University Hospital of Brooklyn 450 Lenox Road Brooklyn, New York 11203
Upstate University Hospital – State University of New York 750 East Adams Street Syracuse, New York 13210
Vassar Brothers Medical Center 45 Reade Place Poughkeepsie, New York 12601
Westchester Medical Center Grasslands Road Valhalla, New York 10595
White Plains Hospital* 41 East Post Road White Plains, NY 10601
Winthrop University Hospital 259 First Street Mineola, New York 11501
* Hospital performs PCI without cardiac surgery on-site ** Hospital Closed or No Longer Performs PCI †† Hospital started PCI after November 2014
Additional copies of this report may be obtained through the Department of Health web site at http://www.nyhealth.gov
or by writing to:
Cardiac Box 2000 New York State Department of Health Albany, New York 12220

Departmentof Health
5/17