Embed Size (px)
Citation preview
Evening Monsoon thunderstorm looking south from the base of Camelback Mountain, 6-28-2012, D. Henz
Flood Control District of Maricopa County
Engineering Division, Flood Warning Branch
MSP Verification Report: Monsoon Season 2012
FCDMC – 2801 W. Durango St. Phoenix, AZ 85009 (602) 506-8655
2
TABLE OF CONTENTS
INTRODUCTION ............................................................................................................. 3
MSP PRODUCT DESCRIPTION ...................................................................................... 4
2012 MONSOON SEASON RECAP ................................................................................ 6
MSP VERIFICATION METRICS AND CRITERIA ............................................................ 9
MSP OUTLOOK VERIFICATION .................................................................................. 12
MSP MESSAGE VERIFICATION .................................................................................... 14
SUMMARY ..................................................................................................................... 16
APPENDIX A: MSP OUTLOOKS – VERIFICATION TABLES ....................................... 17
APPENDIX B: MSP MESSAGES – VERIFICATION TABLES ........................................ 54
FCDMC – 2801 W. Durango St. Phoenix, AZ 85009 (602) 506-8655
3
INTRODUCTION
This report was generated by the Flood Warning Branch of the Flood Control District of
Maricopa County (FCDMC). It covers the length of the monsoon season as defined by the
National Weather Service, June 15th- September 30th. This report includes daily records on
Weather Outlooks and Statements issued by the Meteorological Services Program (MSP) as
well as a complete verification and summary of these products.
The Flood Warning Branch of the FCDMC operates a year round MSP that’s purpose is to
provide detailed meteorological forecasts and support to county, city, and other local agencies.
The program covers 5,400 square miles encompassing Maricopa County and surrounding
watersheds. The goal of the Flood Control District’s MSP is to reduce response time for
emergency managers by providing timely and accurate weather information, primarily
regarding the potential for flood-producing rainfall. During the length of the Monsoon season
the MSP goes on a weekly rotating 24/7 manned schedule. A Duty Officer is selected for each
day who is responsible for issuing MSP products, providing support to clients, and serves as
the on-call supervisor during non-business hours. A supporting officer is also named and can
be available to the duty officer in the case of a significant weather event. All MSP forecast
products are disseminated via email, fax, and occasionally via pager. Emergency managers
may also be notified by telephone to aid in decision making.
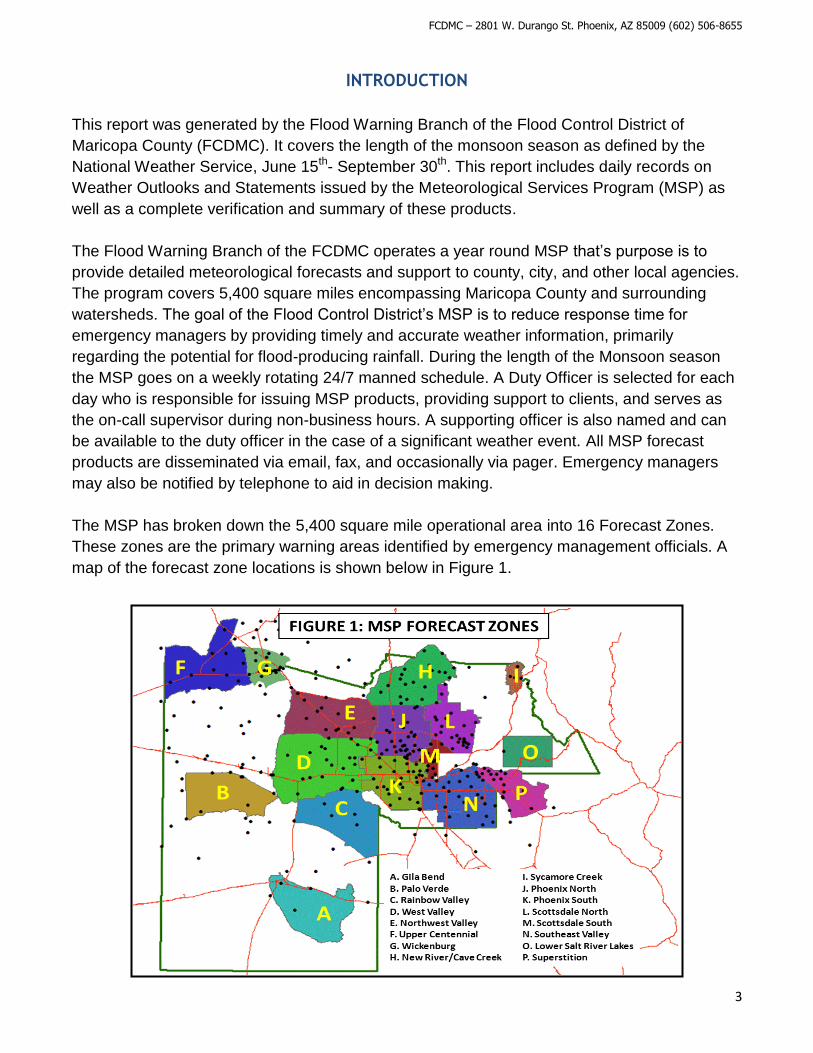
The MSP has broken down the 5,400 square mile operational area into 16 Forecast Zones.
These zones are the primary warning areas identified by emergency management officials. A
map of the forecast zone locations is shown below in Figure 1.
FCDMC – 2801 W. Durango St. Phoenix, AZ 85009 (602) 506-8655
4
MSP PRODUCT DESCRIPTION
Weather Outlook:
The Weather Outlook is disseminated to clients daily no later than 2PM during the monsoon
season. This product covers the today through tomorrow period and occasionally the following
2-3 days where appropriate. Occasionally, due to unexpected weather pattern changes,
Weather Outlooks will be updated throughout the day or first thing the following morning.
Weather Outlooks include a synopsis of expected weather conditions; the “probability of
occurrence” of rain; the expected “prime time” for the bulk of the rain; and the amount of rain
expected during the prime time period. Temperature forecasts and trends are included as well
as a forecast of peak wind speeds.
Message 1 – Alert:
When it is believed developing weather conditions may lead to heavy rain and/or minor to
moderate flooding an Alert is issued. Lead time will generally be less than an hour in advance
of the expected event. The Alert will normally identify the affected zone(s), the time frame of
the event (valid time), rainfall potential, and the type of areas that will be impacted, such as
roads and/or washes.
Message 2 – Flash Flood Watch:
When it appears the developing weather event may lead to flash flooding a Watch is issued for
the possible affected areas. Lead time will generally be 1 to 2 hours in advance of the
expected event. The Watch will include the time frame it will be in effect (valid time), and a
section describing what may take place (comments).
Message 3 – Flash Flood Warning:
When it appears that significant flash flooding is imminent or has started to take place, a
Warning will be issued for the affected areas. Lead time will generally be less than an hour.
The Warning will normally identify the affected zone(s), a time frame of the event, rainfall
potential, and a section describing what is expected to take place (comments).
Message 1, 2 and 3 Update:
This product, issued as needed, will update an existing Alert, Watch or Warning.
Message 4 – Cancel:
When an event (Watch or Warning) no longer poses a threat, and the expiration time has not
been reached, a Cancel message may be issued.
Lake Alerts:
In addition to the above MSP program, weather guidance is provided for Maricopa County
lakes/reservoirs form June 15 through October 15. Lake Alerts are issued as needed to inform
of approaching adverse weather conditions. Emphasis in these statements is on expected
wind gusts and lightning activity.
FCDMC – 2801 W. Durango St. Phoenix, AZ 85009 (602) 506-8655
5
Additional Products:
During the summer months, a program exists to aid the Boy Scouts at Camp Geronimo.
Though not in Maricopa County, many of the scouts reside within the County. A call is made to
the officials at the camp when needed, stating the expected flood problem.
At the request of clients, site specific products may be issued to support unusual or special
operations, such as specific wind forecasts to aid in the fighting of fires, or forecasting for
special events at the County lakes or parks, or District construction projects.
Additional information and data regarding the FCDMC can be found online here
FCDMC – 2801 W. Durango St. Phoenix, AZ 85009 (602) 506-8655
6
2012 MONSOON SEASON RECAP
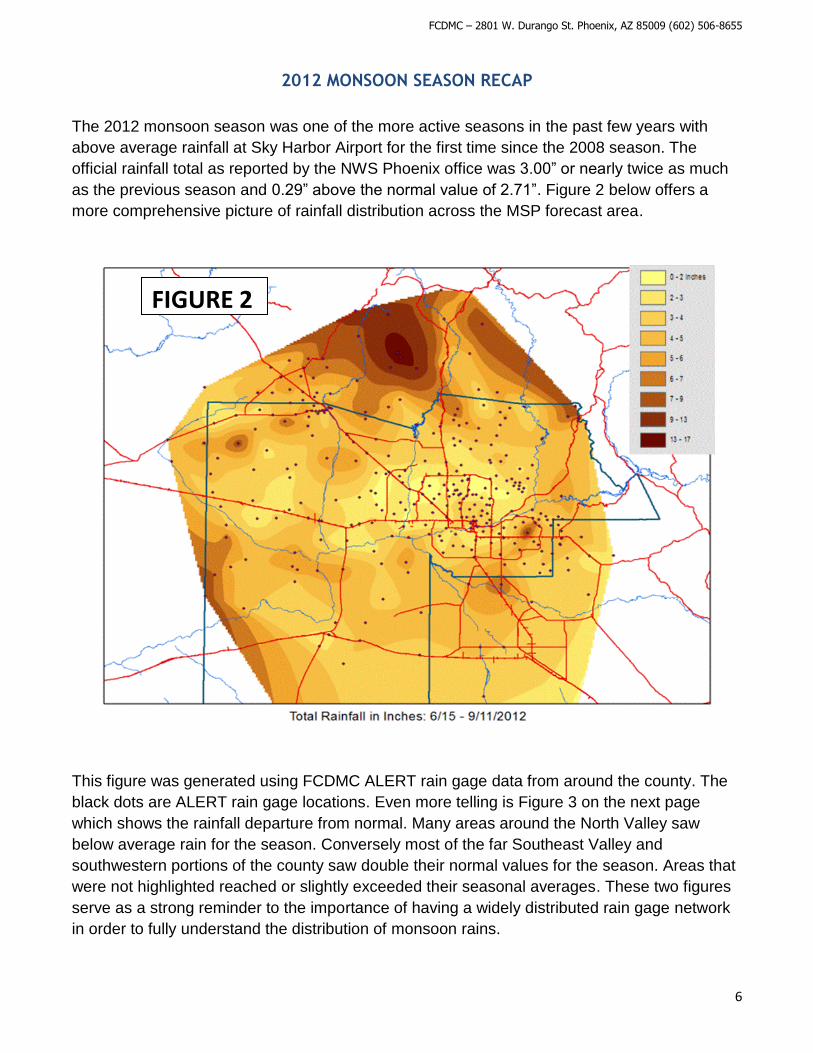
The 2012 monsoon season was one of the more active seasons in the past few years with
above average rainfall at Sky Harbor Airport for the first time since the 2008 season. The
official rainfall total as reported by the NWS Phoenix office was 3.00” or nearly twice as much
as the previous season and 0.29” above the normal value of 2.71”. Figure 2 below offers a
more comprehensive picture of rainfall distribution across the MSP forecast area.
This figure was generated using FCDMC ALERT rain gage data from around the county. The
black dots are ALERT rain gage locations. Even more telling is Figure 3 on the next page
which shows the rainfall departure from normal. Many areas around the North Valley saw
below average rain for the season. Conversely most of the far Southeast Valley and
southwestern portions of the county saw double their normal values for the season. Areas that
were not highlighted reached or slightly exceeded their seasonal averages. These two figures
serve as a strong reminder to the importance of having a widely distributed rain gage network
in order to fully understand the distribution of monsoon rains.
FIGURE 2
FCDMC – 2801 W. Durango St. Phoenix, AZ 85009 (602) 506-8655
7
The season got off to a slow start rain-wise across central AZ with excessive heat dominating
the second half of June (tied for 2nd warmest average temperature for the month on record)
and an over-abundance of dust storms moving north into the Valley out of Pinal County. The
first active multi-day period of storms did not come until July 12th-15th, which was highlighted
by area wide heavy rains on July 14th. July finished with a bang as several heavy rain events
occurred within its final week. In particular, heavy rains in Anthem on July 31st (storm reports
of up to 5.00”) led to localized severe flooding along Deadman Wash and Gavilan Peak Wash.
For more information on this event, please refer to the official FCDMC Storm Report.
The first two weeks of August were met with unrelenting heat across the Valley owing to an
extended break-period in the monsoon. New daily record high temperatures were set at
Phoenix Sky Harbor Airport on August 7th-9th and 12th-15th respectively. The second half of the
month was very active with multiple rain and flooding events occurring between the 16th and
24th. Most notably peak flows of record were observed along Rainbow Wash on the evening of
the 21st and along Indian Bend Wash on the 23rd.
The beginning of September remained quite active with heavy rain events occurring on 6 of the
first 10 days. The 7th saw widespread heavy rains move across the majority of the county
during the morning hours ultimately leading to flooding across portions of the Southeast Valley
and later along Waterman Wash in southern Goodyear. The last day of notable weather
occurred on the evening of the 10th where heavy rains fell over the New River and Cave Creek
FIGURE 3
FCDMC – 2801 W. Durango St. Phoenix, AZ 85009 (602) 506-8655
8
areas causing a peak flow of record along Cline Creek. For the remainder of the month the
monsoon season existed in name only with dry conditions to its official finish on the 30th.
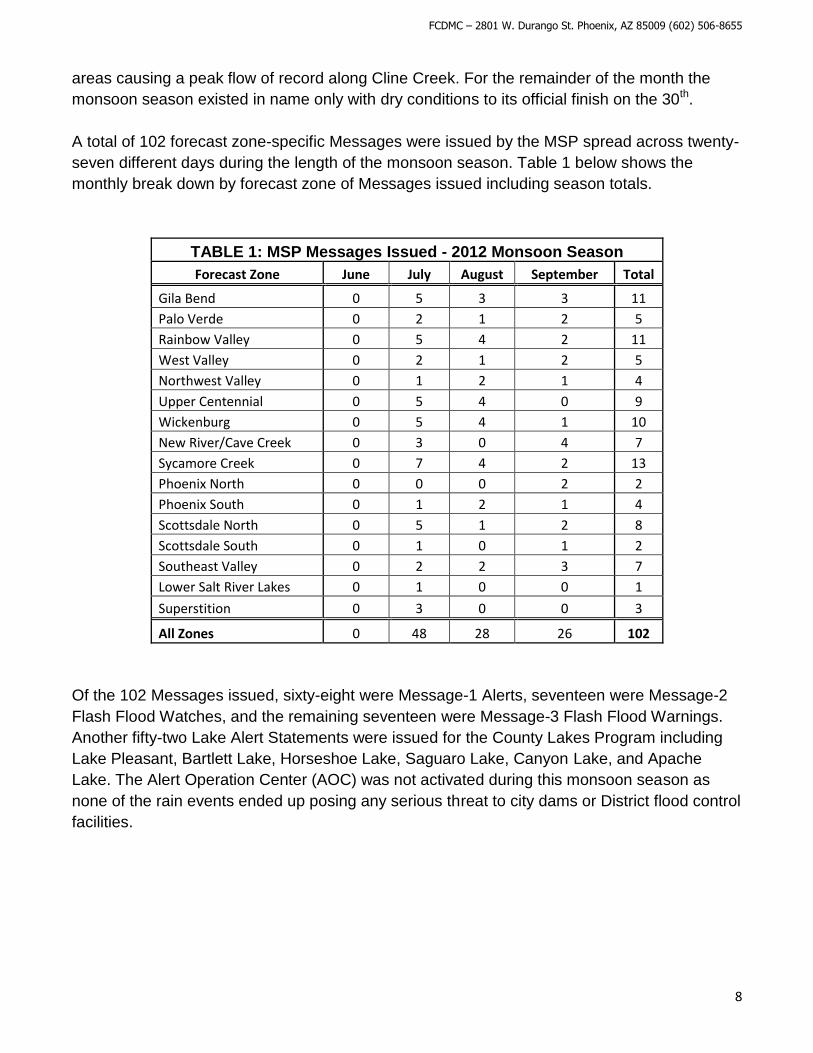
A total of 102 forecast zone-specific Messages were issued by the MSP spread across twenty-
seven different days during the length of the monsoon season. Table 1 below shows the
monthly break down by forecast zone of Messages issued including season totals.
TABLE 1: MSP Messages Issued - 2012 Monsoon Season
Forecast Zone June July August September Total
Gila Bend 0 5 3 3 11
Palo Verde 0 2 1 2 5
Rainbow Valley 0 5 4 2 11
West Valley 0 2 1 2 5
Northwest Valley 0 1 2 1 4
Upper Centennial 0 5 4 0 9
Wickenburg 0 5 4 1 10
New River/Cave Creek 0 3 0 4 7
Sycamore Creek 0 7 4 2 13
Phoenix North 0 0 0 2 2
Phoenix South 0 1 2 1 4
Scottsdale North 0 5 1 2 8
Scottsdale South 0 1 0 1 2
Southeast Valley 0 2 2 3 7
Lower Salt River Lakes 0 1 0 0 1
Superstition 0 3 0 0 3
All Zones 0 48 28 26 102
Of the 102 Messages issued, sixty-eight were Message-1 Alerts, seventeen were Message-2
Flash Flood Watches, and the remaining seventeen were Message-3 Flash Flood Warnings.
Another fifty-two Lake Alert Statements were issued for the County Lakes Program including
Lake Pleasant, Bartlett Lake, Horseshoe Lake, Saguaro Lake, Canyon Lake, and Apache
Lake. The Alert Operation Center (AOC) was not activated during this monsoon season as
none of the rain events ended up posing any serious threat to city dams or District flood control
facilities.
FCDMC – 2801 W. Durango St. Phoenix, AZ 85009 (602) 506-8655
9
MSP VERIFICATION METRICS AND CRITERIA
Several key verification metrics and a clear set of operational based criteria were adopted in
order to conduct a thorough and complete verification of MSP products issued during the 2012
monsoon season. This chapter is broken down into three sections: Outlooks, Messages, and
QPF Peak Intensity and Storm Total Precipitation. Each section discusses the verification
metrics used and the criteria followed to compute the statistics displayed in the summary
chapter sections. A list of frequently used terms including definitions and acronyms as used
throughout this report is listed below.
Observed Rainfall: the amounts of total rainfall gathered from either ALERT rain gages, gage
corrected radar estimations, or local storm reports (LSRs).
Operationally Significant Event (OSE): a rain event within a MSP forecast zone with observed
rainfall equal or greater than 0.50”.
Hit: considered a correct forecast.
Miss: considered an incorrect forecast.
Forecast Accuracy: a measure of the ability to correctly forecast daily rainfall potential. Given
in percent and calculated using Equation 1 below:
Probability of Detection (POD): a measure of the ability to correctly discriminate heavy rain
days (OSEs) from non-rain/minor rain days. Given in percent and calculated using Equation 2
below:
False Alarm: occurs an OSE is forecast for a location but does not occur.
False Alarm Rate: measures the number of false alarms compared to forecast days i.e. over-
forecasting. Given in percent and calculated using the Equation 3 below:
Quantitative Precipitation Forecast (QPF): forecast zone or basin specific rainfall forecast
including a rainfall amount given in inches and/or intensity.
FCDMC – 2801 W. Durango St. Phoenix, AZ 85009 (602) 506-8655
10
Rainfall Intensity: the rate at which rain is falling including an amount in inches over a specific
time period i.e. 0.50”/30min.
Storm Total Precipitation (STP): total rainfall from an identified storm or storm complex, given
in inches.
Probability of Occurrence: forecast confidence, given in percent, that rainfall that could occur
within a forecast zone or basin, usually given in conjunction with a QPF.
The following two sections explain the development of verification statistics as tabulated in
Appendix A.
OUTLOOKS:
Forecast Accuracy:
Either a hit or a miss was selected for each day. A hit was assigned when observed rainfall
met or exceeded the QPF. A miss was assigned when rainfall was observed and no QPF was
made or if observed rainfall failed to reasonably meet the QPF. In some cases a hit was
assigned when the QPF was not reasonably met by observed rainfall. In these cases the
probability of occurrence was 30% or less and the QPF was below the OSE threshold. Values
were then populated for each forecast zone and all zones combined. Forecast accuracy was
then calculated by month.
Probability of Detection:
A dash was assigned to all days when observed rainfall was below the OSE threshold. On
days when observed rainfall met or exceeded the OSE threshold either a hit or a miss was
assigned. A hit was selected when the observed rainfall reasonably met the QPF. A miss was
assigned when observed rainfall greatly exceeded the QPF or if no QPF was issued. Values
were then populated for each forecast zone and all zones combined. A probability of detection
was calculated by month and season total.
False Alarm Rate:
False alarms were denoted by an “x”. A false alarm was assigned on days where the observed
rainfall failed to meet the OSE threshold, yet the QPF called for an OSE with a high probability
of occurrence. The two relationships below outline the above criteria.
Probability ≥ 40% and QPF ≥ 0.50” AND Observed Rain < 0.50”
Probability = 30% and QPF ≥ 1.00” AND Observed Rain < 0.50”
Values were then populated for each forecast zone and all zones combined. False alarm rate
was then calculated by month and season total.
FCDMC – 2801 W. Durango St. Phoenix, AZ 85009 (602) 506-8655
11
Tables containing all of the raw data used in generating the verification metrics discussed
above for the MSP daily Outlooks can be found in Appendix A.
MESSAGES:
Forecast Accuracy:
A hit was assigned if a rain, stream, or dam alarm was triggered during the valid period of the
issued Message and/or if observed rainfall reasonably met the QPF during the valid period.
Conversely a miss was assigned if neither of these two criteria were met. Values were then
populated for each forecast zone and all zones combined. Forecast accuracy was then
calculated by month and season total.
Tables containing all of the raw data used in generating the verification metrics discussed
above for the MSP Messages can be found in Appendix B.
FCDMC – 2801 W. Durango St. Phoenix, AZ 85009 (602) 506-8655
12
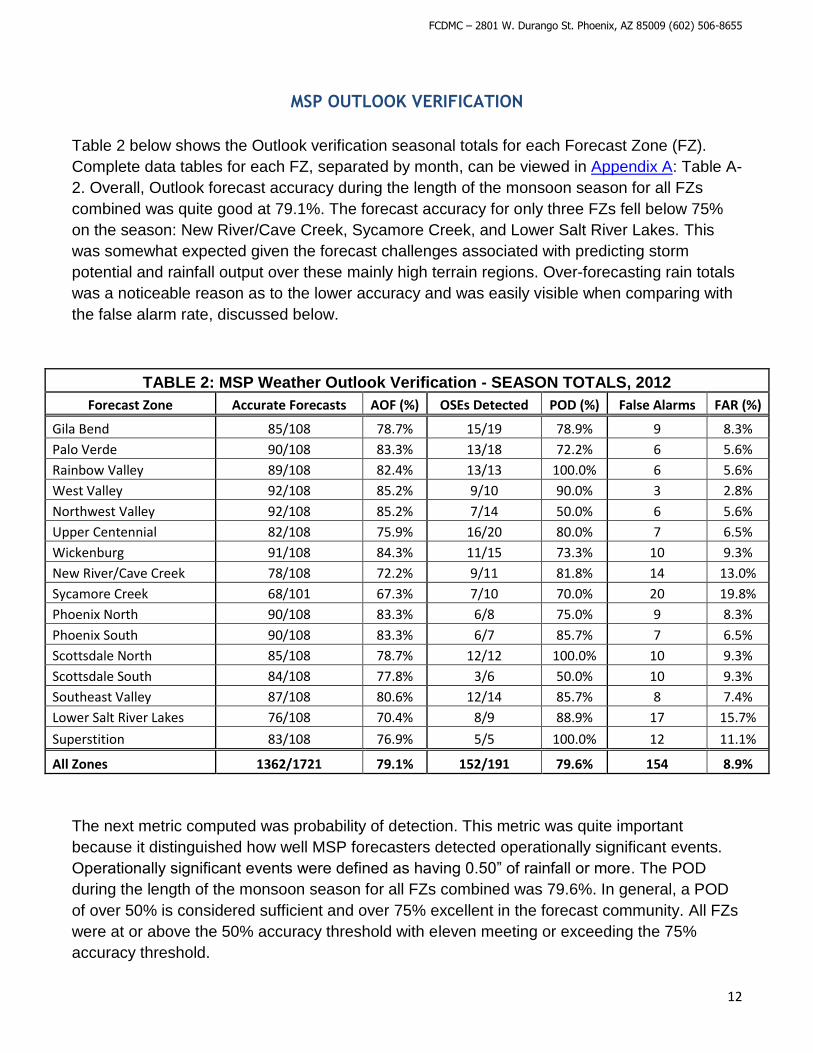
MSP OUTLOOK VERIFICATION
Table 2 below shows the Outlook verification seasonal totals for each Forecast Zone (FZ).
Complete data tables for each FZ, separated by month, can be viewed in Appendix A: Table A-
2. Overall, Outlook forecast accuracy during the length of the monsoon season for all FZs
combined was quite good at 79.1%. The forecast accuracy for only three FZs fell below 75%
on the season: New River/Cave Creek, Sycamore Creek, and Lower Salt River Lakes. This
was somewhat expected given the forecast challenges associated with predicting storm
potential and rainfall output over these mainly high terrain regions. Over-forecasting rain totals
was a noticeable reason as to the lower accuracy and was easily visible when comparing with
the false alarm rate, discussed below.
TABLE 2: MSP Weather Outlook Verification - SEASON TOTALS, 2012
Forecast Zone Accurate Forecasts AOF (%) OSEs Detected POD (%) False Alarms FAR (%)
Gila Bend 85/108 78.7% 15/19 78.9% 9 8.3%
Palo Verde 90/108 83.3% 13/18 72.2% 6 5.6%
Rainbow Valley 89/108 82.4% 13/13 100.0% 6 5.6%
West Valley 92/108 85.2% 9/10 90.0% 3 2.8%
Northwest Valley 92/108 85.2% 7/14 50.0% 6 5.6%
Upper Centennial 82/108 75.9% 16/20 80.0% 7 6.5%
Wickenburg 91/108 84.3% 11/15 73.3% 10 9.3%
New River/Cave Creek 78/108 72.2% 9/11 81.8% 14 13.0%
Sycamore Creek 68/101 67.3% 7/10 70.0% 20 19.8%
Phoenix North 90/108 83.3% 6/8 75.0% 9 8.3%
Phoenix South 90/108 83.3% 6/7 85.7% 7 6.5%
Scottsdale North 85/108 78.7% 12/12 100.0% 10 9.3%
Scottsdale South 84/108 77.8% 3/6 50.0% 10 9.3%
Southeast Valley 87/108 80.6% 12/14 85.7% 8 7.4%
Lower Salt River Lakes 76/108 70.4% 8/9 88.9% 17 15.7%
Superstition 83/108 76.9% 5/5 100.0% 12 11.1%
All Zones 1362/1721 79.1% 152/191 79.6% 154 8.9%
The next metric computed was probability of detection. This metric was quite important
because it distinguished how well MSP forecasters detected operationally significant events.
Operationally significant events were defined as having 0.50” of rainfall or more. The POD
during the length of the monsoon season for all FZs combined was 79.6%. In general, a POD
of over 50% is considered sufficient and over 75% excellent in the forecast community. All FZs
were at or above the 50% accuracy threshold with eleven meeting or exceeding the 75%
accuracy threshold.
FCDMC – 2801 W. Durango St. Phoenix, AZ 85009 (602) 506-8655
13
The final metric included in Table 2 was FAR or false alarm rate. It is important to keep track of
how often MSP forecasters predicted an operationally significant flooding day that did not
occur. Too many false alarms can degrade user confidence in the forecasts. In general a FAR
below 50% is sufficient and below 25% is considered excellent within the forecast community.
The overall FAR for all zones during the length of the Monsoon Season was very low at 8.9%
with none of the forecast zones exceeding 20%.
FCDMC – 2801 W. Durango St. Phoenix, AZ 85009 (602) 506-8655
14
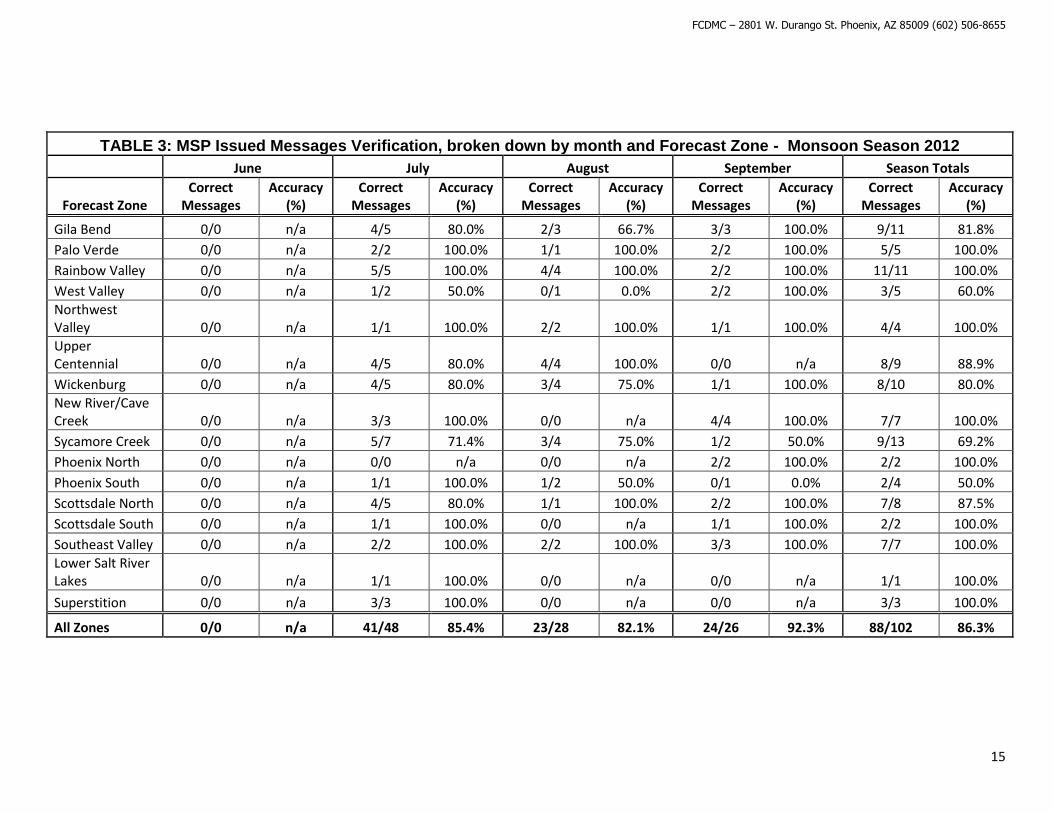
MSP MESSAGE VERIFICATION
The MSP Messages carry a higher priority threat-wise than the daily Outlooks. These
statements (Alerts, Watches, and Warnings) serve as the most critical products issued by the
MSP during the monsoon season to our clients. A high level of accuracy is required when
forecasting these types of events as the information they provide is directly applicable to the
potential or imminent flooding situation. All of the Messages issued fall under the category of
operationally significant events.
Table 3 on the next page shows the issued Message verification broken down by FZ and
month. Complete data tables for each FZ can be viewed in Appendix B: Tables B-1 and B-2.
There 102 Messages issued over the length of the season. Forecast accuracy for all FZs
combined, over the length of the season, was exceptional at 86.3%. Thirteen of the sixteen
FZs exceeded the 75% accuracy threshold with the other three at or above the 50% accuracy
threshold. As stated earlier, 50% accuracy is considered sufficient and 75% or above is
considered excellent within the forecast community.
No Messages were issued in June for any of the FZs. July was the busiest month with 48
Messages issued and also included the most active day (the 14th), with eighteen statements
issued. Seventeen out of the eighteen issued Messages that day were considered hits with the
lone miss occurring in the West Valley zone. Forecast Accuracy for the month for all FZs
combined was 85.4%.
August saw less than half the number of Messages issued as July with 28. Overall forecast
accuracy dropped slightly to 82.1%. The main reason for this drop was directly attributable to a
missed forecast on the 22nd of the month. Four of the five misses for the month occurred on
that day where significant rainfall was expected but did not end up occurring until the following
early morning on the 23rd. All four misses were a result to a Flash Flood Watch that had been
issued for nine of the sixteen forecast zones around the county. September saw a marked rise
in overall forecast accuracy at 92.3%. There were only two Messages that were deemed
misses out of the twenty-six issued. The widespread heavy rain event on the 7th of the month
was the second largest day statement wise of the season. Eleven message statements were
issued with only one ruled a miss.
All of the heavy rain events that occurred in zones encompassing the highest terrain regions of
Maricopa County had very high forecast accuracies meeting or exceeding 80%. Sycamore
Creek came in the lowest at 69.2%. This is directly attributable to several over-forecast events
that occurred throughout the season where Message-2s were issued by the MSP. No
significant rain events occurred in the Sycamore Creek forecast zone on those days. Extra
attention was given to this zone as a significant fire occurred within the Sycamore Creek
watershed earlier in the year leaving it highly susceptible to flash flooding.
FCDMC – 2801 W. Durango St. Phoenix, AZ 85009 (602) 506-8655
15
TABLE 3: MSP Issued Messages Verification, broken down by month and Forecast Zone - Monsoon Season 2012
June July August September Season Totals
Forecast Zone Correct
Messages Accuracy
(%) Correct
Messages Accuracy
(%) Correct
Messages Accuracy
(%) Correct
Messages Accuracy
(%) Correct
Messages Accuracy
(%)
Gila Bend 0/0 n/a 4/5 80.0% 2/3 66.7% 3/3 100.0% 9/11 81.8%
Palo Verde 0/0 n/a 2/2 100.0% 1/1 100.0% 2/2 100.0% 5/5 100.0%
Rainbow Valley 0/0 n/a 5/5 100.0% 4/4 100.0% 2/2 100.0% 11/11 100.0%
West Valley 0/0 n/a 1/2 50.0% 0/1 0.0% 2/2 100.0% 3/5 60.0%
Northwest Valley 0/0 n/a 1/1 100.0% 2/2 100.0% 1/1 100.0% 4/4 100.0%
Upper Centennial 0/0 n/a 4/5 80.0% 4/4 100.0% 0/0 n/a 8/9 88.9%
Wickenburg 0/0 n/a 4/5 80.0% 3/4 75.0% 1/1 100.0% 8/10 80.0%
New River/Cave Creek 0/0 n/a 3/3 100.0% 0/0 n/a 4/4 100.0% 7/7 100.0%
Sycamore Creek 0/0 n/a 5/7 71.4% 3/4 75.0% 1/2 50.0% 9/13 69.2%
Phoenix North 0/0 n/a 0/0 n/a 0/0 n/a 2/2 100.0% 2/2 100.0%
Phoenix South 0/0 n/a 1/1 100.0% 1/2 50.0% 0/1 0.0% 2/4 50.0%
Scottsdale North 0/0 n/a 4/5 80.0% 1/1 100.0% 2/2 100.0% 7/8 87.5%
Scottsdale South 0/0 n/a 1/1 100.0% 0/0 n/a 1/1 100.0% 2/2 100.0%
Southeast Valley 0/0 n/a 2/2 100.0% 2/2 100.0% 3/3 100.0% 7/7 100.0%
Lower Salt River Lakes 0/0 n/a 1/1 100.0% 0/0 n/a 0/0 n/a 1/1 100.0%
Superstition 0/0 n/a 3/3 100.0% 0/0 n/a 0/0 n/a 3/3 100.0%
All Zones 0/0 n/a 41/48 85.4% 23/28 82.1% 24/26 92.3% 88/102 86.3%
FCDMC – 2801 W. Durango St. Phoenix, AZ 85009 (602) 506-8655
16
SUMMARY
The Flood Warning Branch of the FCDMC operates a year round Meteorological Services
Program (MSP) that’s purpose is to provide detailed weather forecasts and support to county,
city, and other local agencies encompassing Maricopa County and its contributing watersheds.
In particular, during the length of the monsoon season, it is the specific the goal of the MSP to
reduce response time for emergency managers by providing timely and accurate weather
information, primarily regarding the potential flood-producing rainfall. This report provides a
compiled set of verification statistics based on products issued by the MSP during the length of
the 2012 monsoon season.
Outlooks and Messages were the two products analyzed in this report. Verification of daily
Outlooks was conducted using three metrics: forecast accuracy, probability of detection, and
false alarm rate. When comparing all Forecast Zones combined over the length of the
monsoon season, forecast accuracy was 79.1%, probability of detection was 75%, and the
false alarm rate was 8.9%. Each metric fell into the “excellent” category when equating these
results with accepted values within the forecast community. Verification of Messages was
conducted using forecast accuracy. When comparing all Forecast Zones combined over the
length of the monsoon season, forecast accuracy was 86.3%. Any value of over 75% is
considered “excellent” within the forecast community. In general, the main trend common to all
verification metrics on both Outlooks and Messages was improvement in the percentages over
the length of the season. This trend highlights the fact that forecaster skill and confidence
continued to improve as the season wore on.
It is hoped that this report serves as quantifiable tool used to evaluate forecast performance on
a year to year basis. This report will be continued in subsequent years focusing not only the
present year’s statistical data, but will also serve as a historical comparison to measure future
year’s performance. In addition, future MSP Verification Reports may be expanded to include:
1. Lead time as a metric for determining verification for issued Statements.
2. A complete verification and summary of Lake Alerts issued during the monsoon season.
3. A comprehensive evaluation of the Quantitative Precipitation Forecasts contained within
Messages including peak rainfall intensity and storm total precipitation.
4. A historical comparison between current and previous year’s verification statistics
FCDMC – 2801 W. Durango St. Phoenix, AZ 85009 (602) 506-8655
17
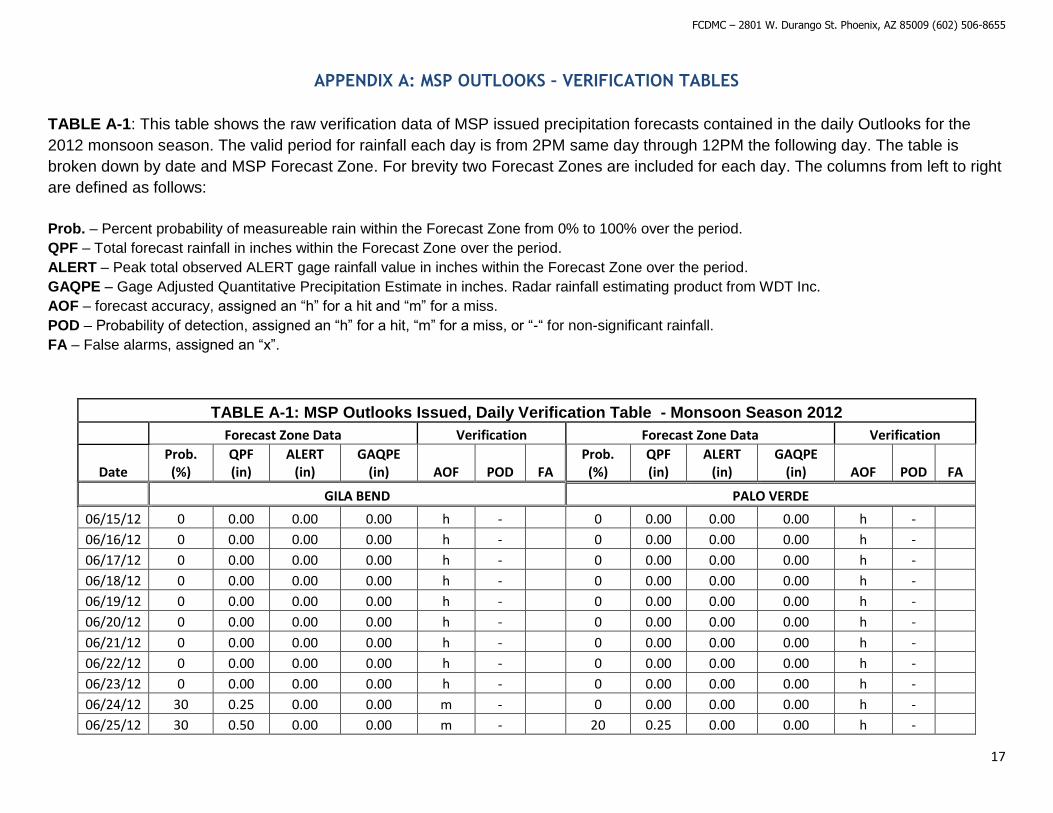
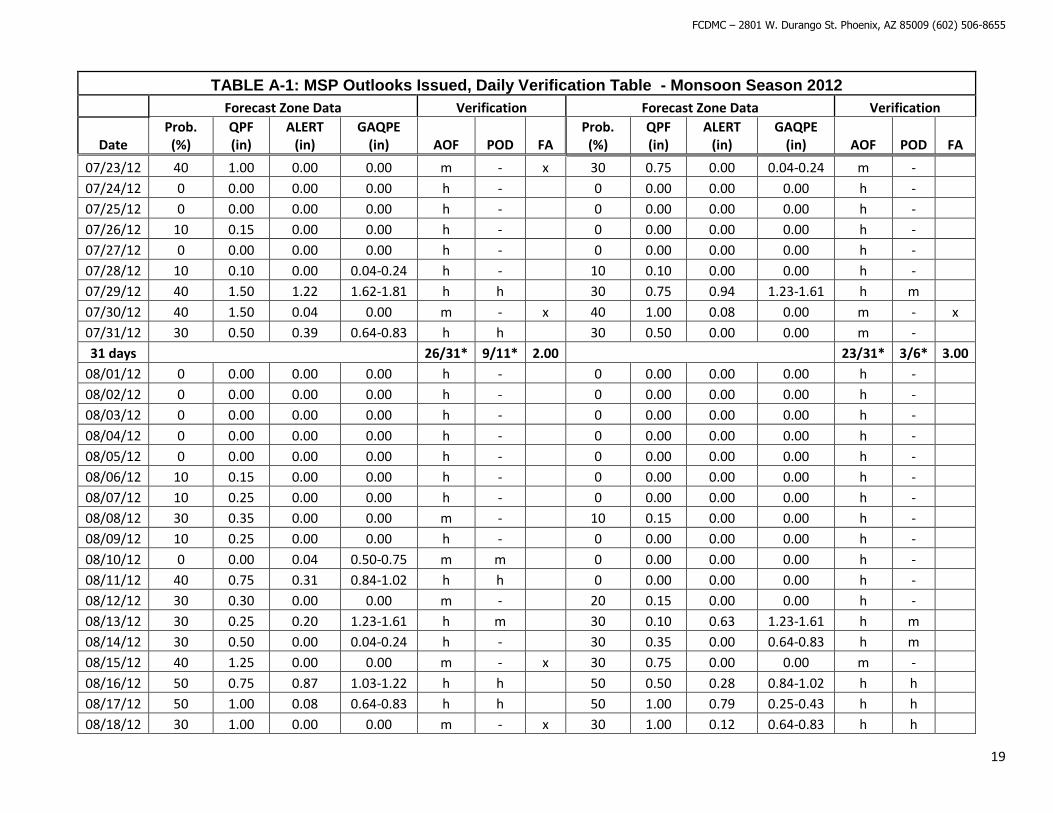
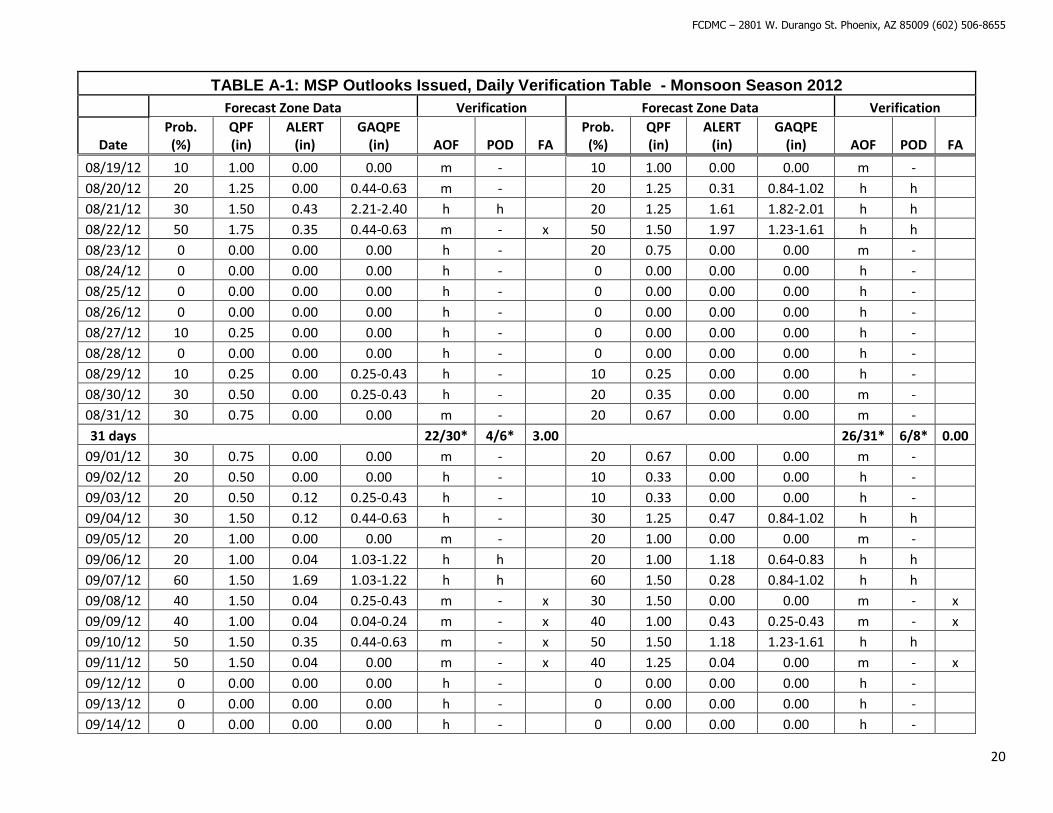
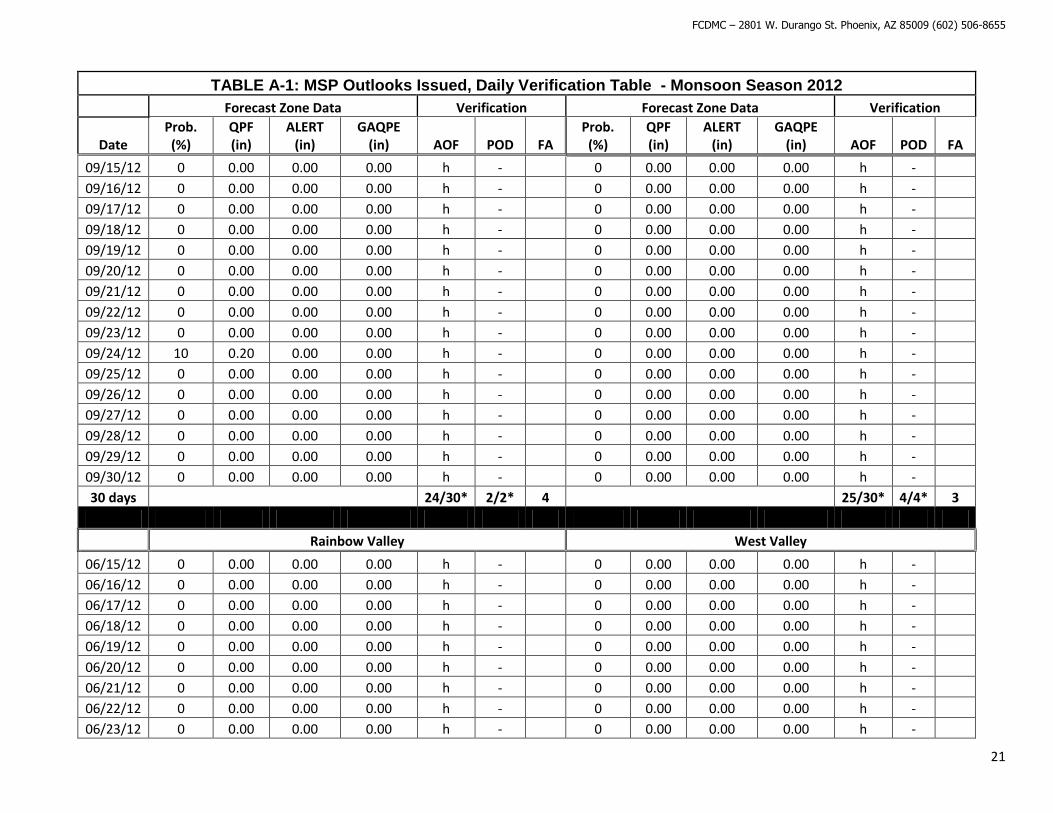
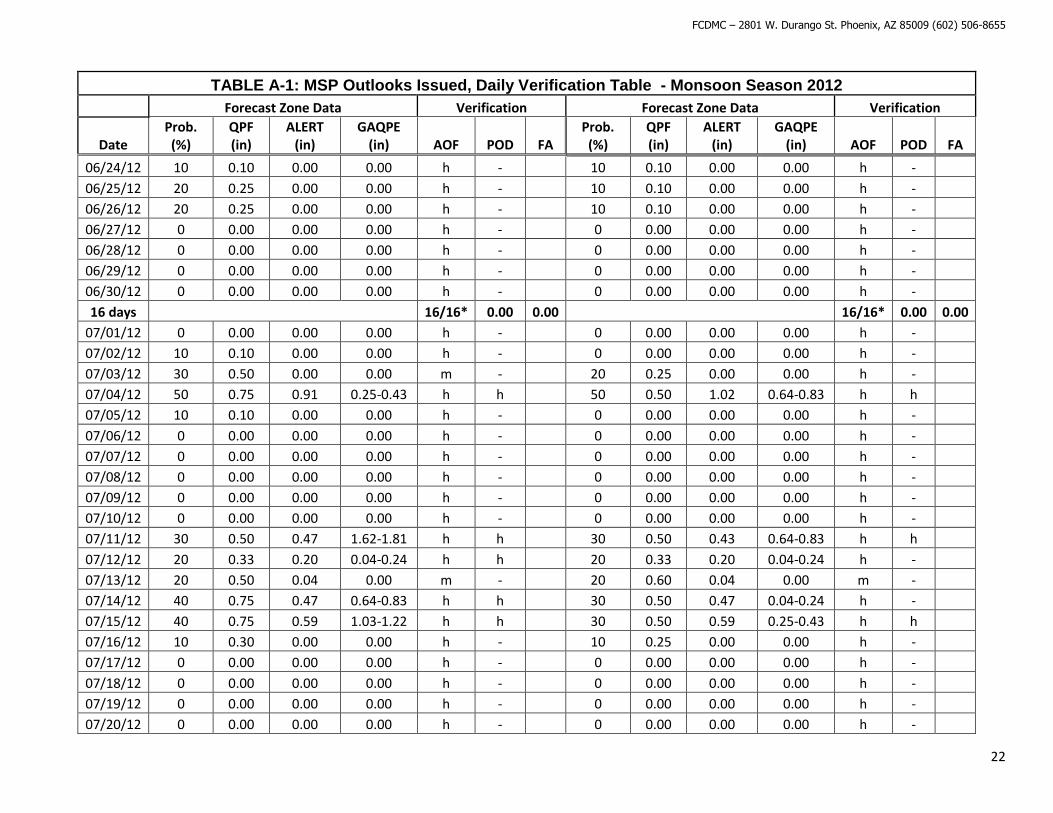
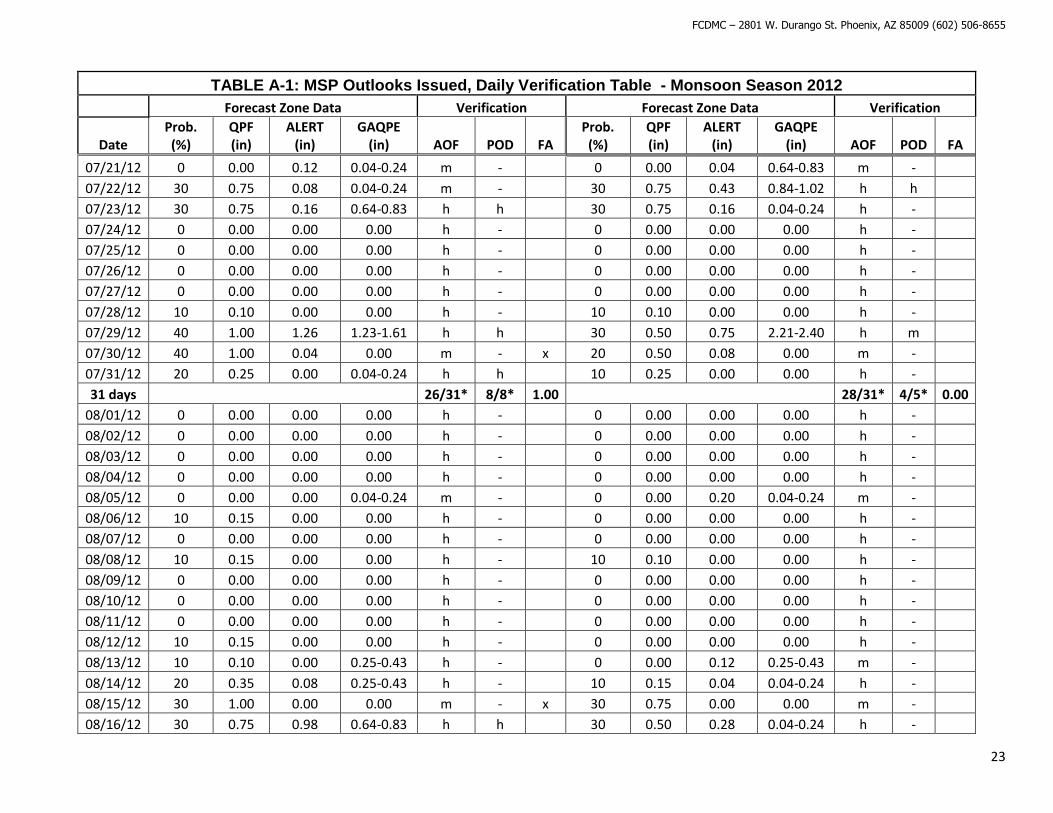
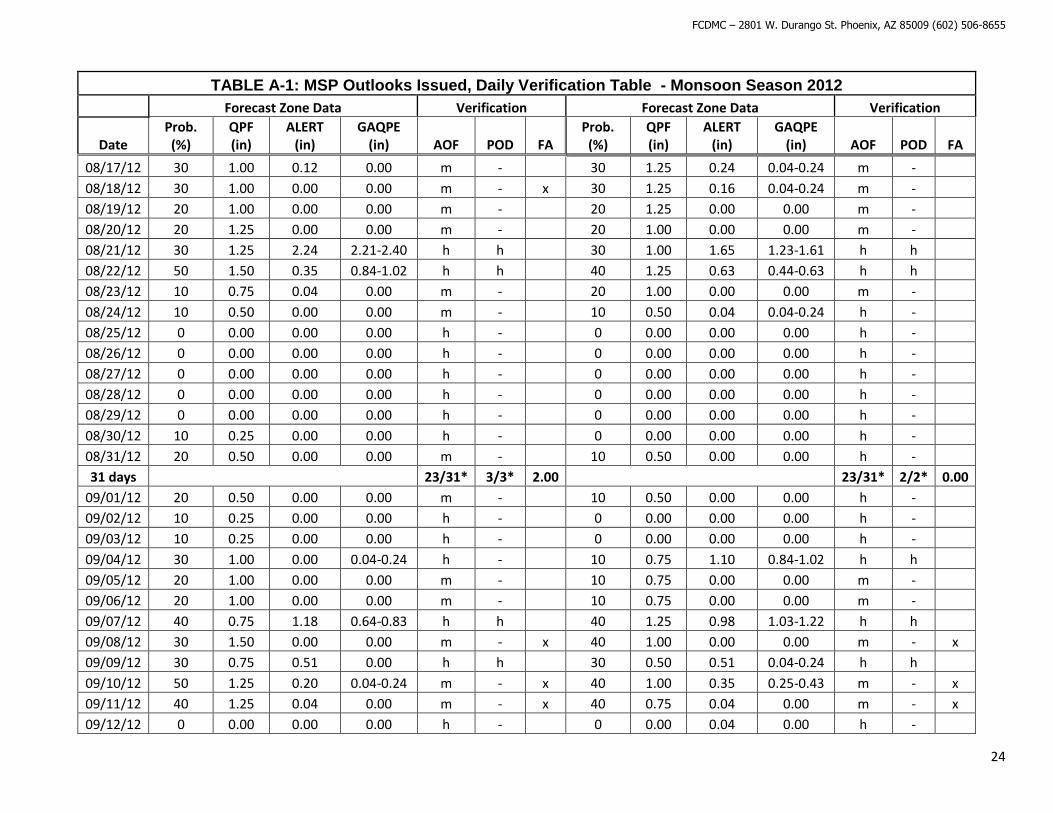
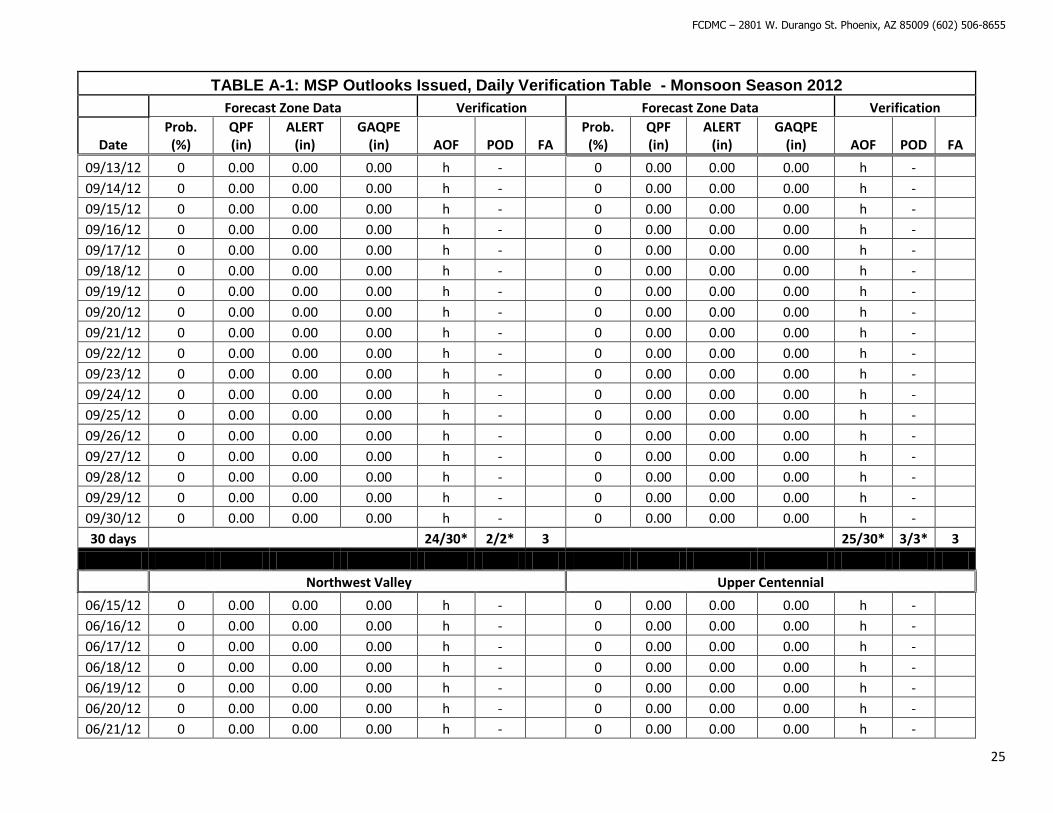
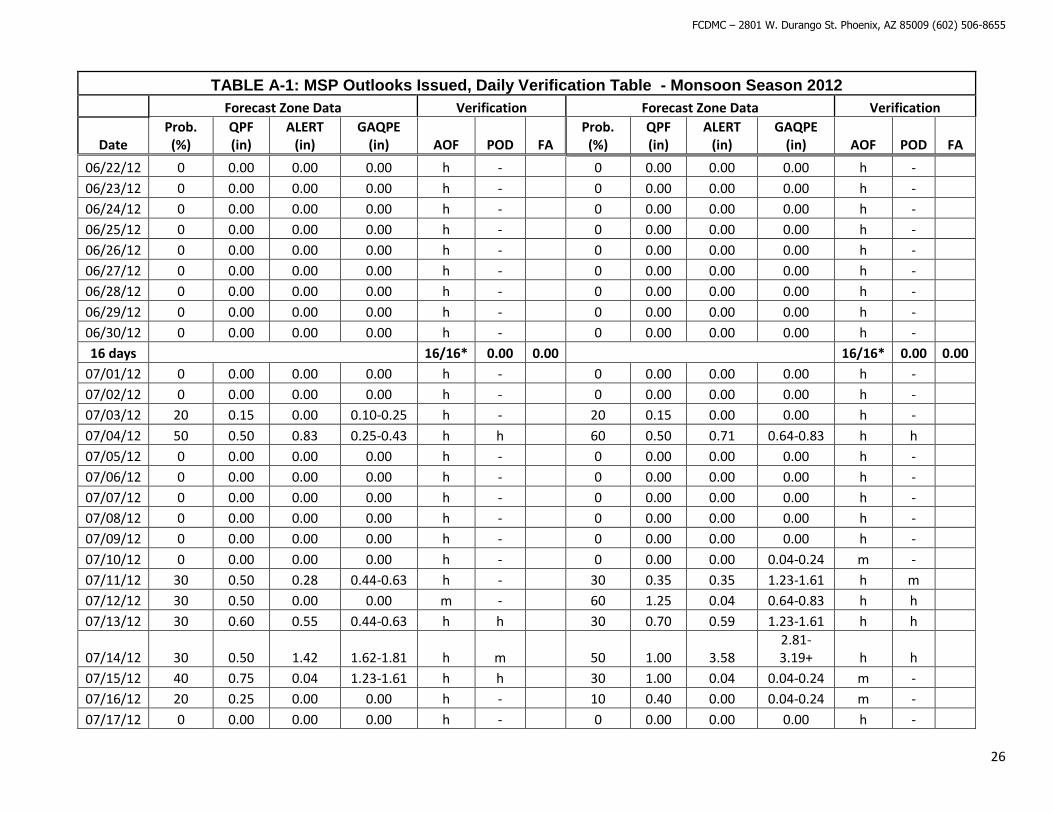
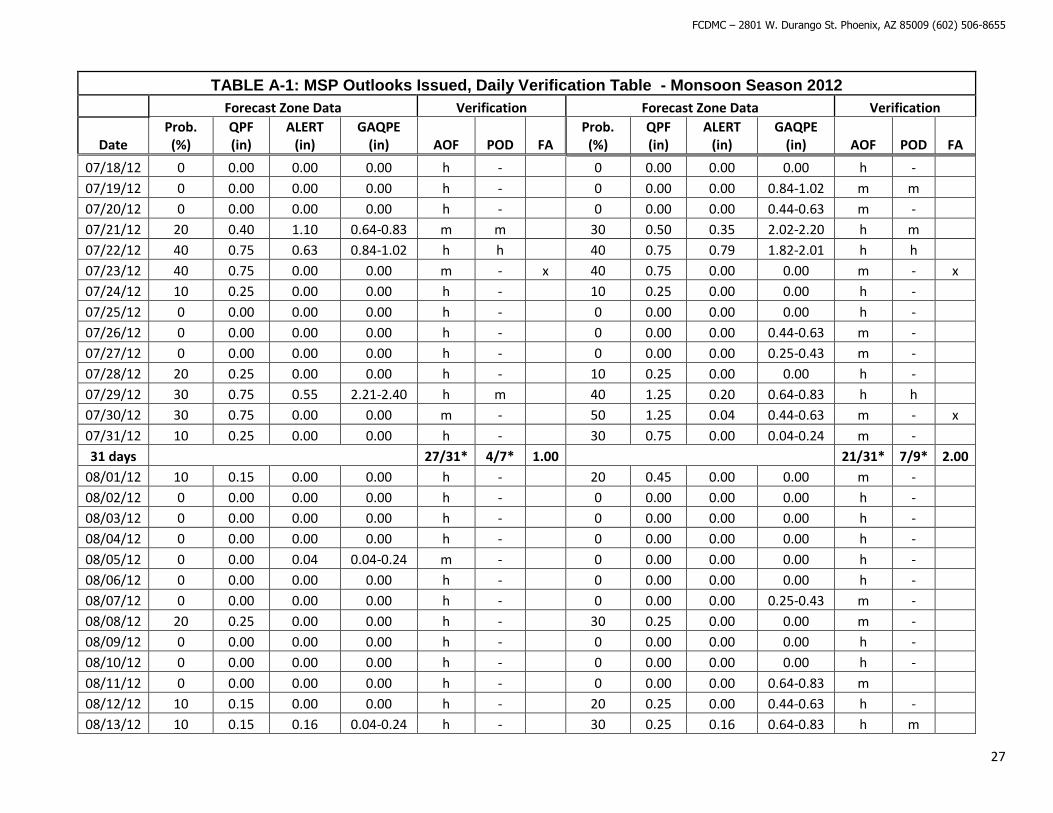
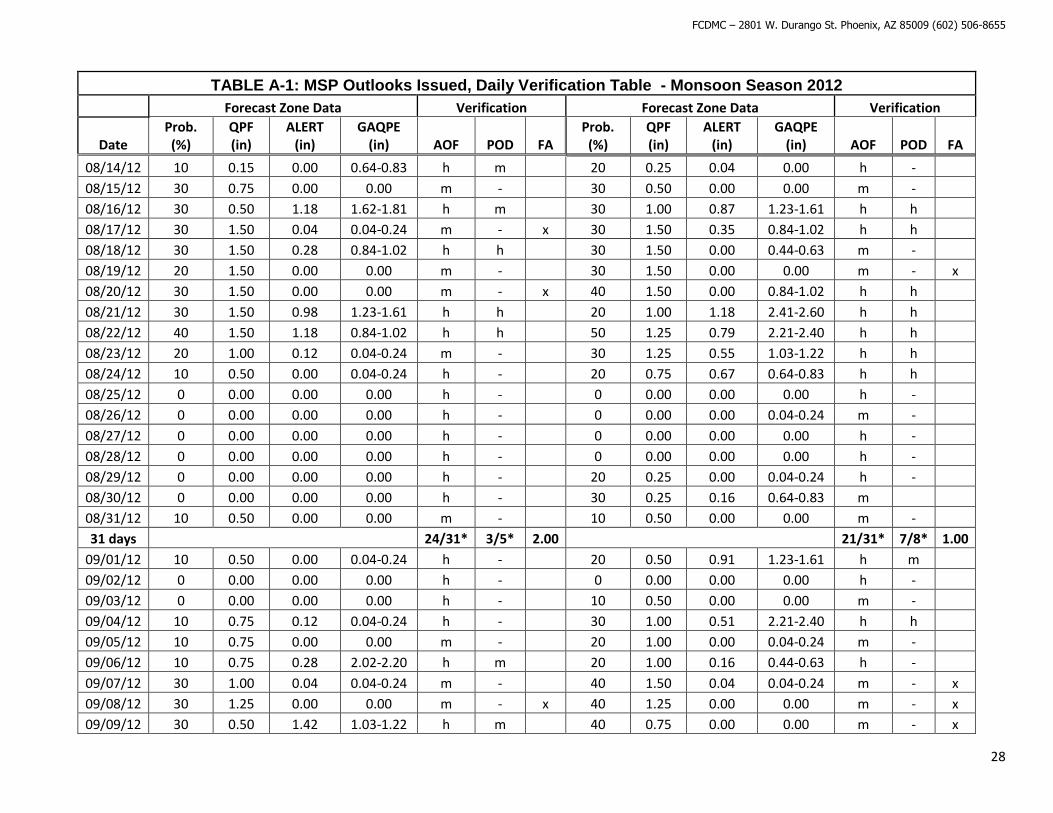
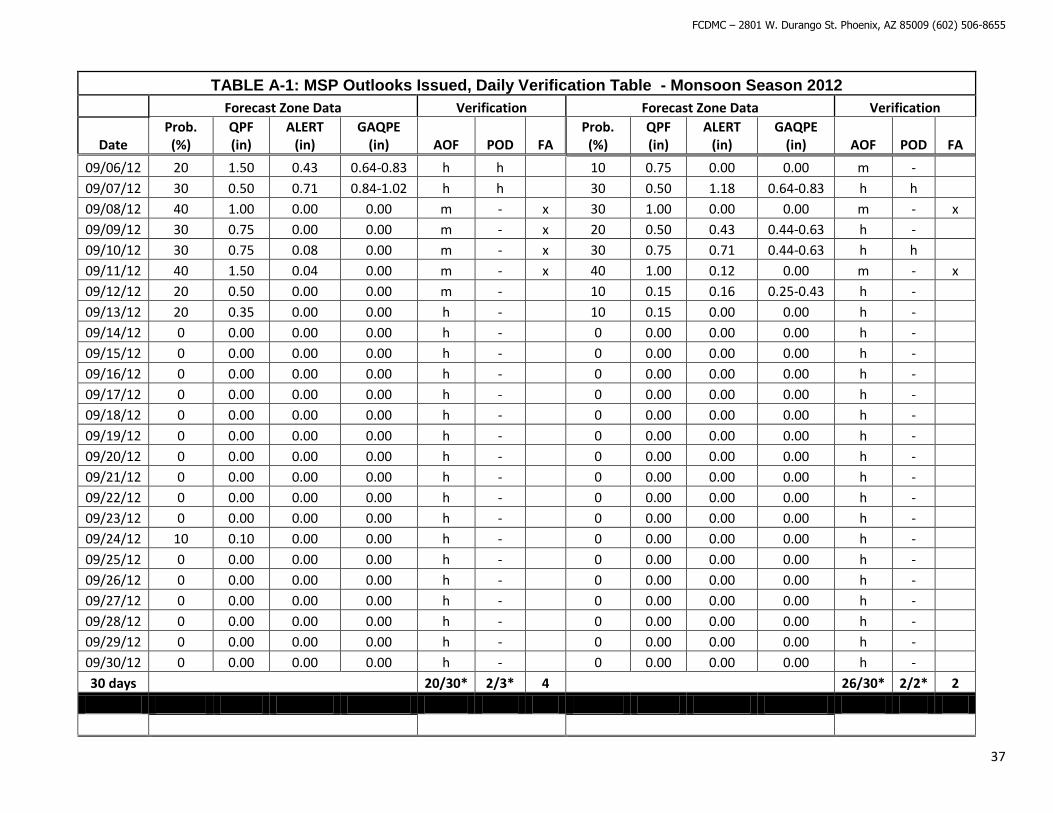
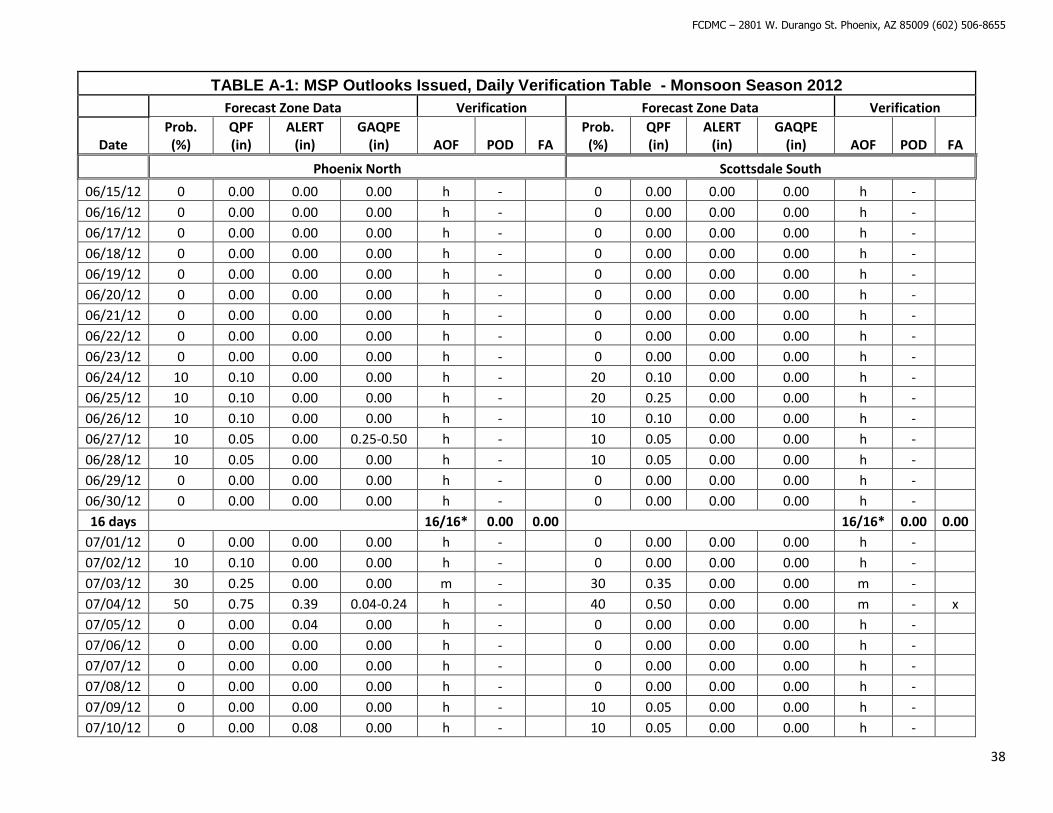
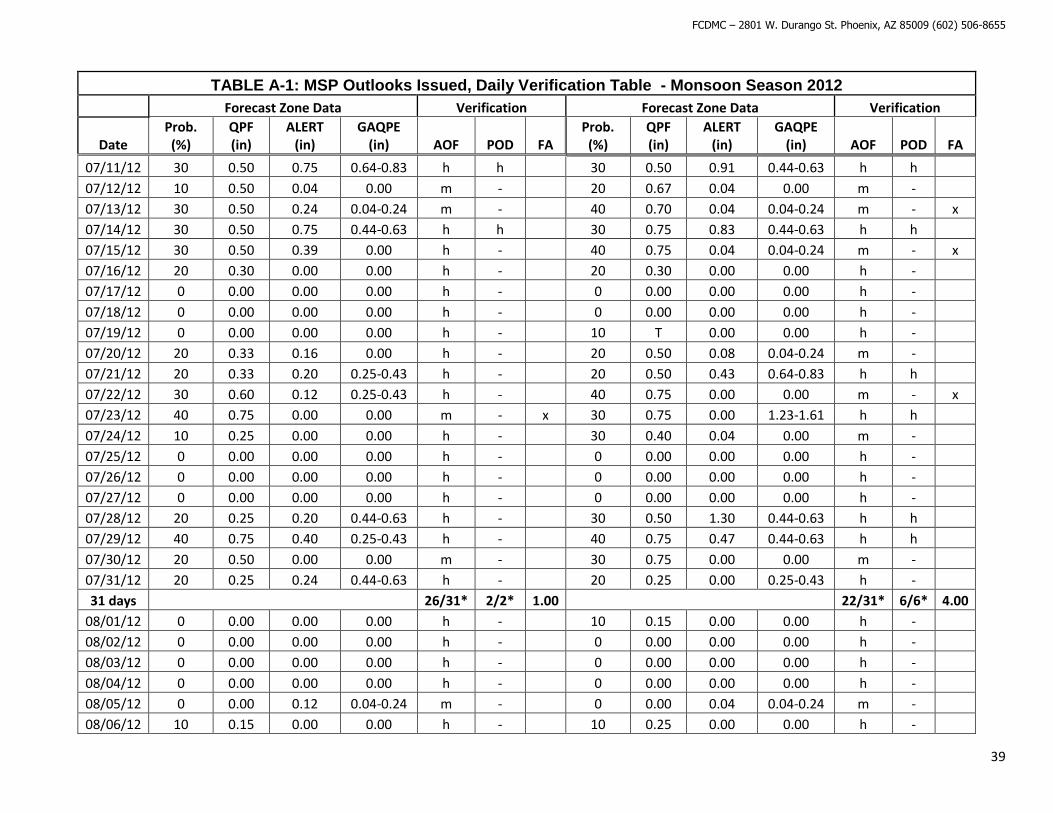
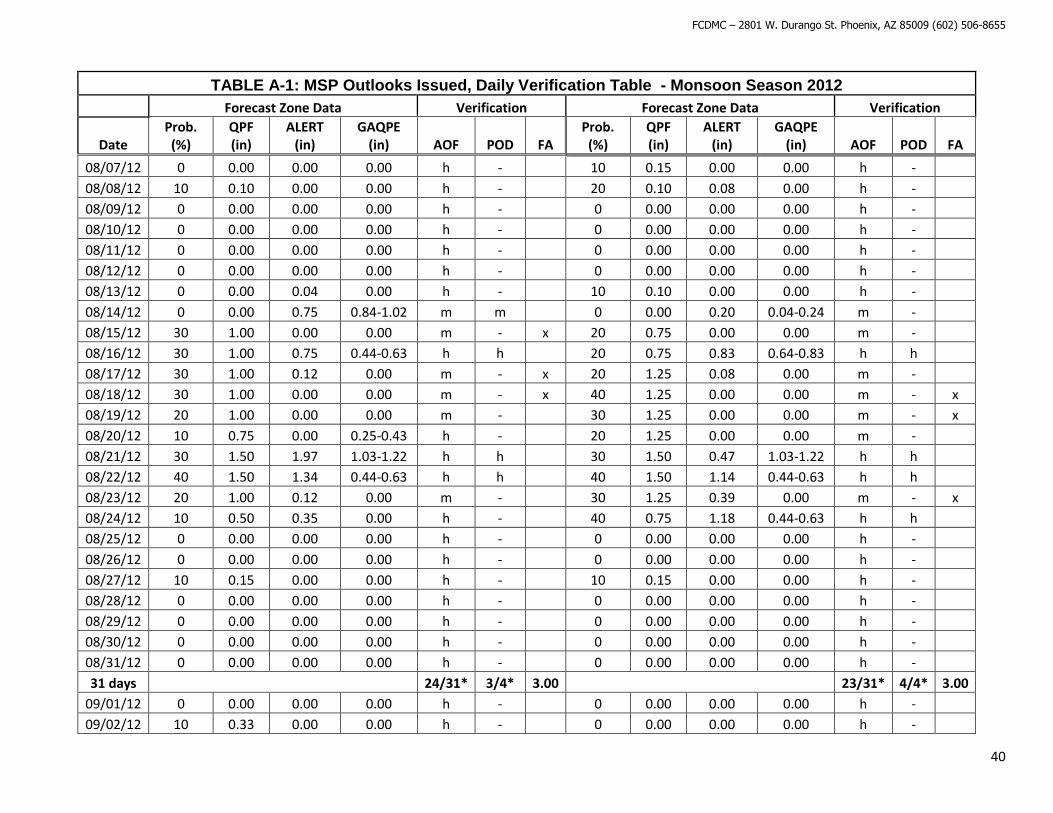
APPENDIX A: MSP OUTLOOKS – VERIFICATION TABLES
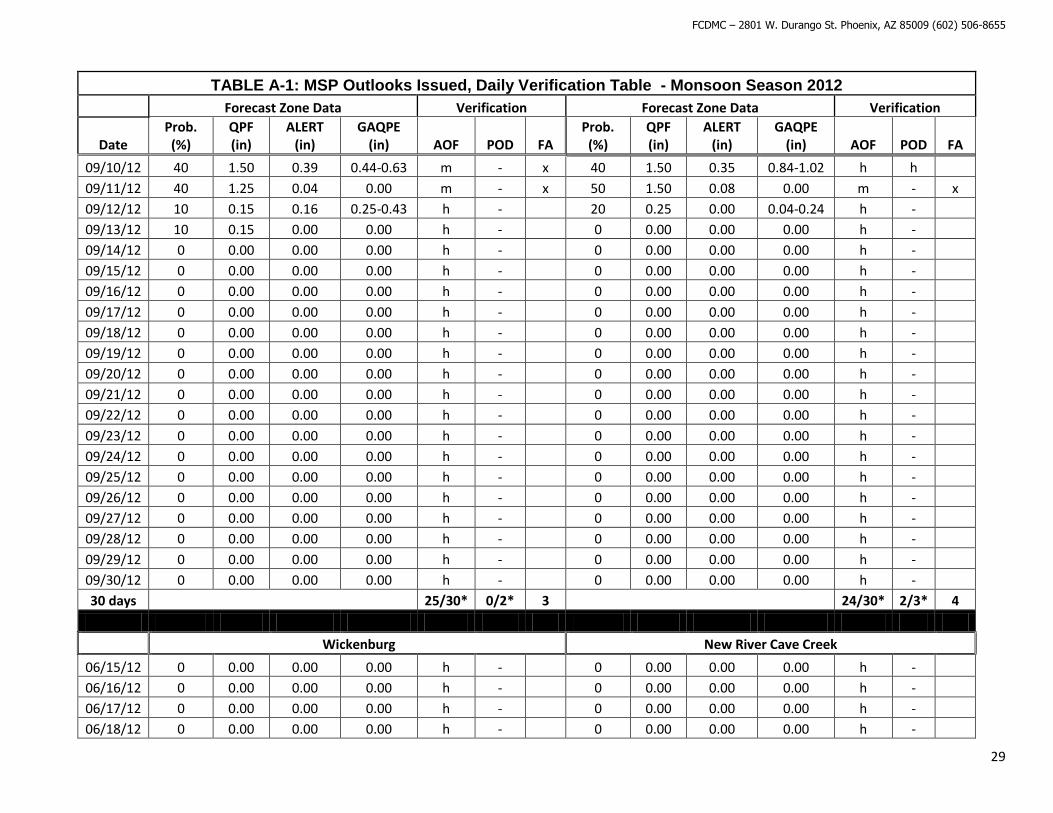
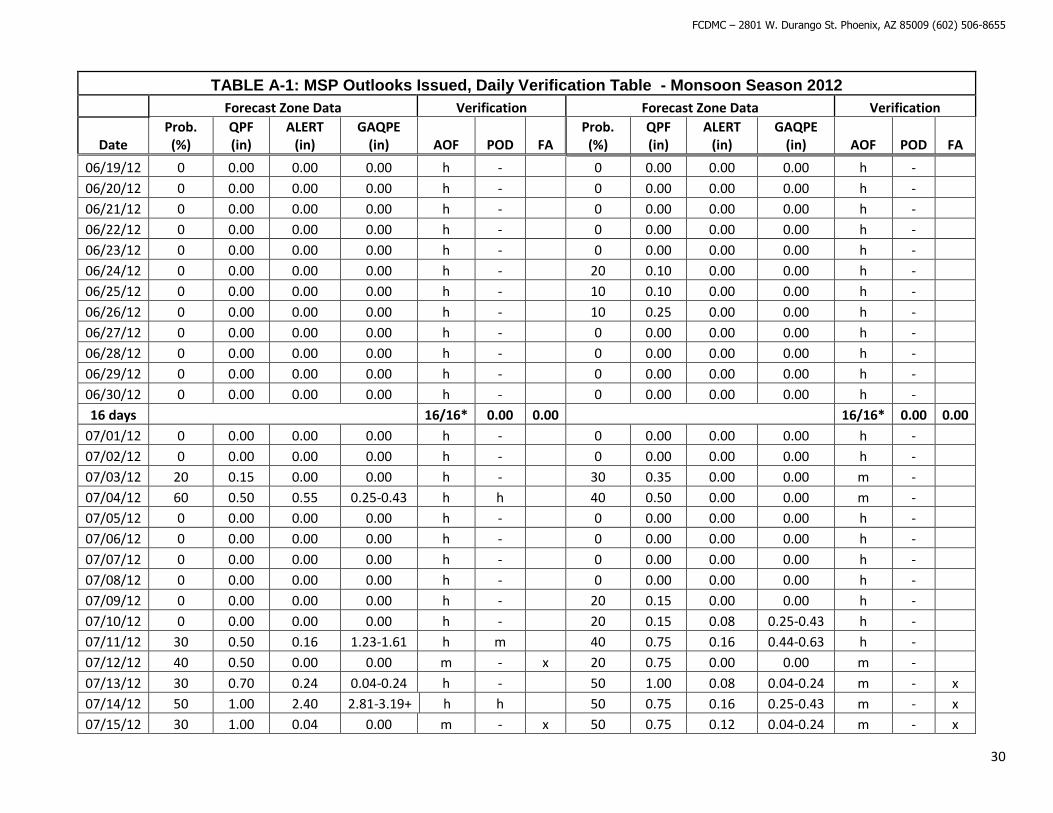
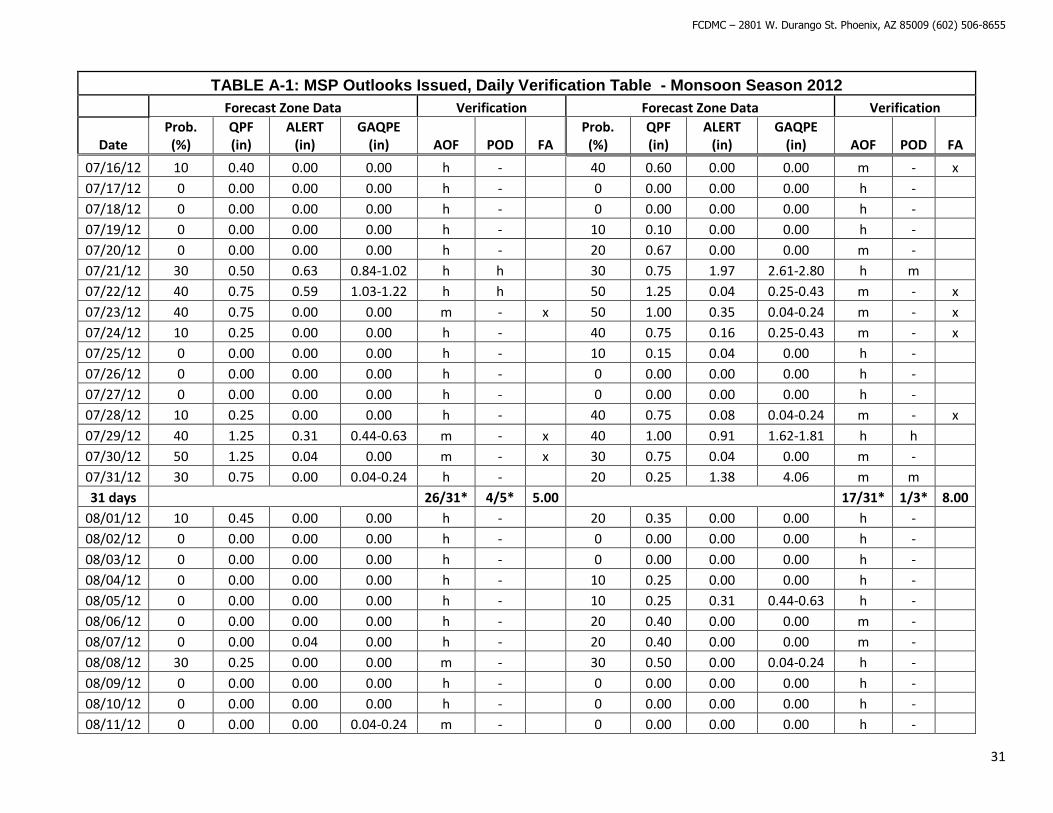
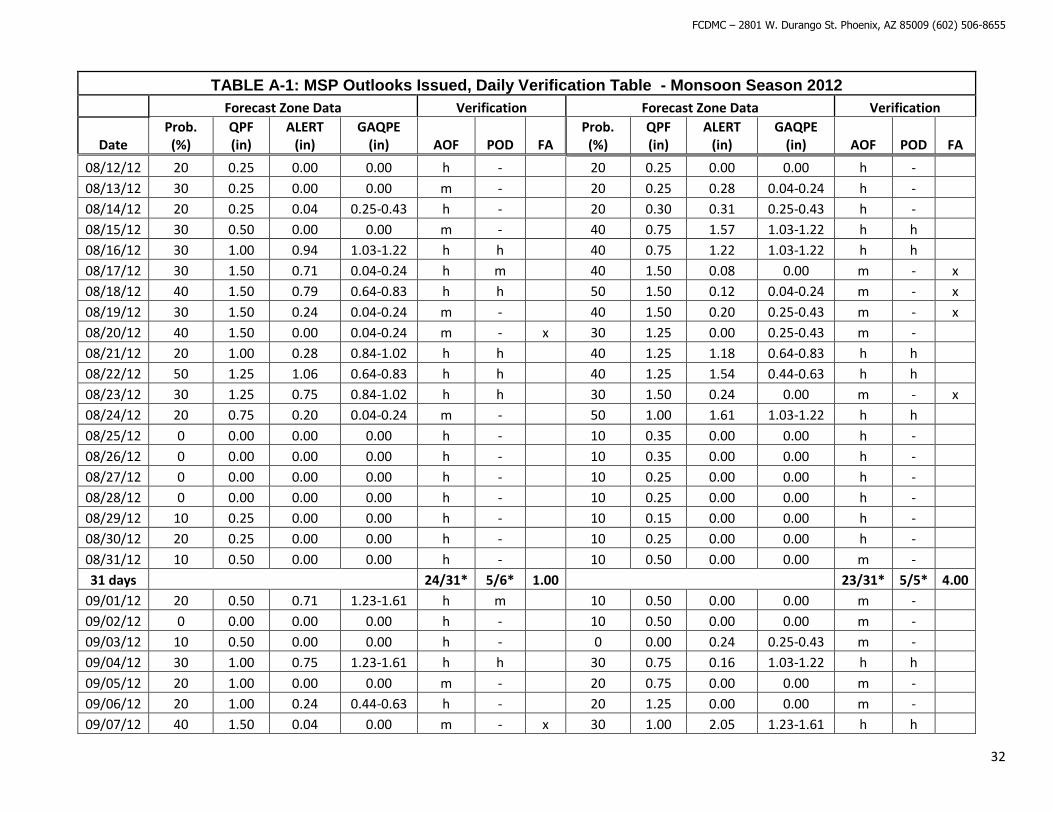
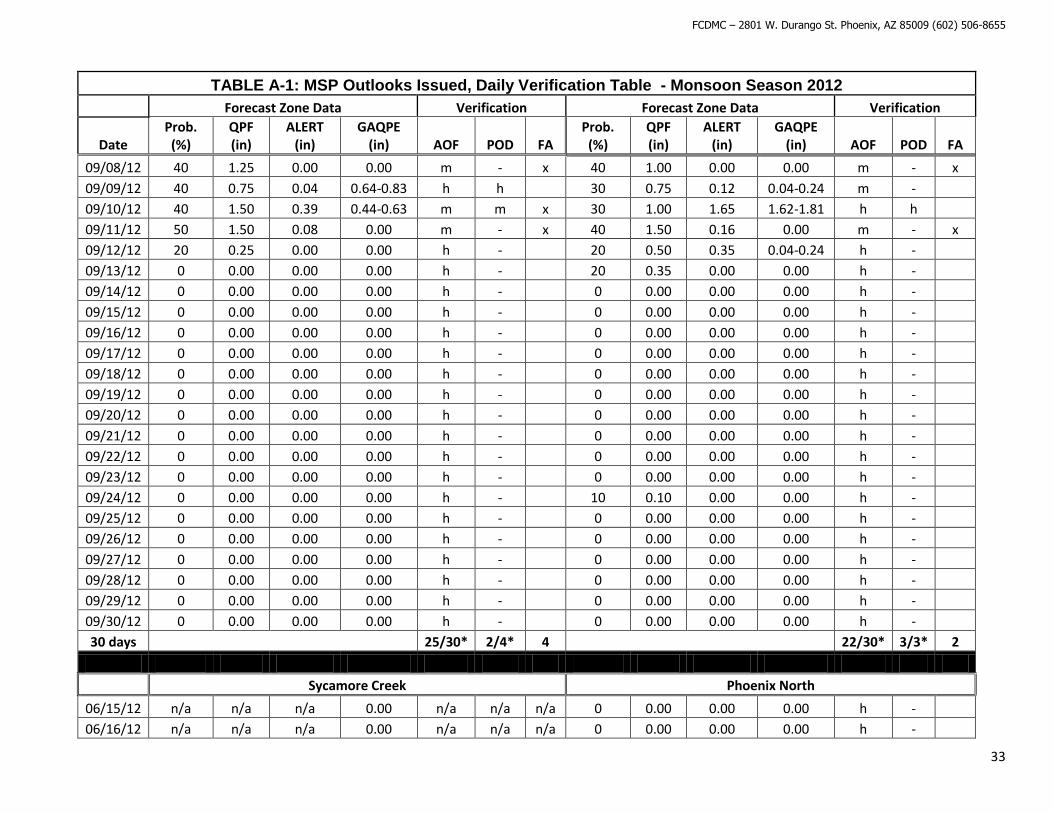
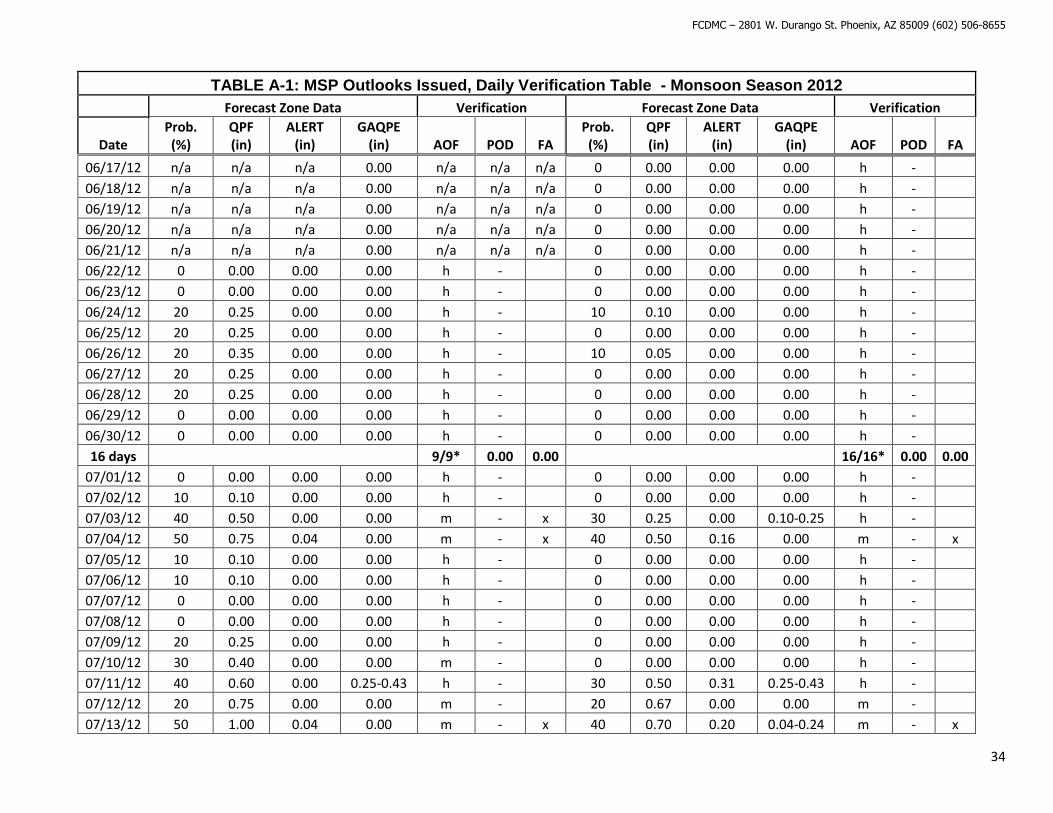
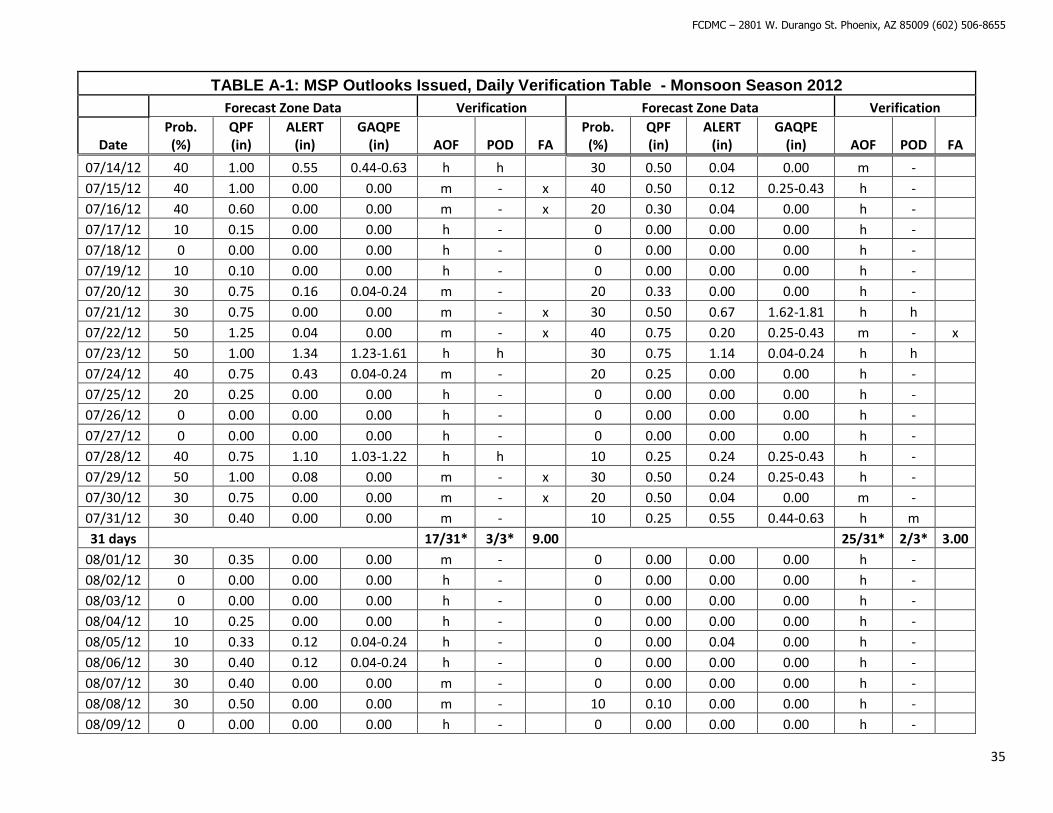
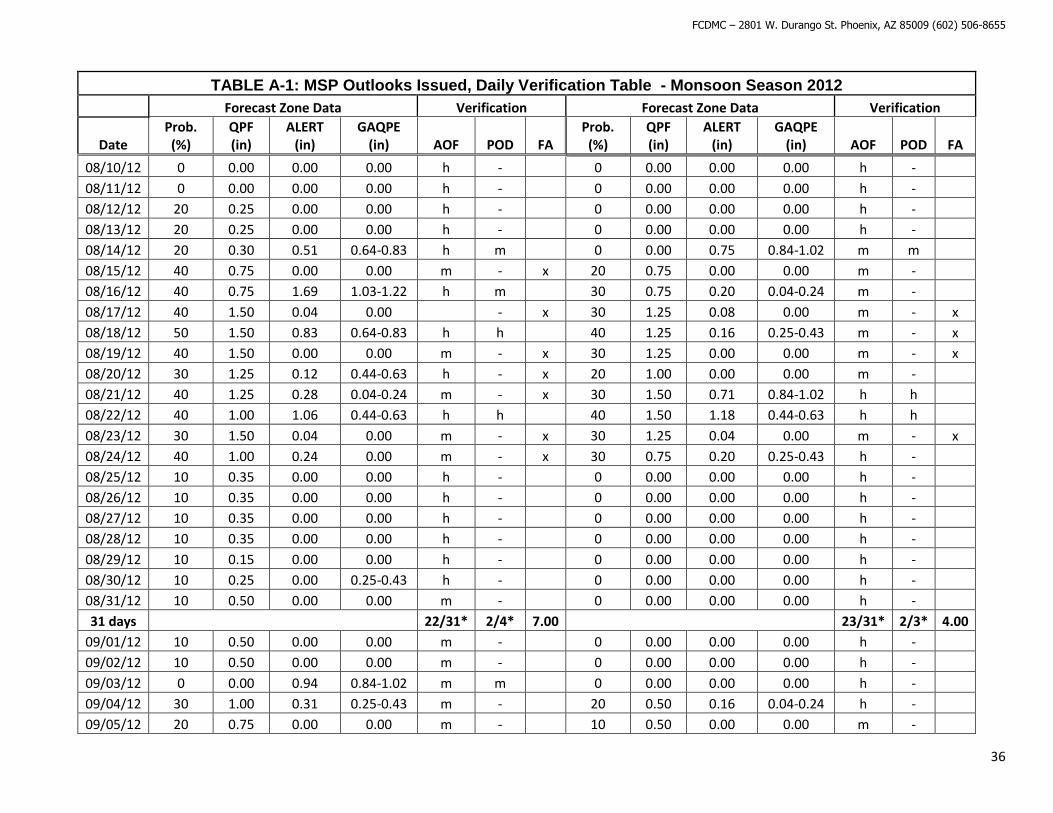
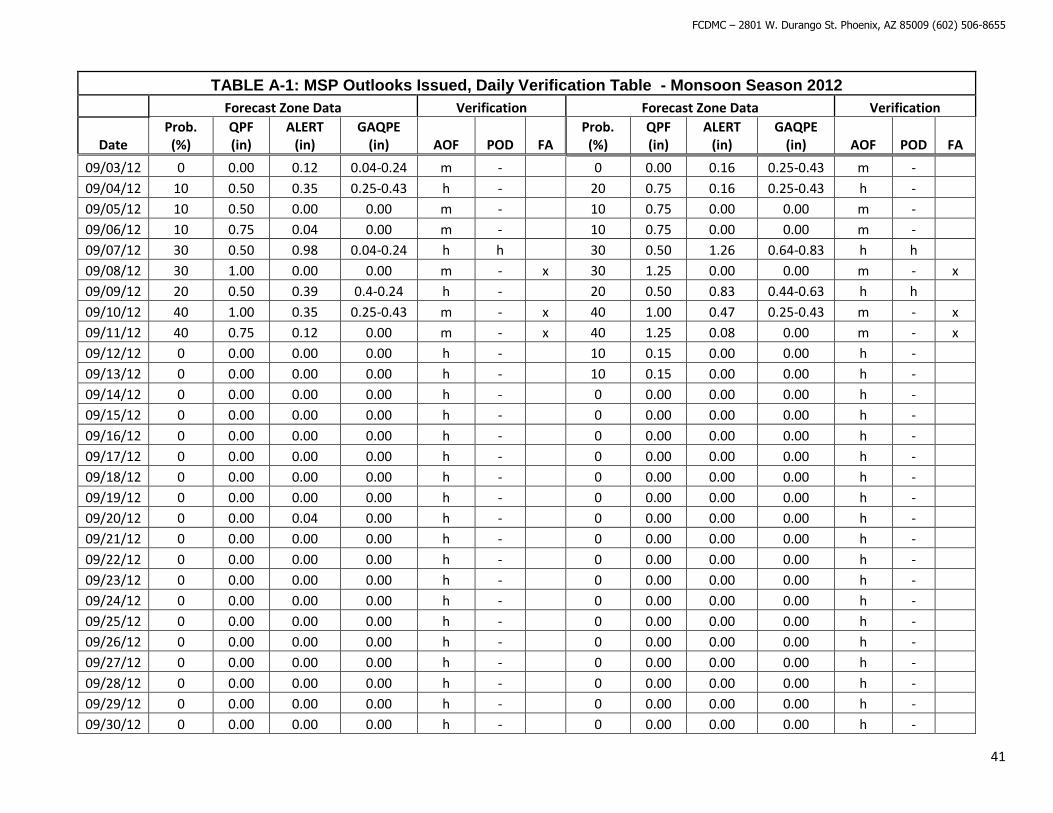
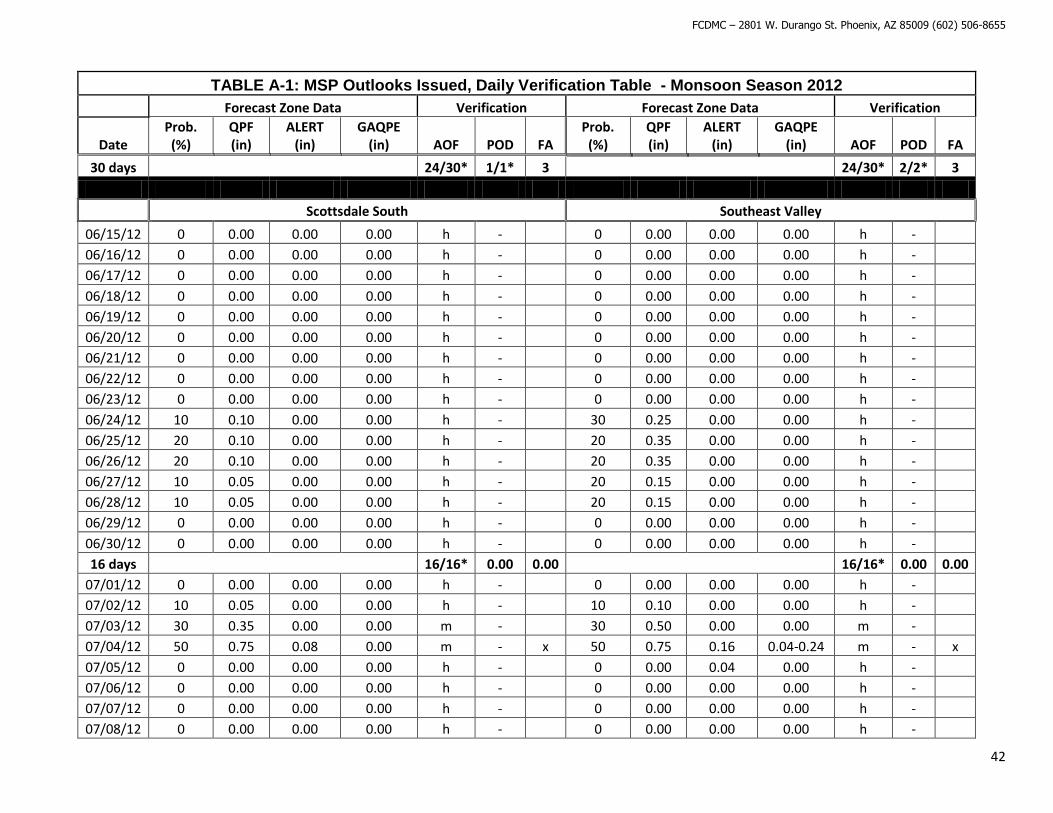
TABLE A-1: This table shows the raw verification data of MSP issued precipitation forecasts contained in the daily Outlooks for the
2012 monsoon season. The valid period for rainfall each day is from 2PM same day through 12PM the following day. The table is
broken down by date and MSP Forecast Zone. For brevity two Forecast Zones are included for each day. The columns from left to right
are defined as follows:
Prob. – Percent probability of measureable rain within the Forecast Zone from 0% to 100% over the period.
QPF – Total forecast rainfall in inches within the Forecast Zone over the period.
ALERT – Peak total observed ALERT gage rainfall value in inches within the Forecast Zone over the period.
GAQPE – Gage Adjusted Quantitative Precipitation Estimate in inches. Radar rainfall estimating product from WDT Inc.
AOF – forecast accuracy, assigned an “h” for a hit and “m” for a miss.
POD – Probability of detection, assigned an “h” for a hit, “m” for a miss, or “-“ for non-significant rainfall.
FA – False alarms, assigned an “x”.
TABLE A-1: MSP Outlooks Issued, Daily Verification Table - Monsoon Season 2012
Forecast Zone Data Verification Forecast Zone Data Verification
Date Prob. (%)
QPF (in)
ALERT (in)
GAQPE (in) AOF POD FA
Prob. (%)
QPF (in)
ALERT (in)
GAQPE (in) AOF POD FA
GILA BEND PALO VERDE
06/15/12 0 0.00 0.00 0.00 h - 0 0.00 0.00 0.00 h -
06/16/12 0 0.00 0.00 0.00 h - 0 0.00 0.00 0.00 h -
06/17/12 0 0.00 0.00 0.00 h - 0 0.00 0.00 0.00 h -
06/18/12 0 0.00 0.00 0.00 h - 0 0.00 0.00 0.00 h -
06/19/12 0 0.00 0.00 0.00 h - 0 0.00 0.00 0.00 h -
06/20/12 0 0.00 0.00 0.00 h - 0 0.00 0.00 0.00 h -
06/21/12 0 0.00 0.00 0.00 h - 0 0.00 0.00 0.00 h -
06/22/12 0 0.00 0.00 0.00 h - 0 0.00 0.00 0.00 h -
06/23/12 0 0.00 0.00 0.00 h - 0 0.00 0.00 0.00 h -
06/24/12 30 0.25 0.00 0.00 m - 0 0.00 0.00 0.00 h -
06/25/12 30 0.50 0.00 0.00 m - 20 0.25 0.00 0.00 h -

FCDMC – 2801 W. Durango St. Phoenix, AZ 85009 (602) 506-8655
18
TABLE A-1: MSP Outlooks Issued, Daily Verification Table - Monsoon Season 2012
Forecast Zone Data Verification Forecast Zone Data Verification
Date Prob. (%)
QPF (in)
ALERT (in)
GAQPE (in) AOF POD FA
Prob. (%)
QPF (in)
ALERT (in)
GAQPE (in) AOF POD FA
06/26/12 30 0.50 0.00 0.00 m - 0 0.00 0.00 0.00 h -
06/27/12 20 0.25 0.00 0.10-0.25 h - 0 0.00 0.00 0.00 h -
06/28/12 20 0.25 0.00 0.00 h - 0 0.00 0.00 0.00 h -
06/29/12 0 0.00 0.00 0.00 h - 0 0.00 0.00 0.00 h -
06/30/12 0 0.00 0.00 0.00 h - 0 0.00 0.00 0.00 h -
16 days 13/16* 0/0* 0.00 16/16* 0/0* 0.00
07/01/12 0 0.00 0.00 0.00 h - 0 0.00 0.00 0.00 h -
07/02/12 20 0.35 0.00 0.00 h - 10 0.10 0.00 0.00 h -
07/03/12 40 0.75 0.00 0.25-0.50 h - 30 0.50 0.00 0.10-0.25 h -
07/04/12 60 0.75 0.83 1.03-1.22 h h 50 0.75 0.39 0.64-0.83 h h
07/05/12 10 0.25 0.12 1.00-1.50 m m 0 0.00 0.00 0.10-0.25 m -
07/06/12 0 0.00 0.00 0.00 h - 0 0.00 0.00 0.00 h -
07/07/12 0 0.00 0.00 0.00 h - 0 0.00 0.00 0.00 h -
07/08/12 0 0.00 0.00 0.00 h - 0 0.00 0.00 0.00 h -
07/09/12 0 0.00 0.00 0.00 h - 0 0.00 0.00 0.00 h -
07/10/12 0 0.00 0.00 0.04-0.24 m - 0 0.00 0.00 0.00 h -
07/11/12 20 0.50 0.28 0.64-0.83 h h 20 0.35 0.28 2.21-2.40 m m
07/12/12 60 1.00 0.08 0.84-1.02 h h 50 0.75 0.04 0.04-0.24 m - x
07/13/12 20 0.50 0.00 0.25-0.43 h h 20 0.50 0.08 1.82-2.01 h m
07/14/12 40 1.00 0.83 1.82-2.01 h h 40 1.00 0.94 1.82-2.01 h h
07/15/12 40 0.75 0.12 1.82-2.01 h h 40 0.75 0.00 0.00 m - x
07/16/12 10 0.30 0.00 0.00 h - 10 0.30 0.00 0.00 h -
07/17/12 0 0.00 0.00 0.00 h - 0 0.00 0.00 0.00 h -
07/18/12 0 0.00 0.00 0.00 h - 0 0.00 0.00 0.00 h -
07/19/12 0 0.00 0.00 0.00 h - 0 0.00 0.00 0.04-0.24 h -
07/20/12 0 0.00 0.00 0.00 h - 0 0.00 0.00 0.00 h -
07/21/12 20 0.40 0.63 1.62-1.81 h m 0 0.00 0.08 0.04-0.24 m -
07/22/12 30 1.00 0.00 0.25-0.43 m - 30 0.75 0.24 1.03-1.22 h h
FCDMC – 2801 W. Durango St. Phoenix, AZ 85009 (602) 506-8655
19
TABLE A-1: MSP Outlooks Issued, Daily Verification Table - Monsoon Season 2012
Forecast Zone Data Verification Forecast Zone Data Verification
Date Prob. (%)
QPF (in)
ALERT (in)
GAQPE (in) AOF POD FA
Prob. (%)
QPF (in)
ALERT (in)
GAQPE (in) AOF POD FA
07/23/12 40 1.00 0.00 0.00 m - x 30 0.75 0.00 0.04-0.24 m -
07/24/12 0 0.00 0.00 0.00 h - 0 0.00 0.00 0.00 h -
07/25/12 0 0.00 0.00 0.00 h - 0 0.00 0.00 0.00 h -
07/26/12 10 0.15 0.00 0.00 h - 0 0.00 0.00 0.00 h -
07/27/12 0 0.00 0.00 0.00 h - 0 0.00 0.00 0.00 h -
07/28/12 10 0.10 0.00 0.04-0.24 h - 10 0.10 0.00 0.00 h -
07/29/12 40 1.50 1.22 1.62-1.81 h h 30 0.75 0.94 1.23-1.61 h m
07/30/12 40 1.50 0.04 0.00 m - x 40 1.00 0.08 0.00 m - x
07/31/12 30 0.50 0.39 0.64-0.83 h h 30 0.50 0.00 0.00 m -
31 days 26/31* 9/11* 2.00 23/31* 3/6* 3.00
08/01/12 0 0.00 0.00 0.00 h - 0 0.00 0.00 0.00 h -
08/02/12 0 0.00 0.00 0.00 h - 0 0.00 0.00 0.00 h -
08/03/12 0 0.00 0.00 0.00 h - 0 0.00 0.00 0.00 h -
08/04/12 0 0.00 0.00 0.00 h - 0 0.00 0.00 0.00 h -
08/05/12 0 0.00 0.00 0.00 h - 0 0.00 0.00 0.00 h -
08/06/12 10 0.15 0.00 0.00 h - 0 0.00 0.00 0.00 h -
08/07/12 10 0.25 0.00 0.00 h - 0 0.00 0.00 0.00 h -
08/08/12 30 0.35 0.00 0.00 m - 10 0.15 0.00 0.00 h -
08/09/12 10 0.25 0.00 0.00 h - 0 0.00 0.00 0.00 h -
08/10/12 0 0.00 0.04 0.50-0.75 m m 0 0.00 0.00 0.00 h -
08/11/12 40 0.75 0.31 0.84-1.02 h h 0 0.00 0.00 0.00 h -
08/12/12 30 0.30 0.00 0.00 m - 20 0.15 0.00 0.00 h -
08/13/12 30 0.25 0.20 1.23-1.61 h m 30 0.10 0.63 1.23-1.61 h m
08/14/12 30 0.50 0.00 0.04-0.24 h - 30 0.35 0.00 0.64-0.83 h m
08/15/12 40 1.25 0.00 0.00 m - x 30 0.75 0.00 0.00 m -
08/16/12 50 0.75 0.87 1.03-1.22 h h 50 0.50 0.28 0.84-1.02 h h
08/17/12 50 1.00 0.08 0.64-0.83 h h 50 1.00 0.79 0.25-0.43 h h
08/18/12 30 1.00 0.00 0.00 m - x 30 1.00 0.12 0.64-0.83 h h
FCDMC – 2801 W. Durango St. Phoenix, AZ 85009 (602) 506-8655
20
TABLE A-1: MSP Outlooks Issued, Daily Verification Table - Monsoon Season 2012
Forecast Zone Data Verification Forecast Zone Data Verification
Date Prob. (%)
QPF (in)
ALERT (in)
GAQPE (in) AOF POD FA
Prob. (%)
QPF (in)
ALERT (in)
GAQPE (in) AOF POD FA
08/19/12 10 1.00 0.00 0.00 m - 10 1.00 0.00 0.00 m -
08/20/12 20 1.25 0.00 0.44-0.63 m - 20 1.25 0.31 0.84-1.02 h h
08/21/12 30 1.50 0.43 2.21-2.40 h h 20 1.25 1.61 1.82-2.01 h h
08/22/12 50 1.75 0.35 0.44-0.63 m - x 50 1.50 1.97 1.23-1.61 h h
08/23/12 0 0.00 0.00 0.00 h - 20 0.75 0.00 0.00 m -
08/24/12 0 0.00 0.00 0.00 h - 0 0.00 0.00 0.00 h -
08/25/12 0 0.00 0.00 0.00 h - 0 0.00 0.00 0.00 h -
08/26/12 0 0.00 0.00 0.00 h - 0 0.00 0.00 0.00 h -
08/27/12 10 0.25 0.00 0.00 h - 0 0.00 0.00 0.00 h -
08/28/12 0 0.00 0.00 0.00 h - 0 0.00 0.00 0.00 h -
08/29/12 10 0.25 0.00 0.25-0.43 h - 10 0.25 0.00 0.00 h -
08/30/12 30 0.50 0.00 0.25-0.43 h - 20 0.35 0.00 0.00 m -
08/31/12 30 0.75 0.00 0.00 m - 20 0.67 0.00 0.00 m -
31 days 22/30* 4/6* 3.00 26/31* 6/8* 0.00
09/01/12 30 0.75 0.00 0.00 m - 20 0.67 0.00 0.00 m -
09/02/12 20 0.50 0.00 0.00 h - 10 0.33 0.00 0.00 h -
09/03/12 20 0.50 0.12 0.25-0.43 h - 10 0.33 0.00 0.00 h -
09/04/12 30 1.50 0.12 0.44-0.63 h - 30 1.25 0.47 0.84-1.02 h h
09/05/12 20 1.00 0.00 0.00 m - 20 1.00 0.00 0.00 m -
09/06/12 20 1.00 0.04 1.03-1.22 h h 20 1.00 1.18 0.64-0.83 h h
09/07/12 60 1.50 1.69 1.03-1.22 h h 60 1.50 0.28 0.84-1.02 h h
09/08/12 40 1.50 0.04 0.25-0.43 m - x 30 1.50 0.00 0.00 m - x
09/09/12 40 1.00 0.04 0.04-0.24 m - x 40 1.00 0.43 0.25-0.43 m - x
09/10/12 50 1.50 0.35 0.44-0.63 m - x 50 1.50 1.18 1.23-1.61 h h
09/11/12 50 1.50 0.04 0.00 m - x 40 1.25 0.04 0.00 m - x
09/12/12 0 0.00 0.00 0.00 h - 0 0.00 0.00 0.00 h -
09/13/12 0 0.00 0.00 0.00 h - 0 0.00 0.00 0.00 h -
09/14/12 0 0.00 0.00 0.00 h - 0 0.00 0.00 0.00 h -
FCDMC – 2801 W. Durango St. Phoenix, AZ 85009 (602) 506-8655
21
TABLE A-1: MSP Outlooks Issued, Daily Verification Table - Monsoon Season 2012
Forecast Zone Data Verification Forecast Zone Data Verification
Date Prob. (%)
QPF (in)
ALERT (in)
GAQPE (in) AOF POD FA
Prob. (%)
QPF (in)
ALERT (in)
GAQPE (in) AOF POD FA
09/15/12 0 0.00 0.00 0.00 h - 0 0.00 0.00 0.00 h -
09/16/12 0 0.00 0.00 0.00 h - 0 0.00 0.00 0.00 h -
09/17/12 0 0.00 0.00 0.00 h - 0 0.00 0.00 0.00 h -
09/18/12 0 0.00 0.00 0.00 h - 0 0.00 0.00 0.00 h -
09/19/12 0 0.00 0.00 0.00 h - 0 0.00 0.00 0.00 h -
09/20/12 0 0.00 0.00 0.00 h - 0 0.00 0.00 0.00 h -
09/21/12 0 0.00 0.00 0.00 h - 0 0.00 0.00 0.00 h -
09/22/12 0 0.00 0.00 0.00 h - 0 0.00 0.00 0.00 h -
09/23/12 0 0.00 0.00 0.00 h - 0 0.00 0.00 0.00 h -
09/24/12 10 0.20 0.00 0.00 h - 0 0.00 0.00 0.00 h -
09/25/12 0 0.00 0.00 0.00 h - 0 0.00 0.00 0.00 h -
09/26/12 0 0.00 0.00 0.00 h - 0 0.00 0.00 0.00 h -
09/27/12 0 0.00 0.00 0.00 h - 0 0.00 0.00 0.00 h -
09/28/12 0 0.00 0.00 0.00 h - 0 0.00 0.00 0.00 h -
09/29/12 0 0.00 0.00 0.00 h - 0 0.00 0.00 0.00 h -
09/30/12 0 0.00 0.00 0.00 h - 0 0.00 0.00 0.00 h -
30 days 24/30* 2/2* 4 25/30* 4/4* 3
Rainbow Valley West Valley
06/15/12 0 0.00 0.00 0.00 h - 0 0.00 0.00 0.00 h -
06/16/12 0 0.00 0.00 0.00 h - 0 0.00 0.00 0.00 h -
06/17/12 0 0.00 0.00 0.00 h - 0 0.00 0.00 0.00 h -
06/18/12 0 0.00 0.00 0.00 h - 0 0.00 0.00 0.00 h -
06/19/12 0 0.00 0.00 0.00 h - 0 0.00 0.00 0.00 h -
06/20/12 0 0.00 0.00 0.00 h - 0 0.00 0.00 0.00 h -
06/21/12 0 0.00 0.00 0.00 h - 0 0.00 0.00 0.00 h -
06/22/12 0 0.00 0.00 0.00 h - 0 0.00 0.00 0.00 h -
06/23/12 0 0.00 0.00 0.00 h - 0 0.00 0.00 0.00 h -
FCDMC – 2801 W. Durango St. Phoenix, AZ 85009 (602) 506-8655
22
TABLE A-1: MSP Outlooks Issued, Daily Verification Table - Monsoon Season 2012
Forecast Zone Data Verification Forecast Zone Data Verification
Date Prob. (%)
QPF (in)
ALERT (in)
GAQPE (in) AOF POD FA
Prob. (%)
QPF (in)
ALERT (in)
GAQPE (in) AOF POD FA
06/24/12 10 0.10 0.00 0.00 h - 10 0.10 0.00 0.00 h -
06/25/12 20 0.25 0.00 0.00 h - 10 0.10 0.00 0.00 h -
06/26/12 20 0.25 0.00 0.00 h - 10 0.10 0.00 0.00 h -
06/27/12 0 0.00 0.00 0.00 h - 0 0.00 0.00 0.00 h -
06/28/12 0 0.00 0.00 0.00 h - 0 0.00 0.00 0.00 h -
06/29/12 0 0.00 0.00 0.00 h - 0 0.00 0.00 0.00 h -
06/30/12 0 0.00 0.00 0.00 h - 0 0.00 0.00 0.00 h -
16 days 16/16* 0.00 0.00 16/16* 0.00 0.00
07/01/12 0 0.00 0.00 0.00 h - 0 0.00 0.00 0.00 h -
07/02/12 10 0.10 0.00 0.00 h - 0 0.00 0.00 0.00 h -
07/03/12 30 0.50 0.00 0.00 m - 20 0.25 0.00 0.00 h -
07/04/12 50 0.75 0.91 0.25-0.43 h h 50 0.50 1.02 0.64-0.83 h h
07/05/12 10 0.10 0.00 0.00 h - 0 0.00 0.00 0.00 h -
07/06/12 0 0.00 0.00 0.00 h - 0 0.00 0.00 0.00 h -
07/07/12 0 0.00 0.00 0.00 h - 0 0.00 0.00 0.00 h -
07/08/12 0 0.00 0.00 0.00 h - 0 0.00 0.00 0.00 h -
07/09/12 0 0.00 0.00 0.00 h - 0 0.00 0.00 0.00 h -
07/10/12 0 0.00 0.00 0.00 h - 0 0.00 0.00 0.00 h -
07/11/12 30 0.50 0.47 1.62-1.81 h h 30 0.50 0.43 0.64-0.83 h h
07/12/12 20 0.33 0.20 0.04-0.24 h h 20 0.33 0.20 0.04-0.24 h -
07/13/12 20 0.50 0.04 0.00 m - 20 0.60 0.04 0.00 m -
07/14/12 40 0.75 0.47 0.64-0.83 h h 30 0.50 0.47 0.04-0.24 h -
07/15/12 40 0.75 0.59 1.03-1.22 h h 30 0.50 0.59 0.25-0.43 h h
07/16/12 10 0.30 0.00 0.00 h - 10 0.25 0.00 0.00 h -
07/17/12 0 0.00 0.00 0.00 h - 0 0.00 0.00 0.00 h -
07/18/12 0 0.00 0.00 0.00 h - 0 0.00 0.00 0.00 h -
07/19/12 0 0.00 0.00 0.00 h - 0 0.00 0.00 0.00 h -
07/20/12 0 0.00 0.00 0.00 h - 0 0.00 0.00 0.00 h -
FCDMC – 2801 W. Durango St. Phoenix, AZ 85009 (602) 506-8655
23
TABLE A-1: MSP Outlooks Issued, Daily Verification Table - Monsoon Season 2012
Forecast Zone Data Verification Forecast Zone Data Verification
Date Prob. (%)
QPF (in)
ALERT (in)
GAQPE (in) AOF POD FA
Prob. (%)
QPF (in)
ALERT (in)
GAQPE (in) AOF POD FA
07/21/12 0 0.00 0.12 0.04-0.24 m - 0 0.00 0.04 0.64-0.83 m -
07/22/12 30 0.75 0.08 0.04-0.24 m - 30 0.75 0.43 0.84-1.02 h h
07/23/12 30 0.75 0.16 0.64-0.83 h h 30 0.75 0.16 0.04-0.24 h -
07/24/12 0 0.00 0.00 0.00 h - 0 0.00 0.00 0.00 h -
07/25/12 0 0.00 0.00 0.00 h - 0 0.00 0.00 0.00 h -
07/26/12 0 0.00 0.00 0.00 h - 0 0.00 0.00 0.00 h -
07/27/12 0 0.00 0.00 0.00 h - 0 0.00 0.00 0.00 h -
07/28/12 10 0.10 0.00 0.00 h - 10 0.10 0.00 0.00 h -
07/29/12 40 1.00 1.26 1.23-1.61 h h 30 0.50 0.75 2.21-2.40 h m
07/30/12 40 1.00 0.04 0.00 m - x 20 0.50 0.08 0.00 m -
07/31/12 20 0.25 0.00 0.04-0.24 h h 10 0.25 0.00 0.00 h -
31 days 26/31* 8/8* 1.00 28/31* 4/5* 0.00
08/01/12 0 0.00 0.00 0.00 h - 0 0.00 0.00 0.00 h -
08/02/12 0 0.00 0.00 0.00 h - 0 0.00 0.00 0.00 h -
08/03/12 0 0.00 0.00 0.00 h - 0 0.00 0.00 0.00 h -
08/04/12 0 0.00 0.00 0.00 h - 0 0.00 0.00 0.00 h -
08/05/12 0 0.00 0.00 0.04-0.24 m - 0 0.00 0.20 0.04-0.24 m -
08/06/12 10 0.15 0.00 0.00 h - 0 0.00 0.00 0.00 h -
08/07/12 0 0.00 0.00 0.00 h - 0 0.00 0.00 0.00 h -
08/08/12 10 0.15 0.00 0.00 h - 10 0.10 0.00 0.00 h -
08/09/12 0 0.00 0.00 0.00 h - 0 0.00 0.00 0.00 h -
08/10/12 0 0.00 0.00 0.00 h - 0 0.00 0.00 0.00 h -
08/11/12 0 0.00 0.00 0.00 h - 0 0.00 0.00 0.00 h -
08/12/12 10 0.15 0.00 0.00 h - 0 0.00 0.00 0.00 h -
08/13/12 10 0.10 0.00 0.25-0.43 h - 0 0.00 0.12 0.25-0.43 m -
08/14/12 20 0.35 0.08 0.25-0.43 h - 10 0.15 0.04 0.04-0.24 h -
08/15/12 30 1.00 0.00 0.00 m - x 30 0.75 0.00 0.00 m -
08/16/12 30 0.75 0.98 0.64-0.83 h h 30 0.50 0.28 0.04-0.24 h -
FCDMC – 2801 W. Durango St. Phoenix, AZ 85009 (602) 506-8655
24
TABLE A-1: MSP Outlooks Issued, Daily Verification Table - Monsoon Season 2012
Forecast Zone Data Verification Forecast Zone Data Verification
Date Prob. (%)
QPF (in)
ALERT (in)
GAQPE (in) AOF POD FA
Prob. (%)
QPF (in)
ALERT (in)
GAQPE (in) AOF POD FA
08/17/12 30 1.00 0.12 0.00 m - 30 1.25 0.24 0.04-0.24 m -
08/18/12 30 1.00 0.00 0.00 m - x 30 1.25 0.16 0.04-0.24 m -
08/19/12 20 1.00 0.00 0.00 m - 20 1.25 0.00 0.00 m -
08/20/12 20 1.25 0.00 0.00 m - 20 1.00 0.00 0.00 m -
08/21/12 30 1.25 2.24 2.21-2.40 h h 30 1.00 1.65 1.23-1.61 h h
08/22/12 50 1.50 0.35 0.84-1.02 h h 40 1.25 0.63 0.44-0.63 h h
08/23/12 10 0.75 0.04 0.00 m - 20 1.00 0.00 0.00 m -
08/24/12 10 0.50 0.00 0.00 m - 10 0.50 0.04 0.04-0.24 h -
08/25/12 0 0.00 0.00 0.00 h - 0 0.00 0.00 0.00 h -
08/26/12 0 0.00 0.00 0.00 h - 0 0.00 0.00 0.00 h -
08/27/12 0 0.00 0.00 0.00 h - 0 0.00 0.00 0.00 h -
08/28/12 0 0.00 0.00 0.00 h - 0 0.00 0.00 0.00 h -
08/29/12 0 0.00 0.00 0.00 h - 0 0.00 0.00 0.00 h -
08/30/12 10 0.25 0.00 0.00 h - 0 0.00 0.00 0.00 h -
08/31/12 20 0.50 0.00 0.00 m - 10 0.50 0.00 0.00 h -
31 days 23/31* 3/3* 2.00 23/31* 2/2* 0.00
09/01/12 20 0.50 0.00 0.00 m - 10 0.50 0.00 0.00 h -
09/02/12 10 0.25 0.00 0.00 h - 0 0.00 0.00 0.00 h -
09/03/12 10 0.25 0.00 0.00 h - 0 0.00 0.00 0.00 h -
09/04/12 30 1.00 0.00 0.04-0.24 h - 10 0.75 1.10 0.84-1.02 h h
09/05/12 20 1.00 0.00 0.00 m - 10 0.75 0.00 0.00 m -
09/06/12 20 1.00 0.00 0.00 m - 10 0.75 0.00 0.00 m -
09/07/12 40 0.75 1.18 0.64-0.83 h h 40 1.25 0.98 1.03-1.22 h h
09/08/12 30 1.50 0.00 0.00 m - x 40 1.00 0.00 0.00 m - x
09/09/12 30 0.75 0.51 0.00 h h 30 0.50 0.51 0.04-0.24 h h
09/10/12 50 1.25 0.20 0.04-0.24 m - x 40 1.00 0.35 0.25-0.43 m - x
09/11/12 40 1.25 0.04 0.00 m - x 40 0.75 0.04 0.00 m - x
09/12/12 0 0.00 0.00 0.00 h - 0 0.00 0.04 0.00 h -
FCDMC – 2801 W. Durango St. Phoenix, AZ 85009 (602) 506-8655
25
TABLE A-1: MSP Outlooks Issued, Daily Verification Table - Monsoon Season 2012
Forecast Zone Data Verification Forecast Zone Data Verification
Date Prob. (%)
QPF (in)
ALERT (in)
GAQPE (in) AOF POD FA
Prob. (%)
QPF (in)
ALERT (in)
GAQPE (in) AOF POD FA
09/13/12 0 0.00 0.00 0.00 h - 0 0.00 0.00 0.00 h -
09/14/12 0 0.00 0.00 0.00 h - 0 0.00 0.00 0.00 h -
09/15/12 0 0.00 0.00 0.00 h - 0 0.00 0.00 0.00 h -
09/16/12 0 0.00 0.00 0.00 h - 0 0.00 0.00 0.00 h -
09/17/12 0 0.00 0.00 0.00 h - 0 0.00 0.00 0.00 h -
09/18/12 0 0.00 0.00 0.00 h - 0 0.00 0.00 0.00 h -
09/19/12 0 0.00 0.00 0.00 h - 0 0.00 0.00 0.00 h -
09/20/12 0 0.00 0.00 0.00 h - 0 0.00 0.00 0.00 h -
09/21/12 0 0.00 0.00 0.00 h - 0 0.00 0.00 0.00 h -
09/22/12 0 0.00 0.00 0.00 h - 0 0.00 0.00 0.00 h -
09/23/12 0 0.00 0.00 0.00 h - 0 0.00 0.00 0.00 h -
09/24/12 0 0.00 0.00 0.00 h - 0 0.00 0.00 0.00 h -
09/25/12 0 0.00 0.00 0.00 h - 0 0.00 0.00 0.00 h -
09/26/12 0 0.00 0.00 0.00 h - 0 0.00 0.00 0.00 h -
09/27/12 0 0.00 0.00 0.00 h - 0 0.00 0.00 0.00 h -
09/28/12 0 0.00 0.00 0.00 h - 0 0.00 0.00 0.00 h -
09/29/12 0 0.00 0.00 0.00 h - 0 0.00 0.00 0.00 h -
09/30/12 0 0.00 0.00 0.00 h - 0 0.00 0.00 0.00 h -
30 days 24/30* 2/2* 3 25/30* 3/3* 3
Northwest Valley Upper Centennial
06/15/12 0 0.00 0.00 0.00 h - 0 0.00 0.00 0.00 h -
06/16/12 0 0.00 0.00 0.00 h - 0 0.00 0.00 0.00 h -
06/17/12 0 0.00 0.00 0.00 h - 0 0.00 0.00 0.00 h -
06/18/12 0 0.00 0.00 0.00 h - 0 0.00 0.00 0.00 h -
06/19/12 0 0.00 0.00 0.00 h - 0 0.00 0.00 0.00 h -
06/20/12 0 0.00 0.00 0.00 h - 0 0.00 0.00 0.00 h -
06/21/12 0 0.00 0.00 0.00 h - 0 0.00 0.00 0.00 h -
FCDMC – 2801 W. Durango St. Phoenix, AZ 85009 (602) 506-8655
26
TABLE A-1: MSP Outlooks Issued, Daily Verification Table - Monsoon Season 2012
Forecast Zone Data Verification Forecast Zone Data Verification
Date Prob. (%)
QPF (in)
ALERT (in)
GAQPE (in) AOF POD FA
Prob. (%)
QPF (in)
ALERT (in)
GAQPE (in) AOF POD FA
06/22/12 0 0.00 0.00 0.00 h - 0 0.00 0.00 0.00 h -
06/23/12 0 0.00 0.00 0.00 h - 0 0.00 0.00 0.00 h -
06/24/12 0 0.00 0.00 0.00 h - 0 0.00 0.00 0.00 h -
06/25/12 0 0.00 0.00 0.00 h - 0 0.00 0.00 0.00 h -
06/26/12 0 0.00 0.00 0.00 h - 0 0.00 0.00 0.00 h -
06/27/12 0 0.00 0.00 0.00 h - 0 0.00 0.00 0.00 h -
06/28/12 0 0.00 0.00 0.00 h - 0 0.00 0.00 0.00 h -
06/29/12 0 0.00 0.00 0.00 h - 0 0.00 0.00 0.00 h -
06/30/12 0 0.00 0.00 0.00 h - 0 0.00 0.00 0.00 h -
16 days 16/16* 0.00 0.00 16/16* 0.00 0.00
07/01/12 0 0.00 0.00 0.00 h - 0 0.00 0.00 0.00 h -
07/02/12 0 0.00 0.00 0.00 h - 0 0.00 0.00 0.00 h -
07/03/12 20 0.15 0.00 0.10-0.25 h - 20 0.15 0.00 0.00 h -
07/04/12 50 0.50 0.83 0.25-0.43 h h 60 0.50 0.71 0.64-0.83 h h
07/05/12 0 0.00 0.00 0.00 h - 0 0.00 0.00 0.00 h -
07/06/12 0 0.00 0.00 0.00 h - 0 0.00 0.00 0.00 h -
07/07/12 0 0.00 0.00 0.00 h - 0 0.00 0.00 0.00 h -
07/08/12 0 0.00 0.00 0.00 h - 0 0.00 0.00 0.00 h -
07/09/12 0 0.00 0.00 0.00 h - 0 0.00 0.00 0.00 h -
07/10/12 0 0.00 0.00 0.00 h - 0 0.00 0.00 0.04-0.24 m -
07/11/12 30 0.50 0.28 0.44-0.63 h - 30 0.35 0.35 1.23-1.61 h m
07/12/12 30 0.50 0.00 0.00 m - 60 1.25 0.04 0.64-0.83 h h
07/13/12 30 0.60 0.55 0.44-0.63 h h 30 0.70 0.59 1.23-1.61 h h
07/14/12 30 0.50 1.42 1.62-1.81 h m 50 1.00 3.58 2.81-3.19+ h h
07/15/12 40 0.75 0.04 1.23-1.61 h h 30 1.00 0.04 0.04-0.24 m -
07/16/12 20 0.25 0.00 0.00 h - 10 0.40 0.00 0.04-0.24 m -
07/17/12 0 0.00 0.00 0.00 h - 0 0.00 0.00 0.00 h -
FCDMC – 2801 W. Durango St. Phoenix, AZ 85009 (602) 506-8655
27
TABLE A-1: MSP Outlooks Issued, Daily Verification Table - Monsoon Season 2012
Forecast Zone Data Verification Forecast Zone Data Verification
Date Prob. (%)
QPF (in)
ALERT (in)
GAQPE (in) AOF POD FA
Prob. (%)
QPF (in)
ALERT (in)
GAQPE (in) AOF POD FA
07/18/12 0 0.00 0.00 0.00 h - 0 0.00 0.00 0.00 h -
07/19/12 0 0.00 0.00 0.00 h - 0 0.00 0.00 0.84-1.02 m m
07/20/12 0 0.00 0.00 0.00 h - 0 0.00 0.00 0.44-0.63 m -
07/21/12 20 0.40 1.10 0.64-0.83 m m 30 0.50 0.35 2.02-2.20 h m
07/22/12 40 0.75 0.63 0.84-1.02 h h 40 0.75 0.79 1.82-2.01 h h
07/23/12 40 0.75 0.00 0.00 m - x 40 0.75 0.00 0.00 m - x
07/24/12 10 0.25 0.00 0.00 h - 10 0.25 0.00 0.00 h -
07/25/12 0 0.00 0.00 0.00 h - 0 0.00 0.00 0.00 h -
07/26/12 0 0.00 0.00 0.00 h - 0 0.00 0.00 0.44-0.63 m -
07/27/12 0 0.00 0.00 0.00 h - 0 0.00 0.00 0.25-0.43 m -
07/28/12 20 0.25 0.00 0.00 h - 10 0.25 0.00 0.00 h -
07/29/12 30 0.75 0.55 2.21-2.40 h m 40 1.25 0.20 0.64-0.83 h h
07/30/12 30 0.75 0.00 0.00 m - 50 1.25 0.04 0.44-0.63 m - x
07/31/12 10 0.25 0.00 0.00 h - 30 0.75 0.00 0.04-0.24 m -
31 days 27/31* 4/7* 1.00 21/31* 7/9* 2.00
08/01/12 10 0.15 0.00 0.00 h - 20 0.45 0.00 0.00 m -
08/02/12 0 0.00 0.00 0.00 h - 0 0.00 0.00 0.00 h -
08/03/12 0 0.00 0.00 0.00 h - 0 0.00 0.00 0.00 h -
08/04/12 0 0.00 0.00 0.00 h - 0 0.00 0.00 0.00 h -
08/05/12 0 0.00 0.04 0.04-0.24 m - 0 0.00 0.00 0.00 h -
08/06/12 0 0.00 0.00 0.00 h - 0 0.00 0.00 0.00 h -
08/07/12 0 0.00 0.00 0.00 h - 0 0.00 0.00 0.25-0.43 m -
08/08/12 20 0.25 0.00 0.00 h - 30 0.25 0.00 0.00 m -
08/09/12 0 0.00 0.00 0.00 h - 0 0.00 0.00 0.00 h -
08/10/12 0 0.00 0.00 0.00 h - 0 0.00 0.00 0.00 h -
08/11/12 0 0.00 0.00 0.00 h - 0 0.00 0.00 0.64-0.83 m
08/12/12 10 0.15 0.00 0.00 h - 20 0.25 0.00 0.44-0.63 h -
08/13/12 10 0.15 0.16 0.04-0.24 h - 30 0.25 0.16 0.64-0.83 h m
FCDMC – 2801 W. Durango St. Phoenix, AZ 85009 (602) 506-8655
28
TABLE A-1: MSP Outlooks Issued, Daily Verification Table - Monsoon Season 2012
Forecast Zone Data Verification Forecast Zone Data Verification
Date Prob. (%)
QPF (in)
ALERT (in)
GAQPE (in) AOF POD FA
Prob. (%)
QPF (in)
ALERT (in)
GAQPE (in) AOF POD FA
08/14/12 10 0.15 0.00 0.64-0.83 h m 20 0.25 0.04 0.00 h -
08/15/12 30 0.75 0.00 0.00 m - 30 0.50 0.00 0.00 m -
08/16/12 30 0.50 1.18 1.62-1.81 h m 30 1.00 0.87 1.23-1.61 h h
08/17/12 30 1.50 0.04 0.04-0.24 m - x 30 1.50 0.35 0.84-1.02 h h
08/18/12 30 1.50 0.28 0.84-1.02 h h 30 1.50 0.00 0.44-0.63 m -
08/19/12 20 1.50 0.00 0.00 m - 30 1.50 0.00 0.00 m - x
08/20/12 30 1.50 0.00 0.00 m - x 40 1.50 0.00 0.84-1.02 h h
08/21/12 30 1.50 0.98 1.23-1.61 h h 20 1.00 1.18 2.41-2.60 h h
08/22/12 40 1.50 1.18 0.84-1.02 h h 50 1.25 0.79 2.21-2.40 h h
08/23/12 20 1.00 0.12 0.04-0.24 m - 30 1.25 0.55 1.03-1.22 h h
08/24/12 10 0.50 0.00 0.04-0.24 h - 20 0.75 0.67 0.64-0.83 h h
08/25/12 0 0.00 0.00 0.00 h - 0 0.00 0.00 0.00 h -
08/26/12 0 0.00 0.00 0.00 h - 0 0.00 0.00 0.04-0.24 m -
08/27/12 0 0.00 0.00 0.00 h - 0 0.00 0.00 0.00 h -
08/28/12 0 0.00 0.00 0.00 h - 0 0.00 0.00 0.00 h -
08/29/12 0 0.00 0.00 0.00 h - 20 0.25 0.00 0.04-0.24 h -
08/30/12 0 0.00 0.00 0.00 h - 30 0.25 0.16 0.64-0.83 m
08/31/12 10 0.50 0.00 0.00 m - 10 0.50 0.00 0.00 m -
31 days 24/31* 3/5* 2.00 21/31* 7/8* 1.00
09/01/12 10 0.50 0.00 0.04-0.24 h - 20 0.50 0.91 1.23-1.61 h m
09/02/12 0 0.00 0.00 0.00 h - 0 0.00 0.00 0.00 h -
09/03/12 0 0.00 0.00 0.00 h - 10 0.50 0.00 0.00 m -
09/04/12 10 0.75 0.12 0.04-0.24 h - 30 1.00 0.51 2.21-2.40 h h
09/05/12 10 0.75 0.00 0.00 m - 20 1.00 0.00 0.04-0.24 m -
09/06/12 10 0.75 0.28 2.02-2.20 h m 20 1.00 0.16 0.44-0.63 h -
09/07/12 30 1.00 0.04 0.04-0.24 m - 40 1.50 0.04 0.04-0.24 m - x
09/08/12 30 1.25 0.00 0.00 m - x 40 1.25 0.00 0.00 m - x
09/09/12 30 0.50 1.42 1.03-1.22 h m 40 0.75 0.00 0.00 m - x
FCDMC – 2801 W. Durango St. Phoenix, AZ 85009 (602) 506-8655
29
TABLE A-1: MSP Outlooks Issued, Daily Verification Table - Monsoon Season 2012
Forecast Zone Data Verification Forecast Zone Data Verification
Date Prob. (%)
QPF (in)
ALERT (in)
GAQPE (in) AOF POD FA
Prob. (%)
QPF (in)
ALERT (in)
GAQPE (in) AOF POD FA
09/10/12 40 1.50 0.39 0.44-0.63 m - x 40 1.50 0.35 0.84-1.02 h h
09/11/12 40 1.25 0.04 0.00 m - x 50 1.50 0.08 0.00 m - x
09/12/12 10 0.15 0.16 0.25-0.43 h - 20 0.25 0.00 0.04-0.24 h -
09/13/12 10 0.15 0.00 0.00 h - 0 0.00 0.00 0.00 h -
09/14/12 0 0.00 0.00 0.00 h - 0 0.00 0.00 0.00 h -
09/15/12 0 0.00 0.00 0.00 h - 0 0.00 0.00 0.00 h -
09/16/12 0 0.00 0.00 0.00 h - 0 0.00 0.00 0.00 h -
09/17/12 0 0.00 0.00 0.00 h - 0 0.00 0.00 0.00 h -
09/18/12 0 0.00 0.00 0.00 h - 0 0.00 0.00 0.00 h -
09/19/12 0 0.00 0.00 0.00 h - 0 0.00 0.00 0.00 h -
09/20/12 0 0.00 0.00 0.00 h - 0 0.00 0.00 0.00 h -
09/21/12 0 0.00 0.00 0.00 h - 0 0.00 0.00 0.00 h -
09/22/12 0 0.00 0.00 0.00 h - 0 0.00 0.00 0.00 h -
09/23/12 0 0.00 0.00 0.00 h - 0 0.00 0.00 0.00 h -
09/24/12 0 0.00 0.00 0.00 h - 0 0.00 0.00 0.00 h -
09/25/12 0 0.00 0.00 0.00 h - 0 0.00 0.00 0.00 h -
09/26/12 0 0.00 0.00 0.00 h - 0 0.00 0.00 0.00 h -
09/27/12 0 0.00 0.00 0.00 h - 0 0.00 0.00 0.00 h -
09/28/12 0 0.00 0.00 0.00 h - 0 0.00 0.00 0.00 h -
09/29/12 0 0.00 0.00 0.00 h - 0 0.00 0.00 0.00 h -
09/30/12 0 0.00 0.00 0.00 h - 0 0.00 0.00 0.00 h -
30 days 25/30* 0/2* 3 24/30* 2/3* 4
Wickenburg New River Cave Creek
06/15/12 0 0.00 0.00 0.00 h - 0 0.00 0.00 0.00 h -
06/16/12 0 0.00 0.00 0.00 h - 0 0.00 0.00 0.00 h -
06/17/12 0 0.00 0.00 0.00 h - 0 0.00 0.00 0.00 h -
06/18/12 0 0.00 0.00 0.00 h - 0 0.00 0.00 0.00 h -
FCDMC – 2801 W. Durango St. Phoenix, AZ 85009 (602) 506-8655
30
TABLE A-1: MSP Outlooks Issued, Daily Verification Table - Monsoon Season 2012
Forecast Zone Data Verification Forecast Zone Data Verification
Date Prob. (%)
QPF (in)
ALERT (in)
GAQPE (in) AOF POD FA
Prob. (%)
QPF (in)
ALERT (in)
GAQPE (in) AOF POD FA
06/19/12 0 0.00 0.00 0.00 h - 0 0.00 0.00 0.00 h -
06/20/12 0 0.00 0.00 0.00 h - 0 0.00 0.00 0.00 h -
06/21/12 0 0.00 0.00 0.00 h - 0 0.00 0.00 0.00 h -
06/22/12 0 0.00 0.00 0.00 h - 0 0.00 0.00 0.00 h -
06/23/12 0 0.00 0.00 0.00 h - 0 0.00 0.00 0.00 h -
06/24/12 0 0.00 0.00 0.00 h - 20 0.10 0.00 0.00 h -
06/25/12 0 0.00 0.00 0.00 h - 10 0.10 0.00 0.00 h -
06/26/12 0 0.00 0.00 0.00 h - 10 0.25 0.00 0.00 h -
06/27/12 0 0.00 0.00 0.00 h - 0 0.00 0.00 0.00 h -
06/28/12 0 0.00 0.00 0.00 h - 0 0.00 0.00 0.00 h -
06/29/12 0 0.00 0.00 0.00 h - 0 0.00 0.00 0.00 h -
06/30/12 0 0.00 0.00 0.00 h - 0 0.00 0.00 0.00 h -
16 days 16/16* 0.00 0.00 16/16* 0.00 0.00
07/01/12 0 0.00 0.00 0.00 h - 0 0.00 0.00 0.00 h -
07/02/12 0 0.00 0.00 0.00 h - 0 0.00 0.00 0.00 h -
07/03/12 20 0.15 0.00 0.00 h - 30 0.35 0.00 0.00 m -
07/04/12 60 0.50 0.55 0.25-0.43 h h 40 0.50 0.00 0.00 m -
07/05/12 0 0.00 0.00 0.00 h - 0 0.00 0.00 0.00 h -
07/06/12 0 0.00 0.00 0.00 h - 0 0.00 0.00 0.00 h -
07/07/12 0 0.00 0.00 0.00 h - 0 0.00 0.00 0.00 h -
07/08/12 0 0.00 0.00 0.00 h - 0 0.00 0.00 0.00 h -
07/09/12 0 0.00 0.00 0.00 h - 20 0.15 0.00 0.00 h -
07/10/12 0 0.00 0.00 0.00 h - 20 0.15 0.08 0.25-0.43 h -
07/11/12 30 0.50 0.16 1.23-1.61 h m 40 0.75 0.16 0.44-0.63 h -
07/12/12 40 0.50 0.00 0.00 m - x 20 0.75 0.00 0.00 m -
07/13/12 30 0.70 0.24 0.04-0.24 h - 50 1.00 0.08 0.04-0.24 m - x
07/14/12 50 1.00 2.40 2.81-3.19+ h h 50 0.75 0.16 0.25-0.43 m - x
07/15/12 30 1.00 0.04 0.00 m - x 50 0.75 0.12 0.04-0.24 m - x
FCDMC – 2801 W. Durango St. Phoenix, AZ 85009 (602) 506-8655
31
TABLE A-1: MSP Outlooks Issued, Daily Verification Table - Monsoon Season 2012
Forecast Zone Data Verification Forecast Zone Data Verification
Date Prob. (%)
QPF (in)
ALERT (in)
GAQPE (in) AOF POD FA
Prob. (%)
QPF (in)
ALERT (in)
GAQPE (in) AOF POD FA
07/16/12 10 0.40 0.00 0.00 h - 40 0.60 0.00 0.00 m - x
07/17/12 0 0.00 0.00 0.00 h - 0 0.00 0.00 0.00 h -
07/18/12 0 0.00 0.00 0.00 h - 0 0.00 0.00 0.00 h -
07/19/12 0 0.00 0.00 0.00 h - 10 0.10 0.00 0.00 h -
07/20/12 0 0.00 0.00 0.00 h - 20 0.67 0.00 0.00 m -
07/21/12 30 0.50 0.63 0.84-1.02 h h 30 0.75 1.97 2.61-2.80 h m
07/22/12 40 0.75 0.59 1.03-1.22 h h 50 1.25 0.04 0.25-0.43 m - x
07/23/12 40 0.75 0.00 0.00 m - x 50 1.00 0.35 0.04-0.24 m - x
07/24/12 10 0.25 0.00 0.00 h - 40 0.75 0.16 0.25-0.43 m - x
07/25/12 0 0.00 0.00 0.00 h - 10 0.15 0.04 0.00 h -
07/26/12 0 0.00 0.00 0.00 h - 0 0.00 0.00 0.00 h -
07/27/12 0 0.00 0.00 0.00 h - 0 0.00 0.00 0.00 h -
07/28/12 10 0.25 0.00 0.00 h - 40 0.75 0.08 0.04-0.24 m - x
07/29/12 40 1.25 0.31 0.44-0.63 m - x 40 1.00 0.91 1.62-1.81 h h
07/30/12 50 1.25 0.04 0.00 m - x 30 0.75 0.04 0.00 m -
07/31/12 30 0.75 0.00 0.04-0.24 h - 20 0.25 1.38 4.06 m m
31 days 26/31* 4/5* 5.00 17/31* 1/3* 8.00
08/01/12 10 0.45 0.00 0.00 h - 20 0.35 0.00 0.00 h -
08/02/12 0 0.00 0.00 0.00 h - 0 0.00 0.00 0.00 h -
08/03/12 0 0.00 0.00 0.00 h - 0 0.00 0.00 0.00 h -
08/04/12 0 0.00 0.00 0.00 h - 10 0.25 0.00 0.00 h -
08/05/12 0 0.00 0.00 0.00 h - 10 0.25 0.31 0.44-0.63 h -
08/06/12 0 0.00 0.00 0.00 h - 20 0.40 0.00 0.00 m -
08/07/12 0 0.00 0.04 0.00 h - 20 0.40 0.00 0.00 m -
08/08/12 30 0.25 0.00 0.00 m - 30 0.50 0.00 0.04-0.24 h -
08/09/12 0 0.00 0.00 0.00 h - 0 0.00 0.00 0.00 h -
08/10/12 0 0.00 0.00 0.00 h - 0 0.00 0.00 0.00 h -
08/11/12 0 0.00 0.00 0.04-0.24 m - 0 0.00 0.00 0.00 h -
FCDMC – 2801 W. Durango St. Phoenix, AZ 85009 (602) 506-8655
32
TABLE A-1: MSP Outlooks Issued, Daily Verification Table - Monsoon Season 2012
Forecast Zone Data Verification Forecast Zone Data Verification
Date Prob. (%)
QPF (in)
ALERT (in)
GAQPE (in) AOF POD FA
Prob. (%)
QPF (in)
ALERT (in)
GAQPE (in) AOF POD FA
08/12/12 20 0.25 0.00 0.00 h - 20 0.25 0.00 0.00 h -
08/13/12 30 0.25 0.00 0.00 m - 20 0.25 0.28 0.04-0.24 h -
08/14/12 20 0.25 0.04 0.25-0.43 h - 20 0.30 0.31 0.25-0.43 h -
08/15/12 30 0.50 0.00 0.00 m - 40 0.75 1.57 1.03-1.22 h h
08/16/12 30 1.00 0.94 1.03-1.22 h h 40 0.75 1.22 1.03-1.22 h h
08/17/12 30 1.50 0.71 0.04-0.24 h m 40 1.50 0.08 0.00 m - x
08/18/12 40 1.50 0.79 0.64-0.83 h h 50 1.50 0.12 0.04-0.24 m - x
08/19/12 30 1.50 0.24 0.04-0.24 m - 40 1.50 0.20 0.25-0.43 m - x
08/20/12 40 1.50 0.00 0.04-0.24 m - x 30 1.25 0.00 0.25-0.43 m -
08/21/12 20 1.00 0.28 0.84-1.02 h h 40 1.25 1.18 0.64-0.83 h h
08/22/12 50 1.25 1.06 0.64-0.83 h h 40 1.25 1.54 0.44-0.63 h h
08/23/12 30 1.25 0.75 0.84-1.02 h h 30 1.50 0.24 0.00 m - x
08/24/12 20 0.75 0.20 0.04-0.24 m - 50 1.00 1.61 1.03-1.22 h h
08/25/12 0 0.00 0.00 0.00 h - 10 0.35 0.00 0.00 h -
08/26/12 0 0.00 0.00 0.00 h - 10 0.35 0.00 0.00 h -
08/27/12 0 0.00 0.00 0.00 h - 10 0.25 0.00 0.00 h -
08/28/12 0 0.00 0.00 0.00 h - 10 0.25 0.00 0.00 h -
08/29/12 10 0.25 0.00 0.00 h - 10 0.15 0.00 0.00 h -
08/30/12 20 0.25 0.00 0.00 h - 10 0.25 0.00 0.00 h -
08/31/12 10 0.50 0.00 0.00 h - 10 0.50 0.00 0.00 m -
31 days 24/31* 5/6* 1.00 23/31* 5/5* 4.00
09/01/12 20 0.50 0.71 1.23-1.61 h m 10 0.50 0.00 0.00 m -
09/02/12 0 0.00 0.00 0.00 h - 10 0.50 0.00 0.00 m -
09/03/12 10 0.50 0.00 0.00 h - 0 0.00 0.24 0.25-0.43 m -
09/04/12 30 1.00 0.75 1.23-1.61 h h 30 0.75 0.16 1.03-1.22 h h
09/05/12 20 1.00 0.00 0.00 m - 20 0.75 0.00 0.00 m -
09/06/12 20 1.00 0.24 0.44-0.63 h - 20 1.25 0.00 0.00 m -
09/07/12 40 1.50 0.04 0.00 m - x 30 1.00 2.05 1.23-1.61 h h
FCDMC – 2801 W. Durango St. Phoenix, AZ 85009 (602) 506-8655
33
TABLE A-1: MSP Outlooks Issued, Daily Verification Table - Monsoon Season 2012
Forecast Zone Data Verification Forecast Zone Data Verification
Date Prob. (%)
QPF (in)
ALERT (in)
GAQPE (in) AOF POD FA
Prob. (%)
QPF (in)
ALERT (in)
GAQPE (in) AOF POD FA
09/08/12 40 1.25 0.00 0.00 m - x 40 1.00 0.00 0.00 m - x
09/09/12 40 0.75 0.04 0.64-0.83 h h 30 0.75 0.12 0.04-0.24 m -
09/10/12 40 1.50 0.39 0.44-0.63 m m x 30 1.00 1.65 1.62-1.81 h h
09/11/12 50 1.50 0.08 0.00 m - x 40 1.50 0.16 0.00 m - x
09/12/12 20 0.25 0.00 0.00 h - 20 0.50 0.35 0.04-0.24 h -
09/13/12 0 0.00 0.00 0.00 h - 20 0.35 0.00 0.00 h -
09/14/12 0 0.00 0.00 0.00 h - 0 0.00 0.00 0.00 h -
09/15/12 0 0.00 0.00 0.00 h - 0 0.00 0.00 0.00 h -
09/16/12 0 0.00 0.00 0.00 h - 0 0.00 0.00 0.00 h -
09/17/12 0 0.00 0.00 0.00 h - 0 0.00 0.00 0.00 h -
09/18/12 0 0.00 0.00 0.00 h - 0 0.00 0.00 0.00 h -
09/19/12 0 0.00 0.00 0.00 h - 0 0.00 0.00 0.00 h -
09/20/12 0 0.00 0.00 0.00 h - 0 0.00 0.00 0.00 h -
09/21/12 0 0.00 0.00 0.00 h - 0 0.00 0.00 0.00 h -
09/22/12 0 0.00 0.00 0.00 h - 0 0.00 0.00 0.00 h -
09/23/12 0 0.00 0.00 0.00 h - 0 0.00 0.00 0.00 h -
09/24/12 0 0.00 0.00 0.00 h - 10 0.10 0.00 0.00 h -
09/25/12 0 0.00 0.00 0.00 h - 0 0.00 0.00 0.00 h -
09/26/12 0 0.00 0.00 0.00 h - 0 0.00 0.00 0.00 h -
09/27/12 0 0.00 0.00 0.00 h - 0 0.00 0.00 0.00 h -
09/28/12 0 0.00 0.00 0.00 h - 0 0.00 0.00 0.00 h -
09/29/12 0 0.00 0.00 0.00 h - 0 0.00 0.00 0.00 h -
09/30/12 0 0.00 0.00 0.00 h - 0 0.00 0.00 0.00 h -
30 days 25/30* 2/4* 4 22/30* 3/3* 2
Sycamore Creek Phoenix North
06/15/12 n/a n/a n/a 0.00 n/a n/a n/a 0 0.00 0.00 0.00 h -
06/16/12 n/a n/a n/a 0.00 n/a n/a n/a 0 0.00 0.00 0.00 h -
FCDMC – 2801 W. Durango St. Phoenix, AZ 85009 (602) 506-8655
34
TABLE A-1: MSP Outlooks Issued, Daily Verification Table - Monsoon Season 2012
Forecast Zone Data Verification Forecast Zone Data Verification
Date Prob. (%)
QPF (in)
ALERT (in)
GAQPE (in) AOF POD FA
Prob. (%)
QPF (in)
ALERT (in)
GAQPE (in) AOF POD FA
06/17/12 n/a n/a n/a 0.00 n/a n/a n/a 0 0.00 0.00 0.00 h -
06/18/12 n/a n/a n/a 0.00 n/a n/a n/a 0 0.00 0.00 0.00 h -
06/19/12 n/a n/a n/a 0.00 n/a n/a n/a 0 0.00 0.00 0.00 h -
06/20/12 n/a n/a n/a 0.00 n/a n/a n/a 0 0.00 0.00 0.00 h -
06/21/12 n/a n/a n/a 0.00 n/a n/a n/a 0 0.00 0.00 0.00 h -
06/22/12 0 0.00 0.00 0.00 h - 0 0.00 0.00 0.00 h -
06/23/12 0 0.00 0.00 0.00 h - 0 0.00 0.00 0.00 h -
06/24/12 20 0.25 0.00 0.00 h - 10 0.10 0.00 0.00 h -
06/25/12 20 0.25 0.00 0.00 h - 0 0.00 0.00 0.00 h -
06/26/12 20 0.35 0.00 0.00 h - 10 0.05 0.00 0.00 h -
06/27/12 20 0.25 0.00 0.00 h - 0 0.00 0.00 0.00 h -
06/28/12 20 0.25 0.00 0.00 h - 0 0.00 0.00 0.00 h -
06/29/12 0 0.00 0.00 0.00 h - 0 0.00 0.00 0.00 h -
06/30/12 0 0.00 0.00 0.00 h - 0 0.00 0.00 0.00 h -
16 days 9/9* 0.00 0.00 16/16* 0.00 0.00
07/01/12 0 0.00 0.00 0.00 h - 0 0.00 0.00 0.00 h -
07/02/12 10 0.10 0.00 0.00 h - 0 0.00 0.00 0.00 h -
07/03/12 40 0.50 0.00 0.00 m - x 30 0.25 0.00 0.10-0.25 h -
07/04/12 50 0.75 0.04 0.00 m - x 40 0.50 0.16 0.00 m - x
07/05/12 10 0.10 0.00 0.00 h - 0 0.00 0.00 0.00 h -
07/06/12 10 0.10 0.00 0.00 h - 0 0.00 0.00 0.00 h -
07/07/12 0 0.00 0.00 0.00 h - 0 0.00 0.00 0.00 h -
07/08/12 0 0.00 0.00 0.00 h - 0 0.00 0.00 0.00 h -
07/09/12 20 0.25 0.00 0.00 h - 0 0.00 0.00 0.00 h -
07/10/12 30 0.40 0.00 0.00 m - 0 0.00 0.00 0.00 h -
07/11/12 40 0.60 0.00 0.25-0.43 h - 30 0.50 0.31 0.25-0.43 h -
07/12/12 20 0.75 0.00 0.00 m - 20 0.67 0.00 0.00 m -
07/13/12 50 1.00 0.04 0.00 m - x 40 0.70 0.20 0.04-0.24 m - x
FCDMC – 2801 W. Durango St. Phoenix, AZ 85009 (602) 506-8655
35
TABLE A-1: MSP Outlooks Issued, Daily Verification Table - Monsoon Season 2012
Forecast Zone Data Verification Forecast Zone Data Verification
Date Prob. (%)
QPF (in)
ALERT (in)
GAQPE (in) AOF POD FA
Prob. (%)
QPF (in)
ALERT (in)
GAQPE (in) AOF POD FA
07/14/12 40 1.00 0.55 0.44-0.63 h h 30 0.50 0.04 0.00 m -
07/15/12 40 1.00 0.00 0.00 m - x 40 0.50 0.12 0.25-0.43 h -
07/16/12 40 0.60 0.00 0.00 m - x 20 0.30 0.04 0.00 h -
07/17/12 10 0.15 0.00 0.00 h - 0 0.00 0.00 0.00 h -
07/18/12 0 0.00 0.00 0.00 h - 0 0.00 0.00 0.00 h -
07/19/12 10 0.10 0.00 0.00 h - 0 0.00 0.00 0.00 h -
07/20/12 30 0.75 0.16 0.04-0.24 m - 20 0.33 0.00 0.00 h -
07/21/12 30 0.75 0.00 0.00 m - x 30 0.50 0.67 1.62-1.81 h h
07/22/12 50 1.25 0.04 0.00 m - x 40 0.75 0.20 0.25-0.43 m - x
07/23/12 50 1.00 1.34 1.23-1.61 h h 30 0.75 1.14 0.04-0.24 h h
07/24/12 40 0.75 0.43 0.04-0.24 m - 20 0.25 0.00 0.00 h -
07/25/12 20 0.25 0.00 0.00 h - 0 0.00 0.00 0.00 h -
07/26/12 0 0.00 0.00 0.00 h - 0 0.00 0.00 0.00 h -
07/27/12 0 0.00 0.00 0.00 h - 0 0.00 0.00 0.00 h -
07/28/12 40 0.75 1.10 1.03-1.22 h h 10 0.25 0.24 0.25-0.43 h -
07/29/12 50 1.00 0.08 0.00 m - x 30 0.50 0.24 0.25-0.43 h -
07/30/12 30 0.75 0.00 0.00 m - x 20 0.50 0.04 0.00 m -
07/31/12 30 0.40 0.00 0.00 m - 10 0.25 0.55 0.44-0.63 h m
31 days 17/31* 3/3* 9.00 25/31* 2/3* 3.00
08/01/12 30 0.35 0.00 0.00 m - 0 0.00 0.00 0.00 h -
08/02/12 0 0.00 0.00 0.00 h - 0 0.00 0.00 0.00 h -
08/03/12 0 0.00 0.00 0.00 h - 0 0.00 0.00 0.00 h -
08/04/12 10 0.25 0.00 0.00 h - 0 0.00 0.00 0.00 h -
08/05/12 10 0.33 0.12 0.04-0.24 h - 0 0.00 0.04 0.00 h -
08/06/12 30 0.40 0.12 0.04-0.24 h - 0 0.00 0.00 0.00 h -
08/07/12 30 0.40 0.00 0.00 m - 0 0.00 0.00 0.00 h -
08/08/12 30 0.50 0.00 0.00 m - 10 0.10 0.00 0.00 h -
08/09/12 0 0.00 0.00 0.00 h - 0 0.00 0.00 0.00 h -
FCDMC – 2801 W. Durango St. Phoenix, AZ 85009 (602) 506-8655
36
TABLE A-1: MSP Outlooks Issued, Daily Verification Table - Monsoon Season 2012
Forecast Zone Data Verification Forecast Zone Data Verification
Date Prob. (%)
QPF (in)
ALERT (in)
GAQPE (in) AOF POD FA
Prob. (%)
QPF (in)
ALERT (in)
GAQPE (in) AOF POD FA
08/10/12 0 0.00 0.00 0.00 h - 0 0.00 0.00 0.00 h -
08/11/12 0 0.00 0.00 0.00 h - 0 0.00 0.00 0.00 h -
08/12/12 20 0.25 0.00 0.00 h - 0 0.00 0.00 0.00 h -
08/13/12 20 0.25 0.00 0.00 h - 0 0.00 0.00 0.00 h -
08/14/12 20 0.30 0.51 0.64-0.83 h m 0 0.00 0.75 0.84-1.02 m m
08/15/12 40 0.75 0.00 0.00 m - x 20 0.75 0.00 0.00 m -
08/16/12 40 0.75 1.69 1.03-1.22 h m 30 0.75 0.20 0.04-0.24 m -
08/17/12 40 1.50 0.04 0.00 - x 30 1.25 0.08 0.00 m - x
08/18/12 50 1.50 0.83 0.64-0.83 h h 40 1.25 0.16 0.25-0.43 m - x
08/19/12 40 1.50 0.00 0.00 m - x 30 1.25 0.00 0.00 m - x
08/20/12 30 1.25 0.12 0.44-0.63 h - x 20 1.00 0.00 0.00 m -
08/21/12 40 1.25 0.28 0.04-0.24 m - x 30 1.50 0.71 0.84-1.02 h h
08/22/12 40 1.00 1.06 0.44-0.63 h h 40 1.50 1.18 0.44-0.63 h h
08/23/12 30 1.50 0.04 0.00 m - x 30 1.25 0.04 0.00 m - x
08/24/12 40 1.00 0.24 0.00 m - x 30 0.75 0.20 0.25-0.43 h -
08/25/12 10 0.35 0.00 0.00 h - 0 0.00 0.00 0.00 h -
08/26/12 10 0.35 0.00 0.00 h - 0 0.00 0.00 0.00 h -
08/27/12 10 0.35 0.00 0.00 h - 0 0.00 0.00 0.00 h -
08/28/12 10 0.35 0.00 0.00 h - 0 0.00 0.00 0.00 h -
08/29/12 10 0.15 0.00 0.00 h - 0 0.00 0.00 0.00 h -
08/30/12 10 0.25 0.00 0.25-0.43 h - 0 0.00 0.00 0.00 h -
08/31/12 10 0.50 0.00 0.00 m - 0 0.00 0.00 0.00 h -
31 days 22/31* 2/4* 7.00 23/31* 2/3* 4.00
09/01/12 10 0.50 0.00 0.00 m - 0 0.00 0.00 0.00 h -
09/02/12 10 0.50 0.00 0.00 m - 0 0.00 0.00 0.00 h -
09/03/12 0 0.00 0.94 0.84-1.02 m m 0 0.00 0.00 0.00 h -
09/04/12 30 1.00 0.31 0.25-0.43 m - 20 0.50 0.16 0.04-0.24 h -
09/05/12 20 0.75 0.00 0.00 m - 10 0.50 0.00 0.00 m -
FCDMC – 2801 W. Durango St. Phoenix, AZ 85009 (602) 506-8655
37
TABLE A-1: MSP Outlooks Issued, Daily Verification Table - Monsoon Season 2012
Forecast Zone Data Verification Forecast Zone Data Verification
Date Prob. (%)
QPF (in)
ALERT (in)
GAQPE (in) AOF POD FA
Prob. (%)
QPF (in)
ALERT (in)
GAQPE (in) AOF POD FA
09/06/12 20 1.50 0.43 0.64-0.83 h h 10 0.75 0.00 0.00 m -
09/07/12 30 0.50 0.71 0.84-1.02 h h 30 0.50 1.18 0.64-0.83 h h
09/08/12 40 1.00 0.00 0.00 m - x 30 1.00 0.00 0.00 m - x
09/09/12 30 0.75 0.00 0.00 m - x 20 0.50 0.43 0.44-0.63 h -
09/10/12 30 0.75 0.08 0.00 m - x 30 0.75 0.71 0.44-0.63 h h
09/11/12 40 1.50 0.04 0.00 m - x 40 1.00 0.12 0.00 m - x
09/12/12 20 0.50 0.00 0.00 m - 10 0.15 0.16 0.25-0.43 h -
09/13/12 20 0.35 0.00 0.00 h - 10 0.15 0.00 0.00 h -
09/14/12 0 0.00 0.00 0.00 h - 0 0.00 0.00 0.00 h -
09/15/12 0 0.00 0.00 0.00 h - 0 0.00 0.00 0.00 h -
09/16/12 0 0.00 0.00 0.00 h - 0 0.00 0.00 0.00 h -
09/17/12 0 0.00 0.00 0.00 h - 0 0.00 0.00 0.00 h -
09/18/12 0 0.00 0.00 0.00 h - 0 0.00 0.00 0.00 h -
09/19/12 0 0.00 0.00 0.00 h - 0 0.00 0.00 0.00 h -
09/20/12 0 0.00 0.00 0.00 h - 0 0.00 0.00 0.00 h -
09/21/12 0 0.00 0.00 0.00 h - 0 0.00 0.00 0.00 h -
09/22/12 0 0.00 0.00 0.00 h - 0 0.00 0.00 0.00 h -
09/23/12 0 0.00 0.00 0.00 h - 0 0.00 0.00 0.00 h -
09/24/12 10 0.10 0.00 0.00 h - 0 0.00 0.00 0.00 h -
09/25/12 0 0.00 0.00 0.00 h - 0 0.00 0.00 0.00 h -
09/26/12 0 0.00 0.00 0.00 h - 0 0.00 0.00 0.00 h -
09/27/12 0 0.00 0.00 0.00 h - 0 0.00 0.00 0.00 h -
09/28/12 0 0.00 0.00 0.00 h - 0 0.00 0.00 0.00 h -
09/29/12 0 0.00 0.00 0.00 h - 0 0.00 0.00 0.00 h -
09/30/12 0 0.00 0.00 0.00 h - 0 0.00 0.00 0.00 h -
30 days 20/30* 2/3* 4 26/30* 2/2* 2
FCDMC – 2801 W. Durango St. Phoenix, AZ 85009 (602) 506-8655
38
TABLE A-1: MSP Outlooks Issued, Daily Verification Table - Monsoon Season 2012
Forecast Zone Data Verification Forecast Zone Data Verification
Date Prob. (%)
QPF (in)
ALERT (in)
GAQPE (in) AOF POD FA
Prob. (%)
QPF (in)
ALERT (in)
GAQPE (in) AOF POD FA
Phoenix North Scottsdale South
06/15/12 0 0.00 0.00 0.00 h - 0 0.00 0.00 0.00 h -
06/16/12 0 0.00 0.00 0.00 h - 0 0.00 0.00 0.00 h -
06/17/12 0 0.00 0.00 0.00 h - 0 0.00 0.00 0.00 h -
06/18/12 0 0.00 0.00 0.00 h - 0 0.00 0.00 0.00 h -
06/19/12 0 0.00 0.00 0.00 h - 0 0.00 0.00 0.00 h -
06/20/12 0 0.00 0.00 0.00 h - 0 0.00 0.00 0.00 h -
06/21/12 0 0.00 0.00 0.00 h - 0 0.00 0.00 0.00 h -
06/22/12 0 0.00 0.00 0.00 h - 0 0.00 0.00 0.00 h -
06/23/12 0 0.00 0.00 0.00 h - 0 0.00 0.00 0.00 h -
06/24/12 10 0.10 0.00 0.00 h - 20 0.10 0.00 0.00 h -
06/25/12 10 0.10 0.00 0.00 h - 20 0.25 0.00 0.00 h -
06/26/12 10 0.10 0.00 0.00 h - 10 0.10 0.00 0.00 h -
06/27/12 10 0.05 0.00 0.25-0.50 h - 10 0.05 0.00 0.00 h -
06/28/12 10 0.05 0.00 0.00 h - 10 0.05 0.00 0.00 h -
06/29/12 0 0.00 0.00 0.00 h - 0 0.00 0.00 0.00 h -
06/30/12 0 0.00 0.00 0.00 h - 0 0.00 0.00 0.00 h -
16 days 16/16* 0.00 0.00 16/16* 0.00 0.00
07/01/12 0 0.00 0.00 0.00 h - 0 0.00 0.00 0.00 h -
07/02/12 10 0.10 0.00 0.00 h - 0 0.00 0.00 0.00 h -
07/03/12 30 0.25 0.00 0.00 m - 30 0.35 0.00 0.00 m -
07/04/12 50 0.75 0.39 0.04-0.24 h - 40 0.50 0.00 0.00 m - x
07/05/12 0 0.00 0.04 0.00 h - 0 0.00 0.00 0.00 h -
07/06/12 0 0.00 0.00 0.00 h - 0 0.00 0.00 0.00 h -
07/07/12 0 0.00 0.00 0.00 h - 0 0.00 0.00 0.00 h -
07/08/12 0 0.00 0.00 0.00 h - 0 0.00 0.00 0.00 h -
07/09/12 0 0.00 0.00 0.00 h - 10 0.05 0.00 0.00 h -
07/10/12 0 0.00 0.08 0.00 h - 10 0.05 0.00 0.00 h -
FCDMC – 2801 W. Durango St. Phoenix, AZ 85009 (602) 506-8655
39
TABLE A-1: MSP Outlooks Issued, Daily Verification Table - Monsoon Season 2012
Forecast Zone Data Verification Forecast Zone Data Verification
Date Prob. (%)
QPF (in)
ALERT (in)
GAQPE (in) AOF POD FA
Prob. (%)
QPF (in)
ALERT (in)
GAQPE (in) AOF POD FA
07/11/12 30 0.50 0.75 0.64-0.83 h h 30 0.50 0.91 0.44-0.63 h h
07/12/12 10 0.50 0.04 0.00 m - 20 0.67 0.04 0.00 m -
07/13/12 30 0.50 0.24 0.04-0.24 m - 40 0.70 0.04 0.04-0.24 m - x
07/14/12 30 0.50 0.75 0.44-0.63 h h 30 0.75 0.83 0.44-0.63 h h
07/15/12 30 0.50 0.39 0.00 h - 40 0.75 0.04 0.04-0.24 m - x
07/16/12 20 0.30 0.00 0.00 h - 20 0.30 0.00 0.00 h -
07/17/12 0 0.00 0.00 0.00 h - 0 0.00 0.00 0.00 h -
07/18/12 0 0.00 0.00 0.00 h - 0 0.00 0.00 0.00 h -
07/19/12 0 0.00 0.00 0.00 h - 10 T 0.00 0.00 h -
07/20/12 20 0.33 0.16 0.00 h - 20 0.50 0.08 0.04-0.24 m -
07/21/12 20 0.33 0.20 0.25-0.43 h - 20 0.50 0.43 0.64-0.83 h h
07/22/12 30 0.60 0.12 0.25-0.43 h - 40 0.75 0.00 0.00 m - x
07/23/12 40 0.75 0.00 0.00 m - x 30 0.75 0.00 1.23-1.61 h h
07/24/12 10 0.25 0.00 0.00 h - 30 0.40 0.04 0.00 m -
07/25/12 0 0.00 0.00 0.00 h - 0 0.00 0.00 0.00 h -
07/26/12 0 0.00 0.00 0.00 h - 0 0.00 0.00 0.00 h -
07/27/12 0 0.00 0.00 0.00 h - 0 0.00 0.00 0.00 h -
07/28/12 20 0.25 0.20 0.44-0.63 h - 30 0.50 1.30 0.44-0.63 h h
07/29/12 40 0.75 0.40 0.25-0.43 h - 40 0.75 0.47 0.44-0.63 h h
07/30/12 20 0.50 0.00 0.00 m - 30 0.75 0.00 0.00 m -
07/31/12 20 0.25 0.24 0.44-0.63 h - 20 0.25 0.00 0.25-0.43 h -
31 days 26/31* 2/2* 1.00 22/31* 6/6* 4.00
08/01/12 0 0.00 0.00 0.00 h - 10 0.15 0.00 0.00 h -
08/02/12 0 0.00 0.00 0.00 h - 0 0.00 0.00 0.00 h -
08/03/12 0 0.00 0.00 0.00 h - 0 0.00 0.00 0.00 h -
08/04/12 0 0.00 0.00 0.00 h - 0 0.00 0.00 0.00 h -
08/05/12 0 0.00 0.12 0.04-0.24 m - 0 0.00 0.04 0.04-0.24 m -
08/06/12 10 0.15 0.00 0.00 h - 10 0.25 0.00 0.00 h -
FCDMC – 2801 W. Durango St. Phoenix, AZ 85009 (602) 506-8655
40
TABLE A-1: MSP Outlooks Issued, Daily Verification Table - Monsoon Season 2012
Forecast Zone Data Verification Forecast Zone Data Verification
Date Prob. (%)
QPF (in)
ALERT (in)
GAQPE (in) AOF POD FA
Prob. (%)
QPF (in)
ALERT (in)
GAQPE (in) AOF POD FA
08/07/12 0 0.00 0.00 0.00 h - 10 0.15 0.00 0.00 h -
08/08/12 10 0.10 0.00 0.00 h - 20 0.10 0.08 0.00 h -
08/09/12 0 0.00 0.00 0.00 h - 0 0.00 0.00 0.00 h -
08/10/12 0 0.00 0.00 0.00 h - 0 0.00 0.00 0.00 h -
08/11/12 0 0.00 0.00 0.00 h - 0 0.00 0.00 0.00 h -
08/12/12 0 0.00 0.00 0.00 h - 0 0.00 0.00 0.00 h -
08/13/12 0 0.00 0.04 0.00 h - 10 0.10 0.00 0.00 h -
08/14/12 0 0.00 0.75 0.84-1.02 m m 0 0.00 0.20 0.04-0.24 m -
08/15/12 30 1.00 0.00 0.00 m - x 20 0.75 0.00 0.00 m -
08/16/12 30 1.00 0.75 0.44-0.63 h h 20 0.75 0.83 0.64-0.83 h h
08/17/12 30 1.00 0.12 0.00 m - x 20 1.25 0.08 0.00 m -
08/18/12 30 1.00 0.00 0.00 m - x 40 1.25 0.00 0.00 m - x
08/19/12 20 1.00 0.00 0.00 m - 30 1.25 0.00 0.00 m - x
08/20/12 10 0.75 0.00 0.25-0.43 h - 20 1.25 0.00 0.00 m -
08/21/12 30 1.50 1.97 1.03-1.22 h h 30 1.50 0.47 1.03-1.22 h h
08/22/12 40 1.50 1.34 0.44-0.63 h h 40 1.50 1.14 0.44-0.63 h h
08/23/12 20 1.00 0.12 0.00 m - 30 1.25 0.39 0.00 m - x
08/24/12 10 0.50 0.35 0.00 h - 40 0.75 1.18 0.44-0.63 h h
08/25/12 0 0.00 0.00 0.00 h - 0 0.00 0.00 0.00 h -
08/26/12 0 0.00 0.00 0.00 h - 0 0.00 0.00 0.00 h -
08/27/12 10 0.15 0.00 0.00 h - 10 0.15 0.00 0.00 h -
08/28/12 0 0.00 0.00 0.00 h - 0 0.00 0.00 0.00 h -
08/29/12 0 0.00 0.00 0.00 h - 0 0.00 0.00 0.00 h -
08/30/12 0 0.00 0.00 0.00 h - 0 0.00 0.00 0.00 h -
08/31/12 0 0.00 0.00 0.00 h - 0 0.00 0.00 0.00 h -
31 days 24/31* 3/4* 3.00 23/31* 4/4* 3.00
09/01/12 0 0.00 0.00 0.00 h - 0 0.00 0.00 0.00 h -
09/02/12 10 0.33 0.00 0.00 h - 0 0.00 0.00 0.00 h -
FCDMC – 2801 W. Durango St. Phoenix, AZ 85009 (602) 506-8655
41
TABLE A-1: MSP Outlooks Issued, Daily Verification Table - Monsoon Season 2012
Forecast Zone Data Verification Forecast Zone Data Verification
Date Prob. (%)
QPF (in)
ALERT (in)
GAQPE (in) AOF POD FA
Prob. (%)
QPF (in)
ALERT (in)
GAQPE (in) AOF POD FA
09/03/12 0 0.00 0.12 0.04-0.24 m - 0 0.00 0.16 0.25-0.43 m -
09/04/12 10 0.50 0.35 0.25-0.43 h - 20 0.75 0.16 0.25-0.43 h -
09/05/12 10 0.50 0.00 0.00 m - 10 0.75 0.00 0.00 m -
09/06/12 10 0.75 0.04 0.00 m - 10 0.75 0.00 0.00 m -
09/07/12 30 0.50 0.98 0.04-0.24 h h 30 0.50 1.26 0.64-0.83 h h
09/08/12 30 1.00 0.00 0.00 m - x 30 1.25 0.00 0.00 m - x
09/09/12 20 0.50 0.39 0.4-0.24 h - 20 0.50 0.83 0.44-0.63 h h
09/10/12 40 1.00 0.35 0.25-0.43 m - x 40 1.00 0.47 0.25-0.43 m - x
09/11/12 40 0.75 0.12 0.00 m - x 40 1.25 0.08 0.00 m - x
09/12/12 0 0.00 0.00 0.00 h - 10 0.15 0.00 0.00 h -
09/13/12 0 0.00 0.00 0.00 h - 10 0.15 0.00 0.00 h -
09/14/12 0 0.00 0.00 0.00 h - 0 0.00 0.00 0.00 h -
09/15/12 0 0.00 0.00 0.00 h - 0 0.00 0.00 0.00 h -
09/16/12 0 0.00 0.00 0.00 h - 0 0.00 0.00 0.00 h -
09/17/12 0 0.00 0.00 0.00 h - 0 0.00 0.00 0.00 h -
09/18/12 0 0.00 0.00 0.00 h - 0 0.00 0.00 0.00 h -
09/19/12 0 0.00 0.00 0.00 h - 0 0.00 0.00 0.00 h -
09/20/12 0 0.00 0.04 0.00 h - 0 0.00 0.00 0.00 h -
09/21/12 0 0.00 0.00 0.00 h - 0 0.00 0.00 0.00 h -
09/22/12 0 0.00 0.00 0.00 h - 0 0.00 0.00 0.00 h -
09/23/12 0 0.00 0.00 0.00 h - 0 0.00 0.00 0.00 h -
09/24/12 0 0.00 0.00 0.00 h - 0 0.00 0.00 0.00 h -
09/25/12 0 0.00 0.00 0.00 h - 0 0.00 0.00 0.00 h -
09/26/12 0 0.00 0.00 0.00 h - 0 0.00 0.00 0.00 h -
09/27/12 0 0.00 0.00 0.00 h - 0 0.00 0.00 0.00 h -
09/28/12 0 0.00 0.00 0.00 h - 0 0.00 0.00 0.00 h -
09/29/12 0 0.00 0.00 0.00 h - 0 0.00 0.00 0.00 h -
09/30/12 0 0.00 0.00 0.00 h - 0 0.00 0.00 0.00 h -
FCDMC – 2801 W. Durango St. Phoenix, AZ 85009 (602) 506-8655
42
TABLE A-1: MSP Outlooks Issued, Daily Verification Table - Monsoon Season 2012
Forecast Zone Data Verification Forecast Zone Data Verification
Date Prob. (%)
QPF (in)
ALERT (in)
GAQPE (in) AOF POD FA
Prob. (%)
QPF (in)
ALERT (in)
GAQPE (in) AOF POD FA
30 days 24/30* 1/1* 3 24/30* 2/2* 3
Scottsdale South Southeast Valley
06/15/12 0 0.00 0.00 0.00 h - 0 0.00 0.00 0.00 h -
06/16/12 0 0.00 0.00 0.00 h - 0 0.00 0.00 0.00 h -
06/17/12 0 0.00 0.00 0.00 h - 0 0.00 0.00 0.00 h -
06/18/12 0 0.00 0.00 0.00 h - 0 0.00 0.00 0.00 h -
06/19/12 0 0.00 0.00 0.00 h - 0 0.00 0.00 0.00 h -
06/20/12 0 0.00 0.00 0.00 h - 0 0.00 0.00 0.00 h -
06/21/12 0 0.00 0.00 0.00 h - 0 0.00 0.00 0.00 h -
06/22/12 0 0.00 0.00 0.00 h - 0 0.00 0.00 0.00 h -
06/23/12 0 0.00 0.00 0.00 h - 0 0.00 0.00 0.00 h -
06/24/12 10 0.10 0.00 0.00 h - 30 0.25 0.00 0.00 h -
06/25/12 20 0.10 0.00 0.00 h - 20 0.35 0.00 0.00 h -
06/26/12 20 0.10 0.00 0.00 h - 20 0.35 0.00 0.00 h -
06/27/12 10 0.05 0.00 0.00 h - 20 0.15 0.00 0.00 h -
06/28/12 10 0.05 0.00 0.00 h - 20 0.15 0.00 0.00 h -
06/29/12 0 0.00 0.00 0.00 h - 0 0.00 0.00 0.00 h -
06/30/12 0 0.00 0.00 0.00 h - 0 0.00 0.00 0.00 h -
16 days 16/16* 0.00 0.00 16/16* 0.00 0.00
07/01/12 0 0.00 0.00 0.00 h - 0 0.00 0.00 0.00 h -
07/02/12 10 0.05 0.00 0.00 h - 10 0.10 0.00 0.00 h -
07/03/12 30 0.35 0.00 0.00 m - 30 0.50 0.00 0.00 m -
07/04/12 50 0.75 0.08 0.00 m - x 50 0.75 0.16 0.04-0.24 m - x
07/05/12 0 0.00 0.00 0.00 h - 0 0.00 0.04 0.00 h -
07/06/12 0 0.00 0.00 0.00 h - 0 0.00 0.00 0.00 h -
07/07/12 0 0.00 0.00 0.00 h - 0 0.00 0.00 0.00 h -
07/08/12 0 0.00 0.00 0.00 h - 0 0.00 0.00 0.00 h -
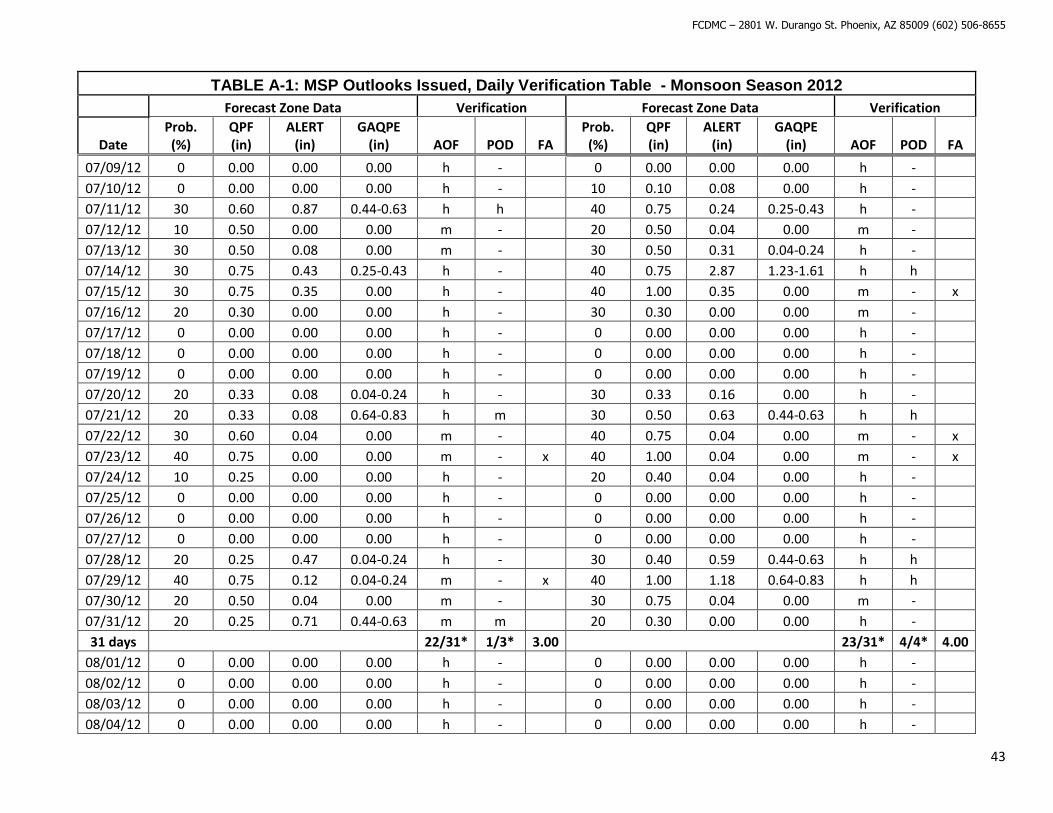
FCDMC – 2801 W. Durango St. Phoenix, AZ 85009 (602) 506-8655
43
TABLE A-1: MSP Outlooks Issued, Daily Verification Table - Monsoon Season 2012
Forecast Zone Data Verification Forecast Zone Data Verification
Date Prob. (%)
QPF (in)
ALERT (in)
GAQPE (in) AOF POD FA
Prob. (%)
QPF (in)
ALERT (in)
GAQPE (in) AOF POD FA
07/09/12 0 0.00 0.00 0.00 h - 0 0.00 0.00 0.00 h -
07/10/12 0 0.00 0.00 0.00 h - 10 0.10 0.08 0.00 h -
07/11/12 30 0.60 0.87 0.44-0.63 h h 40 0.75 0.24 0.25-0.43 h -
07/12/12 10 0.50 0.00 0.00 m - 20 0.50 0.04 0.00 m -
07/13/12 30 0.50 0.08 0.00 m - 30 0.50 0.31 0.04-0.24 h -
07/14/12 30 0.75 0.43 0.25-0.43 h - 40 0.75 2.87 1.23-1.61 h h
07/15/12 30 0.75 0.35 0.00 h - 40 1.00 0.35 0.00 m - x
07/16/12 20 0.30 0.00 0.00 h - 30 0.30 0.00 0.00 m -
07/17/12 0 0.00 0.00 0.00 h - 0 0.00 0.00 0.00 h -
07/18/12 0 0.00 0.00 0.00 h - 0 0.00 0.00 0.00 h -
07/19/12 0 0.00 0.00 0.00 h - 0 0.00 0.00 0.00 h -
07/20/12 20 0.33 0.08 0.04-0.24 h - 30 0.33 0.16 0.00 h -
07/21/12 20 0.33 0.08 0.64-0.83 h m 30 0.50 0.63 0.44-0.63 h h
07/22/12 30 0.60 0.04 0.00 m - 40 0.75 0.04 0.00 m - x
07/23/12 40 0.75 0.00 0.00 m - x 40 1.00 0.04 0.00 m - x
07/24/12 10 0.25 0.00 0.00 h - 20 0.40 0.04 0.00 h -
07/25/12 0 0.00 0.00 0.00 h - 0 0.00 0.00 0.00 h -
07/26/12 0 0.00 0.00 0.00 h - 0 0.00 0.00 0.00 h -
07/27/12 0 0.00 0.00 0.00 h - 0 0.00 0.00 0.00 h -
07/28/12 20 0.25 0.47 0.04-0.24 h - 30 0.40 0.59 0.44-0.63 h h
07/29/12 40 0.75 0.12 0.04-0.24 m - x 40 1.00 1.18 0.64-0.83 h h
07/30/12 20 0.50 0.04 0.00 m - 30 0.75 0.04 0.00 m -
07/31/12 20 0.25 0.71 0.44-0.63 m m 20 0.30 0.00 0.00 h -
31 days 22/31* 1/3* 3.00 23/31* 4/4* 4.00
08/01/12 0 0.00 0.00 0.00 h - 0 0.00 0.00 0.00 h -
08/02/12 0 0.00 0.00 0.00 h - 0 0.00 0.00 0.00 h -
08/03/12 0 0.00 0.00 0.00 h - 0 0.00 0.00 0.00 h -
08/04/12 0 0.00 0.00 0.00 h - 0 0.00 0.00 0.00 h -
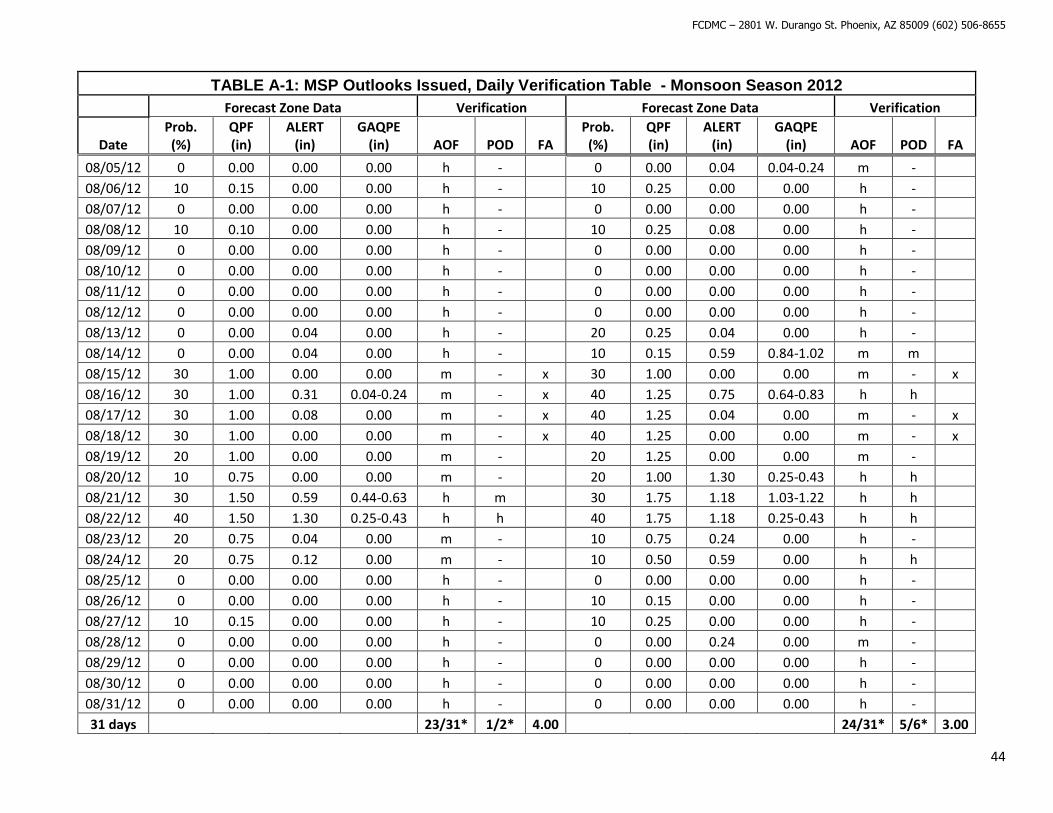
FCDMC – 2801 W. Durango St. Phoenix, AZ 85009 (602) 506-8655
44
TABLE A-1: MSP Outlooks Issued, Daily Verification Table - Monsoon Season 2012
Forecast Zone Data Verification Forecast Zone Data Verification
Date Prob. (%)
QPF (in)
ALERT (in)
GAQPE (in) AOF POD FA
Prob. (%)
QPF (in)
ALERT (in)
GAQPE (in) AOF POD FA
08/05/12 0 0.00 0.00 0.00 h - 0 0.00 0.04 0.04-0.24 m -
08/06/12 10 0.15 0.00 0.00 h - 10 0.25 0.00 0.00 h -
08/07/12 0 0.00 0.00 0.00 h - 0 0.00 0.00 0.00 h -
08/08/12 10 0.10 0.00 0.00 h - 10 0.25 0.08 0.00 h -
08/09/12 0 0.00 0.00 0.00 h - 0 0.00 0.00 0.00 h -
08/10/12 0 0.00 0.00 0.00 h - 0 0.00 0.00 0.00 h -
08/11/12 0 0.00 0.00 0.00 h - 0 0.00 0.00 0.00 h -
08/12/12 0 0.00 0.00 0.00 h - 0 0.00 0.00 0.00 h -
08/13/12 0 0.00 0.04 0.00 h - 20 0.25 0.04 0.00 h -
08/14/12 0 0.00 0.04 0.00 h - 10 0.15 0.59 0.84-1.02 m m
08/15/12 30 1.00 0.00 0.00 m - x 30 1.00 0.00 0.00 m - x
08/16/12 30 1.00 0.31 0.04-0.24 m - x 40 1.25 0.75 0.64-0.83 h h
08/17/12 30 1.00 0.08 0.00 m - x 40 1.25 0.04 0.00 m - x
08/18/12 30 1.00 0.00 0.00 m - x 40 1.25 0.00 0.00 m - x
08/19/12 20 1.00 0.00 0.00 m - 20 1.25 0.00 0.00 m -
08/20/12 10 0.75 0.00 0.00 m - 20 1.00 1.30 0.25-0.43 h h
08/21/12 30 1.50 0.59 0.44-0.63 h m 30 1.75 1.18 1.03-1.22 h h
08/22/12 40 1.50 1.30 0.25-0.43 h h 40 1.75 1.18 0.25-0.43 h h
08/23/12 20 0.75 0.04 0.00 m - 10 0.75 0.24 0.00 h -
08/24/12 20 0.75 0.12 0.00 m - 10 0.50 0.59 0.00 h h
08/25/12 0 0.00 0.00 0.00 h - 0 0.00 0.00 0.00 h -
08/26/12 0 0.00 0.00 0.00 h - 10 0.15 0.00 0.00 h -
08/27/12 10 0.15 0.00 0.00 h - 10 0.25 0.00 0.00 h -
08/28/12 0 0.00 0.00 0.00 h - 0 0.00 0.24 0.00 m -
08/29/12 0 0.00 0.00 0.00 h - 0 0.00 0.00 0.00 h -
08/30/12 0 0.00 0.00 0.00 h - 0 0.00 0.00 0.00 h -
08/31/12 0 0.00 0.00 0.00 h - 0 0.00 0.00 0.00 h -
31 days 23/31* 1/2* 4.00 24/31* 5/6* 3.00
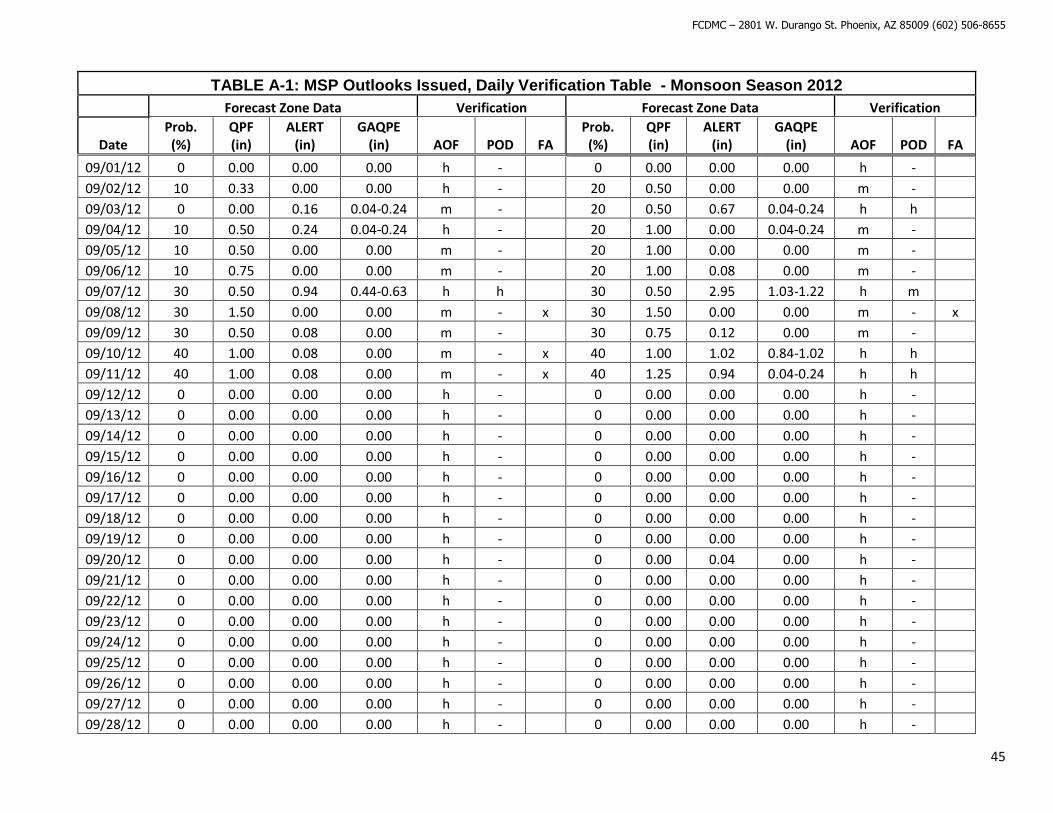
FCDMC – 2801 W. Durango St. Phoenix, AZ 85009 (602) 506-8655
45
TABLE A-1: MSP Outlooks Issued, Daily Verification Table - Monsoon Season 2012
Forecast Zone Data Verification Forecast Zone Data Verification
Date Prob. (%)
QPF (in)
ALERT (in)
GAQPE (in) AOF POD FA
Prob. (%)
QPF (in)
ALERT (in)
GAQPE (in) AOF POD FA
09/01/12 0 0.00 0.00 0.00 h - 0 0.00 0.00 0.00 h -
09/02/12 10 0.33 0.00 0.00 h - 20 0.50 0.00 0.00 m -
09/03/12 0 0.00 0.16 0.04-0.24 m - 20 0.50 0.67 0.04-0.24 h h
09/04/12 10 0.50 0.24 0.04-0.24 h - 20 1.00 0.00 0.04-0.24 m -
09/05/12 10 0.50 0.00 0.00 m - 20 1.00 0.00 0.00 m -
09/06/12 10 0.75 0.00 0.00 m - 20 1.00 0.08 0.00 m -
09/07/12 30 0.50 0.94 0.44-0.63 h h 30 0.50 2.95 1.03-1.22 h m
09/08/12 30 1.50 0.00 0.00 m - x 30 1.50 0.00 0.00 m - x
09/09/12 30 0.50 0.08 0.00 m - 30 0.75 0.12 0.00 m -
09/10/12 40 1.00 0.08 0.00 m - x 40 1.00 1.02 0.84-1.02 h h
09/11/12 40 1.00 0.08 0.00 m - x 40 1.25 0.94 0.04-0.24 h h
09/12/12 0 0.00 0.00 0.00 h - 0 0.00 0.00 0.00 h -
09/13/12 0 0.00 0.00 0.00 h - 0 0.00 0.00 0.00 h -
09/14/12 0 0.00 0.00 0.00 h - 0 0.00 0.00 0.00 h -
09/15/12 0 0.00 0.00 0.00 h - 0 0.00 0.00 0.00 h -
09/16/12 0 0.00 0.00 0.00 h - 0 0.00 0.00 0.00 h -
09/17/12 0 0.00 0.00 0.00 h - 0 0.00 0.00 0.00 h -
09/18/12 0 0.00 0.00 0.00 h - 0 0.00 0.00 0.00 h -
09/19/12 0 0.00 0.00 0.00 h - 0 0.00 0.00 0.00 h -
09/20/12 0 0.00 0.00 0.00 h - 0 0.00 0.04 0.00 h -
09/21/12 0 0.00 0.00 0.00 h - 0 0.00 0.00 0.00 h -
09/22/12 0 0.00 0.00 0.00 h - 0 0.00 0.00 0.00 h -
09/23/12 0 0.00 0.00 0.00 h - 0 0.00 0.00 0.00 h -
09/24/12 0 0.00 0.00 0.00 h - 0 0.00 0.00 0.00 h -
09/25/12 0 0.00 0.00 0.00 h - 0 0.00 0.00 0.00 h -
09/26/12 0 0.00 0.00 0.00 h - 0 0.00 0.00 0.00 h -
09/27/12 0 0.00 0.00 0.00 h - 0 0.00 0.00 0.00 h -
09/28/12 0 0.00 0.00 0.00 h - 0 0.00 0.00 0.00 h -
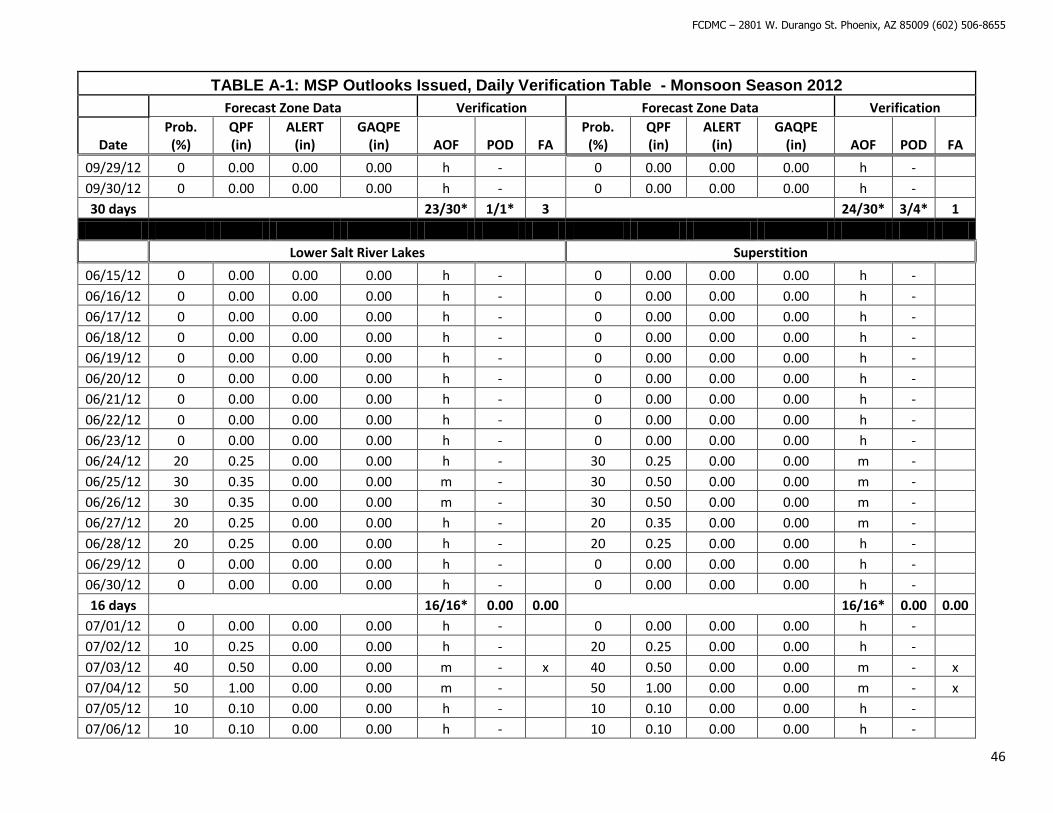
FCDMC – 2801 W. Durango St. Phoenix, AZ 85009 (602) 506-8655
46
TABLE A-1: MSP Outlooks Issued, Daily Verification Table - Monsoon Season 2012
Forecast Zone Data Verification Forecast Zone Data Verification
Date Prob. (%)
QPF (in)
ALERT (in)
GAQPE (in) AOF POD FA
Prob. (%)
QPF (in)
ALERT (in)
GAQPE (in) AOF POD FA
09/29/12 0 0.00 0.00 0.00 h - 0 0.00 0.00 0.00 h -
09/30/12 0 0.00 0.00 0.00 h - 0 0.00 0.00 0.00 h -
30 days 23/30* 1/1* 3 24/30* 3/4* 1
Lower Salt River Lakes Superstition
06/15/12 0 0.00 0.00 0.00 h - 0 0.00 0.00 0.00 h -
06/16/12 0 0.00 0.00 0.00 h - 0 0.00 0.00 0.00 h -
06/17/12 0 0.00 0.00 0.00 h - 0 0.00 0.00 0.00 h -
06/18/12 0 0.00 0.00 0.00 h - 0 0.00 0.00 0.00 h -
06/19/12 0 0.00 0.00 0.00 h - 0 0.00 0.00 0.00 h -
06/20/12 0 0.00 0.00 0.00 h - 0 0.00 0.00 0.00 h -
06/21/12 0 0.00 0.00 0.00 h - 0 0.00 0.00 0.00 h -
06/22/12 0 0.00 0.00 0.00 h - 0 0.00 0.00 0.00 h -
06/23/12 0 0.00 0.00 0.00 h - 0 0.00 0.00 0.00 h -
06/24/12 20 0.25 0.00 0.00 h - 30 0.25 0.00 0.00 m -
06/25/12 30 0.35 0.00 0.00 m - 30 0.50 0.00 0.00 m -
06/26/12 30 0.35 0.00 0.00 m - 30 0.50 0.00 0.00 m -
06/27/12 20 0.25 0.00 0.00 h - 20 0.35 0.00 0.00 m -
06/28/12 20 0.25 0.00 0.00 h - 20 0.25 0.00 0.00 h -
06/29/12 0 0.00 0.00 0.00 h - 0 0.00 0.00 0.00 h -
06/30/12 0 0.00 0.00 0.00 h - 0 0.00 0.00 0.00 h -
16 days 16/16* 0.00 0.00 16/16* 0.00 0.00
07/01/12 0 0.00 0.00 0.00 h - 0 0.00 0.00 0.00 h -
07/02/12 10 0.25 0.00 0.00 h - 20 0.25 0.00 0.00 h -
07/03/12 40 0.50 0.00 0.00 m - x 40 0.50 0.00 0.00 m - x
07/04/12 50 1.00 0.00 0.00 m - 50 1.00 0.00 0.00 m - x
07/05/12 10 0.10 0.00 0.00 h - 10 0.10 0.00 0.00 h -
07/06/12 10 0.10 0.00 0.00 h - 10 0.10 0.00 0.00 h -
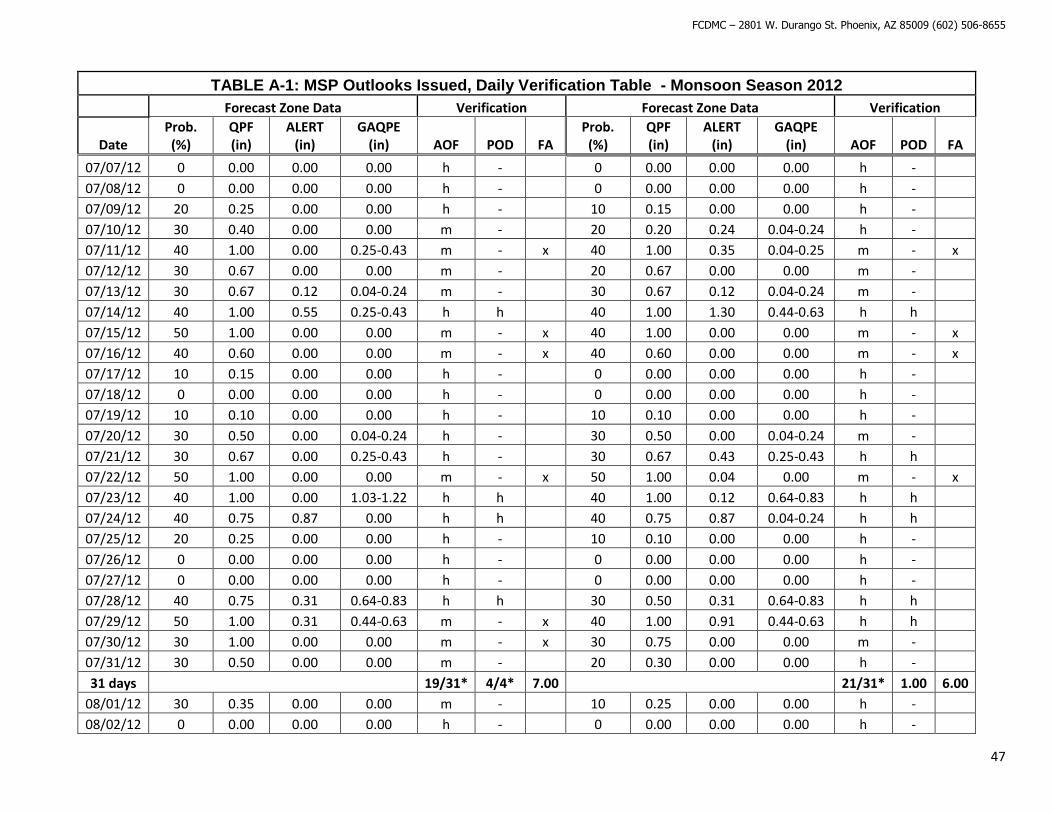
FCDMC – 2801 W. Durango St. Phoenix, AZ 85009 (602) 506-8655
47
TABLE A-1: MSP Outlooks Issued, Daily Verification Table - Monsoon Season 2012
Forecast Zone Data Verification Forecast Zone Data Verification
Date Prob. (%)
QPF (in)
ALERT (in)
GAQPE (in) AOF POD FA
Prob. (%)
QPF (in)
ALERT (in)
GAQPE (in) AOF POD FA
07/07/12 0 0.00 0.00 0.00 h - 0 0.00 0.00 0.00 h -
07/08/12 0 0.00 0.00 0.00 h - 0 0.00 0.00 0.00 h -
07/09/12 20 0.25 0.00 0.00 h - 10 0.15 0.00 0.00 h -
07/10/12 30 0.40 0.00 0.00 m - 20 0.20 0.24 0.04-0.24 h -
07/11/12 40 1.00 0.00 0.25-0.43 m - x 40 1.00 0.35 0.04-0.25 m - x
07/12/12 30 0.67 0.00 0.00 m - 20 0.67 0.00 0.00 m -
07/13/12 30 0.67 0.12 0.04-0.24 m - 30 0.67 0.12 0.04-0.24 m -
07/14/12 40 1.00 0.55 0.25-0.43 h h 40 1.00 1.30 0.44-0.63 h h
07/15/12 50 1.00 0.00 0.00 m - x 40 1.00 0.00 0.00 m - x
07/16/12 40 0.60 0.00 0.00 m - x 40 0.60 0.00 0.00 m - x
07/17/12 10 0.15 0.00 0.00 h - 0 0.00 0.00 0.00 h -
07/18/12 0 0.00 0.00 0.00 h - 0 0.00 0.00 0.00 h -
07/19/12 10 0.10 0.00 0.00 h - 10 0.10 0.00 0.00 h -
07/20/12 30 0.50 0.00 0.04-0.24 h - 30 0.50 0.00 0.04-0.24 m -
07/21/12 30 0.67 0.00 0.25-0.43 h - 30 0.67 0.43 0.25-0.43 h h
07/22/12 50 1.00 0.00 0.00 m - x 50 1.00 0.04 0.00 m - x
07/23/12 40 1.00 0.00 1.03-1.22 h h 40 1.00 0.12 0.64-0.83 h h
07/24/12 40 0.75 0.87 0.00 h h 40 0.75 0.87 0.04-0.24 h h
07/25/12 20 0.25 0.00 0.00 h - 10 0.10 0.00 0.00 h -
07/26/12 0 0.00 0.00 0.00 h - 0 0.00 0.00 0.00 h -
07/27/12 0 0.00 0.00 0.00 h - 0 0.00 0.00 0.00 h -
07/28/12 40 0.75 0.31 0.64-0.83 h h 30 0.50 0.31 0.64-0.83 h h
07/29/12 50 1.00 0.31 0.44-0.63 m - x 40 1.00 0.91 0.44-0.63 h h
07/30/12 30 1.00 0.00 0.00 m - x 30 0.75 0.00 0.00 m -
07/31/12 30 0.50 0.00 0.00 m - 20 0.30 0.00 0.00 h -
31 days 19/31* 4/4* 7.00 21/31* 1.00 6.00
08/01/12 30 0.35 0.00 0.00 m - 10 0.25 0.00 0.00 h -
08/02/12 0 0.00 0.00 0.00 h - 0 0.00 0.00 0.00 h -
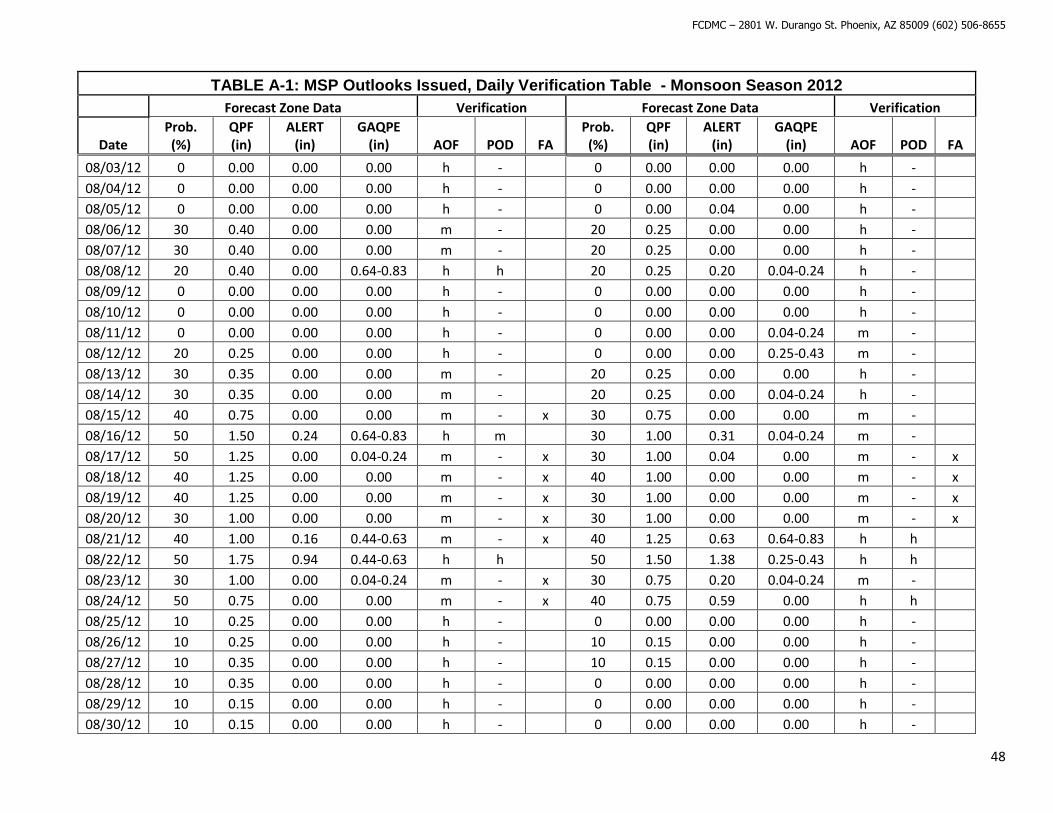
FCDMC – 2801 W. Durango St. Phoenix, AZ 85009 (602) 506-8655
48
TABLE A-1: MSP Outlooks Issued, Daily Verification Table - Monsoon Season 2012
Forecast Zone Data Verification Forecast Zone Data Verification
Date Prob. (%)
QPF (in)
ALERT (in)
GAQPE (in) AOF POD FA
Prob. (%)
QPF (in)
ALERT (in)
GAQPE (in) AOF POD FA
08/03/12 0 0.00 0.00 0.00 h - 0 0.00 0.00 0.00 h -
08/04/12 0 0.00 0.00 0.00 h - 0 0.00 0.00 0.00 h -
08/05/12 0 0.00 0.00 0.00 h - 0 0.00 0.04 0.00 h -
08/06/12 30 0.40 0.00 0.00 m - 20 0.25 0.00 0.00 h -
08/07/12 30 0.40 0.00 0.00 m - 20 0.25 0.00 0.00 h -
08/08/12 20 0.40 0.00 0.64-0.83 h h 20 0.25 0.20 0.04-0.24 h -
08/09/12 0 0.00 0.00 0.00 h - 0 0.00 0.00 0.00 h -
08/10/12 0 0.00 0.00 0.00 h - 0 0.00 0.00 0.00 h -
08/11/12 0 0.00 0.00 0.00 h - 0 0.00 0.00 0.04-0.24 m -
08/12/12 20 0.25 0.00 0.00 h - 0 0.00 0.00 0.25-0.43 m -
08/13/12 30 0.35 0.00 0.00 m - 20 0.25 0.00 0.00 h -
08/14/12 30 0.35 0.00 0.00 m - 20 0.25 0.00 0.04-0.24 h -
08/15/12 40 0.75 0.00 0.00 m - x 30 0.75 0.00 0.00 m -
08/16/12 50 1.50 0.24 0.64-0.83 h m 30 1.00 0.31 0.04-0.24 m -
08/17/12 50 1.25 0.00 0.04-0.24 m - x 30 1.00 0.04 0.00 m - x
08/18/12 40 1.25 0.00 0.00 m - x 40 1.00 0.00 0.00 m - x
08/19/12 40 1.25 0.00 0.00 m - x 30 1.00 0.00 0.00 m - x
08/20/12 30 1.00 0.00 0.00 m - x 30 1.00 0.00 0.00 m - x
08/21/12 40 1.00 0.16 0.44-0.63 m - x 40 1.25 0.63 0.64-0.83 h h
08/22/12 50 1.75 0.94 0.44-0.63 h h 50 1.50 1.38 0.25-0.43 h h
08/23/12 30 1.00 0.00 0.04-0.24 m - x 30 0.75 0.20 0.04-0.24 m -
08/24/12 50 0.75 0.00 0.00 m - x 40 0.75 0.59 0.00 h h
08/25/12 10 0.25 0.00 0.00 h - 0 0.00 0.00 0.00 h -
08/26/12 10 0.25 0.00 0.00 h - 10 0.15 0.00 0.00 h -
08/27/12 10 0.35 0.00 0.00 h - 10 0.15 0.00 0.00 h -
08/28/12 10 0.35 0.00 0.00 h - 0 0.00 0.00 0.00 h -
08/29/12 10 0.15 0.00 0.00 h - 0 0.00 0.00 0.00 h -
08/30/12 10 0.15 0.00 0.00 h - 0 0.00 0.00 0.00 h -
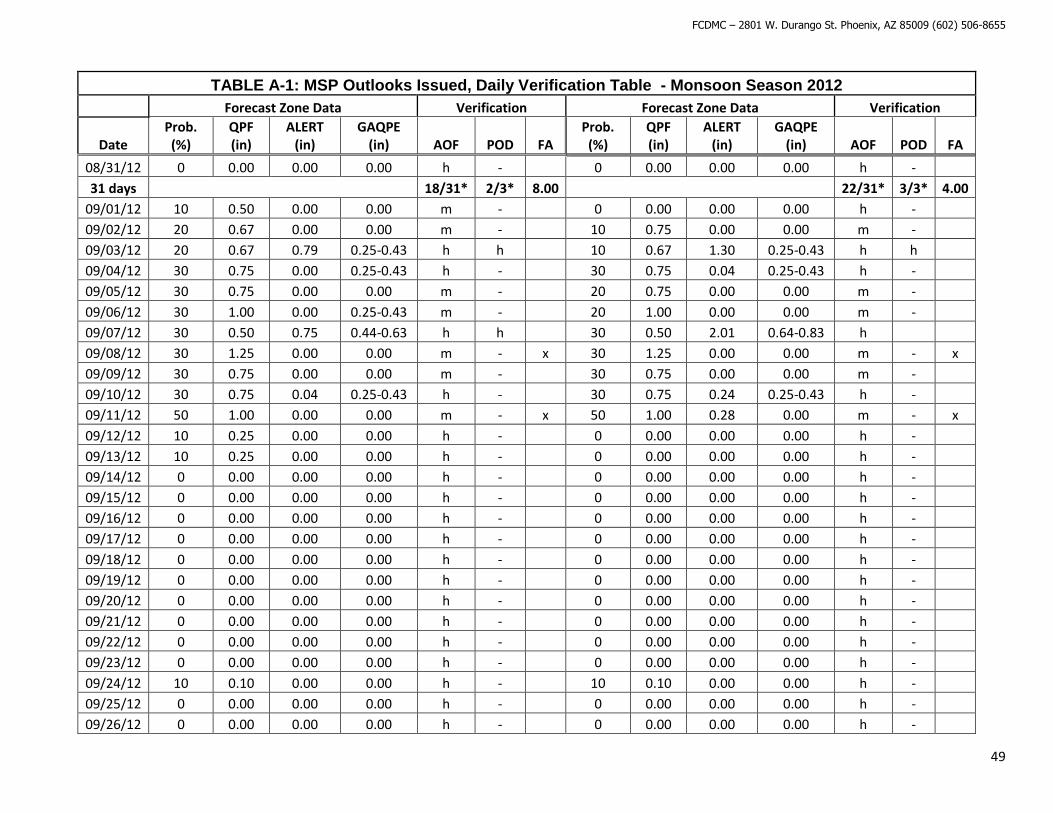
FCDMC – 2801 W. Durango St. Phoenix, AZ 85009 (602) 506-8655
49
TABLE A-1: MSP Outlooks Issued, Daily Verification Table - Monsoon Season 2012
Forecast Zone Data Verification Forecast Zone Data Verification
Date Prob. (%)
QPF (in)
ALERT (in)
GAQPE (in) AOF POD FA
Prob. (%)
QPF (in)
ALERT (in)
GAQPE (in) AOF POD FA
08/31/12 0 0.00 0.00 0.00 h - 0 0.00 0.00 0.00 h -
31 days 18/31* 2/3* 8.00 22/31* 3/3* 4.00
09/01/12 10 0.50 0.00 0.00 m - 0 0.00 0.00 0.00 h -
09/02/12 20 0.67 0.00 0.00 m - 10 0.75 0.00 0.00 m -
09/03/12 20 0.67 0.79 0.25-0.43 h h 10 0.67 1.30 0.25-0.43 h h
09/04/12 30 0.75 0.00 0.25-0.43 h - 30 0.75 0.04 0.25-0.43 h -
09/05/12 30 0.75 0.00 0.00 m - 20 0.75 0.00 0.00 m -
09/06/12 30 1.00 0.00 0.25-0.43 m - 20 1.00 0.00 0.00 m -
09/07/12 30 0.50 0.75 0.44-0.63 h h 30 0.50 2.01 0.64-0.83 h
09/08/12 30 1.25 0.00 0.00 m - x 30 1.25 0.00 0.00 m - x
09/09/12 30 0.75 0.00 0.00 m - 30 0.75 0.00 0.00 m -
09/10/12 30 0.75 0.04 0.25-0.43 h - 30 0.75 0.24 0.25-0.43 h -
09/11/12 50 1.00 0.00 0.00 m - x 50 1.00 0.28 0.00 m - x
09/12/12 10 0.25 0.00 0.00 h - 0 0.00 0.00 0.00 h -
09/13/12 10 0.25 0.00 0.00 h - 0 0.00 0.00 0.00 h -
09/14/12 0 0.00 0.00 0.00 h - 0 0.00 0.00 0.00 h -
09/15/12 0 0.00 0.00 0.00 h - 0 0.00 0.00 0.00 h -
09/16/12 0 0.00 0.00 0.00 h - 0 0.00 0.00 0.00 h -
09/17/12 0 0.00 0.00 0.00 h - 0 0.00 0.00 0.00 h -
09/18/12 0 0.00 0.00 0.00 h - 0 0.00 0.00 0.00 h -
09/19/12 0 0.00 0.00 0.00 h - 0 0.00 0.00 0.00 h -
09/20/12 0 0.00 0.00 0.00 h - 0 0.00 0.00 0.00 h -
09/21/12 0 0.00 0.00 0.00 h - 0 0.00 0.00 0.00 h -
09/22/12 0 0.00 0.00 0.00 h - 0 0.00 0.00 0.00 h -
09/23/12 0 0.00 0.00 0.00 h - 0 0.00 0.00 0.00 h -
09/24/12 10 0.10 0.00 0.00 h - 10 0.10 0.00 0.00 h -
09/25/12 0 0.00 0.00 0.00 h - 0 0.00 0.00 0.00 h -
09/26/12 0 0.00 0.00 0.00 h - 0 0.00 0.00 0.00 h -
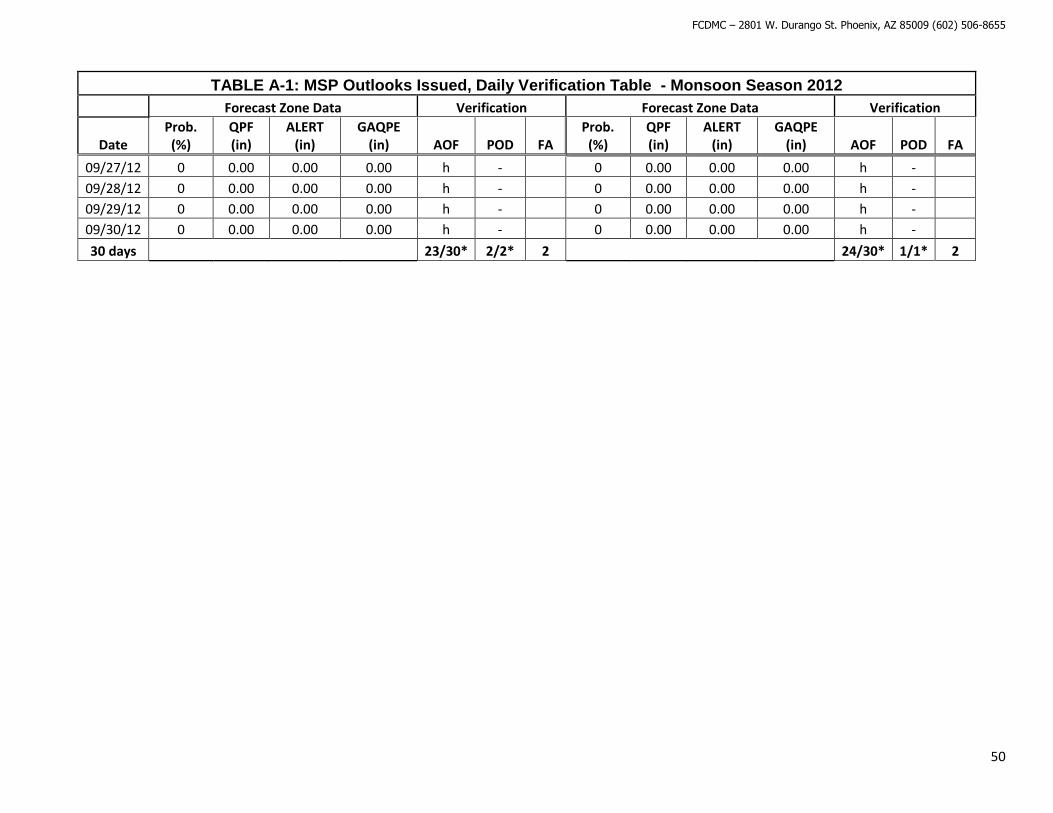
FCDMC – 2801 W. Durango St. Phoenix, AZ 85009 (602) 506-8655
50
TABLE A-1: MSP Outlooks Issued, Daily Verification Table - Monsoon Season 2012
Forecast Zone Data Verification Forecast Zone Data Verification
Date Prob. (%)
QPF (in)
ALERT (in)
GAQPE (in) AOF POD FA
Prob. (%)
QPF (in)
ALERT (in)
GAQPE (in) AOF POD FA
09/27/12 0 0.00 0.00 0.00 h - 0 0.00 0.00 0.00 h -
09/28/12 0 0.00 0.00 0.00 h - 0 0.00 0.00 0.00 h -
09/29/12 0 0.00 0.00 0.00 h - 0 0.00 0.00 0.00 h -
09/30/12 0 0.00 0.00 0.00 h - 0 0.00 0.00 0.00 h -
30 days 23/30* 2/2* 2 24/30* 1/1* 2
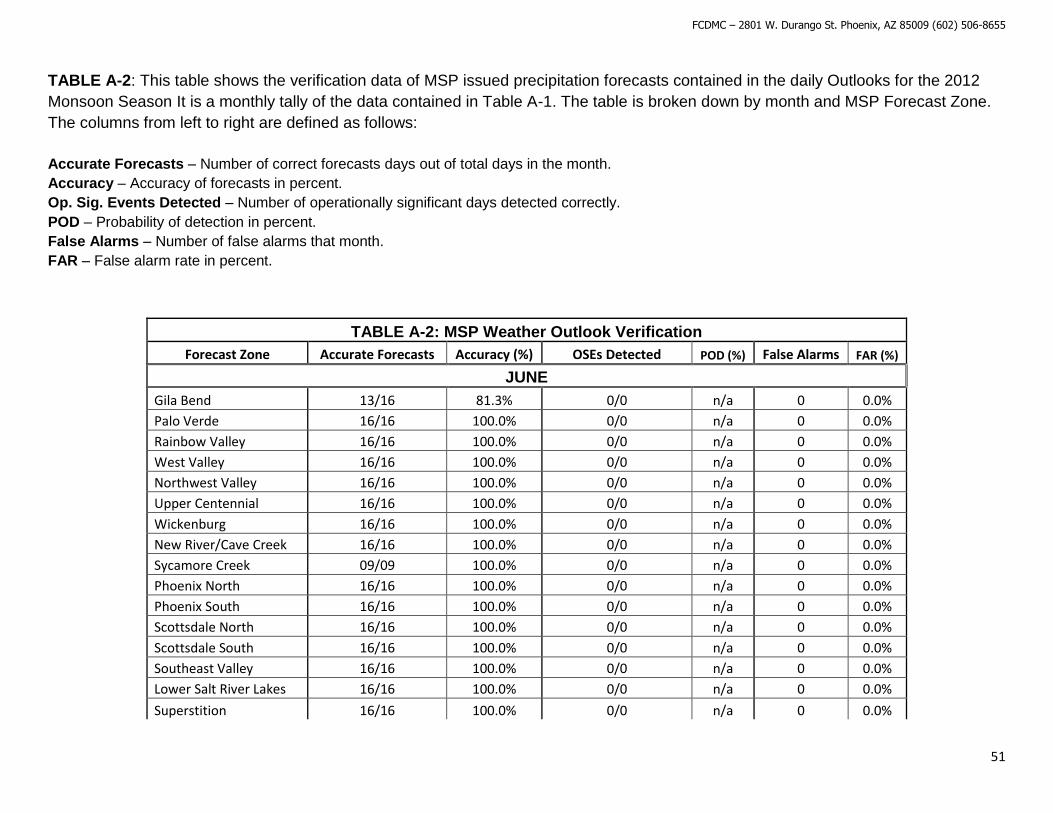
FCDMC – 2801 W. Durango St. Phoenix, AZ 85009 (602) 506-8655
51
TABLE A-2: This table shows the verification data of MSP issued precipitation forecasts contained in the daily Outlooks for the 2012
Monsoon Season It is a monthly tally of the data contained in Table A-1. The table is broken down by month and MSP Forecast Zone.
The columns from left to right are defined as follows:
Accurate Forecasts – Number of correct forecasts days out of total days in the month.
Accuracy – Accuracy of forecasts in percent.
Op. Sig. Events Detected – Number of operationally significant days detected correctly.
POD – Probability of detection in percent.
False Alarms – Number of false alarms that month.
FAR – False alarm rate in percent.
TABLE A-2: MSP Weather Outlook Verification
Forecast Zone Accurate Forecasts Accuracy (%) OSEs Detected POD (%) False Alarms FAR (%)
JUNE
Gila Bend 13/16 81.3% 0/0 n/a 0 0.0%
Palo Verde 16/16 100.0% 0/0 n/a 0 0.0%
Rainbow Valley 16/16 100.0% 0/0 n/a 0 0.0%
West Valley 16/16 100.0% 0/0 n/a 0 0.0%
Northwest Valley 16/16 100.0% 0/0 n/a 0 0.0%
Upper Centennial 16/16 100.0% 0/0 n/a 0 0.0%
Wickenburg 16/16 100.0% 0/0 n/a 0 0.0%
New River/Cave Creek 16/16 100.0% 0/0 n/a 0 0.0%
Sycamore Creek 09/09 100.0% 0/0 n/a 0 0.0%
Phoenix North 16/16 100.0% 0/0 n/a 0 0.0%
Phoenix South 16/16 100.0% 0/0 n/a 0 0.0%
Scottsdale North 16/16 100.0% 0/0 n/a 0 0.0%
Scottsdale South 16/16 100.0% 0/0 n/a 0 0.0%
Southeast Valley 16/16 100.0% 0/0 n/a 0 0.0%
Lower Salt River Lakes 16/16 100.0% 0/0 n/a 0 0.0%
Superstition 16/16 100.0% 0/0 n/a 0 0.0%
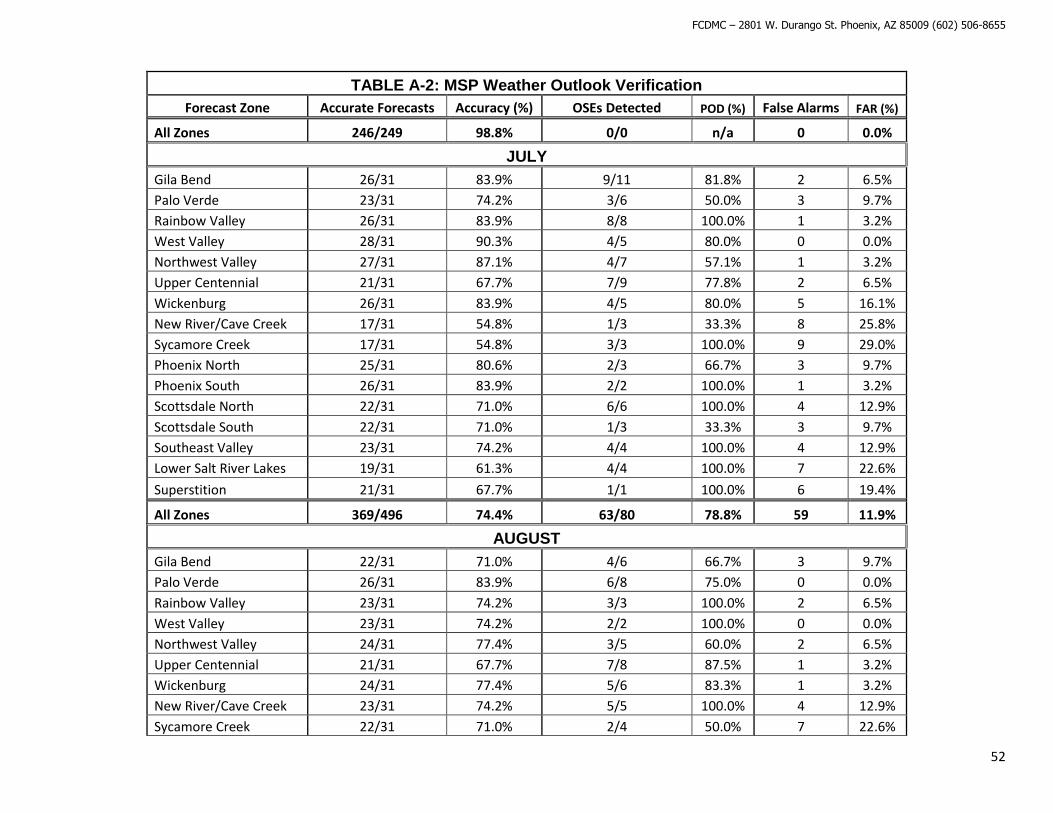
FCDMC – 2801 W. Durango St. Phoenix, AZ 85009 (602) 506-8655
52
TABLE A-2: MSP Weather Outlook Verification
Forecast Zone Accurate Forecasts Accuracy (%) OSEs Detected POD (%) False Alarms FAR (%)
All Zones 246/249 98.8% 0/0 n/a 0 0.0%
JULY
Gila Bend 26/31 83.9% 9/11 81.8% 2 6.5%
Palo Verde 23/31 74.2% 3/6 50.0% 3 9.7%
Rainbow Valley 26/31 83.9% 8/8 100.0% 1 3.2%
West Valley 28/31 90.3% 4/5 80.0% 0 0.0%
Northwest Valley 27/31 87.1% 4/7 57.1% 1 3.2%
Upper Centennial 21/31 67.7% 7/9 77.8% 2 6.5%
Wickenburg 26/31 83.9% 4/5 80.0% 5 16.1%
New River/Cave Creek 17/31 54.8% 1/3 33.3% 8 25.8%
Sycamore Creek 17/31 54.8% 3/3 100.0% 9 29.0%
Phoenix North 25/31 80.6% 2/3 66.7% 3 9.7%
Phoenix South 26/31 83.9% 2/2 100.0% 1 3.2%
Scottsdale North 22/31 71.0% 6/6 100.0% 4 12.9%
Scottsdale South 22/31 71.0% 1/3 33.3% 3 9.7%
Southeast Valley 23/31 74.2% 4/4 100.0% 4 12.9%
Lower Salt River Lakes 19/31 61.3% 4/4 100.0% 7 22.6%
Superstition 21/31 67.7% 1/1 100.0% 6 19.4%
All Zones 369/496 74.4% 63/80 78.8% 59 11.9%
AUGUST
Gila Bend 22/31 71.0% 4/6 66.7% 3 9.7%
Palo Verde 26/31 83.9% 6/8 75.0% 0 0.0%
Rainbow Valley 23/31 74.2% 3/3 100.0% 2 6.5%
West Valley 23/31 74.2% 2/2 100.0% 0 0.0%
Northwest Valley 24/31 77.4% 3/5 60.0% 2 6.5%
Upper Centennial 21/31 67.7% 7/8 87.5% 1 3.2%
Wickenburg 24/31 77.4% 5/6 83.3% 1 3.2%
New River/Cave Creek 23/31 74.2% 5/5 100.0% 4 12.9%
Sycamore Creek 22/31 71.0% 2/4 50.0% 7 22.6%
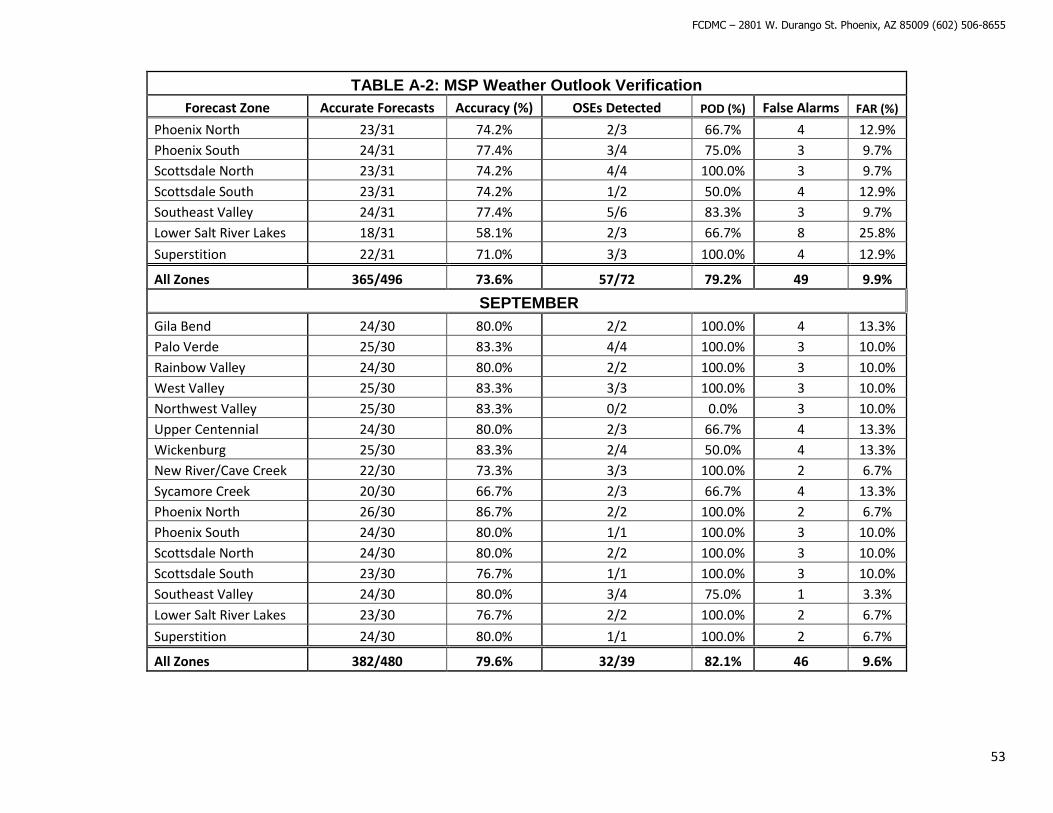
FCDMC – 2801 W. Durango St. Phoenix, AZ 85009 (602) 506-8655
53
TABLE A-2: MSP Weather Outlook Verification
Forecast Zone Accurate Forecasts Accuracy (%) OSEs Detected POD (%) False Alarms FAR (%)
Phoenix North 23/31 74.2% 2/3 66.7% 4 12.9%
Phoenix South 24/31 77.4% 3/4 75.0% 3 9.7%
Scottsdale North 23/31 74.2% 4/4 100.0% 3 9.7%
Scottsdale South 23/31 74.2% 1/2 50.0% 4 12.9%
Southeast Valley 24/31 77.4% 5/6 83.3% 3 9.7%
Lower Salt River Lakes 18/31 58.1% 2/3 66.7% 8 25.8%
Superstition 22/31 71.0% 3/3 100.0% 4 12.9%
All Zones 365/496 73.6% 57/72 79.2% 49 9.9%
SEPTEMBER
Gila Bend 24/30 80.0% 2/2 100.0% 4 13.3%
Palo Verde 25/30 83.3% 4/4 100.0% 3 10.0%
Rainbow Valley 24/30 80.0% 2/2 100.0% 3 10.0%
West Valley 25/30 83.3% 3/3 100.0% 3 10.0%
Northwest Valley 25/30 83.3% 0/2 0.0% 3 10.0%
Upper Centennial 24/30 80.0% 2/3 66.7% 4 13.3%
Wickenburg 25/30 83.3% 2/4 50.0% 4 13.3%
New River/Cave Creek 22/30 73.3% 3/3 100.0% 2 6.7%
Sycamore Creek 20/30 66.7% 2/3 66.7% 4 13.3%
Phoenix North 26/30 86.7% 2/2 100.0% 2 6.7%
Phoenix South 24/30 80.0% 1/1 100.0% 3 10.0%
Scottsdale North 24/30 80.0% 2/2 100.0% 3 10.0%
Scottsdale South 23/30 76.7% 1/1 100.0% 3 10.0%
Southeast Valley 24/30 80.0% 3/4 75.0% 1 3.3%
Lower Salt River Lakes 23/30 76.7% 2/2 100.0% 2 6.7%
Superstition 24/30 80.0% 1/1 100.0% 2 6.7%
All Zones 382/480 79.6% 32/39 82.1% 46 9.6%
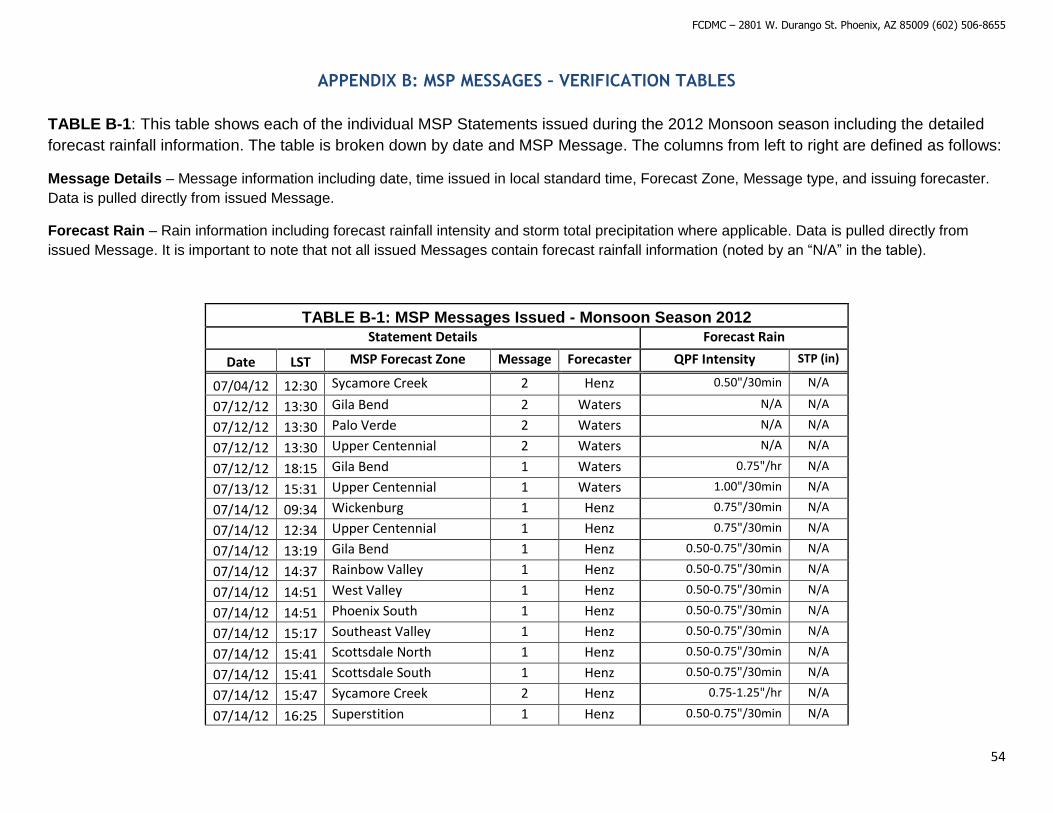
FCDMC – 2801 W. Durango St. Phoenix, AZ 85009 (602) 506-8655
54
APPENDIX B: MSP MESSAGES – VERIFICATION TABLES
TABLE B-1: This table shows each of the individual MSP Statements issued during the 2012 Monsoon season including the detailed
forecast rainfall information. The table is broken down by date and MSP Message. The columns from left to right are defined as follows:
Message Details – Message information including date, time issued in local standard time, Forecast Zone, Message type, and issuing forecaster.
Data is pulled directly from issued Message.
Forecast Rain – Rain information including forecast rainfall intensity and storm total precipitation where applicable. Data is pulled directly from
issued Message. It is important to note that not all issued Messages contain forecast rainfall information (noted by an “N/A” in the table).
TABLE B-1: MSP Messages Issued - Monsoon Season 2012 Statement Details Forecast Rain
Date LST MSP Forecast Zone Message Forecaster QPF Intensity STP (in)
07/04/12 12:30 Sycamore Creek 2 Henz 0.50"/30min N/A
07/12/12 13:30 Gila Bend 2 Waters N/A N/A
07/12/12 13:30 Palo Verde 2 Waters N/A N/A
07/12/12 13:30 Upper Centennial 2 Waters N/A N/A
07/12/12 18:15 Gila Bend 1 Waters 0.75"/hr N/A
07/13/12 15:31 Upper Centennial 1 Waters 1.00"/30min N/A
07/14/12 09:34 Wickenburg 1 Henz 0.75"/30min N/A
07/14/12 12:34 Upper Centennial 1 Henz 0.75"/30min N/A
07/14/12 13:19 Gila Bend 1 Henz 0.50-0.75"/30min N/A
07/14/12 14:37 Rainbow Valley 1 Henz 0.50-0.75"/30min N/A
07/14/12 14:51 West Valley 1 Henz 0.50-0.75"/30min N/A
07/14/12 14:51 Phoenix South 1 Henz 0.50-0.75"/30min N/A
07/14/12 15:17 Southeast Valley 1 Henz 0.50-0.75"/30min N/A
07/14/12 15:41 Scottsdale North 1 Henz 0.50-0.75"/30min N/A
07/14/12 15:41 Scottsdale South 1 Henz 0.50-0.75"/30min N/A
07/14/12 15:47 Sycamore Creek 2 Henz 0.75-1.25"/hr N/A
07/14/12 16:25 Superstition 1 Henz 0.50-0.75"/30min N/A
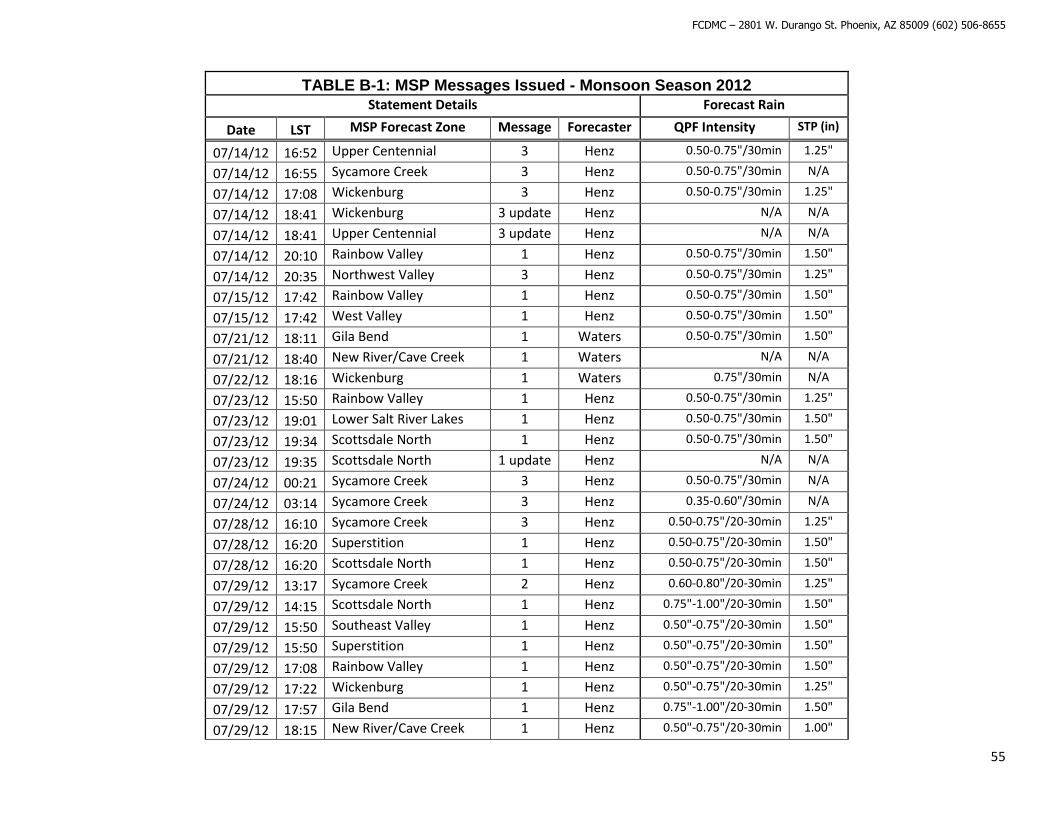
FCDMC – 2801 W. Durango St. Phoenix, AZ 85009 (602) 506-8655
55
TABLE B-1: MSP Messages Issued - Monsoon Season 2012 Statement Details Forecast Rain
Date LST MSP Forecast Zone Message Forecaster QPF Intensity STP (in)
07/14/12 16:52 Upper Centennial 3 Henz 0.50-0.75"/30min 1.25"
07/14/12 16:55 Sycamore Creek 3 Henz 0.50-0.75"/30min N/A
07/14/12 17:08 Wickenburg 3 Henz 0.50-0.75"/30min 1.25"
07/14/12 18:41 Wickenburg 3 update Henz N/A N/A
07/14/12 18:41 Upper Centennial 3 update Henz N/A N/A
07/14/12 20:10 Rainbow Valley 1 Henz 0.50-0.75"/30min 1.50"
07/14/12 20:35 Northwest Valley 3 Henz 0.50-0.75"/30min 1.25"
07/15/12 17:42 Rainbow Valley 1 Henz 0.50-0.75"/30min 1.50"
07/15/12 17:42 West Valley 1 Henz 0.50-0.75"/30min 1.50"
07/21/12 18:11 Gila Bend 1 Waters 0.50-0.75"/30min 1.50"
07/21/12 18:40 New River/Cave Creek 1 Waters N/A N/A
07/22/12 18:16 Wickenburg 1 Waters 0.75"/30min N/A
07/23/12 15:50 Rainbow Valley 1 Henz 0.50-0.75"/30min 1.25"
07/23/12 19:01 Lower Salt River Lakes 1 Henz 0.50-0.75"/30min 1.50"
07/23/12 19:34 Scottsdale North 1 Henz 0.50-0.75"/30min 1.50"
07/23/12 19:35 Scottsdale North 1 update Henz N/A N/A
07/24/12 00:21 Sycamore Creek 3 Henz 0.50-0.75"/30min N/A
07/24/12 03:14 Sycamore Creek 3 Henz 0.35-0.60"/30min N/A
07/28/12 16:10 Sycamore Creek 3 Henz 0.50-0.75"/20-30min 1.25"
07/28/12 16:20 Superstition 1 Henz 0.50-0.75"/20-30min 1.50"
07/28/12 16:20 Scottsdale North 1 Henz 0.50-0.75"/20-30min 1.50"
07/29/12 13:17 Sycamore Creek 2 Henz 0.60-0.80"/20-30min 1.25"
07/29/12 14:15 Scottsdale North 1 Henz 0.75"-1.00"/20-30min 1.50"
07/29/12 15:50 Southeast Valley 1 Henz 0.50"-0.75"/20-30min 1.50"
07/29/12 15:50 Superstition 1 Henz 0.50"-0.75"/20-30min 1.50"
07/29/12 17:08 Rainbow Valley 1 Henz 0.50"-0.75"/20-30min 1.50"
07/29/12 17:22 Wickenburg 1 Henz 0.50"-0.75"/20-30min 1.25"
07/29/12 17:57 Gila Bend 1 Henz 0.75"-1.00"/20-30min 1.50"
07/29/12 18:15 New River/Cave Creek 1 Henz 0.50"-0.75"/20-30min 1.00"
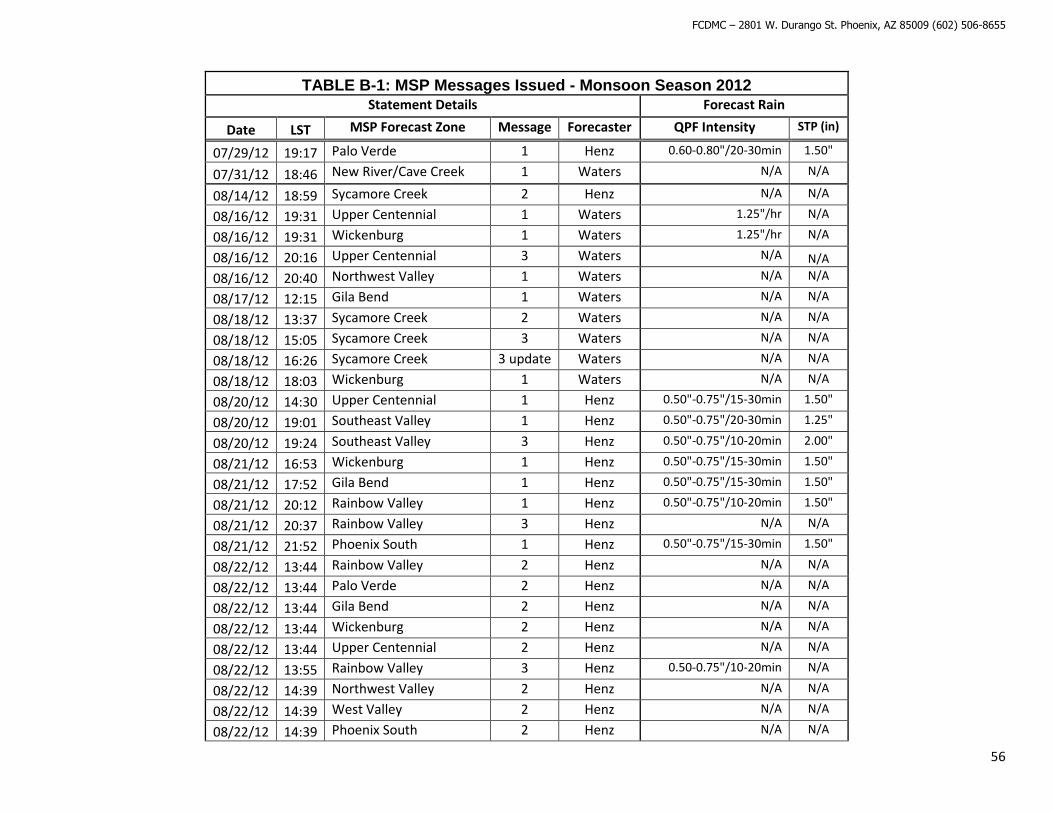
FCDMC – 2801 W. Durango St. Phoenix, AZ 85009 (602) 506-8655
56
TABLE B-1: MSP Messages Issued - Monsoon Season 2012 Statement Details Forecast Rain
Date LST MSP Forecast Zone Message Forecaster QPF Intensity STP (in)
07/29/12 19:17 Palo Verde 1 Henz 0.60-0.80"/20-30min 1.50"
07/31/12 18:46 New River/Cave Creek 1 Waters N/A N/A
08/14/12 18:59 Sycamore Creek 2 Henz N/A N/A
08/16/12 19:31 Upper Centennial 1 Waters 1.25"/hr N/A
08/16/12 19:31 Wickenburg 1 Waters 1.25"/hr N/A
08/16/12 20:16 Upper Centennial 3 Waters N/A N/A
08/16/12 20:40 Northwest Valley 1 Waters N/A N/A
08/17/12 12:15 Gila Bend 1 Waters N/A N/A
08/18/12 13:37 Sycamore Creek 2 Waters N/A N/A
08/18/12 15:05 Sycamore Creek 3 Waters N/A N/A
08/18/12 16:26 Sycamore Creek 3 update Waters N/A N/A
08/18/12 18:03 Wickenburg 1 Waters N/A N/A
08/20/12 14:30 Upper Centennial 1 Henz 0.50"-0.75"/15-30min 1.50"
08/20/12 19:01 Southeast Valley 1 Henz 0.50"-0.75"/20-30min 1.25"
08/20/12 19:24 Southeast Valley 3 Henz 0.50"-0.75"/10-20min 2.00"
08/21/12 16:53 Wickenburg 1 Henz 0.50"-0.75"/15-30min 1.50"
08/21/12 17:52 Gila Bend 1 Henz 0.50"-0.75"/15-30min 1.50"
08/21/12 20:12 Rainbow Valley 1 Henz 0.50"-0.75"/10-20min 1.50"
08/21/12 20:37 Rainbow Valley 3 Henz N/A N/A
08/21/12 21:52 Phoenix South 1 Henz 0.50"-0.75"/15-30min 1.50"
08/22/12 13:44 Rainbow Valley 2 Henz N/A N/A
08/22/12 13:44 Palo Verde 2 Henz N/A N/A
08/22/12 13:44 Gila Bend 2 Henz N/A N/A
08/22/12 13:44 Wickenburg 2 Henz N/A N/A
08/22/12 13:44 Upper Centennial 2 Henz N/A N/A
08/22/12 13:55 Rainbow Valley 3 Henz 0.50-0.75"/10-20min N/A
08/22/12 14:39 Northwest Valley 2 Henz N/A N/A
08/22/12 14:39 West Valley 2 Henz N/A N/A
08/22/12 14:39 Phoenix South 2 Henz N/A N/A
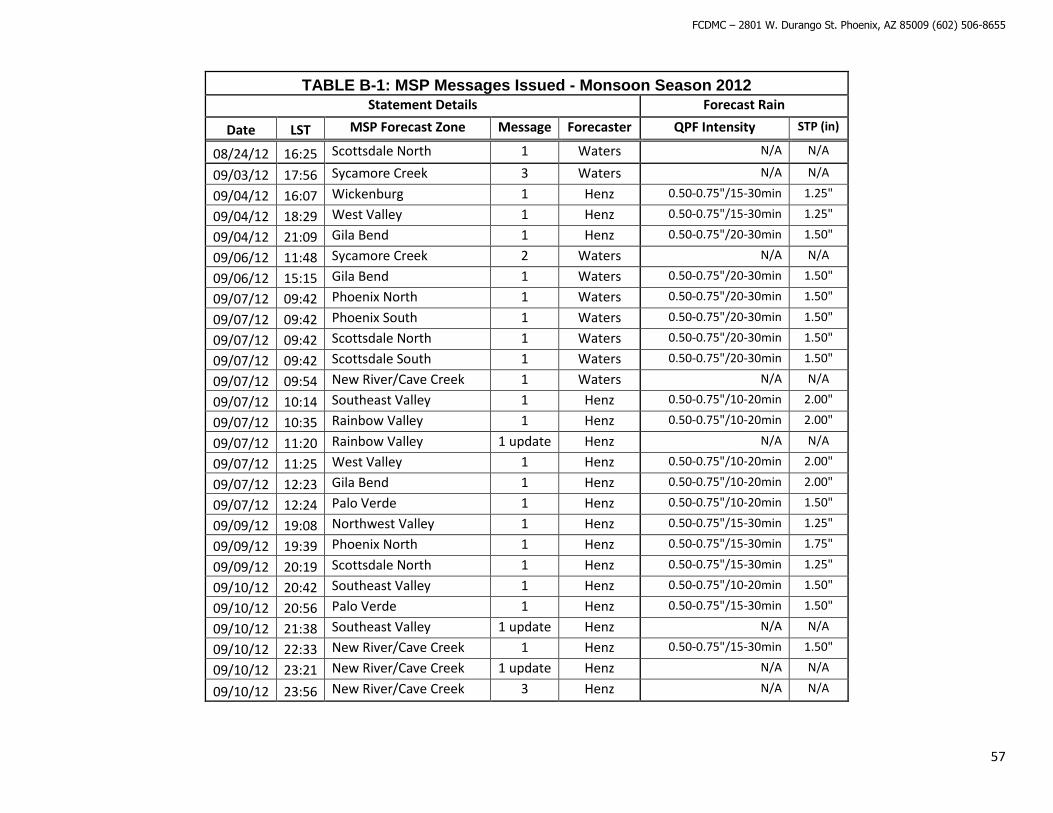
FCDMC – 2801 W. Durango St. Phoenix, AZ 85009 (602) 506-8655
57
TABLE B-1: MSP Messages Issued - Monsoon Season 2012 Statement Details Forecast Rain
Date LST MSP Forecast Zone Message Forecaster QPF Intensity STP (in)
08/24/12 16:25 Scottsdale North 1 Waters N/A N/A
09/03/12 17:56 Sycamore Creek 3 Waters N/A N/A
09/04/12 16:07 Wickenburg 1 Henz 0.50-0.75"/15-30min 1.25"
09/04/12 18:29 West Valley 1 Henz 0.50-0.75"/15-30min 1.25"
09/04/12 21:09 Gila Bend 1 Henz 0.50-0.75"/20-30min 1.50"
09/06/12 11:48 Sycamore Creek 2 Waters N/A N/A
09/06/12 15:15 Gila Bend 1 Waters 0.50-0.75"/20-30min 1.50"
09/07/12 09:42 Phoenix North 1 Waters 0.50-0.75"/20-30min 1.50"
09/07/12 09:42 Phoenix South 1 Waters 0.50-0.75"/20-30min 1.50"
09/07/12 09:42 Scottsdale North 1 Waters 0.50-0.75"/20-30min 1.50"
09/07/12 09:42 Scottsdale South 1 Waters 0.50-0.75"/20-30min 1.50"
09/07/12 09:54 New River/Cave Creek 1 Waters N/A N/A
09/07/12 10:14 Southeast Valley 1 Henz 0.50-0.75"/10-20min 2.00"
09/07/12 10:35 Rainbow Valley 1 Henz 0.50-0.75"/10-20min 2.00"
09/07/12 11:20 Rainbow Valley 1 update Henz N/A N/A
09/07/12 11:25 West Valley 1 Henz 0.50-0.75"/10-20min 2.00"
09/07/12 12:23 Gila Bend 1 Henz 0.50-0.75"/10-20min 2.00"
09/07/12 12:24 Palo Verde 1 Henz 0.50-0.75"/10-20min 1.50"
09/09/12 19:08 Northwest Valley 1 Henz 0.50-0.75"/15-30min 1.25"
09/09/12 19:39 Phoenix North 1 Henz 0.50-0.75"/15-30min 1.75"
09/09/12 20:19 Scottsdale North 1 Henz 0.50-0.75"/15-30min 1.25"
09/10/12 20:42 Southeast Valley 1 Henz 0.50-0.75"/10-20min 1.50"
09/10/12 20:56 Palo Verde 1 Henz 0.50-0.75"/15-30min 1.50"
09/10/12 21:38 Southeast Valley 1 update Henz N/A N/A
09/10/12 22:33 New River/Cave Creek 1 Henz 0.50-0.75"/15-30min 1.50"
09/10/12 23:21 New River/Cave Creek 1 update Henz N/A N/A
09/10/12 23:56 New River/Cave Creek 3 Henz N/A N/A

FCDMC – 2801 W. Durango St. Phoenix, AZ 85009 (602) 506-8655
58
TABLE B-2: This table shows the raw verification data of MSP issued Messages for the 2012 Monsoon Season. The valid period for
rainfall for each Message can be found in Table B-1. The table is broken down by date and MSP Message. The columns from left to
right are defined as follows:
Message Details – Statement information including date and Forecast Zone.
Forecast Rain – Rain information including forecast rainfall intensity and forecast storm total precipitation where applicable. It is important to note
that not all issued statements contain forecast rainfall information (noted by an “n/a” in the table).
Rain Observations – Observed rainfall amounts within the forecast zone including ALERT rain gages, gage adjusted radar rainfall totals, and local
storm reports submitted to NWS Phoenix WFO.
Alarms – Triggered alarms on ALERT gage sensors. These alarms are broken down by alarm type including rain, stream, and dam.
Verification – The verification was broken down by rain and by alarm. Hits and misses were assigned based on thresholds previously discussed in
the MSP Verification Metrics and Criteria section of this report.
TABLE B-2: MSP Messages Issued - Monsoon Season 2012
Message Details Forecast Rain Rain Observations (in) Alarms Verification
Date MSP Forecast Zone QPF Intensity (in/Xmin) STP (in) ALERT GAQPE LSRs Rain Stream Dam Rain Alarm
07/04/12 Sycamore Creek 0.50"/30min N/A 0.04"-0.08" 0.00" None Miss Miss
07/12/12 Gila Bend N/A N/A 0.00" 0.25"-0.43" None Miss Miss
07/12/12 Palo Verde N/A N/A 0.04" 1.62"-1.82" None Hit Miss
07/12/12 Upper Centennial N/A N/A 0.16"-0.55" 1.23"-1.61" None Miss Miss
07/12/12 Gila Bend 0.75"/hr N/A 0.08" 0.84"-1.02" None Hit Miss
07/13/12 Upper Centennial 1.00"/30min N/A 0.59"-0.94" 1.23"-1.61" None X X Hit Hit
07/14/12 Wickenburg 0.75"/30min N/A 0.59"-0.83" 2.81"-3.19" None X X X Hit Hit
07/14/12 Upper Centennial 0.75"/30min N/A 0.43"-1.93" 3.19"+ None X X Hit Hit
07/14/12 Gila Bend 0.50-0.75"/30min N/A 0.16"-0.87" 1.82"-2.01" None X Hit Hit
07/14/12 Rainbow Valley 0.50-0.75"/30min N/A 0.24"-0.35" 0.64"-0.83" None X Hit Hit
07/14/12 West Valley 0.50-0.75"/30min N/A 0.47" 0.04"-0.24" None Miss Miss
07/14/12 Phoenix South 0.50-0.75"/30min N/A 0.24"-0.43" 0.44"-0.63" None Hit Miss
07/14/12 Southeast Valley 0.50-0.75"/30min N/A 1.42"-2.87" 1.23"-1.61" 2.25" X Hit Hit

FCDMC – 2801 W. Durango St. Phoenix, AZ 85009 (602) 506-8655
59
TABLE B-2: MSP Messages Issued - Monsoon Season 2012 Message Details Forecast Rain Rain Observations (in) Alarms Verification
Date MSP Forecast Zone QPF Intensity (in/Xmin) STP (in) ALERT GAQPE LSRs Rain Stream Dam Rain Alarm
07/14/12 Scottsdale North 0.50-0.75"/30min N/A 0.16"-0.83" 0.44"-0.63" None Hit Miss
07/14/12 Scottsdale South 0.50-0.75"/30min N/A 0.43"-0.79" 0.44"-0.63" None X X Hit Hit
07/14/12 Sycamore Creek 0.75-1.25"/hr N/A 0.24"-0.51" 0.44"-0.63" None X Miss Hit
07/14/12 Superstition 0.50-0.75"/30min N/A 0.83"-1.30" 0.44"-0.63" None X Hit Hit
07/14/12 Upper Centennial 0.50-0.75"/30min 1.25" 1.65"-2.76" 3.19"+ None X Hit Hit
07/14/12 Sycamore Creek 0.50-0.75"/30min N/A 0.24"-0.51" 0.44"-0.63" None X Hit Hit
07/14/12 Wickenburg 0.50-0.75"/30min 1.25" 1.73"-1.93" 2.61"-2.80" None X X X Hit Hit
07/14/12 Wickenburg N/A N/A N/A 2.61"-2.80" None X X X Hit Hit
07/14/12 Upper Centennial N/A N/A N/A 3.19"+ None X X Hit Hit
07/14/12 Rainbow Valley 0.50-0.75"/30min 1.50" 0.00" 0.64"-0.83" None X Hit Hit
07/14/12 Northwest Valley 0.50-0.75"/30min 1.25" 0.08"-0.67" 1.62"-1.81" None Hit Miss
07/15/12 Rainbow Valley 0.50-0.75"/30min 1.50" 0.59" 1.23"-1.61" None Hit Hit
07/15/12 West Valley 0.50-0.75"/30min 1.50" 0.59" 1.23"-1.61" None Hit Hit
07/21/12 Gila Bend 0.50-0.75"/30min 1.50" 0.63" 1.62"-1.81" None Hit Miss
07/21/12 New River/Cave Creek N/A N/A 1.34"-1.85" 2.61"-2.80" None X Hit Hit
07/22/12 Wickenburg 0.75"/30min N/A 0.28"-0.47" 1.23"-1.61" None X Hit Hit
07/23/12 Rainbow Valley 0.50-0.75"/30min 1.25" 0.16" 0.64"-0.83" None Hit Miss
07/23/12 Lower Salt River Lakes 0.50-0.75"/30min 1.50" 0.04" 1.03"-1.22" None Hit Miss
07/23/12 Scottsdale North 0.50-0.75"/30min 1.50" 1.10" 1.23"-1.61" None X Hit Hit
07/23/12 Scottsdale North N/A N/A N/A 1.23"-1.61" None Hit Miss
07/24/12 Sycamore Creek 0.50-0.75"/30min N/A 0.31"-0.55" 1.03"-1.22" None X X Hit Hit
07/24/12 Sycamore Creek 0.35-0.60"/30min N/A 0.63"-1.10" 1.03"-1.22" None X X Hit Hit
07/28/12 Sycamore Creek 0.50-0.75"/20-30min 1.25" 0.71"-0.94" 1.03"-1.22" 0.87" X X Hit Hit
07/28/12 Superstition 0.50-0.75"/20-30min 1.50" 0.04"-0.16" 0.64"-0.83" None Hit Miss
07/28/12 Scottsdale North 0.50-0.75"/20-30min 1.50" 0.59"-0.83" 0.44"-0.63" 0.94" X Hit Hit
07/29/12 Sycamore Creek 0.60-0.80"/20-30min 1.25" 0.04"-0.08" 0.00" None Miss Miss
07/29/12 Scottsdale North 0.75"-1.00"/20-30min 1.50" 0.28"-0.35" 0.44"-0.63" None Miss Miss
07/29/12 Southeast Valley 0.50"-0.75"/20-30min 1.50" 1.10"-1.81" 0.64"-0.83" None X Hit Hit
07/29/12 Superstition 0.50"-0.75"/20-30min 1.50" 0.47"-0.87" 0.44"-0.63" None Hit Miss
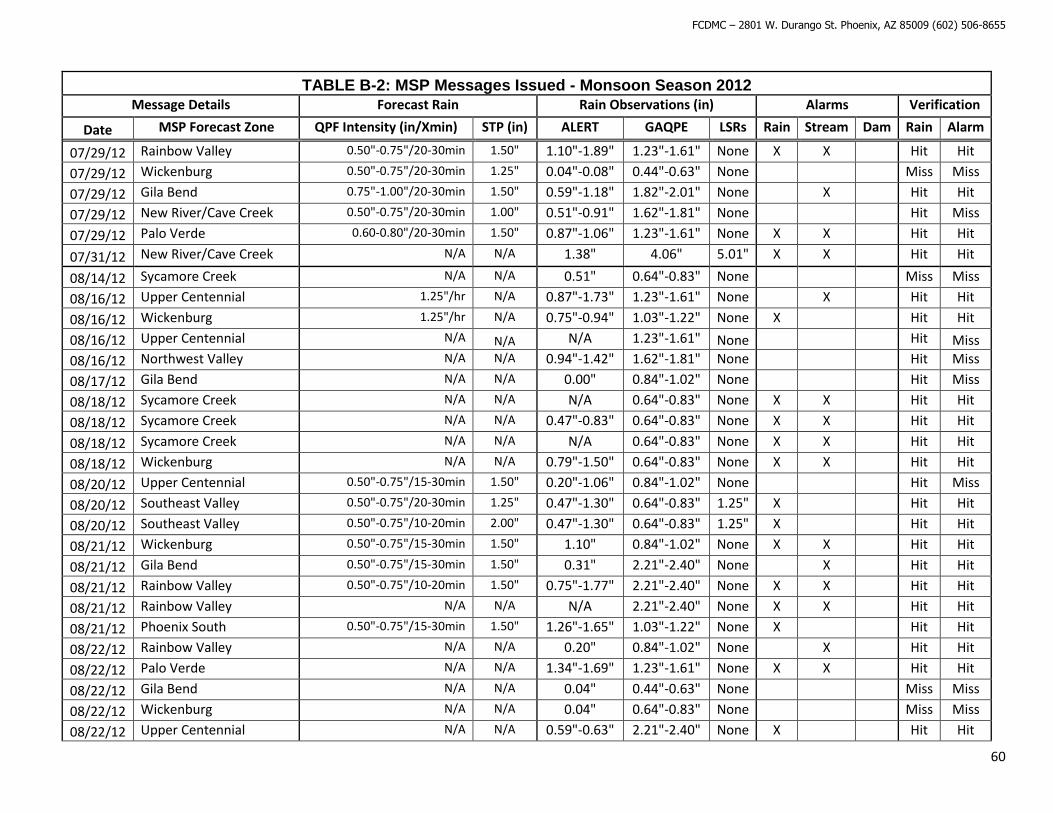
FCDMC – 2801 W. Durango St. Phoenix, AZ 85009 (602) 506-8655
60
TABLE B-2: MSP Messages Issued - Monsoon Season 2012 Message Details Forecast Rain Rain Observations (in) Alarms Verification
Date MSP Forecast Zone QPF Intensity (in/Xmin) STP (in) ALERT GAQPE LSRs Rain Stream Dam Rain Alarm
07/29/12 Rainbow Valley 0.50"-0.75"/20-30min 1.50" 1.10"-1.89" 1.23"-1.61" None X X Hit Hit
07/29/12 Wickenburg 0.50"-0.75"/20-30min 1.25" 0.04"-0.08" 0.44"-0.63" None Miss Miss
07/29/12 Gila Bend 0.75"-1.00"/20-30min 1.50" 0.59"-1.18" 1.82"-2.01" None X Hit Hit
07/29/12 New River/Cave Creek 0.50"-0.75"/20-30min 1.00" 0.51"-0.91" 1.62"-1.81" None Hit Miss
07/29/12 Palo Verde 0.60-0.80"/20-30min 1.50" 0.87"-1.06" 1.23"-1.61" None X X Hit Hit
07/31/12 New River/Cave Creek N/A N/A 1.38" 4.06" 5.01" X X Hit Hit
08/14/12 Sycamore Creek N/A N/A 0.51" 0.64"-0.83" None Miss Miss
08/16/12 Upper Centennial 1.25"/hr N/A 0.87"-1.73" 1.23"-1.61" None X Hit Hit
08/16/12 Wickenburg 1.25"/hr N/A 0.75"-0.94" 1.03"-1.22" None X Hit Hit
08/16/12 Upper Centennial N/A N/A N/A 1.23"-1.61" None Hit Miss
08/16/12 Northwest Valley N/A N/A 0.94"-1.42" 1.62"-1.81" None Hit Miss
08/17/12 Gila Bend N/A N/A 0.00" 0.84"-1.02" None Hit Miss
08/18/12 Sycamore Creek N/A N/A N/A 0.64"-0.83" None X X Hit Hit
08/18/12 Sycamore Creek N/A N/A 0.47"-0.83" 0.64"-0.83" None X X Hit Hit
08/18/12 Sycamore Creek N/A N/A N/A 0.64"-0.83" None X X Hit Hit
08/18/12 Wickenburg N/A N/A 0.79"-1.50" 0.64"-0.83" None X X Hit Hit
08/20/12 Upper Centennial 0.50"-0.75"/15-30min 1.50" 0.20"-1.06" 0.84"-1.02" None Hit Miss
08/20/12 Southeast Valley 0.50"-0.75"/20-30min 1.25" 0.47"-1.30" 0.64"-0.83" 1.25" X Hit Hit
08/20/12 Southeast Valley 0.50"-0.75"/10-20min 2.00" 0.47"-1.30" 0.64"-0.83" 1.25" X Hit Hit
08/21/12 Wickenburg 0.50"-0.75"/15-30min 1.50" 1.10" 0.84"-1.02" None X X Hit Hit
08/21/12 Gila Bend 0.50"-0.75"/15-30min 1.50" 0.31" 2.21"-2.40" None X Hit Hit
08/21/12 Rainbow Valley 0.50"-0.75"/10-20min 1.50" 0.75"-1.77" 2.21"-2.40" None X X Hit Hit
08/21/12 Rainbow Valley N/A N/A N/A 2.21"-2.40" None X X Hit Hit
08/21/12 Phoenix South 0.50"-0.75"/15-30min 1.50" 1.26"-1.65" 1.03"-1.22" None X Hit Hit
08/22/12 Rainbow Valley N/A N/A 0.20" 0.84"-1.02" None X Hit Hit
08/22/12 Palo Verde N/A N/A 1.34"-1.69" 1.23"-1.61" None X X Hit Hit
08/22/12 Gila Bend N/A N/A 0.04" 0.44"-0.63" None Miss Miss
08/22/12 Wickenburg N/A N/A 0.04" 0.64"-0.83" None Miss Miss
08/22/12 Upper Centennial N/A N/A 0.59"-0.63" 2.21"-2.40" None X Hit Hit
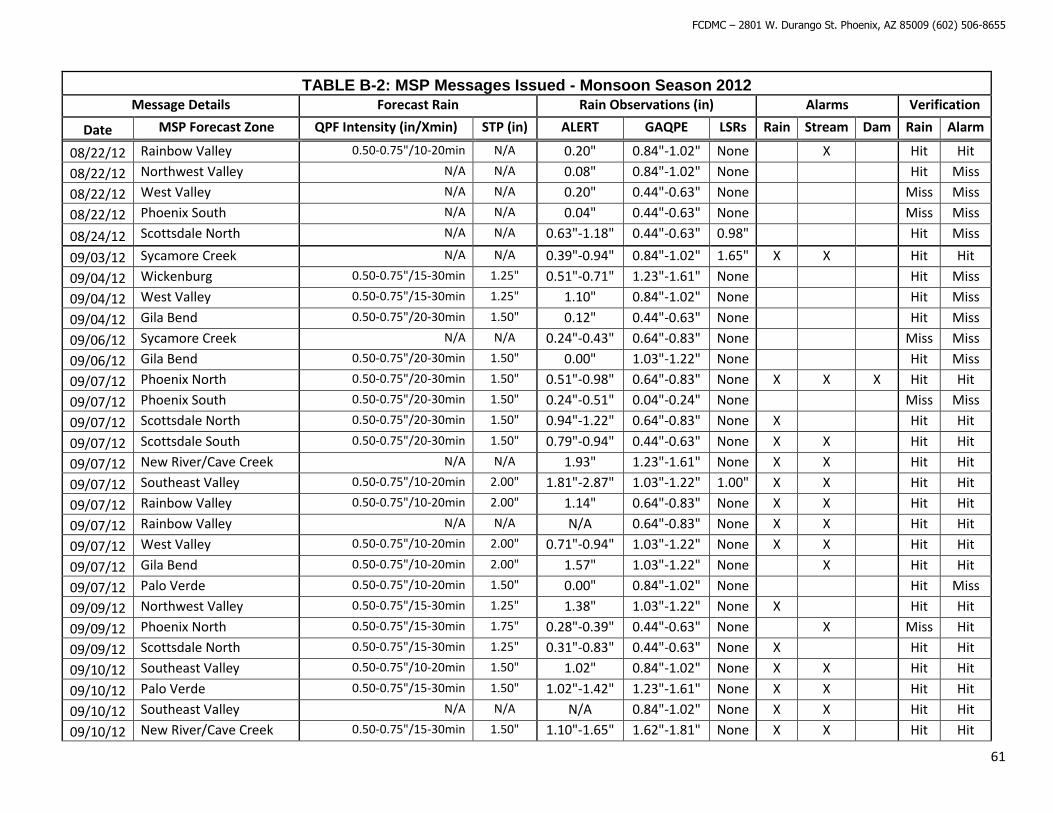
FCDMC – 2801 W. Durango St. Phoenix, AZ 85009 (602) 506-8655
61
TABLE B-2: MSP Messages Issued - Monsoon Season 2012 Message Details Forecast Rain Rain Observations (in) Alarms Verification
Date MSP Forecast Zone QPF Intensity (in/Xmin) STP (in) ALERT GAQPE LSRs Rain Stream Dam Rain Alarm
08/22/12 Rainbow Valley 0.50-0.75"/10-20min N/A 0.20" 0.84"-1.02" None X Hit Hit
08/22/12 Northwest Valley N/A N/A 0.08" 0.84"-1.02" None Hit Miss
08/22/12 West Valley N/A N/A 0.20" 0.44"-0.63" None Miss Miss
08/22/12 Phoenix South N/A N/A 0.04" 0.44"-0.63" None Miss Miss
08/24/12 Scottsdale North N/A N/A 0.63"-1.18" 0.44"-0.63" 0.98" Hit Miss
09/03/12 Sycamore Creek N/A N/A 0.39"-0.94" 0.84"-1.02" 1.65" X X Hit Hit
09/04/12 Wickenburg 0.50-0.75"/15-30min 1.25" 0.51"-0.71" 1.23"-1.61" None Hit Miss
09/04/12 West Valley 0.50-0.75"/15-30min 1.25" 1.10" 0.84"-1.02" None Hit Miss
09/04/12 Gila Bend 0.50-0.75"/20-30min 1.50" 0.12" 0.44"-0.63" None Hit Miss
09/06/12 Sycamore Creek N/A N/A 0.24"-0.43" 0.64"-0.83" None Miss Miss
09/06/12 Gila Bend 0.50-0.75"/20-30min 1.50" 0.00" 1.03"-1.22" None Hit Miss
09/07/12 Phoenix North 0.50-0.75"/20-30min 1.50" 0.51"-0.98" 0.64"-0.83" None X X X Hit Hit
09/07/12 Phoenix South 0.50-0.75"/20-30min 1.50" 0.24"-0.51" 0.04"-0.24" None Miss Miss
09/07/12 Scottsdale North 0.50-0.75"/20-30min 1.50" 0.94"-1.22" 0.64"-0.83" None X Hit Hit
09/07/12 Scottsdale South 0.50-0.75"/20-30min 1.50" 0.79"-0.94" 0.44"-0.63" None X X Hit Hit
09/07/12 New River/Cave Creek N/A N/A 1.93" 1.23"-1.61" None X X Hit Hit
09/07/12 Southeast Valley 0.50-0.75"/10-20min 2.00" 1.81"-2.87" 1.03"-1.22" 1.00" X X Hit Hit
09/07/12 Rainbow Valley 0.50-0.75"/10-20min 2.00" 1.14" 0.64"-0.83" None X X Hit Hit
09/07/12 Rainbow Valley N/A N/A N/A 0.64"-0.83" None X X Hit Hit
09/07/12 West Valley 0.50-0.75"/10-20min 2.00" 0.71"-0.94" 1.03"-1.22" None X X Hit Hit
09/07/12 Gila Bend 0.50-0.75"/10-20min 2.00" 1.57" 1.03"-1.22" None X Hit Hit
09/07/12 Palo Verde 0.50-0.75"/10-20min 1.50" 0.00" 0.84"-1.02" None Hit Miss
09/09/12 Northwest Valley 0.50-0.75"/15-30min 1.25" 1.38" 1.03"-1.22" None X Hit Hit
09/09/12 Phoenix North 0.50-0.75"/15-30min 1.75" 0.28"-0.39" 0.44"-0.63" None X Miss Hit
09/09/12 Scottsdale North 0.50-0.75"/15-30min 1.25" 0.31"-0.83" 0.44"-0.63" None X Hit Hit
09/10/12 Southeast Valley 0.50-0.75"/10-20min 1.50" 1.02" 0.84"-1.02" None X X Hit Hit
09/10/12 Palo Verde 0.50-0.75"/15-30min 1.50" 1.02"-1.42" 1.23"-1.61" None X X Hit Hit
09/10/12 Southeast Valley N/A N/A N/A 0.84"-1.02" None X X Hit Hit
09/10/12 New River/Cave Creek 0.50-0.75"/15-30min 1.50" 1.10"-1.65" 1.62"-1.81" None X X Hit Hit
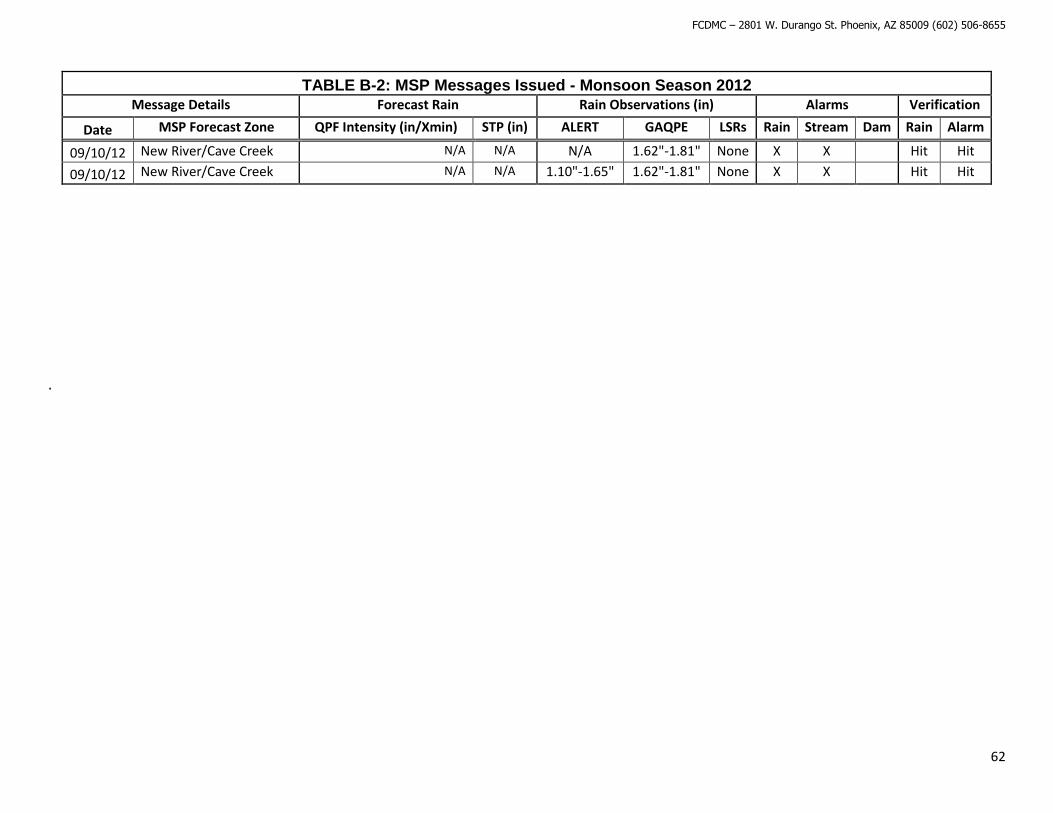
FCDMC – 2801 W. Durango St. Phoenix, AZ 85009 (602) 506-8655
62
TABLE B-2: MSP Messages Issued - Monsoon Season 2012 Message Details Forecast Rain Rain Observations (in) Alarms Verification
Date MSP Forecast Zone QPF Intensity (in/Xmin) STP (in) ALERT GAQPE LSRs Rain Stream Dam Rain Alarm
09/10/12 New River/Cave Creek N/A N/A N/A 1.62"-1.81" None X X Hit Hit
09/10/12 New River/Cave Creek N/A N/A 1.10"-1.65" 1.62"-1.81" None X X Hit Hit
.