Embed Size (px)
Citation preview

Bank of Canada staff analytical notes are short articles that focus on topical issues relevant to the current economic and financial context, produced independently from the Bank’s Governing Council. This work may support or challenge prevailing policy orthodoxy. Therefore, the views expressed in this note are solely those of the authors and may differ from official Bank of Canada views. No responsibility for them should be attributed to the Bank.
www.bank-banque-canada.ca
Staff Analytical Note/Note analytique du personnel 2018-1
Merchant Acceptance of Cash and Credit Cards at the Point of Sale
by Ben Fung, Kim P. Huynh, Kerry Nield and Angelika Welte Currency Department Bank of Canada Ottawa, Ontario, Canada K1A 0G9 [email protected] [email protected] [email protected] [email protected]

ISSN 2369-9639 © 2018 Bank of Canada
Acknowledgements
We thank Victor Aguirregabiria, Heng Chen, Valéry Dongmo Jiongo, Ted Garanzotis, Hanna Halaburda, Fumiko Hayashi, Gradon Nicholls, Marc Rysman, Alex Shcherbakov, Michele Savini Zangrandi and Oz Shy for their comments and suggestions. We thank Nicole van de Wolfshaar for editorial comments. The views expressed in this paper are those of the authors and should not be attributed to the Bank of Canada.

ii
Abstract
Recent data show that the use of credit cards in Canada has been increasing, while the use of cash has been declining. At the same time, only two-thirds of small or medium-sized businesses accept credit cards. To better understand future development of this trend, it is important to study whether a change in merchant fees will increase credit card acceptance and will thus further reduce cash use. In this note, we calculate the level of the merchant fee where a merchant would be indifferent to accepting a credit card or cash payment, using the merchant indifference test. We find that the results are sensitive to the underlying assumptions. Furthermore, we discuss several main issues of applying such a methodology to Canada.
Bank topics: Bank notes; Digital currencies; Econometric and statistical methods; Financial services JEL codes: C2, D1, E41
Résumé
D’après de récentes données, l’utilisation au Canada des cartes de crédit a augmenté au détriment de celle de l’argent comptant. Pourtant, seuls les deux tiers des commerçants de petite et moyenne taille acceptent les cartes de crédit. Pour mieux comprendre l’évolution future de cette tendance, il importe de voir si une réduction des frais imposés aux commerçants les incitera à accepter davantage les cartes de crédit, et donc réduira encore plus l’utilisation de l’argent comptant. Dans cette note, nous essayons de déterminer, grâce au test d’indifférence du commerçant, le montant des frais auquel les commerçants n’accordent pas plus de préférence à la carte de crédit qu’à l’argent comptant. Nous constatons que les résultats dépendent des hypothèses de fond. Nous nous penchons en outre sur différents grands enjeux que soulève l’application de cette méthode au Canada.
Sujets : Billets de banque ; Monnaies numériques ; Méthodes économétriques et statistiques ; Services financiers Codes JEL : C2, D1, E41

2
1. Introduction
Cash remains a popular method of payment (MOP) for consumers to pay for goods and services purchased from a merchant at the point of sale (POS) in Canada, especially for small-value transactions. However, using data from recent Bank of Canada surveys of consumers, Arango et al. (2012) and Fung, Huynh and Stuber (2015) show that the use of credit cards has been increasing both in terms of the number and the value of transactions and that the use of cash has been declining.1 Fung, Huynh and Stuber (2015) find that contactless cards have allowed credit and debit card payments to also make inroads into small-value purchases, which had previously been dominated by cash. Between 2009 and 2013, contactless card transactions increased by four times, while cash transactions declined from 54 per cent to 44 per cent. As the sole issuer of bank notes, the Bank must understand this trend and its implications for the demand for bank notes. Research on emerging developments in retail payments also contributes to the Bank’s research on digital currencies.2 This note focuses on cash and credit cards because the latter has exhibited strong growth in card payments relative to debit cards, as documented by Fung, Huynh, and Stuber (2015). It also draws on experiences from the United States and Australia, whose payment landscapes share many similar features with Canada; see Bagnall et al. (2016) for a cross-country comparison.
Arango, Huynh and Sabetti (2015) show that credit card rewards and merchant acceptance of credit cards and are important factors in the shift from cash to credit cards. Moreover, Huynh, Schmidt-Dengler and Stix (2014) find that the lack of universal merchant acceptance of payments cards is a reason consumers still hold cash as a precaution. Finally, Wakamori and Welte (2017) show that consumer preferences are a key determinant of cash use for small-value transactions.
In 2015 the Bank of Canada conducted the Retailer Survey on the Cost of Payment Methods (RSCPM) to gain further insight into merchant acceptance of and costs associated with various methods of payment.3 The 2015 RSCPM collected data on merchant acceptance, their perceptions of payment methods and the costs they incurred for accepting cash, debit and credit card payments. The RSCPM found that nearly all large businesses (LBs) accepted credit card payments in 2014. By contrast, only two out of three small and medium-sized businesses (SMBs) accepted credit cards. Further, SMBs had a higher share of cash payments in terms of volume and value relative to LBs. Because both LBs and SMBs want to attract and retain consumers, they may consider offering a choice of MOPs, including credit cards. However, Kosse et al. (2017) find that credit cards are the costliest MOP for merchants and that more than 80 per cent of the costs result from merchant service charges (MSC) for accepting credit card payments.4 Fung, Huynh and Kosse (2017) look at how merchants and consumers interact with each other to determine MOP use at the point of sale, using data from the RSCPM and from a recent consumer survey.
1 More details about these consumer surveys are available in Arango and Welte (2012) and Henry, Huynh and Shen (2015). Network data also suggest similar trends. TSI (2017) report that, from 2011 to 2016, the number of credit card transactions grew 6.2 per cent per year, compared with 4.1 per cent for debit cards.
2 http://www.bankofcanada.ca/research/digital-currencies-and-fintech/
3 For more information about the 2015 RSCPM, see Kosse et al. (2017).
4 Kosse et al. (2017) combine the results for SMBs and LBs in the RSCPM sample.

3
It is therefore important to understand the relationship between MSCs, credit card acceptance and cash use; for example, whether lowering MSCs will increase merchant acceptance of credit cards and thus reduce cash use. In this note, we calculate the level of the MSC where a merchant would be indifferent to accepting a credit card or cash payment, using a method proposed by Rochet and Tirole (2011). This methodology is known as the merchant indifference test (MIT) or the “tourist test” and has been used in other studies, such as Bolt, Jonker and Plooij (2013) in the Netherlands, ECDGC (2015) in Europe, and Layne-Farrar (2013) in the United States. To illustrate the main ideas behind the MIT, Section 2 discusses the four-party credit card market, while Section 3 implements the MIT for Canada. We discuss the caveats of MIT exercise and compare our results with findings in other countries in Section 4. Finally, Section 5 concludes.
2. Four-Party Credit Card Payment Market The credit card payment market in Canada is well-developed, with financial institutions offering consumers a large range of credit card products with different features, benefits and annual fees. Typically, premium cards with more features and benefits, such as lower interest rates or rewards programs, charge higher annual fees than basic cards do. In Canada, most credit card payments are processed by the Visa (59 per cent) and Mastercard (35 per cent) networks, which employ a four-party card payment model.5 Figure 1 shows a typical transaction in the four-party credit card payment market. The four parties are the cardholder, the merchant, the issuer of the cardholder’s credit card and the merchant acquirer.
To illustrate how such a system works, consider a $100 credit card transaction at the POS. When a cardholder pays with a credit card, the merchant sends the transaction information to the acquirer (merchant’s bank), who then contacts the issuing bank (consumer’s bank) for authorization. Once authorized, the merchant charges the amount of $100 to the credit card and completes the transaction. After deducting the $1.50 merchant interchange fee (MIF [1]) and the issuer’s $0.05 network access fee (NAF1 [2]), the issuer sends the net transaction amount of $98.45 to the acquirer. The acquirer then transfers the $0.05 NAF to the network (NAF2 [3]) and retains an acquirer margin (AM) of $0.10. The AM covers the internal costs of the acquirer. At the end, the merchant receives $98.30 from the acquirer for the sale. The difference between the original value of the transaction and the amount the merchant ultimately receives from the acquirer ($1.70) represents the fee the merchant pays to the acquirer and is called the merchant service charge (MSC [4]). In the literature, however, it is often the MIF that garners the most attention.
5 American Express provides services in a three-party payment market and has a market share of 6 per cent (The Nilson Report 2017).

4
Figure 1: The four-party credit card payment market
Notes: Adapted from Tirole (2011). Amounts and fees are illustrative. MIF: merchant interchange fee; NAF: network access fee; AM: acquirer margin; MSC: merchant service charge.
The MSC is strictly larger than the MIF because it contains the AM and the NAFs. The network sets the NAFs and the MIF for the issuers, whereas the acquirer sets the AM. Often, merchants are not aware of the different components of the MSC that they pay.6 The MSC is related to the MIF as follows:
MSC = (MIF + NAF)���������set by network
+ AM�set by acquirer
.
Note that all three components of the MSC may depend on the transaction amount. For credit card payments in Canada, MIF and NAF are typically a percentage of the transaction amount. While the NAF percentage is usually uniform across transactions, the MIF and AM can vary with merchant size or industry and with the type of credit card used by the consumer. For example, basic cards usually have lower MIFs than premium cards do. The type of authorization also matters; transactions at the POS using a personal identification number or chip card will incur lower MIFs than card-not-present transactions conducted over the Internet or phone.
6 According to the Financial Consumer Agency of Canada (FCAC), the acquirer must provide the merchant with the
effective merchant discount rate (EMDR) on every invoice for card processing services. The EMDR is calculated as “the total fees paid by the merchant to an acquirer, related to the processing of a specific type of payment card from a payment card network, divided by the total sales volume for that type of payment card.” The EMDR is reflective of the average MSC charged to the merchant and will always be at least as high as the average MIF rate weighted by transaction size.

5
3. Merchant Indifference Test: Canadian Case
In this section, we compute the MSC that meets the merchant indifference test (MIT) for the merchant service charge (MIT MSC) proposed by Rochet and Tirole (2011) using Canadian merchant data from the 2015 RSCPM. In the MIT set-up, merchants assess costs based on a non-repeat customer, such as a tourist, who carries enough cash for the transaction. Figure 2 shows the relationship between the main variables used in the calculation, including the MIT MSC and MIT MIF. The MIT MSC is the difference between the marginal cost of cash and the marginal cost of credit card net of the MSC. We assume that the marginal costs of accepting cash or credit cards (net of the MSC) takes the form of a fixed per transaction cost and a component that varies proportional to the transaction value. The difference between the two marginal costs is therefore also of the form of a fixed cost plus a portion of the transaction value
𝑀𝑀𝑀𝑀𝑀𝑀 𝑀𝑀𝑀𝑀𝑀𝑀 = 𝛼𝛼 + �𝛽𝛽 ∗ 𝑀𝑀𝑇𝑇𝑇𝑇𝑇𝑇𝑇𝑇𝑇𝑇𝑇𝑇𝑇𝑇𝑇𝑇𝑇𝑇𝑇𝑇 𝑉𝑉𝑇𝑇𝑉𝑉𝑉𝑉𝑉𝑉�. (1)
Then the MIT MSC as a percentage of the transaction value is
𝑀𝑀𝑀𝑀𝑀𝑀 𝑀𝑀𝑀𝑀𝑀𝑀 (%) = �𝛼𝛼
𝑀𝑀𝑇𝑇𝑇𝑇𝑇𝑇𝑇𝑇𝑇𝑇𝑇𝑇𝑇𝑇𝑇𝑇𝑇𝑇𝑇𝑇 𝑉𝑉𝑇𝑇𝑉𝑉𝑉𝑉𝑉𝑉+ �𝛽𝛽��×100%. (2)
Under these assumptions, the MIT MSC (%) is therefore a function of the difference in the cost of an additional transaction for cash versus cards (𝛼𝛼) divided by the transaction value plus the difference in the cost of an additional dollar of payment (𝛽𝛽) net of the MSC. A separate technical appendix provides a discussion of the computation of 𝛼𝛼 and 𝛽𝛽.
In the 2015 RSCPM, only the sample of SMBs (merchants with a single location and fewer than 50 employees) is statistically representative of SMBs in Canada.7 As such, this study focuses on SMBs only. The median SMB has annual sales of $375,000, four employees and one cash register, and it holds about $300 in cash. More details about the SMB and LB samples are available in Fung, Huynh, and Kosse (2017).
7 For LBs, the sample is not representative. See Chen and Shen (2017), Hatko (2017), Jiongo (2017) and Welte (2017) for technical details underlying this data.

6
Figure 2: Merchant indifference test for the merchant service charge and for the merchant interchange fee
Notes: Adapted from ECDCG (2014). MIF: merchant interchange fee; NAF: network access fee; AM: acquirer margin; MSC: merchant service charge; MIT: merchant indifference test.
To compute the MIT MSC (%) using the data, two additional considerations are required. First, the calculation of the MIT MSC depends on the transaction value used.8 In this note, we focus on transaction values of $20, $50 and $100 because these bank note denominations are widely used in Canada.9 These values also approximately represent the average transaction values of cash, debit cards and credit cards, which are $21, $46 and $109, respectively. Furthermore, our consumer survey results suggest that cardholders with a preference for credit cards usually choose credit cards for transactions greater than $50 (see Arango, Huynh and Sabetti 2015). We also calculate the transaction value at which MIT MSC (%) equals zero. Intuitively, merchants always prefer cash over credit cards for transactions lower than this value, even if there is no MSC.
Second, the methodology relies on dividing the total costs of cash and credit cards to merchants into fixed costs and variable costs. Variable costs can change with the number or the value of transactions but fixed costs do not. In the case of credit cards, for example, the time spent on accepting payments at the POS is a transaction-related variable cost because it does not depend on the transaction value, whereas the cost of potential fraud is a value-related variable cost. In the case of cash, most of the total costs for SMBs are back-office costs associated with processing bank notes (counting, bundling and depositing at a financial institution).10 Table 1 reports the results under the three different assumptions regarding the allocation of back-office costs of cash.
8 Bolt, Jonker and Plooij (2013) report estimates for a range of transaction sizes from less than 10 euros to more than 100 euros. The technical appendix also plots the MIT MSC against a range of transaction values for the three scenarios considered here.
9 All automated banking machines in Canada dispense $20 notes, and many of them also dispense $50 notes. The $100 notes account for more than 50 per cent of the value of the total notes in circulation in Canada.
10 For more discussions on fixed and variable costs, see Section 4 and the Appendix.

7
In the baseline case, the costs of cash for SMBs are allocated based on the following assumptions in Kosse et al. (2017): (i) one (for businesses with fewer than 5 employees) or two (for businesses with 5 to 50 employees) hours a week of the labour costs are assigned to fixed costs, (ii) two-thirds of the remaining costs are allocated to costs that vary with the volume of transactions, and the other one-third is allocated to costs that vary with the value of transactions.
Table 1: Merchant indifference test for the merchant service charge for small and medium-sized businesses, in per cent
Transaction value
$20
$50
$100
Transaction value at which MIT MSC (%) is zero
Baseline case -0.38 0.05 0.19 $42.46
Scenario 1 0.14 0.50 0.61 $16.08
Scenario 2 0.10 0.89 1.15 $18.56
Note: MIT MSC: merchant indifference test for the merchant service charge.
The first row in Table 1 reports the results of the baseline scenario. The MIT MSC (%) for $20 is -0.38 per cent, which means that the merchant will always prefer cash up to this transaction value, unless there is a subsidy for accepting credit cards. Indeed, the last column in Table 1 reports that merchants will always prefer cash for transactions less than $43. For $50 and $100 transactions, the MIT MSC (%) is 0.05 and 0.19 per cent, respectively. This suggests that a merchant would be indifferent to the use of cash and credit cards at a relatively low level of MSC in the baseline case.
To assess the sensitivity of the baseline results, we consider two alternative scenarios by changing the allocation of the costs of handling cash between fixed and marginal costs.
Scenario 1: No fixed back-office costs. Half of back-office costs are assumed to vary with the volume of cash transactions and the other half with the value of transactions.
Scenario 2: No fixed back-office costs and all the back-office costs are related to the value of transactions.
Comparing with the baseline results, the MIT MSC (%) increases in both scenarios, while the threshold transaction value at which MIT MSC (%) equals zero decreases. For example, the MIT MSC (%) for $20 increases to about 0.14 per cent in scenario 1 and 0.1 per cent in scenario 2. The threshold transaction value declines to $16 and $19, respectively. The highest MIT MSC (%) is 1.15 per cent for $100 in scenario 2. Overall, the MIT MSC (%) increases with the reference transaction value and from the baseline scenario to scenarios 1 and 2. Table 1 shows the MIT MSC (%) for SMBs ranges from -0.38 to 1.15 per cent.
4. Discussions
The calculation above illustrates that there is a wide range of estimates of the level of the MIT MSC (%) at which a merchant is indifferent to accepting cash or credit cards for a non-repeat payment. This suggests that the impact of a change in MSC or MIF on merchant acceptance of

8
credit cards is difficult to assess. Further, given that the calculation of the MIT MSC is sensitive to the underlying assumptions, it is important to discuss the major caveats of applying the MIT to Canadian data. Also, it is instructive to compare our results with similar studies in other countries.
Caveat 1: Data and econometric issues The MSC versus the MIF
• The Canadian data allow us to calculate the MSC only, not the MIF. In the 2015 RSCPM, we collected data on the fees merchants paid to their acquirers (MSC), and this allows us to compute the MIT MSC. To calculate the MIT MIF, however, would require additional information on the AM and the NAF, for example, through acquirer surveys (Bolt, Jonker and Plooij 2013) or by making assumptions about AM (ECDCG 2015 and Layne-Farrar 2013). As noted above, the MSC is always higher than the MIF. More data are needed to understand how the AM is related to the MSC, the transaction amount and, more broadly, merchant characteristics.
Specification of the cost function
• Merchant costs are assumed to be the sum of three components: a share that is fixed, one that is proportional to the number of transactions and one that is variable with the total transaction value. This functional form may not be correctly specified (see also the discussion in ECDCG 2015).
• A major assumption of the MIT is that merchants and transactions are homogeneous. As such, the MIT MSC (%) calculated is based on an average merchant and will not result in indifference to cards and cash across all merchants.
• Kosse et al. (2017) report that the (weighted) survey sample of SMBs is statistically representative, while the LB sample is not representative of LBs in Canada. We therefore apply the MIT only to SMBs.
• The MIT MSC (%) is sensitive to the merchants’ average transaction value. In Table 1, the MIT MSC (%) increases noticeably when the transaction value increases from $20 to $50 and $100. A similar relationship is reported in Bolt, Jonker and Plooij (2013). Hayashi (2013) and Layne-Farrar (2013) find that the introduction of a uniform MIF cap for debit cards in the United States increased fees for merchants with small average transaction values, while decreasing them for those with large average transaction values.
• The MIT MSC (%) is sensitive to the individual merchant’s planning horizon. With a longer horizon a smaller share of the costs for cash and credit cards is fixed and a larger share is variable. In Table 1, scenarios 1 and 2 are consistent with a longer horizon than the base case. Compared with the base case, the calculated MIT MSC (%) is noticeably higher. Bazzucchi, Condorelli and Lo Passo (2014) and ECDCG (2015) also note that the MIT MIF (%) should increase when a longer-term horizon is chosen.

9
Caveat 2: Multi-sided market considerations
Network externalities • The credit card network pictured in Figure 1 is a multi-sided market with cardholders,
merchants, acquirers, issuers and a credit card network. The calculation of MIT MSC here, as in ECDCG (2015) and Bolt, Jonker and Plooij (2013), focuses on costs incurred by merchants only and does not consider the cardholders, acquirers and issuers. However, credit cards become more useful to cardholders when there are more merchants that accept credit cards, and acceptance of credit cards is more beneficial to merchants when there are more cardholding customers. This effect is known as network externalities.
• Rochet and Tirole (2011) argue that the network externalities for merchants and cardholders depend on the level of MIFs. In the same vein, Rysman and Wright (2014) argue that lower MIFs may reduce incentives provided by card issuers to entice cardholders to use credit cards and thereby the incentives for merchants to accept credit cards. Hayashi (2010) finds that credit cards are widely accepted and used in Australia, Canada and the United States despite the high MIFs.
Benefits of card acceptance
• While strategic considerations, such as attracting and retaining customers, may be an important driver of credit card acceptance, the MIT is based on a non-repeat customer who carries enough cash for the transaction. However, Tirole (2011) argues that the benefits to the merchant, such as additional sales generated because of credit card acceptance and the potential to attract consumers, would likely generate a higher and more relevant MIT MSC (%) (compared with the MIT MSC (%) in Table 1). This view that benefits of card acceptance matter is shared by the England and Wales High Court and the UK Competition Appeal Tribunal.11
Network rules
• Further, individual SMBs may not have the ability or power to negotiate the MSC rate, which represents the intensive margin of their costs.12 The merchants’ acceptance decision is largely at the extensive margin; in other words, they decide whether or not to accept credit cards based on the rules established by the networks because they must honour all credit cards on a transaction-by-transaction basis and must not impose a surcharge for credit card transactions.
11 CAT (2017, p. 145), “…the MIT-MIF is so far divorced from commercial realities as to be an exercise the Merchant would not undertake. The notion that a Merchant, when considering what price to pay to participate in a payment scheme, would be minded to assume that its customers have “cash and will never return to the store again” is a proposition that only needs to be stated to be rejected.” England and Wales High Court (2017, 343) “[The] competitive advantage is a benefit which falls to be taken into account for the purposes of the […] exercise, but is left entirely out of account by the tourist test.”
12 Recently the Canadian Federation of Independent Businesses (CFIB) has negotiated a reduced rate for its members with Mastercard: http://www.cfib-fcei.ca/english/article/5818-preferred-cfib-rates-payment-processing-chase-paymentech.html

10
• The cardholders’ decision is both at the extensive and intensive margin: they can choose to adopt credit cards as well as how often and where to use them for purchases. Cash provides consumers with liquidity, while credit cards also provide access to credit, thus allowing the cardholder to delay payment. Kosse et al. (2017) suggest that credit cards are the least costly POS MOP for consumers.
• Changing the network rules, such as surcharging, can have implications for the use of credit cards as well. For example, merchants in Australia have been allowed to impose surcharges on credit card payments since 2003. In 2010, about one-quarter of Australian merchants imposed surcharges on credit cards, and the growth in credit card transactions has been slowing (BIS 2014) compared with the period before 2003, whereas the growth in debit card use has accelerated and the use of cash has continued to decline (see BIS 2014 and Doyle et al. 2017). These observations are broadly in line with the theoretical analysis of allowing credit card surcharges (Gans and King 2003).
Other stakeholders in the network
• While a lack of data prevents us from including issuers and acquirers in our analysis, Tirole (2011) argues that taking into consideration all the stakeholders when calculating the MIF would likely result in a higher MIF than the one based on the MIT for two reasons. First, the MIT ignores profits generated by the issuer and acquirer market. Second, issuers may use MIFs to subsidize other MOPs, such as cash and debit cards. As an example, this subsidy could take the form of transfer pricing, where issuers use MIF revenue to cover the costs they incur from providing automated banking machine services. Getter (2017) reports that merchants, issuers and acquirers in United States were affected unevenly by changes to debit card interchange fees and that the net effect for each stakeholder cannot be determined.
Four-party versus three-party payment market
• Tirole (2011) argues that focusing on MIF (instead of MSC) may have consequences for competition between different types of networks. In the three-party payment markets, MIFs do not exist explicitly because the same agent functions as both the acquirer and the issuer. Restricting the attention to MIF, which exists only in the four-party payment markets, could give the networks operating a three-party payment market an advantage. As such, Tirole (2011) suggests considering an implicit or “shadow” MIF in the three-party payment market.
• In Australia, MIFs for three-party payment markets are now considered as “interchange-like” and are subject to similar treatments as the MIF in the four-party payment markets.13 In Canada, while Visa and Mastercard voluntarily committed in 2014 to reducing the
13 https://www.rba.gov.au/payments-and-infrastructure/review-of-card-payments-regulation/q-and-a/card-payments-regulation-qa-conclusions-paper.html. See also the case of Amex in the United Kingdom: https://www.psr.org.uk/psr-publications/news-announcements/statement-card-schemes-subject-to-interchange-fee-caps-uk-201718

11
average annual MIF to 1.5 per cent over a five-year period, the networks operating three-party payment market are not part of this initiative.14
Caveat 3: Changing payment landscape
• Using merchant data collected for the year 2014 to calculate the appropriate MIT level in later years, such as 2017, poses problems because of the rapidly changing payment landscape. Bolt, Jonker and Plooij (2013) find that the MIT level for the Dutch market increased from 2002 to 2009. They attribute this to increased card use at the POS and the increased marginal cost of cash. They conclude that MIT levels must be revisited frequently.
• For example, contactless credit card payments rose from a share of just 5 per cent of credit card payments at the POS in 2009 to almost 20 per cent in 2013 (Henry, Huynh and Shen 2015).
• Mobile payment applications available to Canadian consumers, such as ApplePay and PayPal Wallet, and the increasing popularity of Interac e-Transfer have the potential to cause further shifts in the payment landscape. As more and more retail purchases are conducted online where cash is not accepted, credit card costs should also be compared with the cost of cashless alternatives.
5. Conclusion While cash remains a popular method of payment, especially for small-value transactions, the use of cash has been declining because of the increased use of alternative payment methods, such as credit cards. Nevertheless, cash is almost universally accepted, and credit cards are not, especially among small and medium sized businesses. It is therefore important to study whether increased credit card acceptance will further increase card use and reduce cash use. This note has provided estimates for the level of the merchant service charges that would leave merchants indifferent to accepting a cash or credit card payment at the point of sale. We undertake this exercise using the merchant indifference test proposed by Rochet and Tirole (2011). The results suggest that there is a wide range of plausible estimates, depending on the underlying assumptions. Furthermore, we discuss several main issues of applying the merchant indifference test to Canada and highlight the need for caution when using this methodology to understand merchant acceptance of credit cards. Future research may be able to address these issues by collecting additional data and/or building a model that embeds the multi-sided nature of the credit card market for consumers, merchants, payment service providers and credit card networks.
14 For details, see Department of Finance Canada (2014).

12
6. References
Arango, C., B. Fung, K. P. Huynh and G. Stuber. 2012. “The Changing Landscape for Retail Payments in Canada and the Implications for the Demand for Cash.” Bank of Canada Review (Autumn): 31‒40.
Arango, C., K. P. Huynh and L. Sabetti. 2015. “Consumer Payment Choice: Merchant Card Acceptance Versus Pricing Incentives.” Journal of Banking and Finance 55 (C): 130–141.
Arango, C. and A. Welte. 2012. “The Bank of Canada’s 2009 Methods-of-Payment Survey: Methodology and Key Results.” Bank of Canada Staff Discussion Paper No. 2012-6.
Bagnall, J., D. Bounie, K. P. Huynh, A. Kosse, T. Schmidt and S. Schuh. 2016. “Consumer Cash Usage: A Cross-Country Comparison with Payment Diary Survey Data.” International Journal of Central Banking 12 (4): 1–61.
Bazzucchi, L., D. Condorelli and F. Lo Passo. 2014. “Assessment of the European Commission’s Preliminary Findings on Merchants’ Costs of Cash and Cards.”
Bank for International Settlements (BIS). 2014. “Statistics on Payment, Clearing and Settlement Systems in the CPSS Countries, Figures for 2011.”
Bolt, W., N. Jonker M. Plooij. 2013. “Tourist Test or Tourist Trap? Unintended Consequences of Debit Card Interchange Fee Regulation.” De Nederlandsche Bank Working Paper No. 405.
Brits, H. and C. Winder. 2005. “Payments Are No Free Lunch.” De Nederlandsche Bank Occasional Studies 3 (2).
Chen, H. and Q. R. Shen. 2017. “The Bank of Canada 2015 Retailer Survey on the Cost of Payment Methods: Calibration for Single-Location Retailers.” Bank of Canada Technical Report No. 109.
Competition Appeal Tribunal (CAT). 2017. “Sainsbury’s Supermarkets Ltd v MasterCard Incorporated and Others.”
Department of Finance Canada. 2014. “Minister of Finance Issues Statement on Voluntary Visa and MasterCard Proposals.” Press release, Ottawa, Ontario, 4 November.
Doyle, M-A., C. Fisher, E. Tellez and A. Yadav. 2017. “How Australians Pay: New Survey Evidence.” Reserve Bank of Australia Bulletin (March): 59–66.
England and Wales High Court. 2017. “ASDA Stores Ltd v MasterCard Incorporated and Others.” http://www.bailii.org/ew/cases/EWHC/Comm/2017/93.html
European Commission Directorate-General for Competition (ECDGC). 2014. “Survey on Merchants’ Cost of Processing Cash and Card Payments-Preliminary Results.”
———. 2015. “Survey on Merchants’ Cost of Processing Cash and Card Payments.” Technical Report.
Fung B., K. P. Huynh and A. Kosse. 2017. “Acceptance and Use of Payments at the Point of Sale in Canada.” Bank of Canada Review (Autumn): 14–26.

13
Fung B., K. P. Huynh and G. Stuber. 2015. “The Use of Cash in Canada.” Bank of Canada Review (Spring): 45‒56.
Gans J. S. and S. P. King. 2003. “The Neutrality of Interchange Fees in Payment Systems.” The B. E. Journal of Economic Analysis & Policy 3 (1): 1–18.
Getter, D. E. 2017. “Regulation of Debit Interchange Fees,” Technical Report.
Hatko, S. 2017. “The Bank of Canada 2015 Retailer Survey on the Cost of Payment Methods: Nonresponse.” Bank of Canada Technical Report No. 107.
Hayashi, F. 2010. “Payment Card Interchange Fees and Merchant Service Charges—An International Comparison.” Lydian Payments Journal 1 (3): 6-22.
———. Hayashi, F. 2013. “The New Debit Card Regulations: Effects on Merchants, Consumers, and Payments System Efficiency.” Federal Reserve Bank of Kansas City Economic Review, Q I: 89–118.
and J. L. Maniff. 2014. “Interchange Fees and Network Rules: A Shift from Antitrust Litigation to Regulatory Measures in Various Countries.” Federal Reserve Bank of Kansas City Payment System Research (October 2014): 1–5.
Henry, C., K. Huynh and R. Shen. 2015. “2013 Method-of-Payment Survey Results.” Bank of Canada Staff Discussion Paper No. 2015-4.
Huynh, K. P., P. Schmidt-Dengler and H. Stix. 2014. “The Role of Card Acceptance in the Transaction Demand for Money.” Bank of Canada Staff Working Paper No. 2014-44.
Jiongo, V. D. 2017. “The Bank of Canada 2015 Retailer Survey on the Cost of Payment Methods: Estimation of the Total Private Cost for Large Businesses.” Bank of Canada Technical Report No. 110.
Layne-Farrar, A. 2013. “Assessing the Durbin Amendment’s Debit Card Interchange Fee Cap: An Application of the Tourist Test to US Retailer Data.” Review of Network Economics 12 (2): 157–182.
Kosse, A., H. Chen, M.-H. Felt, V. D. Jiongo, K. Nield and A. Welte. 2017. “The Costs of Point-of-Sale Payments in Canada.” Bank of Canada Staff Discussion Paper No. 2017-4.
Rochet, J. C. and J. Tirole. 2011. “Must‐Take Cards: Merchant Discounts and Avoided Costs.” Journal of the European Economic Association 9 (3): 462–495.
Rysman, M. and J. Wright. 2014. “The Economics of Payment Cards.” Review of Network Economics 13 (3): 303–353.
Technology Strategies International (TSI). 2017. “Canadian Payments Forecast: 2017.”
The Nilson Report. 2017. Issue 1106 (March).
Tirole, J. 2011. “Payment Card Regulation and the Use of Economic Analysis in Antitrust.” Competition Policy International 7 (1): 137–158.
Wakamori, N. and A. Welte. 2017. “Why Do Shoppers Use Cash? Evidence from Shopping Diary Data.” Journal of Money, Credit and Banking 49: 115–169.
14
Welte, A. 2017. “The Bank of Canada 2015 Retailer Survey on the Cost of Payment Methods: Sampling.” Bank of Canada Technical Report No. 108.
15
Technical Appendix
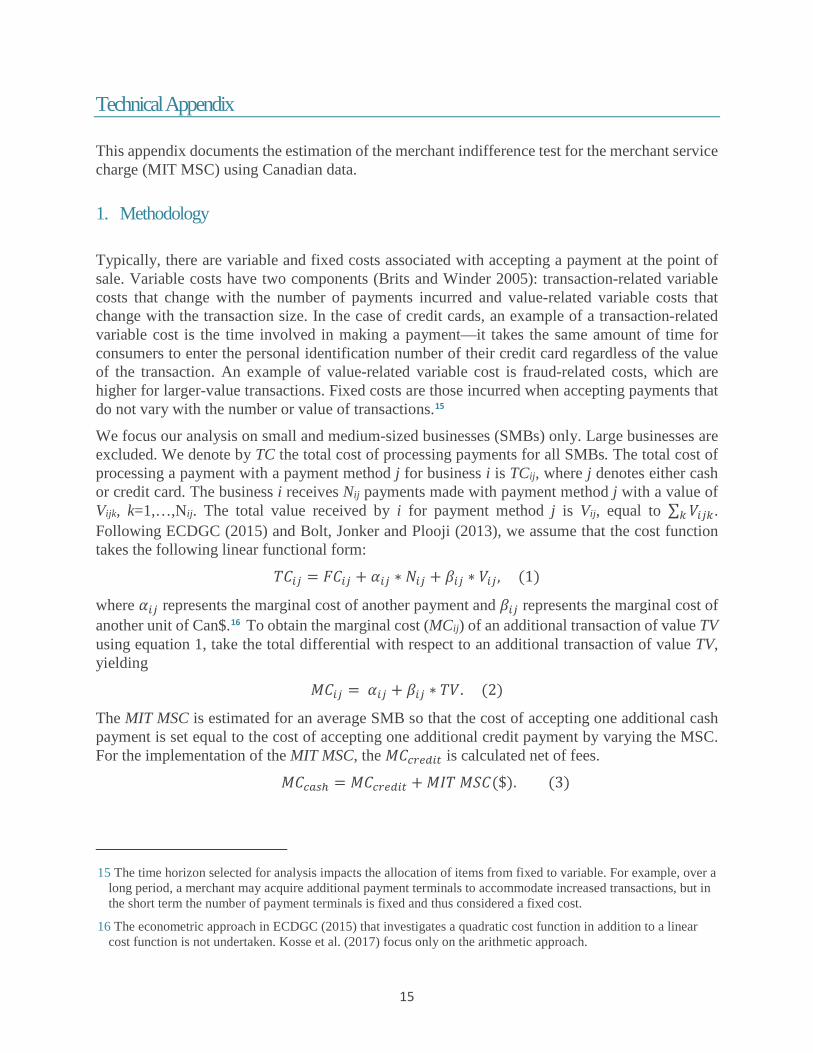
This appendix documents the estimation of the merchant indifference test for the merchant service charge (MIT MSC) using Canadian data.
1. Methodology
Typically, there are variable and fixed costs associated with accepting a payment at the point of sale. Variable costs have two components (Brits and Winder 2005): transaction-related variable costs that change with the number of payments incurred and value-related variable costs that change with the transaction size. In the case of credit cards, an example of a transaction-related variable cost is the time involved in making a payment—it takes the same amount of time for consumers to enter the personal identification number of their credit card regardless of the value of the transaction. An example of value-related variable cost is fraud-related costs, which are higher for larger-value transactions. Fixed costs are those incurred when accepting payments that do not vary with the number or value of transactions.15
We focus our analysis on small and medium-sized businesses (SMBs) only. Large businesses are excluded. We denote by TC the total cost of processing payments for all SMBs. The total cost of processing a payment with a payment method j for business i is TCij, where j denotes either cash or credit card. The business i receives Nij payments made with payment method j with a value of Vijk, k=1,…,Nij. The total value received by i for payment method j is Vij, equal to ∑ 𝑉𝑉𝑖𝑖𝑖𝑖𝑖𝑖𝑖𝑖 . Following ECDGC (2015) and Bolt, Jonker and Plooji (2013), we assume that the cost function takes the following linear functional form:
𝑀𝑀𝑀𝑀𝑖𝑖𝑖𝑖 = 𝐹𝐹𝑀𝑀𝑖𝑖𝑖𝑖 + 𝛼𝛼𝑖𝑖𝑖𝑖 ∗ 𝑁𝑁𝑖𝑖𝑖𝑖 + 𝛽𝛽𝑖𝑖𝑖𝑖 ∗ 𝑉𝑉𝑖𝑖𝑖𝑖, (1)
where 𝛼𝛼𝑖𝑖𝑖𝑖 represents the marginal cost of another payment and 𝛽𝛽𝑖𝑖𝑖𝑖 represents the marginal cost of another unit of Can$.16 To obtain the marginal cost (MCij) of an additional transaction of value TV using equation 1, take the total differential with respect to an additional transaction of value TV, yielding
𝑀𝑀𝑀𝑀𝑖𝑖𝑖𝑖 = 𝛼𝛼𝑖𝑖𝑖𝑖 + 𝛽𝛽𝑖𝑖𝑖𝑖 ∗ 𝑀𝑀𝑉𝑉. (2)
The MIT MSC is estimated for an average SMB so that the cost of accepting one additional cash payment is set equal to the cost of accepting one additional credit payment by varying the MSC. For the implementation of the MIT MSC, the 𝑀𝑀𝑀𝑀𝑐𝑐𝑐𝑐𝑐𝑐𝑐𝑐𝑖𝑖𝑐𝑐 is calculated net of fees.
𝑀𝑀𝑀𝑀𝑐𝑐𝑐𝑐𝑐𝑐ℎ = 𝑀𝑀𝑀𝑀𝑐𝑐𝑐𝑐𝑐𝑐𝑐𝑐𝑖𝑖𝑐𝑐 + 𝑀𝑀𝑀𝑀𝑀𝑀 𝑀𝑀𝑀𝑀𝑀𝑀($). (3)
15 The time horizon selected for analysis impacts the allocation of items from fixed to variable. For example, over a long period, a merchant may acquire additional payment terminals to accommodate increased transactions, but in the short term the number of payment terminals is fixed and thus considered a fixed cost.
16 The econometric approach in ECDGC (2015) that investigates a quadratic cost function in addition to a linear cost function is not undertaken. Kosse et al. (2017) focus only on the arithmetic approach.

16
Thus, from equations 2 and 3:
𝛼𝛼𝑐𝑐𝑐𝑐𝑐𝑐ℎ + 𝛽𝛽𝑐𝑐𝑐𝑐𝑐𝑐ℎ ∗ 𝑀𝑀𝑉𝑉 = 𝛼𝛼𝑐𝑐𝑐𝑐𝑐𝑐𝑐𝑐𝑖𝑖𝑐𝑐 + 𝛽𝛽𝑐𝑐𝑐𝑐𝑐𝑐𝑐𝑐𝑖𝑖𝑐𝑐 ∗ 𝑀𝑀𝑉𝑉 + 𝑀𝑀𝑀𝑀𝑀𝑀 𝑀𝑀𝑀𝑀𝑀𝑀 ($),
𝑀𝑀𝑀𝑀𝑀𝑀 𝑀𝑀𝑀𝑀𝑀𝑀 ($) = (𝛼𝛼𝑐𝑐𝑐𝑐𝑐𝑐ℎ − 𝛼𝛼𝑐𝑐𝑐𝑐𝑐𝑐𝑐𝑐𝑖𝑖𝑐𝑐) + (𝛽𝛽𝑐𝑐𝑐𝑐𝑐𝑐ℎ − 𝛽𝛽𝑐𝑐𝑐𝑐𝑐𝑐𝑐𝑐𝑖𝑖𝑐𝑐) ∗ 𝑀𝑀𝑉𝑉. (4)
The MIT MSC ($) relationship (4) describes the transaction value at which the merchant will have the same marginal cost for an additional credit or cash transaction. In this case, the MIT MSC ($) is expressed in two parts: ad valorem and the fixed fee. The fixed fee component is given by 𝛼𝛼� =(𝛼𝛼𝑐𝑐𝑐𝑐𝑐𝑐ℎ − 𝛼𝛼𝑐𝑐𝑐𝑐𝑐𝑐𝑐𝑐𝑖𝑖𝑐𝑐) and the ad valorem portion is �̅�𝛽 = (𝛽𝛽𝑐𝑐𝑐𝑐𝑐𝑐ℎ − 𝛽𝛽𝑐𝑐𝑐𝑐𝑐𝑐𝑐𝑐𝑖𝑖𝑐𝑐). The two-part MIT MSC is flexible to accommodate different transaction values.
The target parameters 𝛼𝛼𝑖𝑖 and 𝛽𝛽𝑖𝑖 are ratios. The ratios 𝛼𝛼𝑖𝑖 and 𝛽𝛽𝑖𝑖 for the average SMB are obtained by estimating the numerator and denominator separately. For the numerator, the total transaction-linked variable costs �𝛼𝛼𝑖𝑖𝑁𝑁𝑖𝑖� and total value-linked variable costs �𝛽𝛽𝑖𝑖𝑉𝑉𝑖𝑖� are estimated for the SMB population for cash and credit. The denominators, the total value �𝑉𝑉𝑖𝑖� and volume �𝑁𝑁𝑖𝑖� of credit and cash transactions in the SMB population are also estimated. In both estimations, design weights 𝑤𝑤𝑖𝑖 (see Chen and Shen 2017 and Hatko 2017) are used to obtain nationally representative totals.
𝛼𝛼𝑖𝑖𝑁𝑁𝑖𝑖 =∑ 𝑤𝑤𝑖𝑖𝑀𝑀𝑀𝑀𝑁𝑁𝑖𝑖𝑖𝑖𝐴𝐴𝑖𝑖𝑖𝑖𝑅𝑅𝑖𝑖𝑖𝑖𝑖𝑖
∑ 𝑤𝑤𝑖𝑖𝑖𝑖 𝐴𝐴𝑖𝑖𝑖𝑖𝑅𝑅𝑖𝑖𝑖𝑖�� 𝑤𝑤𝑖𝑖𝐴𝐴𝑖𝑖𝑖𝑖
𝑖𝑖� , (5)
𝛽𝛽𝑖𝑖𝑉𝑉𝑖𝑖 = ∑ 𝑤𝑤𝑖𝑖𝑀𝑀𝑀𝑀𝑉𝑉𝑖𝑖𝑖𝑖 𝐴𝐴𝑖𝑖𝑖𝑖𝑅𝑅𝑖𝑖𝑖𝑖𝑖𝑖
∑ 𝑤𝑤𝑖𝑖𝑖𝑖 𝐴𝐴𝑖𝑖𝑖𝑖𝑅𝑅𝑖𝑖𝑖𝑖�� 𝑤𝑤𝑖𝑖𝐴𝐴𝑖𝑖𝑖𝑖
𝑖𝑖� , (6)
𝑁𝑁𝑖𝑖 = �𝑤𝑤𝑖𝑖𝑁𝑁𝑖𝑖𝑖𝑖
𝑖𝑖
, (7)
𝑉𝑉𝑖𝑖 = �𝑤𝑤𝑖𝑖𝑉𝑉𝑖𝑖𝑖𝑖𝑖𝑖
, (8)
where 𝑀𝑀𝑀𝑀𝑁𝑁𝑖𝑖𝑖𝑖 is the total transaction-linked variable cost incurred by respondent i for payment method j, 𝑀𝑀𝑀𝑀𝑉𝑉𝑖𝑖𝑖𝑖 the total value-linked variable cost incurred by respondent i for payment method j, 𝐴𝐴𝑖𝑖𝑖𝑖 is an indicator of whether respondent i accepts payment method j and 𝑅𝑅𝑖𝑖𝑖𝑖 is the response indicator of merchant i to the relevant cost item for the payment method j. Using this information, we estimate 𝛼𝛼𝑖𝑖 and 𝛽𝛽𝑖𝑖 as follows:
𝛼𝛼𝑖𝑖 = 𝛼𝛼𝑖𝑖𝑁𝑁𝑖𝑖𝑁𝑁𝑖𝑖
, 𝛽𝛽𝑖𝑖 =𝛽𝛽𝑖𝑖𝑉𝑉𝑖𝑖𝑉𝑉𝑖𝑖
. (9)
Once the MIT MSC ($) is estimated, we can also estimate the MIT MSC (%), which is the MIT MSC ($) as percentage of the transaction value. If 𝛼𝛼� ≠ 0 , the MIT MSC (%) varies with the transaction value. Therefore, the MIT MSC (%) evaluated at a specific transaction value (TV) will not equate the marginal cost of cash and credit for all other transaction values.
𝑀𝑀𝑀𝑀𝑀𝑀 𝑀𝑀𝑀𝑀𝑀𝑀 (%) =(𝛼𝛼𝑐𝑐𝑐𝑐𝑐𝑐ℎ − 𝛼𝛼𝑐𝑐𝑐𝑐𝑐𝑐𝑐𝑐𝑖𝑖𝑐𝑐)
𝑀𝑀𝑉𝑉+ (𝛽𝛽𝑐𝑐𝑐𝑐𝑐𝑐ℎ − 𝛽𝛽𝑐𝑐𝑐𝑐𝑐𝑐𝑐𝑐𝑖𝑖𝑐𝑐) (10)
17
2. The Data
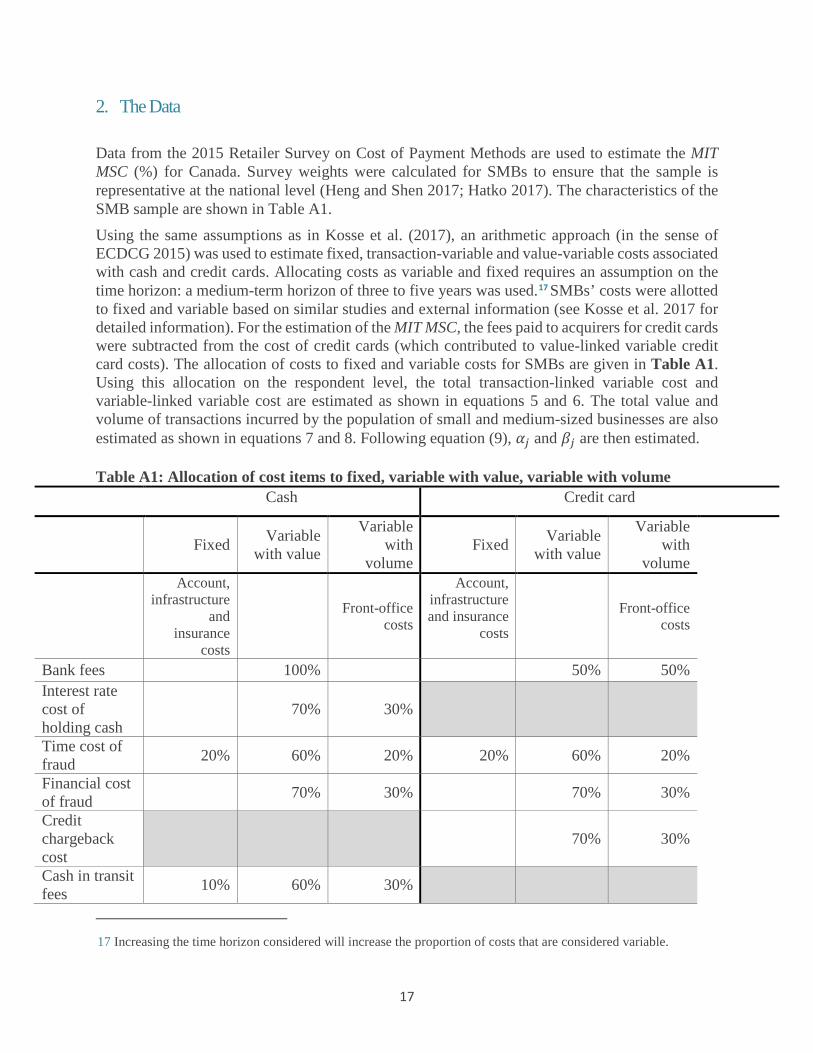
Data from the 2015 Retailer Survey on Cost of Payment Methods are used to estimate the MIT MSC (%) for Canada. Survey weights were calculated for SMBs to ensure that the sample is representative at the national level (Heng and Shen 2017; Hatko 2017). The characteristics of the SMB sample are shown in Table A1. Using the same assumptions as in Kosse et al. (2017), an arithmetic approach (in the sense of ECDCG 2015) was used to estimate fixed, transaction-variable and value-variable costs associated with cash and credit cards. Allocating costs as variable and fixed requires an assumption on the time horizon: a medium-term horizon of three to five years was used.17 SMBs’ costs were allotted to fixed and variable based on similar studies and external information (see Kosse et al. 2017 for detailed information). For the estimation of the MIT MSC, the fees paid to acquirers for credit cards were subtracted from the cost of credit cards (which contributed to value-linked variable credit card costs). The allocation of costs to fixed and variable costs for SMBs are given in Table A1. Using this allocation on the respondent level, the total transaction-linked variable cost and variable-linked variable cost are estimated as shown in equations 5 and 6. The total value and volume of transactions incurred by the population of small and medium-sized businesses are also estimated as shown in equations 7 and 8. Following equation (9), 𝛼𝛼𝑖𝑖 and 𝛽𝛽𝑖𝑖 are then estimated. Table A1: Allocation of cost items to fixed, variable with value, variable with volume
Cash Credit card
Fixed Variable
with value
Variable with
volume Fixed Variable
with value
Variable with
volume Account,
infrastructure and
insurance costs
Front-office costs
Account, infrastructure and insurance
costs
Front-office costs
Bank fees 100% 50% 50% Interest rate cost of holding cash
70% 30%
Time cost of fraud 20% 60% 20% 20% 60% 20%
Financial cost of fraud 70% 30% 70% 30%
Credit chargeback cost
70% 30%
Cash in transit fees 10% 60% 30%
17 Increasing the time horizon considered will increase the proportion of costs that are considered variable.

18
Back-office costs (Baseline case)
1 hour per week for
small businesses
2 hours per week for medium
businesses
1/3 of remaining
back-office cost
2/3 of remaining
back-office cost
1 hour per week for
small businesses
2 hours per week for medium
businesses
1/3 of remaining
back-office cost
2/3 of remaining
back-office cost
Note: Adapted from Kosse et al. 2017. Some cost items (e.g., account fees, front-office costs, infrastructure costs, etc.) can be attributed to several methods of payment. The process for allocating these types of costs to one particular payment method is detailed further in Kosse et al. (2017).
3. Results
Table A2 reports the estimates of the fixed fee 𝛼𝛼� and ad valorem fee �̅�𝛽 for the baseline case and for scenarios 1 and 2.
Table A2: MIT MSC ($) for SMB: Fixed and ad valorem
Note: MIT MSC: merchant indifference test for the merchant service charge; SMB: small and medium-sized business.
These results are then used to estimate the MIT MSC as an ad valorem-only fee. Equation 10 expresses the MIT MSC as a percentage that varies with transaction value, Figure A1 graphically represents MIT MSC (%).
𝛼𝛼� �̅�𝛽
Baseline -0.14185 0.00334 Scenario 1 -0.11767 0.00732 Scenario 2 -0.26239 0.01414

19
Figure A1: MIT MSC (%) for small and medium-sized businesses, as represented by equation 10
Note: MIT MSC: merchant indifference test for the merchant service charge.
The estimator for the marginal costs of an average SMB relies on the computation of the total value-linked variable cost, transaction-linked variable cost, total value and number of transactions. However, the final estimates may be biased for the reasons discussed below.
Influential observations in the survey data are winsorized for certain variables, including the value and volume of transactions. For example, 𝑤𝑤𝑖𝑖𝑁𝑁𝑖𝑖𝑖𝑖 and 𝑤𝑤𝑖𝑖𝑉𝑉𝑖𝑖𝑖𝑖 are winsorized from above, which may introduce downward or prevent upward bias in 𝑁𝑁𝑖𝑖 and 𝑉𝑉𝑖𝑖.
Furthermore, there is item non-response in the cost components in the estimation of the variable costs 𝑀𝑀𝑀𝑀𝑁𝑁𝑖𝑖𝑖𝑖 and 𝑀𝑀𝑀𝑀𝑉𝑉𝑖𝑖𝑖𝑖. 18 While 𝑤𝑤𝑖𝑖 accounts for unit non-response, it does not account for item non-response or incorrect responses. If the item non-response is missing completely at random, then the estimations of 𝛼𝛼𝑖𝑖𝑁𝑁𝑖𝑖 and 𝛽𝛽𝑖𝑖𝑉𝑉𝑖𝑖 are asymptotically unbiased. Because we do not know if the item non-response is missing completely at random, we may overestimate or underestimate 𝛼𝛼𝑖𝑖𝑁𝑁𝑖𝑖 and 𝛽𝛽𝑖𝑖𝑉𝑉𝑖𝑖 .
Given these potential biases, the net effect on the marginal costs, 𝛼𝛼𝑖𝑖and 𝛽𝛽𝑖𝑖, is unclear. Furthermore, the parameters of interest are 𝛼𝛼� and �̅�𝛽, the differences between the marginal costs. Even if there is only one source of bias in the calculation of 𝛼𝛼𝑖𝑖and 𝛽𝛽𝑖𝑖, the impact on the MIT MSC is ambiguous and results shown in Table A2 could be over- or underestimations.
18 Hatko (2017) completed imputation of the survey data to account for item non-response, although not all cost components items were imputed or cleaned.

20
In this note, we did not attempt to estimate the bias. Moreover, complex survey design, the treatment of outliers and missing observations do not allow us to apply standard methods for variance estimation or confidence intervals for 𝛼𝛼� , �̅�𝛽 or the MIT MSC.