Embed Size (px)
Citation preview

Measurement Based VRM Modeling
Steven M. Sandler PICOTEST
Session 5Power Delivery Networks
SPI2017 Measurement Based VRM Modeling - Sandler 2
Voltage Regulator Module Unified Model
SPI2017 Measurement Based VRM Modeling - Sandler 3
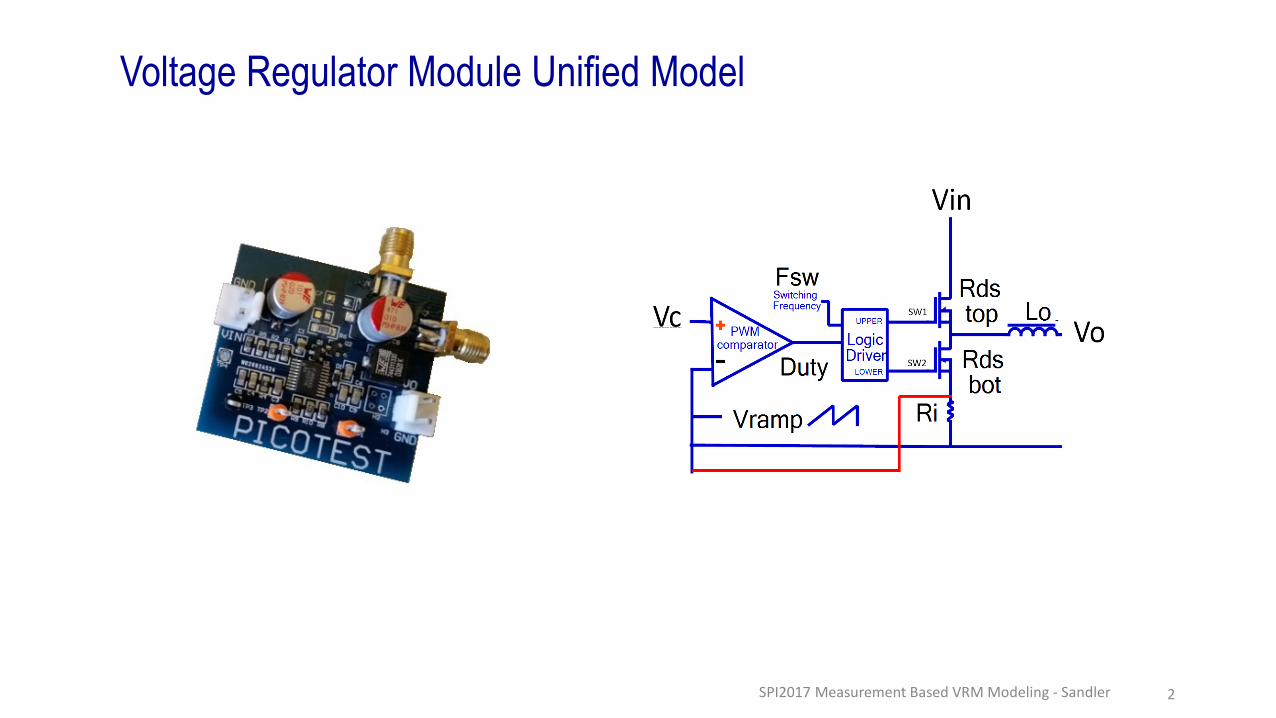
1 Model in 1 Second Delivers Large Signal and Small Signal
SPI2017 Measurement Based VRM Modeling - Sandler 4
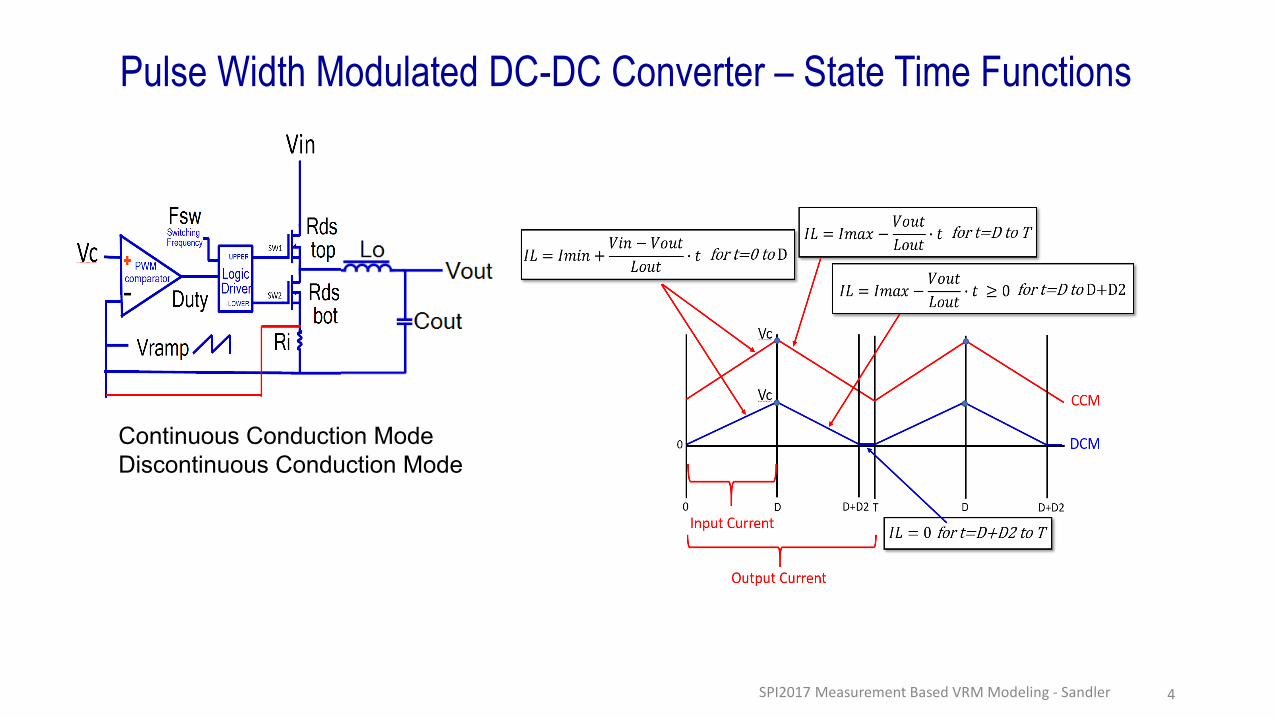
Pulse Width Modulated DC-DC Converter – State Time Functions
Continuous Conduction Mode
Discontinuous Conduction Mode
SPI2017 Measurement Based VRM Modeling - Sandler 5
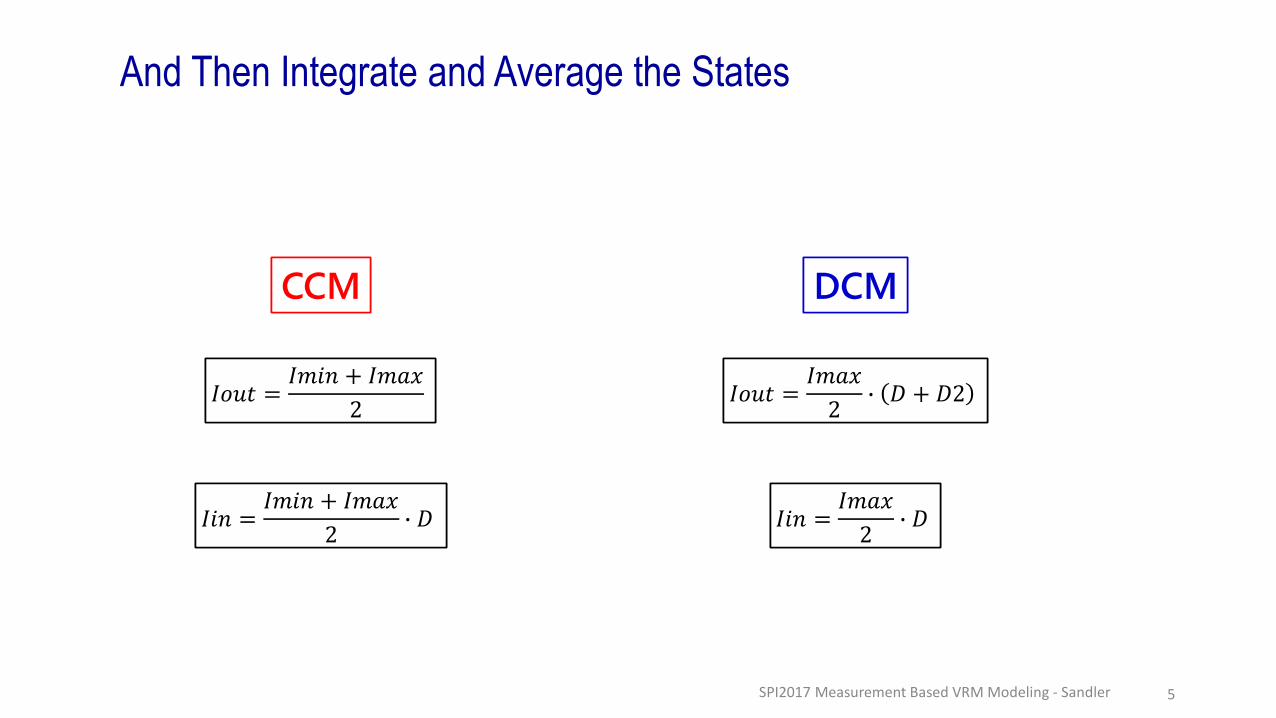
And Then Integrate and Average the States
𝐼𝑜𝑢𝑡 =𝐼𝑚𝑖𝑛 + 𝐼𝑚𝑎𝑥
2𝐼𝑜𝑢𝑡 =
𝐼𝑚𝑖𝑛 + 𝐼𝑚𝑎𝑥
2
𝐼𝑖𝑛 =𝐼𝑚𝑖𝑛 + 𝐼𝑚𝑎𝑥
2∙ 𝐷𝐼𝑖𝑛 =
𝐼𝑚𝑖𝑛 + 𝐼𝑚𝑎𝑥
2∙ 𝐷
CCMCCM DCMDCM
𝐼𝑖𝑛 =𝐼𝑚𝑎𝑥
2∙ 𝐷𝐼𝑖𝑛 =
𝐼𝑚𝑎𝑥
2∙ 𝐷
𝐼𝑜𝑢𝑡 =𝐼𝑚𝑎𝑥
2∙ 𝐷 + 𝐷2𝐼𝑜𝑢𝑡 =
𝐼𝑚𝑎𝑥
2∙ 𝐷 + 𝐷2
SPI2017 Measurement Based VRM Modeling - Sandler 6
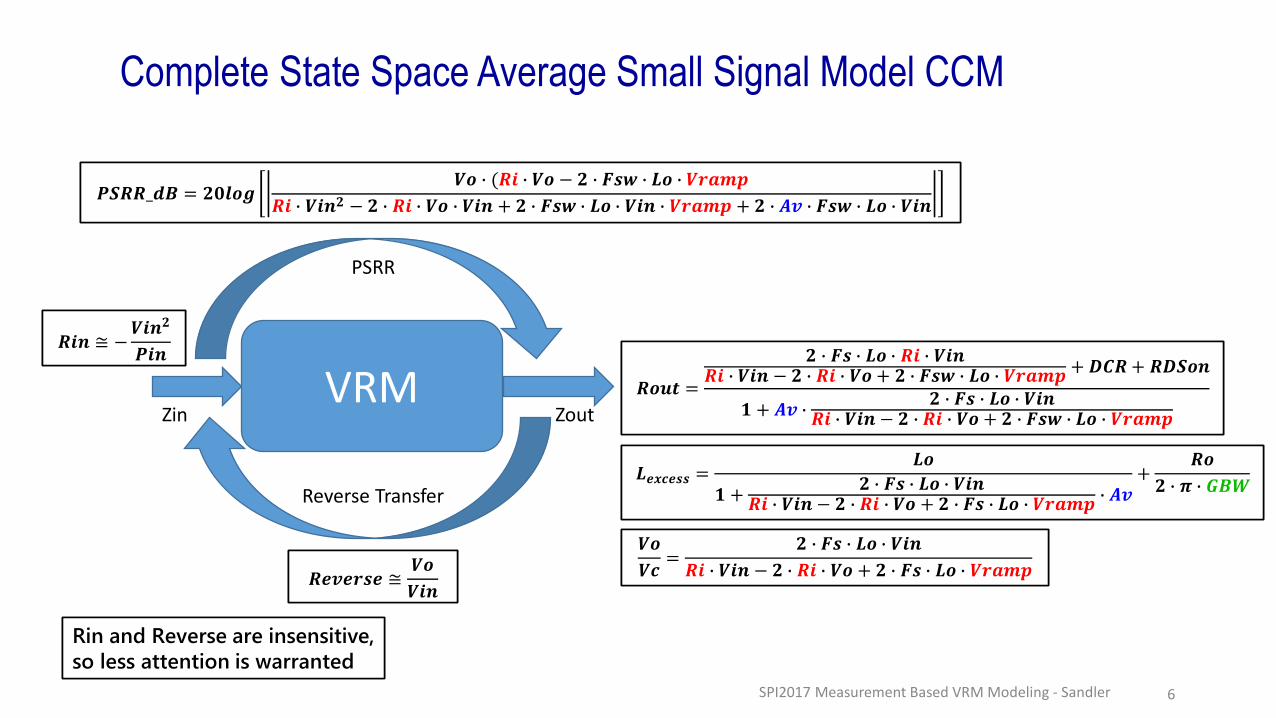
Complete State Space Average Small Signal Model CCM
VRM
Reverse Transfer
PSRR
Zin Zout
𝑷𝑺𝑹𝑹_𝒅𝑩 = 𝟐𝟎𝒍𝒐𝒈𝑽𝒐 ∙ (𝑹𝒊 ∙ 𝑽𝒐 − 𝟐 ∙ 𝑭𝒔𝒘 ∙ 𝑳𝒐 ∙ 𝑽𝒓𝒂𝒎𝒑
𝑹𝒊 ∙ 𝑽𝒊𝒏𝟐 − 𝟐 ∙ 𝑹𝒊 ∙ 𝑽𝒐 ∙ 𝑽𝒊𝒏 + 𝟐 ∙ 𝑭𝒔𝒘 ∙ 𝑳𝒐 ∙ 𝑽𝒊𝒏 ∙ 𝑽𝒓𝒂𝒎𝒑 + 𝟐 ∙ 𝑨𝒗 ∙ 𝑭𝒔𝒘 ∙ 𝑳𝒐 ∙ 𝑽𝒊𝒏𝑷𝑺𝑹𝑹_𝒅𝑩 = 𝟐𝟎𝒍𝒐𝒈
𝑽𝒐 ∙ (𝑹𝒊 ∙ 𝑽𝒐 − 𝟐 ∙ 𝑭𝒔𝒘 ∙ 𝑳𝒐 ∙ 𝑽𝒓𝒂𝒎𝒑
𝑹𝒊 ∙ 𝑽𝒊𝒏𝟐 − 𝟐 ∙ 𝑹𝒊 ∙ 𝑽𝒐 ∙ 𝑽𝒊𝒏 + 𝟐 ∙ 𝑭𝒔𝒘 ∙ 𝑳𝒐 ∙ 𝑽𝒊𝒏 ∙ 𝑽𝒓𝒂𝒎𝒑 + 𝟐 ∙ 𝑨𝒗 ∙ 𝑭𝒔𝒘 ∙ 𝑳𝒐 ∙ 𝑽𝒊𝒏
𝑹𝒐𝒖𝒕 =
𝟐 ∙ 𝑭𝒔 ∙ 𝑳𝒐 ∙ 𝑹𝒊 ∙ 𝑽𝒊𝒏𝑹𝒊 ∙ 𝑽𝒊𝒏 − 𝟐 ∙ 𝑹𝒊 ∙ 𝑽𝒐 + 𝟐 ∙ 𝑭𝒔𝒘 ∙ 𝑳𝒐 ∙ 𝑽𝒓𝒂𝒎𝒑 +𝑫𝑪𝑹+ 𝑹𝑫𝑺𝒐𝒏
𝟏 + 𝑨𝒗 ∙𝟐 ∙ 𝑭𝒔 ∙ 𝑳𝒐 ∙ 𝑽𝒊𝒏
𝑹𝒊 ∙ 𝑽𝒊𝒏 − 𝟐 ∙ 𝑹𝒊 ∙ 𝑽𝒐 + 𝟐 ∙ 𝑭𝒔𝒘 ∙ 𝑳𝒐 ∙ 𝑽𝒓𝒂𝒎𝒑
𝑹𝒐𝒖𝒕 =
𝟐 ∙ 𝑭𝒔 ∙ 𝑳𝒐 ∙ 𝑹𝒊 ∙ 𝑽𝒊𝒏𝑹𝒊 ∙ 𝑽𝒊𝒏 − 𝟐 ∙ 𝑹𝒊 ∙ 𝑽𝒐 + 𝟐 ∙ 𝑭𝒔𝒘 ∙ 𝑳𝒐 ∙ 𝑽𝒓𝒂𝒎𝒑 +𝑫𝑪𝑹+ 𝑹𝑫𝑺𝒐𝒏
𝟏 + 𝑨𝒗 ∙𝟐 ∙ 𝑭𝒔 ∙ 𝑳𝒐 ∙ 𝑽𝒊𝒏
𝑹𝒊 ∙ 𝑽𝒊𝒏 − 𝟐 ∙ 𝑹𝒊 ∙ 𝑽𝒐 + 𝟐 ∙ 𝑭𝒔𝒘 ∙ 𝑳𝒐 ∙ 𝑽𝒓𝒂𝒎𝒑
𝑹𝒆𝒗𝒆𝒓𝒔𝒆 ≅𝑽𝒐
𝑽𝒊𝒏𝑹𝒆𝒗𝒆𝒓𝒔𝒆 ≅
𝑽𝒐
𝑽𝒊𝒏
𝑹𝒊𝒏 ≅ −𝑽𝒊𝒏𝟐
𝑷𝒊𝒏𝑹𝒊𝒏 ≅ −
𝑽𝒊𝒏𝟐
𝑷𝒊𝒏
Rin and Reverse are insensitive,
so less attention is warranted
Rin and Reverse are insensitive,
so less attention is warranted
𝑳𝒆𝒙𝒄𝒆𝒔𝒔 =𝑳𝒐
𝟏 +𝟐 ∙ 𝑭𝒔 ∙ 𝑳𝒐 ∙ 𝑽𝒊𝒏
𝑹𝒊 ∙ 𝑽𝒊𝒏 − 𝟐 ∙ 𝑹𝒊 ∙ 𝑽𝒐 + 𝟐 ∙ 𝑭𝒔 ∙ 𝑳𝒐 ∙ 𝑽𝒓𝒂𝒎𝒑∙ 𝑨𝒗
+𝑹𝒐
𝟐 ∙ 𝝅 ∙ 𝑮𝑩𝑾𝑳𝒆𝒙𝒄𝒆𝒔𝒔 =
𝑳𝒐
𝟏 +𝟐 ∙ 𝑭𝒔 ∙ 𝑳𝒐 ∙ 𝑽𝒊𝒏
𝑹𝒊 ∙ 𝑽𝒊𝒏 − 𝟐 ∙ 𝑹𝒊 ∙ 𝑽𝒐 + 𝟐 ∙ 𝑭𝒔 ∙ 𝑳𝒐 ∙ 𝑽𝒓𝒂𝒎𝒑∙ 𝑨𝒗
+𝑹𝒐
𝟐 ∙ 𝝅 ∙ 𝑮𝑩𝑾
𝑽𝒐
𝑽𝒄=
𝟐 ∙ 𝑭𝒔 ∙ 𝑳𝒐 ∙ 𝑽𝒊𝒏
𝑹𝒊 ∙ 𝑽𝒊𝒏 − 𝟐 ∙ 𝑹𝒊 ∙ 𝑽𝒐 + 𝟐 ∙ 𝑭𝒔 ∙ 𝑳𝒐 ∙ 𝑽𝒓𝒂𝒎𝒑
𝑽𝒐
𝑽𝒄=
𝟐 ∙ 𝑭𝒔 ∙ 𝑳𝒐 ∙ 𝑽𝒊𝒏
𝑹𝒊 ∙ 𝑽𝒊𝒏 − 𝟐 ∙ 𝑹𝒊 ∙ 𝑽𝒐 + 𝟐 ∙ 𝑭𝒔 ∙ 𝑳𝒐 ∙ 𝑽𝒓𝒂𝒎𝒑
SPI2017 Measurement Based VRM Modeling - Sandler 7
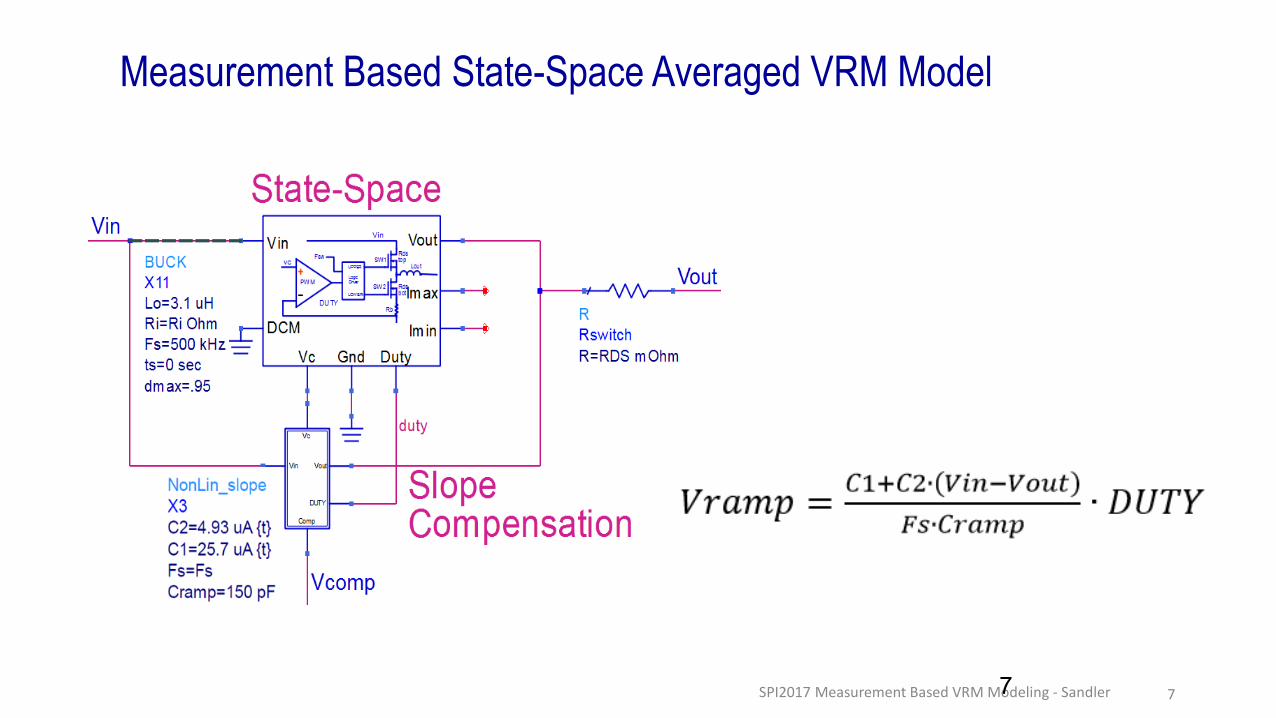
Measurement Based State-Space Averaged VRM Model
7
SPI2017 Measurement Based VRM Modeling - Sandler 8
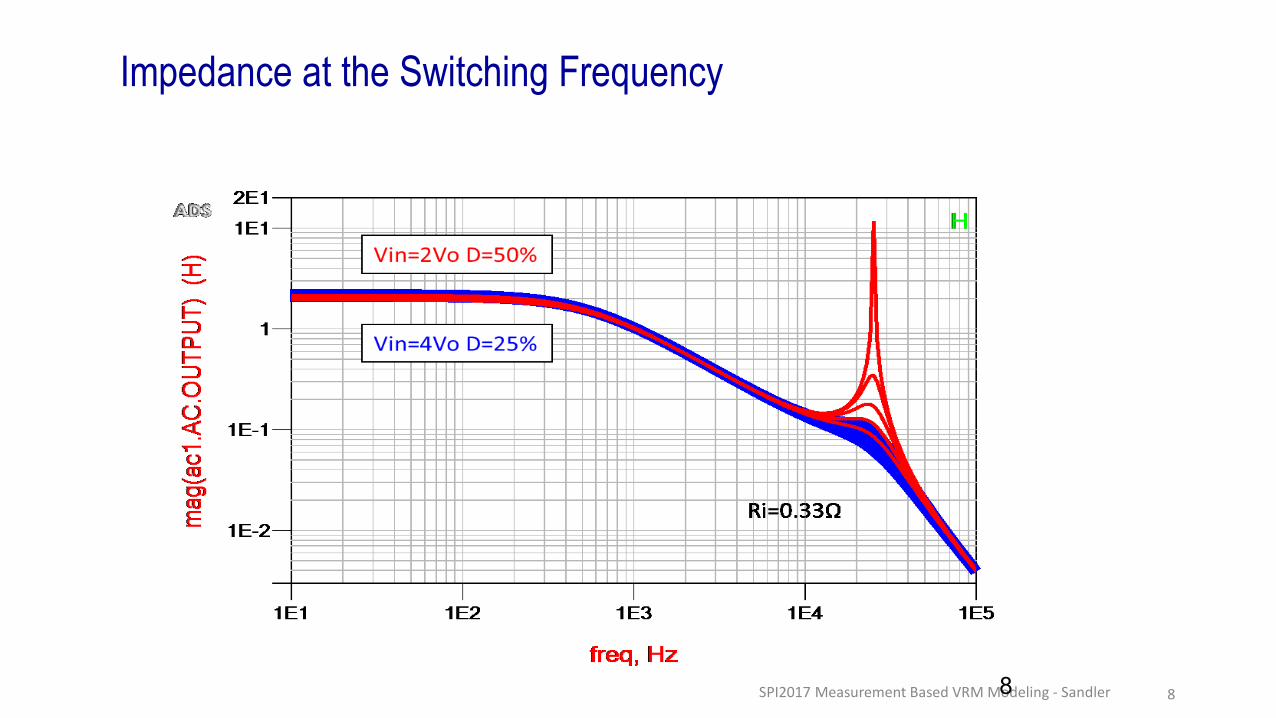
Impedance at the Switching Frequency
8
SPI2017 Measurement Based VRM Modeling - Sandler 9
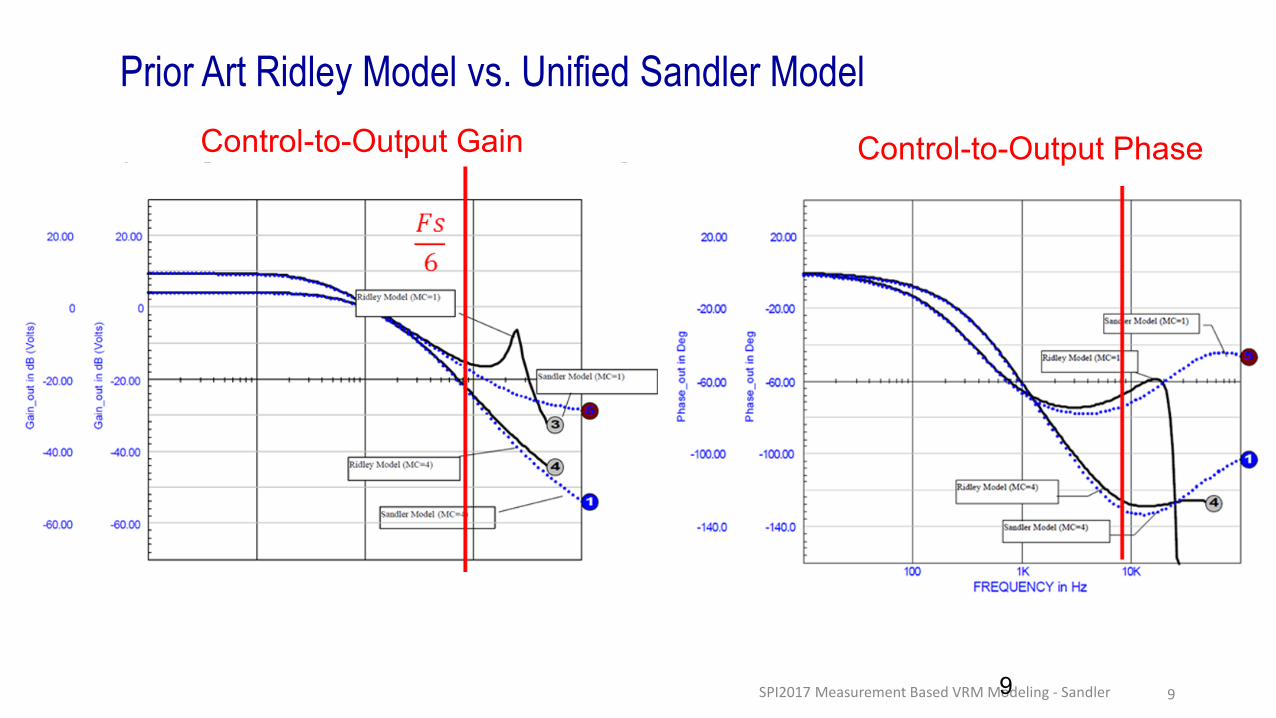
Prior Art Ridley Model vs. Unified Sandler Model
9
Control-to-Output Gain Control-to-Output Phase
SPI2017 Measurement Based VRM Modeling - Sandler 10
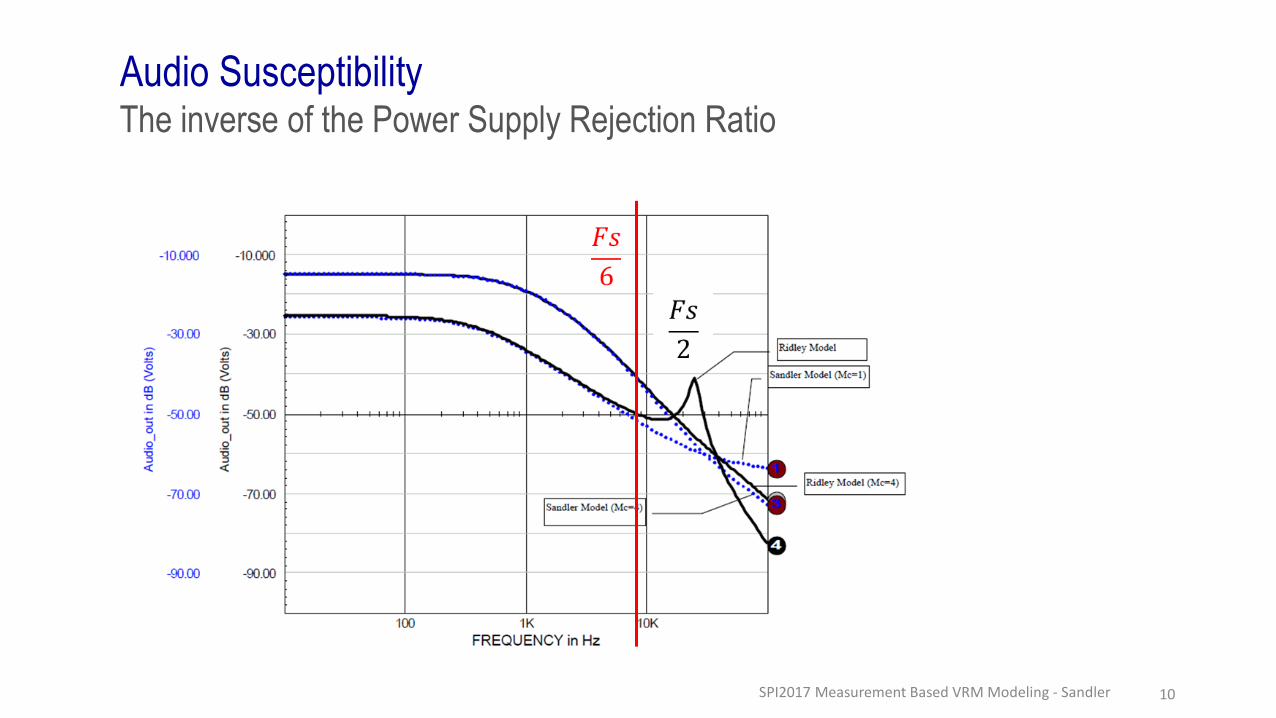
Audio SusceptibilityThe inverse of the Power Supply Rejection Ratio
SPI2017 Measurement Based VRM Modeling - Sandler 11
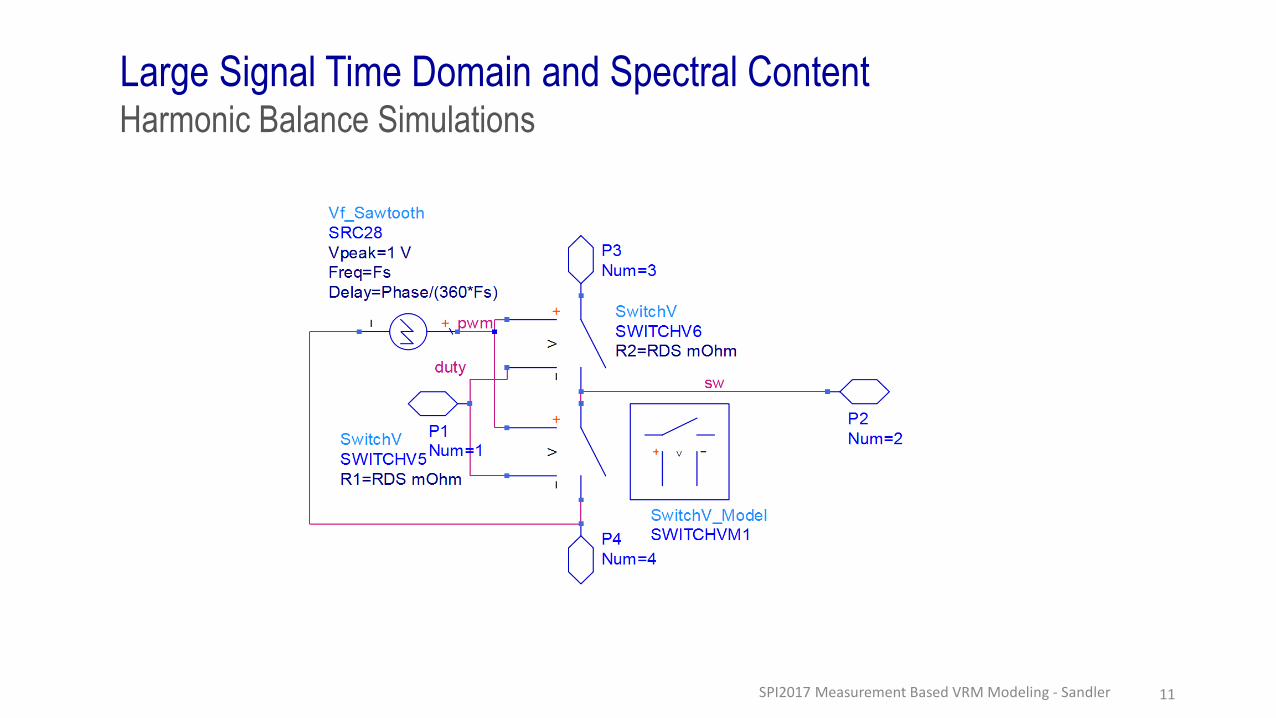
Large Signal Time Domain and Spectral ContentHarmonic Balance Simulations
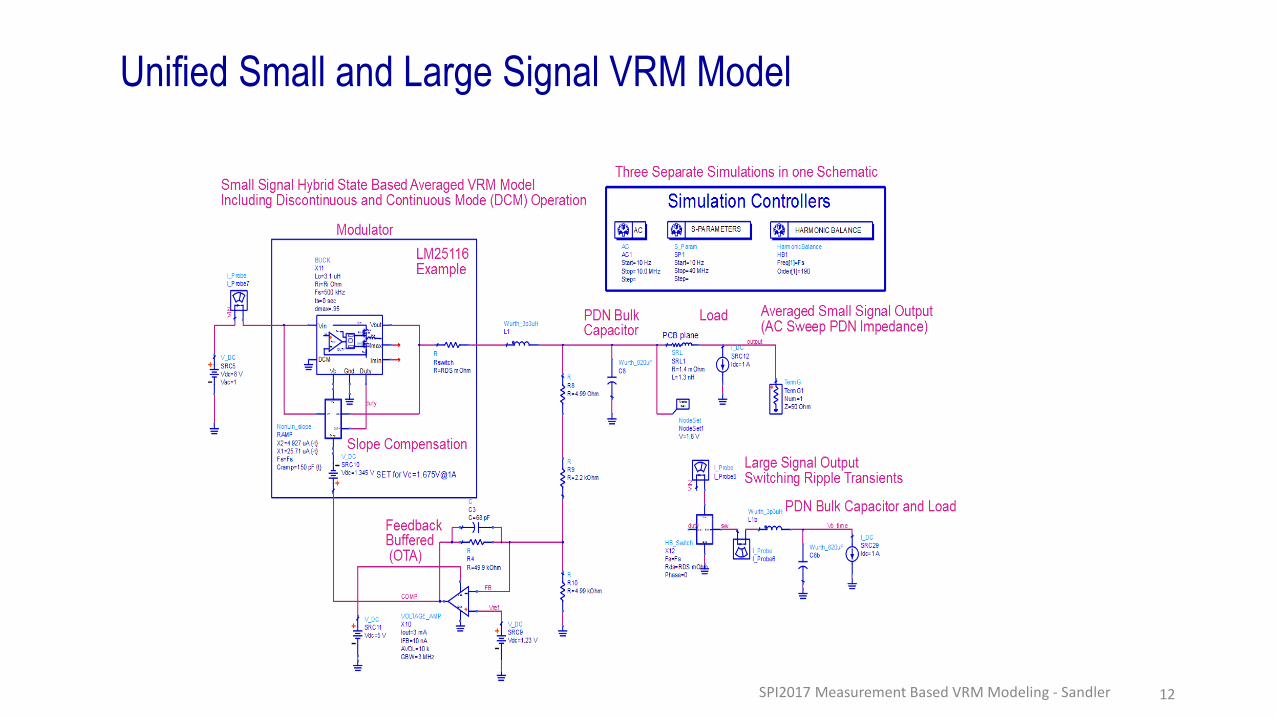
SPI2017 Measurement Based VRM Modeling - Sandler 12
Unified Small and Large Signal VRM Model
SPI2017 Measurement Based VRM Modeling - Sandler 13
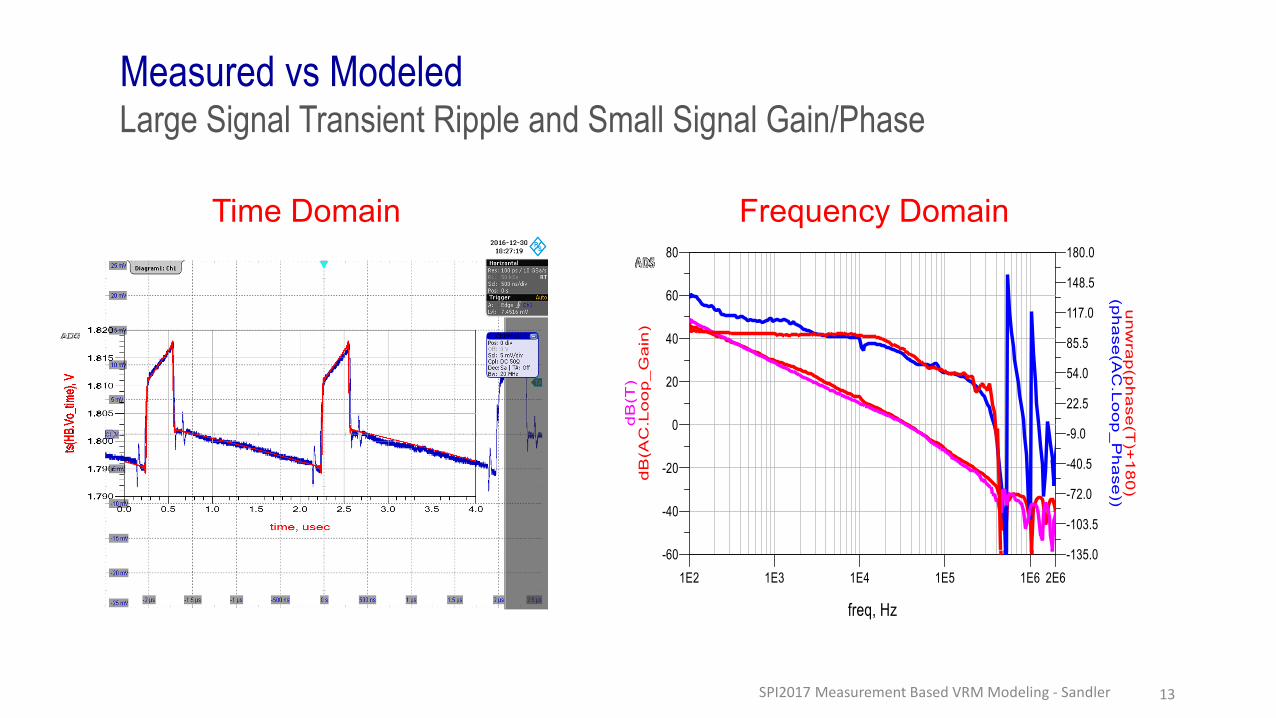
Measured vs ModeledLarge Signal Transient Ripple and Small Signal Gain/Phase
Time Domain Frequency Domain
SPI2017 Measurement Based VRM Modeling - Sandler 14
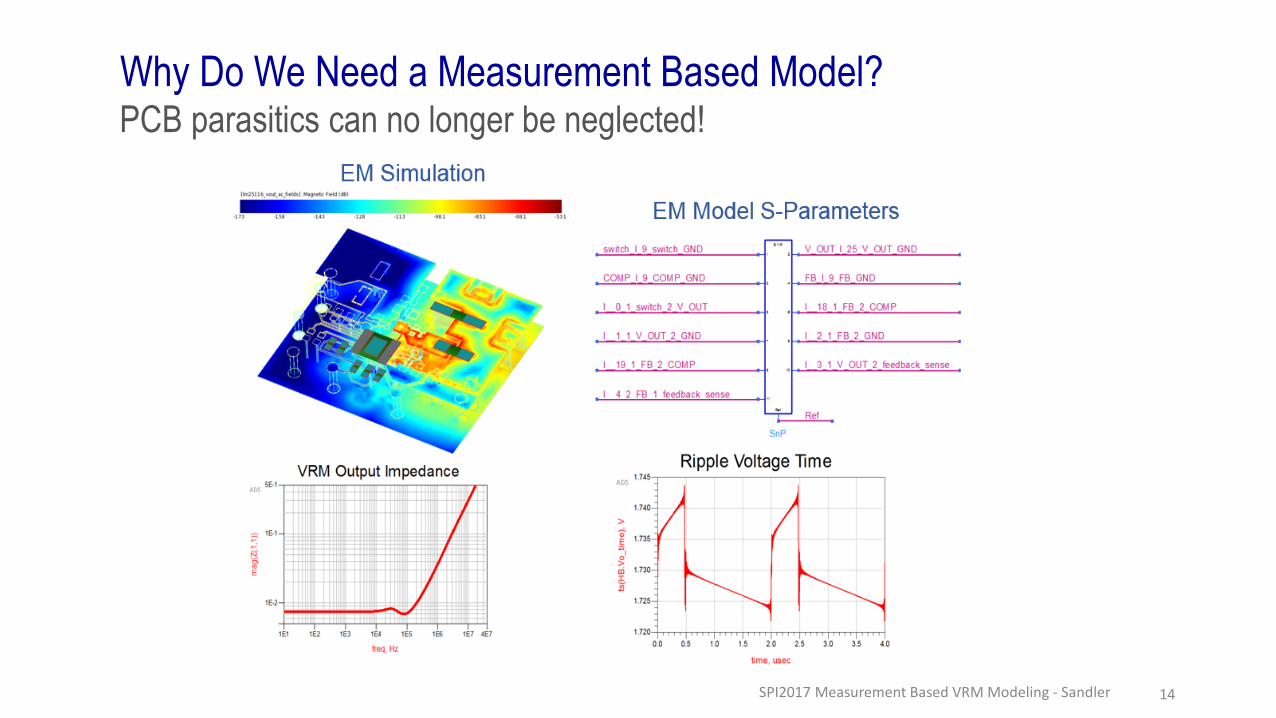
Why Do We Need a Measurement Based Model?PCB parasitics can no longer be neglected!
SPI2017 Measurement Based VRM Modeling - Sandler 15
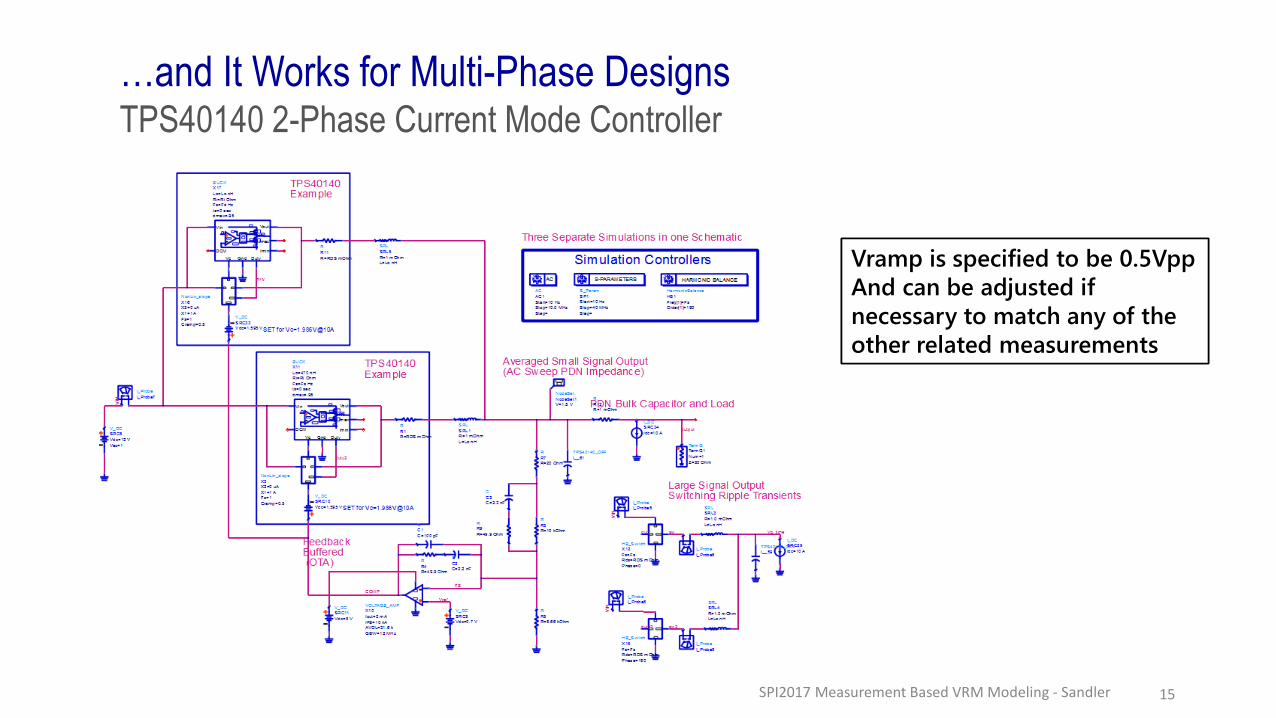
…and It Works for Multi-Phase DesignsTPS40140 2-Phase Current Mode Controller
Vramp is specified to be 0.5Vpp
And can be adjusted if
necessary to match any of the
other related measurements
Vramp is specified to be 0.5Vpp
And can be adjusted if
necessary to match any of the
other related measurements
SPI2017 Measurement Based VRM Modeling - Sandler 16
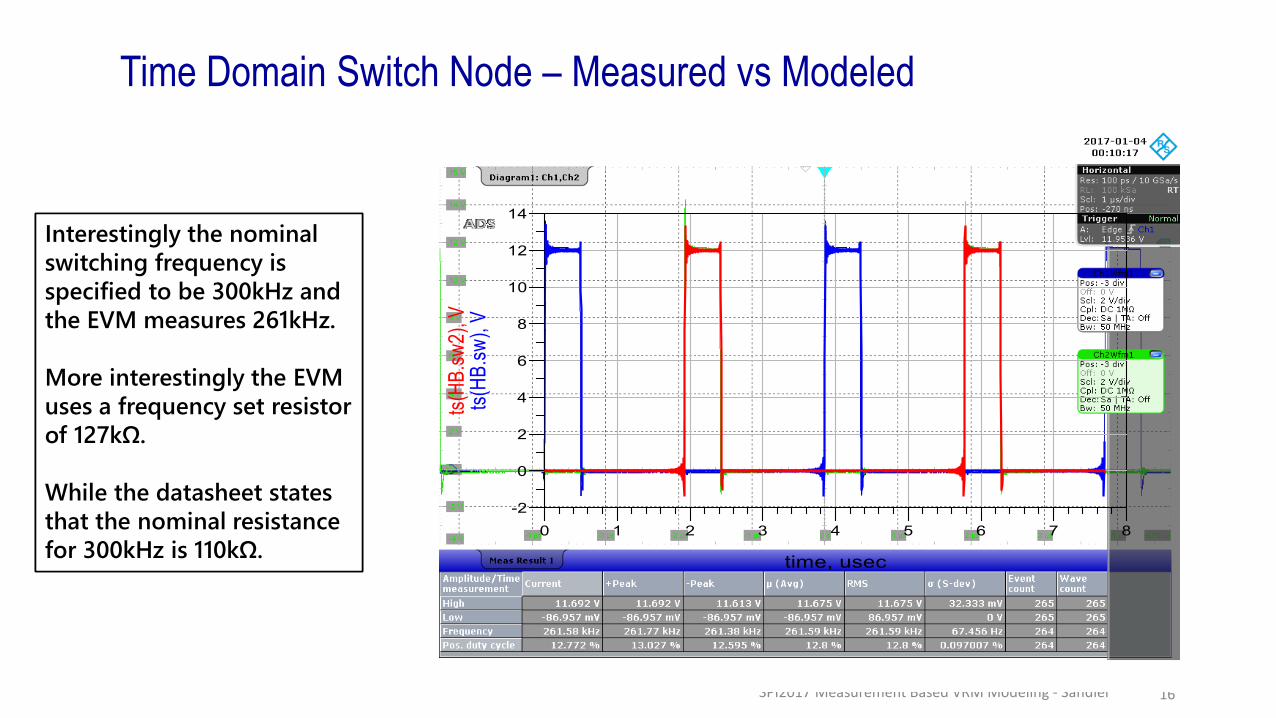
Time Domain Switch Node – Measured vs Modeled
Interestingly the nominal
switching frequency is
specified to be 300kHz and
the EVM measures 261kHz.
More interestingly the EVM
uses a frequency set resistor
of 127kΩ.
While the datasheet states
that the nominal resistance
for 300kHz is 110kΩ.
Interestingly the nominal
switching frequency is
specified to be 300kHz and
the EVM measures 261kHz.
More interestingly the EVM
uses a frequency set resistor
of 127kΩ.
While the datasheet states
that the nominal resistance
for 300kHz is 110kΩ.
SPI2017 Measurement Based VRM Modeling - Sandler 17
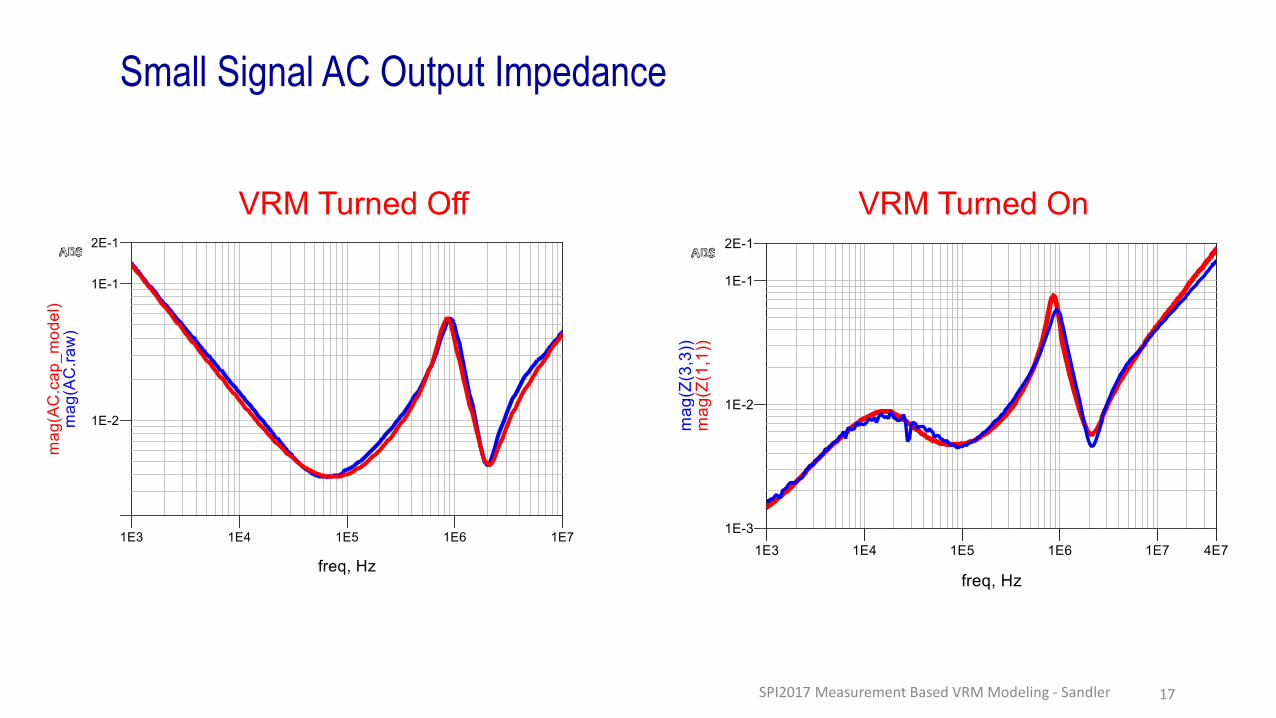
Small Signal AC Output Impedance
VRM Turned Off VRM Turned On
SPI2017 Measurement Based VRM Modeling - Sandler 18
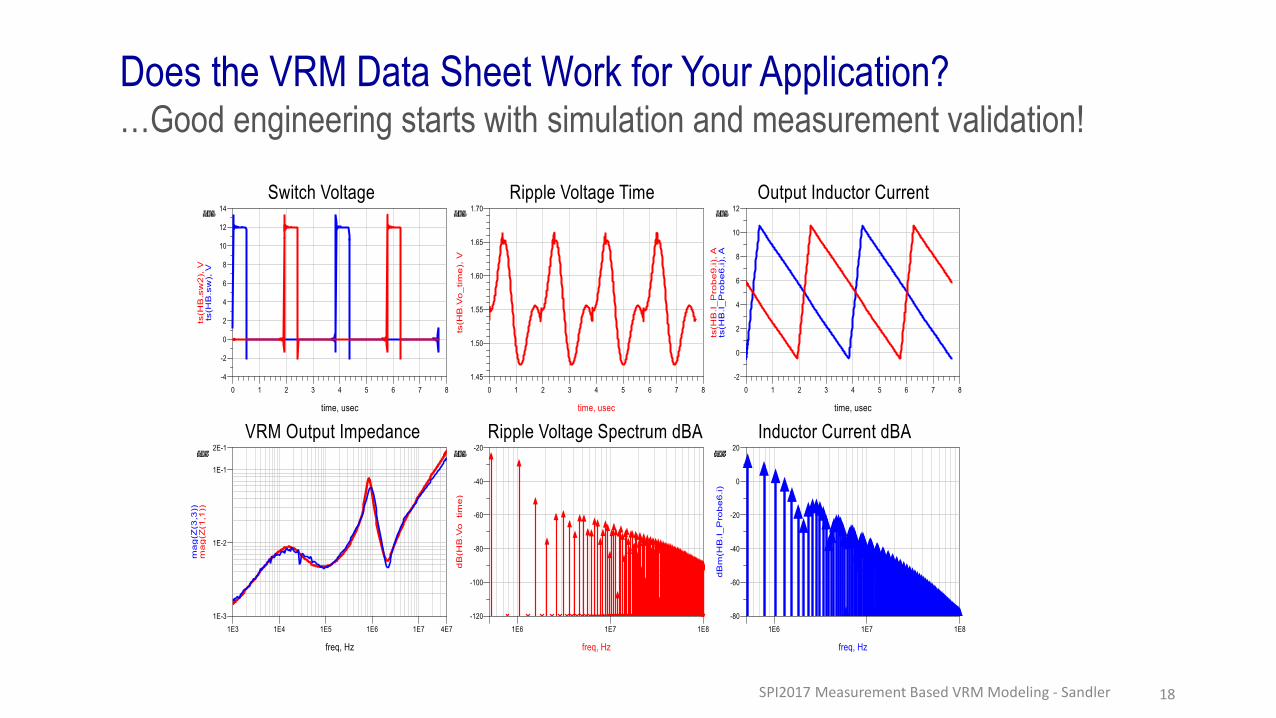
Does the VRM Data Sheet Work for Your Application?…Good engineering starts with simulation and measurement validation!
SPI2017 Measurement Based VRM Modeling - Sandler 19
Conclusion
–Demonstration of a measurement based VRM model for small
signal and large signal.
– Fast simulation results for AC, DC, time domain, and spectral
analysis
–Works with DCM and CCM voltage and current mode control
VRMs
–Verified with the well-established Ridley model in simulation for
desired operation
–Measurement validated with commercially available DC-DC
converters
SPI2017 Measurement Based VRM Modeling - Sandler 20
Thank You,
Ciao