Embed Size (px)
Citation preview

“main” — 2011/7/25 — 18:14 — page 99 — #1
Revista Brasileira de Geofısica (2011) 29(1): 99-111© 2011 Sociedade Brasileira de GeofısicaISSN 0102-261Xwww.scielo.br/rbg
MAPPING IRON-MINERALIZED LATERITE ENVIRONMENTS BASED ON TEXTURALATTRIBUTES FROM MAPSAR IMAGE SIMULATION – SAR-R99B
(SIVAM/SIPAM) IN THE AMAZON REGION
Maria Carolina de Morais1, Paulo Pereira Martins Junior1,2 and Waldir Renato Paradella3
Recebido em 30 abril, 2009 / Aceito em 7 abril, 2011Received on April 30, 2009 / Accepted on April 7, 2011
ABSTRACT. The use of remote sensing is a valuable method for geological mapping as it provides synoptic coverage at relatively low cost. In the Amazon region, radar
imagery has a potential for geological applications due the enhanced sensitivity to topography (macrotopography), surface roughness (microtopography), and dielectric
properties of materials, independent of weather, sun angle, and illumination conditions. As the roughness is highlighted, SAR textural attributes can be used for mapping
iron-ore mineralized laterites in N1 deposit, located in the Carajas Province. For mapping the lateritic cover, the airborne SAR was used from Surveillance of the Amazon
System (SIVAM/SIPAM, L-hh, L-hv, L-vv) to simulate orbital Multi-Application Purpose SAR (MAPSAR). The images were analyzed through textural classifications
derived from second-order measure (GLCM) with the objective of mapping the mineralized laterites for iron ore. Differences are highlighted when comparing the
classified maps and the ground information. Not all classes were separated, but a high performance for textural attributes was presented by the hematite class. This class
was sensitive to the sensor and target parameters, especially macrotopography and physics characteristics. The results showed that for mineral exploration, the radar
images at L-band can be used as a practical tool for a preliminary mapping, and as a guide for field-based verification.
Keywords: Amazonia, SAR, MAPSAR, textural attribute, laterite cover, SIVAM/SIPAM, L-hh, L-hv, L-vv.
RESUMO. Imagens de radar sao uteis em geologia devido a visao sinoptica e a uma cobertura a um custo relativamente baixo. Particularmente na regiao amazonica, o
uso de imagens de radar em aplicacoes geologicas e favorecido pela capacidade de realce do relevo (macrotopografia), da rugosidade superficial (microtopografia) e da
constante dieletrica, independente da presenca de nuvens, angulo solar e condicoes de iluminacao. A microtopografia do terreno, realcada neste tipo de imagem, permite
que a textura das imagens de radar possa ser usada no mapeamento das coberturas laterıticas mineralizadas em ferro do deposito N1, localizado na Provıncia de Carajas.
A investigacao se baseou em imagens adquiridas por radar aerotransportado (SIVAM/SIPAM, banda L-hh, L-hv e L-vv), cujas faixas de voo foram degradadas visando a
simulacao do SAR orbital MAPSAR. Os dados foram analisados atraves de classificacoes texturais, derivadas de medidas obtidas por meio de Matriz de Co-ocorrencia
dos Nıveis de Cinza (MCNC) com o objetivo de mapeamento das unidades laterıticas em N1. Muitas diferencas foram encontradas entre as classes mapeadas e o mapa
de verdade terrestre. Nem todas as classes foram separadas, mas a hematita apresentou alto desempenho na classificac ao. Esta classe foi sensıvel aos parametros do
alvo e do sensor, especialmente a macrotopografia e as caracterısticas fısicas. Os resultados mostraram que a classificacao baseada em MCNC pode ser usada como
ferramenta preliminar de mapeamento das lateritas e como um guia para verificacao de campo.
Palavras-chave: Amazonia, Radar de Abertura Sintetica, MAPSAR, atributo textural, cobertura laterıtica, SIVAM/SIPAM, L-hh, L-hv, L-vv.
1Federal University of Ouro Preto (UFOP), School of Mines, Department of Geology (DEGEO), Campus Universitario Morro do Cruzeiro, s/n, Bauxita, 35400-000 Ouro
Preto, MG, Brazil. Phone/Fax: +55 (31) 3559-1601 – E-mail: [email protected] Gerais Technological Center Foundation (CETEC), Water Resources Sector (SAA), Av. Jose Candido da Silveira, 2000, Horto, 31170-000 Belo Horizonte, MG,
Brazil. Phone/Fax: +55 (31) 3489-2250; Fax: +55 (31) 3489-2227 – E-mail: [email protected] Institute for Space Research (INPE), Remote Sensing Division (DSR), Av. dos Astronautas, 1758, 12227-010 Sao Jose dos Campos, SP, Brazil. Phone/
Fax: +55 (12) 3945-6438 / +55 (12) 3945-6400 – E-mail: [email protected]

“main” — 2011/7/25 — 18:14 — page 100 — #2
100 MAPPING IRON-MINERALIZED LATERITE ENVIRONMENTS
INTRODUCTION
The Carajas Mineral Province is located on the easternmost bor-der of the Amazon region. It is one of most important mine-ral provinces in the world, with a predominating iron produc-tion and enormous potentials for Mn, Cu, Au, Ni, U, Ag, Pd, Pt,Os, and others (Lobato et al., 2005). This mineral province areais on a mountainous terrain with altitudes higher than 900 m,surrounded by southern and northern lowlands with altitudesaround 150-200 m with thick oxisols (“latosols”) as a result ofdeep chemical weathering and with few rocks outcrops. The vege-tation cover is typical of the Equatorial forest with complex, mul-tilevel canopies and numerous species (Paradella et al., 1994).
Since 1967, when the iron deposits were discovered, a re-markable geobotanical contrast given by the iron-mineralizedlaterites and specific vegetation types has been recognized. Thedeposits are related to a set of plateaux covered by thick hardiron-rich crusts developed over volcanic rocks and ironstones.A specific low-density campos rupestres vegetation (Silva et al.,1986) is associated with the deposits, and shows a strong con-trast with the dense equatorial forest. This contrast was detectablethrough radar airborne C-band imageries during the SAREX’92(South American Radar Experiment’92) campaigns (Morais et al.,2002). The province was almost completely covered during theSAREX’92 campaign in preparation for ERS-2 and RADARSAT-1 launches. Details of the SAREX’92 can be found in Woodinget al. (1993).
In the Amazon region, C-band backscatter intensity is stron-gly controlled by decameter scale changes in the surface slope,and by centimeter scale roughness characteristics of the crownscattering, including multiple scattering within the crowns. Thepreliminary evaluation, by textural classifications, of this SAR datahas shown that the backscattered C-band responses are sensitiveto this geobotanical contrast in depicting variations in the duri-crust vegetation associations (Morais et al., 2002).
Due to the economic importance of this area, there is apractical need to provide accurate and up-to-date surface mapsto support mineral exploration and environmental programs.The province has been extensively covered by various airborne(RADAMBRASIL, INTERA, SAREX) and spaceborne SAR (ERS-1,JERS-1, RADARSAT-1) surveys. These data have played an im-portant role in the acquisition of geological information in theCarajas Province (Paradella et al., 1997, 2000). In addition,with SAR system satellites (ALOS/PALSAR and RADARSAT-2)having new characteristics (resolution, polarization, incidence,wavelength) the practical utility of textural SAR classification formapping remains to be demonstrated.
The Brazilian-German MAPSAR (Multi-Application PurposeSAR) is a proposal for an innovative L-band sensor whose mainmission is to assess and monitor natural resources. The MAP-SAR mission is a small spaceborne SAR conceived by Brazilian-German scientific and technical cooperation between INPE(Instituto Nacional de Pesquisas Espaciais ) and DLR (DeutschenZentrums fur Luft- und Raumfahrt ) (Schroder et al., 2005). Evenbefore its lauching, imagery simulation was an important aspectfor the potential-use investigation of SAR. Thus, before its laun-ching, the simulation of MAPSAR imagery is now performed byusing images provided by the airborne SAR L-Band sensor, theR99 of the SIVAM/SIPAM (Surveillance of the Amazon System)(Schroder et al., 2005). In this stage, a set of test sites was se-lected covering fields like Agriculture, Forestry, Geology and Mi-neral Exploration, Disaster Management, Coastal Zone Studies,Geomorphology, Hydrology and Environmental Analysis.
The images of the Carajas Mineral Province were acquired onJune 2005 as part of this campaign. The area was covered in June2005 by an airborne SAR-R99B with adapted processing and si-mulation techniques to simulate the expected MAPSAR imageryproducts. Since the lateritic compositions play an important rolein the expression of the macro and micro topographical rough-ness, it was considered worthwhile to evaluate the SAR textureobtained from MAPSAR L-band on lateritic crust.
The main objective was mapping iron ore laterites from the N1Deposit in Carajas Mineral Province through MAPSAR imagerysimulation. The research used the L-band with the expectationthat this proposed approach could be used as a tool for mappingother similar areas.
STUDY AREA
The N1 is an iron-ore deposit located in the Carajas Mineral Pro-vince, on the easternmost border of the Amazon region (Fig. 1).The total ore resources for the Carajas Province are estimated tobe 17.8 billion tons having a 66.1% iron concentration (Beisiegelet al., 1973). The N1 deposit is a plateau with altitudes of around700 m and an approximate area of 24 km2.
The N1 deposit is related to rocks of the Grao Para Group,displaying complex patterns of folding and faulting. The GraoPara Group has been subdivided into two units: volcanic rocks ofthe Parauapebas Formation (Meirelles et al., 1984), and the iron-stones of the Carajas Formation (Beisiegel et al., 1973). The vol-canic rocks are a bimodal sequence of basalts, dolerites andrhyolites. The ironstones of the Carajas Formation are compo-sed of several types of iron ore of various oxide facies. Theyare mainly jaspilite and interlayered hematite and silica (Tolbert
Revista Brasileira de Geofısica, Vol. 29(1), 2011
“main” — 2011/7/25 — 18:14 — page 101 — #3
MORAIS MC, MARTINS JUNIOR PP & PARADELLA WR 101
Figure 1 – Location map of N1 deposit.
et al., 1971), which are either of soft or hard hematite (Lobatoet al., 2005). The jaspilites have variable compositions with17.11-43.40% Fe and 35.10-60.84% SiO2 presenting typicalinterlayering of dark and light centimetre-thick mesobands andmicrobanding with iron-oxide layers intercalated with white topale or bright red layers composed of crypto to microcrystallineSiO2 (jasper and chert) with inclusions of cryptocrystalline hema-tite (Tolbert et al., 1971; Beisiegel et al., 1973).
Under the humid tropical climate of the Amazon region, fer-ruginous and latosoils are extensively developed in the plateau.These weathered products show varying degrees of alteration thatare responsible for the differences in composition, hardness andtextures. The N1 area was mapped during the economic evalu-ation of the iron reserves in the province (Resende & Barbosa,1972). The following types of ferruginous crusts were identifiedin the area: duricrust (in situ duricrust with limonite blocks), che-mical crust (hematite fragments with goethitic pisolites), iron-oreduricrust (hematite ore blocks and subordinately specularite, ce-mented with hydrous ferric oxides), and hematite (mainly hematiteoutcrops). In addition, a latosoil unit was also mapped in a res-tricted area, associated with arboreal vegetation. The surface mapof the plateau is seen in Figure 2.
Situated on rock outcrops N1 vegetation has a typical aspectof the tropical scrubs called campos rupestres (Silva et al., 1986).
It is predominantly composed of herbs and arboreal plants typeswith less development of the semi-arboreal type. Semi-arborealecosystems are common in restrict lands; others areas have arbo-real species strictly found in latosoil. Gramineae and Legumino-sae plant families have a large geographic distribution. A geobo-tanical control is evident in N1 ferruginous area showing relationsbetween vegetation and relief that support the crusts (Silva et al.,1986). As seen in Figure 3, on the top of the hills with many rockoutcrops a layer of soil is very restricted and plant species are ofshort types. Coming down the hills it is common to see some soiland organic matter, which permit the development of plant speciesof higher sizes in fissures over the crusts. On the basis of the hillsthe flora attains its maximum development with a major growth ofspecies. Many lakes are covered by a vegetation of the Typha sp.type regionally known as “taboa”, where outcrops of the crusts areexposed during the dry seasons.
DATASET
The research was based on airborne SAR imagery obtained fromthe Amazon Surveillance System (SIVAM/SIPAM, L-hh, L-hv,L-vv) aiming for the simulation of orbital Multi-Application Pur-pose SAR (MAPSAR) used for the assessment and monitoring ofnatural resource applications in the Amazon region. The charac-teristics of SAR-R99B data are shown in Table 1.
Brazilian Journal of Geophysics, Vol. 29(1), 2011

“main” — 2011/7/25 — 18:14 — page 102 — #4
102 MAPPING IRON-MINERALIZED LATERITE ENVIRONMENTS
Figure 2 – Surface-Cover Map from N1 plateau adapted from Resende & Barbosa (1972).
Table 1 – SAR-R99B characteristics.
Parameter Specification
Platform EMB-145
Band L
Polarization hh, hv, vv
Acquisition Date June 2005
Incident Angle (deg) 48/53◦
Spatial Resolution (m) 11 × 11
Image Format 8-bits
Illumination Geometry Look Azimuth: 282◦
METHODOLOGY
The research was based statistical approach known as Grey Le-vel Co-occurrence Matrix (GLCM) proposed by Haralick (1979).Grey tone spatial dependence approach characterises textureby the spatial relationships among grey tones in a local area.Grey tone co-occurrence can be specified in a matrix of relativefrequencies Pi j in which two neighbouring resolution cells se-parated by distance d occur on the image, one with grey tonei and the other with grey tone j . Such matrices of spatial greytone dependence frequencies are symmetric and are a function
of the angular relationship between the neighbouring resolutioncells as well as a function of the distance between them (Hara-lick, 1979). Several statistical parameters can be extracted fromthe GLCM, which can be used as input data in an automatic clas-sification process. Weska et al. (1976), and Welch et al. (1990)consider a class of local properties based on absolute differen-ces between pairs of grey levels. The Grey Level Difference Vector(GLDV) is based on absolute differences between pairs of greylevels i and j at a distance d and at a angle θ .
The textural analysis based on GLCM is a common techniquewhich proved to be effective in earlier studies, e.g. Shanmugan etal. (1981), Ulaby et al. (1986), Yanasse et al. (1993), Baraldi &Parmiggiani (1995), and Kurvonen & Hallikainen (1999), but fewexamples have focused on the geological applications in tropicalenvironments (Azzibrouck et al., 1997).
The investigation was based on textural descriptors extrac-ted from the GLCM and GLDV used as input for an unsupervisedclassification scheme. Some of these parameters are related tospecific first-order statistical concepts, such as contrast and vari-ance, with clear textural meaning (pixel pair repetition rate, spatialfrequencies detection, etc.), while other parameters contain tex-
Revista Brasileira de Geofısica, Vol. 29(1), 2011

“main” — 2011/7/25 — 18:14 — page 103 — #5
MORAIS MC, MARTINS JUNIOR PP & PARADELLA WR 103
Figure 3 – Vegetation changing × relief on N1 plateau.
tural information associated with more than one specific texturalmeaning (Baraldi & Parmiggiani, 1995).
No speckle filtering was applied to the images in order tokeep the original texture of SAR scenes. Representative samplesof nine classes were chosen, on the basis of field observationsand the mapped surface: C1 = Latosoil, C2 = Soil (anthro-pogenic effects), C3 = Duricrust (chemical), C4 = Duricrust,C5 = Iron-ore duricrust (with shadow), C6 = Iron-ore duri-crust, C7 = Hematite (with shadow), C8 = Hematite, and C9= Lake. The inclusion of some classes with shadow-effectswas necessary since shadow effects were pronounced on theSAR images. Based on these samples, second-order measuresderived from GLCM (mean, homogeneity, contrast, dissimila-rity, entropy, energy, correlation) and from Grey-Level DifferenceVector-GLDV (energy, entropy, mean, contrast) were analyzed.The second-order measures were computed with nine configu-rations of distance (d), i.e., (–2.0), (–2.1), (–2.2), (–1.2), (0.2),
(1.2), (2.2), (2.1), and (2.0). Since 82 measures were made, it be-came impracticable to use such a large number of configurationsin the classification.
Therefore, texture measure selection was based on the Dis-criminant Factor decision rule that evaluates the separability be-tween classes which details of method can be found in (Renno etal., 1998). Thus, for two hypothetical classes A and B, and onetexture measure k, the Discriminant Factor was computed accor-ding to the variation between and within these classes, given byEquation (1):
DFAB,k =
n A ∙n A∑
i=1
(X Ai,k − X B,k
)2 + nB ∙nB∑
i=1
(X Bi,k − X A,k
)2
n A ∙n A∑
i=1
(X Ai,k − X A,k
)2 + nB ∙nB∑
i=1
(X Bi,k − X B,k
)2(1)
where Xωi,k is the i th sample of class ω for the measure k,Xω,k is the mean value of measure k class ω, and nω is thenumber of samples of class ω.
Brazilian Journal of Geophysics, Vol. 29(1), 2011

“main” — 2011/7/25 — 18:14 — page 104 — #6
104 MAPPING IRON-MINERALIZED LATERITE ENVIRONMENTS
According Equation (1), the texture measure chosen to sep-arate classes A and B is one that selects the highest value ofDFAB for all k, indicating the best separateness for these clas-ses. DFAB,k values near one denote that there is confusionbetween classes A and B for the texture measure k. Thus, foreach pair of nine N1 classes, the best set of measures were se-lected by the criteria described above, using only high DF, whichgave (visually) a good performance for classification.
The next step was to generate selected textural channelsusing texture analysis. For a better control of the grey levels, thetextural channels were processed with 32-bits. A 7×7 windowpixel cell size was selected in order to maintain GLCM sensiti-vity to the smallest details of the targets while reducing both noiseeffects. An unsupervised ISODATA classifier (Mather, 1987) wasused for the classification. The classifications were based on thebest sets of texture measures for each polarization isolated (hh, hv,and vv) and combined (hh and hv; hh and vv; hv and vv; hh, hv,and vv). In order to refine the results, a post-classification Modefilter algorithm was also applied.
The classification results were analyzed through a confusionmatrix to estimate the amount of correctly and incorrectly classi-fied pixels for each class. The method used to evaluate its accu-racy was the kappa coefficient of agreement (Foody, 1992), whichwas evaluated through test samples extracted from the Surface-Cover Map (see Fig. 2). On each classified map, 48 points wererandomly allocated for two classes: hematite and no hematite. Thestatistic test used to evaluate the significant differences betweenthe two classifications is given by Equation (2). All tests for thesignificant difference between classification results were carriedout at a 95% confidence level. At this level, two results maybe considered significantly different if 1k >1.96 (Benson &DeGloria, 1985).
1k =
∣∣k1 − k2
∣∣
√σ 2
∞
[k1
]+ σ 2
∞
[k2
] , (2)
where k kappa and σ 2∞
[k]
is the variance kappa.In the radar images, small-scale surface roughness refers to
microrelief that may modulate the radar return in flat terrain. Theroughness varies with radar wavelengths, incidence angle, andthe topography. The roughness may closely relate to underlyinggeological substrate and may also be caused by weathering pro-cesses, by soil composition, or vegetation associations (Werle,1988).
The roughness is a very important target parameter that influ-ences the performance of the textural classification, and rough-ness measurements were also collected at 73 representative si-
tes of the main classes. Surface roughness is generally difficultto measure accurately in the field, but the in situ measurementswere considered a first approximation to categorise lateritic crustsas smooth, intermediate, or rough. The height values from eachunit were obtained, in RMS (root mean square) values, by inser-ting a thin plate into the surface (Fig. 4) photographing it, anddigitising the profile. The roughness classification was based onthe criterion proposed by (Peake & Oliver, 1971) calculated forlocal incident angles at L-band wavelength.
RESULTS
For each SAR configuration, Table 2 shows the best selectedtextural measures used in the classifications with distances d(distance in pixels at considered direction for measures relatedto GLCM). The mean and GLDV contrast measures were sensiti-ve for all data.
Table 2 – Best selected textural measures with the d dis-tances for each SAR configuration used in the classification.
SAR data Measures d
L-hh
Mean –2.1
Dissimilarity 1.2
GLDV contrast 1.2
GLDV energy 2.1
L-hv
Mean 1.2
Contrast –2.1
GLDV contrast 2.2
Entropy –2.2
L-vv
Mean –1.2
Entropy –2.0
Homogeneity 1.2
GLDV contrast –2.1
The set of selected measures was used as input for the un-supervised classification with hh, hv, vv – L bands and theircombinations, hh and hv; hh and vv; hv and vv; hh, hv and vv.The best textural classification for L-band is shown in Figure 5(hh and vv). The results indicate that not all classes were discrim-inated on SAR-R99B images when compared with the Surface-Cover Map (see Fig. 2). The latosoil, duricrust (chemical), ironore duricrust, and lake were not classified. Backscattered L-bandresponses are no sensitive to these classes. For latosoil thevolume scattering effect was predominant, since response wasaffected by forest canopy over the terrain.
L-band is very sensitive to small-scales variations in surfaceroughness and the backscatter is affected by the terrain belowa vegetation canopy (Tapley, 2002). The dielectric properties ofsurface materials can also influence on radar return signal. A very
Revista Brasileira de Geofısica, Vol. 29(1), 2011

“main” — 2011/7/25 — 18:14 — page 105 — #7
MORAIS MC, MARTINS JUNIOR PP & PARADELLA WR 105
Figure 4 – Plate on the lateritic cover (120cm length × 40cm height).
low dielectric constant in dry environments allows longer radarwavelengths to penetrate to greater depth (Werle, 1988). Lateri-tic crusts have capability to retain high water volume on the rainyseasons, but the area was affected by the strong drought, whichoccurred in the Amazon region, from November 2004 to the endof 2005 (Marengo et al., 2008).
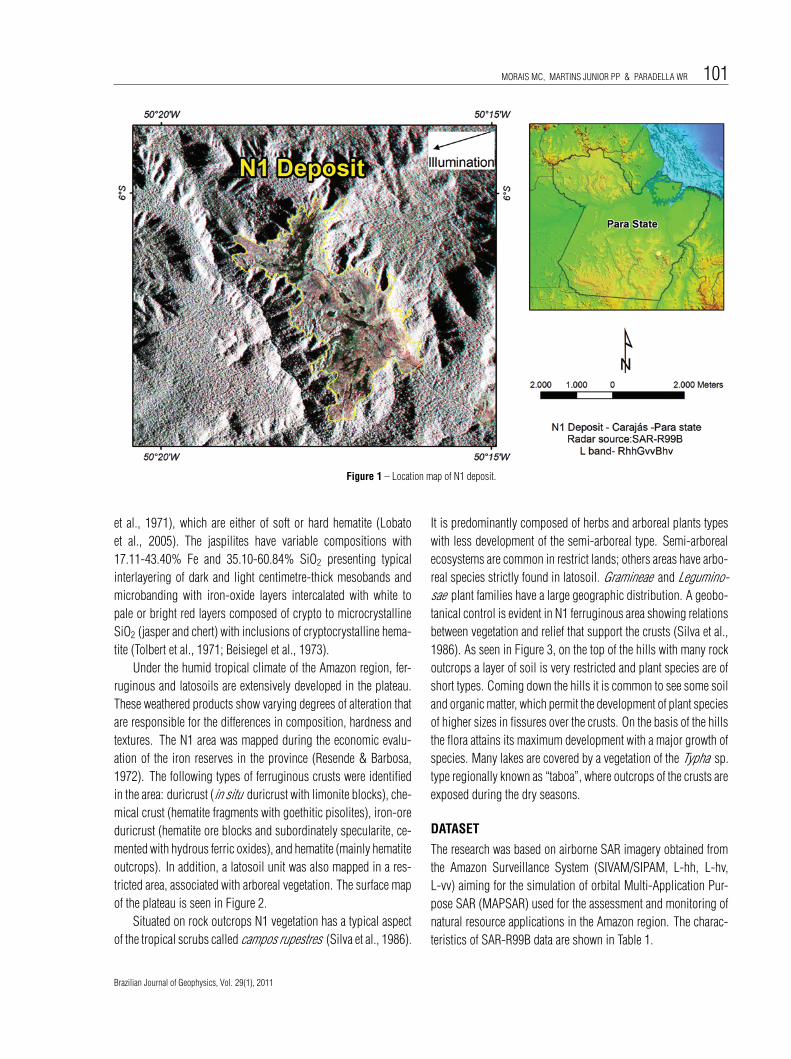
The drought influenced SAR imagery acquisition on June2005, corresponding to the low rain mean of that year (Fig. 6).At this condition, duricrust (chemical) showed very dry grassvegetation in flat terrains, and the low backscattering can be re-lated to low values of dielectric. This effect was also observed indry lakes. At normal rain conditions, it was expected the typicalaquatic vegetation on lakes, and as a consequence a higher radarresponses. Therefore, grasses vegetation appears smooth at L-band, as showed in Figure 7, and it has affected the classificationthat may results on confusion where dry lakes were incorrectlyclassified as soil (anthropogenic effects).
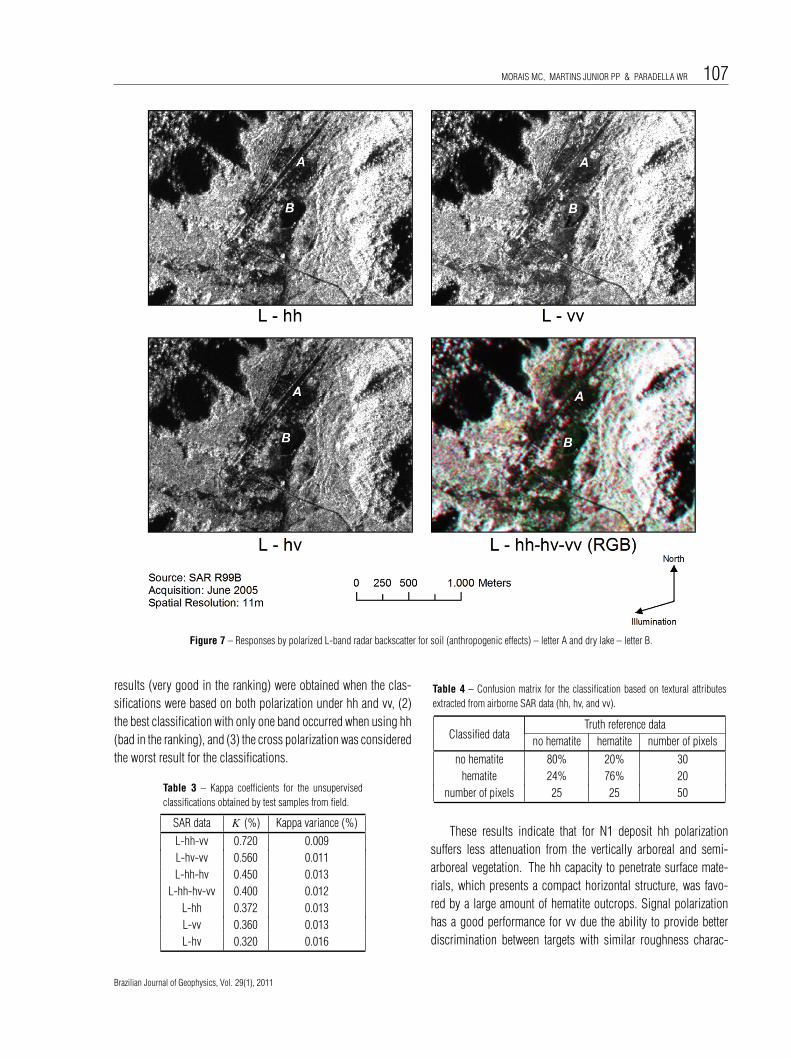
Although the soil (anthropogenic effects), duricrust, and he-matite were relatively well classified, they presented confusionwith other classes. For this reason, the statistical analysis wasmade between hematite and no hematite classes. Table 3 showsthe kappa values for all classifications, where duricrust and soil(anthropogenic effects) were grouped into the “no hematite” classand evaluated with “hematite” class. According to this table, thehh classification was better than vv polarization, while the crosspolarization presented the worst result. The best results are forboth hh and vv classification, showed by the confusion matrix (Ta-ble 4) obtained by test samples based on the field-investigatedpoints, where the rows present the percentage results of theclassification and the columns are the truth obtained from ran-dom test samples. According these results, hematite showed agod performance on textural classification. The application ofthe kappa ranking, as proposed by Landis & Koch (1977),supports this results and indicates the following: (1) the best
Brazilian Journal of Geophysics, Vol. 29(1), 2011

“main” — 2011/7/25 — 18:14 — page 106 — #8
106 MAPPING IRON-MINERALIZED LATERITE ENVIRONMENTS
Figure 5 – Textural classification for the L-band (hh and vv) data.
Figure 6 – Rain mean for 2005 year in the area (Source: ANA – National Water Agency).
Revista Brasileira de Geofısica, Vol. 29(1), 2011
“main” — 2011/7/25 — 18:14 — page 107 — #9
MORAIS MC, MARTINS JUNIOR PP & PARADELLA WR 107
Figure 7 – Responses by polarized L-band radar backscatter for soil (anthropogenic effects) – letter A and dry lake – letter B.
results (very good in the ranking) were obtained when the clas-sifications were based on both polarization under hh and vv, (2)the best classification with only one band occurred when using hh(bad in the ranking), and (3) the cross polarization was consideredthe worst result for the classifications.
Table 3 – Kappa coefficients for the unsupervisedclassifications obtained by test samples from field.
SAR data K (%) Kappa variance (%)
L-hh-vv 0.720 0.009
L-hv-vv 0.560 0.011
L-hh-hv 0.450 0.013
L-hh-hv-vv 0.400 0.012
L-hh 0.372 0.013
L-vv 0.360 0.013
L-hv 0.320 0.016
Table 4 – Confusion matrix for the classification based on textural attributesextracted from airborne SAR data (hh, hv, and vv).
Classified dataTruth reference data
no hematite hematite number of pixels
no hematite 80% 20% 30
hematite 24% 76% 20
number of pixels 25 25 50
These results indicate that for N1 deposit hh polarizationsuffers less attenuation from the vertically arboreal and semi-arboreal vegetation. The hh capacity to penetrate surface mate-rials, which presents a compact horizontal structure, was favo-red by a large amount of hematite outcrops. Signal polarizationhas a good performance for vv due the ability to provide betterdiscrimination between targets with similar roughness charac-
Brazilian Journal of Geophysics, Vol. 29(1), 2011

“main” — 2011/7/25 — 18:14 — page 108 — #10
108 MAPPING IRON-MINERALIZED LATERITE ENVIRONMENTS
Figure 8 – Roughness classification for all classes.
teristics, like vegetation, soil (anthropogenic effects), duricrust(chemical) and dries lakes. The cross-polarized caused a de-creased on kappa values when it added on both hh and vv classi-fications as it can be derived by a loss of signal radar on cross-polarized response. Also, cross-polarized signal provided abetter discrimination between specular and diffuse signal re-turn, like classes covered by dry grasses and arboreal and semi-arboreal vegetation.
In relation to roughness classification, N1 plateau with a re-lative flat topographic relief and low elevations variation (Fig. 9)is controlled by microrelief. A small range of incident anglesoccurred since N1 plateau as located in the centre of swath. Withregards to L-band, the surface roughness of lateritic crusts de-rived from 73 in situ measurements based on a scheme propo-sed by Peake & Oliver (1971) were not sensitive to the variations(Fig. 8). According to these results, most classes were classifiedas intermediate, i.e., the diffuse reflection is observed and thisresults in medium backscattering SAR. Duricrust (chemical) andsoil (anthropogenic effects), presented the best results and wereclassified as smooth, as expected at L-band. The reduced sizeparticles of these classes, located at flat areas, showed a specularreflection at this wavelength.
The influence of macrotopography was evident on hematiteresults classification. This class exhibits a stronger influence onrelief in eastern segment of the plateaux given by bright returnsand shadows (front/back slopes). Further, the 282◦ look azimuthdirection favoured the relief enhancing terrain oriented at NW-SE,with many occurrence of hematite.
CONCLUSIONS
Textures attributes derived from second-order measures (GLCM)from airborne SAR L-band can be used with limitations as apractical tool for a preliminary map. The investigation has shownthat textural descriptors were sensitive to the (1) SAR wavelength,(2) SAR polarization, and (3) target parameters (dielectric cons-tant, macro and microtopography). L-band was very sensitive tosmall-scale areas of vegetation and the surface backscatter wasaffected by the terrain below this vegetation. For forest canopyon flat terrain, the volume scattering effect was predominant.The hh polarization has better performance than vv to penetratematerials with a compact horizontal structure, like hematite. Alre-ady vv polarization presented better performance on discrimina-tion targets with similar roughness characteristics, like vegetation,soil (anthropogenic effects), duricrust (chemical), and dry lakes.The cross-polarized signal caused a decreased on classificationresults and it can be due to the loss of signal radar on cross-polarized response. The dielectric constant can be affected areasubmitted targets to drought conditions. The hematite compactstructure, on higher areas of the plateau, was sensitive to macro-topography and, and it contributed to discriminate it from othersclasses. The surface roughness was poorly classified at L-bandand most classes were classified as intermediate. Most classeswere classified as smooth at specular reflection conditions. Fromall these factors, it can be observed that the wavelength was themost important factor to discriminate iron-mineralized laterites inN1, as previously observed at C-band in N1. Also, this approach
Revista Brasileira de Geofısica, Vol. 29(1), 2011

“main” — 2011/7/25 — 18:14 — page 109 — #11
MORAIS MC, MARTINS JUNIOR PP & PARADELLA WR 109
Figure 9 – DEM generated from topographic curves – N1 plateau.
can be used as a practical tool for a preliminary map, which mayserve as a guide for detailed iron-mineralized laterites mapping inCarajas, and other minerals, like phosphate-titanium mineralizedlaterites in Maicuru. Multi-wavelength SAR images is desirablefor a better classes discrimination. Finally, an additional appro-ach will deserve attention for future research with use of texturalclassification derived from polarimetric SAR data.
ACKNOWLEDGEMENTS
The authors wish to thank to Dr. Camilo D. Renno (INPE) for thesupport with the texture algorithm and kappa statistics. Specialthanks to INPE for field support, and to VALE (GAJAN) miningcompany, particularly to senior-geologist Lambertus C. Schardt,for the infrastructure in Carajas. The authors also thank to JoaoAlvaro Carneiro (CETEC) for discussions.
REFERENCES
AZZIBROUCK GA, SAINT-JEAN R & PREVOST C. 1997. Analyse de la
texture d’une image RADARSAT pour la cartographie geologique dans la
Foret Equatoriale de Ngoutou, est du Gabon. In: Proceedings of Geo-
matics in the Era of RADARSAT (GER’97), 1997, Ottawa. Proceedings...
CD-ROM.
BARALDI A & PARMIGGIANI F. 1995. An investigation of the textural
characteristics associated with Gray Level Cooccurrence Matrix statisti-
cal parameters. IEEE Trans. Geosc. Remote Sens., 33: 293–304.
BEISIEGEL VR, BERNADELLI AL, DRUMMOND NF, RUFF AW & TRE-
MAINE JW. 1973. Geologia e Recursos Minerais da Serra dos Carajas.
Revista Brasileira de Geociencias, 3: 215–242.
BENSON AS & DeGLORIA SD. 1985. Interpretation of Landsat-4 Thema-
tic Mapper and Multispectral Scanner data for forest surveys. Photogr.
Engineering Remote Sens., 51: 1281–1289.
FOODY GM. 1992. On the compensation for change agreement in image
classification accuracy assessment. Photogr. Engineering Remote Sens.,
58: 1459–1460.
HARALICK RM. 1979. Statistical and structural approaches to texture.
Proceedings of the IEEE, 67: 786–804.
KURVONEN L & HALLIKAINEN MT. 1999. Textural information of mul-
titemporal ERS-1 and JERS-1 SAR images with applications to land
and forest type classification in boreal zone. IEEE Trans. Geosc. Remote
Sens., 37: 680–689.
LANDIS JR & KOCH GG. 1977. The measures of observer agreement for
categorical data. Biometrics, 33: 159–174.
LOBATO LM, ROSIERE CA, SILVA RCF, ZUCCHETTI M, BAARS FJ,
SEOANE JCS, RIOS FJ, PIMENTEL M, MENDES GE & MONTEIRO
Brazilian Journal of Geophysics, Vol. 29(1), 2011

“main” — 2011/7/25 — 18:14 — page 110 — #12
110 MAPPING IRON-MINERALIZED LATERITE ENVIRONMENTS
AM. 2005. A mineralizacao hidrotermal de ferro da Provıncia Mineral
de Carajas – Controle estrutural e contexto na evolucao metalogeneti-
ca da provıncia. In: Caracterizacao de depositos minerais em distritos mi-
neiros da Amazonia. ADIMB/DNPM, Ed., DNPM-CT/MINERAL-ADIMB:
Brasılia, 2: p. 20–92.
MARENGO JA, NOBRE CA, TOMASELLA J, CARDOSO MF & OYAMA
MD. 2008. Hydro-climatic and ecological behaviour of the drought of
Amazonia in 2005. Philosophical Transactions of the Royal Society of
London, 363(1498): 1773–1778.
MATHER PM. 1987. Computer processing of remotely-sensed images:
an introduction. John Wiley, Chichester, U.K., 325 p.
MEIRELLES EM, HIRATA WK, AMARAL AF, MEDEIROS FILHO CA &
GATO WC. 1984. Geologia das folhas Carajas e Rio Verde, Provıncia
Mineral dos Carajas, Estado do Para. In: Brazilian Congress of Geo-
logy, 33., 1984, Rio de Janeiro. Annals... Rio de Janeiro: SBG, 1984, p.
2164–2174.
MORAIS MC, PARADELLA WR & FREITAS CC. 2002. An assessment
of the discrimination of iron-mineralized laterites in the Amazon region
(Carajas Province) based on textural attributes from C-band airborne SAR
data. Asian J. Geoinfo., 3: 11–20.
PARADELLA WR, SILVA MFF, ROSA NA & KUSHIGBOR CA. 1994.
A geobotanical approach to the tropical rain forest environment of the
Carajas Mineral Province (Amazon Region, Brazil), based on digital TM-
Landsat and DEM data. Int. J. Remote Sens., 15: 1633–1648.
PARADELLA WR, BIGNELLI PA, VENEZIANI P, PIETSCH RW & TOUTIN
T. 1997. Airborne and spaceborne Synthetic Aperture Radar (SAR) in-
tegration with Landsat TM and gamma ray spectrometry for geological
mapping in a tropical rainforest environment, the Carajas Mineral Pro-
vince, Brazil. Int. J. Remote Sens., 18: 1483–1501.
PARADELLA WR, SANTOS AR, VENEZIANI P, SANT’ANNA MV & MO-
RAIS MC. 2000. Geological investigation using RADARSAT-1 images in
the tropical rainforest environment of Brazil. Canadian Journal of Remote
Sensing, 26: 82–90.
PEAKE WM & OLIVER TL. 1971. The response of terrestrial surfaces at
microwave frequencies. Technical Report. Columbus, Ohio, p. 2440–
2447.
RENNO CD, FREITAS CC & SANT’ANNA SJS. 1998. A system for region
classification based on textural measures. In: Brazilian Remote Sensing
Symposium, 9., 1998, Santos. Annals... Santos: INPE, 1998, on-line.
RESENDE NP & BARBOSA ALM. 1972. Relatorio de Pesquisa de Minerio
de Ferro, Distrito Ferrıfero da Serra dos Carajas, Estado do Para. AMZA.
Final Report, v. 1, 248 p.
SCHRODER R, PULS J, HAJNSEK I, JOCHIM F, NEFF T, KONO J, PARA-
DELLA WR, SILVA MM, VALERIANO DM & COSTA MPF. 2005. MAPSAR:
a small L-band SAR mission for land observation. Acta Astronautica, 56:
35–45.
SHANMUGAN KS, NARAYANAN V, FROST VS, STILES JA & HOLTZ-
MAN JC. 1981. Textural Features for Radar Images. IEEE Trans.
Geosc. Remote Sens., 19: 153–156.
SILVA MFF, MENEZES NL, CAVALCANTE PB & JOLY CA. 1986. Estu-
dos Botanicos: historico, atualidade e perspectivas. In: Carajas: desafio
polıtico, ecologia e desenvolvimento. CNPq/Brasiliense. Cap. 8, p. 185–
206.
TAPLEY IJ. 2002. Radar Imaging. In: PAPP E (Ed.). Geophysical and
remote sensing methods for regolith exploration. CRC LEME. Open File
Report 144, p. 22–32.
TOLBERT GE, TREMAINE JW, MELCHER GC & GOMES CB. 1971. The
recently discovered Serra dos Carajas iron deposits, Northern Brazil.
Economic Geology, 66: 985–994.
ULABY FT, KOUYATE F, BRISCO B & WILLIAMS THL. 1986. Textural
information in SAR images. IEEE Trans. Geosc. Remote Sens., 24: 235–
245.
WELCH RM, KUO SS & SENGUPTA SK. 1990. Cloud and surface textural
features in polar region. IEEE Trans. Geosc. Remote Sens., 28: 520–528.
WERLE D. 1988. Radar remote sensing: a training manual. Ottawa: Den-
dron Resource Surveys, 300 p.
WESKA JS, DYER CR & ROSENFELD A. 1976. A comparative study
of texture measures for terrain classification. IEEE Trans. Syst. Man
Cybern., 4: 269–285.
WOODING MG, ZMUDA AD & ATTEMA E. 1993. An overview of
SAREX’92 data acquisition and analysis of the tropical forest environ-
ment. In: Workshop of SAREX-92 (South American Radar Experiment),
6-8., 1993, Paris. Proceedings... Paris: ESA, 1993, p. 3–14.
YANASSE CCF, FRERY AC, SANT’ANNA SJS, HERNANDES FILHO P &
DUTRA LV. 1993. Statistical analysis of SAREX data over Tapajos – Bra-
zil. In: Workshop of SAREX-92 (South American Radar Experiment), 6-8.,
1993, Paris. Proceedings... Paris: ESA, 1993, p. 25–40.
NOTES ABOUT THE AUTHORS
Maria Carolina de Morais. Geological Engineer (School of Mines, Federal University of Ouro Preto, 1995), Master’s Degree in Remote Sensing at the NationalInstitute for Space Research (INPE, 1998), doctoral student at the Federal University of Ouro Preto in Crustal Evolution and Natural Resources, concentration areaEnvironmental Geology and Conservation of Natural Resources. Experience in Geosciences, with emphasis on Remote Sensing, GIS, acting on the following topics:Digital mapping through satellite imagery, multispectral and radar, Geophysical data in order to mineral exploration and Natural resource management.
Revista Brasileira de Geofısica, Vol. 29(1), 2011

“main” — 2011/7/25 — 18:14 — page 111 — #13
MORAIS MC, MARTINS JUNIOR PP & PARADELLA WR 111
Paulo Pereira Martins Junior. Geologist (Geosciences Institute – Federal University of Rio de Janeiro, 1970), holds a Doctorate, Dr.Sc.T., in Geologie Dynamique– Universite Pierre et Marie Curie – Paris VI, Laboratoire de Geologie Dynamique in 1977. Professor-Researcher at the Federal University of Ouro Preto and Scienceand Technology Researcher at Minas Gerais Tecnological Center Foundation – CETEC. Experience on the following topics: Epistemology, Agrarian and EnvironmentalGeosciences, Modeling watersheds environmental management, Ecology-Economy, System development for Architecture of Knowledge, Cartographic developments inecology, energy and economy and Certification Methods Geo-environmental and economic.
Waldir Renato Paradella. Geologist (University of Sao Paulo – IGUSP, 1973), Master’s Degree in Remote Sensing (National Institute for Space Research – INPE,1976), Ph.D. in General Geology (University of Sao Paulo – IGUSP, 1983) and post-doctoral at CNPq (1988-1989) and CIDA – Canadian International DevelopmentAgency (1995-1996) in Canada. III Researcher holder of the Remote Sensing Division (RSD) of INPE. Experience in the Geosciences, Applications of radar imagesin Geology and Cartography, with emphasis in Radargrammetry, Polarimetry, and Interferometry. Coordinator of radar symposia in 2000 (Rio de Janeiro) and 2008(Oslo, Norway) of the International Geological Congress.
Brazilian Journal of Geophysics, Vol. 29(1), 2011