Embed Size (px)
Citation preview

Machine Learning for the Detection of Electricity Theft
Patrick GLAUNER
SnT - Interdisciplinary Centre for Security, Reliability and Trust,University of Luxembourg
February 21, 2018
Patrick GLAUNER ML for Electricity Theft Detection February 21, 2018 1 / 35

Biography
PhD Student at the University of Luxembourg
Adjunct Lecturer at two German universities
MSc in Machine Learning from Imperial College London
BSc in Computer Science from Karlsruhe University of AppliedSciences
Previously worked at CERN and SAP
Patrick GLAUNER ML for Electricity Theft Detection February 21, 2018 2 / 35
Motivation: how to detect electricity theft?
Figure 1: That is what electricity theft looks.
Patrick GLAUNER ML for Electricity Theft Detection February 21, 2018 3 / 35

Motivation: how to detect electricity theft?
Figure 2: That is what electricity theft looks1.
1http://extra.globo.com/incoming/13321838-a74-9d3/w448/
Eletrotraficante-Rio-das-Pedras.jpgPatrick GLAUNER ML for Electricity Theft Detection February 21, 2018 4 / 35

Motivation: how to detect electricity theft?
Example (Fraudulent behavior)
Figure 3: Two assumed occurrences of NTL due to significant consumption dropsfollowed by inspections (visualized by a vertical bar).
Patrick GLAUNER ML for Electricity Theft Detection February 21, 2018 5 / 35

Agenda
1 Anomaly detection
2 Electricity theft
3 Electricity theft detection
4 Conclusions and outreach
Patrick GLAUNER ML for Electricity Theft Detection February 21, 2018 6 / 35

Anomaly detection
Definition (Anomaly detection)
Anomaly detection allows to find data that does not conform to anexpected pattern. Anomaly detection is used for a very small number ofpositive examples and large number of negative exempts. It is also usedfor many different kinds of anomalies as it is hard for any algorithm tolearn from just a few positive examples what the anomalies might looklike. There may be also future anomalies which may look completelydifferent to any of the anomalous examples learned so far.
Patrick GLAUNER ML for Electricity Theft Detection February 21, 2018 7 / 35

Anomaly detection
Example (Anomaly detection)
Figure 4: Fraud detection in online shoppinga.
ahttps://docs.microsoft.com/en-us/azure/machine-learning/
machine-learning-algorithm-choice
Patrick GLAUNER ML for Electricity Theft Detection February 21, 2018 8 / 35

Anomaly detection
Example (Anomaly detection)
Credit card fraud
Theft of credentials
...
Electricity theft
Patrick GLAUNER ML for Electricity Theft Detection February 21, 2018 9 / 35

Electricity theft
Collaboration with Choice Technologies Holding
Company focuses on providing revenue assurance solutions for energyutilities
More than twenty years of experience in this sector
Patrick GLAUNER ML for Electricity Theft Detection February 21, 2018 10 / 35

Electricity theft
Definition (Technical losses)
Technical losses occur mostly due to power dissipation. This is naturallycaused by internal electrical resistance and the affected componentsinclude generators, transformers and transmission lines.
Patrick GLAUNER ML for Electricity Theft Detection February 21, 2018 11 / 35

Electricity theft
Definition (Non-technical losses)
The opposite class of losses are non-technical losses (NTL), which areprimarily caused by electricity theft. In most countries, NTL account forthe predominant part of the overall losses. Therefore, it is most beneficialto first reduce NTL before reducing technical losses. Nonetheless, reducingtechnical losses is challenging, too. In particular, NTL include, but are notlimited to, the following causes:
Meter tampering in order to record lower consumptions
Bypassing meters by rigging lines from the power source
Arranged false meter readings by bribing meter readers
Faulty or broken meters
Un-metered supply
Technical and human errors in meter readings, data processing andbilling
Patrick GLAUNER ML for Electricity Theft Detection February 21, 2018 12 / 35

Electricity theft
Impact of NTL
NTL cause significant harm to economies, including loss of revenue andprofit of electricity providers, decrease of the stability and reliability ofelectrical power grids and extra use of limited natural resources which inturn increases pollution. There are different estimates of the losses causedby NTL. For example, in India, NTL are estimated at US$ 4.5 billion. NTLalso reported to range up to 40% of the total electricity distributed incountries such as Brazil, India, Malaysia or Lebanon. They are also ofrelevance in developed countries, for example estimates of NTL in the UKand US range from US$ 1-6 billion.
Patrick GLAUNER ML for Electricity Theft Detection February 21, 2018 13 / 35

Electricity theft
Example (Fraudulent behavior)
Figure 5: Two assumed occurrences of NTL due to significant consumption dropfollowed by inspections (visualized by a vertical bar).
Patrick GLAUNER ML for Electricity Theft Detection February 21, 2018 14 / 35

Electricity theft detection
Industrial detection of NTL:
To date, most NTL detection systems deployed in industry are basedon expert knowledge rules
In contrast, the predominant research direction reported in the recentresearch literature is the use of machine learning/data miningmethods, which learn from customer data and known irregularbehavior that was reported through inspection results
Due to the high costs per inspection and the limited number ofpossible inspections, electricity providers aim to maximize the returnon investment (ROI) of inspections
It has previously been shown that the neighborhoods of customersyield significant information in order to decide whether a customercauses a NTL or not
Patrick GLAUNER ML for Electricity Theft Detection February 21, 2018 15 / 35
Electricity theft detection
Patrick GLAUNER ML for Electricity Theft Detection February 21, 2018 16 / 35

Electricity theft detection
The data used in this paper comes from an electricity provider inBrazil
Consists of 3.6M customers
Contains 820K inspection results
There are 195M meter readings from 2011 to 2016
Patrick GLAUNER ML for Electricity Theft Detection February 21, 2018 17 / 35

Electricity theft detection
Extraction of hundreds of features from the consumption time series:
Features specific to NTL detectionGeneric time series features using tsfresh2
Feature selection that handles the noise in this industrial data
Training of various classifiers, random forest proved to perform thebest
2http://github.com/blue-yonder/tsfreshPatrick GLAUNER ML for Electricity Theft Detection February 21, 2018 18 / 35

Electricity theft detection
Patrick GLAUNER ML for Electricity Theft Detection February 21, 2018 19 / 35

Challenges
High costs of false positives
Covariate shift
Patrick GLAUNER ML for Electricity Theft Detection February 21, 2018 20 / 35

Challenges: high costs of false positives
Costs of inspections
We have a very limited number of inspections we can carry out. Eachinspection costs around US$ 100.
Patrick GLAUNER ML for Electricity Theft Detection February 21, 2018 21 / 35

Challenges: high costs of false positives
Figure 6: Microsoft HoloLens3.
3http://www.microsoft.com/en-us/hololensPatrick GLAUNER ML for Electricity Theft Detection February 21, 2018 22 / 35

Challenges: high costs of false positives
Figure 7: Gesture interactions with the spatial hologram allow to select customersas well as to zoom into or rotate holograms. We also provide a future yellow labelthat depicts a borderline case, which requires a manual check by domain experts.
Patrick GLAUNER ML for Electricity Theft Detection February 21, 2018 23 / 35
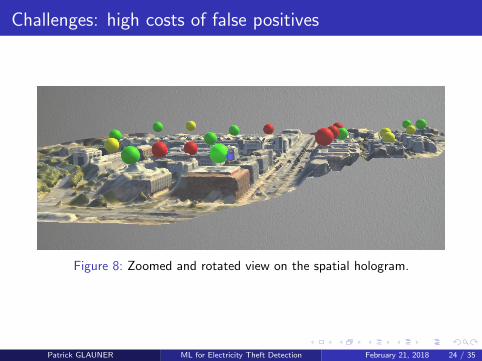
Challenges: high costs of false positives
Figure 8: Zoomed and rotated view on the spatial hologram.
Patrick GLAUNER ML for Electricity Theft Detection February 21, 2018 24 / 35

Challenges: high costs of false positives
Figure 9: Detailed view of a customer depicted by a green dot predicted to have aregular power consumption pattern.
Patrick GLAUNER ML for Electricity Theft Detection February 21, 2018 25 / 35

Challenges: high costs of false positives
Figure 10: Multi-view on multiple customers’ power consumption history.
Patrick GLAUNER ML for Electricity Theft Detection February 21, 2018 26 / 35
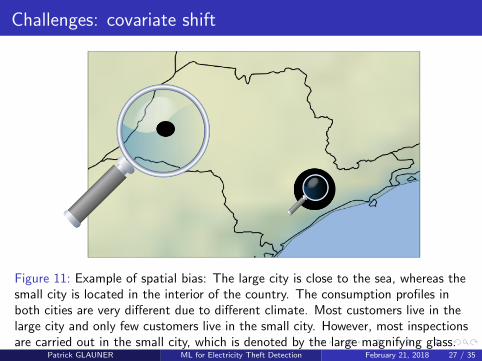
Challenges: covariate shift
Figure 11: Example of spatial bias: The large city is close to the sea, whereas thesmall city is located in the interior of the country. The consumption profiles inboth cities are very different due to different climate. Most customers live in thelarge city and only few customers live in the small city. However, most inspectionsare carried out in the small city, which is denoted by the large magnifying glass.
Patrick GLAUNER ML for Electricity Theft Detection February 21, 2018 27 / 35

Challenges: covariate shift
This happens all the time in Machine Learning and statistics, including:
1936 US Presidential election
Gender bias in Machine Learning
...
Patrick GLAUNER ML for Electricity Theft Detection February 21, 2018 28 / 35

Challenges: covariate shift
Table 1: Global Covariate Shift of Single Features.
Feature MCCmax σ
Location 0.22367 0.03453
Class 0.16255 0.01371
Number of wires 0.14111 0.00794
Meter type 0.13158 0.00382
Voltage 0.07092 0.02375
Contract status 0.03744 0.09183
Patrick GLAUNER ML for Electricity Theft Detection February 21, 2018 29 / 35

Challenges: covariate shift
Figure 12: Municipal level.
Patrick GLAUNER ML for Electricity Theft Detection February 21, 2018 30 / 35

Work covered in New Scientist in September 2017
http://www.newscientist.com/article/2148308-ai-could-put-a-stop-to-electricity-theft-and-meter-misreadings/
Patrick GLAUNER ML for Electricity Theft Detection February 21, 2018 31 / 35

Cited by McKinsey study in June 2017
http://www.mckinsey.de/files/170620 studie ai.pdfPatrick GLAUNER ML for Electricity Theft Detection February 21, 2018 32 / 35

Conclusions and outreach
Non-technical losses (NTL) cause major financial losses to electricitysuppliers
Detecting NTL thrives significant economic value
Superiority performance of machine learning approaches compared toexpert system
Many challenges: costs of false positives, covariate shift, ...
Patrick GLAUNER ML for Electricity Theft Detection February 21, 2018 33 / 35

Bibliography I
[1] P. Glauner, J. Meira, P. Valtchev, R. State and F. Bettinger, “TheChallenge of Non-Technical Loss Detection using ArtificialIntelligence: A Survey”, International Journal of ComputationalIntelligence Systems (IJCIS), vol. 10, issue 1, pp. 760-775, 2017.
[2] P. Glauner, N. Dahringer, O. Puhachov, J. Meira, P. Valtchev, R.State and D. Duarte, “Identifying Irregular Power Usage byTurning Predictions into Holographic Spatial Visualizations”,Proceedings of the 17th IEEE International Conference on DataMining Workshops (ICDMW 2017), New Orleans, USA, 2017.
[3] P. Glauner, A. Migliosi, J. Meria, P. Valtchev, R. State and F.Bettinger, “Is Big Data Sufficient for a Reliable Detection ofNon-Technical Losses?”, Proceedings of the 19th InternationalConference on Intelligent System Applications to Power Systems(ISAP 2017), San Antonio, USA, 2017.
Patrick GLAUNER ML for Electricity Theft Detection February 21, 2018 34 / 35

Bibliography II
[4] P. Glauner, A. Boechat, L. Dolberg, R. State, F. Bettinger, Y.Rangoni and D. Duarte, “Large-Scale Detection ofNon-Technical Losses in Imbalanced Data Sets”, Proceedings ofthe Seventh IEEE Conference on Innovative Smart Grid Technologies(ISGT 2016), Minneapolis, USA, 2016.
[5] P. Glauner, J. Meira, L. Dolberg, R. State, F. Bettinger, Y.Rangoni and D. Duarte, “Neighborhood Features HelpDetecting Non-Technical Losses in Big Data Sets”, Proceedingsof the 3rd IEEE/ACM International Conference on Big DataComputing Applications and Technologies (BDCAT 2016),Shanghai, China, 2016.
Patrick GLAUNER ML for Electricity Theft Detection February 21, 2018 35 / 35