Embed Size (px)
Citation preview

2nd IEEE International Conference on Power and Energy (PECon 08), December 1-3, 2008, Johor Bahru, Malaysia.
Abstract—Electricity consumer dishonesty is a problem faced by all power utilities. Finding efficient measurements for detecting fraudulent electricity consumption has been an active research area in recent years. This paper presents a new approach towards Non-Technical Loss (NTL) analysis for electric utilities using a novel intelligence-based technique, Support Vector Machine (SVM). The main motivation of this study is to assist Tenaga Nasional Berhad (TNB) in Malaysia to reduce its NTLs in the distribution sector due to electricity theft. The proposed model preselects suspected customers to be inspected onsite for fraud based on irregularities and abnormal consumption behavior. This approach provides a method of data mining and involves feature extraction from historical customer consumption data. The SVM based approach uses customer load profile information to expose abnormal behavior that is known to be highly correlated with NTL activities. The result yields classification classes that are used to shortlist potential fraud suspects for onsite inspection, based on significant behavior that emerges due to irregularities in consumption. Simulation results prove the proposed method is more effective compared to the current actions taken by TNB in order to reduce NTL activities.
Index Terms—Support vector machine, intelligent system, electricity theft, non-technical loss, load profile.
I. INTRODUCTION LECTRIC utilities lose large amounts of money each year due to fraud by electricity consumers. Electricity fraud
can be defined as a dishonest or illegal use of electricity equipment or service with the intention to avoid billing charge. It is difficult to distinguish between honest and fraudulent customers. Realistically, electric utilities will never be able to eliminate fraud. It is possible, however, to take measures to detect, prevent and reduce fraud [1]. Investigations are undertaken by electric utilities to assess the impact of technical losses in generation, transmission and distribution networks [2-3]. Non-technical losses (NTLs) comprise one of the most important concerns for electricity distribution utilities worldwide. In 2004, Tenaga Nasional Berhad (TNB) the sole electricity provider in Peninsular Malaysia recorded revenue losses as high as USD 229 million a year as a result of electricity theft, billing errors and faulty metering [4]. NTLs faced by electric utility companies in the United States were estimated between 0.5% and 3.5% of gross annual revenue [5], which is relatively low when compared to losses faced by electric utilities in developing countries such as Bangladesh [6], India [7], and Pakistan [8]. Nevertheless,
the loss is amounted between USD 1 billion and USD 10 billion given that utility companies in the US had revenues around USD 280 billion in 1998 [5].
In recent years, several data mining and research studies on fraud identification and prediction techniques have been carried out in the electricity distribution sector. These include Statistical Methods [9-10], Decision Trees [11], Artificial Neural Networks (ANNs) [12], Knowledge Discovery in Databases (KDD) [13], and Multiple Classifiers using cross identification and voting scheme [1]. Among these, load profiling is one of the most widely used [14], which is defined as the pattern of electricity demand of a customer over a period of time.
NTLs appear to have never been adequately studied, and to date there is no published evidence of research on NTLs in the Malaysian electricity supply industry. TNB in Malaysia is currently focusing on reducing its NTLs, which are estimated around 20% throughout Peninsular Malaysia. At present, customer installation inspections by TNB Distribution (TNBD) Division are carried out without any specific focus due to unavailability of a system for short listing possible fraud suspects. The approach proposed in this paper provides an intelligent system for assisting TNB inspection teams to increase effectiveness of their operation in reducing NTLs, and detecting fraudulent consumers based on load profiles of customers derived from the customer database. This system will increase fraud detection hit-rate for onsite inspection and reduce operational costs due to onsite inspection in monitoring NTL activities.
This paper presents a framework to identify and detect NTL activities in the electric utility market i.e., customers with irregular and abnormal consumption patterns indicating fraudulent activities. An automatic feature extraction method for load profiles with a combination of Support Vector Machines (SVMs) is used to identify fraud customers. This study uses historical customer consumption data collected from TNBD. Customer consumption patterns are extracted using data mining and statistical techniques, which represent customer load profiles. Based on the assumption that load profiles contain abnormalities when a fraud event occurs, SVM classifies load profiles of customers for detection of fraud suspects. There are several different types of fraud that can occur, but our research concentrates only on scenarios where abrupt changes appear in load profiles, indicating fraudulent activities.
Non-Technical Loss Analysis for Detection of Electricity Theft using Support Vector Machines
J. Nagi, A. M. Mohammad, K. S. Yap, S. K. Tiong, Member, IEEE S. K. Ahmed, Member, IEEE
E
1-4244-2405-4/08/$20.00 ©2008 IEEE 907

2nd IEEE International Conference on Power and Energy (PECon 08), December 1-3, 2008, Johor Bahru, Malaysia.
II. SUPPORT VECTOR MACHINE
Support vector machines (SVMs) were introduced by Vapnik [15] in the late 1960s on the foundation of statistical learning theory. SVMs are a set of novel machine learning methods used for classification, and have recently become an active area of intense research with extensions to regression. In SVM, training is performed in a way such to obtain a quadratic programming (QP) problem. The solution to this QP problem is global and unique. For empirical data (x1, y1),…,(xm, ym) ∈ Rn × {-1,+1} that are mapped by φ: Rn → F into a “feature space”, the linear hyperplanes that divide them into two labeled classes can be mathematically represented as:
ℜ∈ℜ∈=+× bwbxw n , 0)(φ (1)
To construct an optimal hyperplane with maximum-margin
and bounded error in the training data (soft margin), the following QP problem is to be solved:
∑=
+m
iibw Cw
1
2, 2
1min ξ
( ) mibxwy ii ,...,2,1, 1)( =−≥+× ξφ (2)
The first term in cost function (2) makes maximum margin of separation between classes, and the second term provides an upper bound for the error in the training data. The constant C ∈ [0,∞) creates a tradeoff between the number of misclassified samples in the training set and separation of the rest samples with maximum margin. A way to solve (2) is via its Lagrange function. Given a kernel K(xi, yi) = φ(xi)·φ(xj), the Lagrange function of (2) is simplified to:
),(21max
1 11jijij
m
i
m
ji
m
ii xxKyyααα
α ∑∑∑= ==
− (3)
∑∑==
∀≤≤==m
iiiii
m
iii iCyxyw
11
, 0, 0), ( ααφα (4)
From eq. (1) it is seen that the optimal hyperplane in the feature space can be written as the linear combination of
training samples with αi ≠ 0. These informative samples, known as support vectors, construct the decision function of the classifier based on the kernel function:
+= ∑
=
bxxkyxf ji
m
ii ),(sgn)(
1,
α (5)
Kernel functions in SVMs are selected based on the data
structure and type of the boundaries between the classes. The representative and widely applied kernel function based on Euclidean distance is the radial basis function (RBF) kernel, also known as the Gaussian kernel [16]:
−−=
2exp),( jiji
RBF xxxxK γ (6)
where γ > 0 is the RBF kernel parameter. The RBF kernel induces an infinite-dimensional kernel space, in which all image vectors have the same norm, and the kernel width parameter “γ” controls the scaling of the mapping [16].
This paper employs LIBSVM [17], a library for support vector machines, as the core SVM classifier and conducts multiclass classifications using the “One Against One” or OAO method.
III. METHODOLOGY The fraud detection system presented in this paper is
developed as standalone GUI software in Microsoft Visual Basic 6.0 using LIBSVM v2.86 [17]. The computer used for testing is a Dell PowerEdge 840 workstation with Windows XP, a 2.40 GHz Intel Quad-core Xeon X3320 Processor with 4 GB of RAM. Time elapsed for obtaining detection results from the customer database is approximated to be 2.3 seconds per customer. The proposed framework for fraud electricity customer detection is shown in Fig. 1.
A. Data Acquisition Electricity customer consumption data from TNBDs
electronic-Customer Information Billing System (e-CIBS) was obtained for Kuala Lumpur Barat station. The raw e-CIBS data consisted of 265,870 customers for a period of 25 months i.e., from June 2006 to June 2008. Data was provided in Microsoft Office Access Database format.
Data Preprocessing Raw Customer Data
Fig. 1. Proposed framework for fraud electricity customer detection
Data Postprocessing
Offline Training
Fraud Suspected Customers
SVM Training
Pilot Testing
Feature Extraction
Fraud Detection Model
908

2nd IEEE International Conference on Power and Energy (PECon 08), December 1-3, 2008, Johor Bahru, Malaysia.
B. Customer Filtering and Selection The raw e-CIBS data obtained from TNBD was filtered for
extraction of customer load profiles and features. Hence, data mining techniques using database querying were applied for:
• Removing repeating customers in monthly data. • Removing customers having no consumption (0 kWh)
throughout the entire 25 month period. • Removing customers who are not present within the
entire 25 month data i.e., removing new customers registered after the first month.
After customer filtering only 186,968 customer records remained. The main tasks involved in preprocessing the raw e-CIBS data for SVM classification are illustrated in Fig. 2.
C. Feature Extraction From the 25 month customer database, 24 daily average
consumption values were extracted for each customer, corresponding to features. These features relate to customer load profiles. For a selected group of M customers, each load profile is characterized by a vector x(m) = {xh
(m), h = 1,…,H}, where H = 24 corresponds to time domain intervals based on average daily kWh consumption features representing the load profile. Therefore, the whole set of data is X = {x(m), m = 1,…,M}. Daily average consumption features for each customer were extracted using:
24, ..., 2, 1 , 1
1)( =−
=+
+ hDD
Px
hh
hmh (7)
where Ph+1 represents the monthly power consumption of the following month, and Dh – Dh+1 represents the difference of days with respect meter reading date between the following and current months.
CWR (Credit Worthiness Rating) data from the e-CIBS data was taken as an additional feature for the fraud detection model. CWR is automatically generated from TNBDs billing system and is targeted to identify customers intentionally avoiding to pay bills and delaying payments. In the customer database CWR value ranges from 0.00 to 5.00, where 0.00 represents minimum CWR and 5.00 represents maximum CWR. Since CWR changes frequently based on monthly payment status of customers, averaged CWR for each customer over a period of 25 months was represented as an additional feature attribute in the fraud detection model. Therefore, 25 features were selected for the SVM classifier
i.e., 24 daily average kWh consumption features and 1 CWR feature.
D. Data Preprocessing Real world data sets tend to be noisy and inconsistent.
Therefore, to overcome these problems, data mining techniques using statistical methods were implemented. Customer data with estimated monthly kWh consumptions (cases where meter readers are unable to record meter readings, due to customers not being present at their residence) were preprocessed and converted to normal consumption values, to smoothen out noise.
E. Data Normalization The load data needs to be represented using a normalized
scale for the SVM classifier. Therefore, the daily average kWh consumption feature data was normalized as follows:
)min()max(
)min(LL
LLNL
−−
= (8)
where L represents the current kWh consumption of the customer, and min(L) and max(L) represent the minimum and maximum values in the 24 month consumption feature set.
Typical load profiles of customers were then established, with each load profile being represented by the 24 normalized daily average kWh consumption features
F. Feature Adjustment All 25 features were given a label, where the labels are
represented by integer values. Normalized feature values with labels are represented as a LIBSVM feature file [17], denoted by the matrix W, in the form:
=
:::
:::
::::::
11
111
22222121
11111111
NMNMNkNkNN
MppMpkpkpp
MMkk
MMkk
xlxlxl
xlxlxl
xlxlxlxlxlxl
W
(9)
where l represents the feature label, x represents the normalized feature value, M = 25 is the number of features and N = 186,968 is the number of customers.
Creation of Customer Record
Database
Data Preprocessing Data Normalization Feature Adjustment
Historical 25 month Customer
Data from e-CIBS
SVM Training and Testing Data
Fig. 2. Flowchart for preprocessing raw e-CIBS data for SVM classification
Customer Filtering and Selection
Feature Selection and Extraction
909
2nd IEEE International Conference on Power and Energy (PECon 08), December 1-3, 2008, Johor Bahru, Malaysia.
Yes
C-SVM Training
10-fold Cross-validation using classifier data
Cross-validation Accuracy > 85%
No
Training done (only once) offline for 4-class SVM classifier Training data used: Kuala Lumpur Barat
Find optimal SVM hyper-parameters (C, γ)
using Grid-Search
End of Training Process
Starting of Training Process
Fig. 5. Flowchart of training engine proposed for C-SVM parameter optimization
Fraud Detection Model
G. SVM Classification Load profiles were classified into categories according to
their typical behavior and atypical behavior content. In this study a 4-class SVM classifier is used to represent four different types of load profiles. The feature file in eq. (9) indicated that out of 186,968 customers, 1171 customers previously inspected onsite by TNBD were detected to be fraud cases.
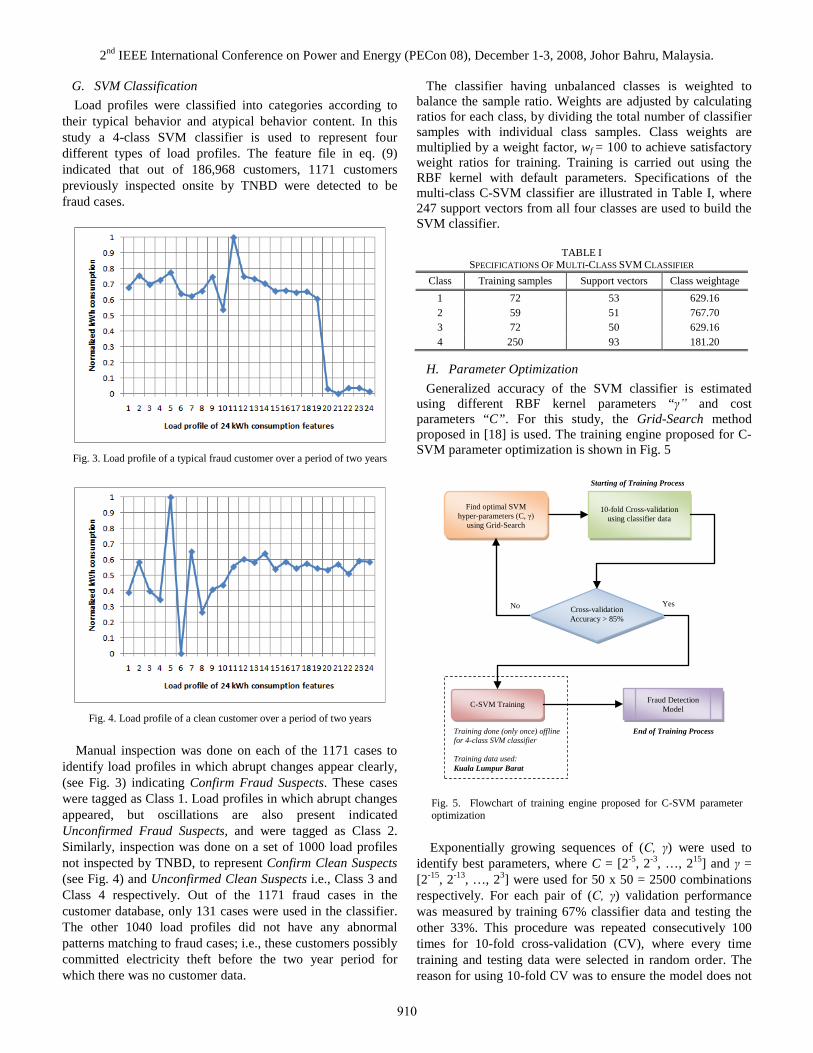
Manual inspection was done on each of the 1171 cases to
identify load profiles in which abrupt changes appear clearly, (see Fig. 3) indicating Confirm Fraud Suspects. These cases were tagged as Class 1. Load profiles in which abrupt changes appeared, but oscillations are also present indicated Unconfirmed Fraud Suspects, and were tagged as Class 2. Similarly, inspection was done on a set of 1000 load profiles not inspected by TNBD, to represent Confirm Clean Suspects (see Fig. 4) and Unconfirmed Clean Suspects i.e., Class 3 and Class 4 respectively. Out of the 1171 fraud cases in the customer database, only 131 cases were used in the classifier. The other 1040 load profiles did not have any abnormal patterns matching to fraud cases; i.e., these customers possibly committed electricity theft before the two year period for which there was no customer data.
The classifier having unbalanced classes is weighted to balance the sample ratio. Weights are adjusted by calculating ratios for each class, by dividing the total number of classifier samples with individual class samples. Class weights are multiplied by a weight factor, wf = 100 to achieve satisfactory weight ratios for training. Training is carried out using the RBF kernel with default parameters. Specifications of the multi-class C-SVM classifier are illustrated in Table I, where 247 support vectors from all four classes are used to build the SVM classifier.
H. Parameter Optimization Generalized accuracy of the SVM classifier is estimated
using different RBF kernel parameters “γ” and cost parameters “C”. For this study, the Grid-Search method proposed in [18] is used. The training engine proposed for C-SVM parameter optimization is shown in Fig. 5
Exponentially growing sequences of (C, γ) were used to identify best parameters, where C = [2-5, 2-3, …, 215] and γ = [2-15, 2-13, …, 23] were used for 50 x 50 = 2500 combinations respectively. For each pair of (C, γ) validation performance was measured by training 67% classifier data and testing the other 33%. This procedure was repeated consecutively 100 times for 10-fold cross-validation (CV), where every time training and testing data were selected in random order. The reason for using 10-fold CV was to ensure the model does not
TABLE I SPECIFICATIONS OF MULTI-CLASS SVM CLASSIFIER
Class Training samples Support vectors Class weightage 1 72 53 629.16 2 59 51 767.70 3 72 50 629.16 4 250 93 181.20
Fig. 4. Load profile of a clean customer over a period of two years
Fig. 3. Load profile of a typical fraud customer over a period of two years
910

2nd IEEE International Conference on Power and Energy (PECon 08), December 1-3, 2008, Johor Bahru, Malaysia. overfit the training data. For Grid-Search, several hyper-parameter combinations were tested. Experimentally it was found that optimal parameters: C = 1 and γ = 0.92, were the most suitable parameters for obtaining the highest SVM 10-fold CV accuracy and fraud detection hit-rate. Separating class boundaries of the 4-class C-SVM classifier using the RBF kernel with optimized hyper-parameters are shown in Fig. 6. Using this (C, γ) parameter set, the highest 10-fold CV accuracy achieved for the fraud detection model was 86.43% with an average hit-rate of 77.41%. Accuracy and hit-rate for the fraud detection model are defined conceptually as illustrated in Table II.
TABLE II ALGORITHM FOR CALCULATION OF ACCURACY AND HIT-RATE
Step Description 1. 2. 3. 4. 5. 6. 7. 8. 9.
10. 11. 12. 13. 14. 15. 16. 17. 18. 19.
w = 0; x = 0; y = 0; z1 = Class label vector used for testing z2 = Class label vector of predicted results n = Number of samples of z1 for i = 1 to n
if z1(i) = z2(i) w = w + 1
end end for j = 1 to n
if z2(j) = Class 1 or z2(j) = Class 2 x = x + 1
if z1(j) = Class 1 or z1(j) = Class 2 y = y + 1 end
end end accuracy = 100*(w/n) hitrate = 100*(x/y)
I. SVM Prediction and Pilot Testing For detecting fraudulent electricity consumers, the trained
fraud detection model was tested with TNBD e-CIBS data from three towns in the state of Kelantan in Malaysia. These towns are listed in Table III. Results obtained from pilot testing carried out indicated an average LIBSVM prediction accuracy of 72.60%. Customer data for all three towns is simulated with the fraud detection model to retrieve lists of fraud suspected customers. The C-SVM prediction engine proposed for fraud electricity consumer detection is illustrated in Fig. 6.
IV. EXPERIMENTAL RESULTS Pilot testing results obtained from TNBD for manual onsite
inspection of NTL activities carried out for towns given in Table III provided feedback that a hit-rate of 22% was achieved i.e., percentage of customers detected by TNBD as fraud cases from the total customers short listed by the fraud detection model. The other 78% cases short listed as fraud met the following criteria:
• Replaced meters • Abundant house
TABLE III TEST BED USED FOR PREDICTING FRAUD ELECTRICITY CONSUMERS
City Number of customers Fraud cases previously detected by TNBD
Gua Musang 13,045 0 Kuala Krai 18,880 37 Kota Bharu 76,595 101
Fig. 6. Separating class boundaries of 4-class C-SVM classifier using RBF kernel with optimized hyper-parameters
SVM Testing Data
SVM Prediction Accuracy ≥ 70%
Integration of C-SVM output with Customer
Record Database
Fraud Suspected Customers from
Testing Data
No
C-SVM Prediction
Yes
Customer Record
Database
End of SVM Prediction
Start of SVM Prediction
Find optimal SVM hyper-
parameters using Grid-Search
Fraud Detection Model
Retrain multi-class C-SVM Classifier
Fig. 6. Flowchart of C-SVM prediction engine for fraud electricity consumer detection
Testing data used: 1. Gua Musang 2. Kuala Krai 3. Kota Bharu
911

2nd IEEE International Conference on Power and Energy (PECon 08), December 1-3, 2008, Johor Bahru, Malaysia.
• Change of tenant • Faulty meter wiring
Since load consumption patterns of these four (4) types of cases results in a similar load profiles as fraud cases, a logical decision based expert system was implemented to eliminate customers matching the four types of criteria. Inspection of load profiles for was performed manually to determine common characteristics distinguishing these four cases amongst all fraud cases detected by TNBD. The expert system eliminated all four types of cases within short listed customers using conditions: Pclass1 > 0.73 and Pclass2 > 0.25 and Pclass3 < 0.01 and Pclass4 < 0.01 with load profile conditions listed in Table IV.
Performance of the fraud detection system by implementing
the expert system increased the fraud detection hit-rate from 22% to an acceptable value of 53%. This increment results as a cause of eliminating a majority of unwanted customers. The stand-alone GUI software developed for fraud detection is shown in Fig. 7.
V. CONCLUSION This paper presents a novel classification technique for
detection of NTLs in the electric utility market. More specifically, this study applies a proposed framework for NTL analysis to detect and predict suspicious patterns of abnormal consumption behavior. A range of NTL sources have been
considered, including meter tampering and faulty metering. The framework proposed for NTL analysis uses SVM to represent kWh consumption characteristics of customers, to build a fraud detection model for classification of customer load profiles. Results obtained show that the proposed framework can be used for reliable detection of fraudulent electricity consumers. The method of using SVM for fraud detection proved to be very promising. Firstly, SVM has non-linear dividing hypersurfaces that give it high discrimination. Secondly, it provides good generalization ability for unseen data classification. Furthermore, with the implementation of the proposed fraud detection system a hit-rate of 50% will be achievable. This will benefit TNB not only in improving its handling of NTLs, but will complement their existing on-going practices, and it is envisaged that tremendous savings will result from the use of the system.
REFERENCES [1] R. Jiang, H. Tagaris, A. Lachsz, and M. Jeffrey, “Wavelet Based Feature
Extraction and Multiple Classifiers for Electricity Fraud Detection” in Proc. of IEEE/PES T&D Conference and Exhibition 2002: Asia Pacific, Vol. 3, pp. 2251-2256.
[2] C. R. Paul, “System loss in a Metropolitan utility network” IEEE Power Engineering Journal, pp. 305-307, Sept. 1987.
[3] I. E. Davidson, A. Odubiyi, M. O. Kachienga, and B. Manhire, “Technical Loss Computation and Economic Dispatch Model in T&D Systems in a Deregulated ESI” IEEE Power Eng. Journal, Apr. 2002.
[4] Annual Report Tenaga Nasional Berhad 2004, TNB 2004. [5] T. B. Smith, “Electricity theft: A comparative analysis” Energy Policy,
Vol. 32, pp. 2067-2076, 2004. [6] M. S. Alam, E. Kabir, M. M. Rahman, and M. A. K. Chowdhury,
“Power sector reform in Bangladesh: Electricity distribution system” Energy, Vol. 29, pp. 1773-1783, 2004.
[7] A. Kumar and D. D. Saxena, “Decision priorities and scenarios for minimizing electrical power loss in an India power system network” Electrical Power Components and Systems, Vol. 31, pp. 717-727, 2003.
[8] M. A. Ram and M. Shrestha, “Environmental and utility planning implications of electricity loss reduction in a developing country: A comparative study of technical options” International Journal of Energy Research, Vol. 22, pp 47-59.
[9] A. H. Nizar, Z. Y. Dong, and Y. Wang, “Power Utility Nontechnical Loss Analysis With Extreme Learning Machine Model” IEEE Trans. on Power Systems, Vol. 23, No. 3, pp. 946-955, August 2008.
[10] J. W. Fourie and J. E. Calmeyer, “A statistical method to minimize electrical energy losses in a local electricity distribution network” in Proc. of the 7th IEEE AFRICON Conference Africa, Sept. 2004.
[11] A. H. Nizar, Z. Y. Dong, J. H. Zhao, P. Zhang, “A Data Mining Based NTL Analysis Method” IEEE PES General Meeting, pp. 1-8, 2007.
[12] J. R. Galvan, A. Elices, A. Munoz, T. Czernichow, and M. A. Sanz-Bobi, “System for Detection of Abnormalities and Fraud in Customer Consumption” in Proc. of the 12th Conference on the Electric Power Supply Industry, Nov 1998.
[13] A. H. Nizar, Z. Y. Dong, M. Jalaluddin, and M. J. Raffles, “Load Profiling Non-Technical Loss Activities in a Power Utility” in Proc. of First International Power and Energy Conference (PECON), Nov. 2006.
[14] D. Gerbec, S. Gasperic, I. Smon, and F. Gubina, “Allocation of the load profiles to consumers using probabilistic neural networks” IEEE Trans. on Power Systems, Vol. 20, No. 2, pp. 548-555, May 2005.
[15] V. Vapnik. Statistical Learning Theory, John Wiley & Sons, 1998. [16] D. Wang, D. S. Yeung, E. C. C. Tsang, “Weighted Mahalanobis
Distance Kernels for Support Vector Machines” IEEE Trans. on Neural Networks, Vol. 18, No. 5, pp. 1453-1462, Sept. 2007.
[17] C.-C. Chang and C.-J. Lin. LIBSVM: A library for support vector machines. [Online]. Available: http://www.csie.ntu.edu.tw/~cjlin/libsvm
[18] C.-W. Hsu, C.-C. Chang, and C.-J. Lin. A practical guide to support vector classification. Technical report, Dept. of Computer Science, National Taiwan University, 2003.
Fig. 7. GUI software developed for fraud detection
TABLE IV FILTERING CONDITIONS FOR IMPROVING FRAUD DETECTION HITRATE
Filtering conditions Description
1.0 < N24 < 4.0 N24 represents feature 24 i.e., 24rd average daily kWh consumption feature value in the load profile.
1.0 < N23 < 4.0 N23 represents feature 23 i.e., 23rd average daily kWh consumption feature value in the load profile.
1.5 > Nmin > 3 Nmin represents the minimum kWh consumption within the load profile.
8 > Nmax > 12 Nmax represents the maximum kWh consumption within the load profile.
Nmin-max > 6.5 Nmin-max represents the difference between the maximum and the minimum kWh consumptions within a load profile.
912