Embed Size (px)
Citation preview
LOW COST DATA COMUNICATION NETWORK FORRURAL TELECOM MANAGEMENT
A THESIS
submitted by
Vinod Kumar Jammula
for the award of the degree
of
MASTER OF SCIENCE
(by Research)
DEPARTMENT OF COMPUTER SCIENCE AND ENGINEERING
INDIAN INSTITUTE OF TECHNOLOGY MADRAS, CHENNAI
SEP 2005
i
CERTIFICATE
This is to certify that the thesis entitled LOW COST DATA COMMUNICATION
NETWORK FOR RURAL TELECOM MANAGEMENT submitted by Vinod
Kumar Jammula to the Indian Institute of Technology, Madras for the award of the
degree of Master of Science by Research is a bonafide record of research work carried
out by him under our supervision. The contents of this thesis, in full or in parts, have not
been submitted to any other Institute or University for the award of degree or diploma
Place: Chennai 600 036 Dr. Timothy A Gonsalves &
Date: 12-09-2005 Dr. Hema A Murthy
Research Guides

ii
ACKNOWLEDGMENTS
I express my sincere gratitude to my guide, Dr. Timothy A. Gonsalves, for his
invaluable guidance. I am greatly indebted to him for the time he spent with me amidst
his busy schedules and the care he took to help me put this work in a written form. I
thank my guide Dr Hema A. Murthy, in giving me constant help throughout period of
M.S. I thank the head of the department, faculty and the staff of Computer Science
and Engineering for all the help and facilities they provided me. I thank all members of
GTC for their valuable suggestions during the GTC meetings.
I express my sincere thanks to Mr. Shirish Purohit, Mr. R. Balajee and Midas
Communication Technologies Pvt. Ltd., Chennai for providing me an opportunity to
work in the corDECT system. I express my thanks to my Internal Guide Mr. R. Kumar
for supporting me to complete my thesis. My special thanks to Mr. C. Jagadish for
helping me in modeling the study and performance measurements in the corDECT
system. I thank Mr P. Hari Krishnan who worked with me to implement the project.
I thank my friends Mr. Jagadeesha Veerabahu, Mrs. J. Suchithra, Mr. M.
Karthikeyan and Mr. S. Sree Hari Nagarajan for encouraging me to complete my
thesis. I thank all my colleagues and well wishers.
Last but not the least, my special thanks to my parents, brother and all family members
for their love, support and encouragement. I also thank them for their wonderful attitude
of accepting my negligence towards them without any resentment.
iii
ABSTRACT
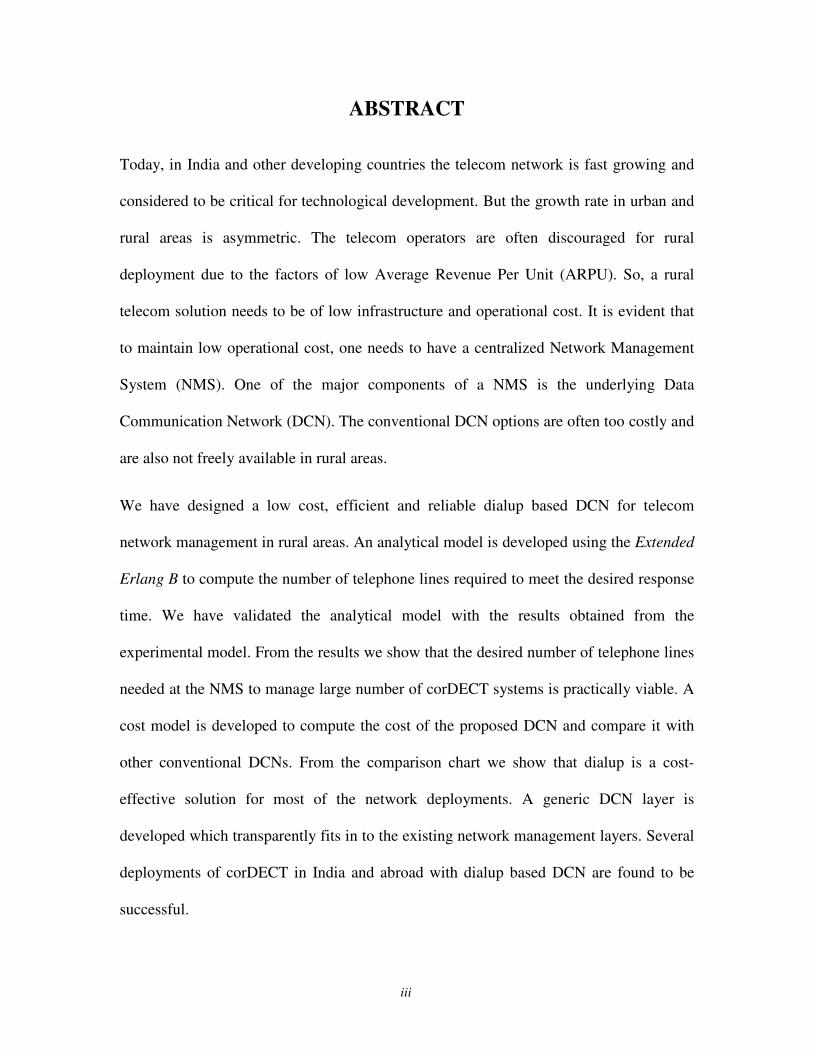
Today, in India and other developing countries the telecom network is fast growing and
considered to be critical for technological development. But the growth rate in urban and
rural areas is asymmetric. The telecom operators are often discouraged for rural
deployment due to the factors of low Average Revenue Per Unit (ARPU). So, a rural
telecom solution needs to be of low infrastructure and operational cost. It is evident that
to maintain low operational cost, one needs to have a centralized Network Management
System (NMS). One of the major components of a NMS is the underlying Data
Communication Network (DCN). The conventional DCN options are often too costly and
are also not freely available in rural areas.
We have designed a low cost, efficient and reliable dialup based DCN for telecom
network management in rural areas. An analytical model is developed using the Extended
Erlang B to compute the number of telephone lines required to meet the desired response
time. We have validated the analytical model with the results obtained from the
experimental model. From the results we show that the desired number of telephone lines
needed at the NMS to manage large number of corDECT systems is practically viable. A
cost model is developed to compute the cost of the proposed DCN and compare it with
other conventional DCNs. From the comparison chart we show that dialup is a cost-
effective solution for most of the network deployments. A generic DCN layer is
developed which transparently fits in to the existing network management layers. Several
deployments of corDECT in India and abroad with dialup based DCN are found to be
successful.
iv
��������������
TABLE OF CONTENTS __________________________________ iv
LIST OF FIGURES_______________________________________ vii
LIST OF TABLES________________________________________ ix
NOTATIONS _____________________________________________ x
Chapter 1 Introduction _____________________________________ 11.1 Rural Telecom in India_________________________________________1
1.2 The corDECT Wireless in Local Loop System ______________________2
1.3 Network Management System (NMS)_____________________________3
1.4 Data Communication Network___________________________________4
1.5 Problem Definition____________________________________________5
1.6 Contributions ________________________________________________5
1.7 Thesis Organization ___________________________________________6
Chapter 2 Background _____________________________________ 72.1 Existing DCN Solutions________________________________________7
2.1.1 RS 232 Serial DCN ________________________________________7
2.1.2 LAN DCN _______________________________________________8
2.1.3 Permanent Leased Line DCN ________________________________8
2.1.4 Internet as DCN ___________________________________________9
2.2 The corDECT Network Management System ______________________10
2.2.1 corDECT NMS Architecture ________________________________11
2.2.2 Features of the corDECT NMS ______________________________11
2.2.3 Functionality in each FCAPS area____________________________12
2.3 Dialup Connection Establishment _______________________________15
2.4 SUMMARY ________________________________________________17
v
Chapter 3 Rural DCN _____________________________________ 183.1 Overview of Dialup __________________________________________18
3.2 Proposed DCN Model ________________________________________19
3.2.1 Operation at the Network Element ___________________________20
3.2.2 Operation at Network Management System ____________________21
3.3 Features and Techniques used in the proposed model ________________21
3.3.1 Job Execution ___________________________________________21
3.3.2 Timers used in connection establishment ______________________22
3.3.3 Timers used in connection maintenance _______________________23
3.3.4 Security in dialup_________________________________________24
3.4 Alarm Delivery______________________________________________25
3.4.1 Alarm delivery mechanism _________________________________26
3.5 Summary __________________________________________________27
Chapter 4 Performance Analysis and Cost Model ______________ 284.1 Introduction ________________________________________________28
4.2 Performance Model __________________________________________29
4.2.1 Alarm delivery Mechanism _________________________________30
4.2.2 Calculation Procedure _____________________________________30
4.3 VALIDATION______________________________________________31
4.3.1 Validation Procedure ______________________________________32
4.4 Experimental Model__________________________________________32
4.5 Validation of the analytical model _______________________________33
4.6 Performance Results__________________________________________34
4.6.1 Time taken for Data Transfer _______________________________36
4.6.2 Homogeneous Network Elements ____________________________37
4.6.3 Homogeneous Network Elements with message diversity _________38
4.6.4 Heterogeneous Network Elements with message diversity_________40
4.7 Cost Model _________________________________________________43
4.7.1 Cost Calculation _________________________________________44
4.7.2 Charges for Permanent leased Connectivity ____________________44
4.7.3 Infrastructure Cost ________________________________________45
vi
4.7.4 Cost Comparision ________________________________________45
4.8 Summary __________________________________________________46
Chapter 5 Design and Implementation _______________________ 47
5.1 Design Issues _______________________________________ 47
5.2 Software Architecture _______________________________ 485.2.1 Management Application layer ______________________________49
5.2.2 Job Management Layer ____________________________________50
5.2.3 Connection Management Layer______________________________55
5.2.4 Intra DCN Communication _________________________________59
5.3 Alarm Delivery Implementation ________________________________60
5.3.1 Software Architecture _____________________________________60
5.3.2 Store And Forward Trap (SAFT) ____________________________60
5.3.3 TxAlarms Job ___________________________________________62
5.3.4 Alarm Regenerator _______________________________________62
5.4 Alarm Generator_____________________________________________62
5.5 Summary __________________________________________________63
Chapter 6 Conclusions_____________________________________ 64
FUTURE WORK_________________________________________ 64
References_______________________________________________ 66
vii
���������� � � ��
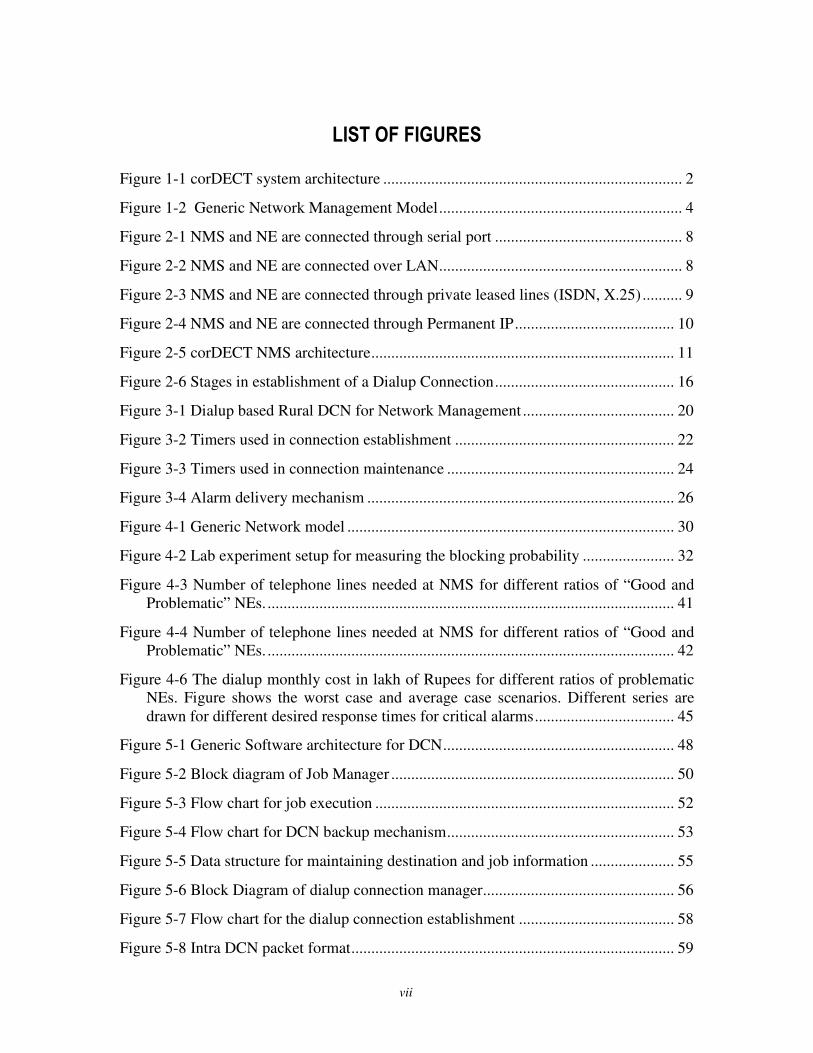
Figure 1-1 corDECT system architecture ........................................................................... 2
Figure 1-2 Generic Network Management Model............................................................. 4
Figure 2-1 NMS and NE are connected through serial port ............................................... 8
Figure 2-2 NMS and NE are connected over LAN............................................................. 8
Figure 2-3 NMS and NE are connected through private leased lines (ISDN, X.25).......... 9
Figure 2-4 NMS and NE are connected through Permanent IP........................................ 10
Figure 2-5 corDECT NMS architecture............................................................................ 11
Figure 2-6 Stages in establishment of a Dialup Connection............................................. 16
Figure 3-1 Dialup based Rural DCN for Network Management ...................................... 20
Figure 3-2 Timers used in connection establishment ....................................................... 22
Figure 3-3 Timers used in connection maintenance ......................................................... 24
Figure 3-4 Alarm delivery mechanism ............................................................................. 26
Figure 4-1 Generic Network model .................................................................................. 30
Figure 4-2 Lab experiment setup for measuring the blocking probability ....................... 32
Figure 4-3 Number of telephone lines needed at NMS for different ratios of “Good andProblematic” NEs....................................................................................................... 41
Figure 4-4 Number of telephone lines needed at NMS for different ratios of “Good andProblematic” NEs....................................................................................................... 42
Figure 4-6 The dialup monthly cost in lakh of Rupees for different ratios of problematicNEs. Figure shows the worst case and average case scenarios. Different series aredrawn for different desired response times for critical alarms................................... 45
Figure 5-1 Generic Software architecture for DCN.......................................................... 48
Figure 5-2 Block diagram of Job Manager ....................................................................... 50
Figure 5-3 Flow chart for job execution ........................................................................... 52
Figure 5-4 Flow chart for DCN backup mechanism......................................................... 53
Figure 5-5 Data structure for maintaining destination and job information ..................... 55
Figure 5-6 Block Diagram of dialup connection manager................................................ 56
Figure 5-7 Flow chart for the dialup connection establishment ....................................... 58
Figure 5-8 Intra DCN packet format................................................................................. 59

viii
Figure 5-9 Block diagram for delivering the alarms to NMS........................................... 60
Figure 5-10 Flow chart for alarm delivery mechanism .................................................... 61
ix
��������������
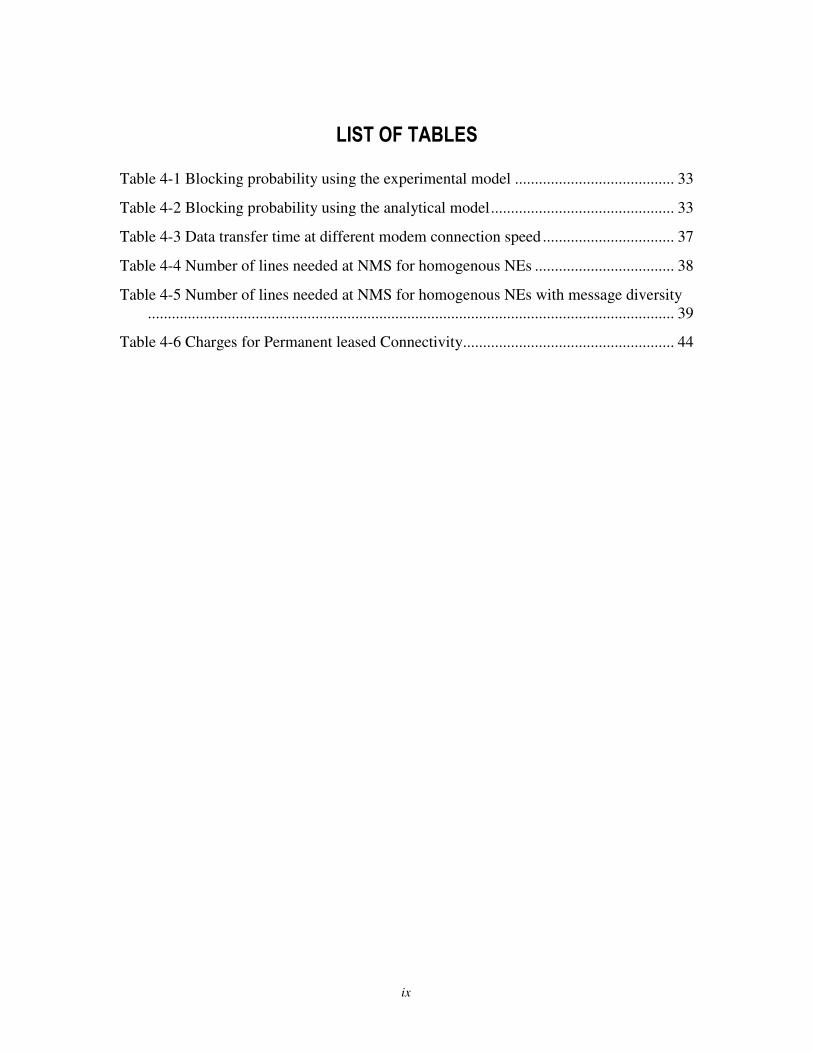
Table 4-1 Blocking probability using the experimental model ........................................ 33
Table 4-2 Blocking probability using the analytical model.............................................. 33
Table 4-3 Data transfer time at different modem connection speed ................................. 37
Table 4-4 Number of lines needed at NMS for homogenous NEs ................................... 38
Table 4-5 Number of lines needed at NMS for homogenous NEs with message diversity.................................................................................................................................... 39
Table 4-6 Charges for Permanent leased Connectivity..................................................... 44
x
�������
NNE Number of NEs
NC Number of calls per hour
NL Number of telephone lines
TH Average call holding time
TR Response time to receive alarms at NMS
BHT Busy Hour Traffic
λM Message arrival rate
SM Average message size
ID Inter-dial interval
PB Blocking probability
BW Bandwidth of the link

1
�� �� � � � � ��� �
� �� � � � � ���� �� � � � ��� ��� � ��
While the rate of growth of telecom services to rural areas has increased, it has been
slower than in urban areas. As of September 2004, while the national tele-density in India
was around 8.68%, and urban tele-density was 23.3%, the rural tele-density was 1.8%
[1]. The growing gap between rural and urban tele-densities is evident. India has already
crossed the 100 million-telephone subscriber mark and the vision is to have 250 million
telephones and a tele-density of 22 percent in 2007 [2].
Between the urban and rural telecom infrastructure, the critical differentiation is in the
local loop. About 80 per cent of the cost of telecom in rural areas is that of the local loop.
The telecom operators often neglect deployment in undeveloped/rural areas because of
several factors [3]:
• Low population density
• Low affordability and usage
• Lack of skilled personnel
It is apparent that to achieve the tremendous growth in rural telecom that is targeted, it is
important that the systems have low infrastructure cost and low operational cost.
2
� �� �� � �� � � ���! �� � �� " " ��� ��� � � ���� � # ��$ " �� �
With the cost of wireless technology systems decreasing steadily, it would become more
economical to adopt predominantly wireless technology in rural networks.
To increase the tele-density in the rural areas at an affordable cost, the TeNeT Group of
IIT Madras and Midas Communication Technologies (P) Ltd, Chennai have developed
the corDECT Wireless in Local Loop system. It acts as an Access Network (AN)
connected to a Local Exchange (LE). corDECT is based on the DECT standard [4]. It is
a cost-effective WLL system [5] that is widely deployed in India and other countries to
serve the data and voice needs of urban and rural population. This DECT based system
provides simultaneous toll quality voice and 35 or 75 kbps Internet access to the
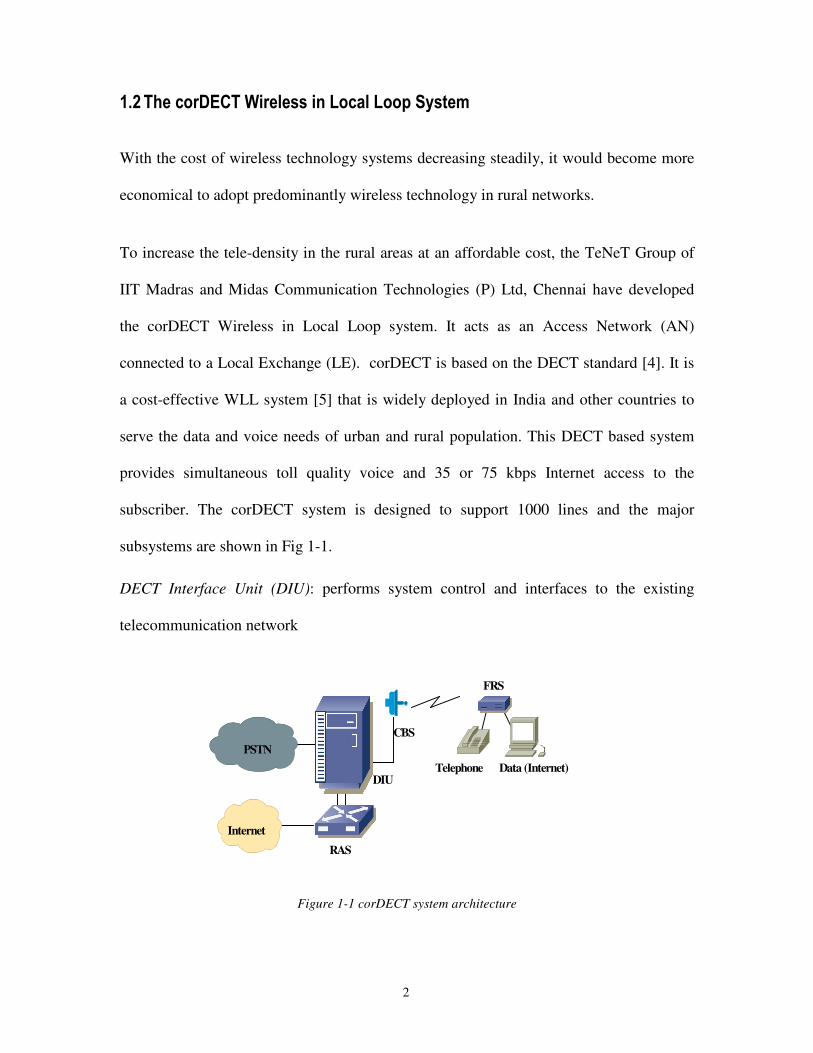
subscriber. The corDECT system is designed to support 1000 lines and the major
subsystems are shown in Fig 1-1.
DECT Interface Unit (DIU): performs system control and interfaces to the existing
telecommunication network
Figure 1-1 corDECT system architecture
RAS
DIU
CBS
FRS
Telephone Data (Internet)
Internet
PSTN
3
Compact Base Station (CBS): provides wireless access to subscribers in the area on
twelve simultaneous channels
Fixed Remote Station (FRS): a fixed wireless terminal that relays the voice and data
traffic between the subscriber end and the DIU
Remote Access Switch (RAS): carries the IP data to the Internet backbone
Base Station Distributor (BSD): supports up to four CBS. The BSD is designed to extend
corDECT coverage to pockets of subscribers located far away from the DIU
Relay Base Station (RBS): extends the range of the corDECT system by relaying DECT
packets between the CBS and subscriber units. The maximum Line of Sight (LOS) range
between a CBS and a RBS is 25 km, while the maximum LOS range between the RBS
and corDECT subscribers is 10 km
� �% � �& � � ' �( � � � ) � � � � ���$ " �� � �*( �+
A wireless solution like corDECT reduces both the infrastructure and operational costs of
the system. To keep the operational costs still lower, telecom equipment is kept
unmanned and managed from a centralized Network Management System. With the
increase in the size and complexity of any network, a number of difficulties arise in
managing them [6], such as
• Identifying and configuring the network elements
• Protecting the equipment and data from unauthorized access and manipulation
• Tuning the network for better performance
• Accounting for the use of different resources by the user
4
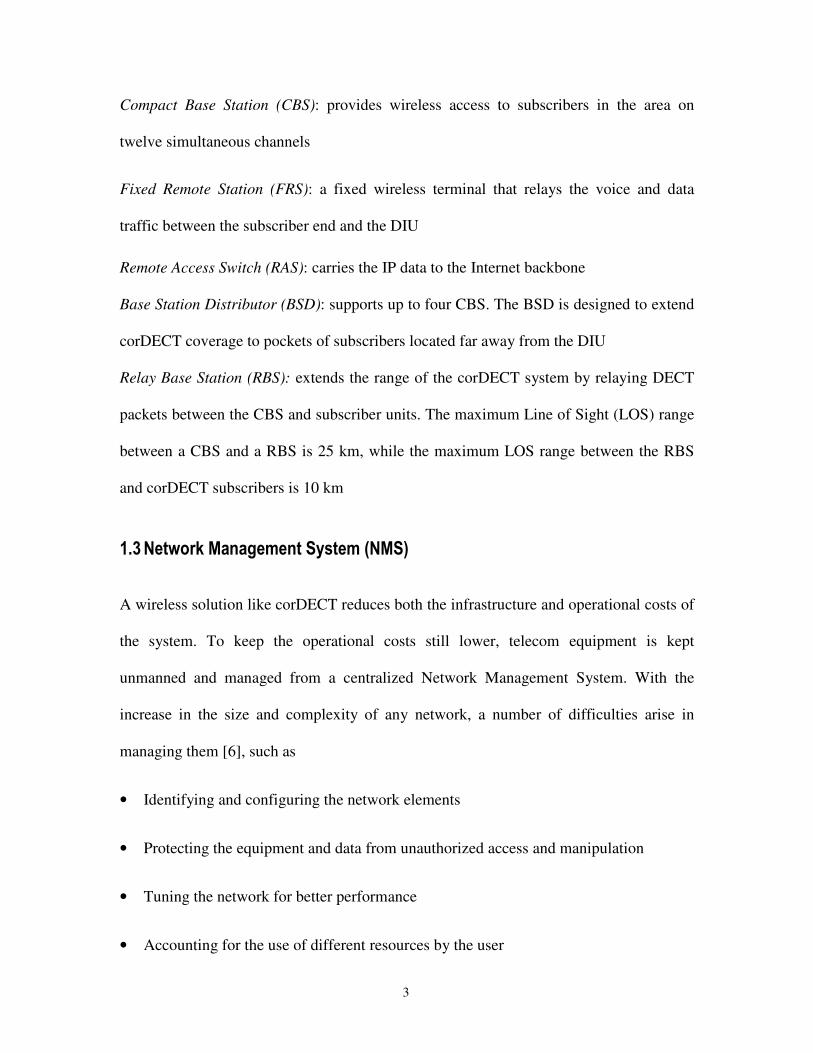
• As organizations rely more on the networks, the consequences of failure are
increasingly expensive.
ManagementStation
NetworkElement
DCN
Figure 1-2 Generic Network Management Model
Generally, the Data Communication Network (DCN) is one of the major contributors for
the operational and infrastructure cost of the NMS system. Hence the DCN becomes a
very important constituent of an efficient rural telecom management platform.
� �, � � �� �� � � � � �� � ��� � �� �& � � '
One of the major components of Network Management is the underlying DCN. The
major criteria that any data communication network must meet are performance,
consistency, reliability, recovery and security [7]. For a rural network these must be
achieved at an affordable cost.
Performance: Performance is defined as the rate of transference of error-free data. It is
measured by the response time. Response time is the elapsed time between the end of an
inquiry and the beginning of a response.
Consistency: Consistency is the predictability of response time and accuracy of data.
5
Reliability: Reliability is the measure of how often a network is usable. MTBF (Mean
Time Between Failures) is a measure of the average time a component is expected to
operate between failures, and is normally provided by the manufacturer.
Recovery: Recovery is the network's ability to return to a prescribed level of operation
after a network failure. This level is where the amount of lost data is nonexistent or at a
minimum. Recovery is based on having back-up files.
Security: Security is the protection of hardware, software and data from unauthorized
access.
� �- . � � / �� � � � 0�� ���� �
To achieve a higher tele-density, rural telephony has to be increased without being
limited because of the cost involved in managing the equipment. The major cost of a
management solution for a rural telecom network management is consumed by the DCN.
This provides the motivation for providing a low-cost, robust and efficient DCN which is
at once suitable for use in managing telecom network in rural areas and accommodates
the vagaries of the management traffic. The need to have a secure and fallback option as
part of the design makes this thesis challenging and interesting.
� �1 � � �� �/ � ��� � "
In this thesis, a dialup based Data Communication Network is proposed for managing the
rural telecom equipment.
6
The following are the major contributions of the thesis
• Study of various Data Communication Network for managing telecom equipment in
rural areas
• Design and development of dialup based DCN
• Store and Forward Trap (SAFT) mechanism for reliable alarm delivery and online
alarm compression for reducing the bandwidth requirements
• Development of an analytical model for evaluation of cost and response time
• Development of a trace-driven lab model for validation of the analytical model
• Calculation of number of lines required at NMS with the help of the analytical model
for receiving the alarms from N Network Elements (NE) with different alarm arrival
rates
� �2 �� � " �" ��� ) � � �3 � ��� �
Chapter 2 presents an overview of the existing DCNs used for Network Management. A
brief description of the corDECT Network Management system is also presented in this
chapter. Chapter 3 presents an overview of the proposed rural DCN for corDECT. It also
lists the different techniques used in this DCN. Chapter 4 presents the performance
model of the DCN. The results of the performance analysis of DCN are discussed. It also
describes the cost model of the DCN. Chapter 5 describes the design and implementation
details of the rural DCN. Finally, Chapter 6 presents the conclusions of the thesis with a
brief discussion of possible further research.
7
� � # �� � ��
�� � ' ) � � � � �
A good understanding of the existing data communication networks [8] used in Network
Management System will help in understanding the proposed DCN solution. Hence this
chapter provides a comparative overview of the various DCNs used for network
management. A functional description of the corDECT Network Management System is
given. Since the proposed DCN solution is based on dialup, this chapter also gives an
overview of how a dialup connection is established between two hosts.
� �� �4 �" ��� ) � ��� �� ��� � "
This section explains about the various DCNs traditionally used for Network
Management. It also lists the advantages and disadvantages of each DCN.
� �� �� � ��� % � ��� � �� ��
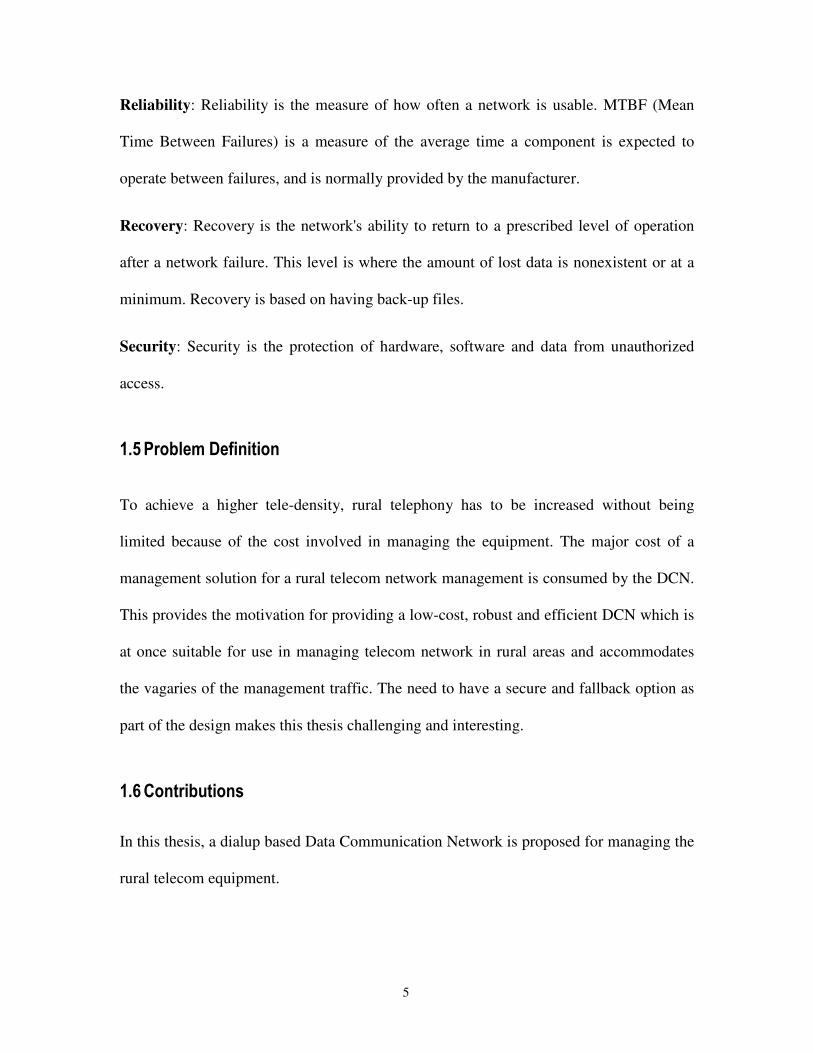
The simplest medium of PC to PC communication is RS 232 serial communication. A
limited maximum speed of 112 kbps can be achieved via the RS232 port. This has a
distance limitation of 15 to 150 meters. This is suitable if the NMS station is co-located
with the NE in the same room as shown in Fig 2-1. Due to the limitation on available
serial ports on a PC and the point-to-point nature of RS 232 connectivity, the number of
NE’s that can be connected to a NMS station with this kind of DCN is highly limited.
8
NMS
corDECT 1 corDECT 2
Figure 2-1 NMS and NE are connected through serial port
� �� �� ���
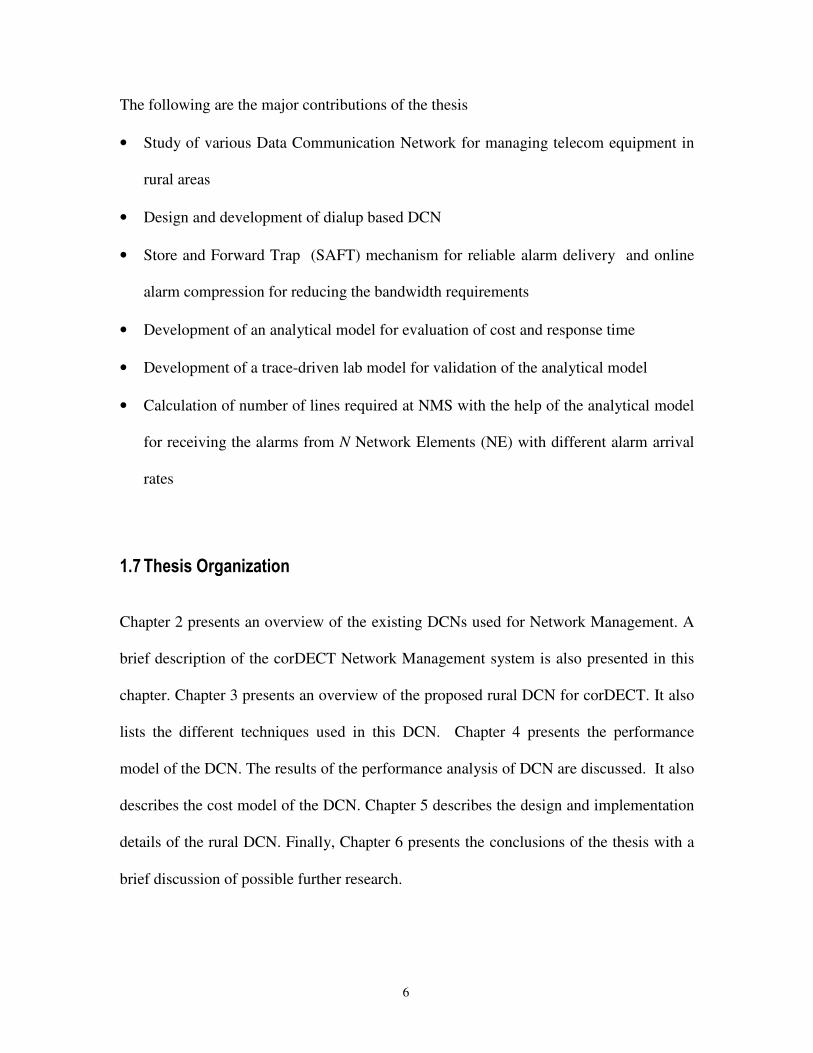
The popular and commonly used DCN is a LAN network such as an Ethernet. A LAN is
a cost-effective, fast and reliable mode of communication but still has the limitation on
the distance it can cover. The maximum distance that can be covered by Ethernet with
repeaters is approximately 3 kilometers. It is suitable in the case of co-located NE and
NMS stations within the same building. The NE and NMS connected over a LAN are
shown in Fig 2-2.
� �� �% . � � � � � � � ���� � " � � ���� � �
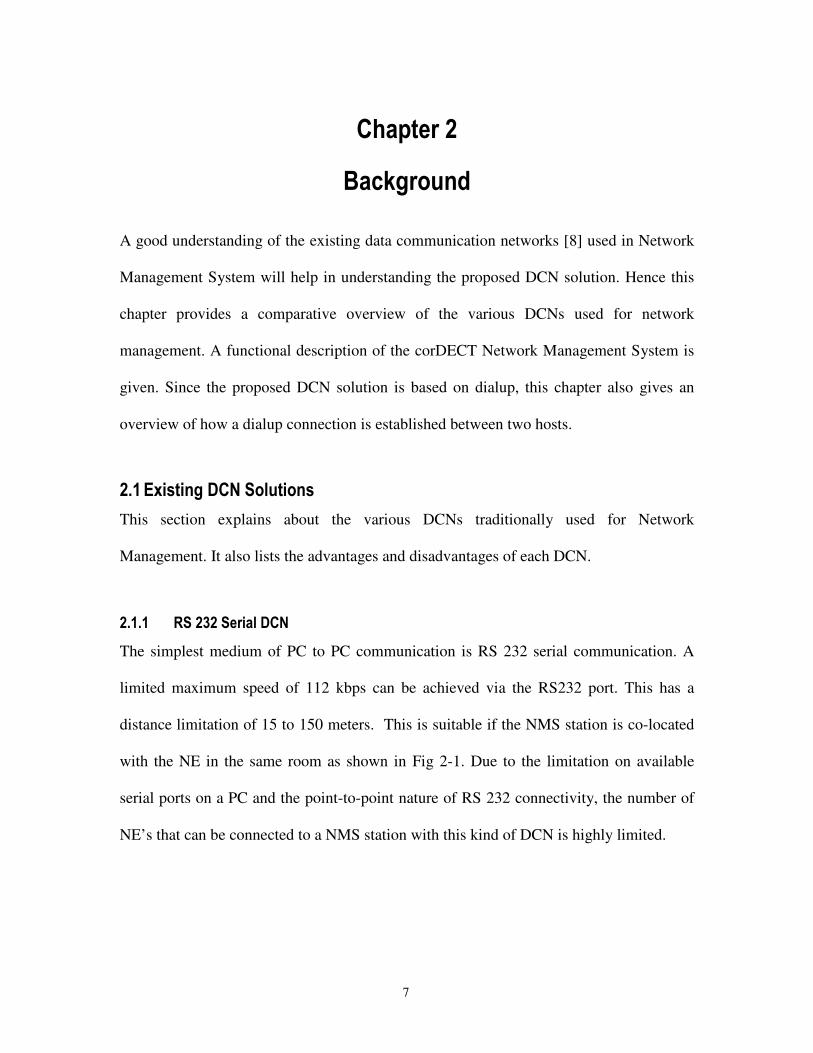
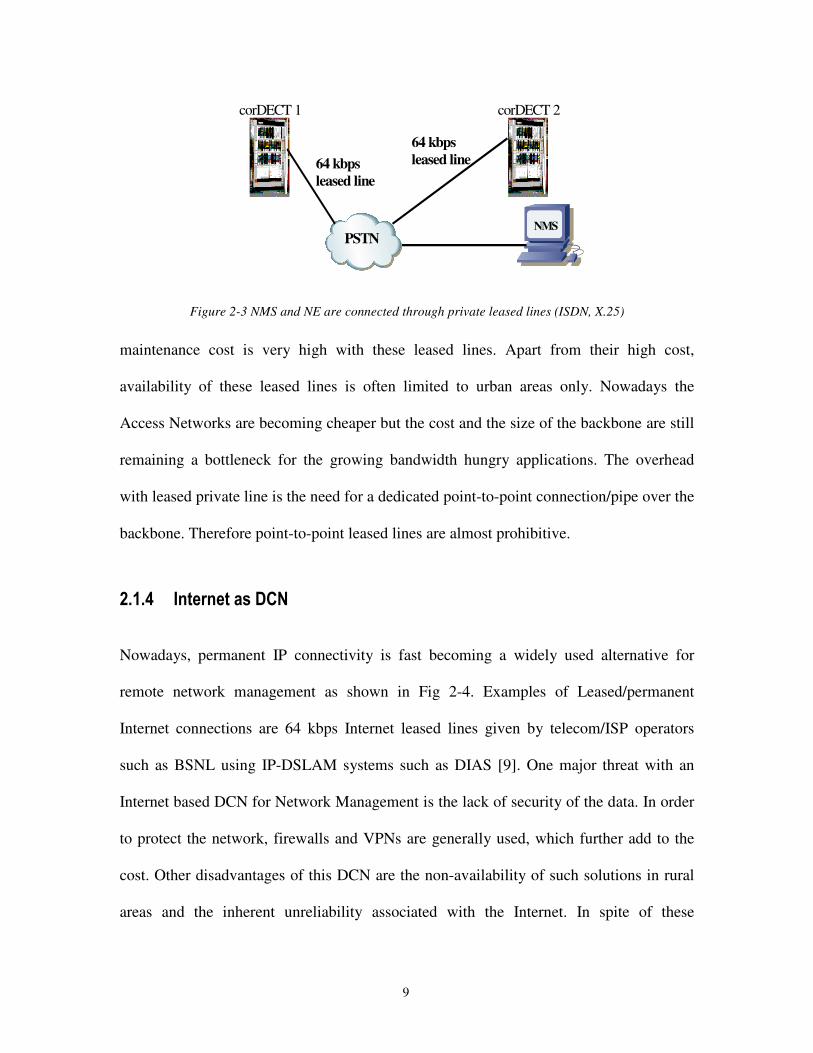
Leased lines are widely used for remote network management as shown in Fig 2-3.
Examples of a few leased private lines are ISDN, X.25 etc. Infrastructure cost and
LAN
NMS
corDECT 1 corDECT 2
Figure 2-2 NMS and NE are connected over LAN
9
64 kbpsleased line
64 kbpsleased line
PSTNNMS
corDECT 1 corDECT 2
Figure 2-3 NMS and NE are connected through private leased lines (ISDN, X.25)
maintenance cost is very high with these leased lines. Apart from their high cost,
availability of these leased lines is often limited to urban areas only. Nowadays the
Access Networks are becoming cheaper but the cost and the size of the backbone are still
remaining a bottleneck for the growing bandwidth hungry applications. The overhead
with leased private line is the need for a dedicated point-to-point connection/pipe over the
backbone. Therefore point-to-point leased lines are almost prohibitive.
� �� �, �� �� � � � ��� " �
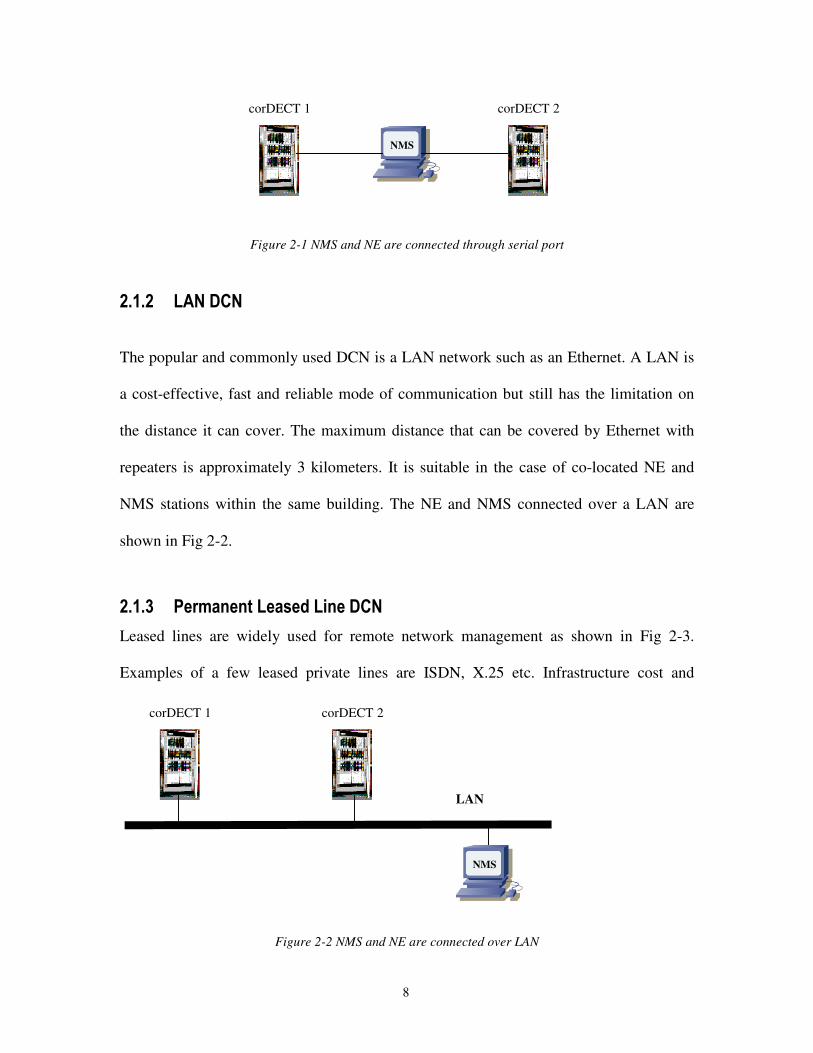
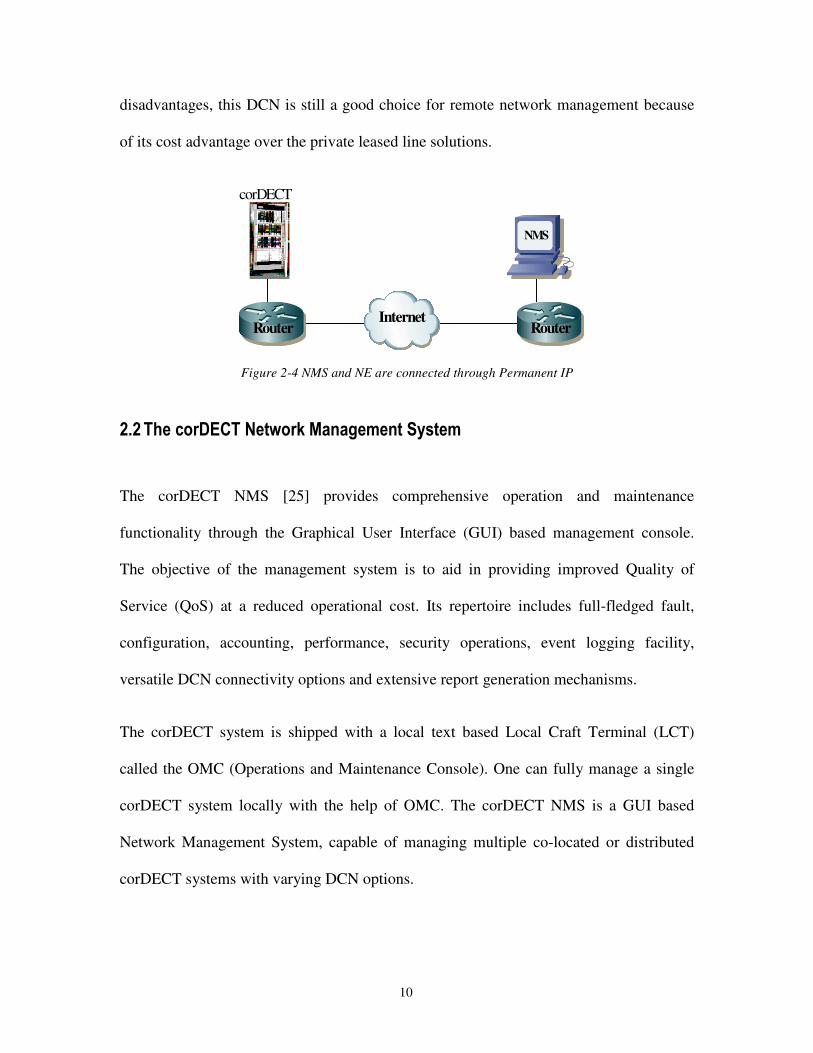
Nowadays, permanent IP connectivity is fast becoming a widely used alternative for
remote network management as shown in Fig 2-4. Examples of Leased/permanent
Internet connections are 64 kbps Internet leased lines given by telecom/ISP operators
such as BSNL using IP-DSLAM systems such as DIAS [9]. One major threat with an
Internet based DCN for Network Management is the lack of security of the data. In order
to protect the network, firewalls and VPNs are generally used, which further add to the
cost. Other disadvantages of this DCN are the non-availability of such solutions in rural
areas and the inherent unreliability associated with the Internet. In spite of these
10
disadvantages, this DCN is still a good choice for remote network management because
of its cost advantage over the private leased line solutions.
NMS
InternetRouter Router
corDECT
Figure 2-4 NMS and NE are connected through Permanent IP
� �� �� � �� � � ���� �& � � ' �( � � � ) � � � � ���$ " �� �
The corDECT NMS [25] provides comprehensive operation and maintenance
functionality through the Graphical User Interface (GUI) based management console.
The objective of the management system is to aid in providing improved Quality of
Service (QoS) at a reduced operational cost. Its repertoire includes full-fledged fault,
configuration, accounting, performance, security operations, event logging facility,
versatile DCN connectivity options and extensive report generation mechanisms.
The corDECT system is shipped with a local text based Local Craft Terminal (LCT)
called the OMC (Operations and Maintenance Console). One can fully manage a single
corDECT system locally with the help of OMC. The corDECT NMS is a GUI based
Network Management System, capable of managing multiple co-located or distributed
corDECT systems with varying DCN options.
11
The NMS provides user friendly menu driven GUI interface for interactive
operations. The NMS system can be switched off and on without affecting the operations
of the corDECT system. NMS redundancy is an added, optional feature.
� �� �� � � � ���( ���� � � ��� � �� � �
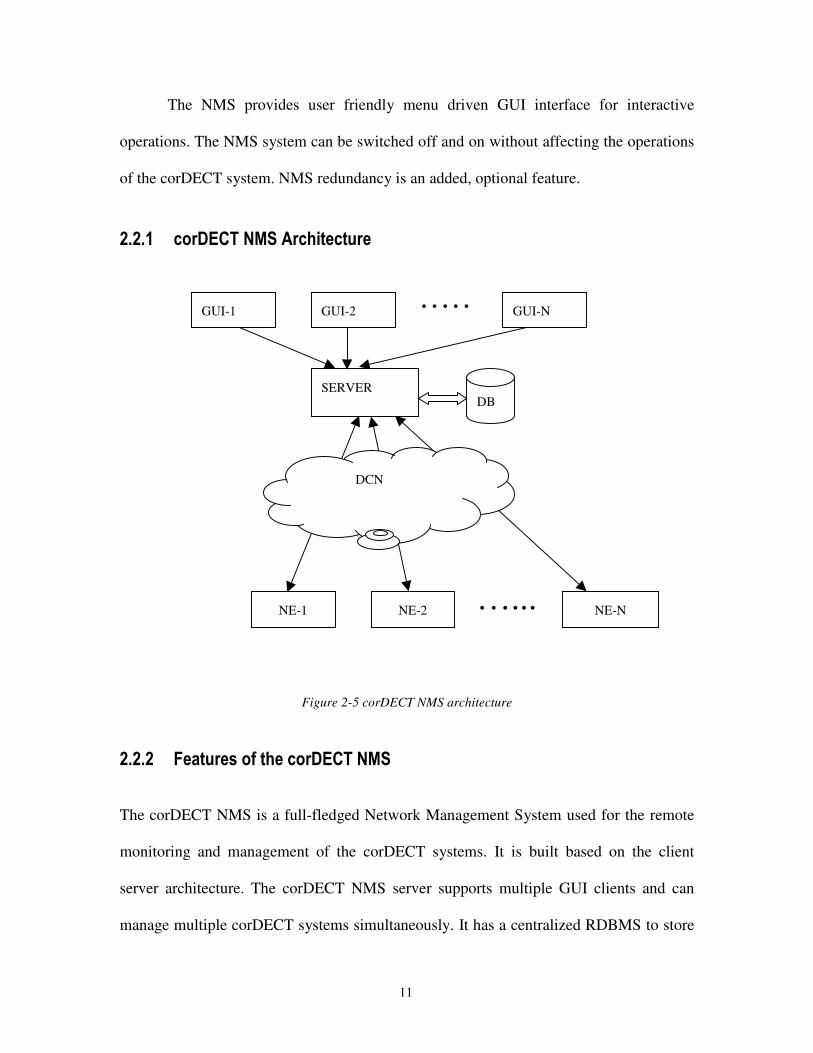
Figure 2-5 corDECT NMS architecture
� �� �� �� � �� � � " �� 0��� � �� � � ���( �
The corDECT NMS is a full-fledged Network Management System used for the remote
monitoring and management of the corDECT systems. It is built based on the client
server architecture. The corDECT NMS server supports multiple GUI clients and can
manage multiple corDECT systems simultaneously. It has a centralized RDBMS to store
SERVERDB
DCN
NE-1 NE-2 NE-N…...
GUI-1 GUI-2 GUI-N. . . . .
12
all the user data, configuration data and alarms generated from the corDECT systems.
Centralized AAA (Authorization, Authentication and Audit) functionality is supported at
the server. It provides a standard North Bound Interface (NBI) to connect to higher level
NMS systems. It is capable of managing the corDECT systems of different versions and
different PSTN connectivity (V5.2, R2MF and SS7) simultaneously.
A single NMS server can have multiple clients, and multiple operators can man separate
client machines. This gives enormous flexibility to the operator to simultaneously
manage the system on various fronts. For example, one client can be used/dedicated for
the subscriber provisioning activity, another for the field operations to monitor the
performance of the system while a third client can have his own terminal for fault
monitoring. The salient FCAPS features of the system are illustrated below.
� �� �% �� � � ��� � � ���$ ��� �� � � � ���. ��� � � �
This section lists the salient FCAPS features of the corDECT NMS system.
2.2.3.1 Fault Management
All the alarms generated from the corDECT system are classified according to the TMN
guideline [10]. Top level view of the corDECT NMS represents the consolidated status of
all the managed the corDECT systems. Zoom in facility is provided to know the status of
each subsystem of the corDECT system. It has the facility to view all pending and history
alarms specific to each subsystem with a click on the subsystem. Status is updated based
on polling and notifications. It has the facility to filter and view alarms based on different
criteria such as severity, NE, subsystem, time and alarm state. It has alarm counters to
represent count of alarms of different severities. Different colors are used to represent
13
different severities. Alarm states such as alerting, acknowledged, zombie and cleared are
maintained. On receipt of an alarm, it can be configured to do one or more of the alarm
actions, such as playing-wave-file, mail, SMS and print. It has the facility to filter the
alarms based on the user criteria. It has a rule based alarm correlation engine for concise
system status representation and a Rule based alarm escalation policy.
2.2.3.2 Performance Management
It provides online views to view the information regarding the current traffic counters and
channel occupancy. It has the facility for both graphical and textual representation of the
measured parameters along with regular polling based updates. It provides PSTN
occupancy and DECT occupancy reports to understand the performance and usage of the
corDECT system. It generates route congestion and IP port congestion reports to
understand the bottlenecks in the system towards the PSTN.
2.2.3.3 Configuration Management
It has the facility to view and change all possible configurations of the corDECT system
such as subscriber provisioning, trunk and route configuration, PSTN signaling
configurations, DECT specific configurations and access level configurations. It also has
the facility to view all the calls going through the system. All the configurations are
organized into multiple views with a user-friendly intuitive GUI. It has a real life view of
the complete system with the facility to zoom into each subsystem. It records all the
configuration changes done in the system for further usage. It provides a print facility to
print all the current configurations of the system.
14
2.2.3.4 Accounting Management
It has the facility to configure the charging details such as time zones, day zones and
charge calendar. It gives an interface to view Detailed Call Records (DCR) of a
subscriber online and also interfaces to view and update subscriber billing related details
such as bill paid status and grace days.
2.2.3.5 Security Management
Security at exchange level
It provides an interface for the operator to program subscriber call restrictions, which can
further be, controlled by the subscribers themselves.
Security for management operations
Apart from the rudimentary user/operator name and password based authentication the
NMS system has more elaborate security measures. Access privileges can be defined on
per operator basis. Access level control is possible to the granular levels. All the change
operations and alarm actions by an operator are recorded with all relevant details. For all
management operations the NE authenticates the NMS system based on the identity of a
hardware dongle physically present at the NMS server and manually configured at the
NE i.e. only authorized NMS systems can access the corDECT systems.
2.2.3.6 Backup and Restoration
NMS is equipped with an automated facility to remotely backup all the important data
(configuration, billing and log) from all the DIUs at regular intervals. The backed up data
can be written on to secondary devices such as tape and CDROM for archiving purpose.
15
In case of any disaster, it is possible to restore the configuration of the NMS or any DIU
from the latest backup copy (from tape/CDROM).
2.2.3.7 Remote Software Upgrade
The NMS facilitates to load the software centrally at the NMS and remotely upgrade the
same in all the DIUs and their corresponding subsystems. Alternately the system can be
configured to auto upgrade any subsystem software that is found to be old.
� �% �� �� # �� � � � � ��� � ��" �� / ��" � � � � �
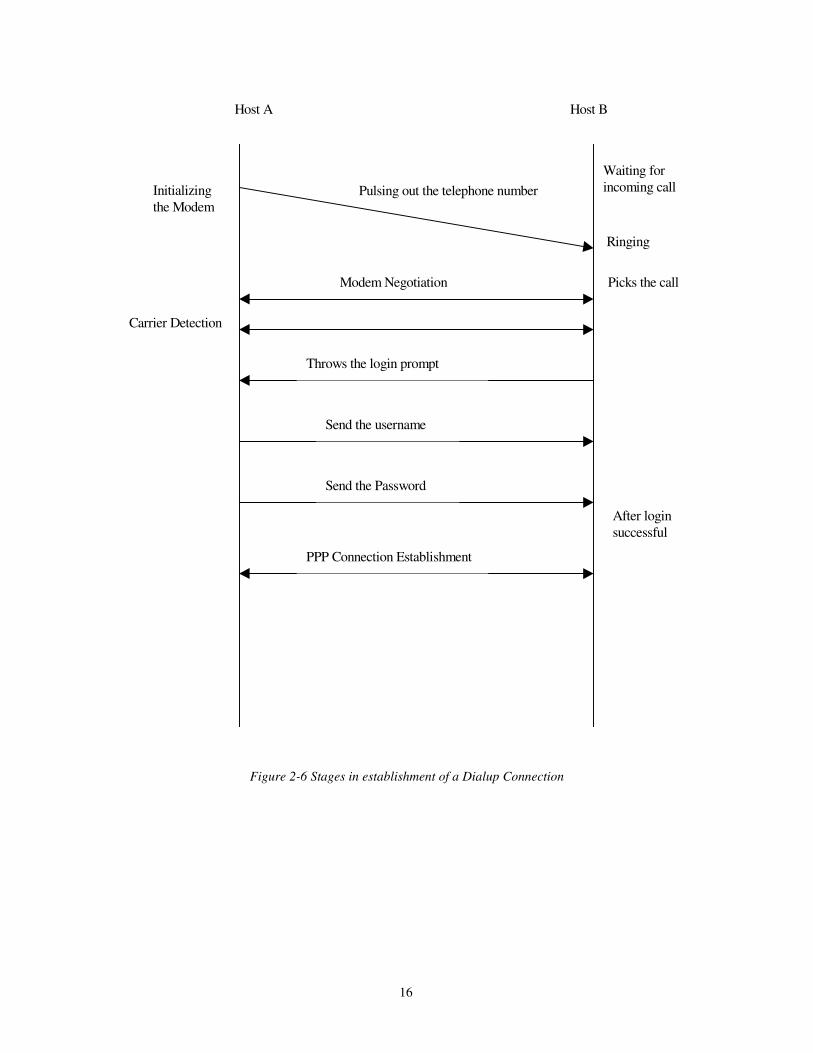
The dialup scenario of Host A calling Host B between two Linux hosts for establishing
the dialup connection is shown in Fig 2.6. The Sequence of events is explained in the
timing diagram. After Host B picks the call, modems at both ends will negotiate for the
communication parameters like baud rate etc. Once the parameters are agreed between
two ends, physical communication will be established between modems. This is followed
by user login. If login is successful, a Point to Point link (PPP) [11] will be established
between the two hosts with the pre-configured IP addresses. Using the PPP interface IP
address, all the TCP/IP [12, 13] applications can communicate between the two hosts.
16
Initializingthe Modem
Pulsing out the telephone number
Picks the call
Carrier Detection
Throws the login prompt
Send the username
Send the Password
Modem Negotiation
After loginsuccessful
PPP Connection Establishment
Ringing
Waiting forincoming call
Host A Host B
Figure 2-6 Stages in establishment of a Dialup Connection
17
� �, �� ( ( �� 5
This chapter has introduced the various data communication networks used for Network
Management. We have also looked at the architecture and features of the corDECT
Network Management System. Many of these features are highly data-centric. They
depend on timely and reliable availability of relevant data. This calls for an efficient and
reliable Data Communication Network. We also looked at the different stages in the
establishment of a dialup connection between two Hosts. With these basics in place, we
shall describe the proposed dialup based DCN solution for Network Management System
in the next chapter.
18
� � # �� � �%
� � � � ��
Various DCNs used in Network Management and features of the corDECT Network
Management System were discussed in the previous chapter. This chapter explains the
proposed Dialup based Data Communication Network (Rural DCN) for Network
Management.
% �� �6 � � 6 �� & �� 0� �� �� #
Dialup connectivity is commonly used for Internet access, where the connection request
is initiated only from one direction (subscriber side) and the other side is a Remote
Access Server (RAS). On the contrary, usage of dialup connections for telecom network
management is not very common due to several reasons. Availability and bandwidth of a
dialup connection may not be acceptable for managing large telecom networks remotely.
But, these are not significant limitations for managing small rural telecom switches.
However the underlying DCN should support the peculiarities of management traffic.
Network management has two modes of operations, namely polling or request-response
and event driven. The Management Station updates its database by means of polling
(sending requests and getting response from Network Element), and by the spontaneous
alarms received from the NE. The need and importance of either mode is a classical
debate and neither could totally replace the need for the other. Therefore the underlying
19
connectivity should be available at regular polling intervals as well as when the NE needs
to notify the NMS of alarms.
A dialup connection which is continuously up is costly and increases heavily the
occupancy of the telephone networks. Therefore demand based dialing should be
available from both the ends (NMS to NE and NE to NMS). To save on the telephone
usage charges, the frequency of connection establishment should be kept to a minimum.
On the contrary, larger intervals between connection establishments will lead to delay in
communicating the status. To add to the complexity of this problem, a single NMS
station has to manage multiple NEs. It is evident that there will be contention for the
available telephone lines. At the NMS end, the available lines have to be shared both for
the incoming calls from NEs (for event update) as well as for the outgoing calls (for poll-
based requests originating from NMS). At the NE end, the available lines (usually just
one) have to be shared for the incoming calls from NMS for poll-based requests and
outgoing calls to NMS for event update.
% �� . � � # � " � � � �( � � � �
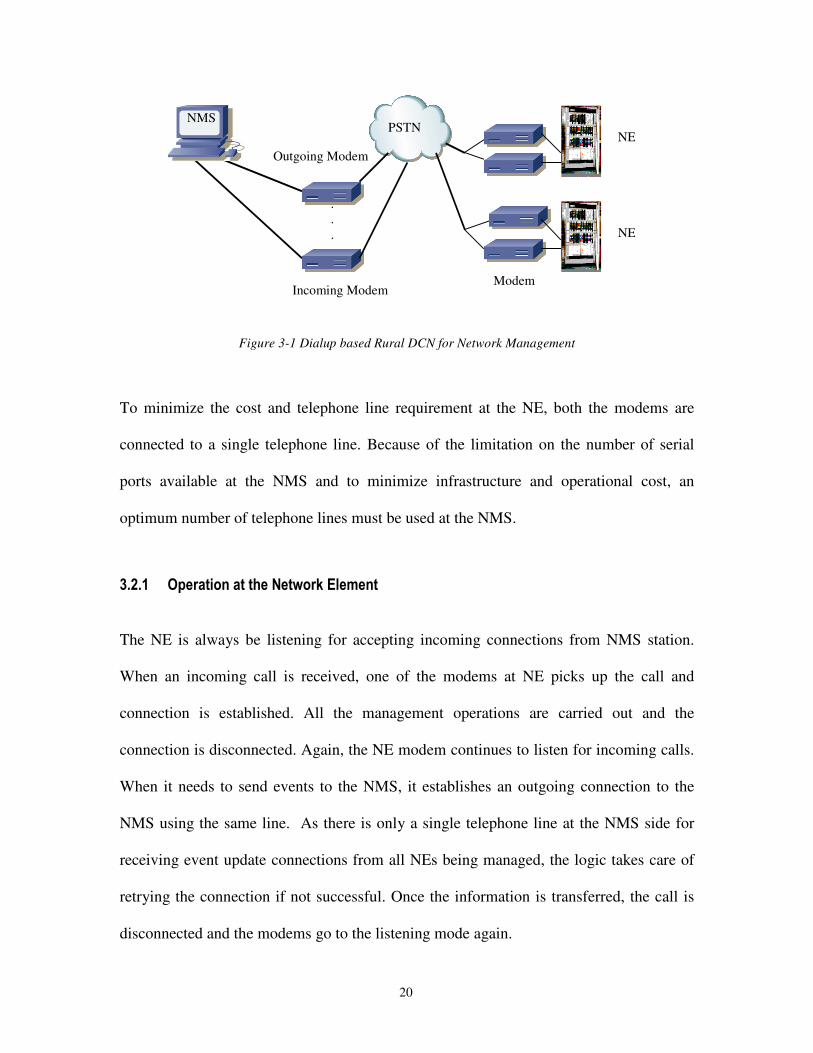
With the above considerations, the following dialup based DCN is proposed for network
management. Fig 3-1 illustrates the proposed DCN model.
For redundancy each corDECT system (NE) has two controller cards. In order to increase
the fault tolerance at NE, one modem is connected to each controller card. Even if one of
the controller cards fails, management will be possible. Based on the status of the
controller cards and the modems, one of the copies is automatically designated to receive
the incoming calls and to dial out for delivering alarms.
20
NE
NE
Incoming Modem
Outgoing Modem
Modem
NMSPSTN
.
.
.
Figure 3-1 Dialup based Rural DCN for Network Management
To minimize the cost and telephone line requirement at the NE, both the modems are
connected to a single telephone line. Because of the limitation on the number of serial
ports available at the NMS and to minimize infrastructure and operational cost, an
optimum number of telephone lines must be used at the NMS.
% �� �� �# � � � ��� � �� ���� � �� �& � � ' ���� � � � �
The NE is always be listening for accepting incoming connections from NMS station.
When an incoming call is received, one of the modems at NE picks up the call and
connection is established. All the management operations are carried out and the
connection is disconnected. Again, the NE modem continues to listen for incoming calls.
When it needs to send events to the NMS, it establishes an outgoing connection to the
NMS using the same line. As there is only a single telephone line at the NMS side for
receiving event update connections from all NEs being managed, the logic takes care of
retrying the connection if not successful. Once the information is transferred, the call is
disconnected and the modems go to the listening mode again.
21
% �� �� �# � � � ��� � �� ��� �& � � ' �( � � � ) � � � � ���$ " �� �
At the NMS side, there are two (or more) modems, one for managing the NEs (polling
based) and another for receiving the alarms from NEs. The single outgoing line is used
for establishing dialup connection to any NE requiring request-response based
management. Hence, usually the requests for connection to NE are queued at the NMS
side. The other telephone line always listens for incoming connections from NEs for
event notifications.
The overall logic looks quite straightforward. But, there are significant exceptional
conditions that require special support.
% �% �� � �� � � " �� � � ��� � � � �7 � � " �� " � � ��� ��� � �# � � # � " � � �� � � � �
To suit the behaviour of the management traffic and to achieve the desired objectives, a
number of techniques are employed in the proposed dialup DCN model. To perform any
management operation from the NMS on a given NE, the dialup connection towards that
NE needs to be established. Similarly, if an NE needs to communicate/transfer data
(alarms) to the NMS, the dialup connection is required.
% �% �� 8 � / ��4 � � � ��� �
We define each operation from NMS to NE and vice-versa as a Job. To cater to the
typical nature of management traffic, two kinds of job execution are supported. The first
one is immediate job execution done on the request of an operator and the second one is
delayed job execution for batch processing. Demand based dialing from the NMS to the
22
NE on operator request. The connection is established only when needed and
disconnected after the transactions are completed. This way, a single line at the NMS can
be multiplexed to manage multiple NEs.
In case of batch processing, once the connection to a destination (NMS/NE) is
established, all the jobs towards that destination will be executed and on completion of
the jobs, the connection will be disconnected. Provision is given for automatic execution
of the low priority jobs, such as batch Jobs, during non-peak hours. When the system is
executing a batch process and if operator requests for a connection and no free lines are
available, system stops executing the batch process and executes the operator request.
Operator requests are given priority over the system or batch process.
To ensure fairness across all jobs, following parameters are provided for each job:
Retries on abnormal termination to ensure sufficient retries are done for a job
before it is removed from the queue
Time To Live (TTL): If a job is not executed with in a given period, it will be
discarded.
% �% �� ��� � � " �� " � � ��� �� � � � � � ��� � �� " �� / ��" � � � � �
Connection try time
Back off timeLaxity time
New Job
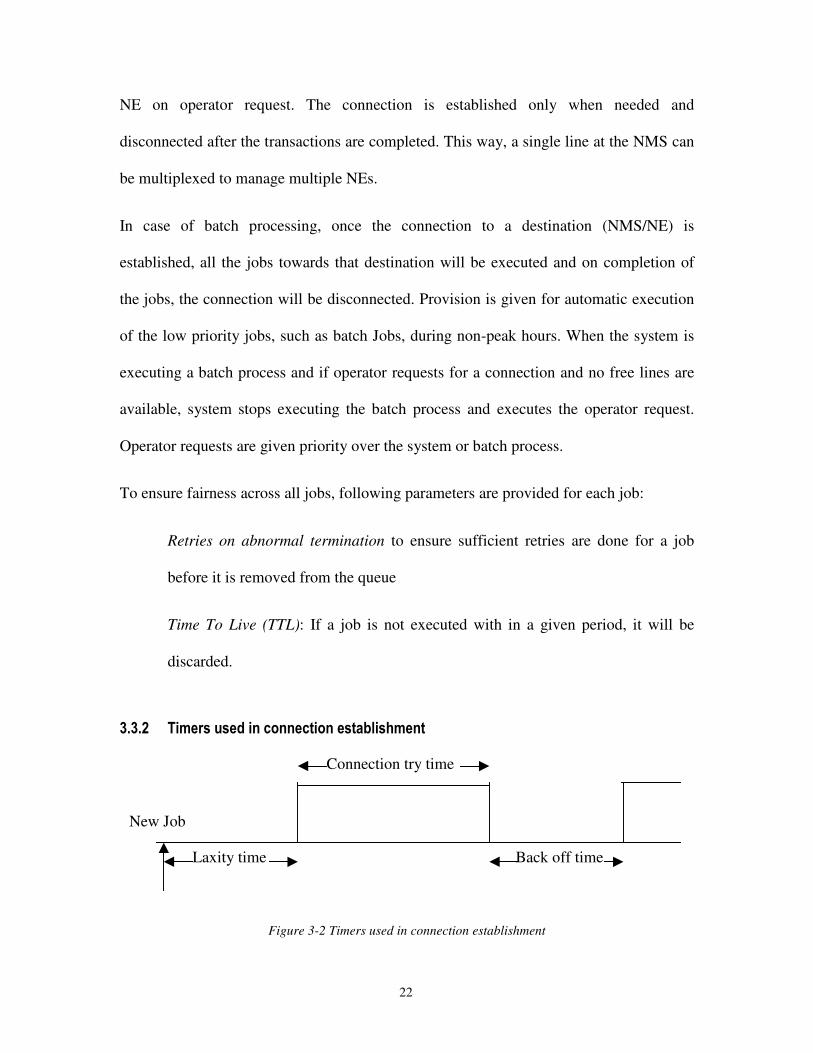
Figure 3-2 Timers used in connection establishment
23
Laxity time is the time for which the connection initiation will be delayed. On the expiry
of the laxity timer, the dialup connection is initiated. This way, jobs towards a destination
are combined and a single connection established to complete all the jobs rather than
establishing individual connections for each job.
Connection try time is the time until which the process of establishing a connection will
be tried towards a destination as shown in Fig 3-2. This will ensure fairness for each
destination to establish the connection. This timer is fixed considering the reliability and
availability of the telephone connectivity between the two ends. For example, connection
try time for a remote village will be higher than the time for a nearby town.
Back-off time is the time until which the system will not try to connect towards a
destination. On the back-off timer expiry, the destination will be retried for the
connection. In the condition where the NMS side incoming line is continuously used and
the DIU is trying to connect to that line for event update, unless the DIU has a back-off
time, the NMS station also will not be able to connect to the DIU for a request-response
connection. This also helps to avoid unnecessary congestion in the telephone network.
% �% �% ��� � � " �� " � � ��� �� � � � � � ��� � �� � �� �� � � � � �
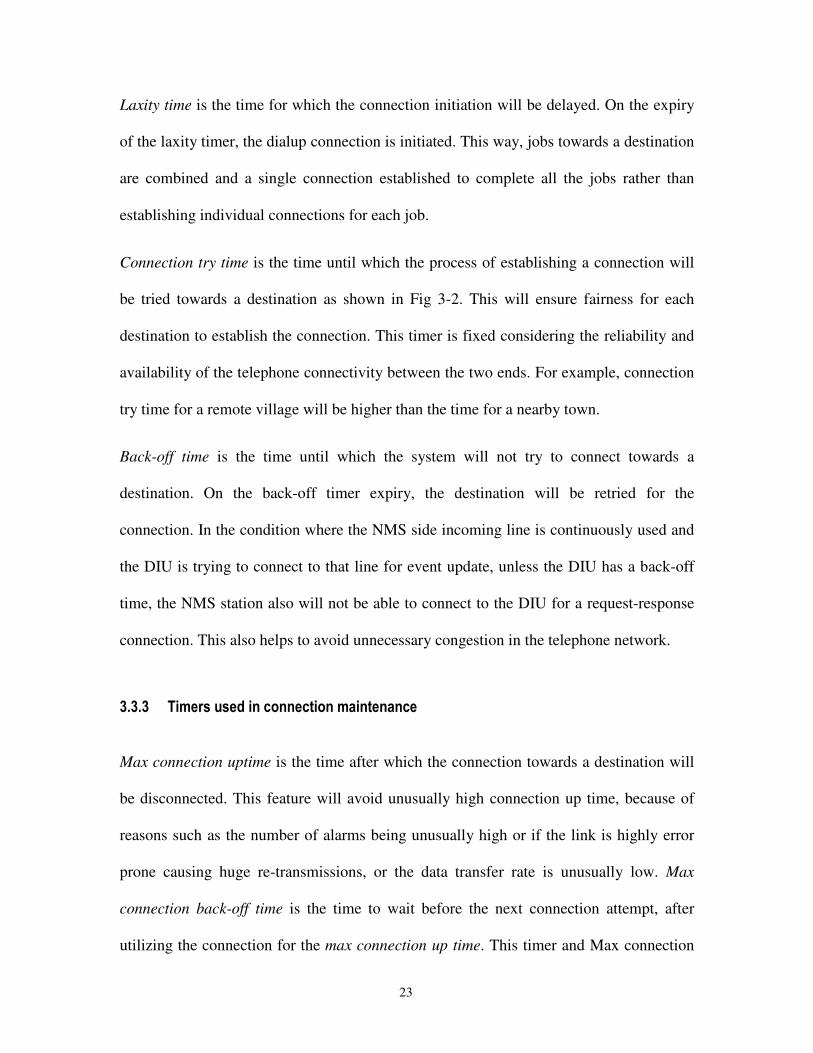
Max connection uptime is the time after which the connection towards a destination will
be disconnected. This feature will avoid unusually high connection up time, because of
reasons such as the number of alarms being unusually high or if the link is highly error
prone causing huge re-transmissions, or the data transfer rate is unusually low. Max
connection back-off time is the time to wait before the next connection attempt, after
utilizing the connection for the max connection up time. This timer and Max connection
24
uptime are provided to avoid starvation as shown in Fig 3-3. However, in the condition
where there are no other jobs pending, this timer is overridden and connection is retried
for the same destination. Link idle time is the time after which connection towards a
destination will be disconnected if no data is transmitted over the dialup link.
Max connectionback-off time
Connection try timeMax connection uptime
Figure 3-3 Timers used in connection maintenance
% �% �, �� � � � ��$ ��� �� �� �� #
In order to prevent the misuse of STD/ISD facilities, automatic STD barring/unbarring
facilities are provided. Before the system dials to the destination, it unlocks the line and
after disconnecting the connection, it locks the same. In order to protect the system from
access by unauthorized users, user-id based authentication is built. Only if the user-id
authentication is successful, the call will be established. Otherwise, the call will be
disconnected.
25
% �, ��� � � � � ��6 � � $
The corDECT Network Management System uses proprietary SNMP like protocol called
corDECT Management Protocol (CMP) as the management protocol for managing the
corDECT systems. Since we are using the demand-based dialup as the DCN between NE
and management station, any attempt to forward the alarms without establishing the
connectivity will result in loss of alarms.
Further, the following issues need to be addressed with respect to alarm delivery
� The transport protocol used by SNMP [14], i.e. UDP [15] is a connection-less
protocol that does not ensure delivery of data. If some packets are lost in the network
because of errors in the data transfer, no attempt would be made to retransmit the data
and hence this results in loss of alarms at the NMS station
� For every alarm generated at the NE, if the NE establishes a connection to NMS, it
results in huge number of connections. This leads to both inefficient use of limited
telephone lines and also huge telephone usage charges
To take care of the above issues, the following mechanism is used for transfer of alarms:
Store and Forward Trap (SAFT): The messages which are generated from agent are
stored temporarily in a file at the NE itself and then the file is transferred to the NMS
station.
Severity based alarm time: The messages generated in the NE are classified into the
following severities viz. CRITICAL, MAJOR and MINOR and a timer is associated with
each severity.
26
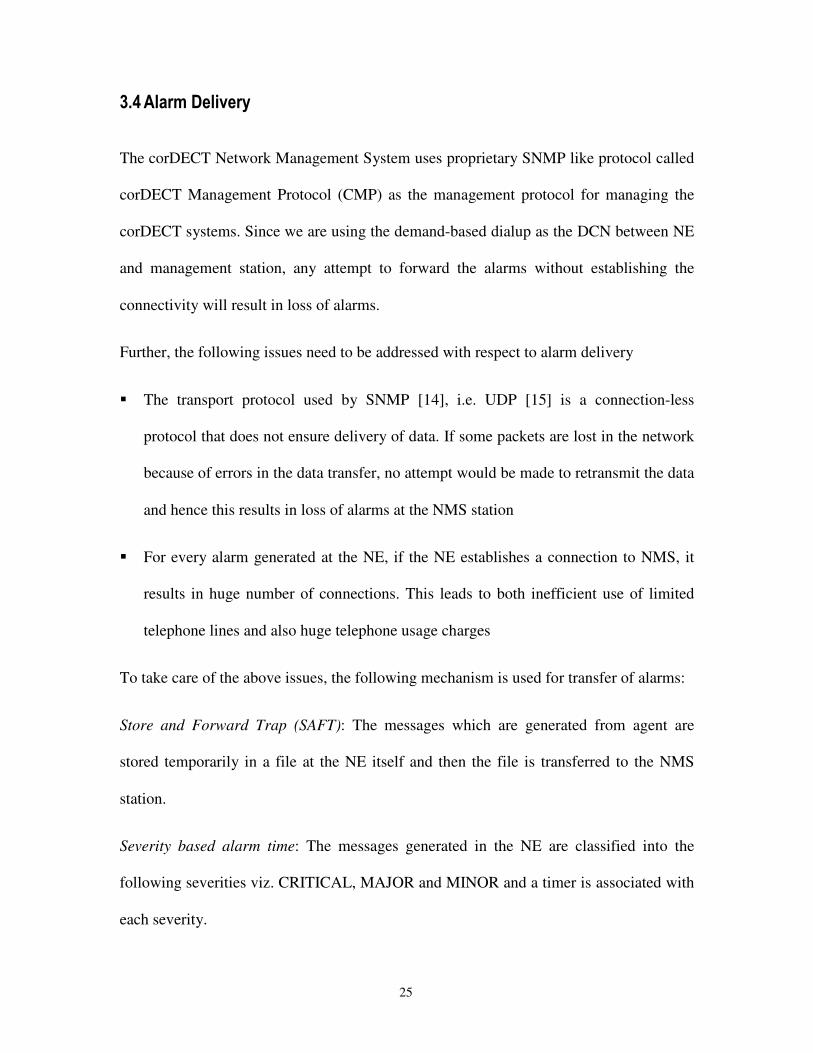
% �, �� ��� � � �� � ��6 � � $ �� � � � � � �" �
Start timer
On timer expiry,transfer alarmsfrom NE to NMS
ManagementStation Alarm Regenerator
NetworkElement
SAFTAgentProcess
NE stagingArea
NMS stagingArea
PSTN
SNMPtrap
SNMPtrap
Figure 3-4 Alarm delivery mechanism
Different modules involved in delivering the alarms to NMS are shown in Fig 3-4. When
an alarm is generated at the Network Element, SAFT receives and stores it in a file. The
delay to initiate a connection is decided based on the severity of the generated alarm. The
delay time will be low with the higher the severity of the massage. It is also possible to
configure the delay time as zero to ensure that alarms are transferred without any delay.
All the alarms generated between two subsequent connections are stored in a file at the
NE and are transferred, once the connection is established. When the delay timer is in
progress, if a higher severity alarm is generated, the delay timer will be adjusted to the
minimum of remaining time and new alarm delay time.
Filtering and unique of alarms is used to avoid alarm flood. Frequently, it is observed that
a spurious alarm gets generated repeatedly due to some persistent problem at the NE.
This can result in huge number of alarms. In order to avoid transfer of redundant data,
27
alarms are uniqued and additional information such as repeat count and first occurrence
time are added. It is also possible to filter alarms based on the alarm parameters.
Compressed, efficient and reliable alarm transfer. Using the in-built facility of the file
transfer application rsync, it is ensured that only un-transferred data is transferred after a
partial file transfer. Rsync also provides facility for compressed data transfer. The alarm
file being a text file, usually the compression is substantial, reducing the effective transfer
time. The reliability of the transfer is also increased, because rsync uses the connection-
oriented TCP as the transport protocol.
An alarm regenerator at the NMS side regenerates the SNMP alarms from the transferred
alarm text file as UDP packets. For the NMS system, all the intermediate mechanisms are
transparent as it continues to get SNMP alarms as UDP packets. This way, the lack of
reliability and efficiency is addressed without changing the inherent SNMP based alarm
management operations at the NMS station.
% �- �� � � � � $
This chapter has introduced the proposed Data Communication Network based on dialup,
which is designed for management traffic. We have also discussed about different
features and techniques used in this DCN to increase the reliability and efficiency.
Finally, we have seen the Alarm delivery mechanism used in the proposed DCN.
28
� � # �� � �,
. � � 0� � � � � � � ��� � �$ " �" �� � � �� " ��( � � � �
We have proposed a dialup based data communication network for network management
in the previous chapter. In this chapter, we develop a performance model for this DCN
and result obtained using this performance model. This chapter also explains a cost model
for the dialup based DCN.
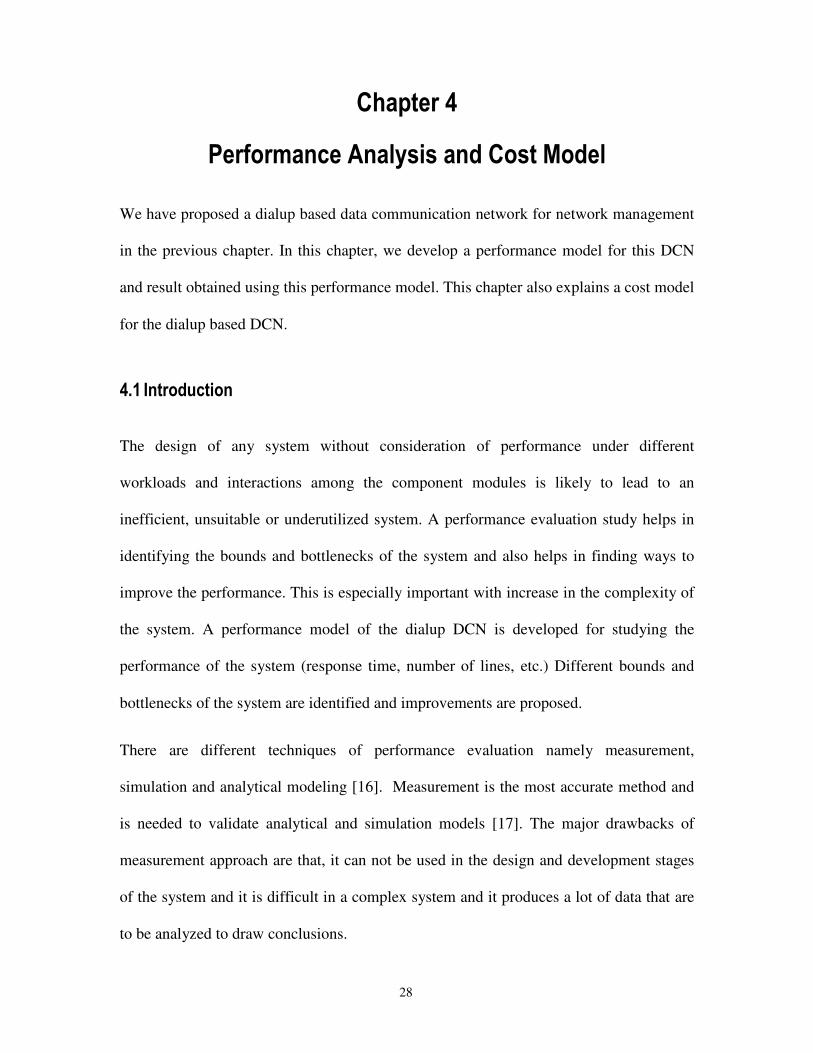
, �� �� �� � � � � ��� �
The design of any system without consideration of performance under different
workloads and interactions among the component modules is likely to lead to an
inefficient, unsuitable or underutilized system. A performance evaluation study helps in
identifying the bounds and bottlenecks of the system and also helps in finding ways to
improve the performance. This is especially important with increase in the complexity of
the system. A performance model of the dialup DCN is developed for studying the
performance of the system (response time, number of lines, etc.) Different bounds and
bottlenecks of the system are identified and improvements are proposed.
There are different techniques of performance evaluation namely measurement,
simulation and analytical modeling [16]. Measurement is the most accurate method and
is needed to validate analytical and simulation models [17]. The major drawbacks of
measurement approach are that, it can not be used in the design and development stages
of the system and it is difficult in a complex system and it produces a lot of data that are
to be analyzed to draw conclusions.
29
Simulation involves constructing a model for the behavior of the system and driving it
with measured or calculated workloads. Simulation like measurement generates a lot of
raw data that must be analyzed to draw conclusions. Careful design of the system model
is essential to keep the computational cost low.
Analytical modeling involves constructing a mathematical model of the system behavior
at the desired level of detail and solving it. Despite the simplification necessary for
tractability, analytical models produce fairly good approximations of the system
performance, especially in identifying bounds and bottlenecks of the system.
In analytical Modeling, Queuing Network Models (QNMs) have proved to be widely
used and cost-effective tools for analyzing modern computer systems.
We have used the analytical model for computing the different performance parameters
and the same is validated using the values obtained from the measurement model.
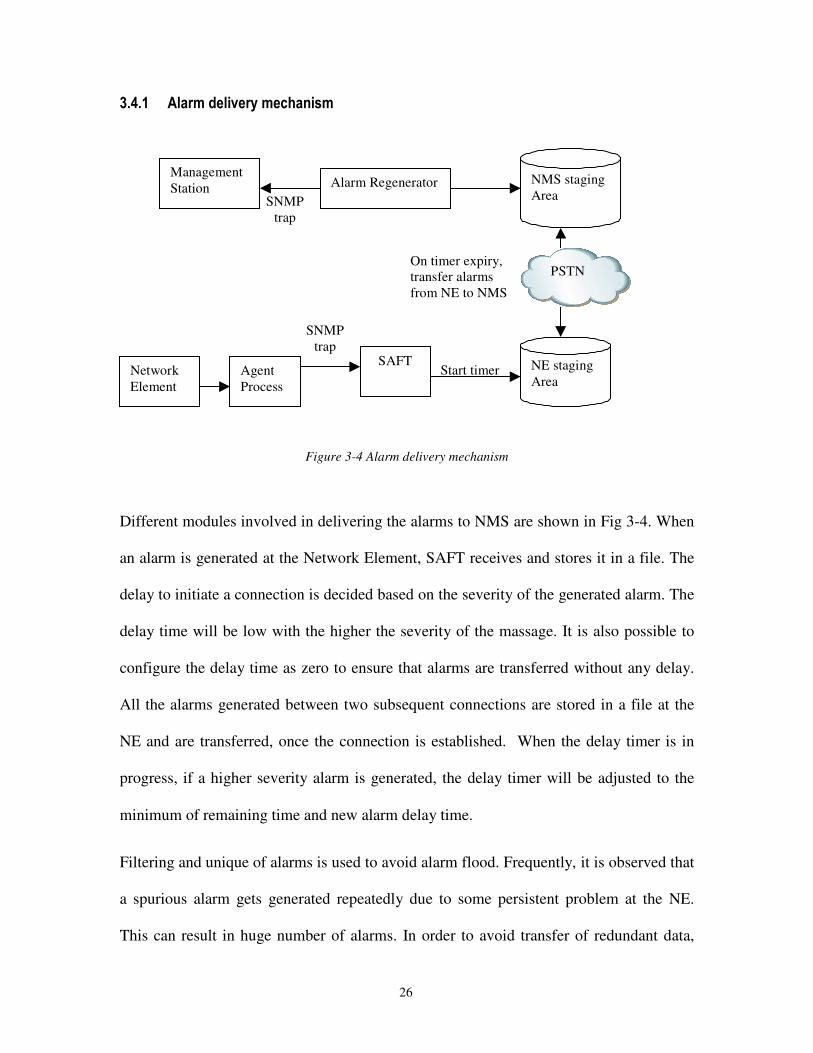
, �� . � � 0� � � � � � � �( � � � �
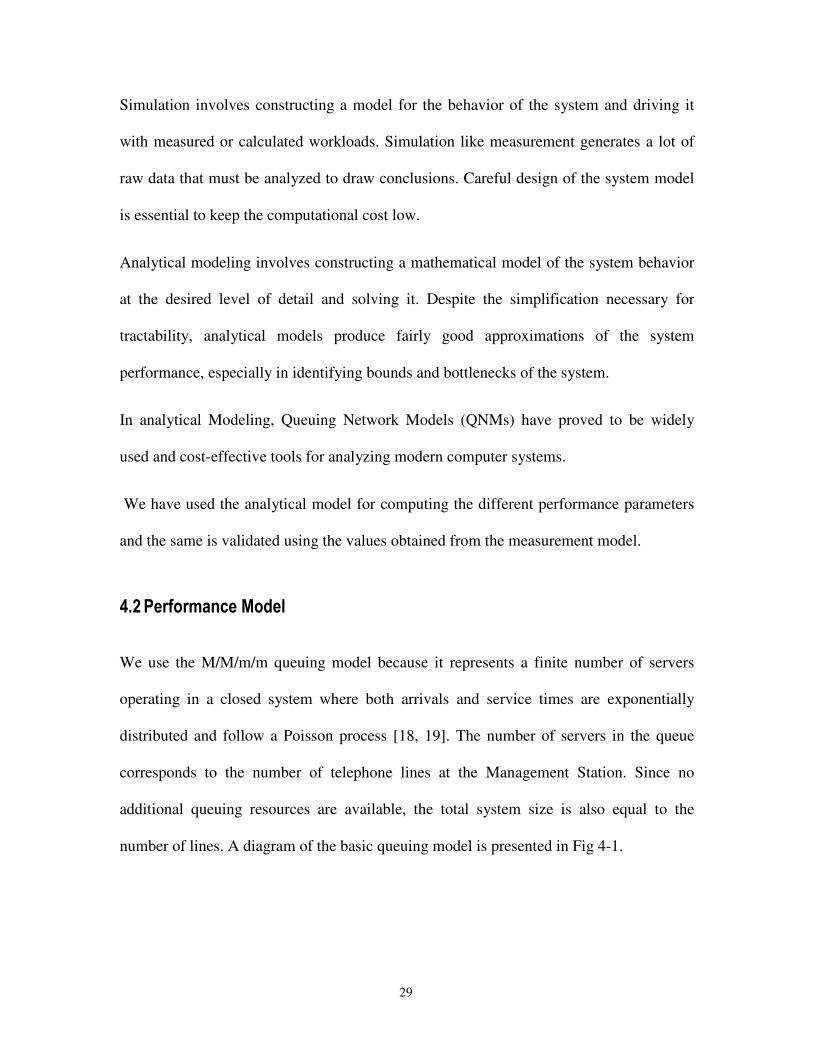
We use the M/M/m/m queuing model because it represents a finite number of servers
operating in a closed system where both arrivals and service times are exponentially
distributed and follow a Poisson process [18, 19]. The number of servers in the queue
corresponds to the number of telephone lines at the Management Station. Since no
additional queuing resources are available, the total system size is also equal to the
number of lines. A diagram of the basic queuing model is presented in Fig 4-1.
30
Figure 4-1 Generic Network model
Analytical model is defined to find the number of lines required at NMS to receive the
alarms from NEs. To understand the same first we need to understand the calling
behavior for delivering the alarms.
, �� �� ��� � � �� � ��6 � � $ �( � � � � � �" �
On occurrence of an alarm, the NE starts a timer corresponding to the severity of the
alarm. On expiry of the timer, the NE dials to the NMS and on successful connection, it
delivers the alarms to NMS. In the case of dialup connection establishment failure, either
because of congestion in the network or the telephone line at the NMS is busy, the
connection will be retried immediately.
This calling behaviour can be modeled using the Extended Erlang B queueing model [20,
21]. Applying the Extended Erlang B formula, we can derive the number of lines needed
at the NMS [22].
, �� �� � �� � �� ��� � �. � � � � � � � �
The procedure and formula to mathematically compute the desired number of telephone
lines at the NMS for receiving alarms from all the NEs is defined as below
Source Sink Queue
31
Number of lines required at NMS = Extended Erlang B (BHT, PB)
where the BHT = NC × NNE × TH
TH = (ID × λM × SM) / BW
The number of calls per hour from all NEs is a function of the message arrival rate, ratio
of different severity messages and their corresponding desired response time
The delivery time or response time TR = ID × (1 / (1 – PB))
Considering that the delivery time can be maximum of twice inter-dial interval, the
maximum acceptable blocking probability is 0.5
, �% 9 ��� ����
One of the most serious problems in performance modeling is proving the validity of a
model, that is, proving that the model is a representation of the evaluated system.
Validation involves comparing measured performance values with the performance
values calculated by a model. If reasonable agreement is observed, it is likely that the
model has successfully captured the primary factors that govern the performance of a
particular system.
A validated model can be used in several ways. It may be used to calculate the
performance quantities that were not measured because they were ignored or were too
difficult to obtain. However, the more important use of a validated model is for
prediction. A validated model together with estimates of the future parameter values may
be used to provide quantitative insight into the future system.
32
, �% �� 9 � ��� � ��� � �. � � � � � � � �
By performing measurements in the corDECT system we estimate the parameters for one
trace in the corDECT system. Given the demands in each server and the number of
servers in the system, we solve the analytical model to predict the performance
parameters viz. response time and blocking probability. The input parameters used for the
analytical model are also used in the measurement model to predict the performance
measures. The analytical model is then validated by comparing the blocking probability
with that obtained from experimental model.
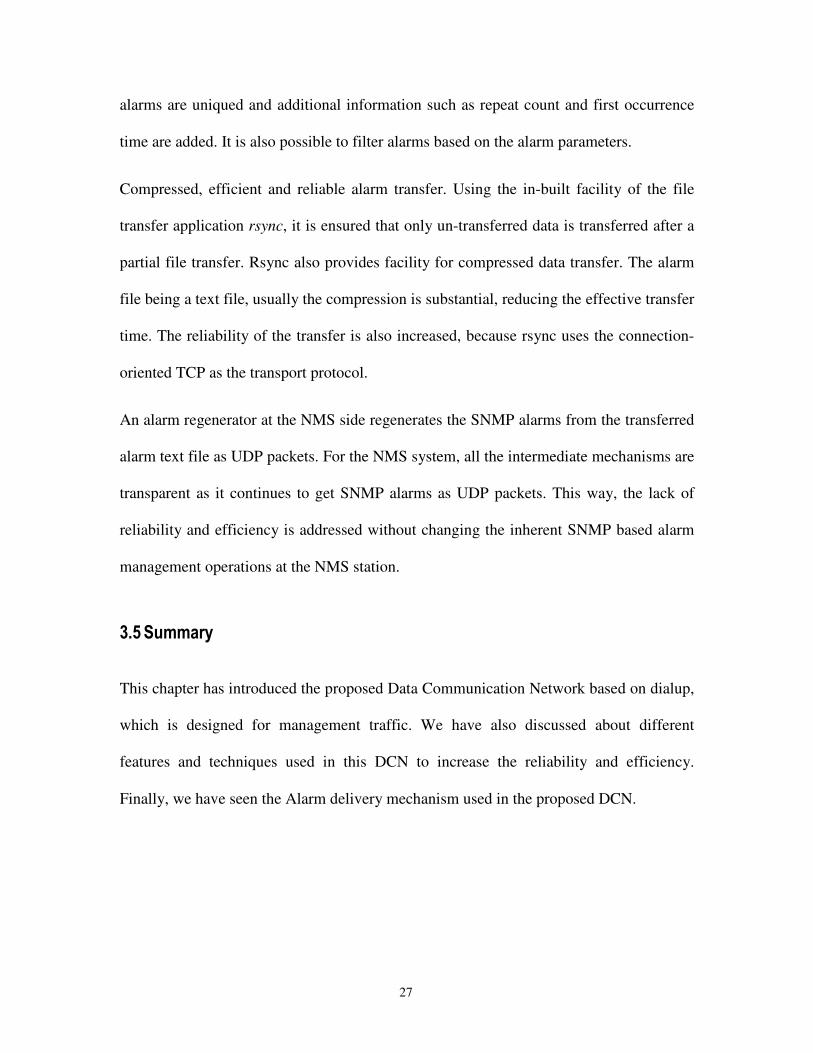
, �, ��4 # � � �� � � �� ��( � � � �
AlarmGenerator
Field logtrace
NE NE NE
M odem
OutgoingM odem
Incom ingM odem
… … … ..
PBX
NM S
M odem
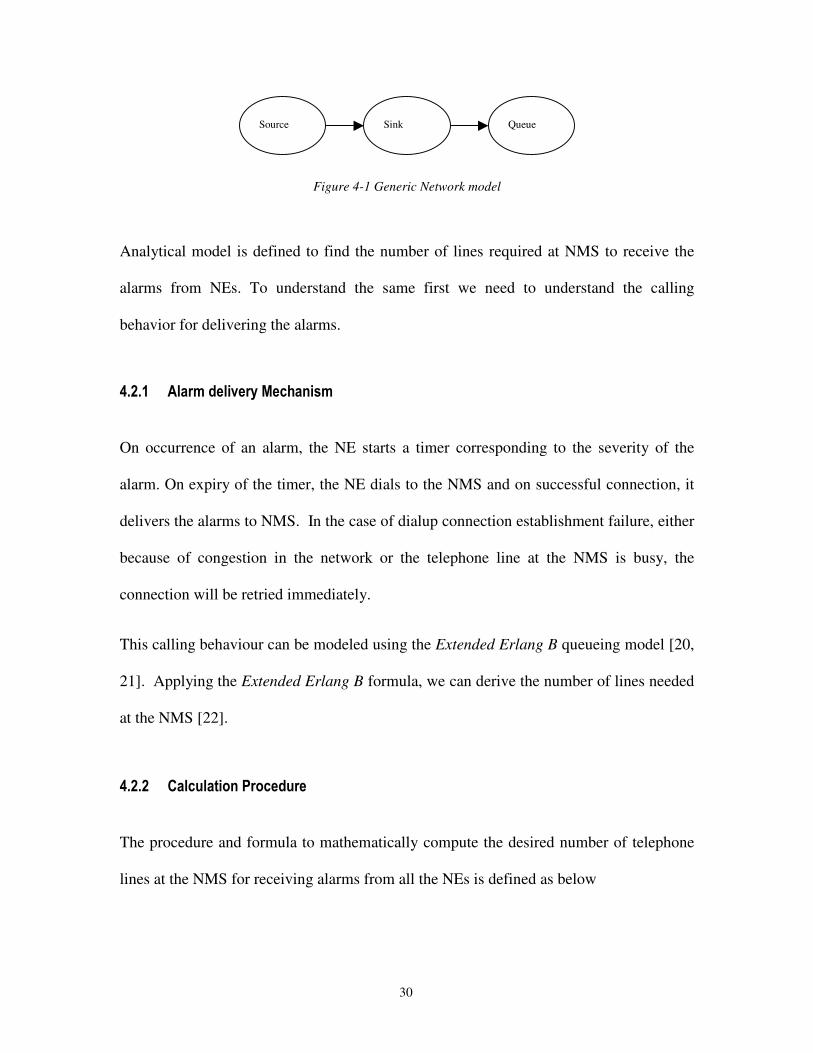
Figure 4-2 Lab experiment setup for measuring the blocking probability
A lab experiment has been setup to validate the analytical model. Alarm Generator
generates the alarms in sequence based on traces from operational corDECT systems.
This was run in six NEs and the alarms were generated.
33
With the use of PBX telephone lines and modems as shown in Fig 4-2 in a lab setup, the
field scenario was emulated and the call blocking was measured. The alarm traces were
collected from one of the telecom operator site for a week. The alarm files were analyzed
and few traces were chosen and the experiments were carried out.
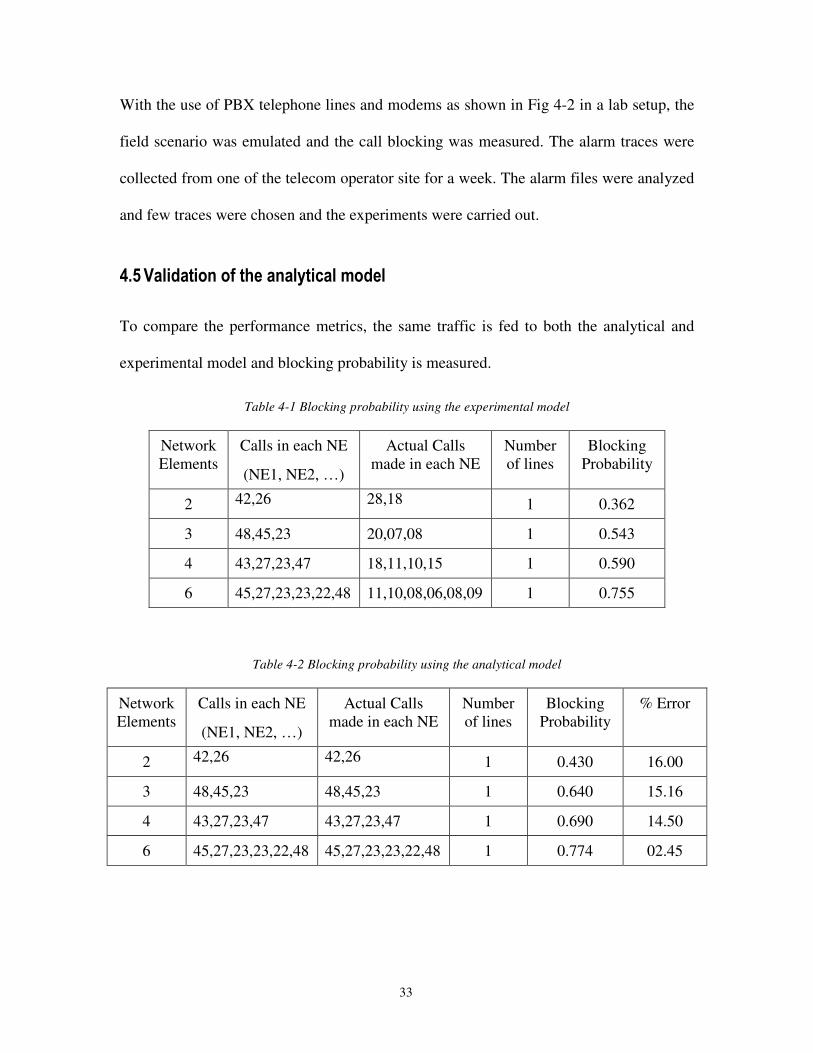
, �- 9 � ��� � ��� � �� 0��� � �� � � �$ ��� � ��� � � � �
To compare the performance metrics, the same traffic is fed to both the analytical and
experimental model and blocking probability is measured.
Table 4-1 Blocking probability using the experimental model
NetworkElements
Calls in each NE
(NE1, NE2, …)
Actual Callsmade in each NE
Numberof lines
BlockingProbability
2 42,26 28,18 1 0.362
3 48,45,23 20,07,08 1 0.543
4 43,27,23,47 18,11,10,15 1 0.590
6 45,27,23,23,22,48 11,10,08,06,08,09 1 0.755
Table 4-2 Blocking probability using the analytical model
NetworkElements
Calls in each NE
(NE1, NE2, …)
Actual Callsmade in each NE
Numberof lines
BlockingProbability
% Error
2 42,26 42,26 1 0.430 16.00
3 48,45,23 48,45,23 1 0.640 15.16
4 43,27,23,47 43,27,23,47 1 0.690 14.50
6 45,27,23,23,22,48 45,27,23,23,22,48 1 0.774 02.45
34
The blocking probability computed in the analytical model is high compared to the
experimental model. This can be explained as below.
When a call is being re-tried because of blocking and in the mean while if there is another
alarm, which requires a connection, both the existing connection requirement and the new
connection requirement are merged into a single connection requirement. This decreases
the number of calls established, because of which the blocking probability is reduced in
the experimental model. Because of the lower blocking probability, the average response
time for alarms is also improved. The percentage error is found to decrease with increase
in the traffic.
, �1 . � � 0� � � � � � � �� � " � ��"
This section summarizes the performance results of the dialup based DCN for Network
Management. The main goals of the performance studies were to determine the following
1. Availability of the underlying DCN(telephone connection) at both NE and NMS ends
2. Number of telephone lines required at NMS and at every NE and its scalability as the
number of problems in NE grows
3. Response time seen by the different requests between NMS and NE
4. Reliability or error rate of the data transferred using dialup DCN
5. Maintenance and infrastructure cost incurred incase of dialup based DCN
35
To evaluate the above mentioned performance metrics, we need to define the following
system parameters
1. Number of Network Elements
2. The rate/distribution at which these NEs generate messages
3. The severity classifications for these messages
4. The number of messages of each severity type
5. The desired response time for each severity type
The considered values for each of the above parameters is
• Number of NEs (N) = 100
• Message arrival rate is considered to be of Poisson distribution. Generally messages
from a NE are due to overload, installation problems and hardware failures. Based on
the number of messages generated, NEs are categorized as “Good” and
“Problematic”. Random samples of corDECT systems are taken and the average
message arrival rate is measured. From this the average message arrival rate for
“Good” NE is defined as 500 per day and for “Problematic” NE is defined as 12,000
per day.
• Severity classification: The messages are classified into three severities i.e. Critical,
Major and Minor

36
To generalize the study, a comparison is made by varying the following parameters and
the results are represented in graphs to understand the trend.
1. Ratio of Good and Problematic NEs (i.e. number of problematic NEs / total
number of NEs)
2. Ratio of messages of different Severities
3. Desired response time for each Severity
The analysis is done progressively in three phases with the following considerations
1) All NEs generate same number of messages and of same severity (Homogeneous
Network Elements)
2) All NEs generate same number of messages and of different severities (Homogeneous
Network Elements with message diversity)
3) Number of messages generated by each NE is different and of different severities
(Heterogeneous Network Elements with message diversity)
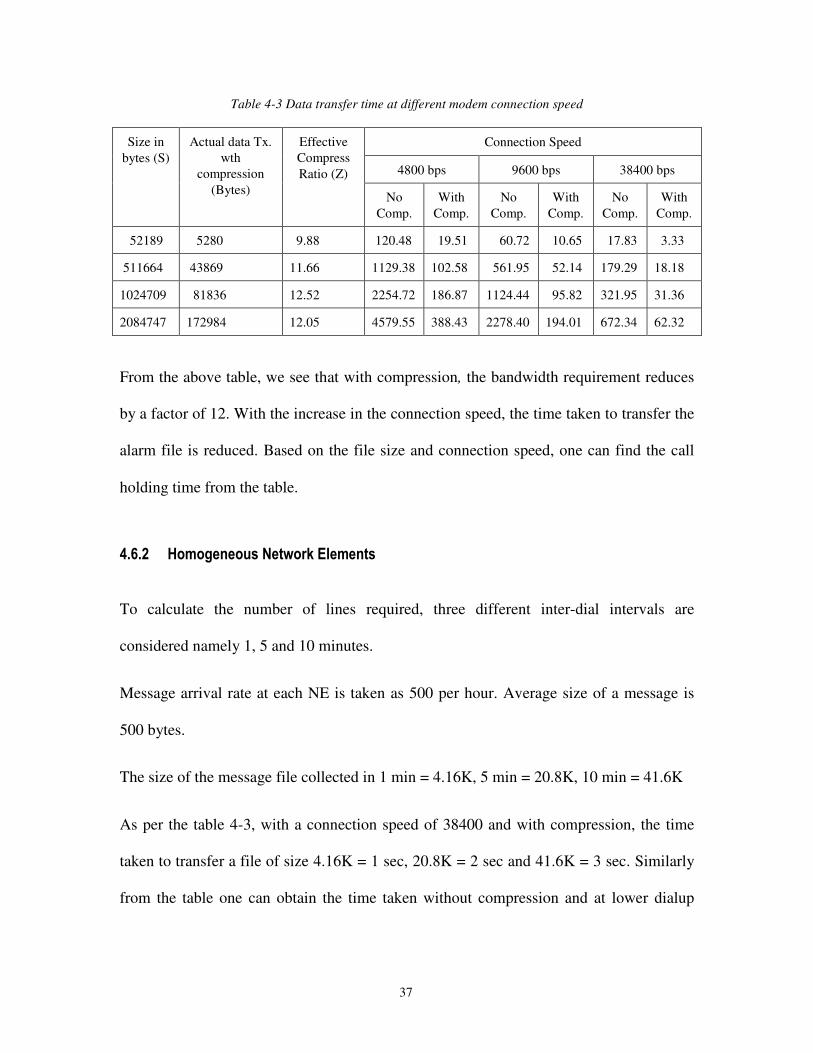
, �1 �� ���� � ��� ' � � �0� � � � �� ��� � � " 0� �
The rsync command is used to transfer alarm files from the NE to the NMS. The rsync
command has an option to transfer files in compressed format. Time taken to transfer
files both in compressed mode and in uncompressed mode are measured for different
speeds of dialup connection and the same is tabulated in Table 4-3.
37
Table 4-3 Data transfer time at different modem connection speed
Connection Speed
4800 bps 9600 bps 38400 bps
Size inbytes (S)
Actual data Tx.wth
compression(Bytes)
EffectiveCompressRatio (Z)
NoComp.
WithComp.
NoComp.
WithComp.
NoComp.
WithComp.
52189 5280 9.88 120.48 19.51 60.72 10.65 17.83 3.33
511664 43869 11.66 1129.38 102.58 561.95 52.14 179.29 18.18
1024709 81836 12.52 2254.72 186.87 1124.44 95.82 321.95 31.36
2084747 172984 12.05 4579.55 388.43 2278.40 194.01 672.34 62.32
From the above table, we see that with compression, the bandwidth requirement reduces
by a factor of 12. With the increase in the connection speed, the time taken to transfer the
alarm file is reduced. Based on the file size and connection speed, one can find the call
holding time from the table.
, �1 �� : � � � ) � � � � � " �� �& � � ' ���� � � � �"
To calculate the number of lines required, three different inter-dial intervals are
considered namely 1, 5 and 10 minutes.
Message arrival rate at each NE is taken as 500 per hour. Average size of a message is
500 bytes.
The size of the message file collected in 1 min = 4.16K, 5 min = 20.8K, 10 min = 41.6K
As per the table 4-3, with a connection speed of 38400 and with compression, the time
taken to transfer a file of size 4.16K = 1 sec, 20.8K = 2 sec and 41.6K = 3 sec. Similarly
from the table one can obtain the time taken without compression and at lower dialup
38
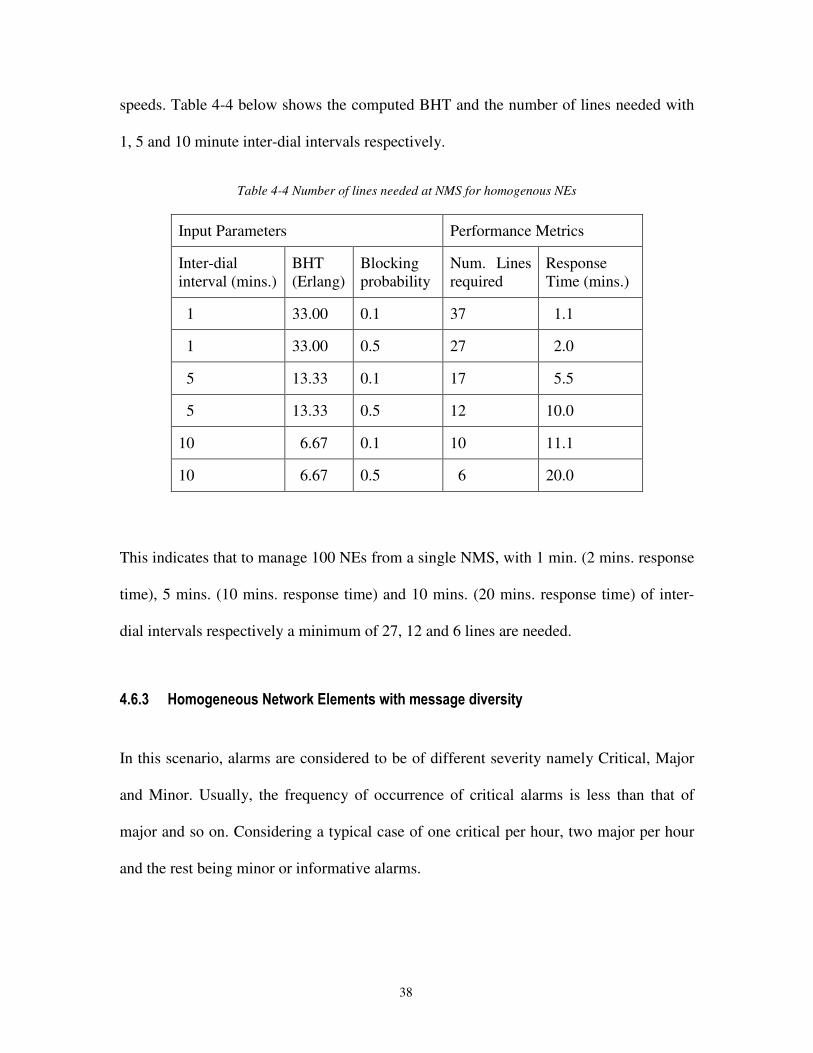
speeds. Table 4-4 below shows the computed BHT and the number of lines needed with
1, 5 and 10 minute inter-dial intervals respectively.
Table 4-4 Number of lines needed at NMS for homogenous NEs
Input Parameters Performance Metrics
Inter-dialinterval (mins.)
BHT(Erlang)
Blockingprobability
Num. Linesrequired
ResponseTime (mins.)
1 33.00 0.1 37 1.1
1 33.00 0.5 27 2.0
5 13.33 0.1 17 5.5
5 13.33 0.5 12 10.0
10 6.67 0.1 10 11.1
10 6.67 0.5 6 20.0
This indicates that to manage 100 NEs from a single NMS, with 1 min. (2 mins. response
time), 5 mins. (10 mins. response time) and 10 mins. (20 mins. response time) of inter-
dial intervals respectively a minimum of 27, 12 and 6 lines are needed.
, �1 �% : � � � ) � � � � � " �� �& � � ' ���� � � � �" �& ��� �� � " " � ) � �� �6 � � " ��$
In this scenario, alarms are considered to be of different severity namely Critical, Major
and Minor. Usually, the frequency of occurrence of critical alarms is less than that of
major and so on. Considering a typical case of one critical per hour, two major per hour
and the rest being minor or informative alarms.
39
In reality the response time to receive critical alarms needs to be much less than that of
minor and informative alarms. Considering the desired response time for critical is 2
mins., major is 20 mins., minor is 60 mins., the inter-dial intervals are set to half of that.
The number of calls per hour is taken in two ways (i) The worst case number
(considering worst case order where the number of calls are maximum) (ii) average case
(simulated by generating random alarms of different severity with a frequency equal to
the desired frequency), with this measure the number of call attempts per hour. With this
it is seen that the worst case call attempts per hour is 4.25 and in average case it is 3.
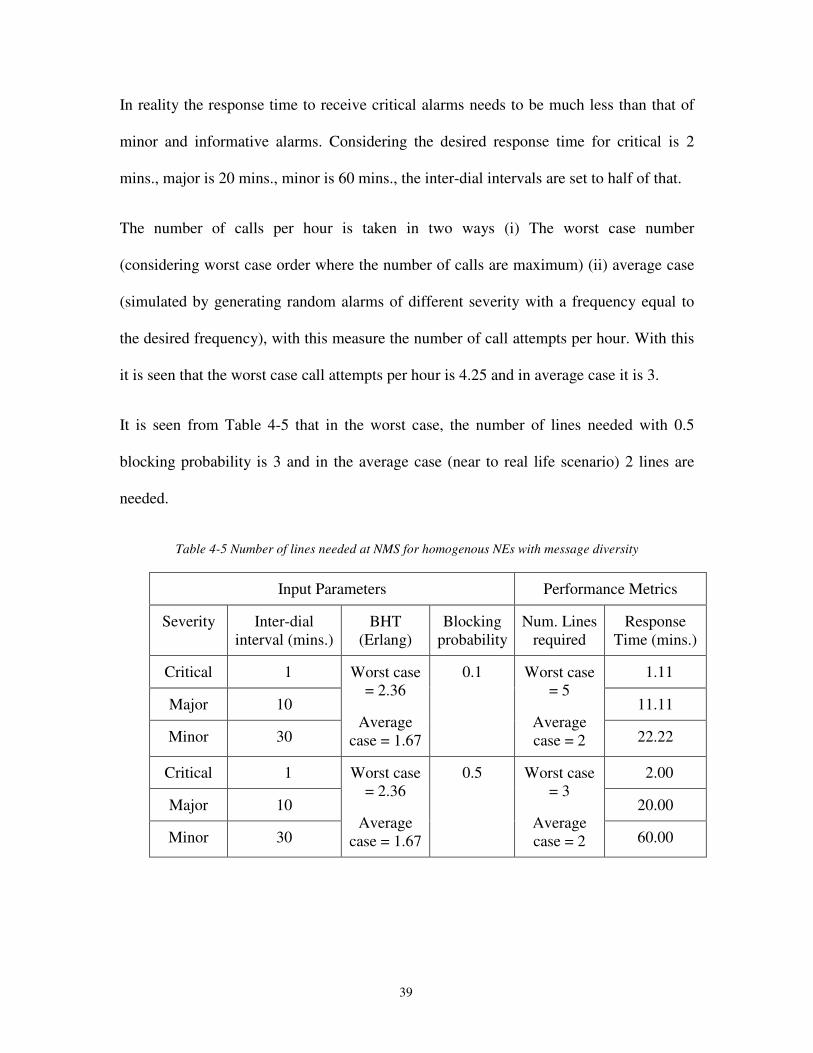
It is seen from Table 4-5 that in the worst case, the number of lines needed with 0.5
blocking probability is 3 and in the average case (near to real life scenario) 2 lines are
needed.
Table 4-5 Number of lines needed at NMS for homogenous NEs with message diversity
Input Parameters Performance Metrics
Severity Inter-dialinterval (mins.)
BHT(Erlang)
Blockingprobability
Num. Linesrequired
ResponseTime (mins.)
Critical 1 1.11
Major 10 11.11
Minor 30
Worst case= 2.36
Averagecase = 1.67
0.1 Worst case= 5
Averagecase = 2 22.22
Critical 1 2.00
Major 10 20.00
Minor 30
Worst case= 2.36
Averagecase = 1.67
0.5 Worst case= 3
Averagecase = 2 60.00

40
, �1 �, : � �� � � ) � � � � � " �� �& � � ' ���� � � � �" �& ��� �� � " " � ) � �� �6 � � " ��$
This is the most generalized case where the number of messages generated by different
NEs differ and also, the messages are of different severity. In the previous section it is
indicated that the Good and Problematic NE classification is done based on the number of
messages generated by them. In reality at a given point of time a portion of the NEs
would be healthy and another portion will be problematic. To define real life situation a
ratio of Good:Problematic NEs is taken, and results are shown by varying from all good
to all problematic NEs.
Similarly, in reality the ratios of different severity alarms differ. Three cases are taken as
example to study the effect of these ratios. One can vary these ratios to their need and
follow the procedure to compute the desired number of telephone lines. Different ratios
that are considered are
P1 = 1% Critical, 4% Major and 95% Minor
P2 = 5% Critical, 15 % Major and 80% Minor
P3 = 15% Critical, 35% Major and 50% Minor
Finally, the desired response time is varied for different severity of alarms and the
computation is repeated. The results indicate that slight variation in the desired response
time has great impact on the required telephone lines. Using the procedure, one can
compute the required number of lines based on the desired response time, ratio of
different severity alarms and ratio of problematic NEs. Different response times
considered are
41
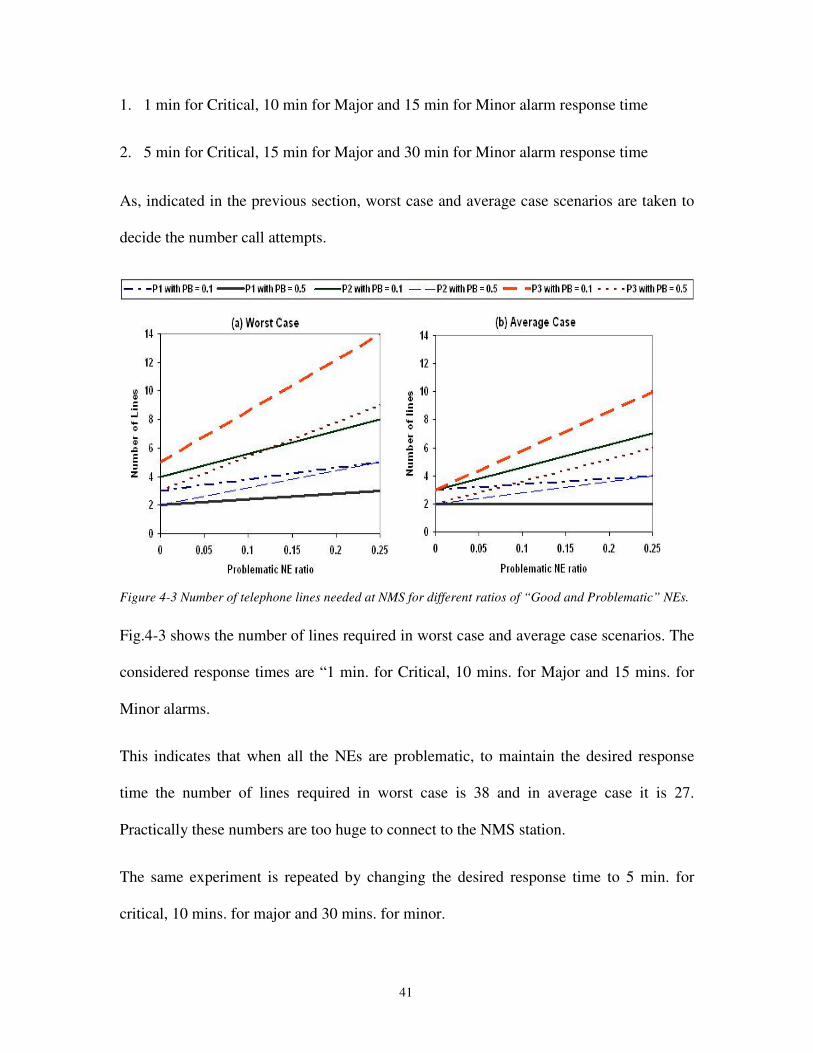
1. 1 min for Critical, 10 min for Major and 15 min for Minor alarm response time
2. 5 min for Critical, 15 min for Major and 30 min for Minor alarm response time
As, indicated in the previous section, worst case and average case scenarios are taken to
decide the number call attempts.
Figure 4-3 Number of telephone lines needed at NMS for different ratios of “Good and Problematic” NEs.
Fig.4-3 shows the number of lines required in worst case and average case scenarios. The
considered response times are “1 min. for Critical, 10 mins. for Major and 15 mins. for
Minor alarms.
This indicates that when all the NEs are problematic, to maintain the desired response
time the number of lines required in worst case is 38 and in average case it is 27.
Practically these numbers are too huge to connect to the NMS station.
The same experiment is repeated by changing the desired response time to 5 min. for
critical, 10 mins. for major and 30 mins. for minor.
42
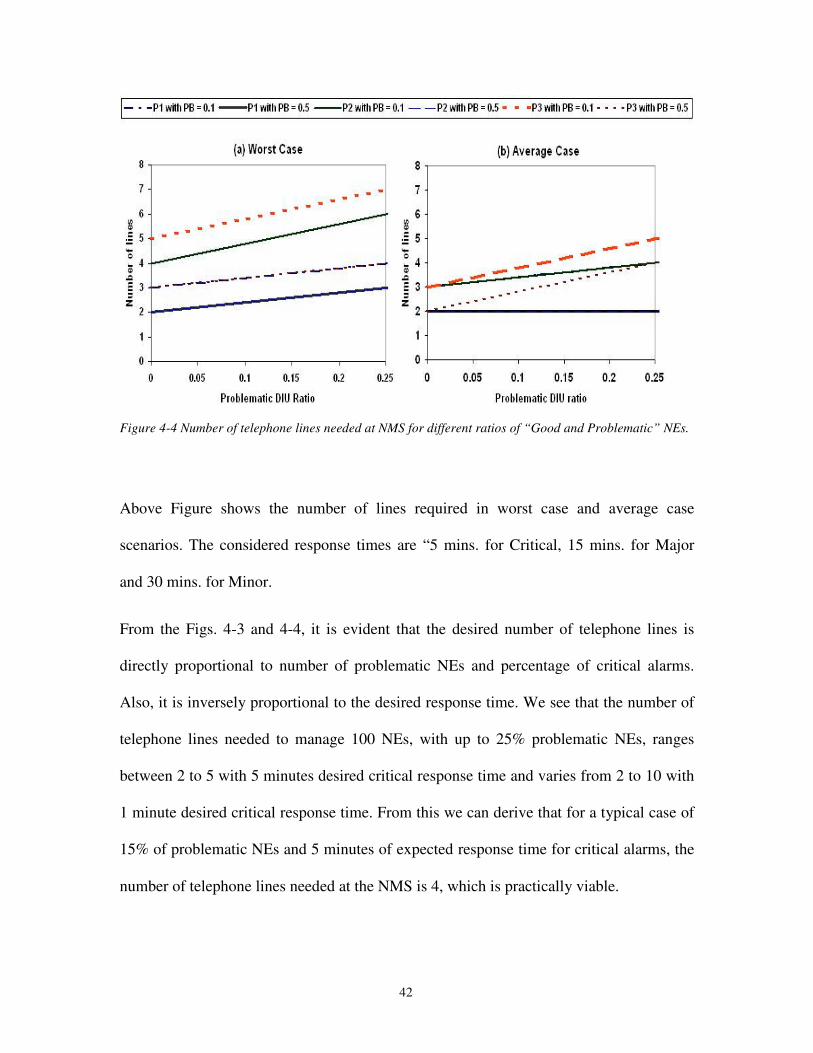
Figure 4-4 Number of telephone lines needed at NMS for different ratios of “Good and Problematic” NEs.
Above Figure shows the number of lines required in worst case and average case
scenarios. The considered response times are “5 mins. for Critical, 15 mins. for Major
and 30 mins. for Minor.
From the Figs. 4-3 and 4-4, it is evident that the desired number of telephone lines is
directly proportional to number of problematic NEs and percentage of critical alarms.
Also, it is inversely proportional to the desired response time. We see that the number of
telephone lines needed to manage 100 NEs, with up to 25% problematic NEs, ranges
between 2 to 5 with 5 minutes desired critical response time and varies from 2 to 10 with
1 minute desired critical response time. From this we can derive that for a typical case of
15% of problematic NEs and 5 minutes of expected response time for critical alarms, the
number of telephone lines needed at the NMS is 4, which is practically viable.
43
, �2 � " ��( � � � �
Apart from the consideration of number of telephone lines needed to achieve the desired
response time, an important factor of concern is the operational cost. The operational cost
for a dialup connection largely depends on number of calls and average call holding time.
Number of calls depends on the number of messages generated and desired response time
as shown in the previous sections. The second part is the call holding time
The total call holding time or duration can be divided into three portions namely T1, T2
and T3. T1 is the average time to establish a call (this time does not add to the cost factor)
and T2 is the average time to establish the dialup connection (modem negotiation + PPP
connection) and T3 is the average time to transfer the pooled alarms to the NMS
The measured average value for T1 is 20 sec and for T2 is 17 sec.
Message arrival rate at each NE is taken as 500 per hour. Average size of a message is
500 bytes.
The number of calls made in one hour is 60. The size of the message file collected in
60/N min is 4K
From the Table 4-3, with a connection speed of 38400 and with compression, the time
taken to transfer a file of size 4K is 3 sec. So, the value of T3 is 3 sec.
44
, �2 �� � " ��� �� � �� ��� �
Assumptions made for cost calculation are
1. Unit cost = C = INR 1
2. 1 Unit duration = 30 seconds
Number of units charged in a call = (T2 + T3) / 30 = A
Cost per month = (Number of NEs × Number days in a month × Number of hours in a
day × Number of calls per hour × Average number of units charged in one call × Cost of
one unit) = NNE × 30 × 24 × N × A × C
, �2 �� � � � ) � " �0� � �. � � � � � � � ���� � " � � �� � � � � ��6 ��$
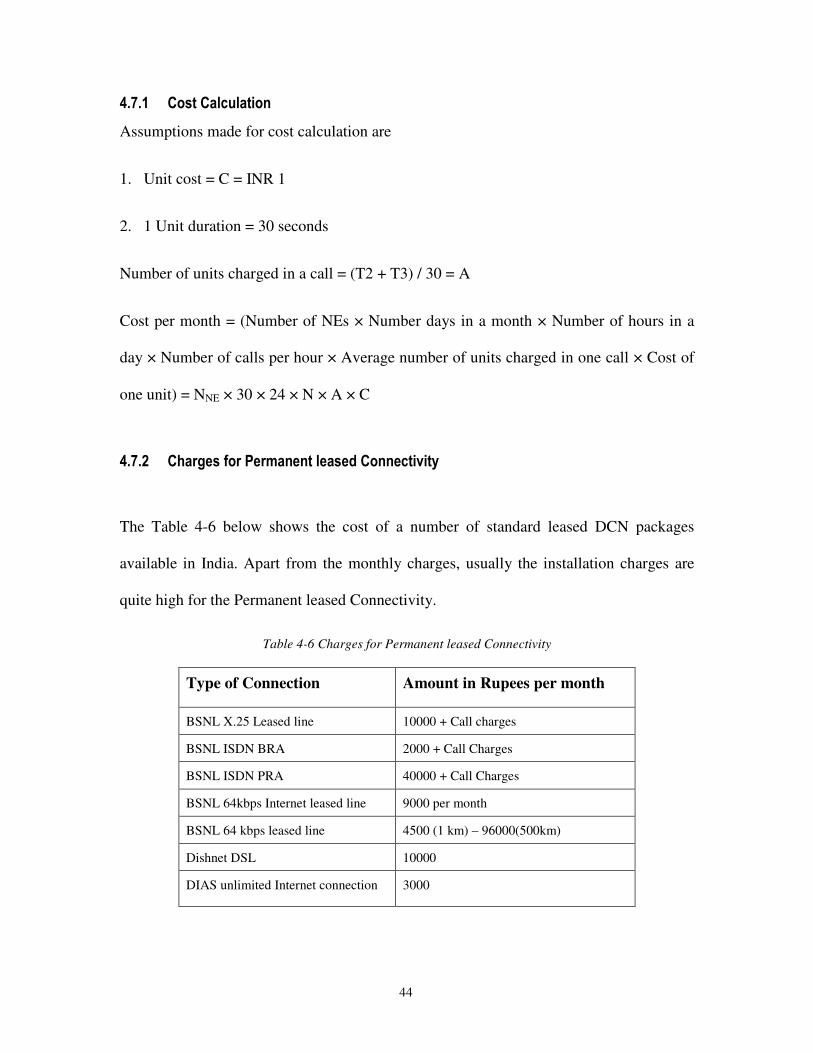
The Table 4-6 below shows the cost of a number of standard leased DCN packages
available in India. Apart from the monthly charges, usually the installation charges are
quite high for the Permanent leased Connectivity.
Table 4-6 Charges for Permanent leased Connectivity
Type of Connection Amount in Rupees per month
BSNL X.25 Leased line 10000 + Call charges
BSNL ISDN BRA 2000 + Call Charges
BSNL ISDN PRA 40000 + Call Charges
BSNL 64kbps Internet leased line 9000 per month
BSNL 64 kbps leased line 4500 (1 km) – 96000(500km)
Dishnet DSL 10000
DIAS unlimited Internet connection 3000
45
, �2 �% �� 0� � " �� � � �� � � �� " �
Leased Line
Installation charges per leased line = Rs. 10000
Total Cost = NNE × 10000 = Rs. 10 lakhs
Dialup Line
Deposit for each telephone line = Rs. 3000
Total Cost = NNE × 3000 = 3 lakh = Rs. 3 lakhs
, �2 �, � " ��� � # � � �" �� �
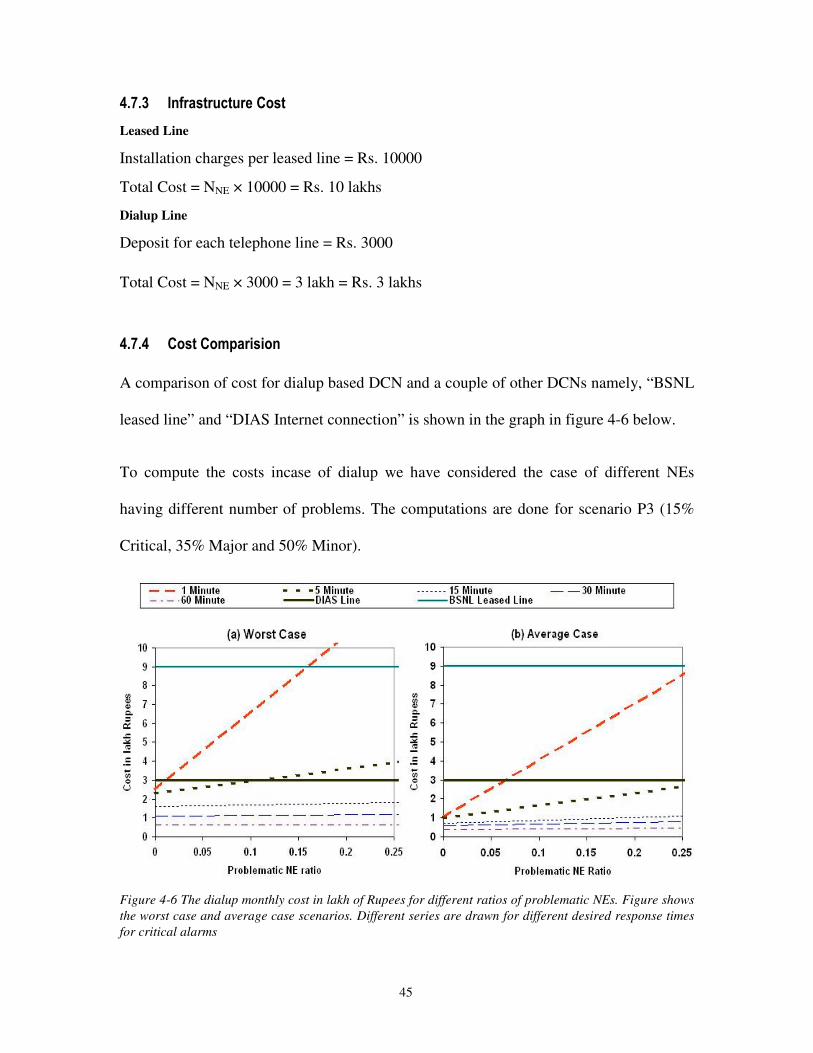
A comparison of cost for dialup based DCN and a couple of other DCNs namely, “BSNL
leased line” and “DIAS Internet connection” is shown in the graph in figure 4-6 below.
To compute the costs incase of dialup we have considered the case of different NEs
having different number of problems. The computations are done for scenario P3 (15%
Critical, 35% Major and 50% Minor).
Figure 4-6 The dialup monthly cost in lakh of Rupees for different ratios of problematic NEs. Figure showsthe worst case and average case scenarios. Different series are drawn for different desired response timesfor critical alarms
46
From corDECT installations, in general we have seen that the problematic NEs ratio is 10
– 15% of the total NEs in the network during times when the network is severely
stressed. From Fig 4-6, it is evident that the dialup operational cost increases with the
increase in the problematic NEs and with the decrease in the desired response time. In the
worst case the dialup cost becomes extremely high. With a response time of five-minute
or higher dialup is cheaper than DIAS and BSNL leased lines. Whereas, with one-minute
response time, dialup is cheaper than BSNL leased line, but costlier than DIAS leased
lines. From this we can derive that for a typical case of 15% of problematic NEs and 5
minutes of expected response time for critical alarms the dialup is 33% cheaper than DSL
lines.
, �; �� � � � � $
We have derived performance and cost models for the dialup based Data Communication
Network. The results of the analytical performance model are validated with an
experimental test bed. Using the validated analytical model, we have calculated the
number of lines required for delivering alarms at the NMS. Using the cost model, the cost
incurred for different response times is computed and a graph was drawn. From the
results we can derive that NEs which are important but problematic (i.e. whose desired
response time is of the order of 1 min and which generate too many messages) leased
lines might be a better DCN choice. If the desired response time is of the order of 5 mins.
or above and the problematic NE ratio is below 10 – 15%, dialup proves to be a cost-
effective choice.
47
� � # �� � �-
� " �) � �� � � ��� # �� � � � �� ��� �
We have seen the dialup based Data Communication Network performance model and its
results in the previous chapter. This chapter gives an insight into the design and
implementation aspects of the dialup based Data Communication Network for network
management.
- �� � " �) � ��" " � � "
Apart from the different techniques discussed in dialup based DCN solution, different
issues considered for designing the dialup DCN for network management are
The corDECT system has two controller cards for redundancy purpose. Even when one
of the controller cards goes down, the management should be made possible. When both
the controller cards are up, only one controller card should answer the incoming calls and
should deliver the alarms to the NMS. System should recover from abnormal connection
drop and should try to connect to destination immediately.
System should use the already established dialup connection for job execution. In order to
increase the DCN availability, backup option is to be supported. Since most of the
functionalities are same at the NMS and the Network Element, the software should be
modularized. DCN should be transparent to all management applications.
48
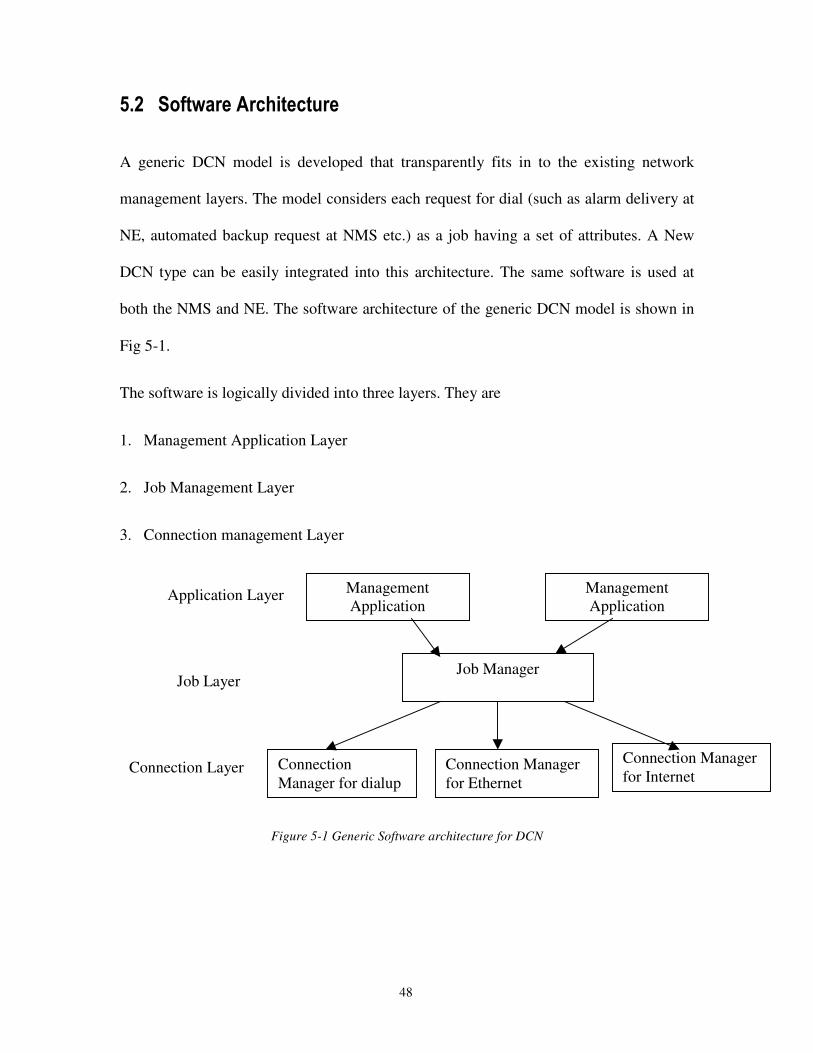
- �� �� 0�& � � � ��� � � ��� � �� � �
A generic DCN model is developed that transparently fits in to the existing network
management layers. The model considers each request for dial (such as alarm delivery at
NE, automated backup request at NMS etc.) as a job having a set of attributes. A New
DCN type can be easily integrated into this architecture. The same software is used at
both the NMS and NE. The software architecture of the generic DCN model is shown in
Fig 5-1.
The software is logically divided into three layers. They are
1. Management Application Layer
2. Job Management Layer
3. Connection management Layer
ManagementApplication
Job Manager
ConnectionManager for dialup
Connection Managerfor Ethernet
Connection Managerfor Internet
ManagementApplication
Application Layer
Job Layer
Connection Layer
Figure 5-1 Generic Software architecture for DCN
49
- �� �� ( � � � ) � � � � ���# # ��� � ��� � ��� $ � �
All the management applications, which need to manage/monitor the Managed Objects,
will reside in this layer. Examples of management applications are
1. Billing backup
2. PM data collection
3. Alarm delivery
4. Client user interface software
5.2.1.1 Billing Backup
This is a system job that will be triggered at regular intervals every day. The main
objective is to fetch the Call Detail Records from all the Network Elements and store
them in the NMS station.
5.2.1.2 Performance data collection
This is a system job, which will be triggered at regular intervals every day. The main
objective is to collect the traffic statistics and other performance data from Network
Element and store it in the NMS station.
5.2.1.3 Alarm delivery
This is a system job executed at the Network Element to deliver the alarms to the NMS
station.
5.2.1.4 Client user interface software
When an operator wants to provision a Network Element, he/she requests for a
connection and once the task is over, disconnects the connection. The Connection will
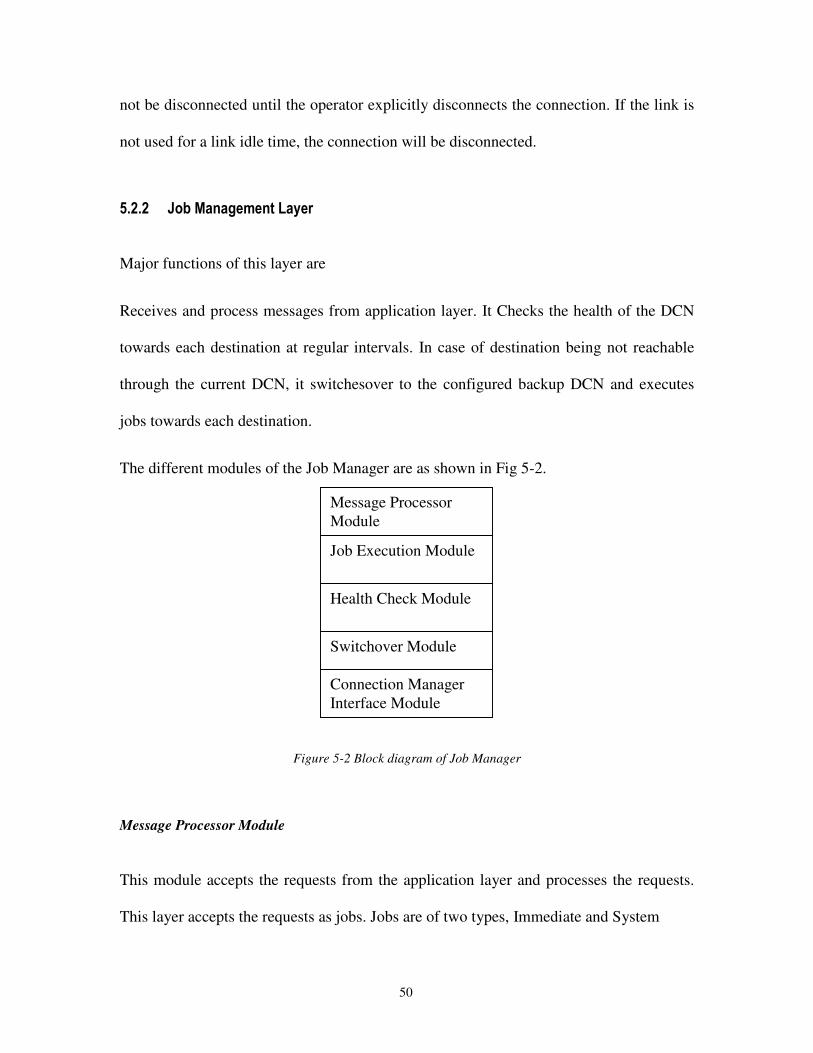
50
not be disconnected until the operator explicitly disconnects the connection. If the link is
not used for a link idle time, the connection will be disconnected.
- �� �� 8 � / �( � � � ) � � � � ���� $ � �
Major functions of this layer are
Receives and process messages from application layer. It Checks the health of the DCN
towards each destination at regular intervals. In case of destination being not reachable
through the current DCN, it switchesover to the configured backup DCN and executes
jobs towards each destination.
The different modules of the Job Manager are as shown in Fig 5-2.
Message ProcessorModule
Health Check Module
Switchover Module
Job Execution Module
Connection ManagerInterface Module
Figure 5-2 Block diagram of Job Manager
Message Processor Module
This module accepts the requests from the application layer and processes the requests.
This layer accepts the requests as jobs. Jobs are of two types, Immediate and System
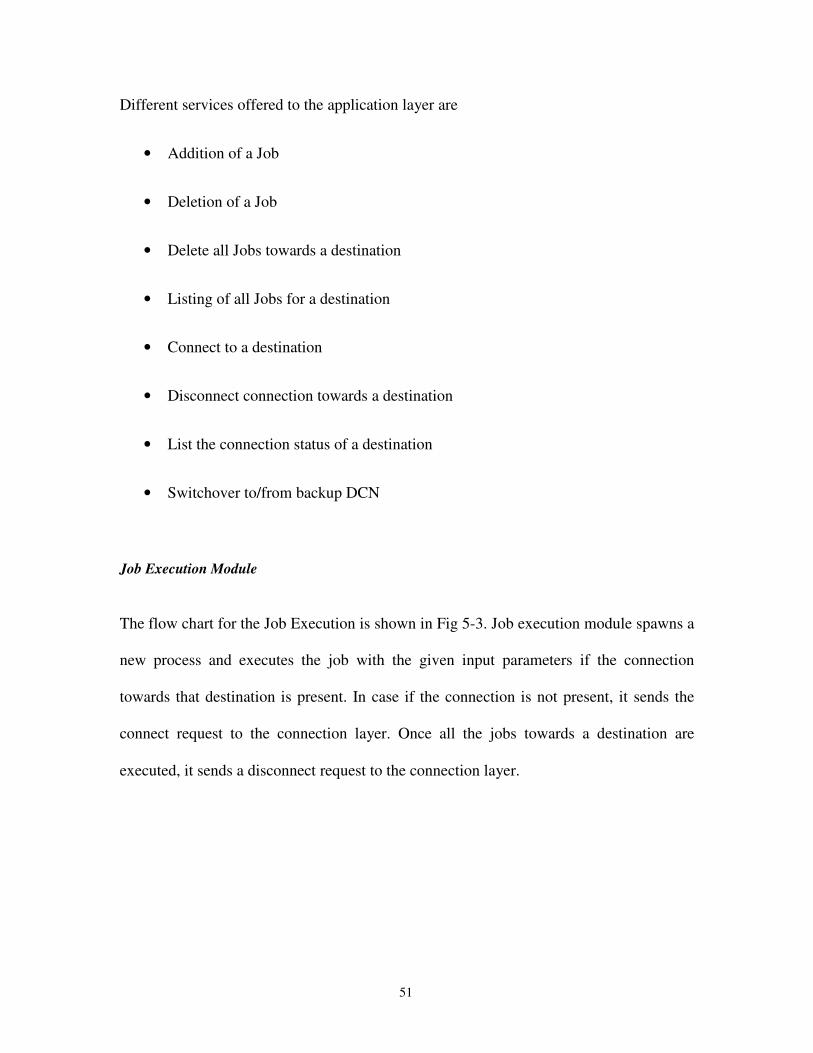
51
Different services offered to the application layer are
• Addition of a Job
• Deletion of a Job
• Delete all Jobs towards a destination
• Listing of all Jobs for a destination
• Connect to a destination
• Disconnect connection towards a destination
• List the connection status of a destination
• Switchover to/from backup DCN
Job Execution Module
The flow chart for the Job Execution is shown in Fig 5-3. Job execution module spawns a
new process and executes the job with the given input parameters if the connection
towards that destination is present. In case if the connection is not present, it sends the
connect request to the connection layer. Once all the jobs towards a destination are
executed, it sends a disconnect request to the connection layer.
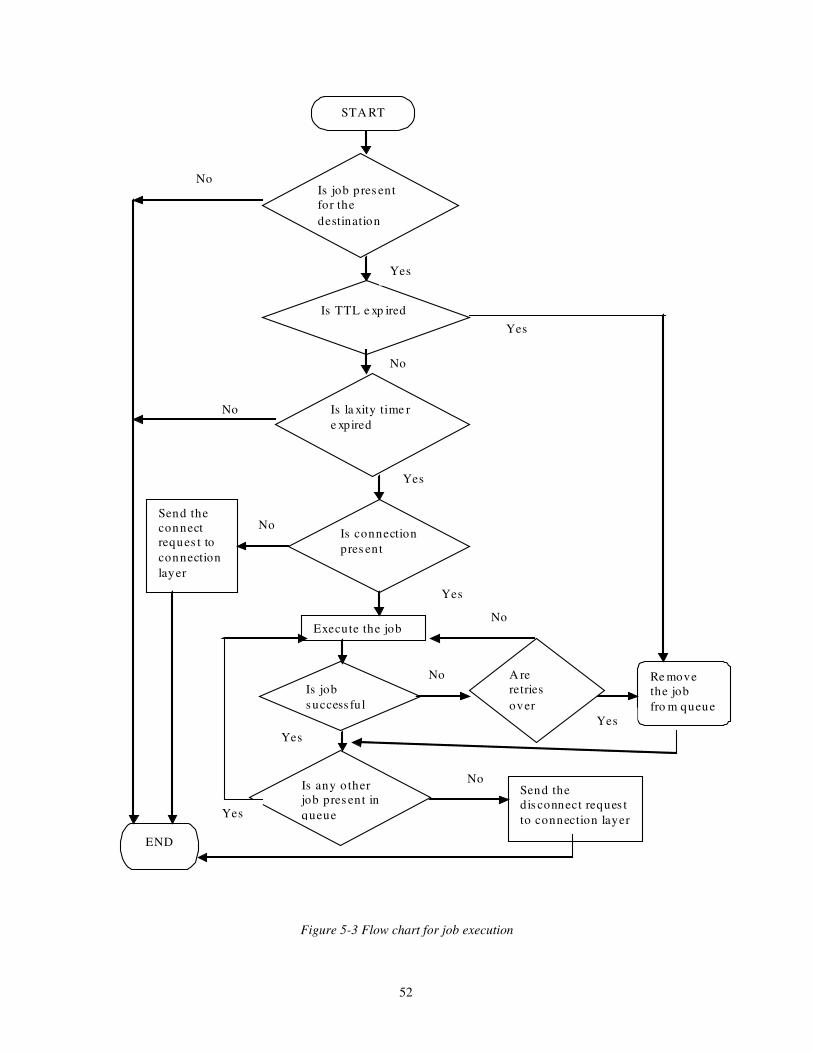
52
Is job pres ent for the destination
Is connection pres ent
Execute the job
Send the connect reques t to connection layer
Yes
Is job success ful
Is any o ther job pres ent in queue
Send the dis connect reques t to connection layer
No
A re retries over
No
Re move the job fro m queue
Is TTL e xp ired
Yes
Yes
No
Yes
No
Yes
Is la xity time r e xpired
STA RT
END
No
Yes
No
No
Yes
Figure 5-3 Flow chart for job execution
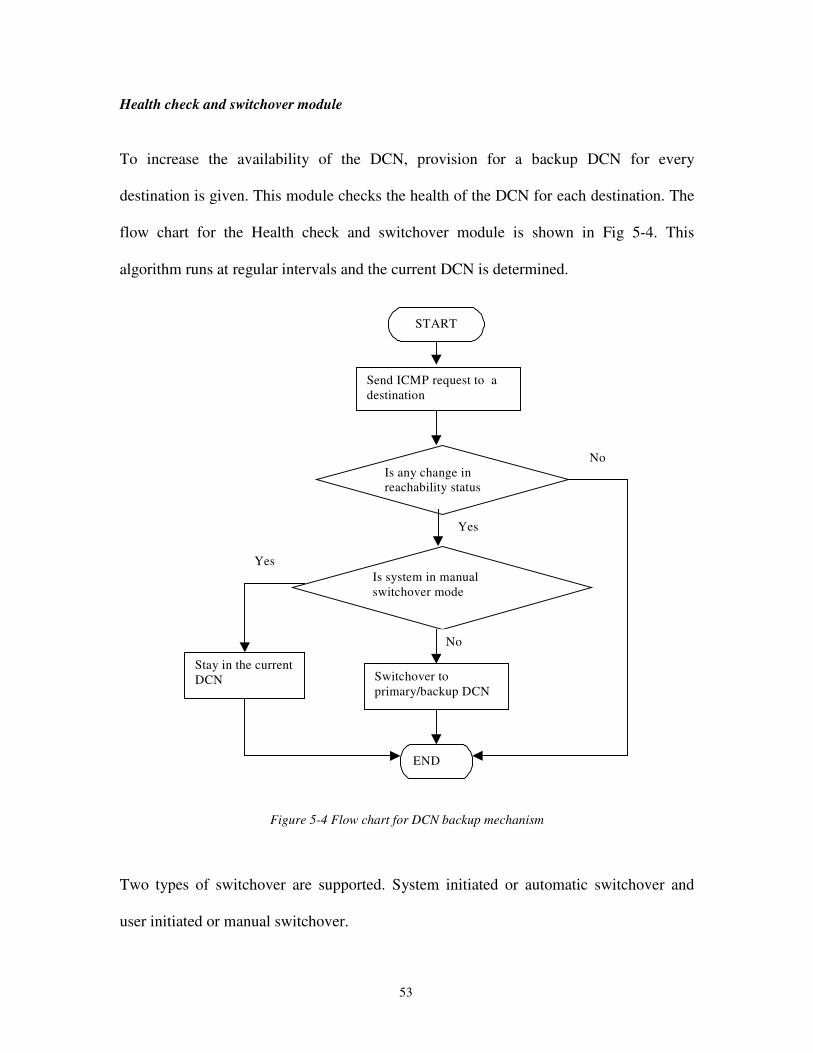
53
Health check and switchover module
To increase the availability of the DCN, provision for a backup DCN for every
destination is given. This module checks the health of the DCN for each destination. The
flow chart for the Health check and switchover module is shown in Fig 5-4. This
algorithm runs at regular intervals and the current DCN is determined.
Send ICMP request to adestination
Is any change inreachability status
Is system in manualswitchover mode
Switchover toprimary/backup DCN
No
No
Yes
Yes
START
END
Stay in the currentDCN
Figure 5-4 Flow chart for DCN backup mechanism
Two types of switchover are supported. System initiated or automatic switchover and
user initiated or manual switchover.
54
The System can be either in user initiated switchover or system initiated switchover
mode. In case of user initiated switchover, even on the current DCN failure, system will
not switchover to the backup DCN. User has to manually switchover to the backup DCN.
In case of system initiated switchover, on failure of the current DCN towards a
destination, it switches over to the backup DCN. If the primary DCN recovers, it switches
automatically back to the primary DCN.
Connection Manager Interface Module
This module provides the following primitives for each kind of DCN.
• Connect
• Disconnect
• List connection status
To support any new DCN in this framework, the above three primitives have to be
implemented. With this, the DCN software can be extended to support any new kind of
DCN. When a user issues a connect request, based on the current DCN towards a
destination, connect request will be sent to the corresponding connection manager.
Destination Id and connection type (system or user) arguments are sent to the connection
manager with connect and disconnect requests.
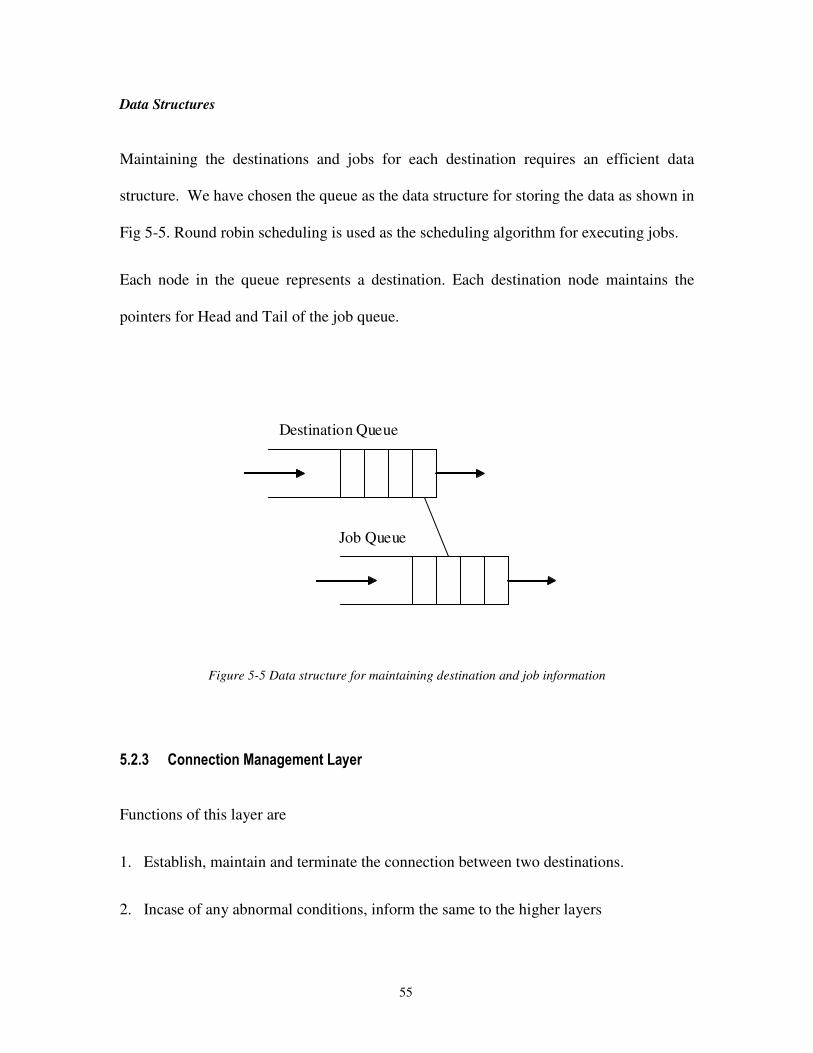
55
Data Structures
Maintaining the destinations and jobs for each destination requires an efficient data
structure. We have chosen the queue as the data structure for storing the data as shown in
Fig 5-5. Round robin scheduling is used as the scheduling algorithm for executing jobs.
Each node in the queue represents a destination. Each destination node maintains the
pointers for Head and Tail of the job queue.
Destination Queue
Job Queue
Figure 5-5 Data structure for maintaining destination and job information
- �� �% � � � � � ��� � �( � � � ) � � � � ���� $ � �
Functions of this layer are
1. Establish, maintain and terminate the connection between two destinations.
2. Incase of any abnormal conditions, inform the same to the higher layers
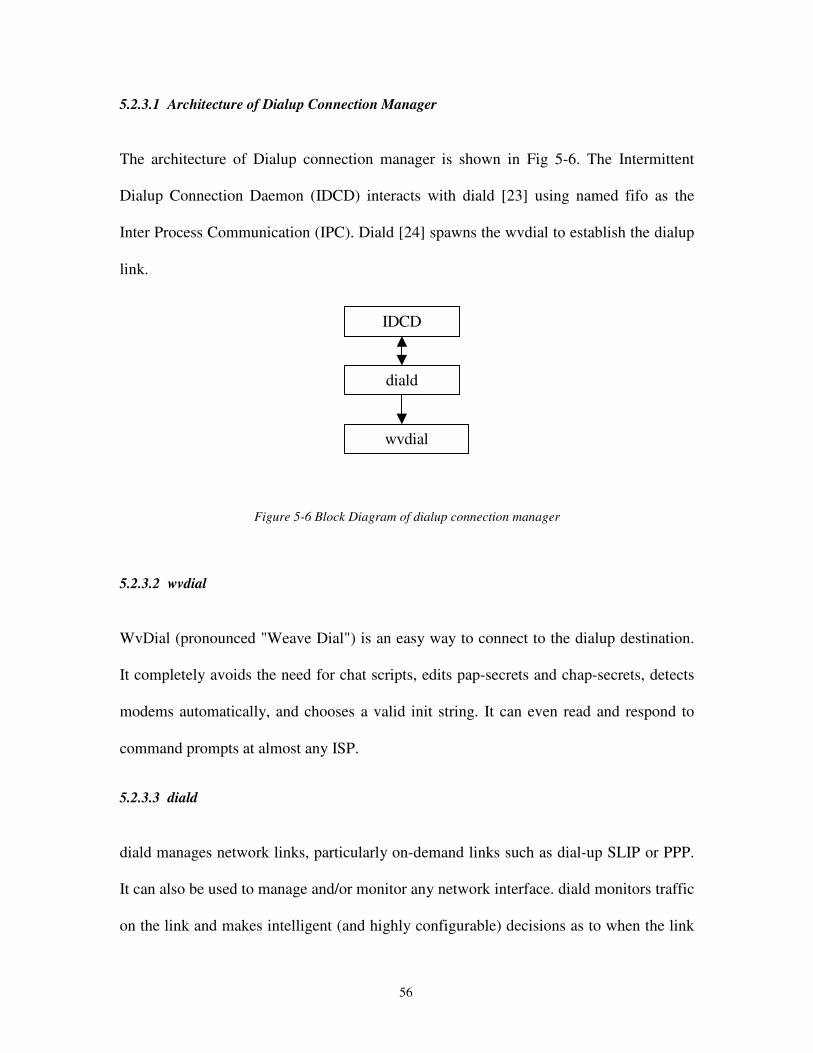
56
5.2.3.1 Architecture of Dialup Connection Manager
The architecture of Dialup connection manager is shown in Fig 5-6. The Intermittent
Dialup Connection Daemon (IDCD) interacts with diald [23] using named fifo as the
Inter Process Communication (IPC). Diald [24] spawns the wvdial to establish the dialup
link.
IDCD
diald
wvdial
Figure 5-6 Block Diagram of dialup connection manager
5.2.3.2 wvdial
WvDial (pronounced "Weave Dial") is an easy way to connect to the dialup destination.
It completely avoids the need for chat scripts, edits pap-secrets and chap-secrets, detects
modems automatically, and chooses a valid init string. It can even read and respond to
command prompts at almost any ISP.
5.2.3.3 diald
diald manages network links, particularly on-demand links such as dial-up SLIP or PPP.
It can also be used to manage and/or monitor any network interface. diald monitors traffic
on the link and makes intelligent (and highly configurable) decisions as to when the link
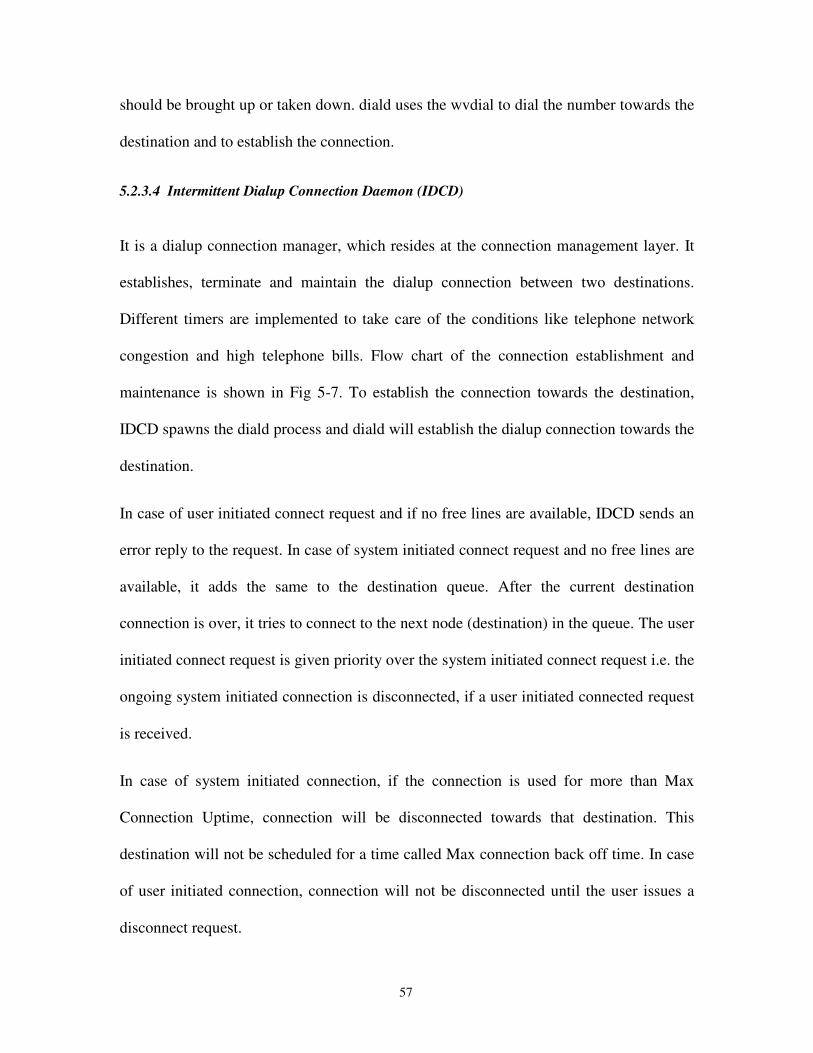
57
should be brought up or taken down. diald uses the wvdial to dial the number towards the
destination and to establish the connection.
5.2.3.4 Intermittent Dialup Connection Daemon (IDCD)
It is a dialup connection manager, which resides at the connection management layer. It
establishes, terminate and maintain the dialup connection between two destinations.
Different timers are implemented to take care of the conditions like telephone network
congestion and high telephone bills. Flow chart of the connection establishment and
maintenance is shown in Fig 5-7. To establish the connection towards the destination,
IDCD spawns the diald process and diald will establish the dialup connection towards the
destination.
In case of user initiated connect request and if no free lines are available, IDCD sends an
error reply to the request. In case of system initiated connect request and no free lines are
available, it adds the same to the destination queue. After the current destination
connection is over, it tries to connect to the next node (destination) in the queue. The user
initiated connect request is given priority over the system initiated connect request i.e. the
ongoing system initiated connection is disconnected, if a user initiated connected request
is received.
In case of system initiated connection, if the connection is used for more than Max
Connection Uptime, connection will be disconnected towards that destination. This
destination will not be scheduled for a time called Max connection back off time. In case
of user initiated connection, connection will not be disconnected until the user issues a
disconnect request.
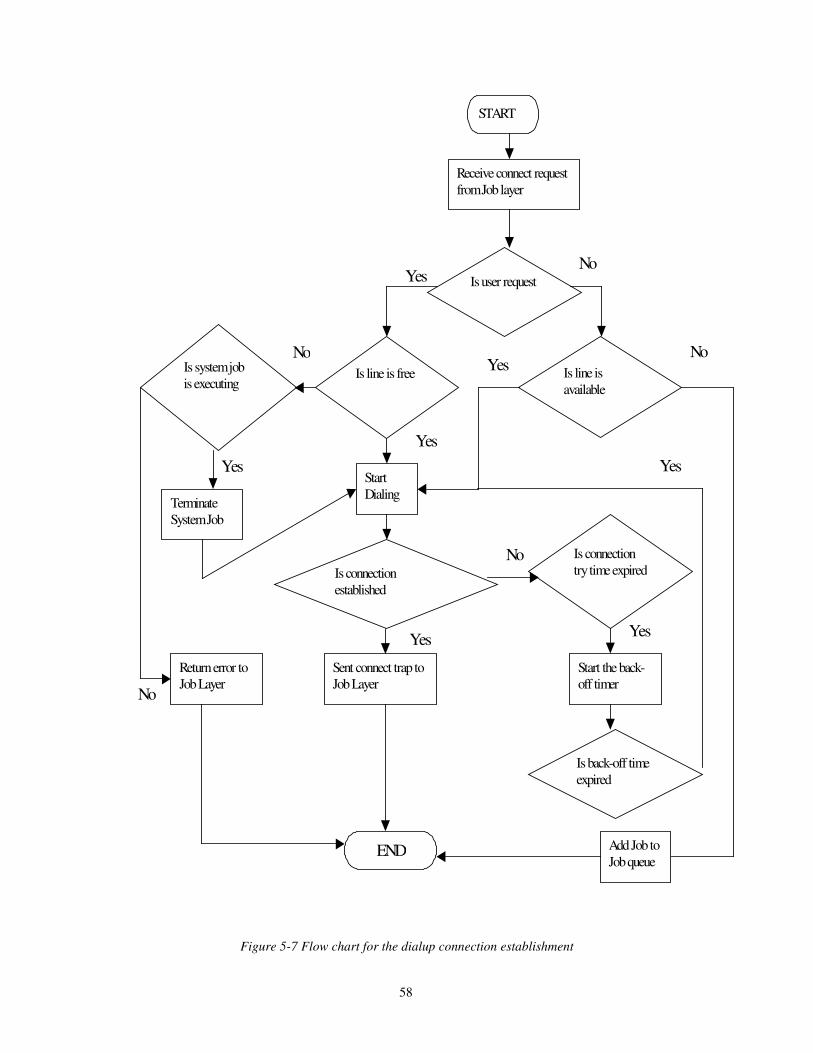
58
START
Receive connect requestfrom Job layer
Is user request
Is line is free
StartDialing
Is system jobis executing
TerminateSystem Job
Is line isavailable
Add Job toJob queue
Sent connect trap toJob Layer
END
YesNo
Yes
YesYes
NoNo
No
Return error toJob Layer
Is connectionestablished
Start the back-off timer
Is connectiontry time expired
Is back-off timeexpired
No
Yes
Yes
Yes
Figure 5-7 Flow chart for the dialup connection establishment
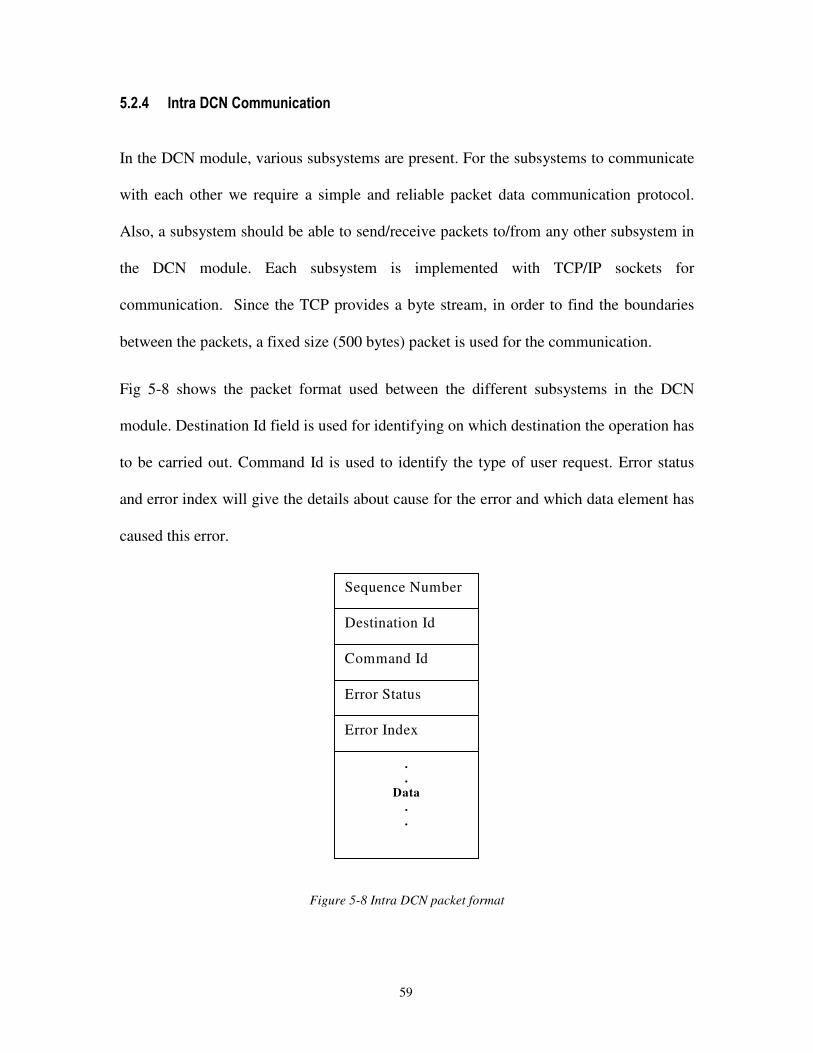
59
- �� �, �� �� � � �� � � � � �� � ��� �
In the DCN module, various subsystems are present. For the subsystems to communicate
with each other we require a simple and reliable packet data communication protocol.
Also, a subsystem should be able to send/receive packets to/from any other subsystem in
the DCN module. Each subsystem is implemented with TCP/IP sockets for
communication. Since the TCP provides a byte stream, in order to find the boundaries
between the packets, a fixed size (500 bytes) packet is used for the communication.
Fig 5-8 shows the packet format used between the different subsystems in the DCN
module. Destination Id field is used for identifying on which destination the operation has
to be carried out. Command Id is used to identify the type of user request. Error status
and error index will give the details about cause for the error and which data element has
caused this error.
.
.Data
.
.
Sequence Number
Destination Id
Command Id
Error Status
Error Index
Figure 5-8 Intra DCN packet format
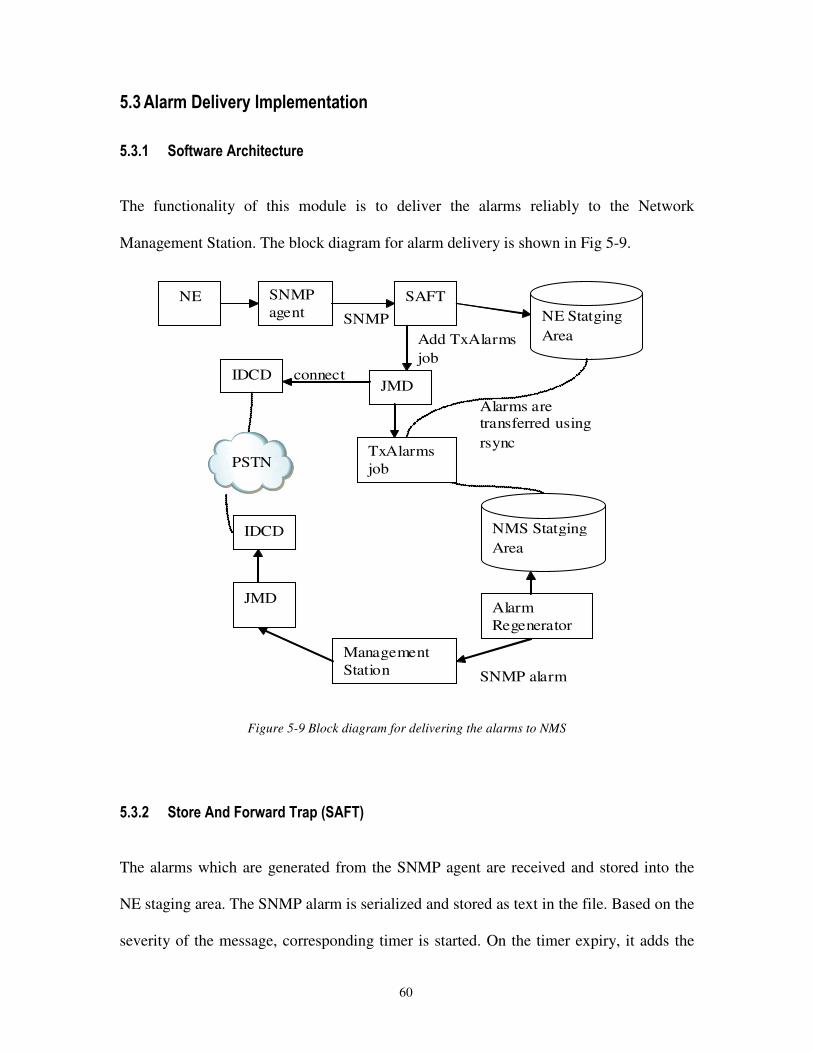
60
- �% ��� � � � � ��6 � � $ ��� # �� � � � �� ��� �
- �% �� �� 0�& � � � ��� � � ��� � �� � �
The functionality of this module is to deliver the alarms reliably to the Network
Management Station. The block diagram for alarm delivery is shown in Fig 5-9.
NE SNMP agent
SAFT
JMD IDCD
IDCD
NE Statging Area
NMS Statging Area
Alarm Regenerator
JMD
Management Station
Alarms are transferred using rsync
connect
Add TxAlarms job
SNMP alarm
SNMP
PSTN TxAlarms job
Figure 5-9 Block diagram for delivering the alarms to NMS
- �% �� ��� � � ��� � ��� � & � � � ��� � # �*����+
The alarms which are generated from the SNMP agent are received and stored into the
NE staging area. The SNMP alarm is serialized and stored as text in the file. Based on the
severity of the message, corresponding timer is started. On the timer expiry, it adds the
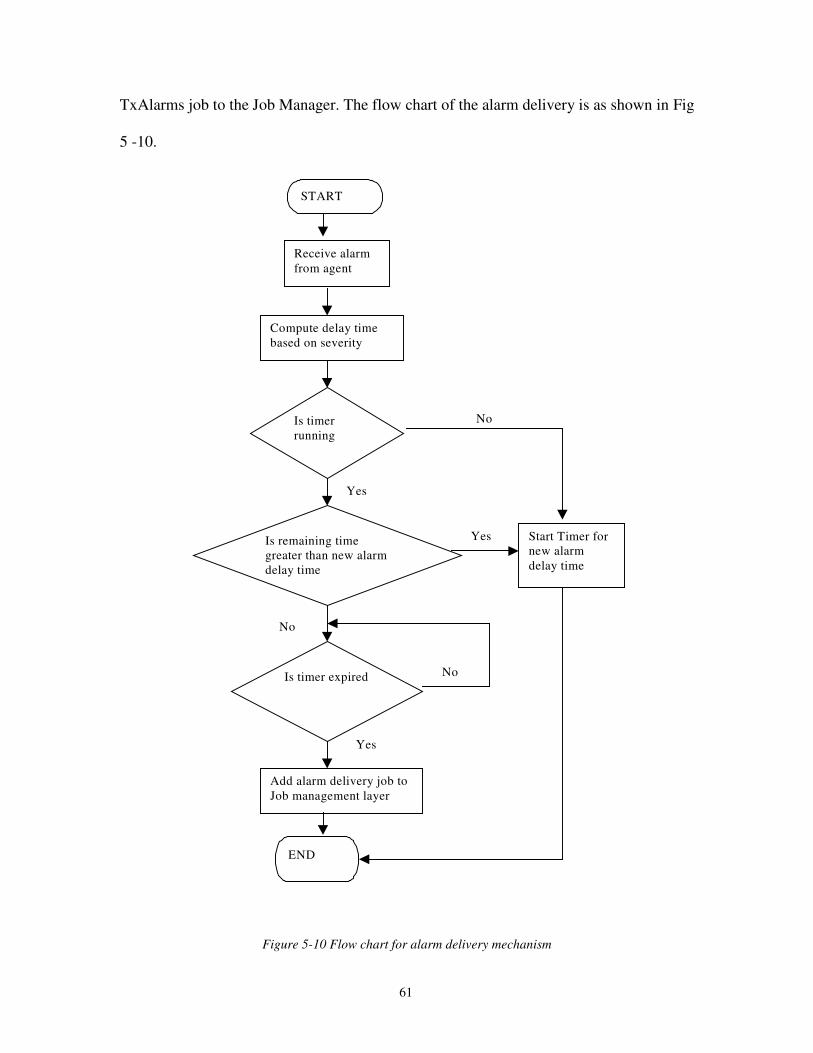
61
TxAlarms job to the Job Manager. The flow chart of the alarm delivery is as shown in Fig
5 -10.
Receive alarmfrom agent
Is timerrunning
Compute delay timebased on severity
Is remaining timegreater than new alarmdelay time
Start Timer fornew alarmdelay time
Yes
Add alarm delivery job toJob management layer
Yes
Is timer expired
Yes
No
No
START
END
No
Figure 5-10 Flow chart for alarm delivery mechanism
62
- �% �% �4 ��� � � " �8 � /
The functionality of this module is to transfer the alarm file from the NE staging area to
the NMS staging area. The rsync program is used to transfer the alarms from the Network
Element to the NMS. Before it sends the alarm to the NMS staging area, it filters the
alarms and adds additional information like first occurrence time and repeat count. In
case of abnormal dialup connection termination, usage of the partial file transfer option of
rsync ensures that only the differential file is transferred.
- �% �, ��� � � �� � ) � � � � � �� �
The alarm regenerator reads the alarm text file in the NMS staging area, forms the SNMP
trap and sends it to the Management Station.
- �, ��� � � � � � � � � �� �
This software module is implemented to generate alarms from a field log trace. It reads
the log records from the trace and generates the SNMP traps in sequence with the actual
time difference between two log records. This software module along with the DCN
software helps one to conduct the experiments in the corDECT system and measure
various parameters such as response time, blocking probability and cost. This module is
used in the experimental model to validate the analytical model.
63
- �- �� � � � � $
The software is organized into three logical layers and we have seen the design and
implementation aspects of each layer. We have seen the implementation details of the
alarm delivery mechanism. The proposed alarm delivery mechanism can be used on any
un-reliable DCN and does not need any change in the management applications. Finally
we have seen the alarm generator which is used for simulating the alarms for measuring
the various parameters in the dialup DCN.
64
� � # �� � �1
� � � �� " �� � "
We have proposed dialup as a Data Communication Network for managing a telecom
network. We have developed an analytical model for this DCN. The analytical model was
validated using measurements obtained using an experimental test bed. The error between
the proposed analytical and experimental model was found to be less than 15%. With
increase in traffic it was found that the error decreased to 2%.
With the validated analytical model, the number of lines and cost can be computed for
any network deployments. For receiving alarms from 100 Network Elements, from the
results (Section 4.6.4) we can derive that for a typical case of 15% of problematic NEs
and 5 minutes of expected response time for critical alarms, the number of telephone
lines needed at the NMS is 4, which is practically viable.
We have designed and implemented the DCN software, which transparently fits into the
existing management platform. The software can be extended to support any new kinds
of DCN. Backup DCN option is provided to increase the availability of the underlying
DCN. The proposed reliable and efficient alarm delivery mechanism can be used on any
un-reliable DCN such as Internet. The software is modularized to have the same
implementation on both the Network Element and NMS side.

65
We have designed and implemented this DCN model for the corDECT NMS. Several
deployments of corDECT in India and abroad with dialup based DCN are found to be
successful.
�� �� � ��! �� <
The analytical model can be improved by taking into account the effect of call merging
because of the dialup retries. The analytical model can be extended to understand the
number of channels required to deliver the alarms with permissible load on NMS, in case
of continuous DCN like Ethernet.
The backup DCN can be extended to support more than one backup DCN option. Calling
Line Identification based support can be built for increasing the security
66
� � 0� � � � � � "
[1] Rekha Jain, “Expanding Rural telecom services”, http://investor.rediff.com/
indusnewsDt.asp?path=2005%5C1%5Cindus2012005.html&y=2005, Jan. 2005.
[2] “India targets 250 million phone connections by 2007”,
http://www.thehindubusinessline.com/2005/04/14/stories/2005041401700300.htm,
Apr. 2005.
[3] A. Jhunjhunwala, B. Ramamurthi, T.A. Gonsalves, “The role of technology in
telecom expansion in India”, IEEE Commun. Mag , vol. 22, no. 3, Nov. 98, pp.
88-94.
[4] ETSI EN 300 175-1, “Digital Enhanced Cordless Telecommunications (DECT)
Overview”, European Telecomm. Stands. Inst., vol. 37, no. 8, Aug 89.
[5] A. Jhunjunwala, D. Jalihal, K. Giridhar, “Wireless in Local Loop – Some
Fundamentals”, J. IETE, vol. 46, no. 6, Nov – Dec 2000.
[6] W. Stallings, SNMP, SNMPv2, SNMPv3 and RMON 1 and 2, 3rd ed., Addison
Wesley, 99.
[7] Data Communication Network, www.linuxports.com/howto/intro_to_networking/
c563.htm, 2001.
[8] A.S. Tanenbaum, Computer Networks, 4th ed., Prentice Hall of India, 2002.
[9] Banyan Networks, www.banyannetworks.com, 2004.
[10] CCITT Recommendation X.733, Information Technology – Open Systems
Interconnection - Systems Management: Part 4: Alarm reporting function, 92.
67
[11] W. Simpson, Point to Point Protocol (PPP), RFC 1661, Network working Group,
Jul 94.
[12] J. Postal, Transmission Control Protocol (TCP), RFC 793, Sep. 81.
[13] J. Postal, Internet Protocol (IP), RFC 791, Sep. 81.
[14] J. Case, M. Fedor, M. Schoffstall, J. Davin, A Simple Network Management
Protocol (SNMP), RFC 1157, May 90.
[15] J. Postal, User Datagram Protocol (IP), RFC 768, Aug. 80.
[16] K. Kant, M.M. Srinivasan, Introduction to Computer System Performance
Evaluation, McGrawHill Inc., 92.
[17] L. Svododova, Computer Performance Measurement and Evaluation Methods:
Analysis and Applications, American Elsevier publishing company, Inc., 76.
[18] K.S. Trivedi, Probability and Statistics with Reliability, Queueing, and Computer
Science Applilcaitons, Prentice-Hall Inc., 94.
[19] D. Gross, C.M. Harris, Fundamentals of Queuing Theory, 3rd ed., Wiley series,
2002
[20] D. Novak, D. Rowland, and L. Dasilva, “Modem pool simulation and performance
analysis” – Soc. for Comp. Sim. Symp. for Perf. Eval. of Comp. & Telecom Sys.,
2000.
[21] J. Davidson, Deploying Cisco Voice Over IP Solutions, Cisco Press, 2001.
[22] “Extended Erlang B Calculator”, http://www.erlang.com/calculator/exeb/, 2004.
[23] Wvdial, http://open.nit.ca/wiki/?page=WvDial, 2005.
68
[24] Diald, http://diald.sourceforge.net/, Jun. 2001.
[25] Midas Comm Tech Pvt Ltd., http://www.midascomm.com, 2003.
[26] G. Goldszmidt and Y. Yemini, “Delegated Agents for Network Management”,
IEEE Commun. Mag., vol.36, no. 3, Mar. 98, pp. 66 – 70.
[27] A. Liotta and G. Pavlou, “Exploiting Agent Mobility for Large-Scale Network
Monitoring”, IEEE Network, vol. 16, no. 3, May/Jun. 2002, pp. 7 – 15.
[28] U. Black, Network Management Standards: SNMP, CMIP, TMN, MIBs and Object
Libraries, 2nd ed., McGraw-Hill, 94.
[29] T.A. Gonsalves, “The SNMP Manager-Agent paradigm revisited”, Proc.
Intil.Conf. Broadband Commn. (ICBN ’03), Banglore, India, May 2003.
[30] T.A. Gonsalves, A. Jhunhjunwala and H.A. Murthy, “CygNet: Integrated network
management for voice + internet”, Proc. NCC 2000, IIT-Delhi, Jan. 2000.
[31] AGK Vanchynathan, N. Usha Rani, C. Charitha, T. A.Gonsalves, “Distributed
NMS for Affordable Communications “ Proc. NCC 2004, IIT Madras, 2004.