Embed Size (px)
Citation preview
* Corresponding author: [email protected]
LOS Displacements of Mauna Loa volcano, Hawaii Island, as determined using SBAS-InSAR
Karolina Grzesiak1, and Wojciech J. Milczarek1,*
1
50-
Abstract. This paper presents an overview of the surface displacements retrieval capability of the Differential Synthetic Aperture Radar Interferometry algorithm, using Small Baseline Subset (SBAS) technique, in the context of active volcanic areas. Based on Sentinel-1A images, time series displacementsfields of the Mauna Loa volcano area over a 2-year time interval (between 2015 and 2017) were received using batch processing. Based on 35 radar images, a total of 179 interferograms have been calculated. Methodology of Synthetic Aperture Radar (SAR) Sentinel-1 ESA satellite mission data processing with small base (SBAS) interferometric techniques from has been presented. The displacements calculated in the satellite’s Line of Sight (LOS) have been presented graphically on maps and graphs. Application of radar interferometry methods in the case of volcanic surface activity research creates new possibilities in the area of permanent monitoring of this type of areas.
1 IntroductionThe present shape and location of the continents is the result of tectonic plates movements over millions of years. Numerous tectonic processes that lead to morphological differences in the terrain are observed at the boundaries of the plates. One of them is volcanism, which can both create new forms and - in the case of extremely explosions - lead to the destruction of previous forms. The earthquake is a frequent phenomenon preceding the eruption of the volcano [1]. Advanced measurement techniques enable us to obtain information about the elevation shape, observe a lot of phenomena and examine the physical properties of the Earth surface. Data for this type of research is acquired direct or indirect methods. The first group includes data from direct measurements such as GNSS, levelling, tachymetric and terrestrial laser scanning, while the second group includes radar images acquired by satellites. The range of the aforementioned methods largely depends on the quality and technical requirements, the availability of data, the physical characteristics of the object under study, and time. Remote sensing is useful in monitoring difficult to reach areas where stationary testing is dangerous, impossible to execute, or too costly. Radar interferometry is used to obtain information about the topography of the study area, as well as an excellent tool for monitoring displacements of terrain. These changes are mainly due to natural phenomena such as earthquakes, volcanic activity, landslides and human activities.
This article was created during the research work within the thesis. The main objective was to investigate
Mauna Loa’s volcanic activity over two years, adequate for the operation of the Sentinel – 1A satellite, to check the suitability and quality of results based on sentinel radar images. For this purpose, 35 satellite images were processed using the open source GMT5SAR [2]program, available only on the UNIX operating systems.
2 Mauna Loa volcano – basic information Mauna Loa is a shield volcano located on the southwestern side of the Hawaiian Archipelago Island – Hawaii and is one of the largest active volcano in the Earth (Fig. 1). Along with the other volcanoes, it is under constant observation by the USGS Research and Development Agency. Mauna Loa occupies most of the island’s total area (about 5180 km2), while it measures 4168 m above the Pacific Ocean surface [3]. The last eruption was in 1984 and it has erupted 39 times since 1832. Based on research and geological analyses, it has been shown that below the Pacific plate, there are still hot spots. The manifestation of this phenomenon allowed the formation of volcanic islands and volcanoes, by collecting the lava extracted from the interior of the land. Currently, the hot spots are located directly below the central part of the Hawai’i Islands, causing the activity in Mauna Lao and Kilauea volcanoes of the five volcanos. As a result of the eruption, the volcano produces low – viscosity basaltic lava (fluid and dark). The sudden drop in pressure and temperature contributes to the crystallization of the lava, the characteristic chemical composition of ‘hawaiian’ lava, which causes it to move over long distances, thus forming the outer crust of a
© The Authors, published by EDP Sciences. This is an open access article distributed under the terms of the Creative Commons Attribution License 4.0
(http://creativecommons.org/licenses/by/4.0/).
E3S Web of Conferences 55, 00006 (2018) https://doi.org/10.1051/e3sconf/20185500006XXIIIrd Autumn School of Geodesy
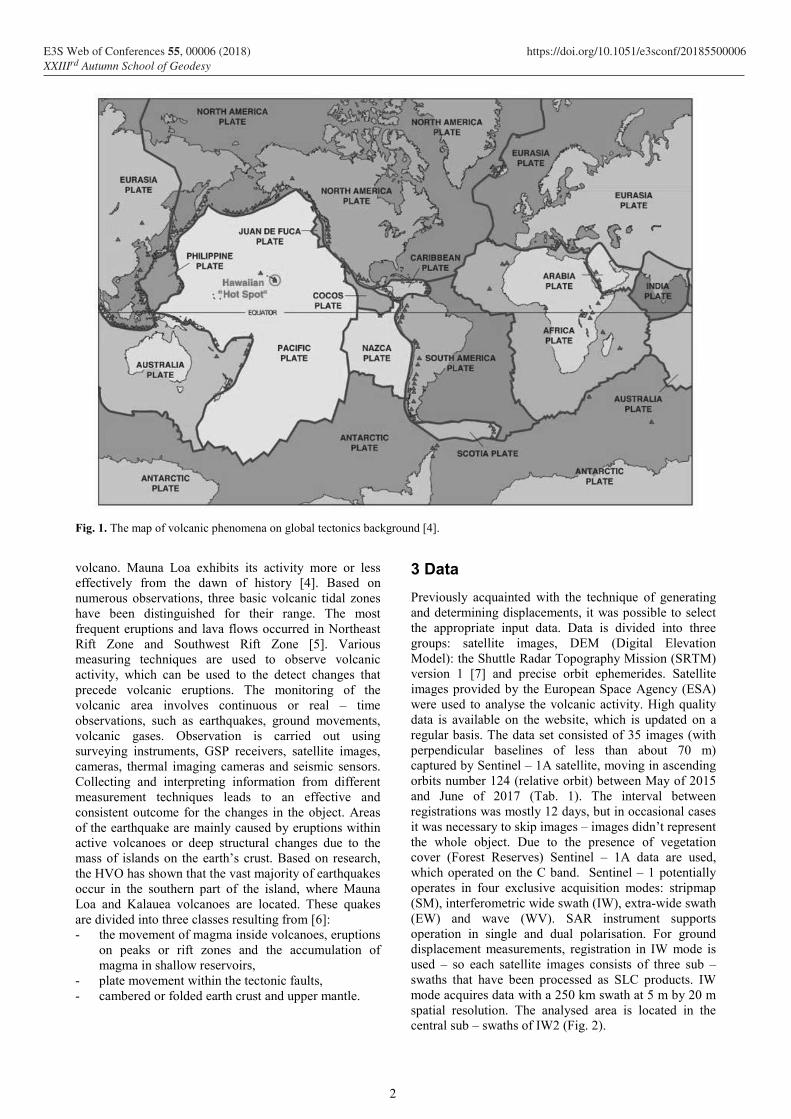
Fig. 1. The map of volcanic phenomena on global tectonics background [4].
volcano. Mauna Loa exhibits its activity more or less effectively from the dawn of history [4]. Based on numerous observations, three basic volcanic tidal zones have been distinguished for their range. The most frequent eruptions and lava flows occurred in Northeast Rift Zone and Southwest Rift Zone [5]. Various measuring techniques are used to observe volcanic activity, which can be used to the detect changes that precede volcanic eruptions. The monitoring of the volcanic area involves continuous or real – time observations, such as earthquakes, ground movements, volcanic gases. Observation is carried out using surveying instruments, GSP receivers, satellite images, cameras, thermal imaging cameras and seismic sensors. Collecting and interpreting information from different measurement techniques leads to an effective and consistent outcome for the changes in the object. Areas of the earthquake are mainly caused by eruptions within active volcanoes or deep structural changes due to the mass of islands on the earth’s crust. Based on research, the HVO has shown that the vast majority of earthquakes occur in the southern part of the island, where Mauna Loa and Kalauea volcanoes are located. These quakes are divided into three classes resulting from [6]: - the movement of magma inside volcanoes, eruptions
on peaks or rift zones and the accumulation ofmagma in shallow reservoirs,
- plate movement within the tectonic faults,- cambered or folded earth crust and upper mantle.
3 DataPreviously acquainted with the technique of generating and determining displacements, it was possible to select the appropriate input data. Data is divided into three groups: satellite images, DEM (Digital Elevation Model): the Shuttle Radar Topography Mission (SRTM) version 1 [7] and precise orbit ephemerides. Satellite images provided by the European Space Agency (ESA) were used to analyse the volcanic activity. High quality data is available on the website, which is updated on a regular basis. The data set consisted of 35 images (with perpendicular baselines of less than about 70 m) captured by Sentinel – 1A satellite, moving in ascending orbits number 124 (relative orbit) between May of 2015 and June of 2017 (Tab. 1). The interval between registrations was mostly 12 days, but in occasional cases it was necessary to skip images – images didn’t represent the whole object. Due to the presence of vegetation cover (Forest Reserves) Sentinel – 1A data are used, which operated on the C band. Sentinel – 1 potentially operates in four exclusive acquisition modes: stripmap (SM), interferometric wide swath (IW), extra-wide swath (EW) and wave (WV). SAR instrument supports operation in single and dual polarisation. For ground displacement measurements, registration in IW mode is used – so each satellite images consists of three sub – swaths that have been processed as SLC products. IW mode acquires data with a 250 km swath at 5 m by 20 m spatial resolution. The analysed area is located in the central sub – swaths of IW2 (Fig. 2).
2
E3S Web of Conferences 55, 00006 (2018) https://doi.org/10.1051/e3sconf/20185500006XXIIIrd Autumn School of Geodesy
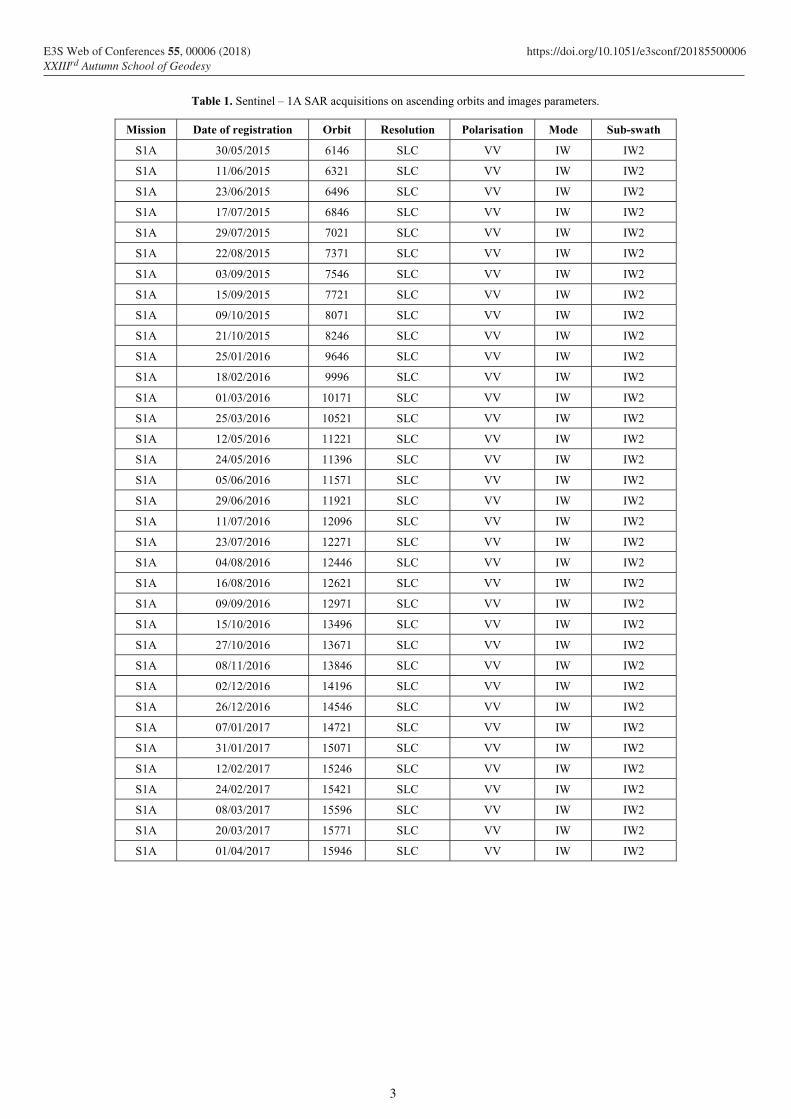
Table 1. Sentinel – 1A SAR acquisitions on ascending orbits and images parameters.
Mission Date of registration Orbit Resolution Polarisation Mode Sub-swath
S1A 30/05/2015 6146 SLC VV IW IW2
S1A 11/06/2015 6321 SLC VV IW IW2
S1A 23/06/2015 6496 SLC VV IW IW2
S1A 17/07/2015 6846 SLC VV IW IW2
S1A 29/07/2015 7021 SLC VV IW IW2
S1A 22/08/2015 7371 SLC VV IW IW2
S1A 03/09/2015 7546 SLC VV IW IW2
S1A 15/09/2015 7721 SLC VV IW IW2
S1A 09/10/2015 8071 SLC VV IW IW2
S1A 21/10/2015 8246 SLC VV IW IW2
S1A 25/01/2016 9646 SLC VV IW IW2
S1A 18/02/2016 9996 SLC VV IW IW2
S1A 01/03/2016 10171 SLC VV IW IW2
S1A 25/03/2016 10521 SLC VV IW IW2
S1A 12/05/2016 11221 SLC VV IW IW2
S1A 24/05/2016 11396 SLC VV IW IW2
S1A 05/06/2016 11571 SLC VV IW IW2
S1A 29/06/2016 11921 SLC VV IW IW2
S1A 11/07/2016 12096 SLC VV IW IW2
S1A 23/07/2016 12271 SLC VV IW IW2
S1A 04/08/2016 12446 SLC VV IW IW2
S1A 16/08/2016 12621 SLC VV IW IW2
S1A 09/09/2016 12971 SLC VV IW IW2
S1A 15/10/2016 13496 SLC VV IW IW2
S1A 27/10/2016 13671 SLC VV IW IW2
S1A 08/11/2016 13846 SLC VV IW IW2
S1A 02/12/2016 14196 SLC VV IW IW2
S1A 26/12/2016 14546 SLC VV IW IW2
S1A 07/01/2017 14721 SLC VV IW IW2
S1A 31/01/2017 15071 SLC VV IW IW2
S1A 12/02/2017 15246 SLC VV IW IW2
S1A 24/02/2017 15421 SLC VV IW IW2
S1A 08/03/2017 15596 SLC VV IW IW2
S1A 20/03/2017 15771 SLC VV IW IW2
S1A 01/04/2017 15946 SLC VV IW IW2
3
E3S Web of Conferences 55, 00006 (2018) https://doi.org/10.1051/e3sconf/20185500006XXIIIrd Autumn School of Geodesy
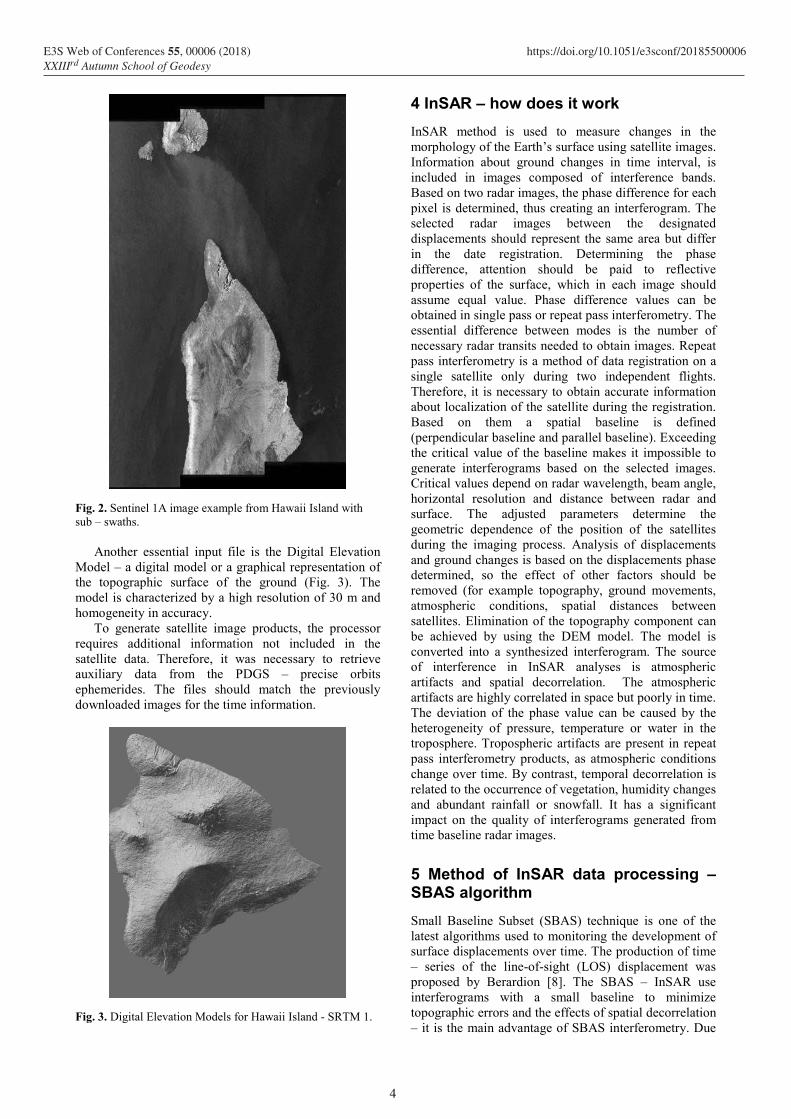
Fig. 2. Sentinel 1A image example from Hawaii Island with sub – swaths.
Another essential input file is the Digital Elevation Model – a digital model or a graphical representation of the topographic surface of the ground (Fig. 3). The model is characterized by a high resolution of 30 m and homogeneity in accuracy.
To generate satellite image products, the processor requires additional information not included in the satellite data. Therefore, it was necessary to retrieve auxiliary data from the PDGS – precise orbits ephemerides. The files should match the previously downloaded images for the time information.
Fig. 3. Digital Elevation Models for Hawaii Island - SRTM 1.
4 InSAR – how does it workInSAR method is used to measure changes in the morphology of the Earth’s surface using satellite images. Information about ground changes in time interval, is included in images composed of interference bands. Based on two radar images, the phase difference for each pixel is determined, thus creating an interferogram. The selected radar images between the designated displacements should represent the same area but differ in the date registration. Determining the phase difference, attention should be paid to reflective properties of the surface, which in each image should assume equal value. Phase difference values can be obtained in single pass or repeat pass interferometry. The essential difference between modes is the number of necessary radar transits needed to obtain images. Repeat pass interferometry is a method of data registration on a single satellite only during two independent flights. Therefore, it is necessary to obtain accurate informationabout localization of the satellite during the registration. Based on them a spatial baseline is defined (perpendicular baseline and parallel baseline). Exceeding the critical value of the baseline makes it impossible to generate interferograms based on the selected images. Critical values depend on radar wavelength, beam angle, horizontal resolution and distance between radar and surface. The adjusted parameters determine the geometric dependence of the position of the satellites during the imaging process. Analysis of displacements and ground changes is based on the displacements phase determined, so the effect of other factors should be removed (for example topography, ground movements, atmospheric conditions, spatial distances between satellites. Elimination of the topography component can be achieved by using the DEM model. The model is converted into a synthesized interferogram. The source of interference in InSAR analyses is atmospheric artifacts and spatial decorrelation. The atmospheric artifacts are highly correlated in space but poorly in time. The deviation of the phase value can be caused by the heterogeneity of pressure, temperature or water in the troposphere. Tropospheric artifacts are present in repeat pass interferometry products, as atmospheric conditions change over time. By contrast, temporal decorrelation is related to the occurrence of vegetation, humidity changes and abundant rainfall or snowfall. It has a significant impact on the quality of interferograms generated from time baseline radar images.
5 Method of InSAR data processing – SBAS algorithmSmall Baseline Subset (SBAS) technique is one of the latest algorithms used to monitoring the development of surface displacements over time. The production of time – series of the line-of-sight (LOS) displacement wasproposed by Berardion [8]. The SBAS – InSAR useinterferograms with a small baseline to minimizetopographic errors and the effects of spatial decorrelation– it is the main advantage of SBAS interferometry. Due
4
E3S Web of Conferences 55, 00006 (2018) https://doi.org/10.1051/e3sconf/20185500006XXIIIrd Autumn School of Geodesy
to the use of distributed scatterers points, which are more commonly identified in the natural environment, this method is used for monitoring displacements in non – urbanized areas. Intermediate and final results (interferograms and time – series displacements maps) are determined by batch processing, in three stages. The advantage of this process is the ability to generate several hundred interferograms based on the large amount of SAR data. All processed and calculations were performed is GMT5SAR.
5.1 Batch pre – processing
The first step before processing includes organize the data. The pre – processing involves both processing without a master image (using default parameters: earth radius, Doppler centroid and near range) and processing with a master image. Command execution sequence is important – the first pre – processing generates the baseline time plot necessary to select the master image to the next step. The best master image covers the area of interest and minimizes perpendicular baselines between interferometric pairs.
5.2 Batch processing
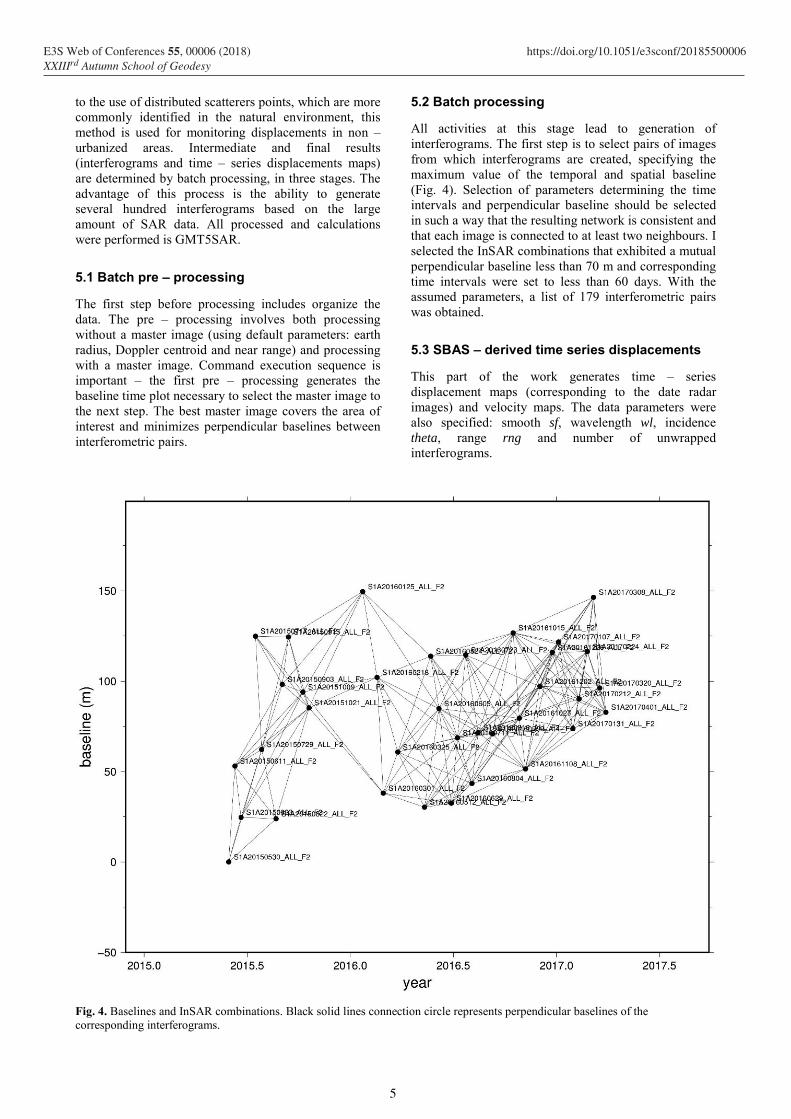
All activities at this stage lead to generation of interferograms. The first step is to select pairs of images from which interferograms are created, specifying the maximum value of the temporal and spatial baseline(Fig. 4). Selection of parameters determining the time intervals and perpendicular baseline should be selected in such a way that the resulting network is consistent and that each image is connected to at least two neighbours. I selected the InSAR combinations that exhibited a mutual perpendicular baseline less than 70 m and corresponding time intervals were set to less than 60 days. With the assumed parameters, a list of 179 interferometric pairs was obtained.
5.3 SBAS – derived time series displacements
This part of the work generates time – series displacement maps (corresponding to the date radar images) and velocity maps. The data parameters were also specified: smooth sf, wavelength wl, incidencetheta, range rng and number of unwrapped interferograms.
Fig. 4. Baselines and InSAR combinations. Black solid lines connection circle represents perpendicular baselines of the corresponding interferograms.
5
E3S Web of Conferences 55, 00006 (2018) https://doi.org/10.1051/e3sconf/20185500006XXIIIrd Autumn School of Geodesy
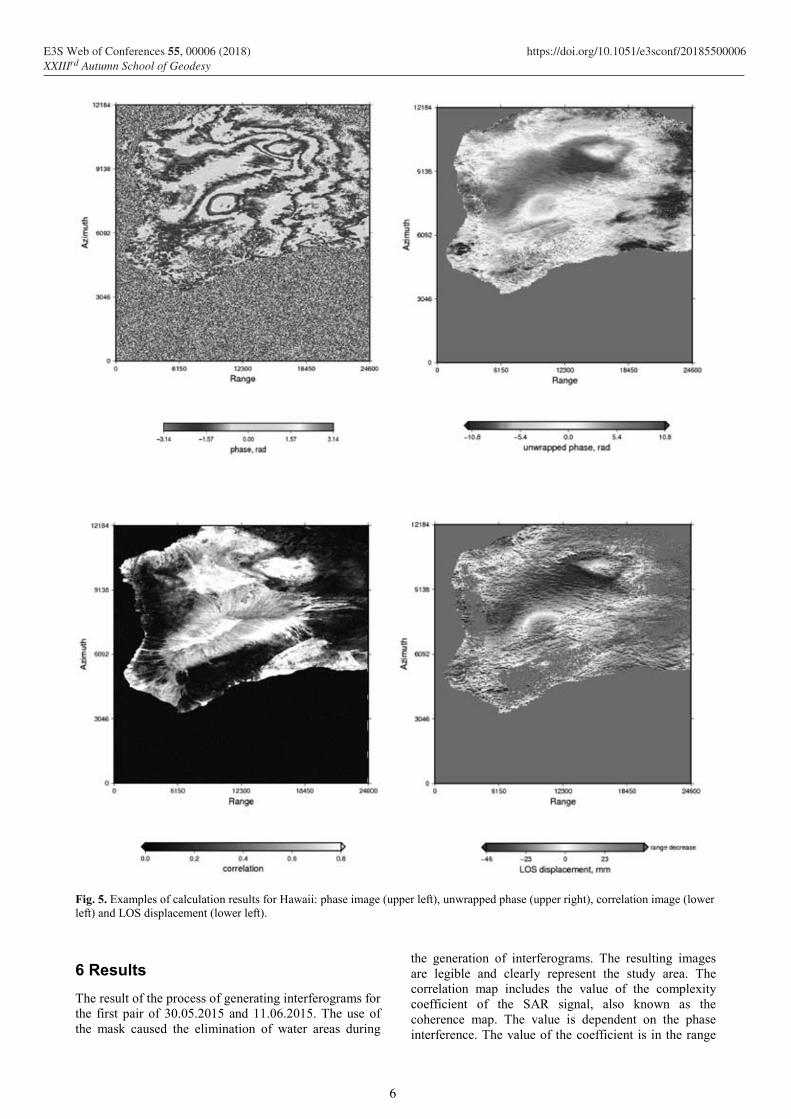
Fig. 5. Examples of calculation results for Hawaii: phase image (upper left), unwrapped phase (upper right), correlation image (lower left) and LOS displacement (lower left).
6 ResultsThe result of the process of generating interferograms for the first pair of 30.05.2015 and 11.06.2015. The use of the mask caused the elimination of water areas during
the generation of interferograms. The resulting images are legible and clearly represent the study area. The correlation map includes the value of the complexity coefficient of the SAR signal, also known as the coherence map. The value is dependent on the phase interference. The value of the coefficient is in the range
6
E3S Web of Conferences 55, 00006 (2018) https://doi.org/10.1051/e3sconf/20185500006XXIIIrd Autumn School of Geodesy
of 0 to 1, where the pixel receiving values close to equal to 0 exhibit the phase error of the two displays, while the value equal to 1 suggests fill compliance. This example result shows both areas with low and high coherence – these are mainly areas covered by vegetation (for example Forest Reserve areas) is low coherence, but the parts of the volcano surface exhibit high coherence. Based on the coherence map, the areas for which interferometric bands can be produced are determined. Within the first 12 days of observation, recorded displacement value is 4.5 cm and is located near the Kilauea volcano. In relation to the Mauna Loa volcano, the highest value of LOS displacements can be observed in the central part of the volcano – around the crater – about 3 cm. On the other hand, the slope of the volcano decreases. In the next step, the displacement maps were generated in time – series designated for the images input files. The results are in geographic coordinates system. Additionally, three points are identified for the analysis of volcano activity (Tab. 2).
Table 2. The coordinates of designated measurement points.
Point Longitude Latitude
P1 -155.7805 19.6161
P2 -155.6494 19.4572
P3 -155.7072 19.2006
Number one was located on the northern slope of the Mauna Loa volcano, the second was located at the western part of the cone, while the third point was on the southern flank of the volcanic edifice, due to the frequency of lava over recent years. As previously mentioned, the Island of Hawaii and volcanoes are observed by the USGS Hawaiian Volcano Observatory. According to published data of 17 September 2017, since mid-2013, seismic activity in the Mauna Loa volcano has increased compared to previous years. Prior to 2013, on average, 15 to 20 quakes were recorded in a week, with low magnitude. However, in 2013 there was a breakthrough. Initially minor changes were observed in the frequency of the occurrence of earthquakes. By the end of 2014, the number of earthquakes rose twice during the week and thrice in 2015 – signalling changes in the earth. Based on a study of the relative distances between the GPS stations on opposite side of Mauna Loa’s summit caldera, a value was changed (over 5 years period). It is often an indication of inflation of the shallow summit magma reservoir.
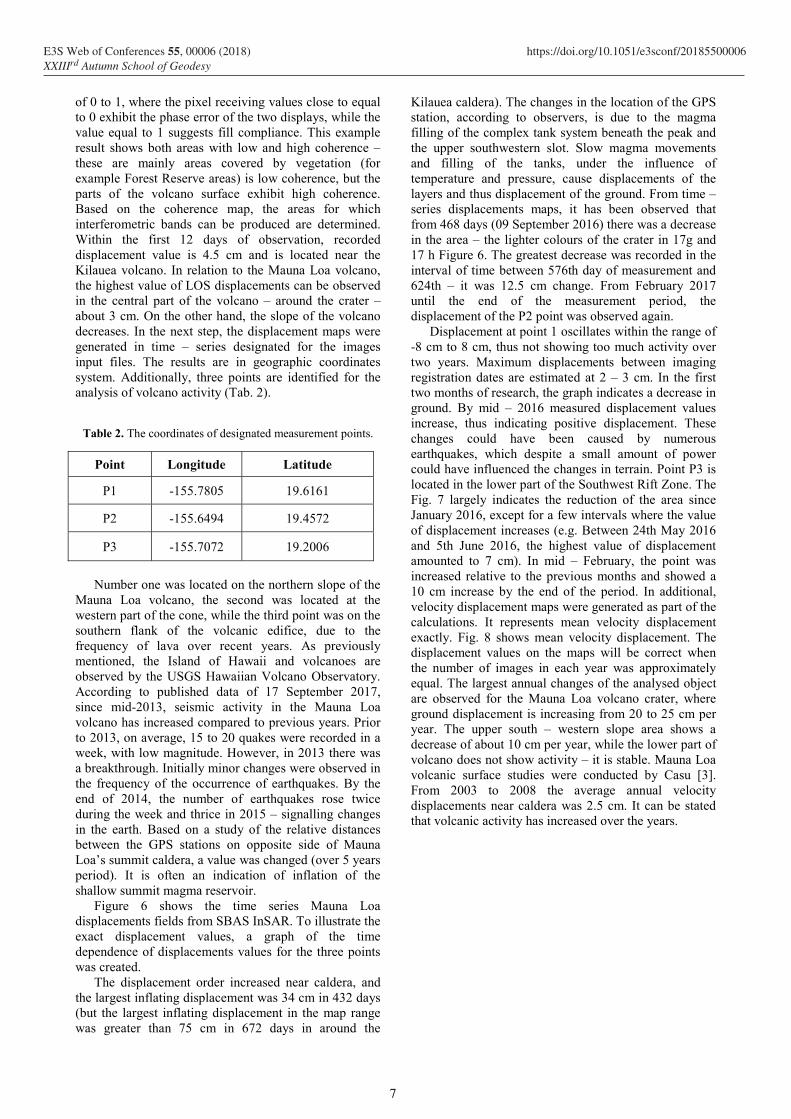
Figure 6 shows the time series Mauna Loa displacements fields from SBAS InSAR. To illustrate the exact displacement values, a graph of the time dependence of displacements values for the three points was created.
The displacement order increased near caldera, and the largest inflating displacement was 34 cm in 432 days (but the largest inflating displacement in the map range was greater than 75 cm in 672 days in around the
Kilauea caldera). The changes in the location of the GPS station, according to observers, is due to the magma filling of the complex tank system beneath the peak and the upper southwestern slot. Slow magma movements and filling of the tanks, under the influence of temperature and pressure, cause displacements of the layers and thus displacement of the ground. From time – series displacements maps, it has been observed that from 468 days (09 September 2016) there was a decrease in the area – the lighter colours of the crater in 17g and 17 h Figure 6. The greatest decrease was recorded in the interval of time between 576th day of measurement and 624th – it was 12.5 cm change. From February 2017 until the end of the measurement period, the displacement of the P2 point was observed again.
Displacement at point 1 oscillates within the range of -8 cm to 8 cm, thus not showing too much activity overtwo years. Maximum displacements between imagingregistration dates are estimated at 2 – 3 cm. In the firsttwo months of research, the graph indicates a decrease inground. By mid – 2016 measured displacement valuesincrease, thus indicating positive displacement. Thesechanges could have been caused by numerousearthquakes, which despite a small amount of powercould have influenced the changes in terrain. Point P3 islocated in the lower part of the Southwest Rift Zone. TheFig. 7 largely indicates the reduction of the area sinceJanuary 2016, except for a few intervals where the valueof displacement increases (e.g. Between 24th May 2016and 5th June 2016, the highest value of displacementamounted to 7 cm). In mid – February, the point wasincreased relative to the previous months and showed a10 cm increase by the end of the period. In additional,velocity displacement maps were generated as part of thecalculations. It represents mean velocity displacementexactly. Fig. 8 shows mean velocity displacement. Thedisplacement values on the maps will be correct whenthe number of images in each year was approximatelyequal. The largest annual changes of the analysed objectare observed for the Mauna Loa volcano crater, whereground displacement is increasing from 20 to 25 cm peryear. The upper south – western slope area shows adecrease of about 10 cm per year, while the lower part ofvolcano does not show activity – it is stable. Mauna Loavolcanic surface studies were conducted by Casu [3].From 2003 to 2008 the average annual velocitydisplacements near caldera was 2.5 cm. It can be statedthat volcanic activity has increased over the years.
7
E3S Web of Conferences 55, 00006 (2018) https://doi.org/10.1051/e3sconf/20185500006XXIIIrd Autumn School of Geodesy
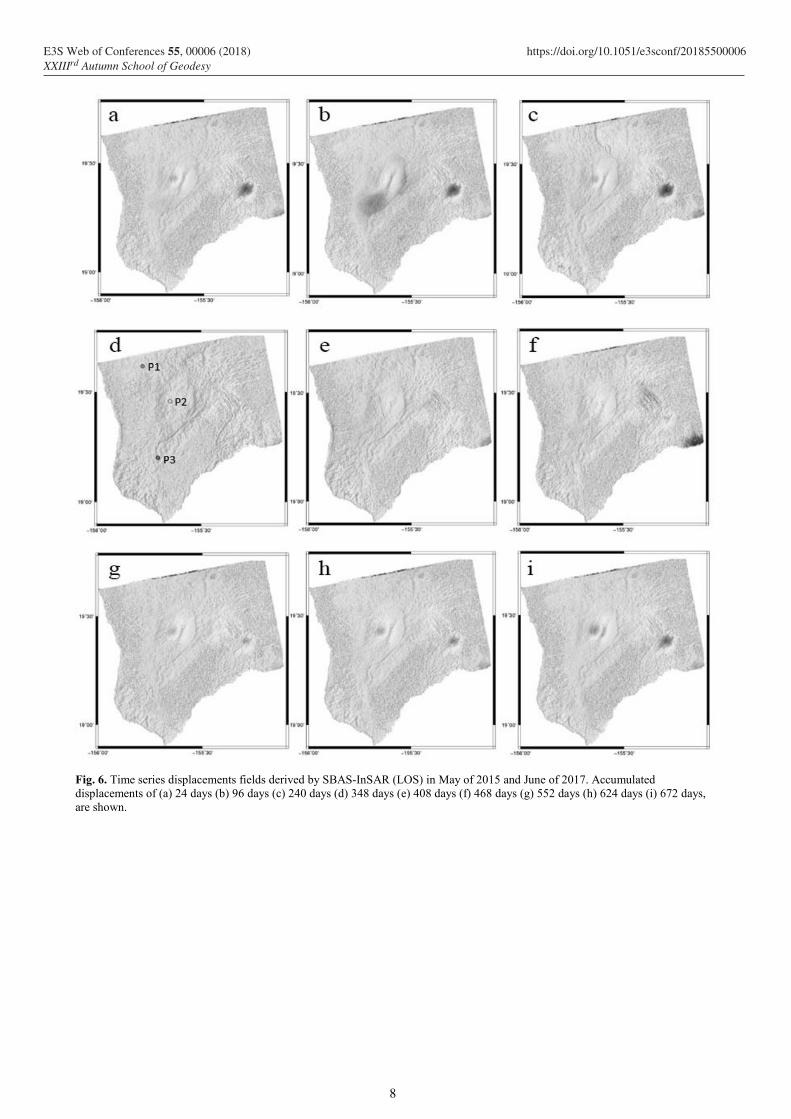
Fig. 6. Time series displacements fields derived by SBAS-InSAR (LOS) in May of 2015 and June of 2017. Accumulated displacements of (a) 24 days (b) 96 days (c) 240 days (d) 348 days (e) 408 days (f) 468 days (g) 552 days (h) 624 days (i) 672 days, are shown.
8
E3S Web of Conferences 55, 00006 (2018) https://doi.org/10.1051/e3sconf/20185500006XXIIIrd Autumn School of Geodesy
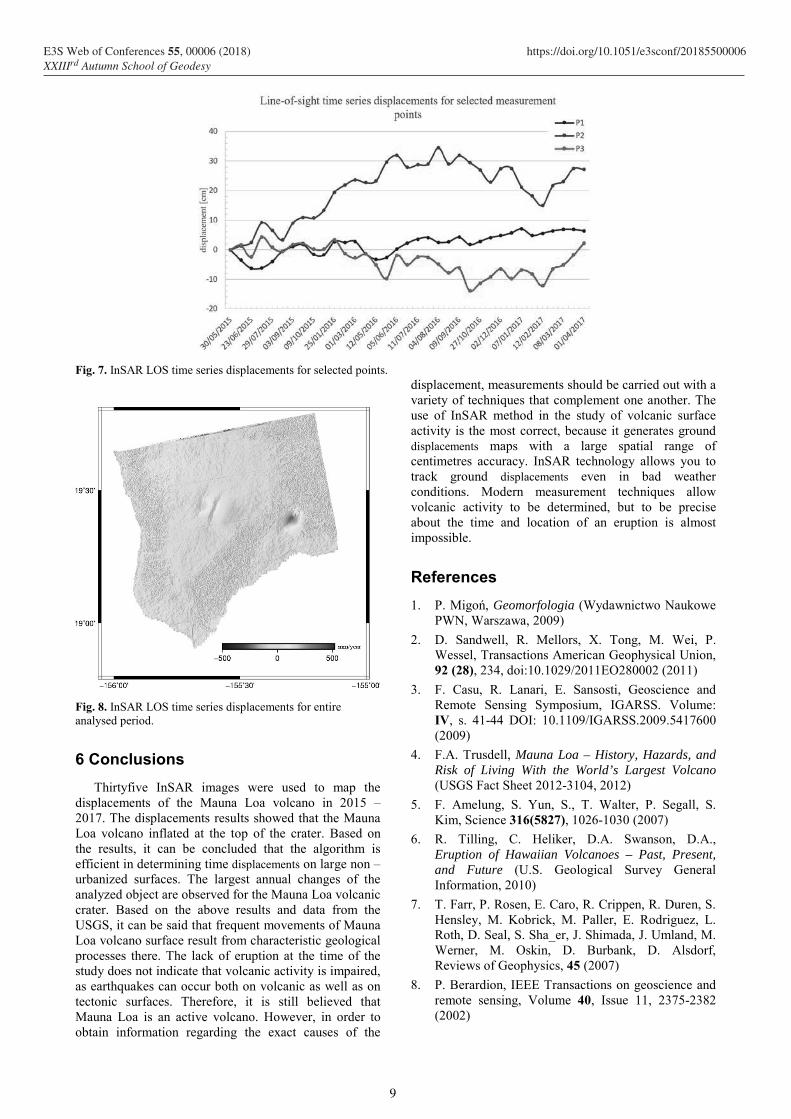
Fig. 7. InSAR LOS time series displacements for selected points.
Fig. 8. InSAR LOS time series displacements for entire analysed period.
6 ConclusionsThirtyfive InSAR images were used to map the
displacements of the Mauna Loa volcano in 2015 – 2017. The displacements results showed that the Mauna Loa volcano inflated at the top of the crater. Based onthe results, it can be concluded that the algorithm is efficient in determining time displacements on large non – urbanized surfaces. The largest annual changes of the analyzed object are observed for the Mauna Loa volcanic crater. Based on the above results and data from the USGS, it can be said that frequent movements of Mauna Loa volcano surface result from characteristic geological processes there. The lack of eruption at the time of the study does not indicate that volcanic activity is impaired, as earthquakes can occur both on volcanic as well as on tectonic surfaces. Therefore, it is still believed that Mauna Loa is an active volcano. However, in order to obtain information regarding the exact causes of the
displacement, measurements should be carried out with a variety of techniques that complement one another. The use of InSAR method in the study of volcanic surface activity is the most correct, because it generates ground displacements maps with a large spatial range of centimetres accuracy. InSAR technology allows you to track ground displacements even in bad weather conditions. Modern measurement techniques allow volcanic activity to be determined, but to be precise about the time and location of an eruption is almost impossible.
References1. Geomorfologia (Wydawnictwo Naukowe
PWN, Warszawa, 2009)2. D. Sandwell, R. Mellors, X. Tong, M. Wei, P.
Wessel, Transactions American Geophysical Union,92 (28), 234, doi:10.1029/2011EO280002 (2011)
3. F. Casu, R. Lanari, E. Sansosti, Geoscience andRemote Sensing Symposium, IGARSS. Volume:IV, s. 41-44 DOI: 10.1109/IGARSS.2009.5417600(2009)
4. F.A. Trusdell, Mauna Loa – History, Hazards, andRisk of Living With the World’s Largest Volcano(USGS Fact Sheet 2012-3104, 2012)
5. F. Amelung, S. Yun, S., T. Walter, P. Segall, S.Kim, Science 316(5827), 1026-1030 (2007)
6. R. Tilling, C. Heliker, D.A. Swanson, D.A.,Eruption of Hawaiian Volcanoes – Past, Present,and Future (U.S. Geological Survey GeneralInformation, 2010)
7. T. Farr, P. Rosen, E. Caro, R. Crippen, R. Duren, S.Hensley, M. Kobrick, M. Paller, E. Rodriguez, L.Roth, D. Seal, S. Sha_er, J. Shimada, J. Umland, M.Werner, M. Oskin, D. Burbank, D. Alsdorf,Reviews of Geophysics, 45 (2007)
8. P. Berardion, IEEE Transactions on geoscience andremote sensing, Volume 40, Issue 11, 2375-2382(2002)
9
E3S Web of Conferences 55, 00006 (2018) https://doi.org/10.1051/e3sconf/20185500006XXIIIrd Autumn School of Geodesy


![[PPT]Mauna Loa - mrs. BOHAYCHUK's information stationmrsbohaychuk.weebly.com/.../mauna_loa_ashlea_olga.ppt · Web viewThe largest volcano on the island of hawaii! Mauna loa’s summit](https://img.pdfslide.us/doc/110x75/5b032cd17f8b9a89208bc914/pptmauna-loa-mrs-bohaychuks-information-viewthe-largest-volcano-on-the-island.jpg)