Embed Size (px)
Citation preview

Business growth through customer insight
Bob E Hayes, PhD [email protected]
www.businessoverbroadway.com
www.businessoverbroadway.com/blog
206.372.5990
www.twitter.com/bobehayes
Linkage Analysis in your Voice of the Customer Program Understanding the causes and consequences of customer loyalty
This paper discusses three types of linkage analyses in VoC programs: 1) Financial, 2) Operational and 3) Constituency. Linkage analysis is primarily an exercise in data management. Linkage analysis is illustrated using data models and real-life examples for each type of linkage analysis.

Linkage Analysis in your Voice of the Customer Program
Copyright 2011 Business Over Broadway · www.businessoverbroadway.com · [email protected] 2
Customer feedback provides useful information about the health of the customer relationship. Relationship and
transactional surveys, commonly used to capture customer feedback, are used to assess and improve that health.
While customer feedback metrics provide great value in and of themselves, when used with other types of business
data, they can address meaningful business questions:
Are the customer feedback metrics predictive of future financial performance and business growth?
Do customers who report higher loyalty spend more than customers who report lower levels of loyalty?
Where do we set operational goals to ensure we maximize customer satisfaction?
Does employee training help improve the customer experience?
To answer these questions, companies look to a process called business linkage analysis.
Business Linkage Analysis is the process of combining different sources of data (e.g., customer, employee, partner,
financial, and operational) to uncover important relationships among important variables (e.g., call handle time and
customer satisfaction). For our context, linkage analysis will refer to the linking of other data sources to customer
feedback metrics (e.g., customer satisfaction,
customer loyalty).
Business Case for Linkage Analyses
Based on a recent study on customer feedback
programs best practices (Hayes, 2009), I found that
companies who regularly conduct operational
linkages analyses with their customer feedback data
had higher customer loyalty (72nd percentile)
compared to companies who do not conduct linkage
analyses (50th percentile). Furthermore, customer
feedback executives were substantially more
satisfied with their customer feedback program in
helping them manage customer relationships when
linkage analyses (e.g., operational, financial,
constituency) were a part of the program (~90%
satisfied) compared to their peers in companies who
did not use linkage analyses (~55% satisfied) (see
Figure 1).
Linkage analysis appears to have a positive impact on customer loyalty by providing executives the insights they need
to manage customer relationships. These insights give loyalty leaders an advantage over loyalty laggards. Loyalty
leaders apply linkage analyses results in a variety of ways to build a more customer-centric company: Determine the
ROI of different improvement effort, create customer-centric operational metrics (important to customers) and set
employee training standards to ensure customer loyalty, to name a few.
Linkage Analysis: A Data Management and Analysis Problem
The term "linkage analysis" is actually a misnomer. Linkage analysis is not really a type of analysis; it is used to denote
that two different data sources have been "linked" together. In fact, several types of analyses can be employed after
two data sources have been linked together. Rather, you can think of linkage analysis as a two-step process: 1)
Figure 1. Companies who adopt linkage analysis get the insight that drives customer loyalty

Linkage Analysis in your Voice of the Customer Program
Copyright 2011 Business Over Broadway · www.businessoverbroadway.com · [email protected] 3
organizing two disparate data sources into one coherent dataset and 2) conducting analyses on that aggregated
dataset. The primary hurdle in any linkage analysis is organizing the data in an appropriate way where the resulting
linked dataset make logical sense for our analyses (appropriate unit of analysis). Therefore, knowledge in data
management and research methodology are essential in conducting a linkage analysis study.
Once the data are organized, the researcher is able to conduct nearly any kind of statistical analyses he/she want
(e.g., Regression, ANOVA, Multivariate), as long as it makes sense given the types of measurement scales (e.g.,
nominal, interval) you are using.
Types of Linkage Analyses
In business, linkage analyses can be
conducted using the following types of
data (see Figure 2):
1. Customer Feedback 2. Financial 3. Operational 4. Employee 5. Partner
Even though I discuss these data sources
as if they are distinct, separate sources of
data, it is important to note that some
companies have some of these data sources housed in one dataset (e.g., call center system can house transaction
details including operational metrics and customer satisfaction with that transaction). While this is an advantage,
these companies still need to ensure
their data are organized together in an
appropriate way.
With these data sources, we can conduct
three general types of linkage analyses:
1. Financial: linking customer
feedback to financial metrics
2. Operational: linking customer
feedback to operational metrics
3. Constituency: linking customer
feedback to employee and
partner variables
Before we go further, I need to make an
important distinction between two
different types of customer feedback
sources: 1) relationship-based and 2)
transaction-based. In relationship-based feedback, customer ratings (data) reflect their overall experience with and
Figure 2. Linking Disparate Business Data Sources Leads to Insight
Figure 3. Common Types of Linkages among Disparate Data Source

Linkage Analysis in your Voice of the Customer Program
Copyright 2011 Business Over Broadway · www.businessoverbroadway.com · [email protected] 4
loyalty towards the company. In transaction-based feedback, customer ratings (data) reflect their experience with a
specific event or transaction. This distinction is necessary because different types of linkage analyses require
different types of customer feedback data (See Figure 3). Relationship-based customer feedback is needed to
conduct financial linkage analyses and transaction-based customer feedback is needed to conduct operational
linkage analyses.
Next, I will talk about each of the three types of linkage analyses; for each type, I will present a data model to help
illustrate how the disparate datasets can be merged together. Additionally, I will present examples of different types
of linkage studies I have conducted.
Financial and VoC Linkage
Business linkage analysis is the process of linking disparate business data sources together for the purposes of
understanding the relationships between them. For financial linkage analysis, we are interested in understanding the
relationship between customer feedback metrics and financial business outcomes. Demonstrating the statistical
relationship between customer feedback metrics and financial business outcomes is useful for three reasons:
1. Strengthen business case for your VOC program: Demonstrating your customer feedback metrics predict
future bottom line metrics shows executives that tracking/measuring customer satisfaction/loyalty is
important. Senior executives' support of the VOC program is paramount to its success, and a customer-
financial linkage can quickly illustrate the reasons why you have a customer feedback program and the
important business outcomes it predicts.
2. Identify drivers of real customer behaviors: In typical VoC programs, we measure customer loyalty via
survey questions that let customers indicate their future loyalty behaviors (recommend, buy again, not
churn). Using linkage analysis, we can use real customer loyalty behaviors in our analysis. Taking this
approach, we can understand drivers of real customer behaviors (number of products purchased, sales
amount).
3. Determine ROI for customer experience improvement solutions: Improving customer loyalty may require
significant investment to improve the customer experience. Financial linkage analysis can help you
understand the expected increases in financial performance given a specific improvement in customer
satisfaction.
Financial and Customer Feedback Metrics
I use the term, "financial metrics," to include various types of business outcomes that can be used in linkage analyses.
These metrics include:
Customer tenure Customer defection rate Number of new customers Revenue Service contract renewal Number of sales transactions Number of products purchased Frequency of purchases
Linkage Analysis in your Voice of the Customer Program
Copyright 2011 Business Over Broadway · www.businessoverbroadway.com · [email protected] 5
It is important to note that the specific details of conducting linkage analyses may vary slightly for different metrics;
the level at which the financial metric can be summarized (by geography, by time, by customer) reflects the level at
which the datasets need to be merged. If you are able to track revenue for each customer, you can associate the
customer feedback metric with each customer's revenue. On the other hand, if you are able to track defection rate at
the group level, you can associate the customer feedback metric with each group's defection rate. The key here is to
ensure the level of analysis (e.g., customer, geography, time-level) makes sense given the level of measurement of
your financial metric.
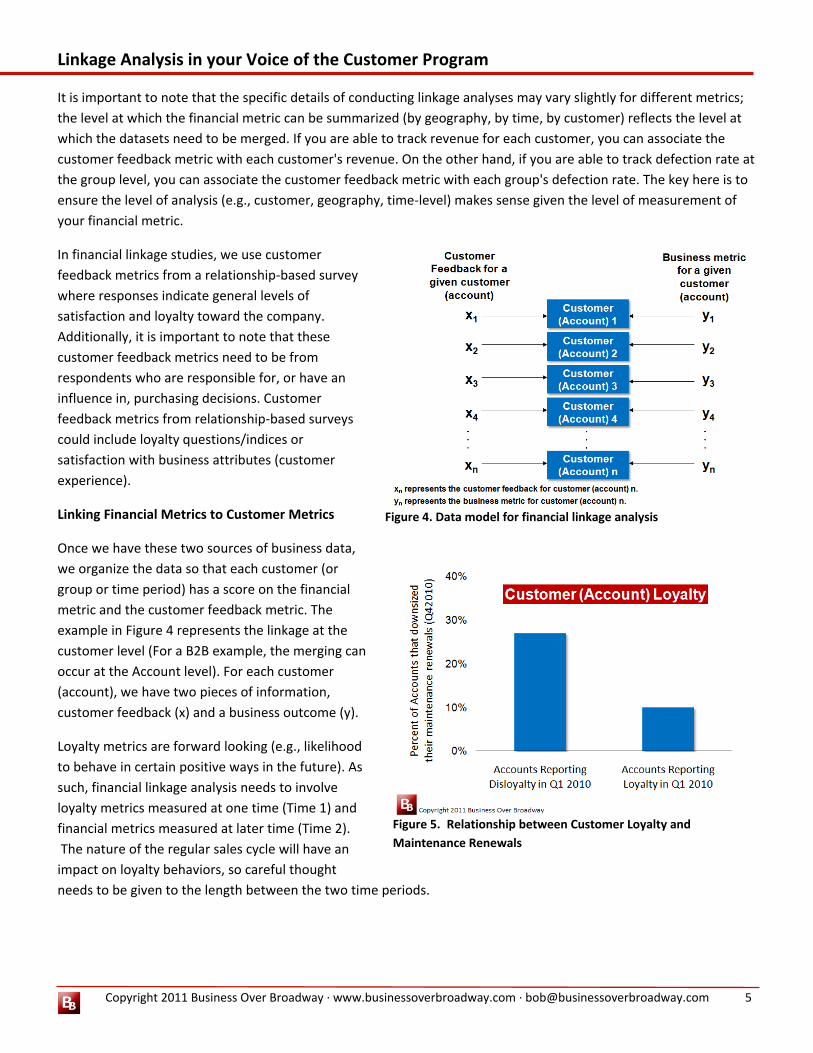
In financial linkage studies, we use customer
feedback metrics from a relationship-based survey
where responses indicate general levels of
satisfaction and loyalty toward the company.
Additionally, it is important to note that these
customer feedback metrics need to be from
respondents who are responsible for, or have an
influence in, purchasing decisions. Customer
feedback metrics from relationship-based surveys
could include loyalty questions/indices or
satisfaction with business attributes (customer
experience).
Linking Financial Metrics to Customer Metrics
Once we have these two sources of business data,
we organize the data so that each customer (or
group or time period) has a score on the financial
metric and the customer feedback metric. The
example in Figure 4 represents the linkage at the
customer level (For a B2B example, the merging can
occur at the Account level). For each customer
(account), we have two pieces of information,
customer feedback (x) and a business outcome (y).
Loyalty metrics are forward looking (e.g., likelihood
to behave in certain positive ways in the future). As
such, financial linkage analysis needs to involve
loyalty metrics measured at one time (Time 1) and
financial metrics measured at later time (Time 2).
The nature of the regular sales cycle will have an
impact on loyalty behaviors, so careful thought
needs to be given to the length between the two time periods.
Figure 4. Data model for financial linkage analysis
Figure 5. Relationship between Customer Loyalty and
Maintenance Renewals

Linkage Analysis in your Voice of the Customer Program
Copyright 2011 Business Over Broadway · www.businessoverbroadway.com · [email protected] 6
Results
The output of the analyses will illustrate
the relationship between customer
satisfaction/loyalty and business
outcomes. When presenting the results of
the analysis, I like to illustrate the
relationship in graphical form. Below are
two figures that show the relationship
between customer satisfaction/loyalty
metrics and important business
outcomes.
Figure 5 illustrates the relationship
between customer loyalty and future
maintenance renewals. We found that
accounts who reported they were disloyal in Q1 2010 are more likely to result in downsizes in maintenance renewals
for Q4 2010 compared to accounts who reported they were loyal in Q1 2010.
Figure 6 illustrates the relationship between customer satisfaction with technical account managers (TAMs) and
revenue. Accounts that are more satisfied with Technical Account Management (TAM) performance in Q1 2010 have
significantly higher revenue from maintenance renewals in Q4 2010 compared to account that are dissatisfied with
TAM performance in Q1 2010.
Using the results of these analyses, senior executives were able to estimate the increased revenue they would expect
(additional revenue and saved revenue) given improvements in customer satisfaction.
Operational and VoC Linkage
For operational linkage analysis, we are interested in understanding the relationship between customer feedback
metrics and operational metrics. Demonstrating the statistical relationship between customer feedback metrics and
operational metrics is useful for three reasons:
1. Build/Identify customer-centric business metrics: Operational linkage analysis helps you identify/create key
operational metrics that are statistically linked to customer satisfaction.
2. Manage customer relationships using objective operational metrics: Driving business growth now becomes
a process of using the operational metrics to manage customer relationships. Linkage analysis will help in
setting appropriate operational performance goals (using operational metrics) that ensure customers will be
satisfied.
3. Reward employee behavior that will drive customer satisfaction: Because of their reliability and specificity,
operational metrics are good candidates for use in goal setting and employee incentive programs. Rewarding
employee performance based on customer-centric operational metrics ensures employees are aligned with
the needs of the customers.
Figure 6. Relationship between Satisfaction with Technical Account Manager
(TAM) and Revenue

Linkage Analysis in your Voice of the Customer Program
Copyright 2011 Business Over Broadway · www.businessoverbroadway.com · [email protected] 7
Operational and Customer Feedback Metrics
There are many types of operational metrics
that are commonly tracked in support and call
centers. These metrics include:
First Call Resolution (FCR) Number of calls until resolution Call handling time Response time Abandon rate Adherence & Shrinkage Average talk time Average speed of answer (ASA)
In operational linkage studies, we use
customer feedback metrics from a transaction-
based survey where responses are associated
with a specific transaction (typically, in a call-center environment) and reflect satisfaction with a that specific
transaction (or satisfaction with other components of the transaction - knowledge of call center rep). So, for any
given transaction, we have two kinds of information, 1) the operational metrics surrounding that transaction and 2)
customer's satisfaction with that transaction.
Linking Operational Metrics to Customer
Metrics
Once we have these two sources of business
data, we organize the data so that each
transaction (or group or time period) has a score
on the operational metric and the customer
feedback metric. The example in Figure 7
represents the linkage at the transaction level.
For each transaction (interaction), we have two
pieces of information, operational metric (x) and
customer feedback (y).
Results
The output of the analyses will illustrate the relationship between operational metrics and customer satisfaction.
When presenting the results of the analysis, I like to illustrate the relationship in graphical form. Below are two
figures that show the relationship operational metrics and customer satisfaction.
Figure 8 illustrates the relationship between number of calls to resolve the service request (SR) and customer
satisfaction with that SR. We found that SRs that required more calls from the customer resulted in lower levels of
satisfaction with SRs compared to SRs that required fewer calls from the customer. Specifically, customers were
satisfied until they had to call four times. As a result, senior executives were able to implement a performance
standard for SR resolutions (Resolve SRs within 3 telephone calls).
Figure 7. Data Model for Operational Linkage Analysis
Figure 8. Number of calls to resolve Service Request (SR) is related to
customer satisfaction with that SR

Linkage Analysis in your Voice of the Customer Program
Copyright 2011 Business Over Broadway · www.businessoverbroadway.com · [email protected] 8
Figure 9 illustrates the relationship of
two operational metrics (initial
response time and total time to
resolve SR) with customer satisfaction
with SRs. A client wanted to identify
which operational metric was more
important to customers (e.g.,
predicted customer satisfaction
better). As you can see in the figure,
initial response time had no impact on
customer satisfaction; customers were
just as satisfied with SRs that had a
long initial response time as they were
with SRs that had a shorter initial
response time. On the other hand,
total time to resolve the SR had a large impact on customer satisfaction with the SR. Customers were significantly
more satisfied with SRs that were resolved within one week compared to SRs that took longer to resolve. From these
results, it appears that only one of these metrics were important to customers (Total time to resolve SR).
Using the results of these analyses, senior executives were able to identify the call center operational metrics that
impact customer satisfaction. As a result, senior executives wanted to understand how other operational metrics
impacted customer satisfaction with the SR process in order to build a performance dashboard where only the
important, customer-centric, operational metrics are displayed and tracked.
Constituency and VoC Linkage
Constituency linkage analysis allows us to better understand how employees and partner relationships impact the
health of the customer relationships. The service delivery model depicted in Figure 10 (I added a partner variable and
expanded customer loyalty) supports the idea that employee and partner management is key to ensuring customer
loyalty and business growth. As this model illustrates, business growth is dependent on customer loyalty (and
perceived customer value and satisfaction), which is, in turn impacted by employee satisfaction/loyalty and partner
satisfaction/loyalty. In fact, empirical studies to support this model employ linkage analysis as a way of identifying
and quantifying the linkages among the constituencies.
Demonstrating the statistical relationship between customer feedback metrics and constituency metrics is useful for
three related reasons:
1. Understand the impact of employee and partner experience on the customer experience: Constituency
linkage analysis helps you identify which employee/partner metrics are statistically linked to customer
satisfaction.
Figure 9. Linkage analysis used to identify which operational metrics are
important to customers

Linkage Analysis in your Voice of the Customer Program
Copyright 2011 Business Over Broadway · www.businessoverbroadway.com · [email protected] 9
2. Improve the health of the
customer relationship by
improving the health of
the employee and partner
relationship. Managing
customer relationships
does not occur in a
vacuum. Understanding
how these other
constituencies impact
customer satisfaction and
loyalty helps senior
executives allocate the
right resources across the
entire ecosystem to drive
business growth. For a
company to grow, they
need to manage all
different types of
relationships (employee, partner, customer); a problem in one could impact the rest.
3. Help build a customer centric culture. Constituency linkage results can help executives communicate the
importance of the entire ecosystem in driving customer satisfaction and loyalty. Evangelizing how important
the employees and partners are in helping ensure customers receive a great customer experience can be
supported with these linkage studies.
Constituency and Customer Feedback Metrics
There are many types of constituency metrics
that are commonly measured. Any metric
tracked by human resources (HR) are candidates
for employee metrics that we can use in linkage
analysis. Additionally, many partner metrics (e.g.,
certification status, revenue) are candidates for
partner metrics. Some example metrics used in
constituency linkage analysis include:
Satisfaction metrics (employee sat and partner sat)
Loyalty metrics (employee loyalty and partner loyalty)
Employee training metrics Partner certification status
In constituency linkage studies, we can use
customer feedback metrics from either a relationship-based or a transaction-based survey, as long as customer
Figure 10. Service Delivery Model Highlights the Impact of Employees and Partners
on Customer Loyalty and Business Growth
Figure 10. Data Model for Constituency - Customer Linkage

Linkage Analysis in your Voice of the Customer Program
Copyright 2011 Business Over Broadway · www.businessoverbroadway.com · [email protected] 10
metrics can be aggregated at the appropriate unit of analysis (typically at the employee or partner level). So, for any
given constituency, we can have two kinds of information, 1) their employee/partner metric (sat, loyalty, objective)
and 2) customer's satisfaction/loyalty metric.
Linking Constituency Metrics to Customer Metrics
Once we have these two sources of business data, we organize the data at the employee/partner level (each
employee has a score on the constituency metric and a customer feedback metric. Linking an employee metric to a
given employee is straightforward. There is a 1 to 1 ratio of employee to employee metric (Employee 1 has Employee
1 Metric; Employee 2 has Employee 2 Metric).
Considering the customer feedback metric, a
given employee could have more than one
customer response associated to him/her. There
is a 1 to many ratio of employees to customer
feedback responses. The customer metric for
each employee, then, would be the average of
the customer responses for that employee. In
large B2B enterprise companies, a specific
employee (Account Managers, Technical
Account Managers, Consulting Services) can be
assigned to specific Accounts. Therefore, each
Account Manager could have multiple customer
feedback responses associated to him/her; the
customer metric for this employee would be the
average rating across all his/her responses. In a
B2C environment, call center agents can be linked to several, specific customer interactions; each employee's
customer metric would be the average rating across all his/her interactions.
The bottom line is that employees/partners can have feedback from multiple customers. If you are able, obtaining all
relevant customer data points for each employee/partner results in more reliable measures of customers' attitudes.
So, if an employee had customer satisfaction ratings from 10 customers, his customer metric would be the average of
those 10 customers. The data model in Figure 3 represents the linkage at the employee level. For each employee, we
have two pieces of information, constituency metric (x) and customer feedback (y - average over the different
customers the employee served).
Results
The output of the analyses will illustrate the relationship between the constituency metrics and the customer metric.
When presenting the results of the analysis, I like to illustrate the relationship in graphical form the segment the
constituency metric into homogeneous segments (e.g., low employee satisfaction / high employee satisfaction) and
compare the customer metric across each employee group. Below are three figures that show the relationship
constituency metrics and customer metrics.
In an enterprise software company, the Technical Account Managers (TAMs) are responsible for implementing the
software into the company's infrastructure. Figure 11 illustrates the results of a linkage study that examined the how
Figure 11. Employee who are satisfied deliver a better customer
experience

Linkage Analysis in your Voice of the Customer Program
Copyright 2011 Business Over Broadway · www.businessoverbroadway.com · [email protected] 11
Technical Account Managers' attitudes toward the company impacts customers' satisfaction with the
implementation. We found that TAMs that were highly satisfied with their company also had customers who were
more satisfied with their implementation. It appears that, to ensure customers are satisfied with their
implementation, the company needs to
ensure their TAMs are satisfied.
Figure 12 illustrates the impact of training on
customer satisfaction. Employing a linkage
study, this company was able to link training
metrics and customer satisfaction metrics for
specific TAMs. The company was spending
much money on employee training and
wanted to determine its effectiveness on
improving customer satisfaction. As you can
see in Figure 5, TAMs who completed 4 or
more courses for a given quarter had
customers who were more satisfied with their
performance than TAMs who completed 1-3
courses.
In the same enterprise software company, business partners (system integrators) were used to help integrate the
software into joint customers' accounts. To understand how partner relationships impact joint customer
relationships, the company wanted to examines the linkage between partner and customer metrics. Because a given
Account had only one system integrator, we could easily link partner metrics and customer metrics via partners
(system integrators). Figure 13 illustrates this relationship. The company found that customers were much more
satisfied with the implementation when
the system integrator report high loyalty
to the company.
The results of these analyses helped senior
executives evangelize the importance of
employees and partners in delivering great
customer service. The senior executives
were able to determine the value of
employee training on customer
satisfaction and set appropriate training
goals that ensured customers were
satisfied with the implementation of their
solution. The partner-customer linkage
study supported the need for a formal
partner relationship program. The
company implemented a more formal
partner program in which partner survey
results were used to improve partner
satisfaction.
Figure 12. Employee training has a positive impact on customer
satisfaction
Figure 13. System integrators (partners) who are loyal to the company have
customers who are satisfied with the implementation.

Linkage Analysis in your Voice of the Customer Program
Copyright 2011 Business Over Broadway · www.businessoverbroadway.com · [email protected] 12
Summary
Linkage analysis is the process of combining/managing disparate data sources to understand the relationship among
the variables across different data sets. The application of linkage analysis in VoC programs unlocks much value from
customer feedback metrics, by helping you understand the causes and consequences of customer satisfaction and
loyalty.
Financial linkage analysis helps show the consequences of customer satisfaction and loyalty and demonstrate the
value of the VOC metrics. In my examples, the linkage analyses showed us that customer feedback metrics (customer
satisfaction with tech support and satisfaction with technical account managers) were, in fact, predictive of future
business metrics (maintenance renewals and revenue, respectively).
Operational linkage analysis helps show the causes of customer satisfaction. In my examples, the linkage analyses
showed us that not all operational metrics are created equal. Companies turn to operational linkage analysis to
identify those objective, measurable aspects of the transaction that drive customer satisfaction. Once identified,
operational metrics can be used to manage customer relationships by incentivizing employees on operational metrics
that matter to the customer.
Constituency linkage analysis helps show how customer loyalty is a function of the entire ecosystem; successfully
managing customer relationships includes effective employee relationship management and partner relationship
management. In the examples, the linkage analyses showed us that employee and partner metrics are leading
indicators of customer satisfaction and loyalty.
-------
Linkage Analysis in your Voice of the Customer Program
Copyright 2011 Business Over Broadway · www.businessoverbroadway.com · [email protected] 13
Biography
I am Business over Broadway (B.O.B.). My professional life is dedicated to
sharing my knowledge of customer feedback programs (VOC, customer
experience/loyalty programs) and the scientific method to anybody who
wants to listen and learn. I conduct research on customer feedback
programs, customer experience / satisfaction / loyalty measurement and
have published books on these topics (Beyond the Ultimate Question and
Measuring Customer Satisfaction and Loyalty). I provide consultation
services to companies to help them improve the customer experience,
maximize customer loyalty and accelerate business growth.
I have over 20 years of consulting and research experience in enterprise and midsize companies, including Oracle,
Agilent Technologies, Sophos, Virtual Instruments, Netsmart Technologies and Genstar Capital. I have managed
customer satisfaction research as an employee to Fortune 500 firms, and as an independent consultant. I have
published numerous articles in both scientific and trade journals and presented research at national and
international conferences on the measurement of customer satisfaction, employee empowerment, and employee
perceptions of workplace safety.
When I am not staring at a monitor, I spend my time exercising, cooking, creating, taking pictures, visiting friends and
family and catching an occasional show at a local club.