Embed Size (px)
Citation preview
Level 3 Data and Meeting Booklet9th February 2017
2
Level 3 Meeting Programme Mary Ward House, 5-7 Tavistock Place, London
Time Topic Speaker / Chair 1000-1030 Arrival and Coffee 1030-1040 Welcome
Making the most of our opportunities to save lives
Ms Sally Johnson
1040-1100 Objectives Dr Dale Gardiner
1100-1215 Best Practice Sharing Session (selected hospitals sharing their best practice)
Dr Dale Gardiner
3 Breakout sessions (rotation through all three groups) • Applying PDSA methods to Referral & SNOD Involvement (James Van Der
Walt/Gordon Turpie)
• CLOD Review Recommendations (Dale Gardiner)
• Promoting Organ Donation (Caroline Rodaway)1215-1300 Break Out Session 1 1300-1345 Lunch 1345-1410 Improving Organ Utilisation – the role of the
donation community Dr Paul Murphy
1410-1455 Break Out Session 2 1455-1510 Coffee 1510-1555 Break Out Session 3 1555-1600 Summary and Close Dr Dale Gardiner
Speakers
Ms Sally Johnson – Director of Organ Donation and Transplantation
Dr Paul Murphy – National Clinical Lead for Organ Donation
Dr Dale Gardiner – Deputy National Clinical Lead for Organ Donation
Mr James Van Der Walt – Professional Development Specialist, ODT
Mr Gordon Turpie – Professional Development Specialist, ODT
Ms Caroline Rodaway – Senior Marketing & Campaigns Officer, NHSBT
3
3
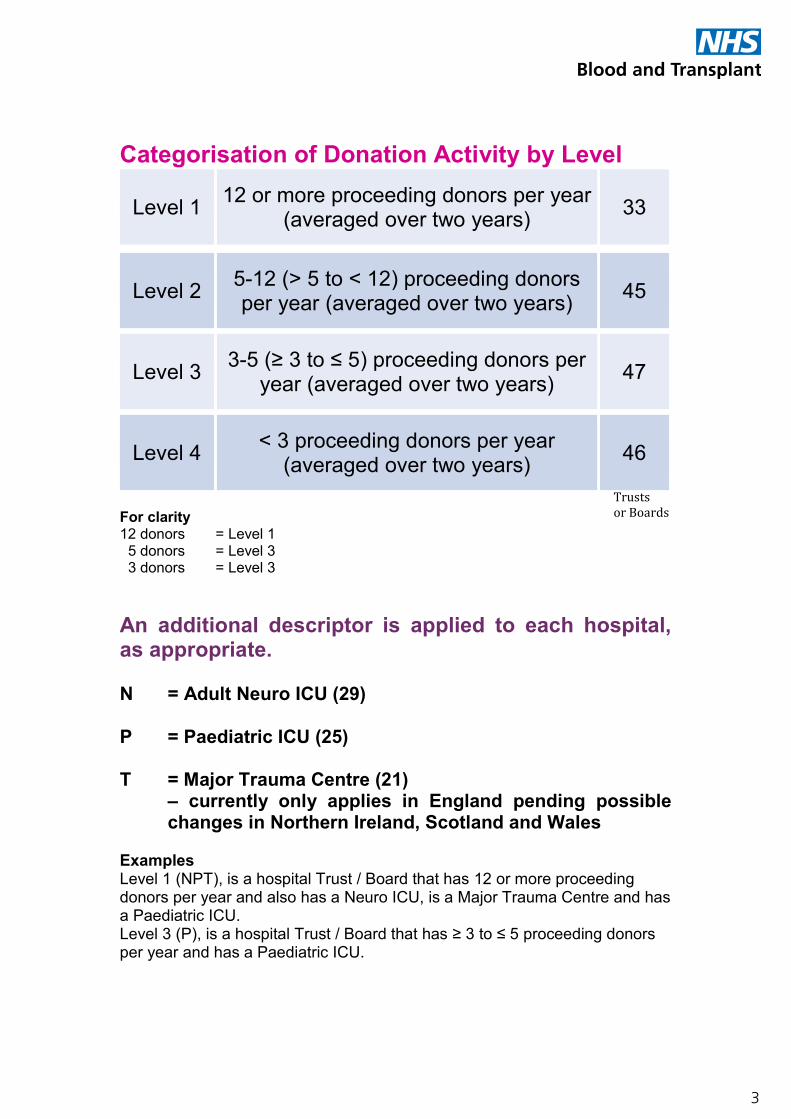
Categorisation of Donation Activity by Level
Level 1 12 or more proceeding donors per year (averaged over two years) 33
Level 2 5-12 (> 5 to < 12) proceeding donors per year (averaged over two years) 45
Level 3 3-5 (≥ 3 to ≤ 5) proceeding donors per year (averaged over two years) 47
Level 4 < 3 proceeding donors per year (averaged over two years) 46
For clarity 12 donors = Level 1 5 donors = Level 3 3 donors = Level 3 An additional descriptor is applied to each hospital, as appropriate. N = Adult Neuro ICU (29) P = Paediatric ICU (25) T = Major Trauma Centre (21)
– currently only applies in England pending possible changes in Northern Ireland, Scotland and Wales
Examples Level 1 (NPT), is a hospital Trust / Board that has 12 or more proceeding donors per year and also has a Neuro ICU, is a Major Trauma Centre and has a Paediatric ICU. Level 3 (P), is a hospital Trust / Board that has ≥ 3 to ≤ 5 proceeding donors per year and has a Paediatric ICU.
Trusts or Boards
4
UK Donation by Level
4!
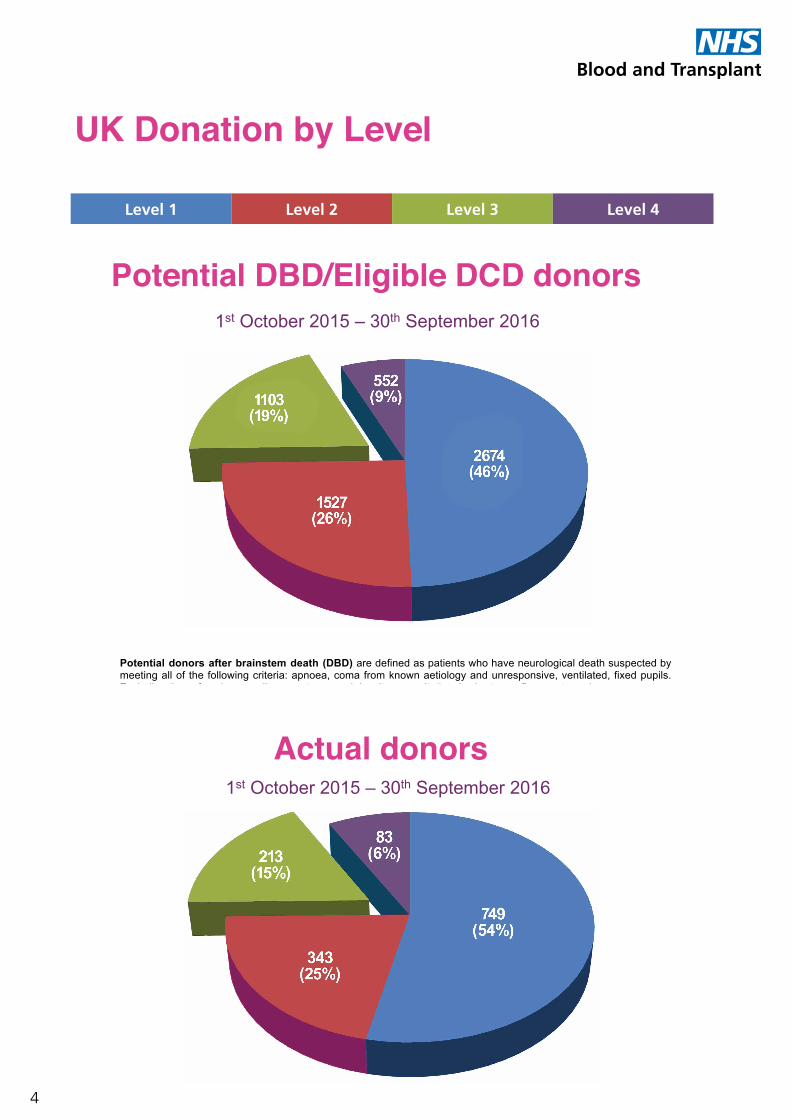
UK Donation by Level
Level 1 Level 2 Level 3 Level 4
Potential DBD/Eligible DCD donors
Potential donors after brainstem death (DBD) are defined as patients who have neurological death suspected by meeting all of the following criteria: apnoea, coma from known aetiology and unresponsive, ventilated, fixed pupils. Excluding those for whom cardiac arrest occurred despite resuscitation, brain stem reflexes returned. Eligible donors after circulatory death (DCD) are defined as patients who had treatment withdrawn and death was anticipated within four hours, with no absolute medical contraindications to solid organ donation.
Actual Donors
1st October 2015 – 30th September 2016 !
1st October 2015 – 30th September 2016 !
Level 1Level 2Level 3Level 4
Level 1
Level 2
Level 3
Level 4
2674(46%)
1527(26%)
1103(19%)
552(9%)
749(54%)
343(25%)
213(15%)
83(6%)
(19%)
(6%)
(25%)
(49%) 1348(49%)
685(25%)
518(19%)
173(6%)
Potential DBD/Eligible DCD donors1st October 2015 – 30th September 2016
(17%)
(6%)
(21%)
(53%)
689(53%)275
(21%)
223(17%)
103(8%)
Actual donors1st October 2015 – 30th September 2016
Level 1 Level 2 Level 3 Level 4
Potential DBD/Eligible DCD donors
Actual donors
5
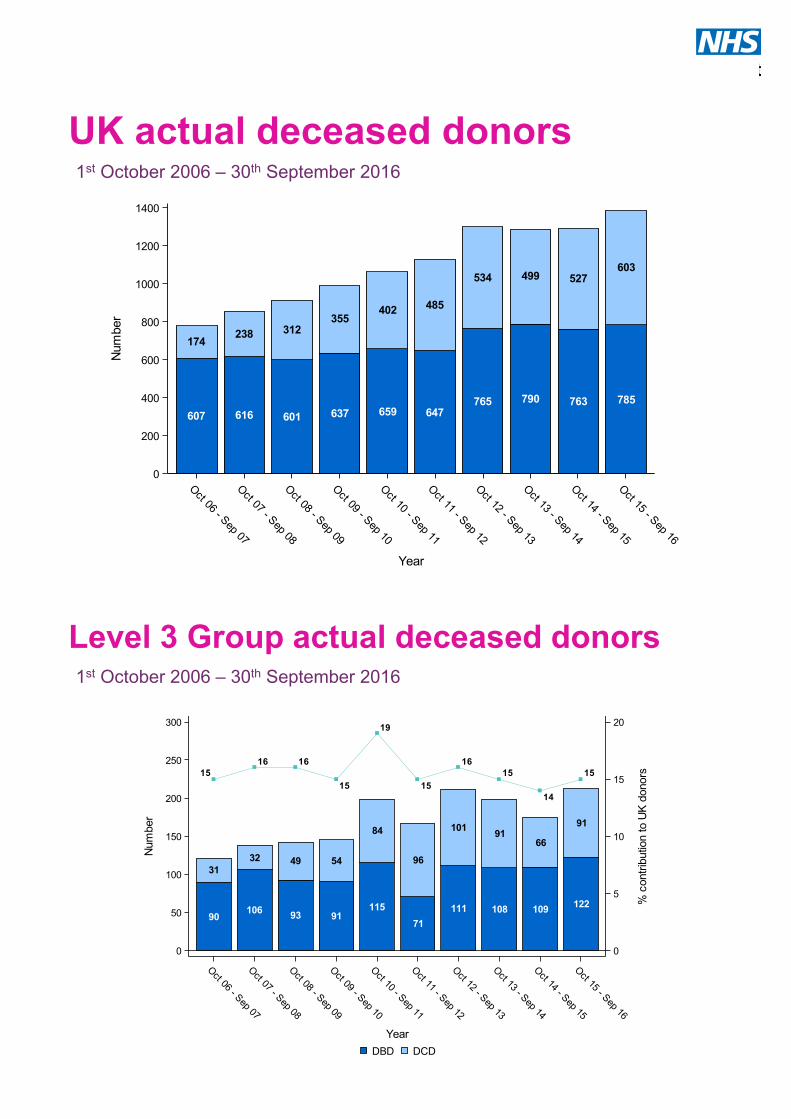
UK actual deceased donors1st October 2006 – 30th September 2016
Oct 06 - Sep 07
Oct 07 - Sep 08
Oct 08 - Sep 09
Oct 09 - Sep 10
Oct 10 - Sep 11
Oct 11 - Sep 12
Oct 12 - Sep 13
Oct 13 - Sep 14
Oct 14 - Sep 15
Oct 15 - Sep 16
Year
0
200
400
600
800
1000
1200
1400
Num
ber
DCDDBD
607
174
616
238
601
312
637
355
659
402
647
485
765
534
790
499
763
527
785
603
Level 3 Group actual deceased donors1st October 2006 – 30th September 2016
1516 16
15
19
15
1615
14
15
Oct 06 - Sep 07
Oct 07 - Sep 08
Oct 08 - Sep 09
Oct 09 - Sep 10
Oct 10 - Sep 11
Oct 11 - Sep 12
Oct 12 - Sep 13
Oct 13 - Sep 14
Oct 14 - Sep 15
Oct 15 - Sep 16
Year
0
50
100
150
200
250
300
Num
ber
0
5
10
15
20
% c
ontri
butio
n to
UK
don
ors
DCDDBD
90
31
106
32
93
49
91
54
115
84
71
96
111
101
108
91
109
66
122
91

6
Level 3 Group actual deceased donors1st October 2014 – 30th September 2016
12
34
56
78
910
1112
1314
1516
1718
1920
2122
2324
2526
2728
2930
3132
3334
3536
3738
3940
4142
4344
4546
47
Trust/Board
0
5
10
15
Num
ber
DCDDBD
4
7
4
6
4
4
6
1
2
4
4
10
3
6
5
7
1
9
1
3
310
2
5
3
4
7
2
5
4
4
6
4
5
19
5
2
5
6
4
68
3
8
3
4
1
2
4
3
3
3
7
10
8
3
6
1
8
5
2
3
3
3
4
3
5
5
4
4
17
1
3
8
53
7
3
4
5
2
4
3
5
5
3
7
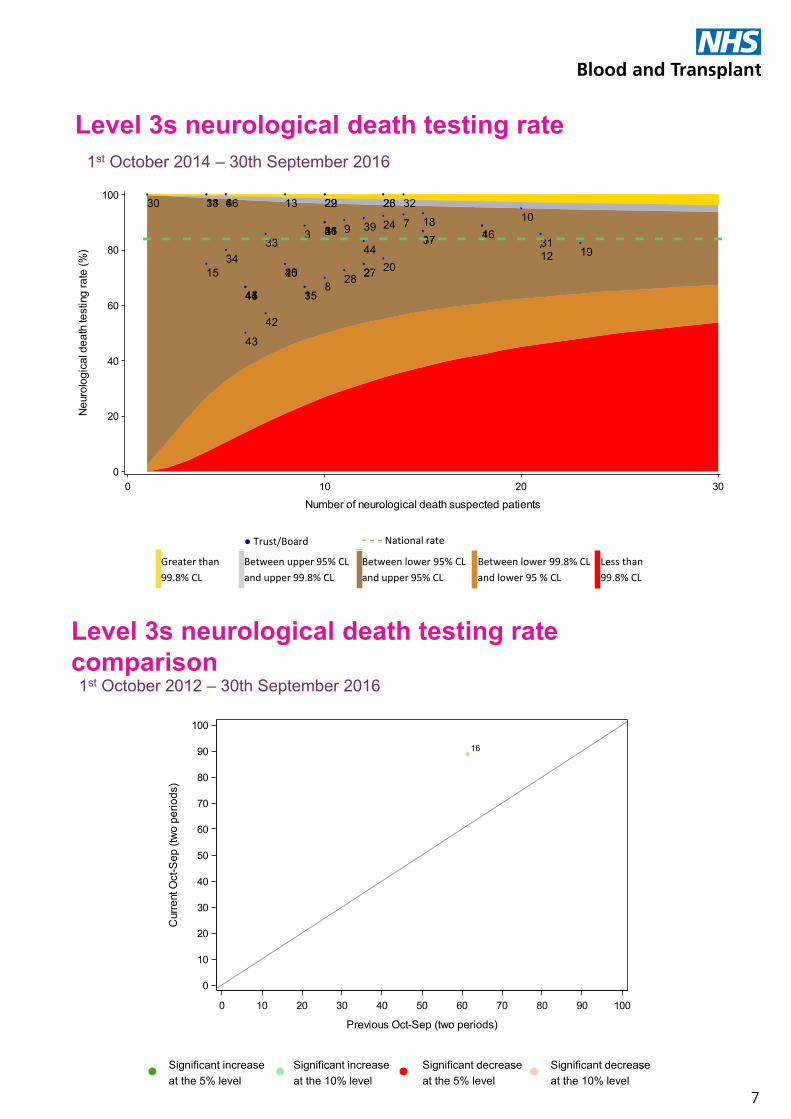
Level 3s neurological death testing rate1st October 2014 – 30th September 2016
● Trust/Board - - - National rate
Greater than 99.8% CL
Between upper 95% CL and upper 99.8% CL
Between lower 95% CL and upper 95% CL
Between lower 99.8% CL and lower 95 % CL
Less than 99.8% CL
Neu
rolo
gica
l dea
th te
stin
g ra
te (%
)
0
20
40
60
80
100
Number of neurological death suspected patients0 10 20 30
1
1011
12
13
14
15
161718
19
2 20
21
22 23
24
25
26
2728
29
3
30
31
32
3334
35
3637
38
394
40
41
42
43
44
45
46
47
5
6
7
8
9- - - - - - - - - - - - - - - - - - - - - - - - - - - - - -•
•
• ••
•
•
•
••
•
•
•
•
•
••
•
•
•
•
• •
•
•
•
••
••
•
•
•
•
•
••
•
•
•
•
•
•
•
•
•
•
Level 3s neurological death testing ratecomparison1st October 2012 – 30th September 2016
● Significant increase at the 5% level
● Significant increase at the 10% level
● Significant decrease at the 5% level
● Significant decrease at the 10% level
16
0 10 20 30 40 50 60 70 80 90 100
Previous Oct-Sep (two periods)
0
10
20
30
40
50
60
70
80
90
100
Cur
rent
Oct
-Sep
(tw
o pe
riods
)

8
Level 3s DBD referral rate1st October 2014 – 30th September 2016
● Trust/Board - - - National rate
Greater than 99.8% CL
Between upper 95% CL and upper 99.8% CL
Between lower 95% CL and upper 95% CL
Between lower 99.8% CL and lower 95 % CL
Less than 99.8% CL
Ref
erra
l rat
e (%
)
0
20
40
60
80
100
Number of neurological death suspected patients0 10 20 30
1 1011 12131415 161718 192 202122 2324
25
26272829330 31323334 35 36 3738 39 440 4142
43
444546 47 56 7
8
9- - - - - - - - - - - - - - - - - - - - - - - - - - - - - -• •• ••• •
•
• •• •••• ••• •••• ••
•
••••• •••• • • •• •• ••
•
••• •
9
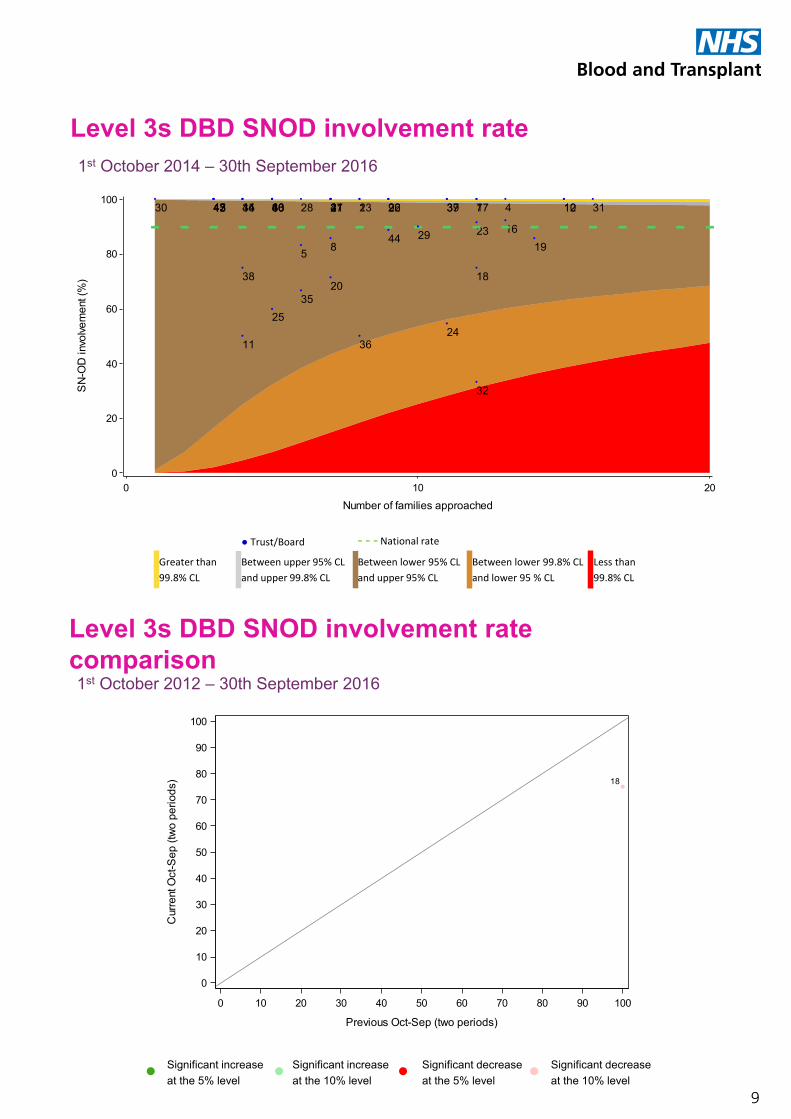
Level 3s DBD SNOD involvement rate comparison1st October 2012 – 30th September 2016
● Significant increase at the 5% level
● Significant increase at the 10% level
● Significant decrease at the 5% level
● Significant decrease at the 10% level
18
0 10 20 30 40 50 60 70 80 90 100
Previous Oct-Sep (two periods)
0
10
20
30
40
50
60
70
80
90
100
Cur
rent
Oct
-Sep
(tw
o pe
riods
)
Level 3s DBD SNOD involvement rate1st October 2014 – 30th September 2016
● Trust/Board - - - National rate
Greater than 99.8% CL
Between upper 95% CL and upper 99.8% CL
Between lower 95% CL and upper 95% CL
Between lower 99.8% CL and lower 95 % CL
Less than 99.8% CL
SN
-OD
invo
lvem
ent (
%)
0
20
40
60
80
100
Number of families approached0 10 20
1 10
11
12131415
16
17
18
19
2
20
21 22
23
2425
262728
29
330 31
32
3334
35
36
37
38
39 440 414243
44
45 4647
5
6 7
8
9
- - - - - - - - - - - - - - - - - - - -• •• •
•
• •
•
• •
•
••••
•
•
•
•
•
• •
•
•
•
•••
•
• •
•
••
•
•
•
•
•• •••
•
• ••

10
Level 3s DBD consent/authorisation rate1st October 2014 – 30th September 2016
● Trust/Board - - - National rate
Greater than 99.8% CL
Between upper 95% CL and upper 99.8% CL
Between lower 95% CL and upper 95% CL
Between lower 99.8% CL and lower 95 % CL
Less than 99.8% CL
Con
sent
/Aut
horis
atio
n ra
te (%
)
0
20
40
60
80
100
Number of families approached0 10 20
1
10
11
12
13
14
15
16
1718
19
2
20
2122
23
24
25
26
27
28
29
3
30
31
32
33
34
35 3637
38
39
4
40
41
42
43 44
45 4647
5
678
9
- - - - - - - - - - - - - - - - - - - -•
•
•
•
•
••
••
•
•
•
•
•
•
•
••
•
•
••
•
•
•
•
•
•
••
•
•
•
•
• ••
•
•
•
•
•
• •
• ••

11
Level 3s DBD conversion rate comparison1st October 2012 – 30th September 2016
● Significant increase at the 5% level
● Significant increase at the 10% level
● Significant decrease at the 5% level
● Significant decrease at the 10% level
5
27
29
0 10 20 30 40 50 60 70 80 90 100
Previous Oct-Sep (two periods)
0
10
20
30
40
50
60
70
80
90
100
Cur
rent
Oct
-Sep
(tw
o pe
riods
)
Level 3s DBD conversion rate1st October 2014 – 30th September 2016
● Trust/Board - - - National rate
Greater than 99.8% CL
Between upper 95% CL and upper 99.8% CL
Between lower 95% CL and upper 95% CL
Between lower 99.8% CL and lower 95 % CL
Less than 99.8% CL
Con
vers
ion
rate
(%)
0
20
40
60
80
100
Number of eligible DBD0 10 20
1
10
11
12
13
14
15
16
17
18
19220
21
22 23
24
25
2627
28
29
3
30
31
32
33
34
35
3637
38
39
4
40 41
42
43
44
45 4647
5
678
9
- - - - - - - - - - - - - - - - - - - -•
•
•
•
•
••
•
•
•
•
•
•
•
•
•
•
•
•
•
•
• •
•
•
•
•
•
•
•
•
•
•
•
•
••
•
••
•
•
•
•
• ••

12
Level 3s DCD referral rate comparison1st October 2012 – 30th September 2016
● Significant increase at the 5% level
● Significant increase at the 10% level
● Significant decrease at the 5% level
● Significant decrease at the 10% level
2
4 6
10
13
1516 19
21
23
28
29
33
0 10 20 30 40 50 60 70 80 90 100
Previous Oct-Sep (two periods)
0
10
20
30
40
50
60
70
80
90
100
Cur
rent
Oct
-Sep
(tw
o pe
riods
)
Level 3s DCD referral rate1st October 2014 – 30th September 2016
● Trust/Board - - - National rate
Greater than 99.8% CL
Between upper 95% CL and upper 99.8% CL
Between lower 95% CL and upper 95% CL
Between lower 99.8% CL and lower 95 % CL
Less than 99.8% CL
Ref
erra
l rat
e (%
)
0
20
40
60
80
100
Number of imminent death anticipated patients0 20 40 60 80 100 120 140 160
1
1011
12
13
14
1516
17
18
19
22021
22
2324
25
26 27
28
29
3
30
31
32
3334
3536
37
38
39
4 40
41
42
4344
45
46
47 56 7
8
9
----------------------------------------------------------------------------------------------------------------------------------------------------------------••
•
• •• •
•
••
•
•
•
•
••
•
•
•
••
•
••
•
• •
•
•
•
•
•
••
••
•
•
•
•
•
•
••
•
•
•
13
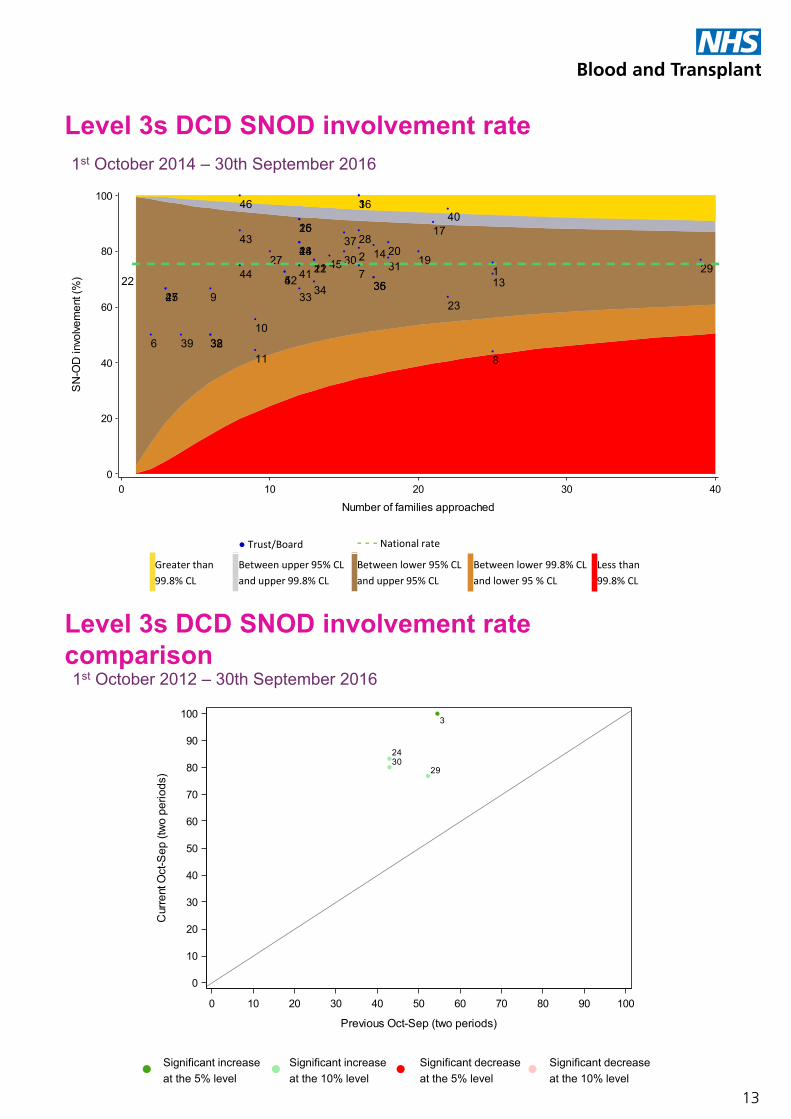
Level 3s DCD SNOD involvement rate1st October 2014 – 30th September 2016
● Trust/Board - - - National rate
Greater than 99.8% CL
Between upper 95% CL and upper 99.8% CL
Between lower 95% CL and upper 95% CL
Between lower 99.8% CL and lower 95 % CL
Less than 99.8% CL
SN
-OD
invo
lvem
ent (
%)
0
20
40
60
80
100
Number of families approached0 10 20 30 40
1
10
11
1213
14
15
16
17
18192 20
2122
23
24
25
26
27
28
29
3
30 31
32
33 34 3536
37
3839
4
40
4142
43
4445
46
475
6
7
8
9
- - - - - - - - - - - - - - - - - - - - - - - - - - - - - - - - - - - - - - - -•
•
•
•
•
•
•
•
•
•
•
••
•
•
•
•
••
•
•
•
•
•
•
•
•
••
•
•
•• ••
•
••
•
••
•
••
•
•
Level 3s DCD SNOD involvement rate comparison1st October 2012 – 30th September 2016
● Significant increase at the 5% level
● Significant increase at the 10% level
● Significant decrease at the 5% level
● Significant decrease at the 10% level
3
24
2930
0 10 20 30 40 50 60 70 80 90 100
Previous Oct-Sep (two periods)
0
10
20
30
40
50
60
70
80
90
100
Cur
rent
Oct
-Sep
(tw
o pe
riods
)
14
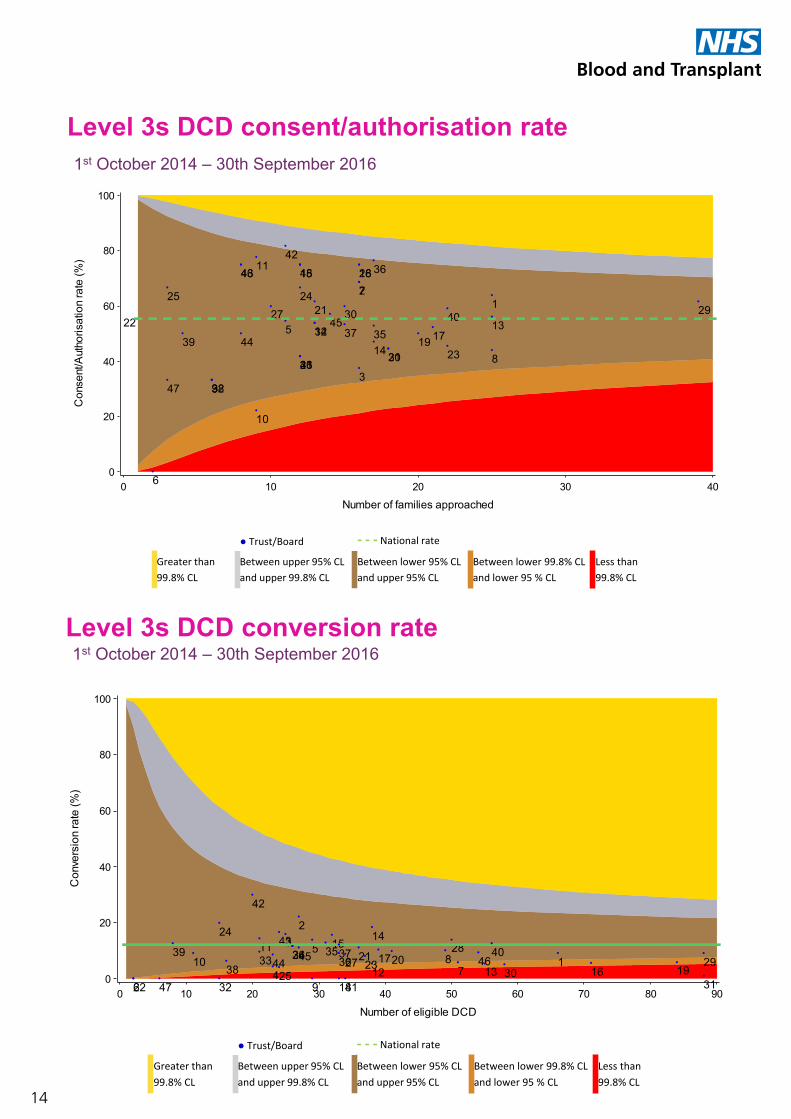
Level 3s DCD consent/authorisation rate1st October 2014 – 30th September 2016
● Trust/Board - - - National rate
Greater than 99.8% CL
Between upper 95% CL and upper 99.8% CL
Between lower 95% CL and upper 95% CL
Between lower 99.8% CL and lower 95 % CL
Less than 99.8% CL
Con
sent
/Aut
horis
atio
n ra
te (%
)
0
20
40
60
80
100
Number of families approached0 10 20 30 40
1
10
11
12 13
14
15 16
17
18
19
2
20
2122
23
2425
26
27
28
29
3
30
31
32
33
34 35
36
37
38
39
4
40
41
42
43
44
45
46
47
5
6
7
8
9
- - - - - - - - - - - - - - - - - - - - - - - - - - - - - - - - - - - - - - - -•
•
•
•
•
•
•
•
•
•
•
••
•
• •
•
•
•
•
•
•
••
•
•
•
••
•
•
•
• •
•
•
•
•
•
•
•
•
•
•
•
•
Level 3s DCD conversion rate1st October 2014 – 30th September 2016
● Trust/Board - - - National rate
Greater than 99.8% CL
Between upper 95% CL and upper 99.8% CL
Between lower 95% CL and upper 95% CL
Between lower 99.8% CL and lower 95 % CL
Less than 99.8% CL
Con
vers
ion
rate
(%)
0
20
40
60
80
100
Number of eligible DCD0 10 20 30 40 50 60 70 80 90
11011
12 13
1415
1617
1819
2
2021
22
23
24
25
2627
2829
3
303132
33 34 353637
3839
4
40
41
42
43
44 45 46
47
5
67
8
9
------------------------------------------------------------------------------------------•
•
•
•
•
•
••
•
•
•
• •
••
••
•
•••
•
•
•
•
••
••
•••
• • •••
•
• •
•
•
•
•• •
•
15
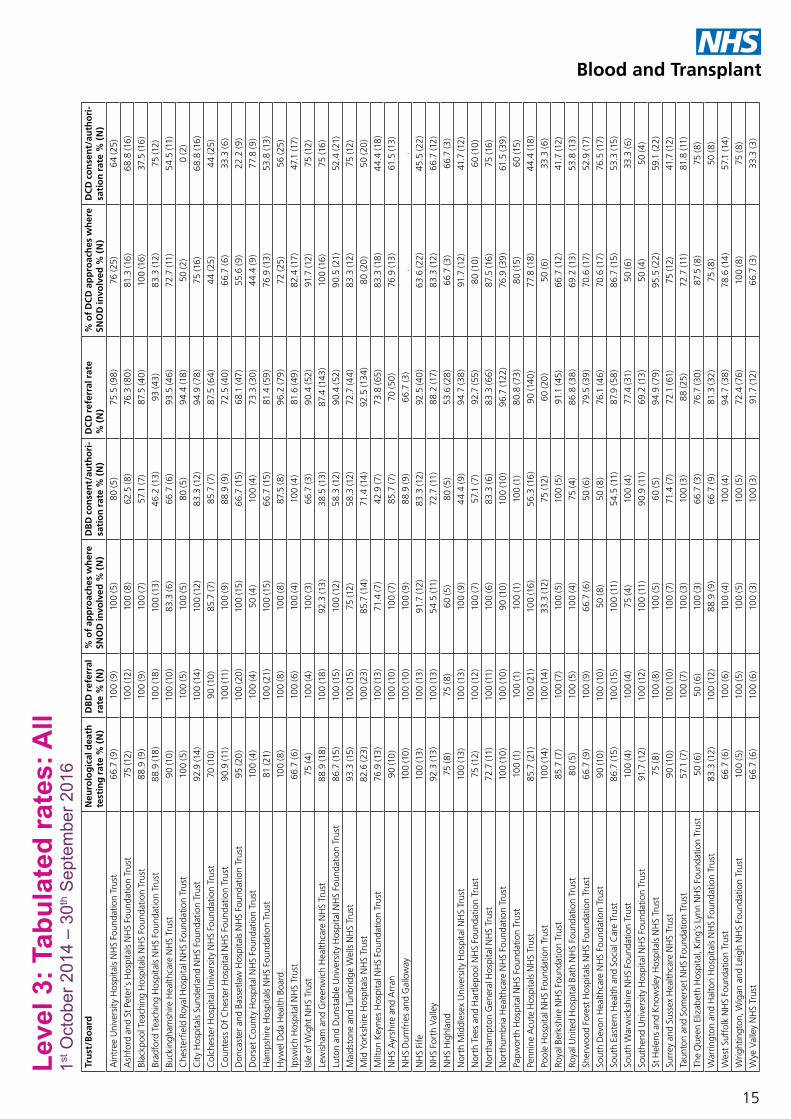
Leve
l 3: T
abul
ated
rate
s: A
ll1st
Oct
ober
201
4 –
30th S
epte
mbe
r 201
6Tr
ust
/Bo
ard
Neu
rolo
gic
al d
eath
te
stin
g r
ate
% (
N)
DB
D r
efer
ral
rate
% (
N)
% o
f ap
pro
ach
es w
her
e SN
OD
invo
lved
% (
N)
DB
D c
on
sen
t/au
tho
ri-
sati
on
rat
e %
(N
)D
CD
ref
erra
l rat
e %
(N
)%
of
DC
D a
pp
roac
hes
wh
ere
SNO
D in
volv
ed %
(N
)D
CD
co
nse
nt/
auth
ori
-sa
tio
n r
ate
% (
N)
Ain
tree
Uni
vers
ity
Hos
pita
ls N
HS
Foun
datio
n Tr
ust
66.7
(9)
100
(9)
100
(5)
80
(5)
75.5
(98
)76
(25
)6
4 (2
5)
Ash
ford
and
St
Pete
r’s
Hos
pita
ls N
HS
Foun
datio
n Tr
ust
75 (1
2)10
0 (1
2)10
0 (8
)62
.5 (8
)76
.3 (
80
)81
.3 (1
6)
68.8
(16
)
Blac
kpoo
l Tea
chin
g H
ospi
tals
NH
S Fo
unda
tion
Trus
t8
8.9
(9)
100
(9)
100
(7)
57.1
(7)
87.5
(40
)10
0 (1
6)
37.5
(16
)
Brad
ford
Tea
chin
g H
ospi
tals
NH
S Fo
unda
tion
Trus
t8
8.9
(18
)10
0 (1
8)
100
(13
)4
6.2
(13
)93
(43
)83
.3 (1
2)75
(12)
Buck
ingh
amsh
ire H
ealth
care
NH
S Tr
ust
90
(10
)10
0 (1
0)
83.3
(6)
66.7
(6)
93.5
(46
)72
.7 (1
1)5
4.5
(11)
Che
ster
field
Roy
al H
ospi
tal N
HS
Foun
datio
n Tr
ust
100
(5)
100
(5)
100
(5)
80
(5)
94.
4 (1
8)
50 (2
)0
(2)
Cit
y H
ospi
tals
Sun
derla
nd N
HS
Foun
datio
n Tr
ust
92.9
(14
)10
0 (1
4)
100
(12)
83.3
(12)
94.
9 (7
8)
75 (1
6)
68.8
(16
)
Col
ches
ter
Hos
pita
l Uni
vers
ity
NH
S Fo
unda
tion
Trus
t70
(10
)9
0 (1
0)
85.7
(7)
85.7
(7)
87.5
(64
)4
4 (2
5)
44
(25
)
Cou
ntes
s O
f C
hest
er H
ospi
tal N
HS
Foun
datio
n Tr
ust
90.
9 (1
1)10
0 (1
1)10
0 (9
)8
8.9
(9)
72.5
(40
)66
.7 (6
)33
.3 (6
)
Don
cast
er a
nd B
asse
tlaw
Hos
pita
ls N
HS
Foun
datio
n Tr
ust
95 (2
0)
100
(20
)10
0 (1
5)
66.7
(15
)68
.1 (4
7)55
.6 (9
)22
.2 (9
)
Dor
set
Cou
nty
Hos
pita
l NH
S Fo
unda
tion
Trus
t10
0 (4
)10
0 (4
)50
(4)
100
(4)
73.3
(30
)4
4.4
(9)
77.8
(9)
Ham
pshi
re H
ospi
tals
NH
S Fo
unda
tion
Trus
t81
(21)
100
(21)
100
(15
)66
.7 (1
5)
81.4
(59
)76
.9 (1
3)
53.8
(13
)
Hyw
el D
da H
ealth
Boa
rd10
0 (8
)10
0 (8
)10
0 (8
)87
.5 (8
)9
6.2
(79
)72
(25
)56
(25
)
Ipsw
ich
Hos
pita
l NH
S Tr
ust
66.7
(6)
100
(6)
100
(4)
100
(4)
81.6
(49
)82
.4 (1
7)47
.1 (1
7)
Isle
of
Wig
ht N
HS
Trus
t75
(4)
100
(4)
100
(3)
66.7
(3)
90.
4 (5
2)91
.7 (1
2)75
(12)
Lew
isha
m a
nd G
reen
wic
h H
ealth
care
NH
S Tr
ust
88.
9 (1
8)
100
(18
)92
.3 (1
3)
38.5
(13
)87
.4 (1
43)
100
(16
)75
(16
)
Luto
n an
d D
unst
able
Uni
vers
ity
Hos
pita
l NH
S Fo
unda
tion
Trus
t86
.7 (1
5)
100
(15
)10
0 (1
2)58
.3 (1
2)9
0.4
(52)
90.
5 (2
1)52
.4 (2
1)
Mai
dsto
ne a
nd T
unbr
idge
Wel
ls N
HS
Trus
t93
.3 (1
5)
100
(15
)75
(12)
58.3
(12)
72.7
(44
)83
.3 (1
2)75
(12)
Mid
Yor
kshi
re H
ospi
tals
NH
S Tr
ust
82.6
(23
)10
0 (2
3)
85.7
(14
)71
.4 (1
4)
92.5
(134
)8
0 (2
0)
50 (2
0)
Milt
on K
eyne
s H
ospi
tal N
HS
Foun
datio
n Tr
ust
76.9
(13
)10
0 (1
3)
71.4
(7)
42.9
(7)
73.8
(65
)83
.3 (1
8)
44.
4 (1
8)
NH
S A
yrsh
ire a
nd A
rran
90
(10
)10
0 (1
0)
100
(7)
85.7
(7)
70 (5
0)
76.9
(13
)61
.5 (1
3)
NH
S D
umfr
ies
and
Gal
low
ay10
0 (1
0)
100
(10
)10
0 (9
)8
8.9
(9)
66.7
(3)
..
NH
S Fi
fe10
0 (1
3)
100
(13
)91
.7 (1
2)83
.3 (1
2)92
.5 (4
0)
63.6
(22)
45.5
(22)
NH
S Fo
rth
Val
ley
92.3
(13
)10
0 (1
3)
54.
5 (1
1)72
.7 (1
1)8
8.2
(17)
83.3
(12)
66.7
(12)
NH
S H
ighl
and
75 (8
)75
(8)
60 (5
)8
0 (5
)53
.6 (2
8)
66.7
(3)
66.7
(3)
Nor
th M
iddl
esex
Uni
vers
ity
Hos
pita
l NH
S Tr
ust
100
(13
)10
0 (1
3)
100
(9)
44.
4 (9
)9
4.7
(38
)91
.7 (1
2)41
.7 (1
2)
Nor
th T
ees
and
Har
tlepo
ol N
HS
Foun
datio
n Tr
ust
75 (1
2)10
0 (1
2)10
0 (7
)57
.1 (7
)92
.7 (5
5)
80
(10
)60
(10
)
Nor
tham
pton
Gen
eral
Hos
pita
l NH
S Tr
ust
72.7
(11)
100
(11)
100
(6)
83.3
(6)
83.3
(66
)87
.5 (1
6)
75 (1
6)
Nor
thum
bria
Hea
lthca
re N
HS
Foun
datio
n Tr
ust
100
(10
)10
0 (1
0)
90
(10
)10
0 (1
0)
96.
7 (1
22)
76.9
(39
)61
.5 (3
9)
Papw
orth
Hos
pita
l NH
S Fo
unda
tion
Trus
t10
0 (1
)10
0 (1
)10
0 (1
)10
0 (1
)8
0.8
(73
)8
0 (1
5)
60 (1
5)
Penn
ine
Acu
te H
ospi
tals
NH
S Tr
ust
85.7
(21)
100
(21)
100
(16
)56
.3 (1
6)
90
(14
0)
77.8
(18
)4
4.4
(18
)
Pool
e H
ospi
tal N
HS
Foun
datio
n Tr
ust
100
(14
)10
0 (1
4)
33.3
(12)
75 (1
2)60
(20
)50
(6)
33.3
(6)
Roya
l Ber
kshi
re N
HS
Foun
datio
n Tr
ust
85.7
(7)
100
(7)
100
(5)
100
(5)
91.1
(45
)66
.7 (1
2)41
.7 (1
2)
Roya
l Uni
ted
Hos
pita
l Bat
h N
HS
Foun
datio
n Tr
ust
80
(5)
100
(5)
100
(4)
75 (4
)86
.8 (3
8)
69.2
(13
)53
.8 (1
3)
Sher
woo
d Fo
rest
Hos
pita
ls N
HS
Foun
datio
n Tr
ust
66.7
(9)
100
(9)
66.7
(6)
50 (6
)79
.5 (3
9)
70.6
(17)
52.9
(17)
Sout
h D
evon
Hea
lthca
re N
HS
Foun
datio
n Tr
ust
90
(10
)10
0 (1
0)
50 (8
)50
(8)
76.1
(46
)70
.6 (1
7)76
.5 (1
7)
Sout
h Ea
ster
n H
ealth
and
Soc
ial C
are
Trus
t86
.7 (1
5)
100
(15
)10
0 (1
1)5
4.5
(11)
87.9
(58
)86
.7 (1
5)
53.3
(15
)
Sout
h W
arw
icks
hire
NH
S Fo
unda
tion
Trus
t10
0 (4
)10
0 (4
)75
(4)
100
(4)
77.4
(31)
50 (6
)33
.3 (6
)
Sout
hend
Uni
vers
ity
Hos
pita
l NH
S Fo
unda
tion
Trus
t91
.7 (1
2)10
0 (1
2)10
0 (1
1)9
0.9
(11)
69.2
(13
)50
(4)
50 (4
)
St H
elen
s an
d K
now
sley
Hos
pita
ls N
HS
Trus
t75
(8)
100
(8)
100
(5)
60 (5
)9
4.9
(79
)95
.5 (2
2)59
.1 (2
2)
Surr
ey a
nd S
usse
x H
ealth
care
NH
S Tr
ust
90
(10
)10
0 (1
0)
100
(7)
71.4
(7)
72.1
(61)
75 (1
2)41
.7 (1
2)
Taun
ton
and
Som
erse
t N
HS
Foun
datio
n Tr
ust
57.1
(7)
100
(7)
100
(3)
100
(3)
88
(25
)72
.7 (1
1)81
.8 (1
1)
The
Que
en E
lizab
eth
Hos
pita
l, K
ing’
s Ly
nn N
HS
Foun
datio
n Tr
ust
50 (6
)50
(6)
100
(3)
66.7
(3)
76.7
(30
)87
.5 (
8)
75 (
8)
War
ringt
on a
nd H
alto
n H
ospi
tals
NH
S Fo
unda
tion
Trus
t83
.3 (1
2)10
0 (1
2)8
8.9
(9)
66.7
(9)
81.3
(32)
75 (
8)
50 (
8)
Wes
t Su
ffol
k N
HS
Foun
datio
n Tr
ust
66.7
(6)
100
(6)
100
(4)
100
(4)
94.
7 (3
8)
78.6
(14
)57
.1 (1
4)
Wrig
htin
gton
, Wig
an a
nd L
eigh
NH
S Fo
unda
tion
Trus
t10
0 (5
)10
0 (5
)10
0 (5
)10
0 (5
)72
.4 (7
6)
100
(8)
75 (
8)
Wye
Val
ley
NH
S Tr
ust
66.7
(6)
100
(6)
100
(3)
100
(3)
91.7
(12)
66.7
(3)
33.3
(3)
16
Trust level Number not tested Neurological death testing rate %
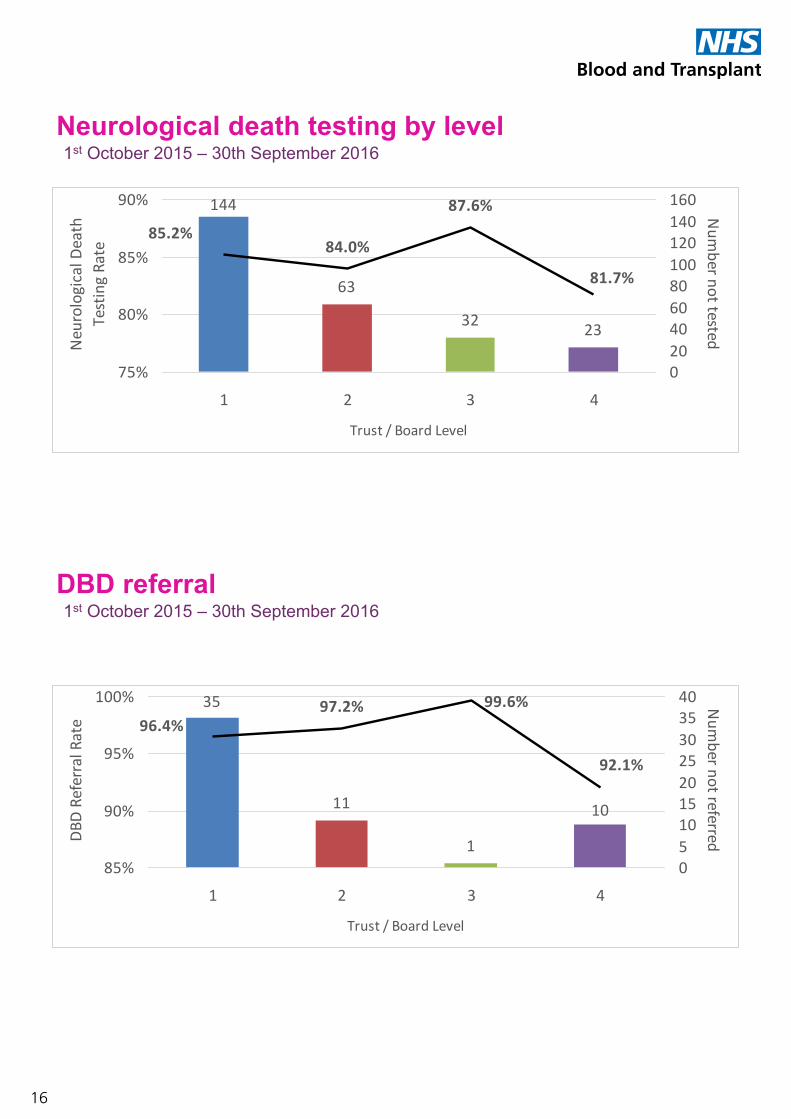
1 144 85.22 63 84.03 32 87.64 23 81.7
Neurological death testing by level
144
63
32 23
84.0%
87.6%
81.7%
85.2%
75%
80%
85%
90%
1 2 3 4
Trust / Board Level
Neur
olog
ical D
eath
Te
stin
g Ra
te
020406080100120140160
Number not tested
1st October 2015 – 30th September 2016
Trust level Number not tested Neurological death testing rate %
1 144 85.22 63 84.03 32 87.64 23 81.7
Neurological death testing by level
144
63
32 23
84.0%
87.6%
81.7%
85.2%
75%
80%
85%
90%
1 2 3 4
Trust / Board Level
Neur
olog
ical D
eath
Te
stin
g Ra
te
020406080100120140160
Number not tested
1st October 2015 – 30th September 2016
Trust level Number not referred DBD referral rate %1 35 96.42 11 97.23 1 99.64 10 92.1
DBD referral
35
11
1
10
97.2%
92.1%
99.6%96.4%
85%
90%
95%
100%
1 2 3 4
Trust / Board Level
DBD
Refe
rral
Rat
e
0510152025303540 N
umber not referred
1st October 2015 – 30th September 2016
Trust level Number not referred DBD referral rate %1 35 96.42 11 97.23 1 99.64 10 92.1
DBD referral
35
11
1
10
97.2%
92.1%
99.6%96.4%
85%
90%
95%
100%
1 2 3 4
Trust / Board Level
DBD
Refe
rral
Rat
e
0510152025303540 N
umber not referred
1st October 2015 – 30th September 2016
17
Trust levelNu mber where SNOD not involved in approach
DBD SNOD involvement rate %
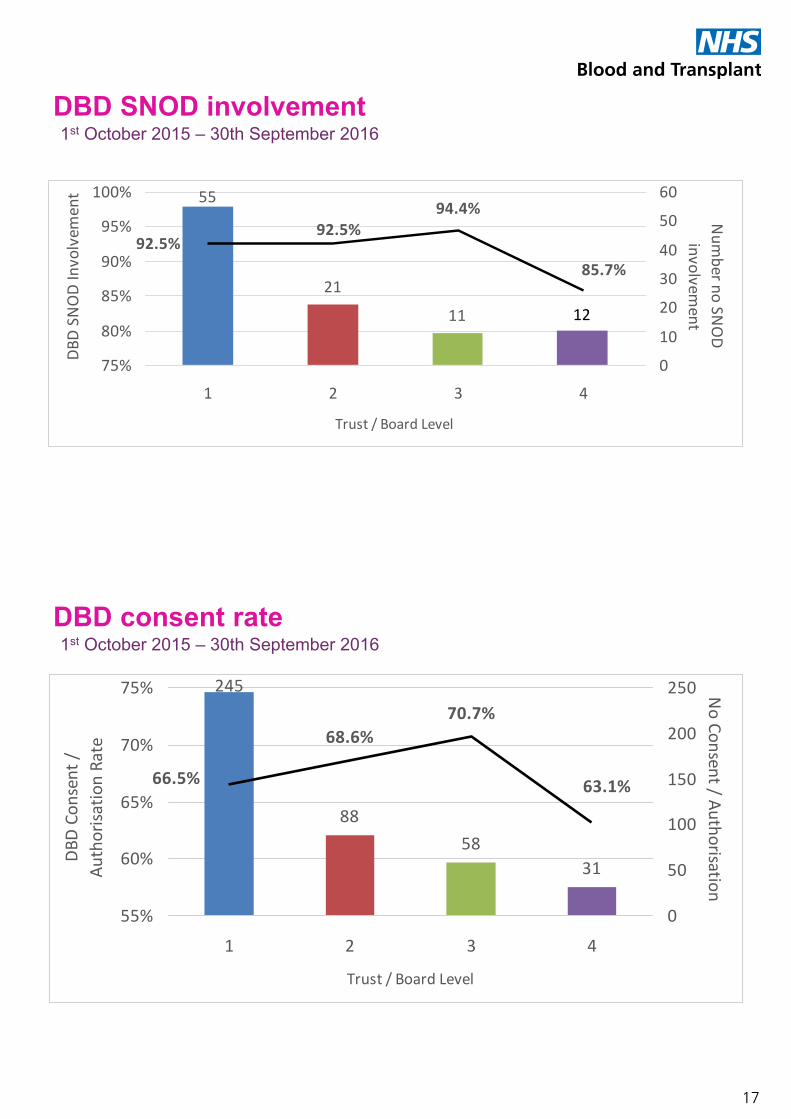
1 55 92.52 21 92.53 11 94.44 12 85.1
DBD SNOD involvement1st October 2015 – 30th September 2016
55
21
11 12
94.4%
85.7%
92.5%92.5%
75%
80%
85%
90%
95%
100%
1 2 3 4
Trust / Board Level
DBD
SNO
D In
volv
emen
t
0
10
20
30
40
50
60
Num
ber no SNO
D involvem
ent
Trust levelNu mber where SNOD not involved in approach
DBD SNOD involvement rate %
1 55 92.52 21 92.53 11 94.44 12 85.1
DBD SNOD involvement1st October 2015 – 30th September 2016
55
21
11 12
94.4%
85.7%
92.5%92.5%
75%
80%
85%
90%
95%
100%
1 2 3 4
Trust / Board Level
DBD
SNO
D In
volv
emen
t
0
10
20
30
40
50
60
Num
ber no SNO
D involvem
ent
Trust level Number not consenting DBD consent rate %
1 245 66.52 88 68.63 58 70.74 31 63.1
DBD consent rate1st October 2015 – 30th September 2016
245
8858
31
68.6%70.7%
63.1%66.5%
55%
60%
65%
70%
75%
1 2 3 4
Trust / Board Level
DBD
Cons
ent /
Au
thor
isatio
n Ra
te
0
50
100
150
200
250 No Consent / Authorisation
18
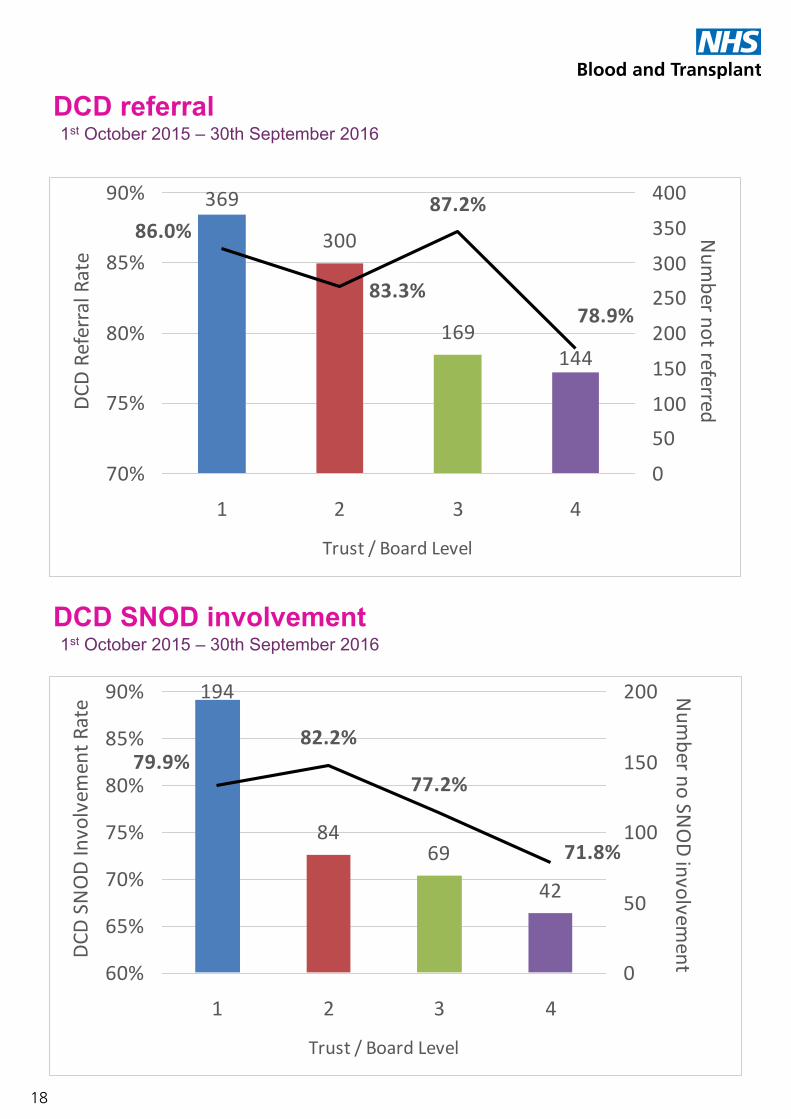
Trust level Number not referred DCD referral rate %1 369 86.02 300 83.33 169 87.24 144 78.9
DCD referral1st October 2015 – 30th September 2016
369
300
169144
87.2%
78.9%83.3%
86.0%
70%
75%
80%
85%
90%
1 2 3 4
Trust / Board Level
DCD
Refe
rral R
ate
050100150200250300350400
Number not referred
Trust level Number not referred DCD referral rate %1 369 86.02 300 83.33 169 87.24 144 78.9
DCD referral1st October 2015 – 30th September 2016
369
300
169144
87.2%
78.9%83.3%
86.0%
70%
75%
80%
85%
90%
1 2 3 4
Trust / Board Level
DCD
Refe
rral R
ate
050100150200250300350400
Number not referred
Trust level Number where SNOD not involved in approach
DCD SNOD involvement rate %
1 194 79.92 84 82.23 69 77.24 42 71.8
DCD SNOD involvement1st October 2015 – 30th September 2016
194
8469
42
82.2%
77.2%
71.8%
79.9%
60%
65%
70%
75%
80%
85%
90%
1 2 3 4
Trust / Board Level
DCD
SNO
D In
volv
emen
t Rat
e
0
50
100
150
200
involvement
Num
bernoSN
OD

19
Trust level Number not consenting DCD consent rate %
1 405 57.92 167 64.53 125 58.64 70 53.0
DCD consent rate1st October 2015 – 30th September 2016
405
167125
70
64.5%
53.0%
58.6%57.9%
40%
50%
60%
70%
1 2 3 4
Trust / Board Level
DCD
Cons
ent /
Au
thor
isatio
n Ra
te
050100150200250300350400450 No Consent / Authorisation

20
17
Applying PDSA methods
Why? Why?Why?
Cycle end date: Cycle start date:
Issue: Cycle number:
Why?
X
Guide to completing your PDSA cycle template
State here your main ‘why’ This should be your root causeNow question your main ‘why’
Explain what your next steps will be now that your first cycle has come to an end. If the cycle was successful: You will have achieved your primary goal. As no further cycles are required make sure you delete any blank slides.If the cycle was not successful: Copy your current cycle, paste the text onto the next template and adapt the plan and do sections accordingly.
What are you trying to achieve?
Explain what you are going to do and why. You will find an example on slide 3. which should help you complete this.
Explain what it is that you actually did. This may differ to what you had initially planned to do.
Note the lessons that you have learnt, addressing any problems that you found and summarising your result.You will find an example on slide 3. which should help you complete this.
What is the issue/problem?
dd/mm/yyyy dd/mm/yyyy
Why? Why?Why?
Cycle end date: Cycle start date:
Issue: Cycle number:Hints & tips to help you complete your PDSA cycle
1. Plan: Be clear about the primary goal you aim to change, the questions that need to be answered and what is expected to happen. Plan how the PDSA cycle will be carried out, specifying who will be responsible for implementing the plan, where and when it will be tested, what will be done and what the expected outcomes might be.
Notes: when running PDSA cycles•Don’t think too big. Implement a small simple change as this is more likely to be successful.•Don’t be too vague or too detailed - some detail is needed but to a practical, not obsessive, level.•Make sure the results are acted on.•In practice more than one PDSA cycle can be run at a time as long as they are small and simple.
2. Do: Carry out the plan and record the agreed measures and outcomes carefully. Ensure that any problems or other unexpected events are also documented.
3. Study: Compare what the outcomes were to what you thought would happen. Ask those who were involved and study what actually happened, noting problems and other unexpected events. Summarise the outcome of the pilot.
4. Act: As a team decide what should happen next? Should the same primary goal be kept but the cycle repeated, should the primary goal be adapted and the cycle run again or should the cycle be stopped. Make the decision based on what was learnt from the PDSA cycle. It is possible that a single PDSA cycle will show a primary goal that can be achieved and be applied more widely or even adopted into routine practice. However, remember that several cycles might have to be run before a primary goal of a PDSA cycle is successfully adopted into normal practice.
To Start: Identify issue to be addressed and drill down using 3 whys to create your primary goal.
Each primary goal should have at least 1 PDSA cycle. Each cycle has 4 sections which are listed below:

21
18
Why? Why?Why?
Cycle end date: Cycle start date:
Issue: Cycle number:
Why?
• More education needed• Use poster board in ED staff room to
promote referral, and feedback results.• Run a 2nd PDSA cycle on this goal
• Engage with ED to identify a local trigger• To highlight with ED Consultants and
Senior Nursing Team• Monitor through the Potential Donor Audit• Review at Organ Donation Committee
(ODC)• Encourage ED attendance at ODC
• Ran PDSA cycle for 1 month• 2 cases of potential donors not referred• Both cases missed at the weekend
• To include Organ Donation trigger as part of End of Life paperwork
• Educate ED medical and nursing teams, cascade message.
50% of missed referrals are in the ED
Not identifying all potential organ donors
100% identification and referral of potential organ donors
No referral trigger in place in ED
1st Sept 2016
70% referral rate 1

22
19
Why
?W
hy?
Why
?
Cycl
e en
d da
te:
Cycl
e st
art d
ate:
Issu
e:Cy
cle
num
ber:
Why
?
3

23
Level Three Hospitals (47)Key Trust/Board1 Aintree University Hospitals NHS Foundation Trust2 Ashford and St Peter's Hospitals NHS Foundation Trust3 Blackpool Teaching Hospitals NHS Foundation Trust4 Bradford Teaching Hospitals NHS Foundation Trust5 Buckinghamshire Healthcare NHS Trust6 Chesterfield Royal Hospital NHS Foundation Trust7 City Hospitals Sunderland NHS Foundation Trust8 Colchester Hospital University NHS Foundation Trust9 Countess Of Chester Hospital NHS Foundation Trust10 Doncaster and Bassetlaw Hospitals NHS Foundation Trust11 Dorset County Hospital NHS Foundation Trust12 Hampshire Hospitals NHS Foundation Trust13 Hywel Dda Health Board14 Ipswich Hospital NHS Trust15 Isle of Wight NHS Trust16 Lewisham and Greenwich Healthcare NHS Trust17 Luton and Dunstable University Hospital NHS Foundation Trust18 Maidstone and Tunbridge Wells NHS Trust19 Mid Yorkshire Hospitals NHS Trust20 Milton Keynes Hospital NHS Foundation Trust21 NHS Ayrshire and Arran22 NHS Dumfries and Galloway23 NHS Fife24 NHS Forth Valley25 NHS Highland26 North Middlesex University Hospital NHS Trust27 North Tees and Hartlepool NHS Foundation Trust28 Northampton General Hospital NHS Trust29 Northumbria Healthcare NHS Foundation Trust30 Papworth Hospital NHS Foundation Trust31 Pennine Acute Hospitals NHS Trust32 Poole Hospital NHS Foundation Trust33 Royal Berkshire NHS Foundation Trust34 Royal United Hospital Bath NHS Foundation Trust35 Sherwood Forest Hospitals NHS Foundation Trust36 South Devon Healthcare NHS Foundation Trust37 South Eastern Health and Social Care Trust38 South Warwickshire NHS Foundation Trust39 Southend University Hospital NHS Foundation Trust40 St Helens and Knowsley Hospitals NHS Trust41 Surrey and Sussex Healthcare NHS Trust42 Taunton and Somerset NHS Foundation Trust43 The Queen Elizabeth Hospital, King's Lynn NHS Foundation Trust44 Warrington and Halton Hospitals NHS Foundation Trust45 West Suffolk NHS Foundation Trust46 Wrightington, Wigan and Leigh NHS Foundation Trust47 Wye Valley NHS Trust