Embed Size (px)
Citation preview

MTAT.03.231 Business Process Management
Lecture 12-13
Process Monitoring and Process Mining
Marlon Dumas
University of Tartu

Process identification
Conformance and performance insights
Conformance and performance insights
Processmonitoring and
controlling
Executable processmodel
Executable processmodel
Processimplementation To-be process
model
To-be process model
Processanalysis
As-is processmodel
As-is processmodel
Process discovery
Process architectureProcess architecture
Processredesign
Insights onweaknesses and
their impact
Insights onweaknesses and
their impact
Where are we?
2

1. Introduction
2. Process Identification
3. Essential Process Modeling
4. Advanced Process Modeling
5. Process Discovery
6. Qualitative Process Analysis
7. Quantitative Process Analysis
8. Process Redesign
9. Process-Aware Information Systems
10.Process Automation
11.Process Monitoring
12.BPM as an Enterprise Capability
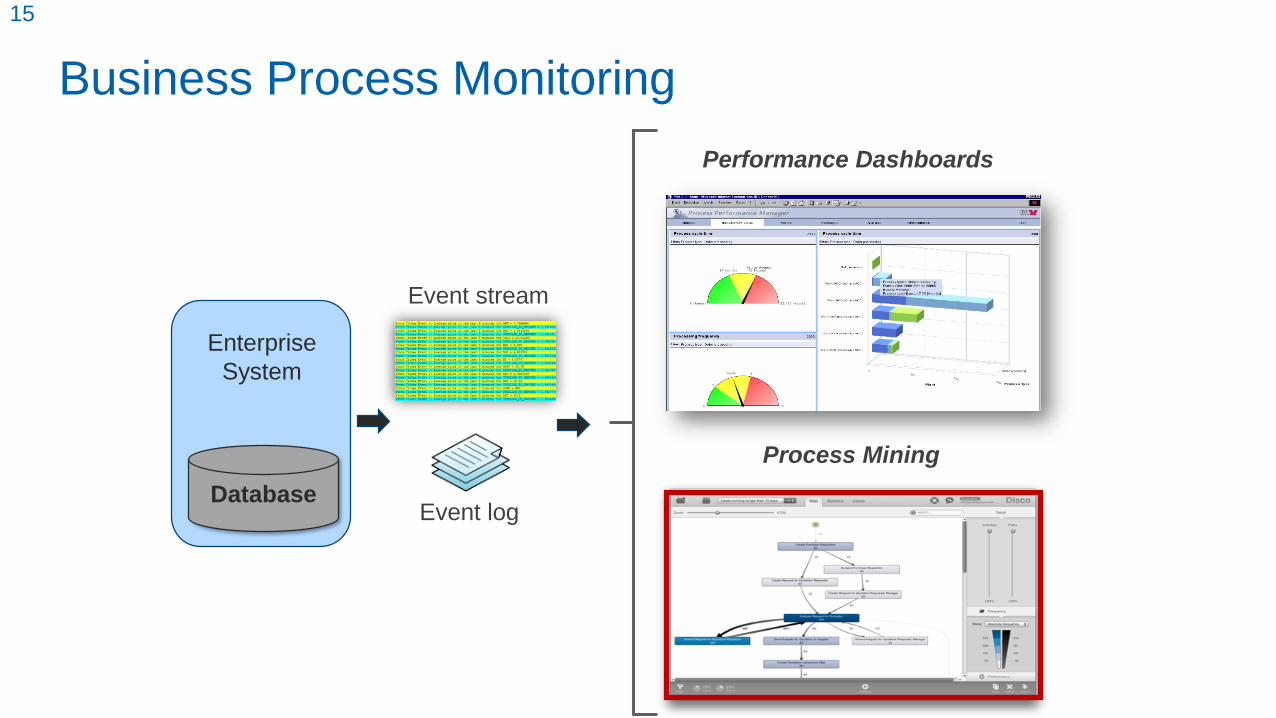
Performance Dashboards
Process Mining
Database
Enterprise
System
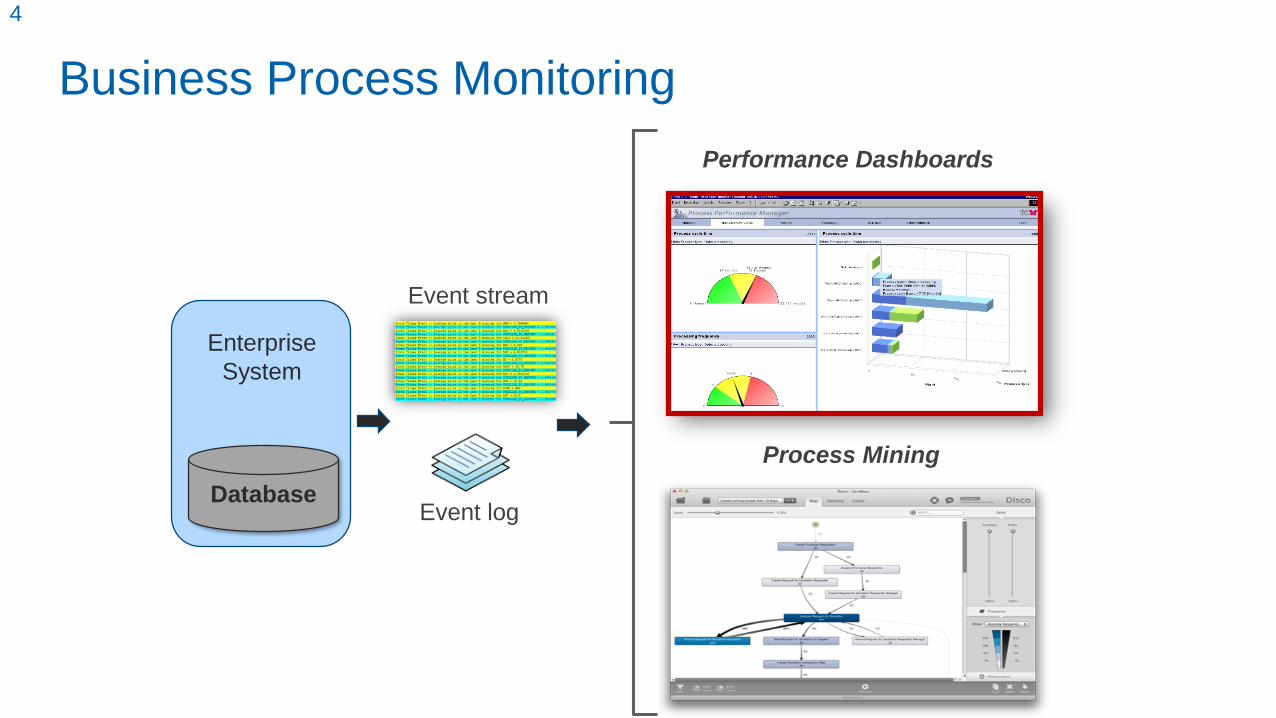
Business Process Monitoring
Event log
Event stream
4
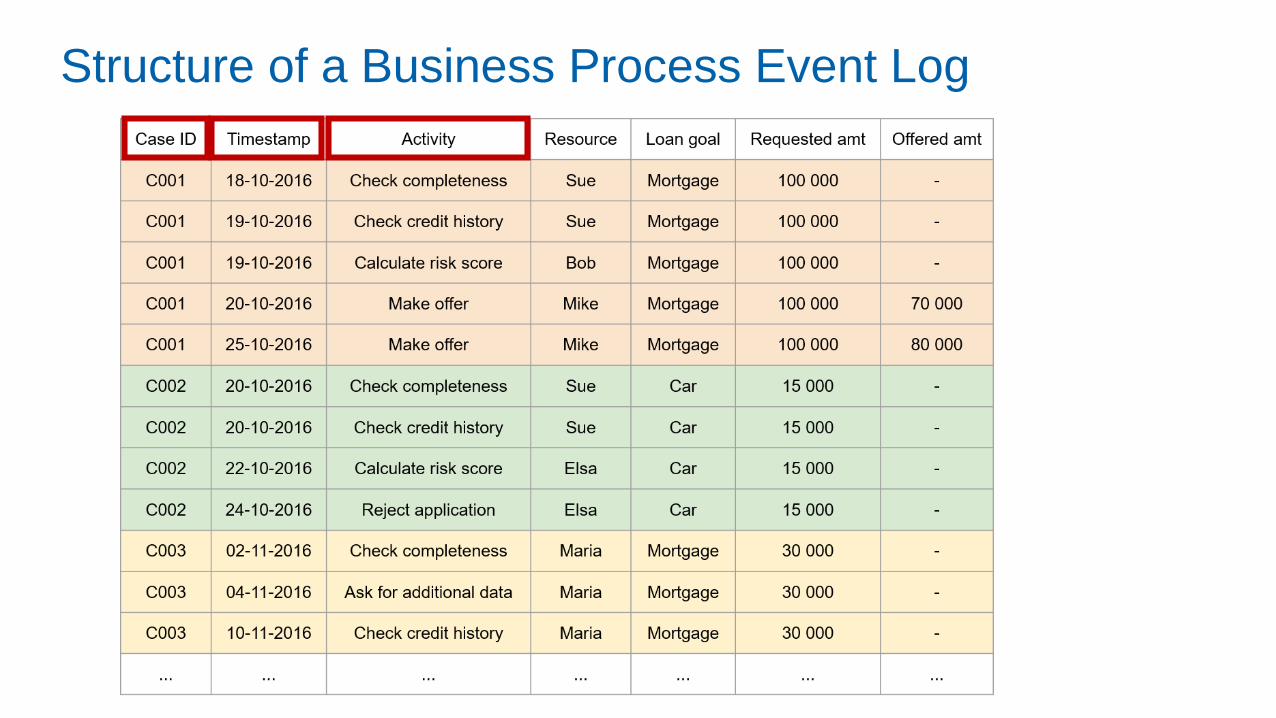
Structure of a Business Process Event Log

ProcessDashboards
Operationaldashboards
(runtime)
Tactical dashboards(historical)
Strategic dashboards(historical)
Types of process dashboards

Operational process dashboards
• Aimed at process workers & operational managers
• Emphasis on monitoring (detect-and-respond), e.g.:
- Work-in-progress
- Problematic cases – e.g. overdue/at-risk cases
- Resource load

• Aimed at process owners / managers
• Emphasis on analysis and management
• E.g. detecting bottlenecks
• Typical process performance indicators
• Cycle times
• Error rates
• Resource utilization
Tactical performance dashboards

Tactical Performance Dashboard @ Australian Insurer

• Aimed at executives & managers
• Emphasis on linking process performance to strategic objectives
Strategic performance dashboards

Manage
Unplanned
Outages
Manage
Emergencies &
Disasters
Manage Work
Programming &
Resourcing
Manage
Procurement
Customer
Satisfaction0.5 0.55 - 0.2
Customer
Complaint0.6 - - 0.5
Customer
Feedback0.4 - - 0.8
Connection Less
Than Agreed Time0.3 0.6 0.7 -
Key Performance
Process
Strategic Performance Dashboard @ Australian Utilities Provider

Process: Manage Emergencies & Disasters
Process: Manage Procurement
Process: Manage Unplanned Outages
Overall Process Performance
Financial PeopleCustomer
Excellence
Operational
Excellence
Risk
Management
Health
& Safety
Customer
Satisfaction
Customer
Complaint
Customer
Rating (%)
Customer
Loyalty Index
Average Time
Spent on Plan
1st Layer
Key Result
Area
2nd Layer
Key Performance
Satisfied
Customer Index
Market
Share (%)
3rd & 4th Layer
Process Performance
Measures
0.65
0.6 0.7
0.7 0.6 0.8
0.4 0.8
0.5 0.4 0.5 0.8 0.4
0.54
0.58
0.67
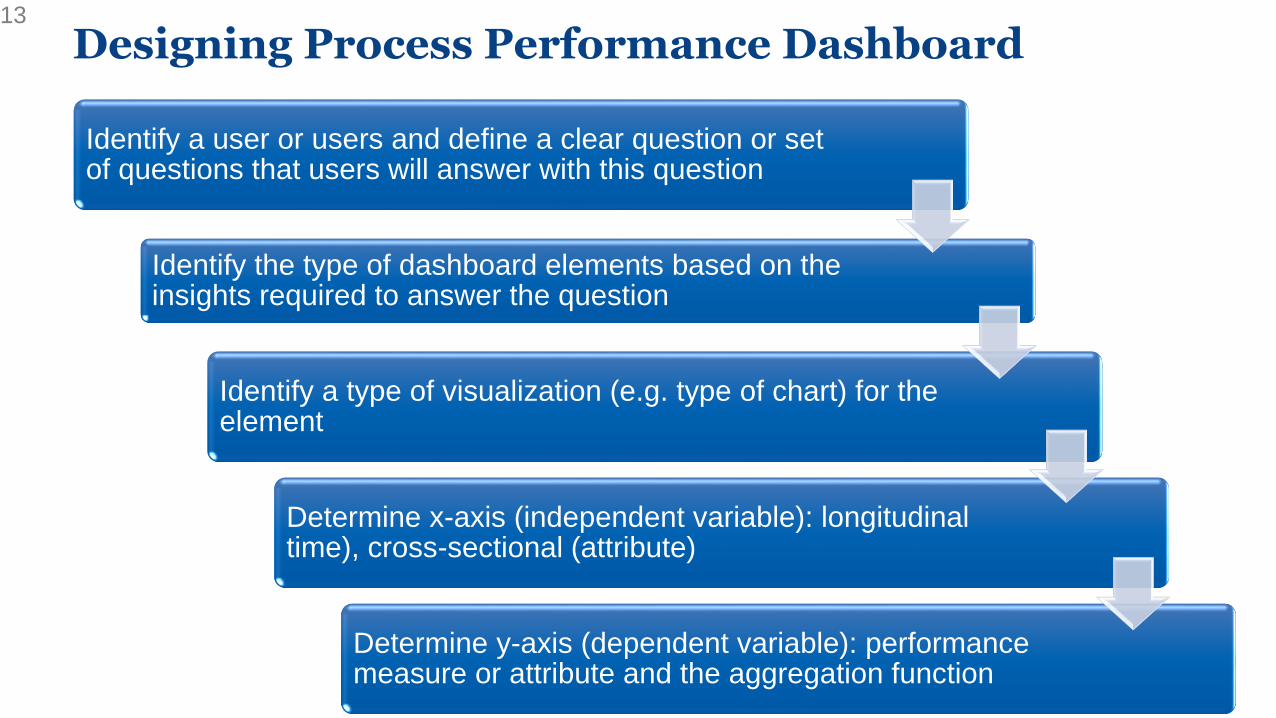
Designing Process Performance Dashboard13
Identify a user or users and define a clear question or set of questions that users will answer with this question
Identify the type of dashboard elements based on the insights required to answer the question
Identify a type of visualization (e.g. type of chart) for the element
Determine x-axis (independent variable): longitudinal time), cross-sectional (attribute)
Determine y-axis (dependent variable): performance measure or attribute and the aggregation function

Process performance dashboard elements
14
Indicator: Card displaying a process performance measure
• Example: cycle time (average, median, max, min, etc.)
Trend chart: A longitudinal performance chart that traces a performance measure over time
• Chart displaying the number of active cases (WIP) over time
Performance distribution chart: A histogram displaying the performance of the process across different components
• Histogram of total effort (total processing time) spent per resource
Cross-sectional chart: A chart that traces a performance measure across different segments (e.g. business units, countries, activity, etc.)
• Chart displaying the cycle time of the process per country
Detailed Tables
• Tables providing detailed performance statistics per case, per activity, etc.
Performance Dashboards
Process Mining
Database
Enterprise
System
Business Process Monitoring
Event log
Event stream
15

Process Mining16
16
event log
discovered process model
Automated Process Discovery

Enter Loan Application
Retrieve Applicant
Data
Compute Installments
Approve Simple
Application
Approve Complex
Application
Notify Rejection
Notify Eligibility
CID Task Time Stamp …
13219 Enter Loan Application 2007-11-09 T 11:20:10 -
13219 Retrieve Applicant Data 2007-11-09 T 11:22:15 -
13220 Enter Loan Application 2007-11-09 T 11:22:40 -
13219 Compute Installments 2007-11-09 T 11:22:45 -
13219 Notify Eligibility 2007-11-09 T 11:23:00 -
13219Approve Simple Application
2007-11-09 T 11:24:30 -
13220 Compute Installements 2007-11-09 T 11:24:35 -
… … … …
Process Map
(directly follows graph)
BPMN process model
Automated Process Discovery
17

A process map of an event log is a graph where:
• Each activity is represented by one node
• An arc from activity A to activity B means that B is directly followed by A in at
least one case in the log
Process maps (aka Directly-follows graphs)
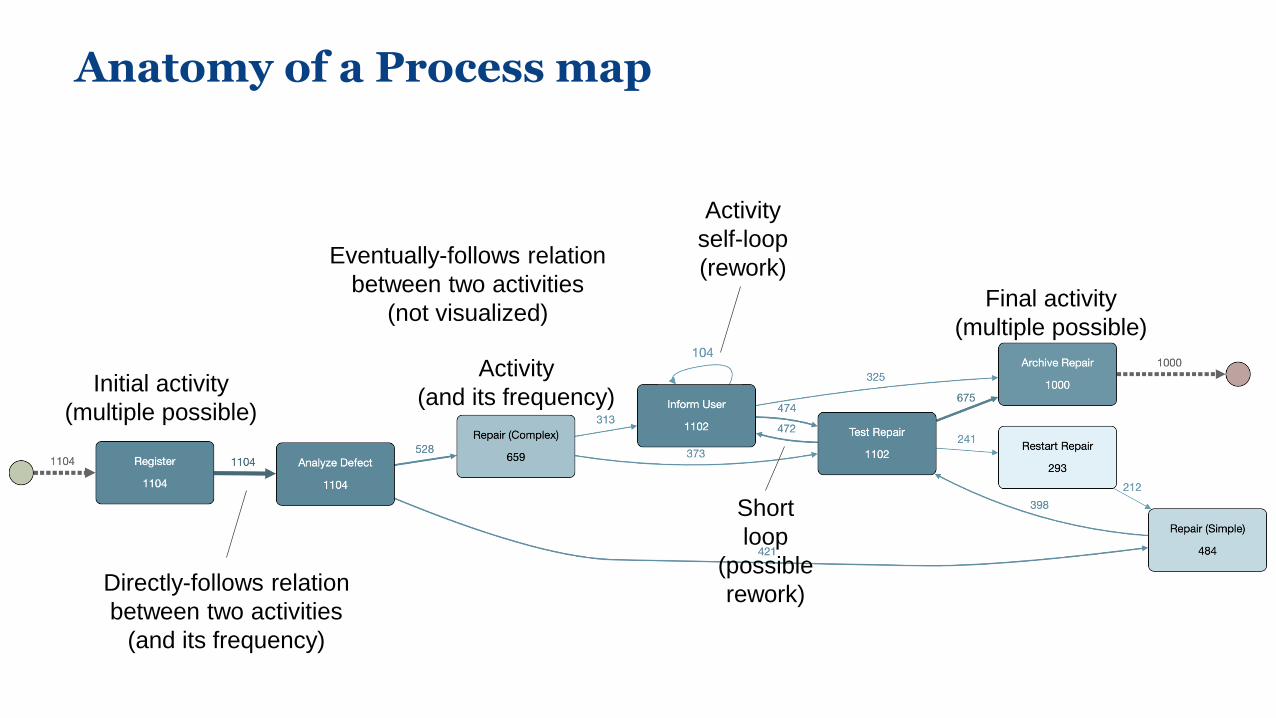
Anatomy of a Process map
Activity
(and its frequency)
Directly-follows relation
between two activities
(and its frequency)
Initial activity
(multiple possible)
Final activity
(multiple possible)
Activity
self-loop
(rework)
Short
loop
(possible
rework)
Eventually-follows relation
between two activities
(not visualized)

Nodes in a process map can be coloured, and arcs’ thickness can be changed,
to capture:
• Frequency: How often a given activity or directly-follows relation occurs?
• Duration: processing times and cycle times for activities, waiting times for
directly-follow relations
• Other attributes: some tools support enhancement by other attributes, e.g.
cost, revenue, sales volume etc., if these data attributes are available
Process maps: overlays
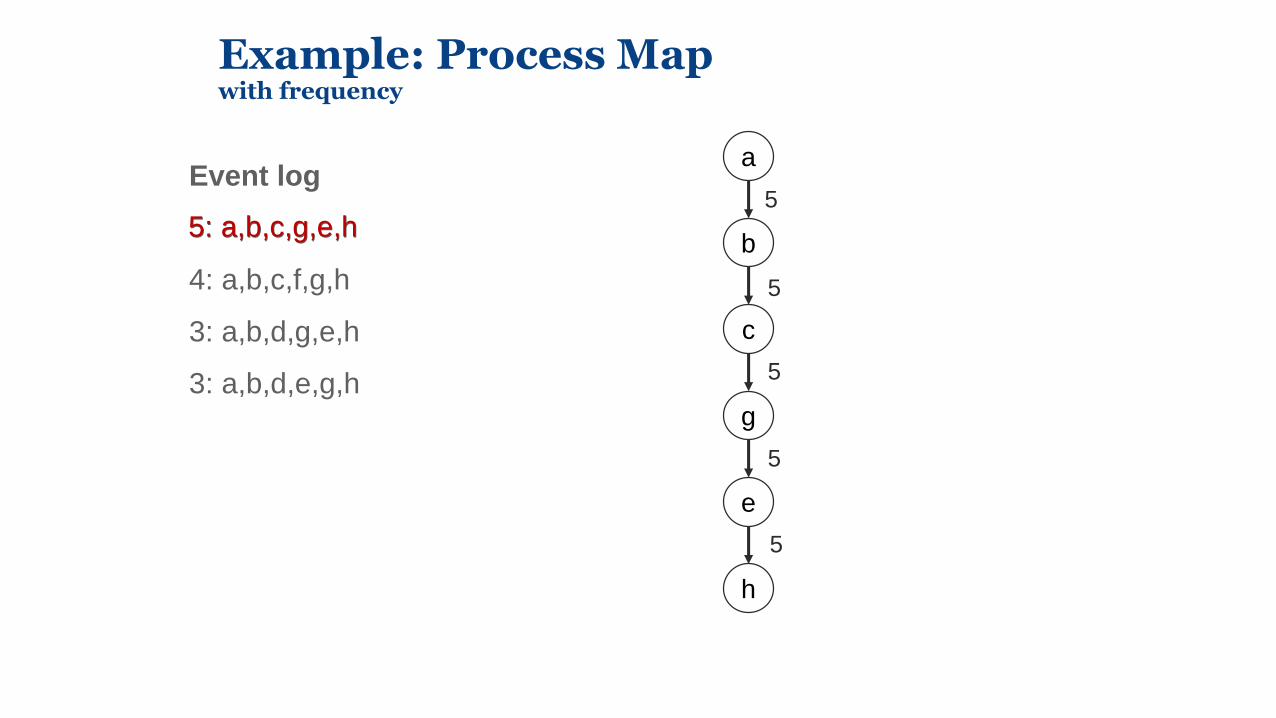
Example: Process Mapwith frequency
Event log
5: a,b,c,g,e,h
4: a,b,c,f,g,h
3: a,b,d,g,e,h
3: a,b,d,e,g,h
a
b
c
g
e
h
5
5
5
5
5
5: a,b,c,g,e,h

Event log
5: a,b,c,g,e,h
4: a,b,c,f,g,h
3: a,b,d,g,e,h
3: a,b,d,e,g,h
a
b
c
g
e
h
5
5
5
5
5
+ 4
+ 4
f4
4
4
Example: Process Mapwith frequency

Event log
5: a,b,c,g,e,h
4: a,b,c,f,g,h
3: a,b,d,g,e,h
3: a,b,d,e,g,h
a
b
c
g
e
h
5
5
5
5
5
+ 4
+ 4
f4
4
+ 3
d
3
+ 3
+ 3
3
4
Example: Process Mapwith frequency
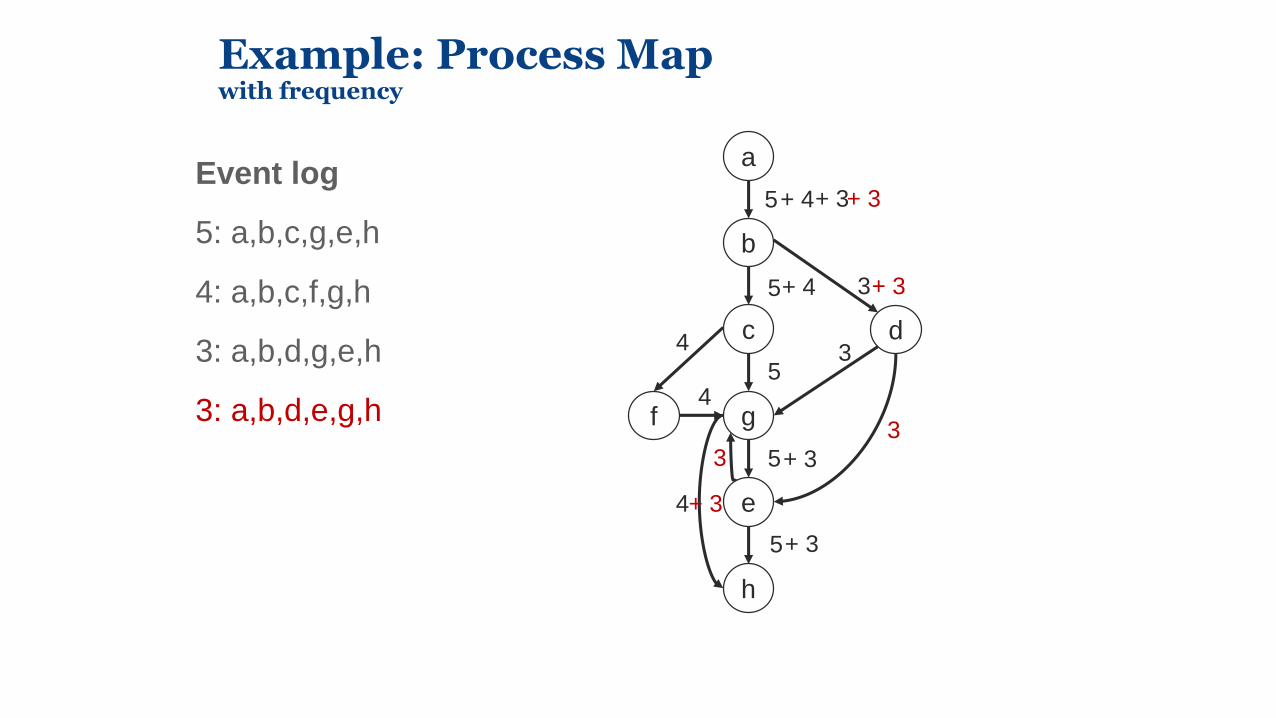
Event log
5: a,b,c,g,e,h
4: a,b,c,f,g,h
3: a,b,d,g,e,h
3: a,b,d,e,g,h
a
b
c
g
e
h
5
5
5
5
5
+ 4
+ 4
f4
4
4
+ 3
d
3
3
+ 3
+ 3
33
+ 3
+ 3
+ 3
Example: Process Mapwith frequency

Event log
5: a,b,c,g,e,h
4: a,b,c,f,g,h
3: a,b,d,g,e,h
3: a,b,d,e,g,h
a
b
c
g
e
h
15
9
5
8
8
f4
4
7
d
6
3
33
Example: Process Mapwith frequency
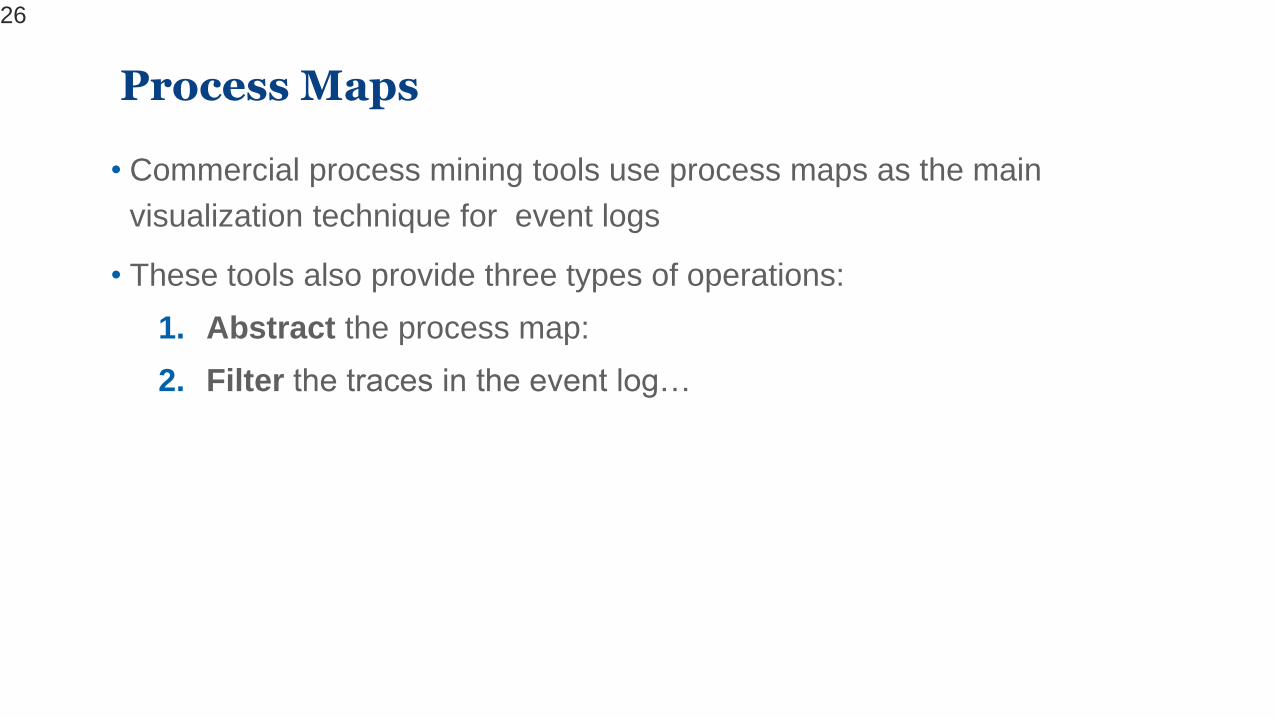
Process Maps
• Commercial process mining tools use process maps as the main
visualization technique for event logs
• These tools also provide three types of operations:
1. Abstract the process map:
2. Filter the traces in the event log…
26

Abstraction and Filtering
• Real-life processes are really messy
• Let’s have a look at a few of them…

Examples
Patient Treatment Process @ Hospital
(Sepsis infections)
28
IT Incident Management @ Bank

Common process mining tools provide abstraction capabilities on top of process
maps, to:
• Show only most frequent activities
• Show only most frequent arcs
Some tools offer further abstraction capabilities to:
• Show only least frequent activities
• Show only least frequent arcs
• Show only fastest/slowest activities
• Show only fastest/slowest arcs
Process map: Abstraction

Demo Time!

Case variant filter
Retain/remove cases that follow a certain sequence of activities
Case ID filter
Retain/remove cases with a specific ID
Attribute filter
Retain/remove cases that fulfil a given condition:
• Single dimension: e.g. all cases that have an event “Amend purchase order”
• Two-dimensional: e.g. all cases where activity “Amend purchase order” has been performed by
Luke or Jane
Timeframe filter
Retain/remove cases that are active/contained/start or end in a given timeframe (e.g. from 1 Jan to
31 July 2019)
Filtering: Case filtersD

Performance filter
• Retain/remove cases whose performance measure (e.g. case duration, avg waiting time) is above or
below a given value (e.g. all cases that last more than 5 days)
• Retain/remove cases where a given node or arc has a given duration range (e.g. all cases whose activity
“Create invoice” taken between 10 and 20 min)
Path filter
• Retain/remove cases where there is a pair of events that fulfils a given condition (e.g. “Create invoice”
directly or eventually followed by “Approve invoice”). The condition can also involve attributes and time
intervals
• Retain/remove cases that start with or finish with an event that fulfils a given condition (e.g. all traces that
start with “Purchase order received” and finish with “Order cancelled”)
Rework & repetition filter
• Retain/remove cases where certain activities are performed a given number of times
(e.g. keep all cases where activity “Amend purchase order” is done at least twice).
Filtering: Case filtersD
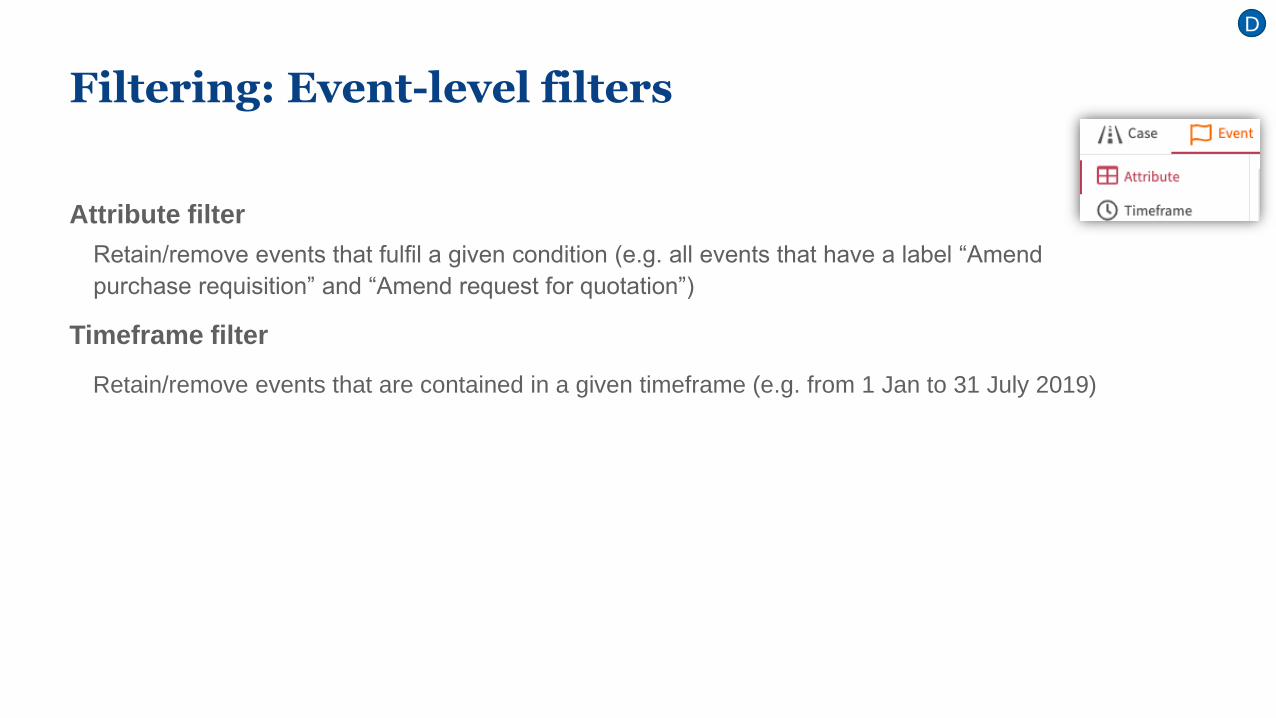
Filtering: Event-level filters
Attribute filter
Retain/remove events that fulfil a given condition (e.g. all events that have a label “Amend
purchase requisition” and “Amend request for quotation”)
Timeframe filter
Retain/remove events that are contained in a given timeframe (e.g. from 1 Jan to 31 July 2019)
D

Demo Time!

Process maps over-generalize: some paths of a process map might actually not exist and
might not make sense
• Example: Draw the process map of [ abc, adc, afce, afec ] and check which cases it can
recognize for which there is no support in the event log.
Process maps make it difficult to distinguish conditional branching,
parallelism and loops
• See previous example… or a simpler one: [ abcd, acbd ]
Solution: automated discovery of BPMN models
Limitations of process maps
a
b c
d
a
b c
d
+
+
a
b
c
e
f d

Discovery of BPMN models
A given configuration of node/arc sliders, and parallelism slider
Note: Apromore uses an algorithm called to turn process maps into process models
D

Process Mining Using BPMN
• To get an intuition of how BPMN models are discovered from an event log,
let’s draw the process maps of the following logs and let’s try to imagine what
is the BPMN process model corresponding to these logs:
• [abc, abd]
• [abcd, acbd]
• [abcd, abcbcd]

38
1. [abc, abd]
2. [abcd, acbd]
3. [abcd, abcbcd]

Automated Process Discovery: Analysis TemplateWhat? How?
Flow Analysis1. Analyze the process structure & main
case variants2. Identify parallelism, branching points &
rework loops3. Analyze case entry and exit points, and
check for incomplete cases
Visualize the most frequent case variant(s) using the Case inspectorUse abstraction sliders to focus on the most frequent activities and dependencies.Switch to BPMN view; inspect the behavior around the gatewaysCheck the dotted lines in the process map (arcs emanating from the start event or leading to the end event). Unexpected dotted lines indicate some cases are incomplete
Filtered Flow AnalysisAnalyze different components or slices of the process separately
Use event filtering to retain/remove subsets of activities, e.g. separate automated or non-core activities, or separate activities belonging to two different systems.
Frequency analysisAnalyze the most frequent activities and relations
Use the Activity inspectorUse the color-coding to find most frequent arcsConsider switching between frequency metrics (max, avg, …)Use the Activities tab in performance dashboard (Apromore EE)
Handoff analysisAnalyze handoffs between workers, teams, groups, org units
Switch between perspectivesUse the Resource and Other Attributes tabs in the Dashboard
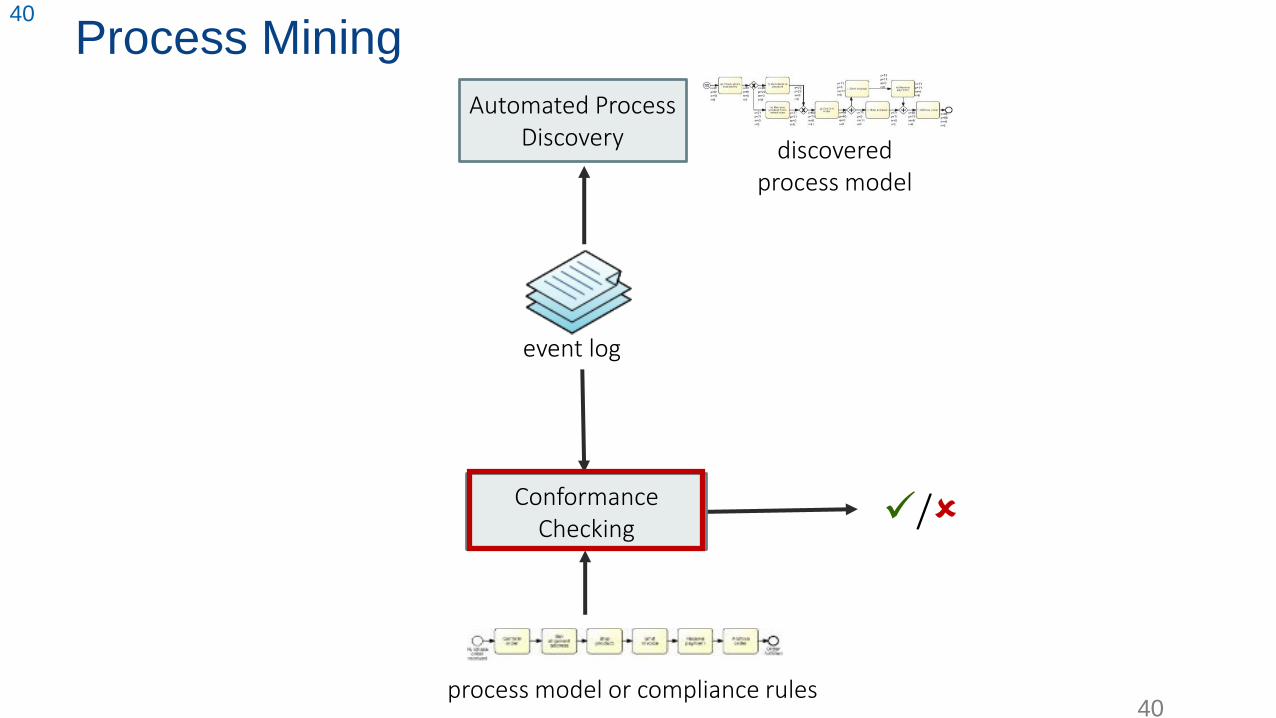
Process Mining40
40
/
event log
discovered process model
Automated Process Discovery
Conformance Checking
process model or compliance rules

Given an event log and a set of business rules or a process model, find,
describe, and measure the impact of differences between the rules/model and
the log.
Conformance checking
≠

Types of Conformance Checking
1. Rule-Based Conformance Checking
• Checking that a process follows certain rules
2. Model-Based Conformance Checking
• Comparing the behaviour captured in the process model against the one in the event log
42

Checking whether regulations and control measures embedded in processes are
followed in practice.
Common types of compliance rules:
Certain activities may be mandatory e.g. a specific approval to proceed with an
application.
Customer agreements on service quality define timeframes at the case, milestone
or activity transition level.
Certain activities must be executed by different employees, e.g. creation and
approval of an invoice.
Rule-Based Conformance Checking

Conformance Checking Levels
Accordingly, we can identify the following compliance checking levels:
• have all mandatory activities been performed? Have activities been performed in the
right order and with the right frequency?
• has a given timeframe between activities, process milestones or for the end-to-
end process been adhered to?
• did everyone obey the segregation of duties?
• explore highly-infrequent behavior to identify possible deviations from the
standard process
Procedure:
1. Define compliance rules (based on attribute-value pairs, activity orders or performance
targets)
2. Apply one or more filters to keep cases that violate the rules in question
3. If needed, switch perspective to highlight non-compliance issues (e.g. show resources
that violate a segregation of duties principle)
4. Assess impact on process performance

Flow Compliance Checking
1 Mandatory tasks: Have all mandatory tasks been completed?
To check whether all your tasks have been executed at least once, change the frequency view to “Min.” in the visualization settings of your Process Discoverer.
The numbers in your activities now indicate the minimum amount of times it has been completed in all process instances.
1
2 4 3
5

Temporal Compliance Checking
2 Prescribed time frame: Has the given time frame been adhered to?
Select the “Path” filter and define the steps that must be performed in a defined time frame. Use “Time interval” to then set your temporal figures.
Example:Compliance rule: Waiting time between “Inform User” and “Repair (Simple)” should not exceed 1 hours.
“Time Interval“ Filter: > 1 hour, so that only those cases are retained that do not comply with the compliance rule.

Temporal Compliance Checking
1
Performance filter can help to check for end-to-end SLA violations.
For example, retain only those cases that gets completed in at most 1 hour.
Prescribed time frame: Has the given time frame been adhered to?

Resource Compliance Checking
1 Segregation of duties: Did everyone obey the segregation of duties?
To check whether the segregation of duties has been breached, select a “Path” filter. Now, set another filter which indicates that the same resource must have completed the tasks (e.g. creating & approving an invoice)

Resource Compliance Checking
1 Unexpected resource assignments
User the Attribute filter with
two attributes (primary and
secondary) to retrieve cases
where a given activity was
performed by a given
resource (or any other
combination of attributes)

What? How?
Flow compliance checking1. Check skipped mandatory activities
2. Check forbidden repetitions.
3. Check activity exclusion or co-
occurrence relations
Identify skipped activities in the process map or BPMN model
Visualize process map with the min/max frequency metrics
Visualize min/max statistics in Activity tab of the dashboard (EE)
Use Path filter (directly-follows or eventually-follows)
Temporal compliance checkingCheck temporal constraints violations
Use performance filter (to check for end-to-end SLA violations)
Use Path filter (eventually-follows) with a duration constraint to identify
violations of temporal constraints between two activities
Resource compliance checkingCheck four-eyes principle or same-case-
hander principle
Check if an activity has been performed
by a resource who should not do so.
Use Path filter (eventually-follows) and require the same Resource (or
different resources)
Use the Attribute filter and search with “Activity” as the primary
attribute and “Resource” as secondary attribute to check if a resource
performed an activity they were not supposed to do.
Conformance Checking: Analysis Template

Demo Time!

Process Mining52
52
/
event log
discovered process model
Automated Process Discovery
Conformance Checking
Performance Mining
input process model
Enhanced process model

Extract process execution performance in an aggregate or detailed level (i.e. at the level of
individual activities and directly-follows relations)
Analytics:
• Duration-enhanced process maps (activity, resource perspective…)
• Duration-enhanced BPMN models
• Process performance dashboards
Analysis types:
• Bottleneck analysis
• Workload analysis
• Rework analysis
Process performance mining: Analytics & Analysis types

Bottleneck analysis in the Activity perspective
Resource-capacity
bottleneck
(all incoming
arcs are slow)
[waiting bottleneck]
D
Activity
bottleneck
(activity is slow)
Slow handoff
between activities
(transition is slow)
[waiting bottleneck]

Bottleneck analysis in the Resource perspectiveD
Slow handoff
between
specific resources
[waiting bottleneck]
Resource bottleneck

Workload analysis: overused vs underused resourcesD
Potentially
underused resource
Potentially overused
resources
• are those with high total frequency and/or high total duration
• are those with low total frequency and/or low total duration

Rework analysis
Activity 2
Activity 3
Rework means repetition of activities within the same case:
an activity takes place n times in a row
two activities are repeated one
after the other. Note: this may be confused with parallelism
several activities are executed several
times in sequence.
To analyze repetitions, one can answer the following questions:
(1) What type of repetition is present?
(2) How often is an activity / series of activities repeated?
(3) How many cases showcase this repetition? How often does it occur?
(4) Which cases are affected exactly? And how do they differ from cases
where there is no repetition?
Activity 1
Activity 4
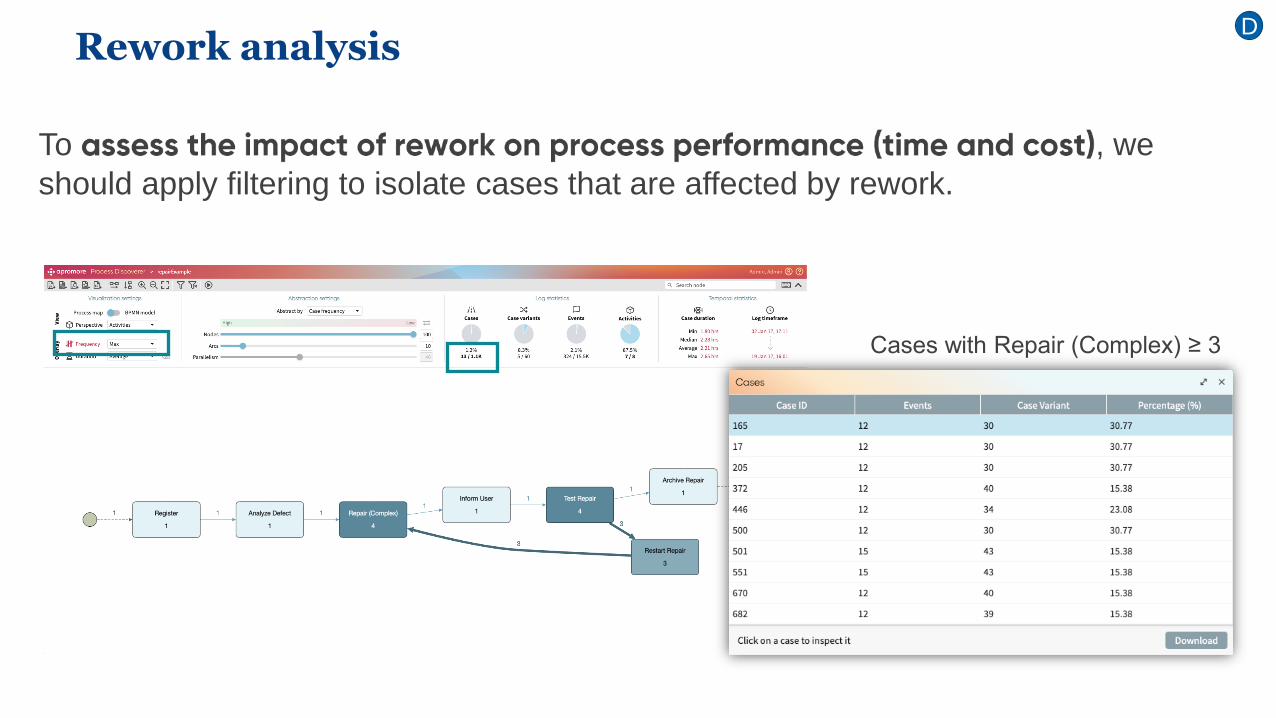
To , we
should apply filtering to isolate cases that are affected by rework.
D
Cases with Repair (Complex) ≥ 3
Rework analysis

What? How?
Bottleneck analysis• Identify activity bottlenecks
(high-effort activities) • Identify waiting bottlenecks
(slow handoffs and capacity bottlenecks)
• Identify resource bottlenecks
• In the process map, select the duration overlay (average or total duration): activity bottleneckshave long processing time; slow handoffs between activities are arcs with long waiting times; resource-capacity bottlenecks relate to activities with all/most incoming arcs with long waiting times
• Switch to the Resources perspective in the map: slow handoffs between resources are arcs with long waiting times; resource bottlenecks are resources with long avg duration (slow resources)
• Use slider with Average duration to focus on slowest or fastest nodes/arcs• Use Activities tab in Dashboard to visualize activity processing times• Use Animation plugin to visualize the build-up of bottlenecks.
Workload analysis• Identify overused vs
underused resources/idleness waste
• Analyze resource workload
• In the Resources perspective: overused resources have high total frequency or high “total duration”; underused resources have low total frequency and low total duration
• Use also the Resources tab in Dashboard to visualize resource workload distribution• Use Filtering to focus on cases where the resource(s) with the highest workload are involved.
Rework analysisIdentify defects/errors and rework waste
• Use the Max frequency overlay in the process map to visualize the max amount of repetitions of each activity / transition
• Use the Case > Rework & repetition filter to retain cases with activity repetition; use the Case > Path filter with eventually-follows relation between an activity and itself to isolate cases with specific loops
• Use the chart in the Activities Dashboard to visualize the distribution of max activity frequencies per case.

Demo Time!
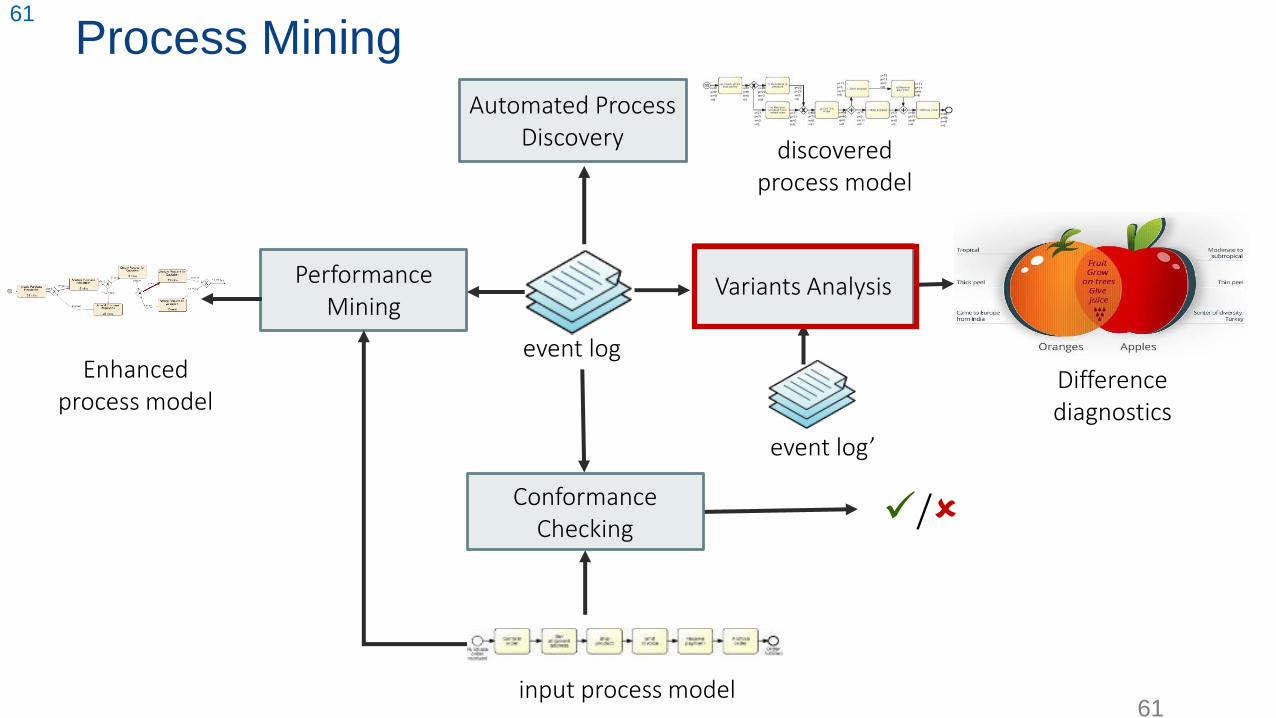
Process Mining61
61
/
event log
discovered process model
Automated Process Discovery
Conformance Checking
Variants Analysis
Differencediagnostics
Performance Mining
input process model
Enhanced process model
event log’

Given two or more logs representing variants of the same process, find the
differences and root causes for variation or deviance between the logs.
Variant analysis
Activity 1
9,5 min
Activity 2
3 min
Activity 3
7 min
Activity 4
2 min
Activity 1
9,5 min
Activity 3
7 min
Activity 5
10 min
On schedule Late The comparison of process variants offers
insights into the the “why”: Why do certain
process cases differ from others?
• Why some take longer than others? (fast vs.
slow cases)
• Why some end successfully, while others
don’t? (positive vs. negative outcomes)
• Why is employee XY more efficient and more
successful when it comes to their activities than
others? (resource XY vs. remaining resources)Activity 4
2 min

Performance
Identify and compare variants based on performance measures and their targets
(e.g. slow vs fast cases)
Logical
Identify and compare variants based on case attributes (e.g. product type, customer
segment, geographic area, loan amount, claim outcome)
Temporal
Identify and compare variants based on different log timeframes (e.g. before and
during COVID)
Variant analysis: drivers

1. Apply the same filter one per variant, to isolate the respective sublog:
• use Case > Performance filter
• use Case > Attribute filter
• use Case > Timeframe filter
2. Save filtered process map and BPMN model back to the repository
3. Analyze the variants using one or more analysis techniques.
Apply filter Save filtered log & BPMN model
DVariant analysis: approach

D
Visual comparison of process maps/BPMN models, to identify structural differences:
• Flow
• Frequency & rework
• Bottlenecks
• etc.
Consider different perspectives (Activities, Resources…)
fast” (up to 45 min) “slow” (more than 1.5 hrs)
[Avg duration for full log: 1.1 hrs]
Variant analysis: comparison via maps/models

Variant analysis: comparison via dashboard
Statistical comparison via dashboard charts and tables. Variants are color-coded (e.g. red for slow,
green for fast cases)
D
Select your filtered logs and
launch the Dashboard. All
dashboard functionalities are
also available when
comparing multiple variants.

What? How?
Flow comparison
Identify notable diffs in
activity flow
• Discover a BPMN process model from the log of each variant. Visualize them side-
by-side. Look for the gateways around each task to detect for example situations
where two tasks are in parallel in one variant, but sequential in the other.
Frequency & rework
comparison
Compare activity or
handoff frequency and
rework
• Compare the maps of the process variants side-by-side (as above), but using the
frequency overlay instead of the duration overlay. This allows us to detect the most
frequent transitions between tasks. Look also for “thick” loop-backs.
• Use a multi-low dashboard to compare frequencies of activities, resources or other
attributes.
Bottleneck comparison
Compare the location
and magnitude of
bottlenecks across
variants
• Use filtering interface to retain all traces that fulfill the condition to belong to a
variant (then repeat for the other).
• Open the maps of the process variants side-by-side and compare the dependencies
(arcs) with the highest waiting times. If the maps are too complex, use the
abstraction slider with the abstraction metric “average duration” and the ordering
from slow (right) to fast (left). Use the arc slider to retain the slowest dependencies.
• Compare activity durations using side-by-side comparison of process maps or a
multi-log dashboard (open the logs of 2+ variants in a single dashboard).
• Consider comparing the two variants using the “resource” perspective to identify
hand-offs between resources.
Variant Analysis Template

Demo Time!
http://apromore.cs.ut.ee

Summary69
69
/
event log
discovered process model
Automated Process Discovery
Conformance Checking
Variants Analysis
Differencediagnostics
Performance Mining
input process model or compliance rules
Enhanced process model
event log’