Embed Size (px)
Citation preview
Statistical LearningIntroduction:
Data Mining Process and Modeling Examples
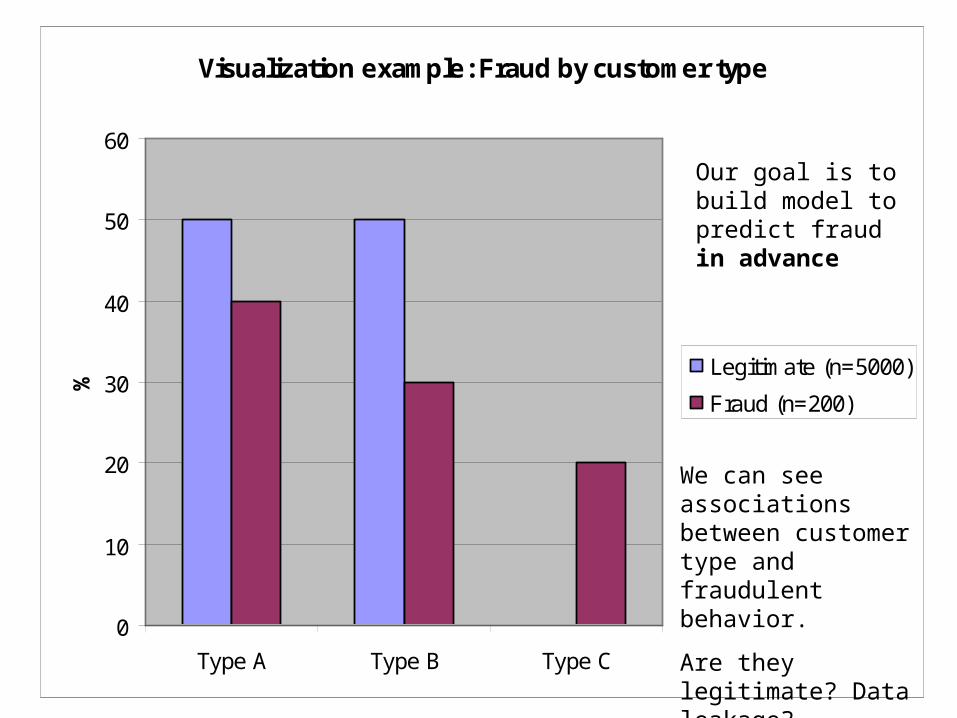
Visualization example: Fraud by customer type
0
10
20
30
40
50
60
Type A Type B Type C
%
Legitimate (n=5000)
Fraud (n=200)
We can see associations between customer type and fraudulent behavior.
Are they legitimate? Data leakage?
Our goal is to build model to predict fraud in advance
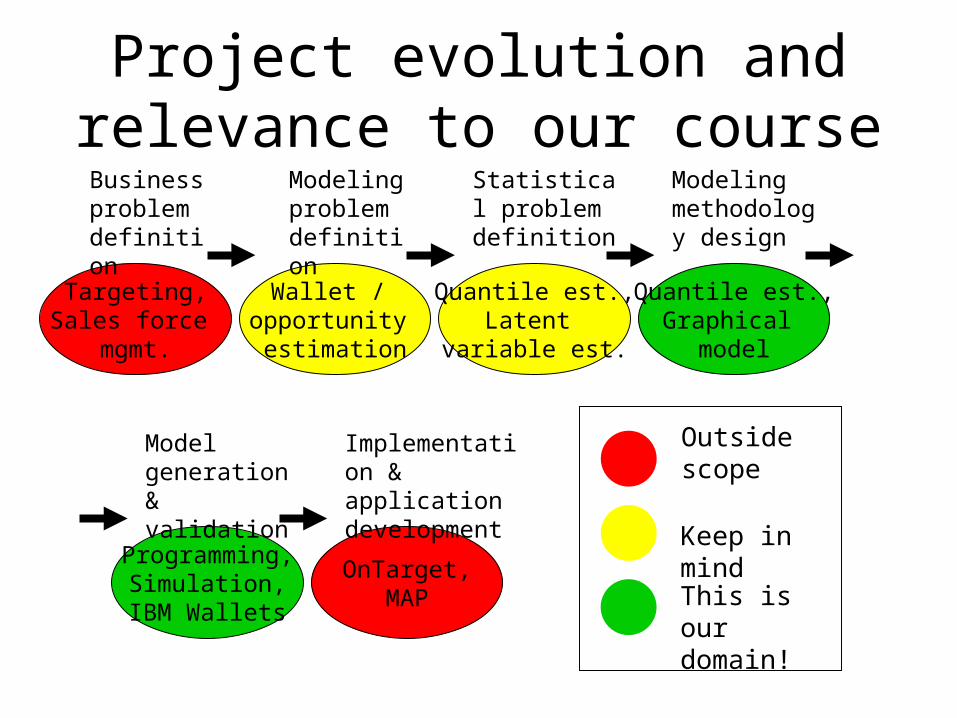
Targeting,Sales force
mgmt.
Business problem definition
Wallet / opportunity estimation
Modeling problem definition
Quantile est.,Latent
variable est.
Statistical problem definition
Quantile est.,Graphical
model
Modeling methodology design
Programming,Simulation,IBM Wallets
Model generation & validation
OnTarget,MAP
Implementation & application development
Project evolution and relevance to our course
Outside scope
Keep in mind
This is our domain!
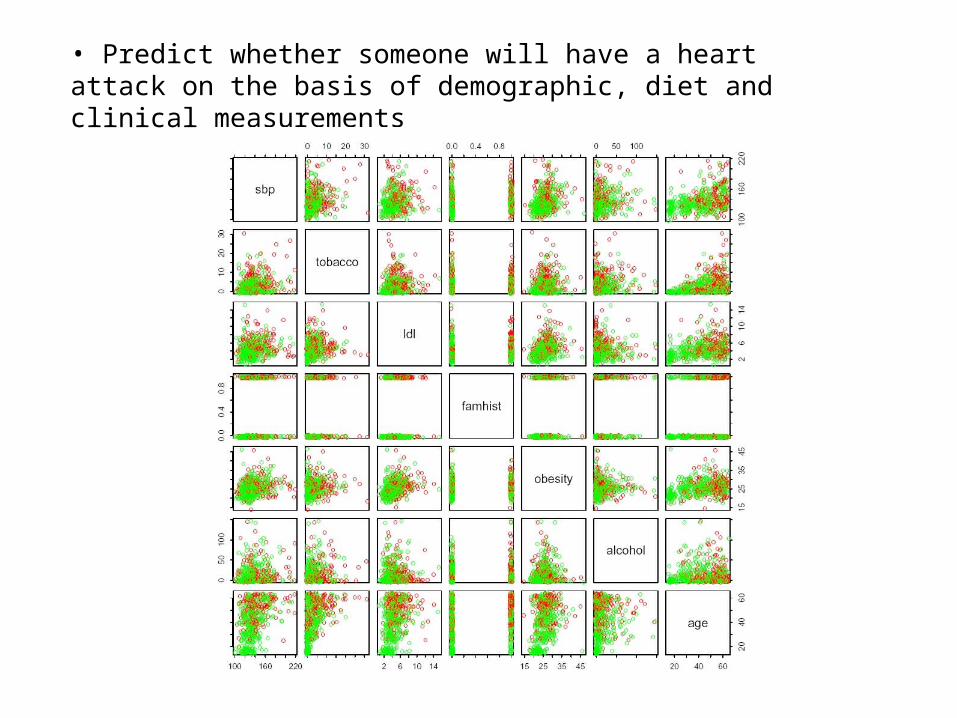
• Predict whether someone will have a heart attack on the basis of demographic, diet and clinical measurements
ESL Chap1 - Introduction
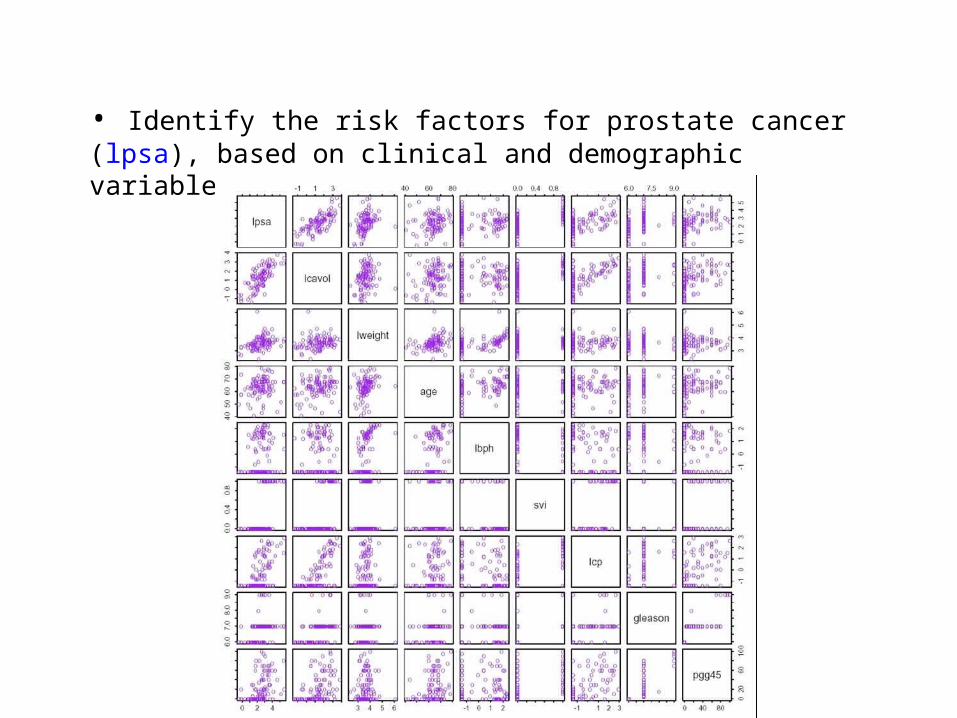
• Identify the risk factors for prostate cancer (lpsa), based on clinical and demographic variables.
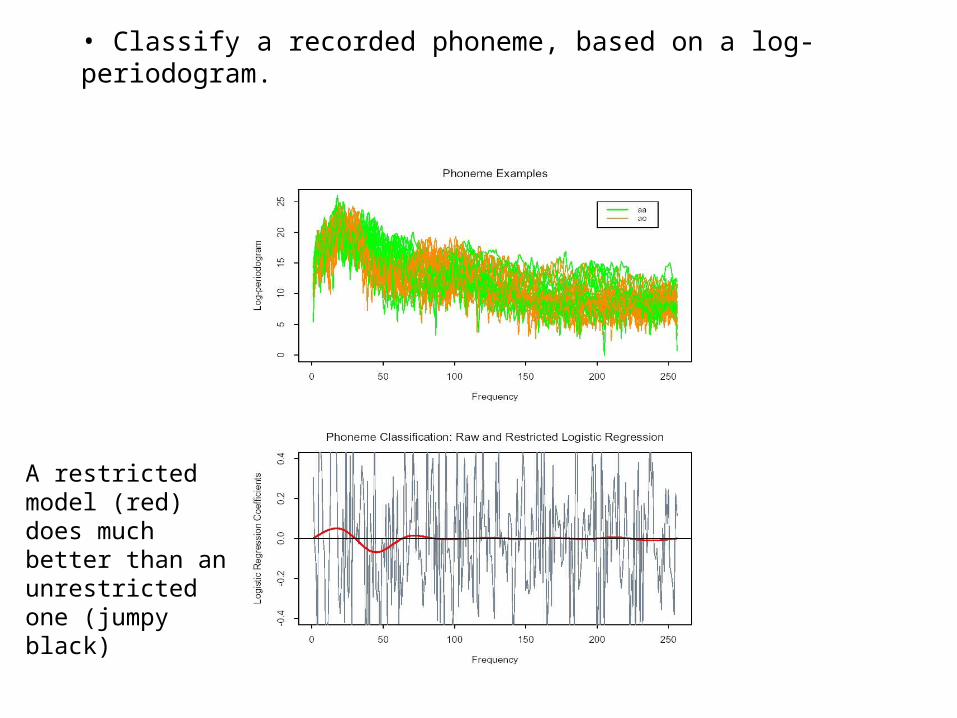
• Classify a recorded phoneme, based on a log-periodogram.
A restricted model (red) does much better than an unrestricted one (jumpy black)
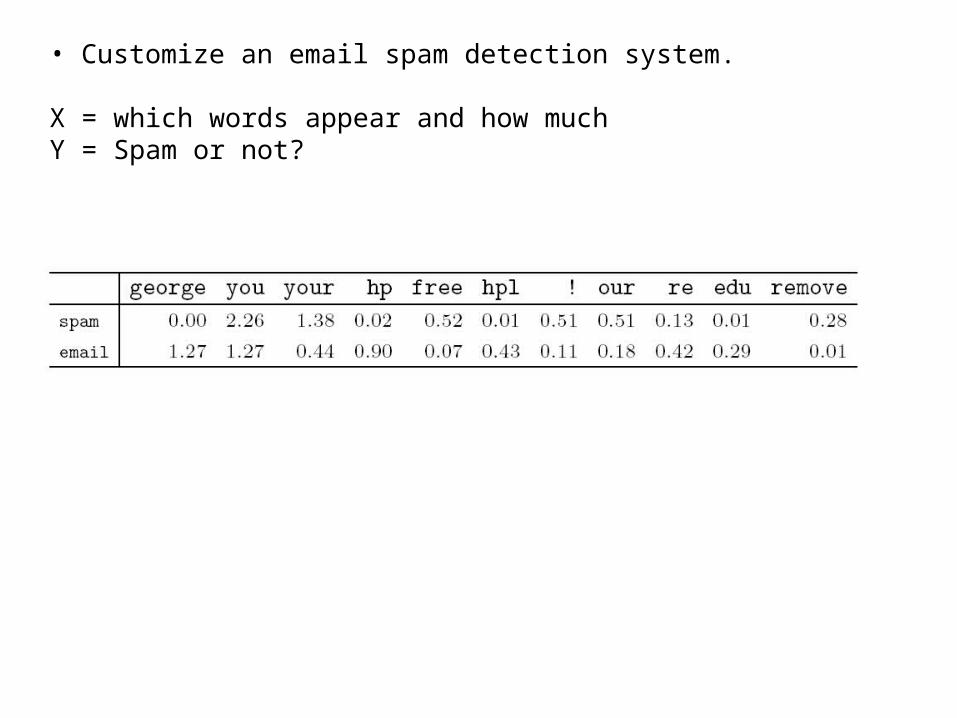
• Customize an email spam detection system.
X = which words appear and how muchY = Spam or not?
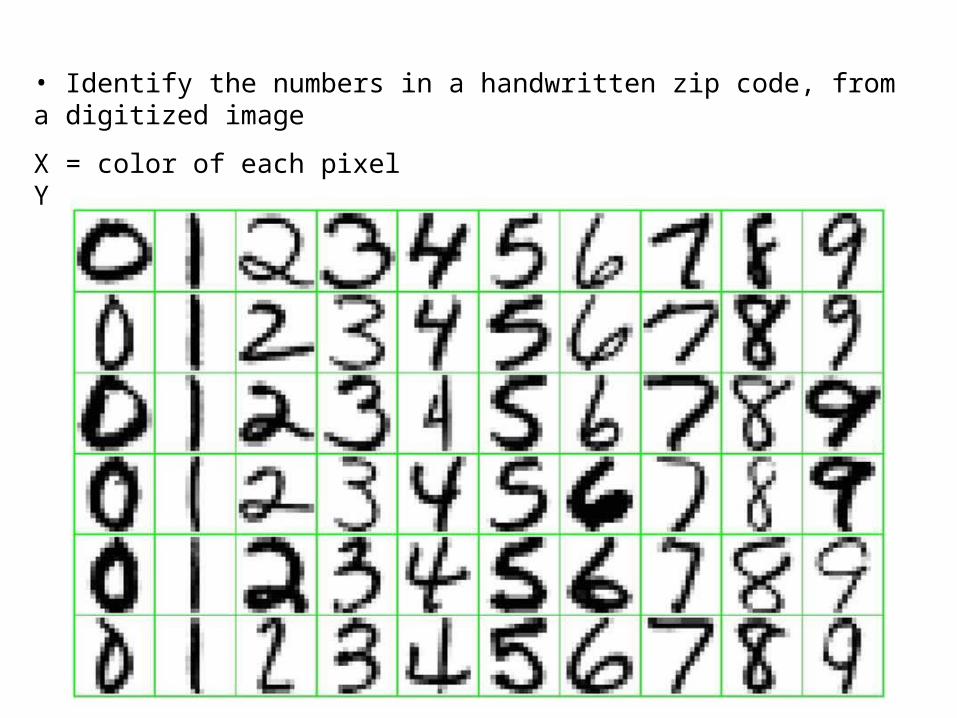
• Identify the numbers in a handwritten zip code, from a digitized image
X = color of each pixelY = which digit is it?
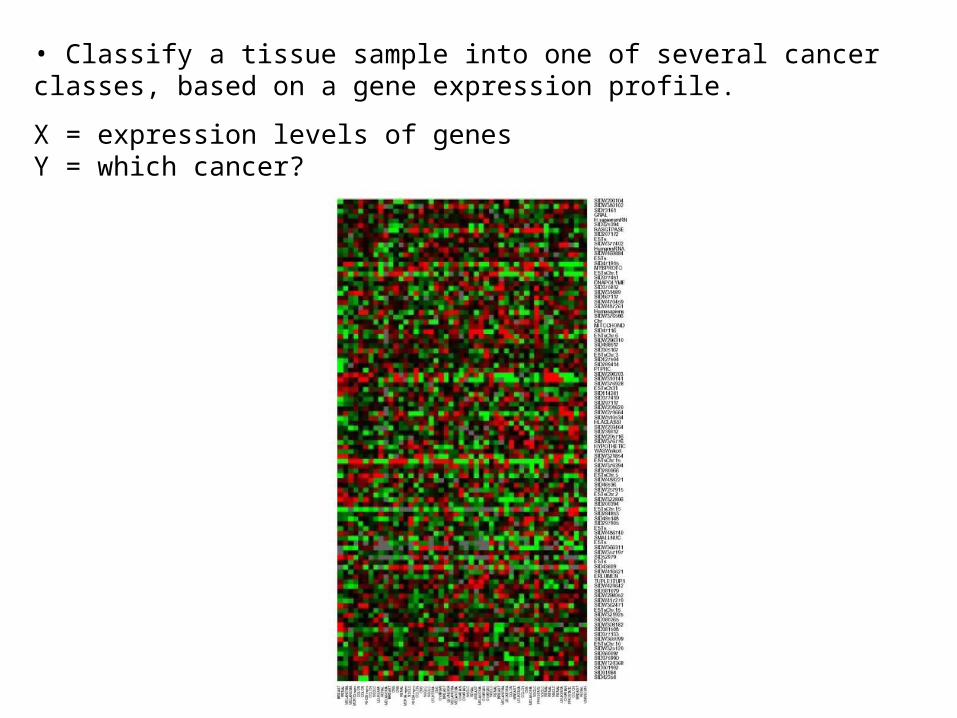
• Classify a tissue sample into one of several cancer classes, based on a gene expression profile.
X = expression levels of genesY = which cancer?
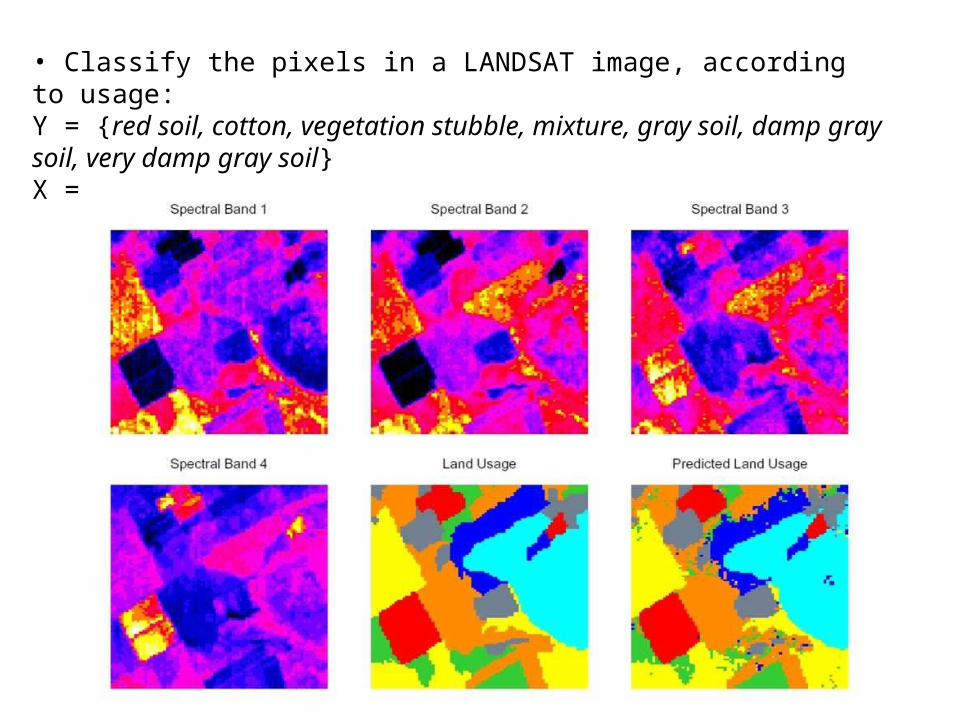
• Classify the pixels in a LANDSAT image, according to usage:Y = {red soil, cotton, vegetation stubble, mixture, gray soil, damp gray soil, very damp gray soil}X = values of pixels in several wavelength bands
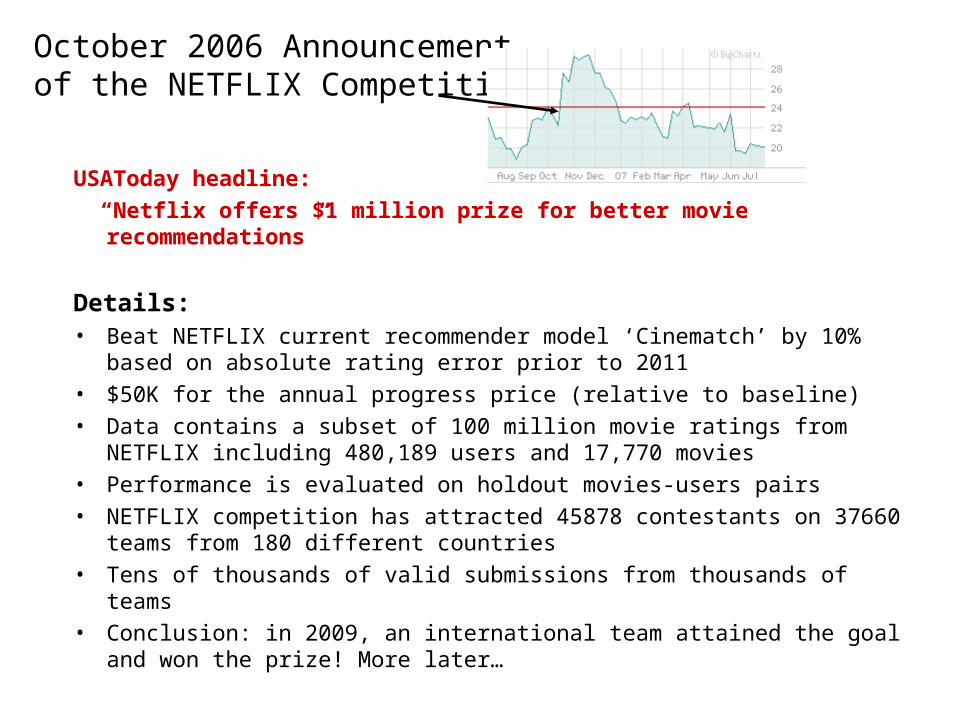
October 2006 Announcement of the NETFLIX Competition
USAToday headline:
“Netflix offers $1 million prize for better movie recommendations”
Details:• Beat NETFLIX current recommender model ‘Cinematch’ by 10% based on
absolute rating error prior to 2011
• $50K for the annual progress price (relative to baseline)
• Data contains a subset of 100 million movie ratings from NETFLIX including 480,189 users and 17,770 movies
• Performance is evaluated on holdout movies-users pairs
• NETFLIX competition has attracted 45878 contestants on 37660 teams from 180 different countries
• Tens of thousands of valid submissions from thousands of teams
• Conclusion: in 2009, an international team attained the goal and won the prize! More later…
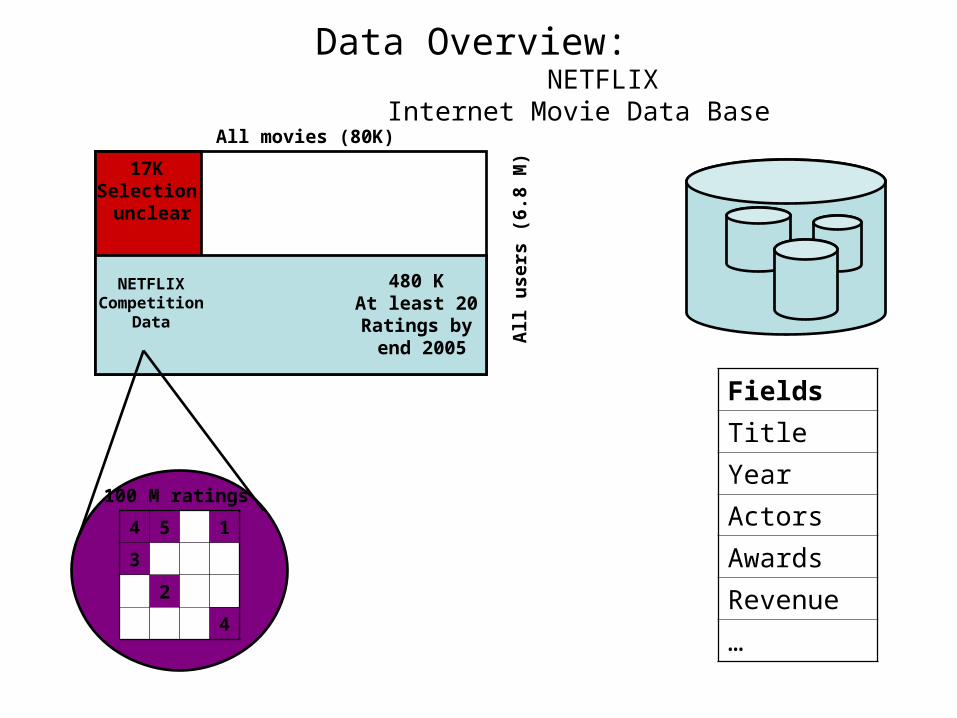
4 5 1
3
2
4
All movies (80K)
All
use
rs (
6.8
M)
NETFLIXCompetition
Data
17KSelection unclear
480 KAt least 20Ratings by end 2005
100 M ratings
Data Overview: NETFLIX Internet Movie Data Base
Fields
Title
Year
Actors
Awards
Revenue
…
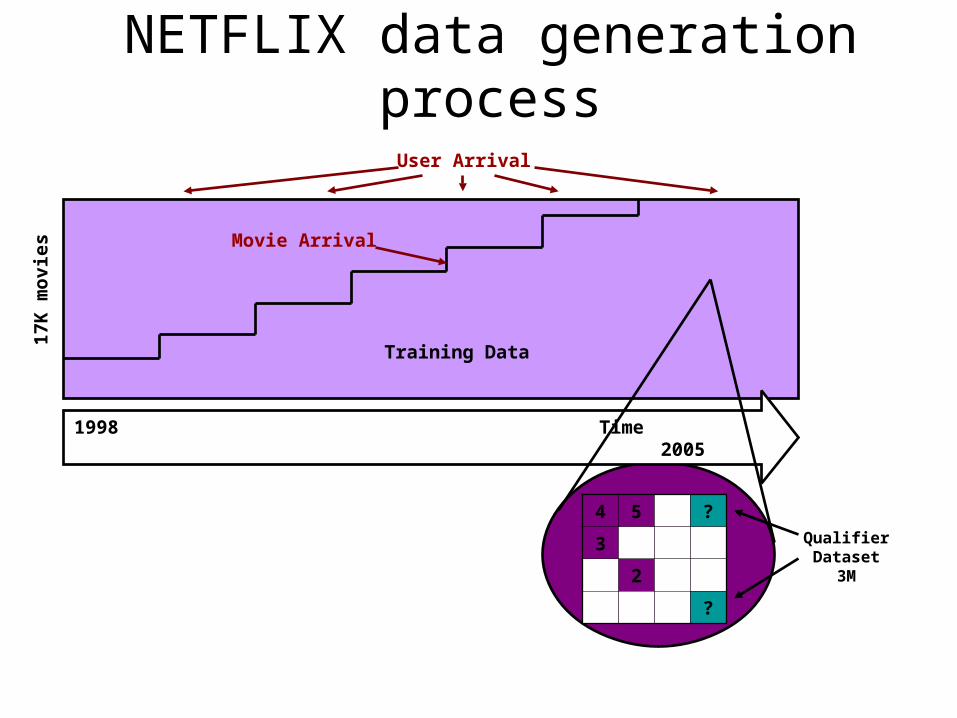
17K
mo
vie
s
Training Data
Movie Arrival
1998 Time 2005
User Arrival
4 5 ?
3
2
?
QualifierDataset
3M
NETFLIX data generation process
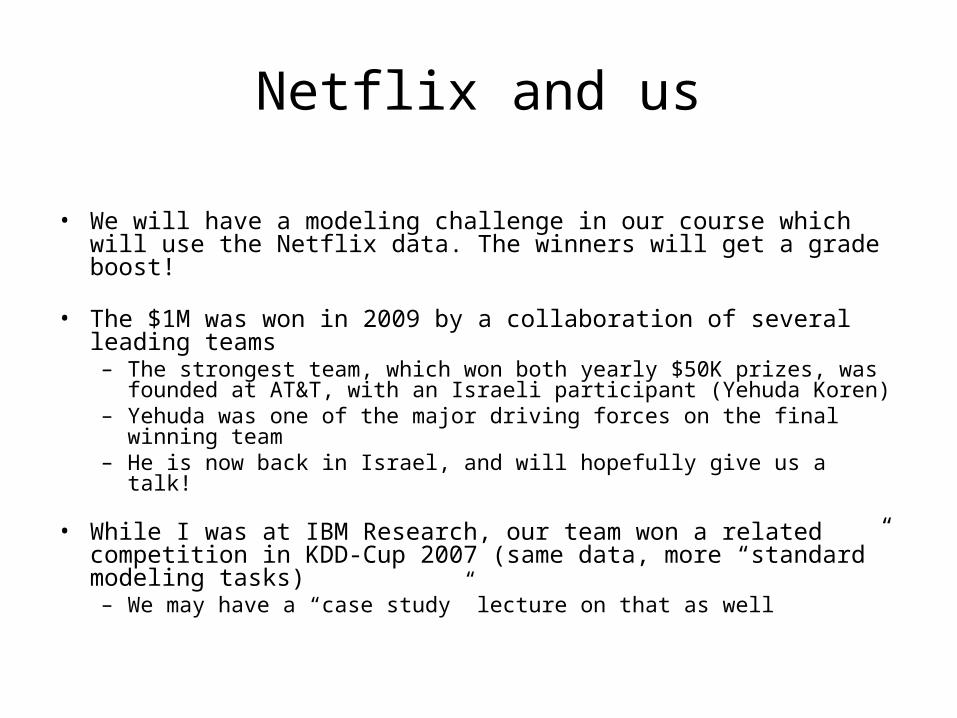
Netflix and us
• We will have a modeling challenge in our course which will use the Netflix data. The winners will get a grade boost!
• The $1M was won in 2009 by a collaboration of several leading teams– The strongest team, which won both yearly $50K prizes, was founded at
AT&T, with an Israeli participant (Yehuda Koren) – Yehuda was one of the major driving forces on the final winning team– He is now back in Israel, and will hopefully give us a talk!
• While I was at IBM Research, our team won a related competition in KDD-Cup 2007 (same data, more “standard” modeling tasks) – We may have a “case study” lecture on that as well