Embed Size (px)
Citation preview
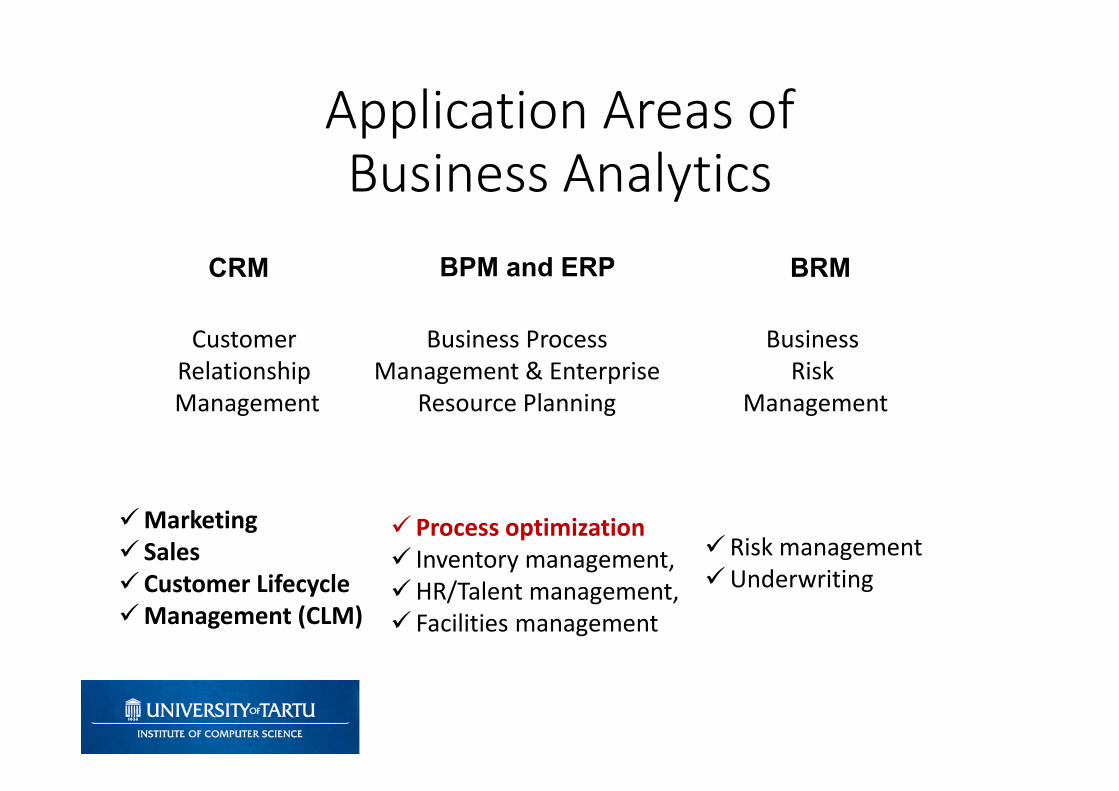
Application Areas of Business Analytics
CRM BRMBPM and ERP
Customer Relationship Management
Business Process Management & Enterprise
Resource Planning
Business Risk
Management
Marketing Sales Customer Lifecycle Management (CLM)
Risk managementUnderwriting
Process optimization Inventory management, HR/Talent management, Facilities management
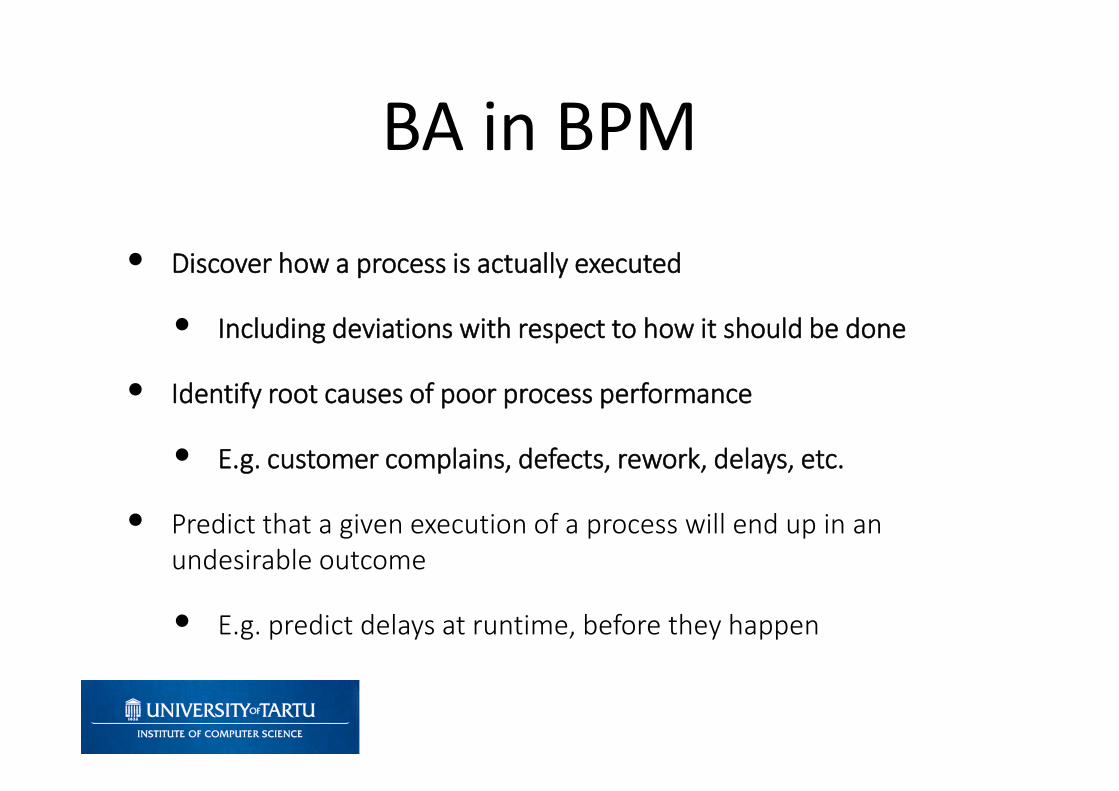
BA in BPM
• Discover how a process is actually executed
• Including deviations with respect to how it should be done
• Identify root causes of poor process performance
• E.g. customer complains, defects, rework, delays, etc.
• Predict that a given execution of a process will end up in an undesirable outcome
• E.g. predict delays at runtime, before they happen
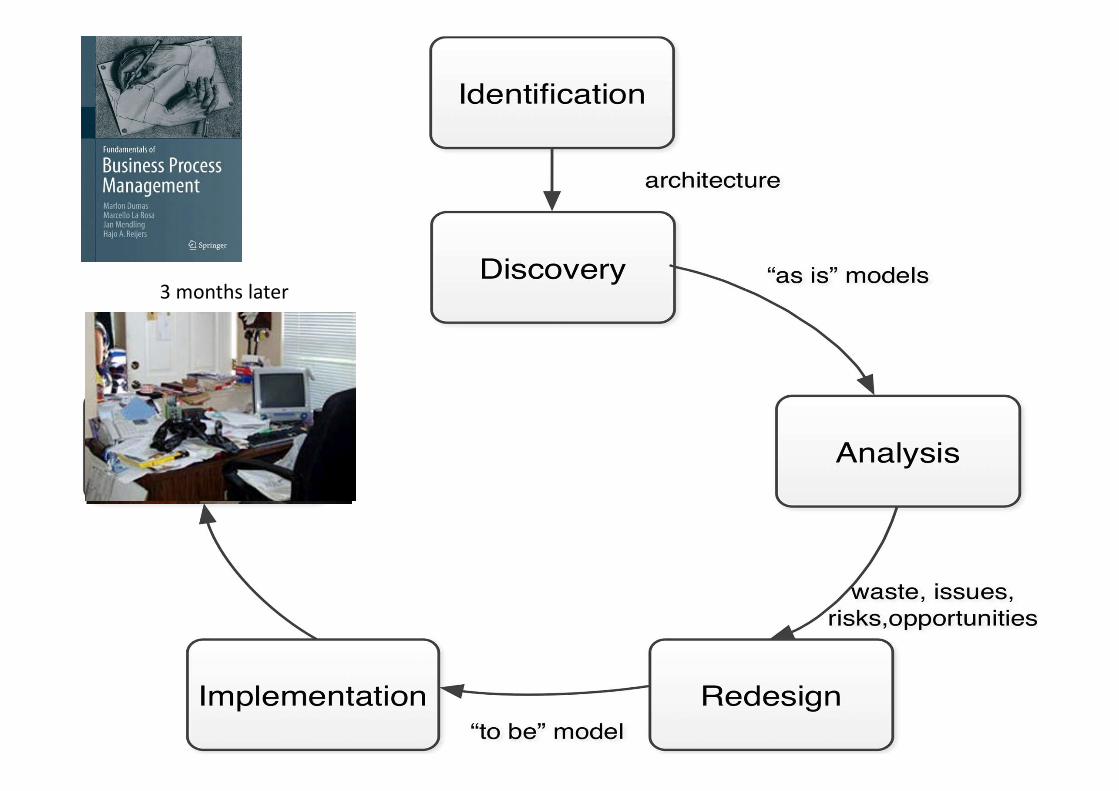
3 months later
PreambleIntroduction to Process Performance Measures
Process performance
If you had to choose between two services, you would typically choose the one that is:
• F…
• C…
• B…
Process performance
If you had to choose between two services, you would typically choose the one that is:
• Faster
• Cheaper
• Better
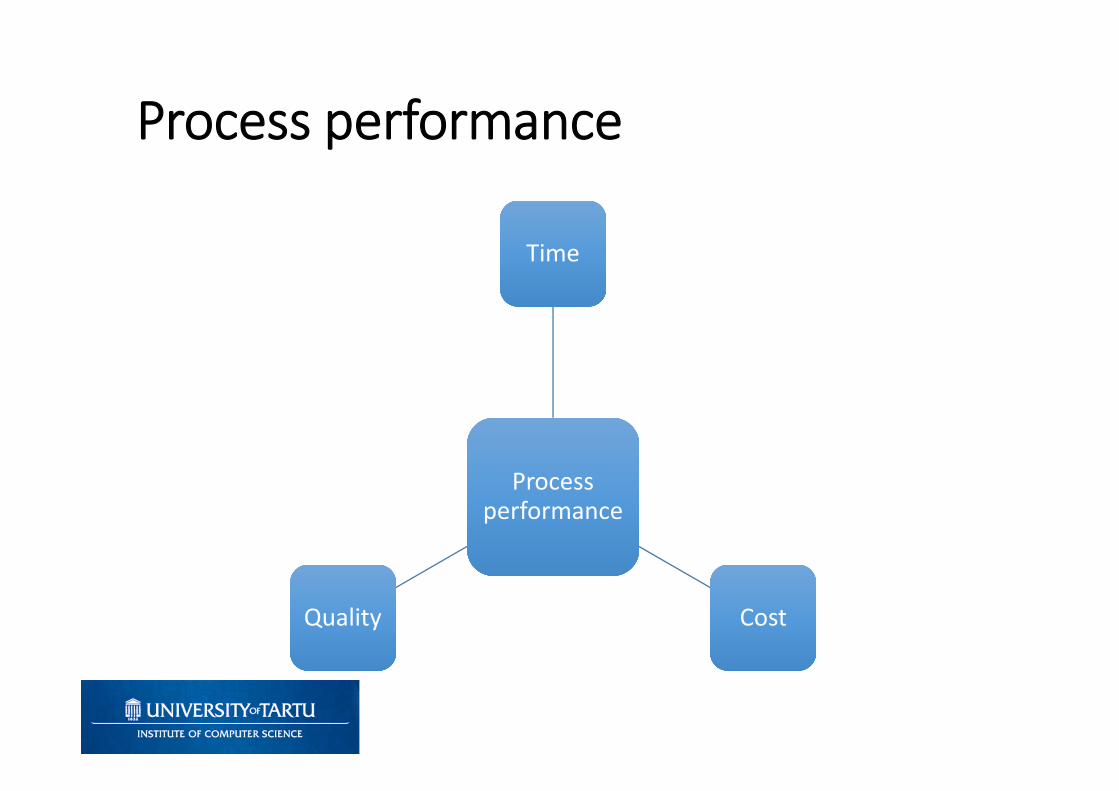
Process performance
Process performance
Process performance
TimeTime
CostCostQualityQuality
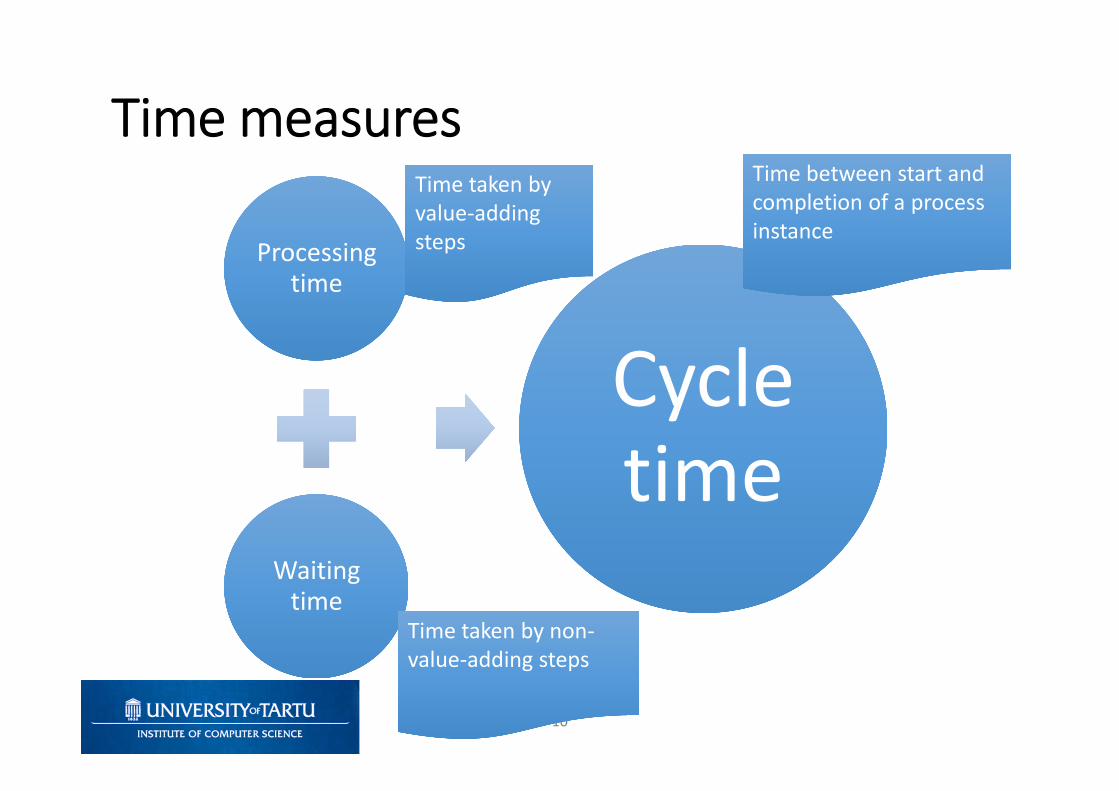
Processing time
Processing time
Waiting time
Waiting time
Cycle timeCycle time
Time measures
10
Time taken by value-adding steps
Time taken by value-adding steps
Time between start and completion of a process instance
Time between start and completion of a process instance
Time taken by non-value-adding stepsTime taken by non-value-adding steps
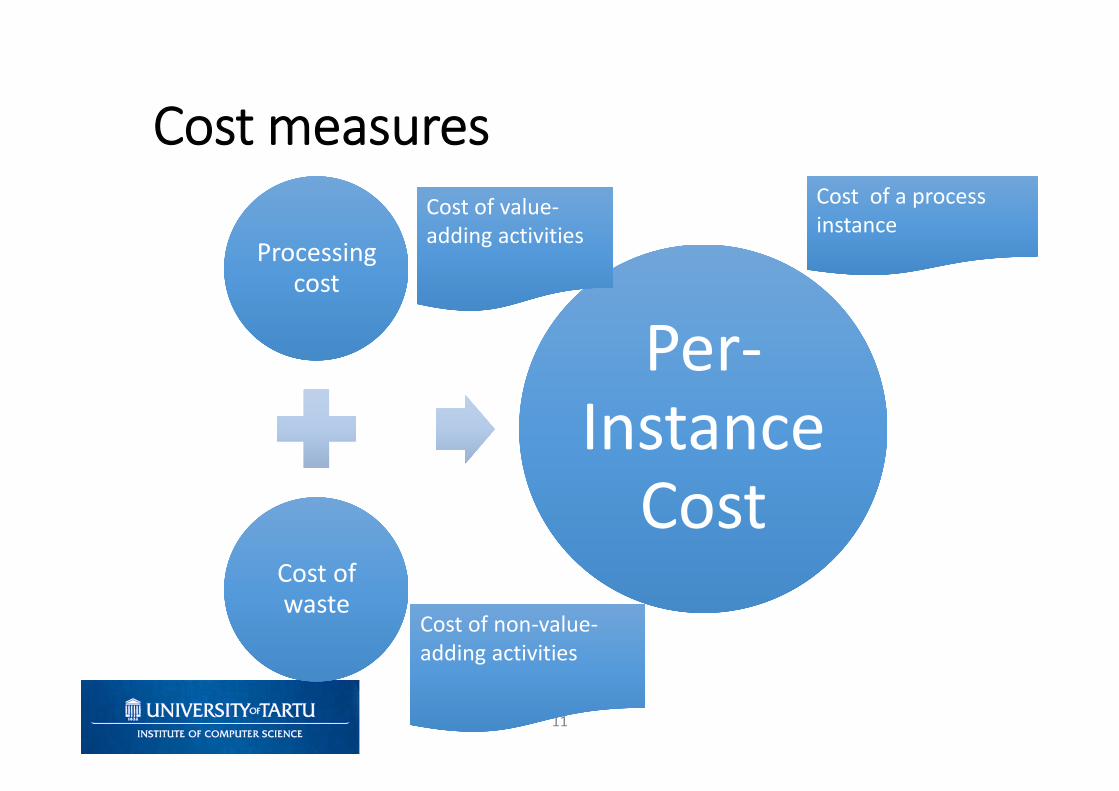
Processing cost
Processing cost
Cost of wasteCost of waste
Per-Instance
Cost
Per-Instance
Cost
Cost measures
11
Cost of value-adding activitiesCost of value-adding activities
Cost of a process instanceCost of a process instance
Cost of non-value-adding activitiesCost of non-value-adding activities
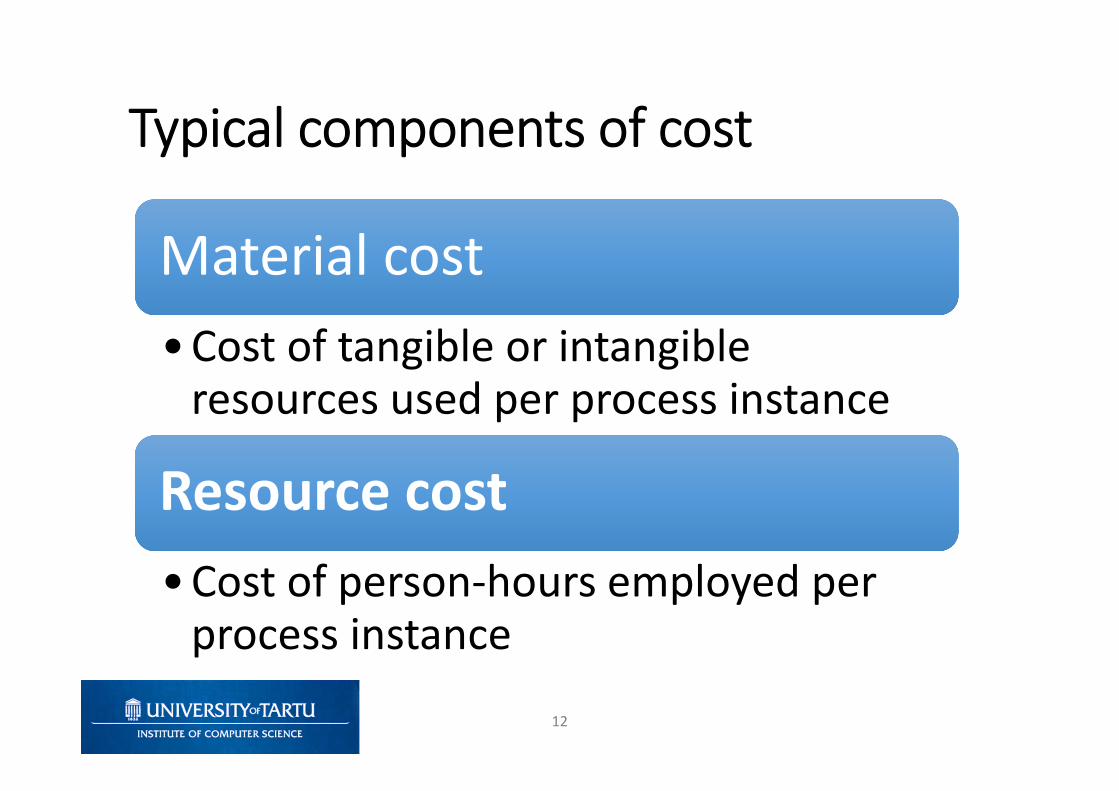
Material costMaterial cost
• Cost of tangible or intangible resources used per process instance
Resource costResource cost
• Cost of person-hours employed per process instance
Typical components of cost
12
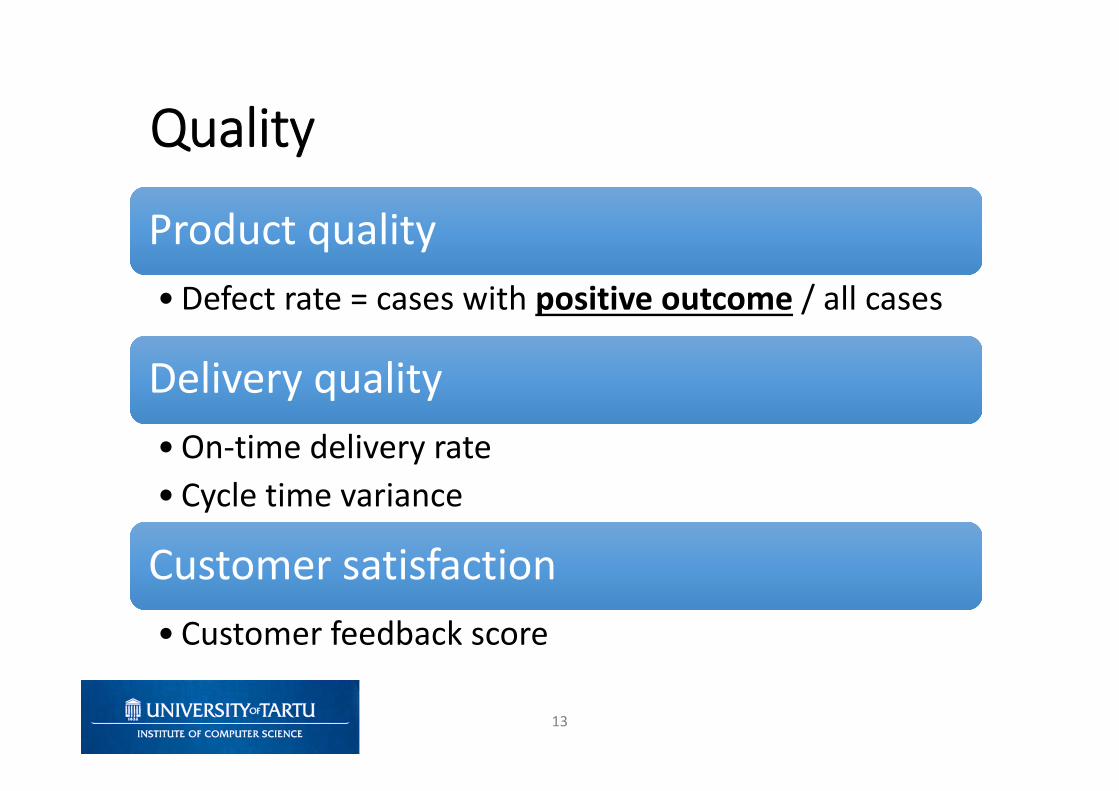
Product qualityProduct quality
• Defect rate = cases with positive outcome / all cases
Delivery qualityDelivery quality
• On-time delivery rate
• Cycle time variance
Customer satisfactionCustomer satisfaction
• Customer feedback score
Quality
13
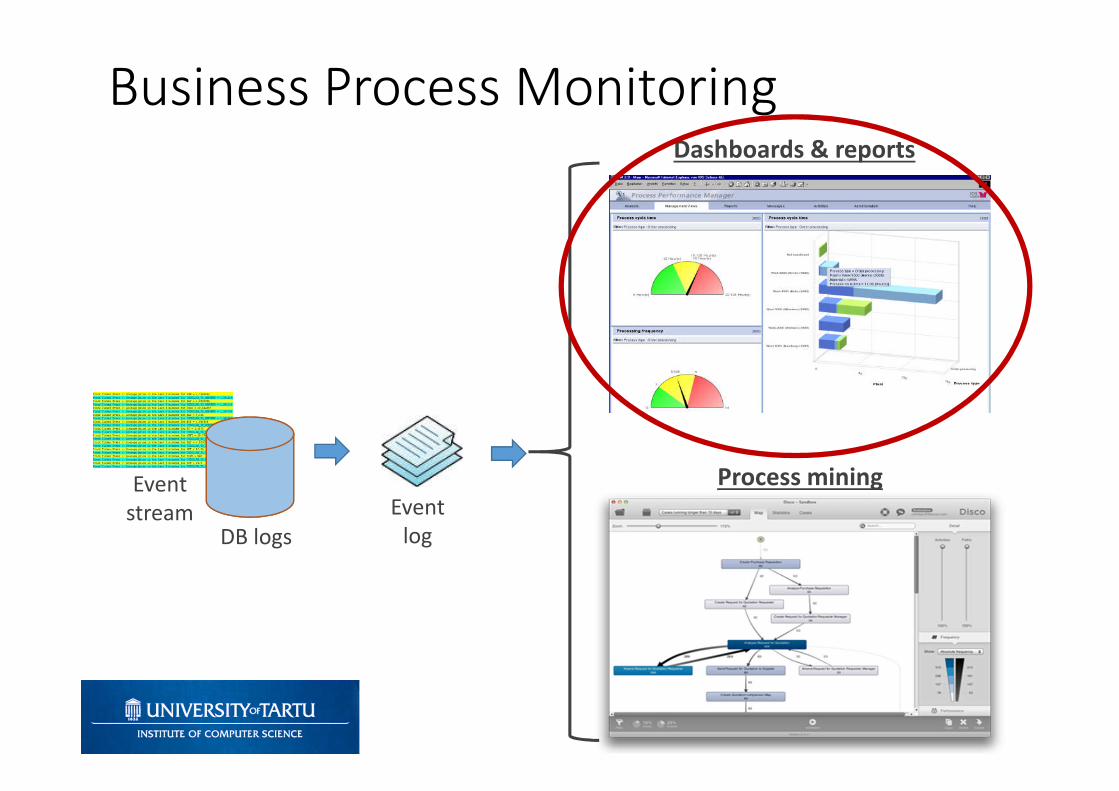
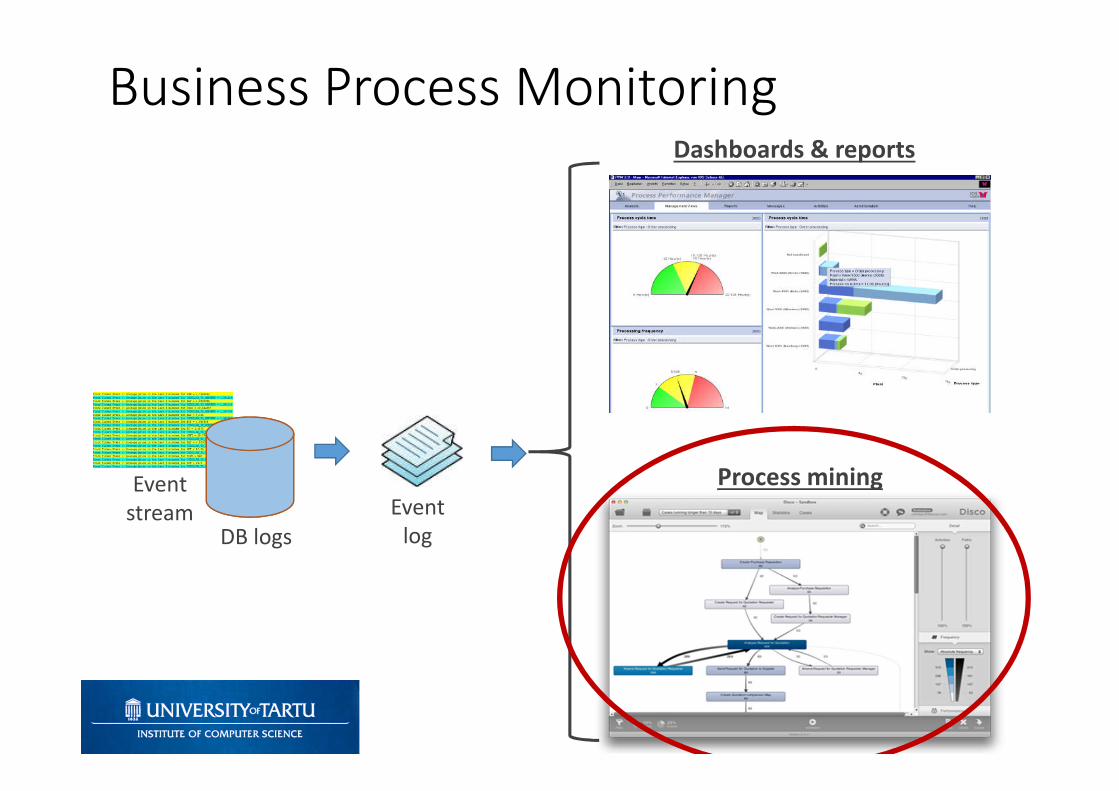
Business Process MonitoringDashboards & reports
Process miningEventstream
DB logsEvent
log
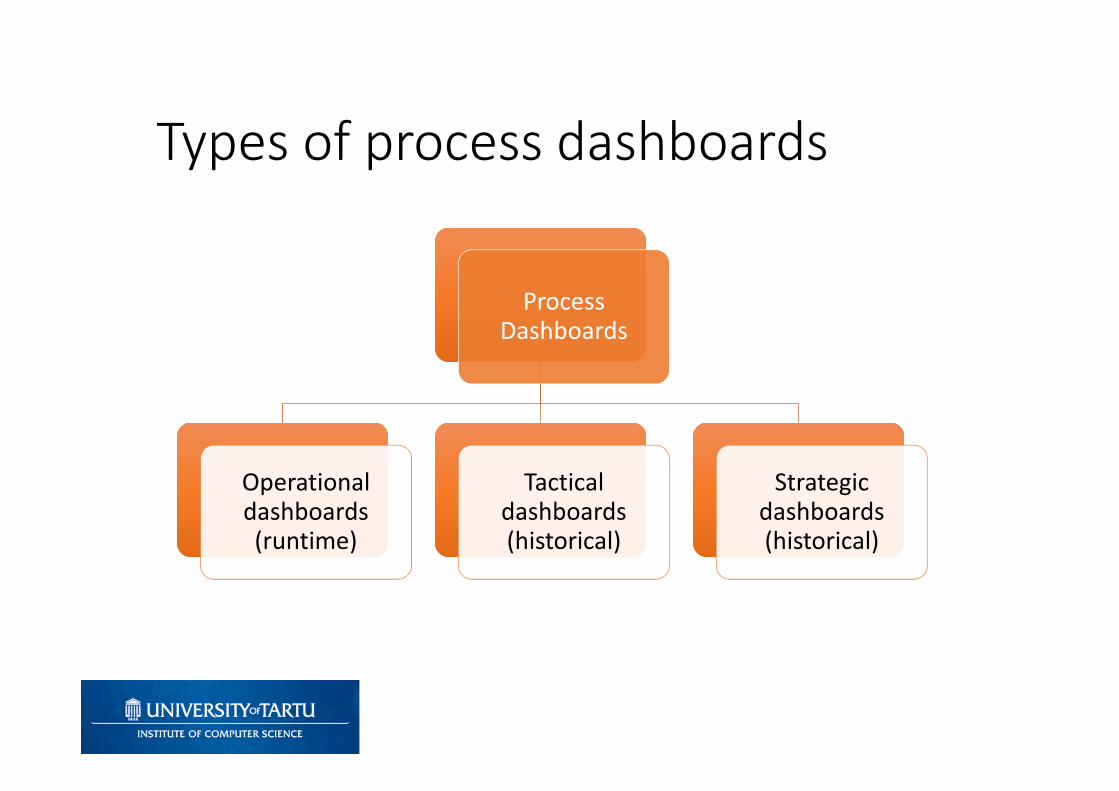
ProcessDashboards
Operationaldashboards(runtime)
Tactical dashboards(historical)
Strategic dashboards(historical)
Types of process dashboards
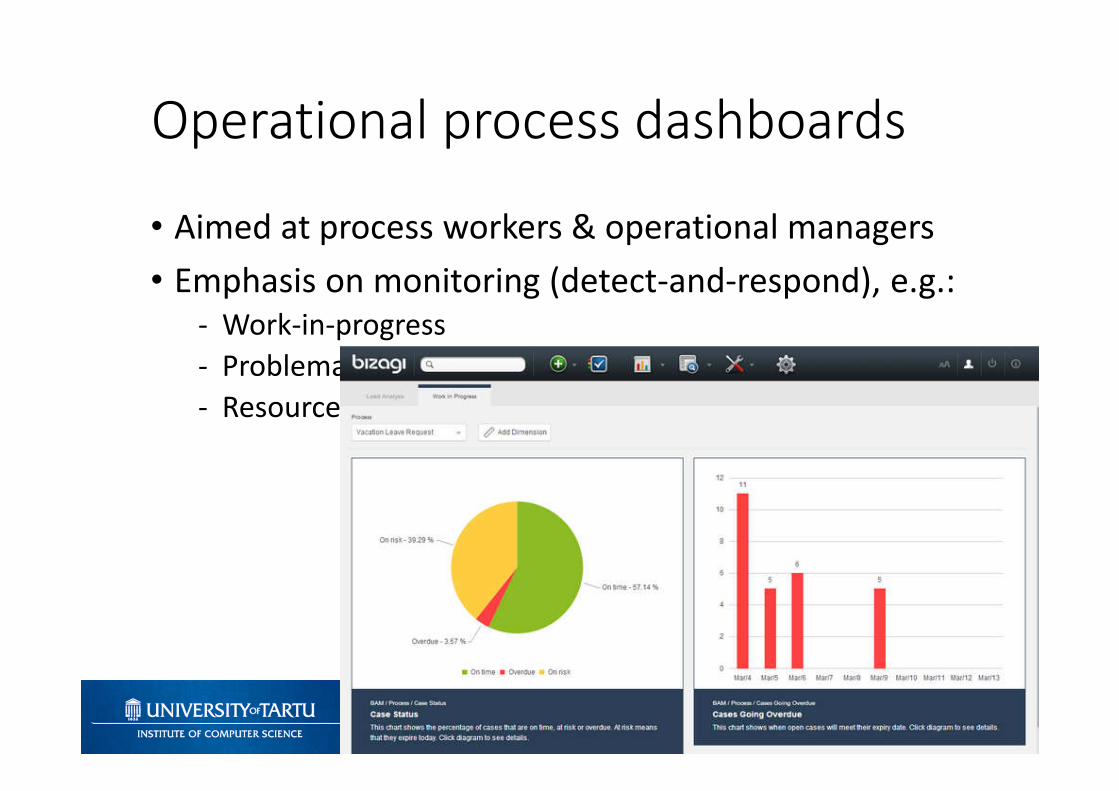
Operational process dashboards
• Aimed at process workers & operational managers
• Emphasis on monitoring (detect-and-respond), e.g.:- Work-in-progress
- Problematic cases – e.g. overdue/at-risk cases
- Resource load
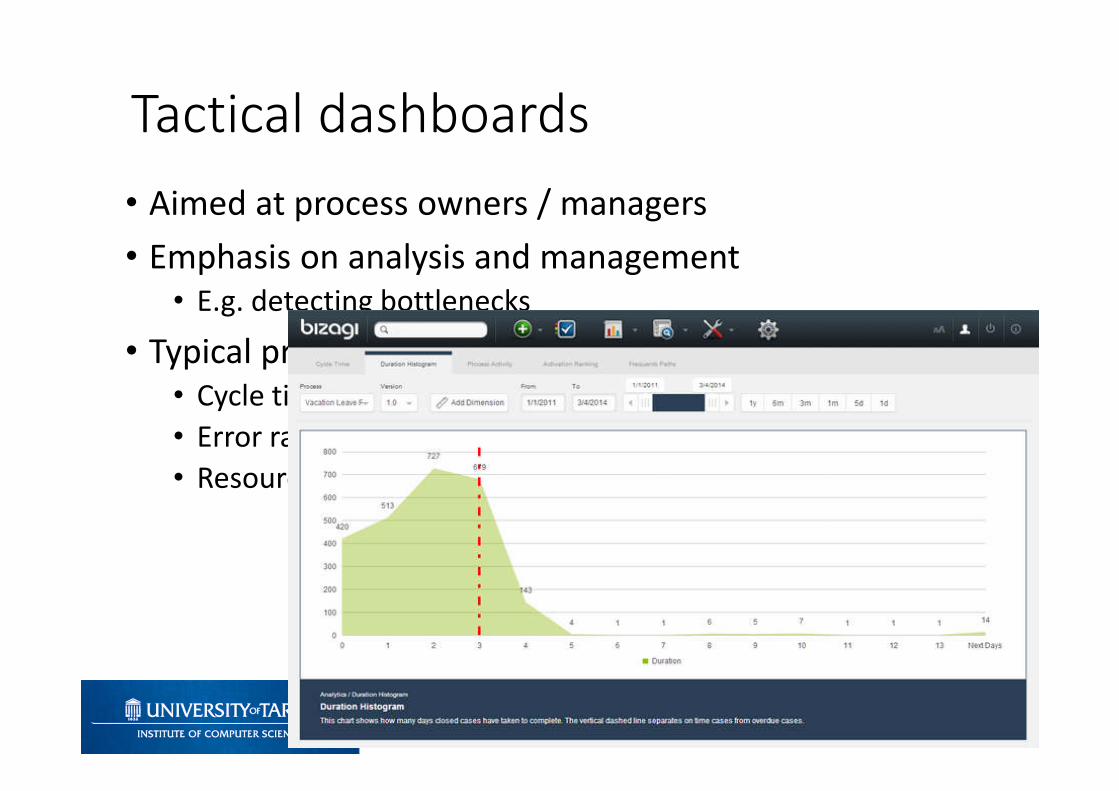
• Aimed at process owners / managers
• Emphasis on analysis and management• E.g. detecting bottlenecks
• Typical process performance indicators• Cycle times
• Error rates
• Resource utilization
Tactical dashboards
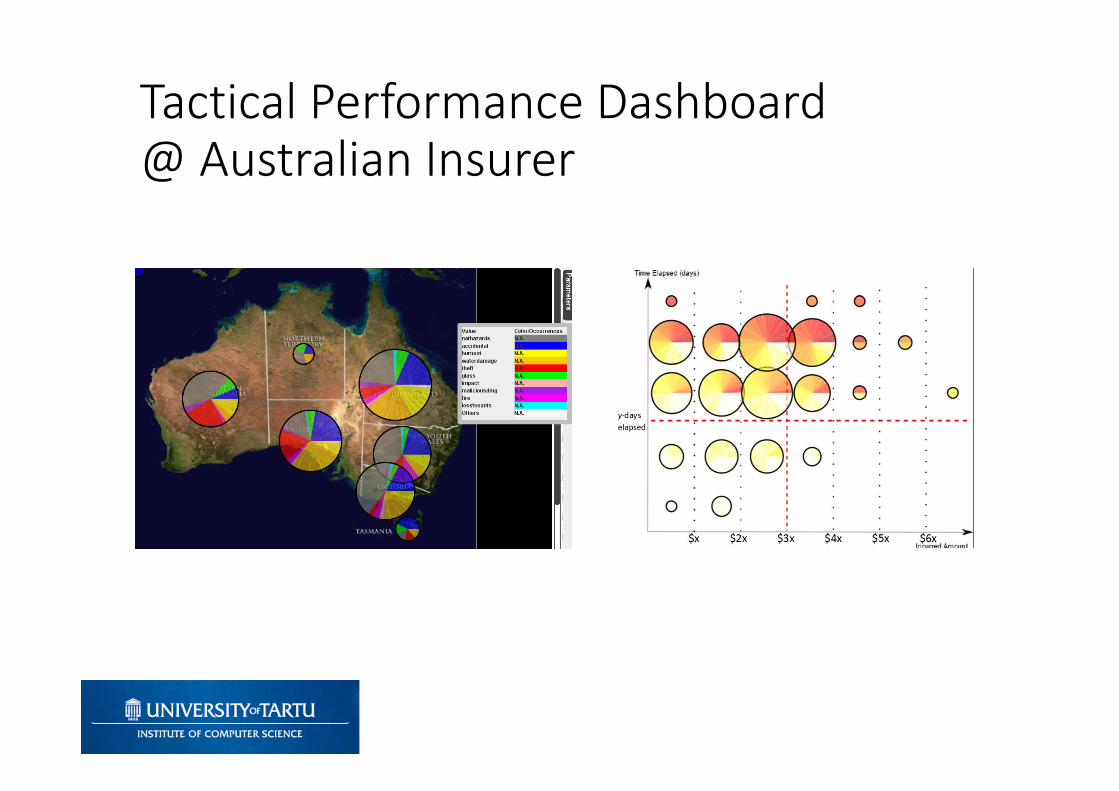
Tactical Performance Dashboard @ Australian Insurer
• Aimed at executives & managers
• Emphasis on linking process performance to strategic objectives
Strategic dashboards
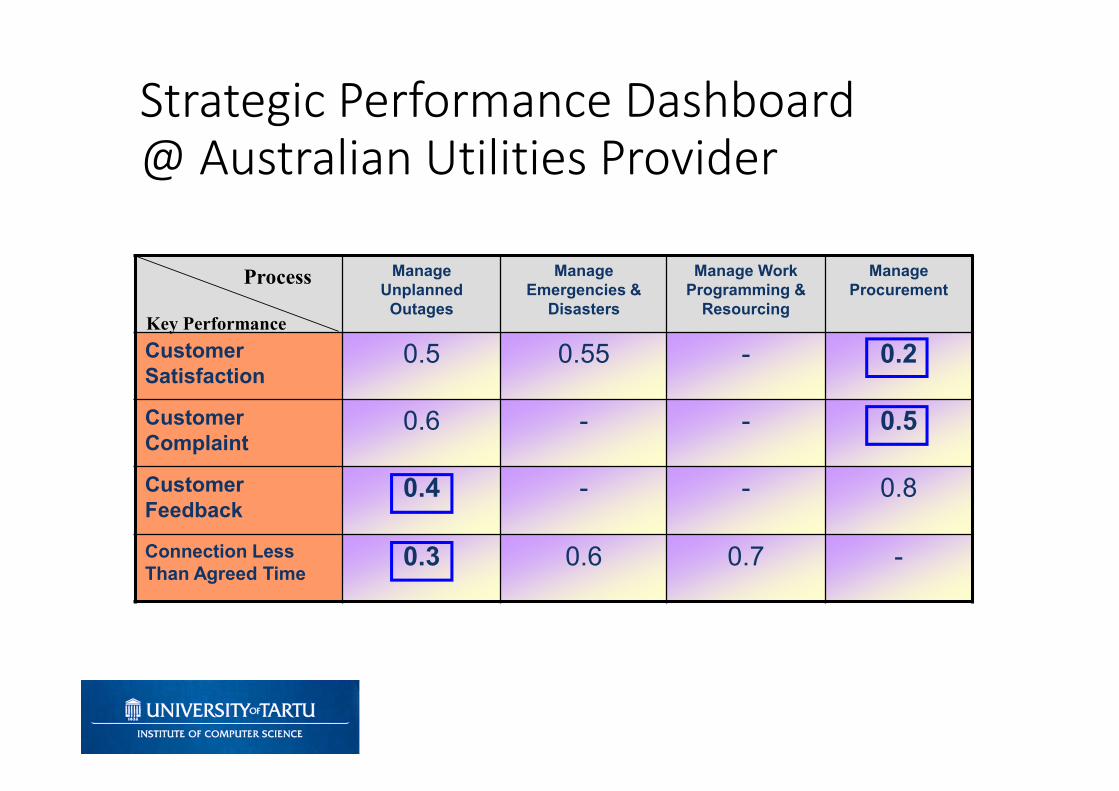
Manage Unplanned
Outages
Manage Emergencies &
Disasters
Manage Work Programming &
Resourcing
Manage Procurement
Customer Satisfaction
0.5 0.55 - 0.2
Customer Complaint
0.6 - - 0.5
Customer Feedback
0.4 - - 0.8
Connection Less Than Agreed Time
0.3 0.6 0.7 -
Key Performance
Process
Strategic Performance Dashboard @ Australian Utilities Provider
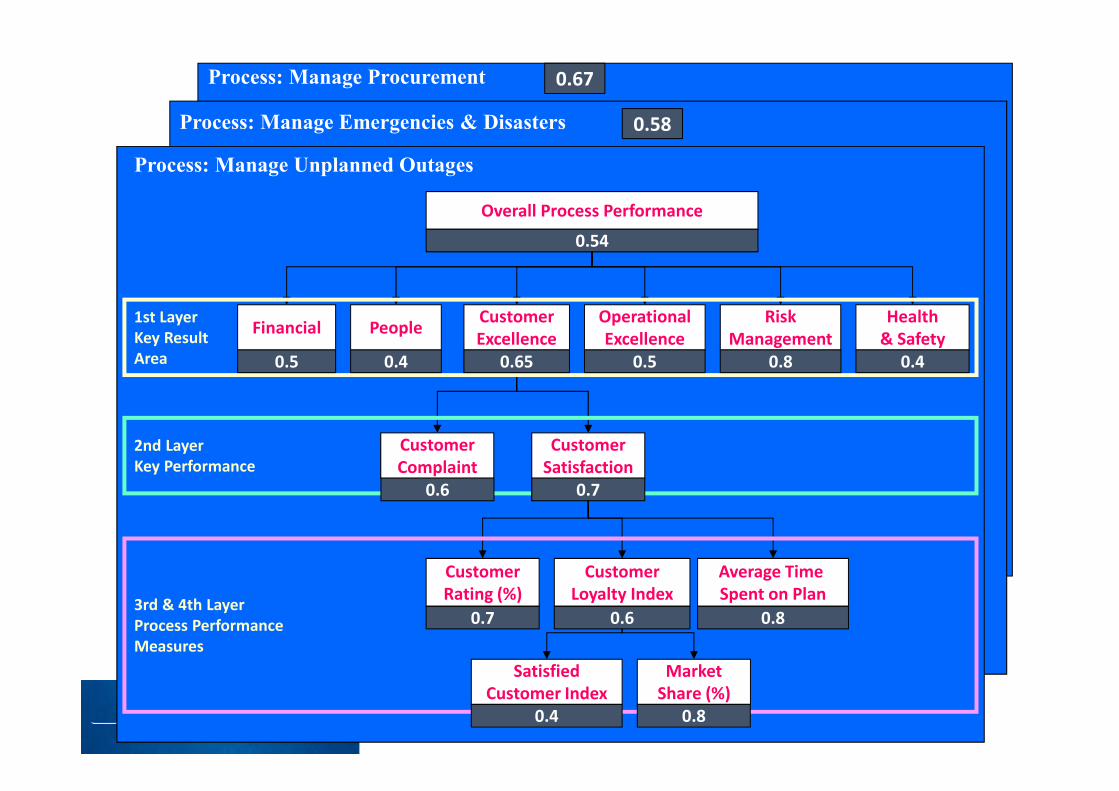
Process: Manage Emergencies & Disasters
Process: Manage Procurement
Process: Manage Unplanned Outages
Overall Process Performance
Financial PeopleCustomerExcellence
OperationalExcellence
RiskManagement
Health& Safety
CustomerSatisfaction
CustomerComplaint
CustomerRating (%)
CustomerLoyalty Index
Average Time Spent on Plan
1st Layer Key ResultArea
2nd Layer Key Performance
SatisfiedCustomer Index
MarketShare (%)
3rd & 4th Layer Process PerformanceMeasures
0.65
0.6 0.7
0.7 0.6 0.8
0.4 0.8
0.5 0.4 0.5 0.8 0.4
0.54
0.58
0.67
Consider the pharmacy prescription process described in the handout.
What performance measures could we define for this process?
Sketch operational and tactical process monitoring dashboards for CVS Pharmacy’s prescription fulfillment process. Consider the viewpoints of each stakeholder in the process.
Teamwork
Business Process MonitoringDashboards & reports
Process miningEventstream
DB logsEvent
log
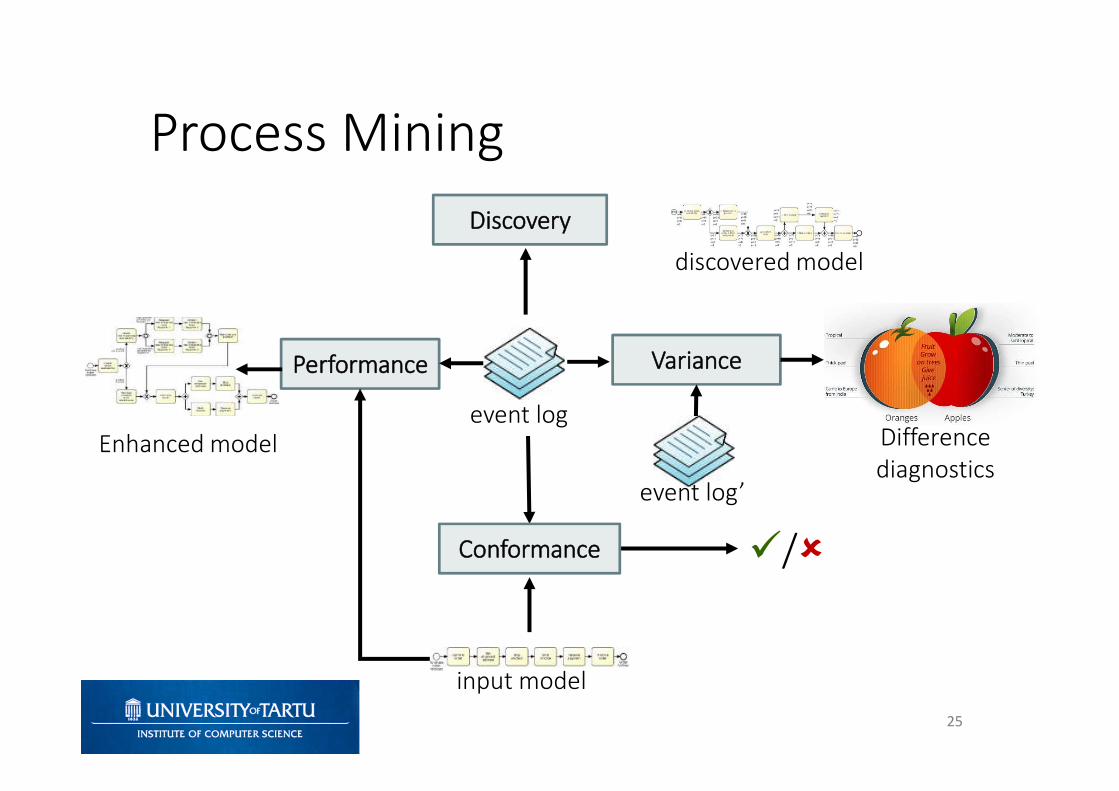
Process Mining
25
/
event log
discovered model
Discovery
Conformance
Variance
Differencediagnostics
Performance
input model
Enhanced model
event log’
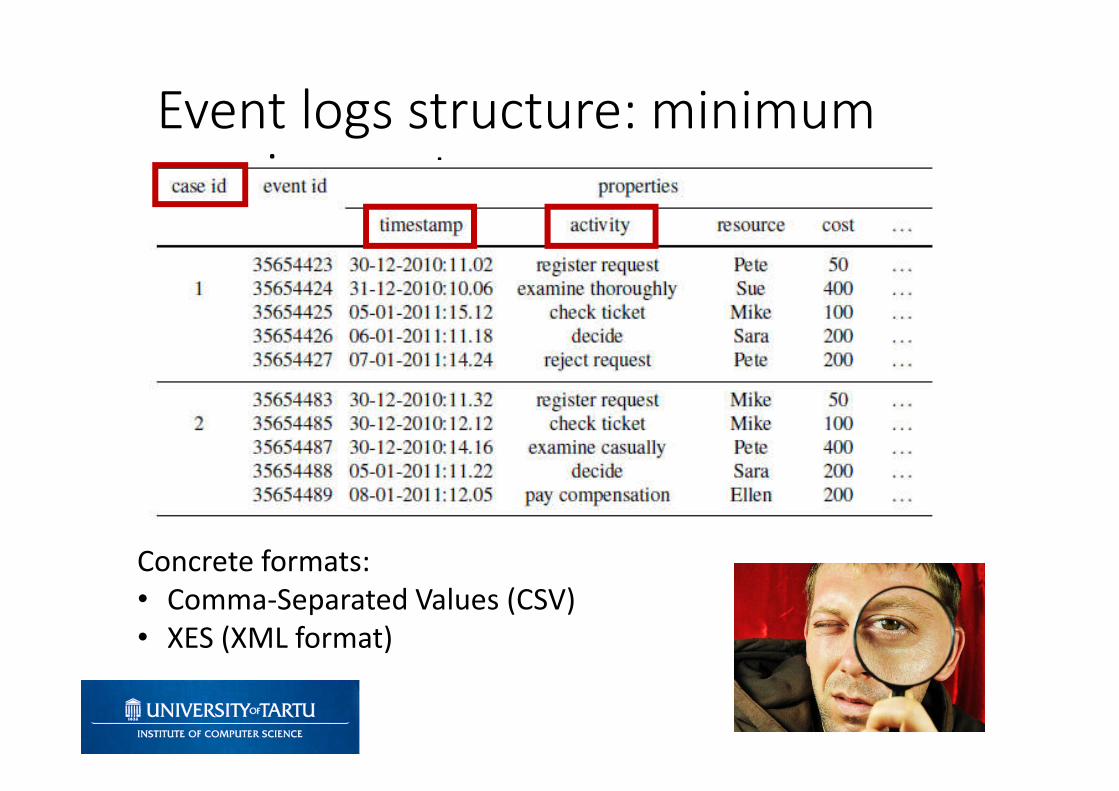
Event logs structure: minimum requirements
Concrete formats:• Comma-Separated Values (CSV)• XES (XML format)

Automated Process Discovery
27
Enter Loan Application
Retrieve Applicant
Data
Compute Installments
Approve Simple
Application
Approve Complex
Application
Notify Rejection
Notify Eligibility
CID Task Time Stamp …
13219 Enter Loan Application 2007-11-09 T 11:20:10 -
13219 Retrieve Applicant Data 2007-11-09 T 11:22:15 -
13220 Enter Loan Application 2007-11-09 T 11:22:40 -
13219 Compute Installments 2007-11-09 T 11:22:45 -
13219 Notify Eligibility 2007-11-09 T 11:23:00 -
13219 Approve Simple Application 2007-11-09 T 11:24:30 -
13220 Compute Installements 2007-11-09 T 11:24:35 -
… … … …

Process Mining Tools
Open-source
• Apromore
• ProM
• bupaR
Lightweight
• Disco
Mid-range
• Minit
• myInvenio
• QPR Process Analyzer
• Signavio Process Intelligence
• StereoLOGICDiscovery Analyst
Heavyweight
• ARIS Process Performance Manager
• Celonis Process Mining
• Perceptive Process Mining (Lexmark)
• Interstage Process Discovery (Fujitsu)
28

Fluxicon Disco
29

Process Maps
• A process map of an event log is a graph where:• Each activity is represented by one node
• An arc from activity A to activity B means that B is directly followed by A in at least one trace in the log
• Arcs in a process map can be annotated with:• Absolute frequency: how many times B directly follows A?
• Relative frequency: in what percentage of times when A is executed, it is directly followed by B?
• Time: What is the average time between the occurrence of A and the occurrence of B?
30

Process Maps – Example
31
Event log:
10: a,b,c,g,e,h
10: a,b,c,f,g,h
10: a,b,d,g,e,h
10: a,b,d,e,g,h
10: a,b,e,c,g,h
10: a,b,e,d,g,h
10: a,c,b,e,g,h
10: a,c,b,f,g,h
10: a,d,b,e,g,h
10: a,d,b,f,g,h

Process Maps – ExerciseCase
ID Task Name Originator TimestampCase
ID Task Name Originator Timestamp
1 File Fine Anne 20-07-2004 14:00:00 3 Reminder John 21-08-2004 10:00:00
2 File Fine Anne 20-07-2004 15:00:00 2 Process Payment system 22-08-2004 09:05:00
1 Send Bill system 20-07-2004 15:05:00 2 Close case system 22-08-2004 09:06:00
2 Send Bill system 20-07-2004 15:07:00 4 Reminder John 22-08-2004 15:10:00
3 File Fine Anne 21-07-2004 10:00:00 4 Reminder Mary 22-08-2004 17:10:00
3 Send Bill system 21-07-2004 14:00:00 4 Process Payment system 29-08-2004 14:01:00
4 File Fine Anne 22-07-2004 11:00:00 4 Close Case system 29-08-2004 17:30:00
4 Send Bill system 22-07-2004 11:10:00 3 Reminder John 21-09-2004 10:00:00
1Process Payment system 24-07-2004 15:05:00 3 Reminder John 21-10-2004 10:00:00
1 Close Case system 24-07-2004 15:06:00 3 Process Payment system 25-10-2004 14:00:00
2 Reminder Mary 20-08-2004 10:00:00 3 Close Case system 25-10-2004 14:01:00
32

Process Maps in Disco
• Disco (and other commercial process mining tools) use process maps as the main visualization technique for event logs
• These tools also provide three types of operations:1. Abstract the process map:
• Show only most frequent activities
• Show only most frequent arcs
2. Filter the traces in the event log…
33

Types of filters
• Event filters• Retain only events that fulfil a given condition (e.g. all events
of type “Create purchase order”)
• Performance filter• Retain traces that have a duration above or below a given
value
• Event pair filter (a.k.a. “follower” filter)• Retain traces where there is a pair of events that fulfil a given
condition (e.g. “Create invoice” followed by “Create purchase order”)
• Endpoint filter• Retain traces that start with or finish with an event that fulfils
a given condition
34

Process Maps in Disco
• Disco (and other commercial process mining tools) use process maps as the main visualization technique for event logs
• These tools also provide three types of operations:1. Abstract the process map:
• Show only most frequent activities
• Show only most frequent arcs
2. Filter the traces in the event log
3. Enhance the process map
35

Process Map Enhancement
• Nodes and arcs in a process map can be color-coded or thickness-coded to capture:
• Frequency: How often a given task or a given directly-follows relation occurs?
• Time performance: processing times, waiting times, cycles times of tasks
• More advanced tools support enhancement by other attributes, e.g. cost, revenue, etc. if the data is available.
36

Disco tutorial
37

Using Disco, answer the following questions on the PurchasingExample log:
• How many cases had to settle a dispute with the purchasing agent?
• Is there a difference in cycle time for the cases that had to settle a dispute with the purchasing agent, compared to the ones that did not? Make sure you only compare cases that actually reach the endpoint ‘Pay invoice’
• Are there any cases where the invoice is released and authorized by the same resource? And if so, who is doing this most often?
Additional Exercises
Exercise by Anne Rozinat, Fluxicon

Given two logs, find the differences and root causes for variation or deviance between the two logs
Variance Mining
≠

Case Study: Variance Mining at Suncorp
OK
OK Good
Bad Expected Performance
Line
Expected Performance
Line

Simple claims and quick Simple claims and slow
Deviance Mining via Process Map Comparison
?
S. Suriadi et al.: Understanding Process Behaviours in a Large Insurance Company in Australia: A Case Study. CAiSE 2013

Variance mining
• Hands-on example: comparison of two variants of an insurance claims handling log
42

Recap
• Process monitoring is about analysing events produced during the execution of a process to understand the performance and conformance of the process.
• Two major types of approaches to monitoring are:• Performance dashboards• Process mining
• Process mining is centered around diagrammatic representations of a process
• Process maps or BPMN process models
• Process mining tools such as Disco allow us to apply abstraction, filtering, and enhancement to process maps and event logs.
43

44