Embed Size (px)
Citation preview
REPORT
SAMPLING AND ANALYSIS PLAN KENMORE AREA SEDIMENT AND WATER CHARACTERIZATION
Prepared for
Washington State Department of Ecology
Dredged Material Management Program
Washington State Department of Health
On Behalf of
City of Kenmore
18120 68th Avenue NE
Kenmore, Washington 98028
Prepared by
Anchor QEA, LLC
720 Olive Way, Suite 1900
Seattle, Washington 98101
October 2012

Sampling and Analysis Plan October 2012 Kenmore Areas Sediment and Water Characterization i 120891-01.01
TABLE OF CONTENTS
1 INTRODUCTION .................................................................................................................. 1
1.1 Kenmore Navigation Channel Screening Level Characterization .................................1
1.2 Additional Nearshore Sediment and Surface Water Characterization .........................3
1.2 Purpose and Objectives ....................................................................................................4
1.3 Background Information .................................................................................................5
1.3.1 Site Setting ..................................................................................................................5
1.3.2 Summary of Previous Sediment Characterization and Dredging ............................6
1.3.3 Potential Sediment Loading and Contamination Sources ........................................8
2 PROJECT MANAGEMENT AND RESPONSIBILITIES ..................................................... 11
2.1 Project Planning and Coordination ..............................................................................11
2.2 Field Sample Collection .................................................................................................11
2.3 Laboratory Preparation and Analyses ...........................................................................12
2.4 Quality Assurance/Quality Control Management ........................................................12
2.5 Sampling and Analysis Results Memorandum .............................................................12
3 SAMPLE COLLECTION, PROCESSING, AND HANDLING PROCEDURES .................. 13
3.1 Sampling Schedule .........................................................................................................13
3.2 Station and Sample Identification and Nomenclature .................................................13
3.3 Station Positioning .........................................................................................................20
3.4 Collection Methods ........................................................................................................20
3.4.1 Sediment ...................................................................................................................20
3.4.2 Surface Water ...........................................................................................................22
3.4.3 Sample Processing ....................................................................................................23
3.5 Field Quality Assurance/Quality Control Samples.......................................................25
3.6 Waste Management .......................................................................................................25
4 SAMPLE TRANSPORT AND CHAIN-OF-CUSTODY PROCEDURES ............................ 26
4.1 Sample Custody Procedures ..........................................................................................26
4.2 Sample Delivery and Receipt Requirements ................................................................26
5 CHEMICAL AND PHYSICAL ANALYTICAL TESTING .................................................. 27
5.1.1 Laboratory Instrument Calibration and Frequency ...............................................36
5.1.2 Laboratory Duplicates/Replicates ............................................................................37
Sampling and Analysis Plan October 2012 Kenmore Area Sediment and Water Characterization ii 120891-01.01
5.1.3 Matrix Spikes/Matrix Spike Duplicates ...................................................................37
5.1.4 Method Blanks ..........................................................................................................37
5.1.5 Laboratory Control Samples ....................................................................................37
5.1.6 Standard Reference Materials ..................................................................................37
5.2 Laboratory Data Package ...............................................................................................38
5.3 Data Validation and Verification ..................................................................................39
6 SAMPLING AND ANALYSIS RESULTS MEMORANDUM .............................................. 41
7 PROJECT SCHEDULE ......................................................................................................... 42
8 REFERENCES ...................................................................................................................... 43
List of Tables
Table 1 Sample Locations, Collection Methods, and Rationale .......................................14
Table 2 Guidelines for Sample Handling and Storage ......................................................24
Table 3 Sediment Analyte List, Interpretive Criteria, Analytical Methods, and
Reporting Limits ...................................................................................................28
Table 4 Surface Water Analyte List, Analytical Methods, and Reporting Limits ..........32
Table 5 Laboratory Quality Assurance/Quality Control Sample Analysis Summary for
Sediment and Water .............................................................................................35
Table 6 Data Quality Objectives for Sediment and Water ..............................................36
Table 7 Estimated Schedule ...............................................................................................42
List of Figures
Figure 1 Existing Information ...............................................................................................2
Figure 2 Proposed Sampling Locations ...............................................................................19
Appendices
Appendix A Field Forms and Logs

Sampling and Analysis Plan October 2012 Kenmore Area Sediment and Water Characterization iii 120891-01.01
LIST OF ACRONYMS AND ABBREVIATIONS
C degrees Celsius
μg microgram
ARI Analytical Resources, Inc.
BT bioaccumulation trigger
CCV continuing calibration verification
City City of Kenmore
cm centimeter
COC chain-of-custody
COI chemical of interest
CSL Cleanup Screening Level
cy cubic yard
DDT dichlorodiphenyltrichloroethane
DGPS differential global positioning system
DMMO Dredged Material Management Office
DMMP Dredged Material Management Program
DMMU dredged material management unit
DOH Washington State Department of Health
DQO data quality objective
Ecology Washington State Department of Ecology
EIM Environmental Information Management
FC field coordinator
GC/MS gas chromatograph/mass spectrometer
g gram
HDPE high density polyethylene
HPAH high-molecular-weight polycyclic aromatic hydrocarbon
ID identification
kg kilogram
KGM Kiewit General Manson
KIP Kenmore Industrial Park
LCS laboratory control sample

Sampling and Analysis Plan October 2012 Kenmore Areas Sediment and Water Characterization iv 120891-01.01
LPAH low-molecular-weight polycyclic aromatic hydrocarbon
m meter
mg milligram
ml milliliter
MS matrix spike
MSD matrix spike duplicate
MTCA Model Toxics Control Act
NA not applicable
NAD North American Datum
ng nanogram
PAH polycyclic aromatic hydrocarbon
PCB polychlorinated biphenyl
PCDD/F polychlorinated dioxins and furans
PSEP Puget Sound Estuary Program
QA quality assurance
QC quality control
QAPP Quality Assurance Project Plan
RL reporting limit
RPD relative percent difference
SAP Sampling and Analysis Plan
SL Screening Level
SQS Sediment Quality Standard
SQV Sediment Quality Value
SRM standard reference material
SAPA Sediment Sampling Analysis Plan Appendix
SVOC Semi-volatile organic compound
SQS Sediment Quality Standard
TBT tributyltin
TEQ toxic equivalency
USACE U.S. Army Corps of Engineers
USEPA U.S. Environmental Protection Agency
Sampling and Analysis Plan October 2012 Kenmore Area Sediment and Water Characterization 1 120891-01.01
1 INTRODUCTION
This Sampling and Analysis Plan (SAP) has been prepared by the City of Kenmore (City) in
partnership with the Washington State Department of Ecology (Ecology) to characterize
sediment and water in northeastern portion of Lake Washington south of Kenmore and
northwest of the mouth of the Sammamish River. The characterization effort supports a
number of objectives for the City and Ecology. First, the characterization is intended to
support the City’s ongoing work with the U.S. Army Corps of Engineers (USACE) to support
a request for federal funding for maintenance dredging of the federal Kenmore Navigation
Channel (Figure 1). Second, with assistance from a grant from Ecology, the City and Ecology
are conducting additional characterization activities to evaluate the presence and
concentration of possible chemicals and the potential presence of contamination along the
shoreline. The characterization has been designed to support Ecology’s Model Toxics
Control Act (MTCA) cleanup action requirements and the Health Consultations to be
developed by Washington State Department of Health (DOH).
This SAP describes the screening level sediment characterization to support a request for
federal funding for maintenance dredging of the federal Kenmore Navigation Channel in the
USACE’s maintenance dredging budget. The SAP also characterizes and evaluates nearshore
sediment and surface water for public health, safety, and environmental concerns.
1.1 Kenmore Navigation Channel Screening Level Characterization
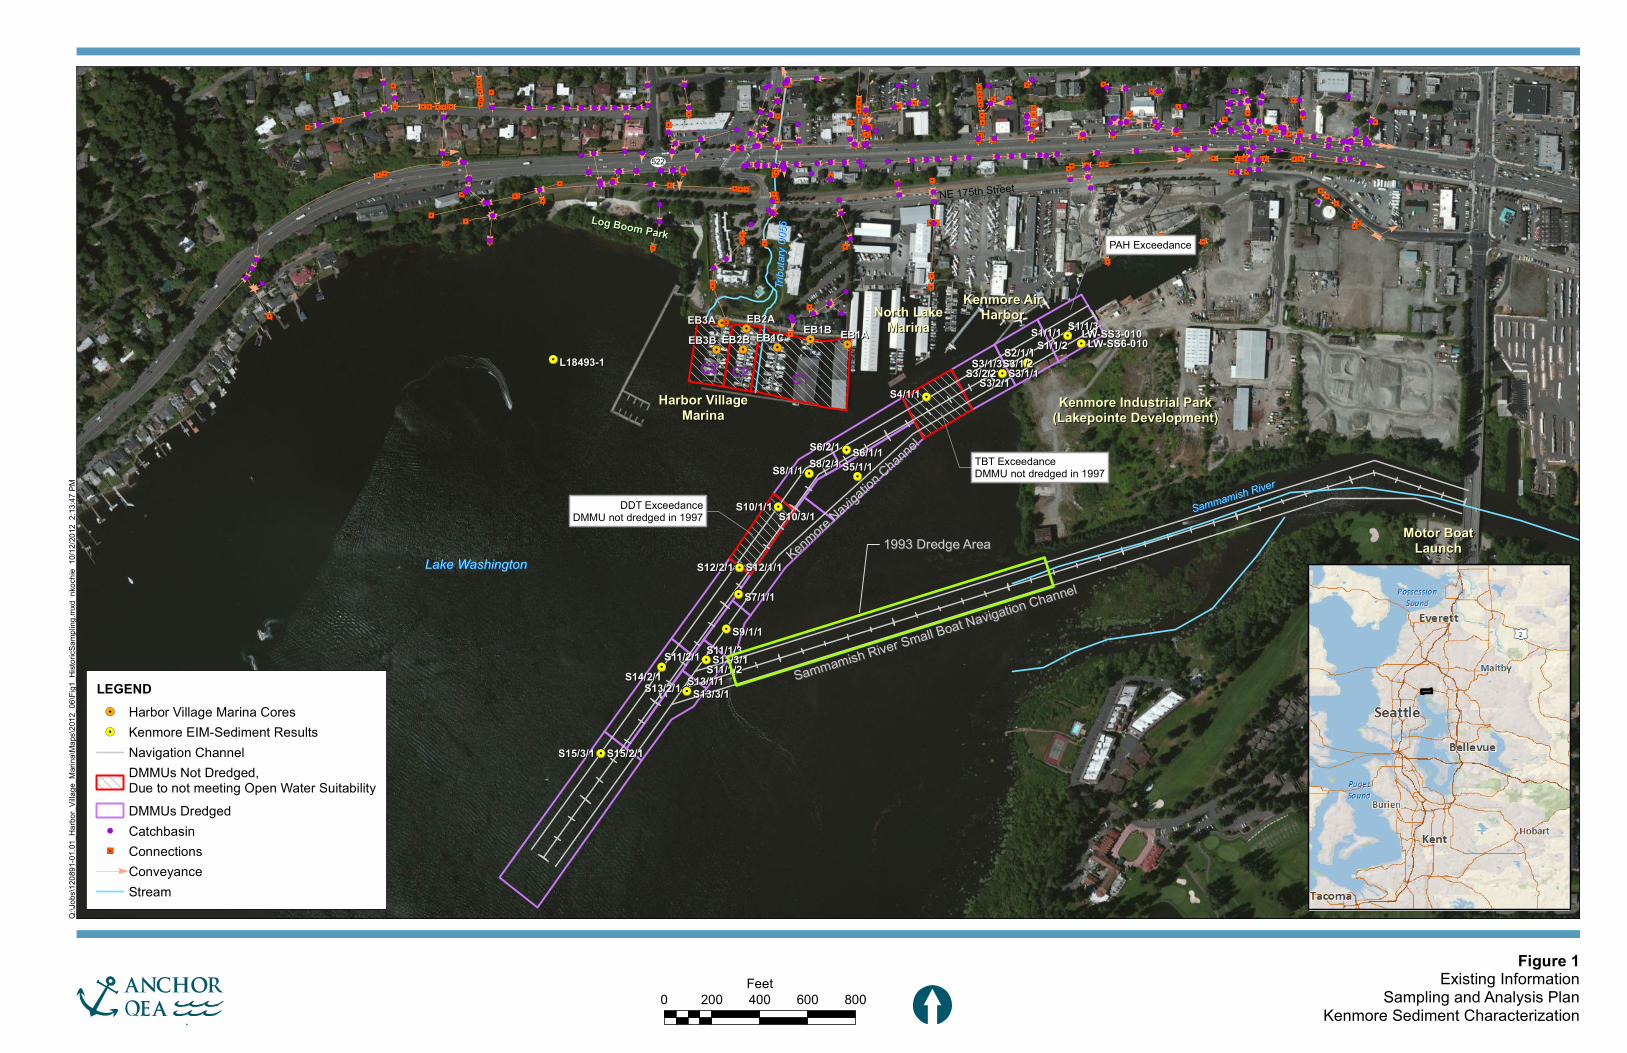
The Kenmore Navigation Channel was constructed in 1981 as a USACE project authorized in
Section 107 of the 1960 River and Harbors Act (Figure 1). It was sampled in 1996, dredged
in 1997, and surveyed in 2010. The recent survey conducted by the USACE in February
2010 showed shallow areas present within the Kenmore Navigation Channel. The most
recent maintenance dredging of the Kenmore Navigation Channel was prior to the City’s
1998 incorporation. Currently, King County is the Local Sponsor Authority for the Kenmore
Navigation Channel and the Sammamish River Small Boat Navigation Channel. The City,
King County, and the USACE are presently exploring the possible transfer of the Local
Sponsor Authority for the Kenmore Navigation Channel to the City. The USACE estimates
that maintenance dredging would require removal of 31,700 cubic yards (cy) of sediment
within the channel.
!.!.!.
!.
!.
!.
!.
!.
!.
!.
!.
!.
!.
!.
!.
!.
!.
!.
!.
!.
!.
!.
!.
!.
!.!.!.!.
!.!.!.
!.!.!.
!.!.!.
!.!.!.
!.!.!.!.!.!.!.!.!.!.!.!.!.!.!.!.!.!.!.
!.!.!.!.!.!.
!.!.!.
!.!.!.!.!.!.
!.!.!.!.!.!.!.!.!.
!.!.!.
!.!.!.
!.!.!.
!.!.!.
!.!.!.
!.!.!.
!.!.!.
!.!.!.
!.!.!.!.!.!.
!.!.!.
!.!.!.
!.
!.!.!.
!.!.!.
!.!.!.
!.!.!.
!.
!.!.!.
!.!.!.
!.!.!.
!.!.!.
!.!.!.
!.!.!.!.!.!.!.!.!.!.!.!.!.!.!.!.!.!.!.
!.!.!.!.!.!.!.!.!.!.!.!.!.!.!.!.!.!.!.
!.!.!.!.
!.!.!.!.!.!.!.!.!.!.!.!.!.!.!.!.!.!.!.!.!.!.!.!.!.!.!.!.!.!.!.!.!.!.!.!.!.!.!.!.!.!.!.
!.!.!.!.!.!.!.!.!.!.!.!.!.!.!.!.!.!.!.
!.!.!.!.!.!.!.!.!.!.!.!.!.!.!.!.!.!.!.
!.!.!.!.!.!.!.!.!.!.!.!.!.!.!.!.!.!.!.
!.!.!.!.!.!.!.!.!.!.!.!.!.!.!.!.!.!.!.!.!.!.!.!.!.!.!.
!.!.!.!.!.!.!.!.!.!.!.!.!.!.!.
!.!.!.!.!.!.!.!.!.!.!.
!.!.!.
!.!.!.!.!.!.!.!.!.!.!.!.!.!.!.!.!.!.!.
!.!.!.!.!.!.!.!.!.!.!.
!.!.!.!.
!.!.!.!.!.!.!.!.!.!.!.
!.!.!.!.!.!.!.!.
!.!.!.!.!.!.!.!.!.!.!.
!.!.!.!.
!.!.!.!.!.!.!.!.!.!.!.
!.!.!.!.!.!.!.!.!.!.!.!.!.!.!.!.!.!.!.
!.!.!.!.!.!.!.!.!.!.!.
!.!.!.!.!.!.!.!.!.!.!.
!.!.!.!.!.!.!.!.!.!.!.!.!.!.!.!.!.!.!.
!.!.!.!.!.!.!.!.
!.
!.!.!.!.!.!.!.!.
!.!.!.!.!.!.!.!.!.!.!.!.!.!.!.!.!.!.!.!.!.!.
!.!.!.!.!.!.!.!.!.!.!.!.!.!.!.!.!.!.!.!.!.!.
!.!.!.
!.
!.
!.
!.!.!.!.!.!.!.!.!.!.!.!.!.!.!.!.!.!.!.!.!.!.!.!.!.!.!.!.!.!.!.!.!.!.!.!.!.!.!.!.!.!.!.!.!.!.!.!.
!.!.!.!.!.!.!.!.!.!.!.!.!.!.!.!.!.!.!.!.!.!.!.
!.!.!.!.!.!.!.!.!.!.!.!.!.!.!.!.!.!.!.!.!.!.
!.!.!.!.!.!.!.!.!.!.!.!.!.!.!.!.!.!.!.!.!.!.!.
!.!.!.!.!.!.!.!.!.!.!.!.!.!.!.!.!.!.!.!.!.!.!.!.!.!.!.!.!.!.!.
!.
!.
!.!.!.!.!.!.!.!.!.!.!.!.!.!.!.
!.
!.
!.!.!.
!.!.!.!.!.!.!.!.!.!.!.!.!.!.!.
!.
!.
!.!.!.
!.!.!.!.!.!.!.!.!.!.!.!.!.!.!.!.!.!.!.!.!.!.!.
!.!.!.!.!.!.!.!.!.!.!.!.!.!.!.
!.!.!.
!.!.!.!.!.!.!.!.!.!.!.!.!.!.!.
!.!.!.!.!.!.
!.!.!.!.!.!.!.!.!.!.!.!.!.!.!.
!.!.!.
!.!.!.!.!.!.!.!.!.!.!.!.!.!.!.
!.!.!.!.!.!.!.!.!.!.!.!.!.!.!.!.!.!.!.!.!.!.
!.!.!.!.!.!.!.!.!.!.!.!.!.!.!.
!.!.!.!.!.!.!.!.!.!.!.!.!.!.!.
!.!.!.!.!.!.!.!.!.!.!.!.!.!.!.!.!.!.!.!.!.!.
!.!.!.!.!.!.!.!.
!.
!.!.!.!.!.!.!.!.
!.!.!.!.!.!.!.!.!.!.!.!.!.!.!.!.!.!.!.!.
!.!.!.!.!.!.!.!.!.!.!.!.!.!.!.!.!.!.!.!.
!.!.!.!.!.!.!.
!.!.!.
!.!.!.
!.!.!.
!.!.!.!.!.!.!.!.!.!.!.!.!.!.!.!.!.!.!.!.!.!.!.!.!.!.!.!.!.!.!.!.!.!.
!.!.!.!.!.!.!.!.!.!.!.!.!.!.!.!.!.!.!.!.!.!.!.
!.!.!.!.!.!.!.!.!.!.!.!.!.!.!.!.!.!.!.!.
!.!.!.!.!.!.!.!.!.!.!.!.!.!.!.!.!.!.!.!.!.!.!.
!.!.!.!.!.!.!.!.!.!.!.!.!.!.!.!.!.!.!.!.!.!.!.!.!.!.!.!.!.!.!.!.!.!.!.!.!.!.!.!.!.
!.!.!.
!.!.!.
!.!.!.!.!.!.!.!.!.!.!.
!.!.!.
!.!.!.
!.!.!.!.!.!.!.
!.!.!.!.!.
!.!.!.
!.!.!.
!.!.!.!.!.
!.!.!.!.!.!.!.!.!.!.!.!.!.!.!.!.!.!.!.!.!.!.!.!.!.!.
!.!.!.!.!.
!.!.!.!.!.!.!.
!.!.
!.!.!.!.!.!.!.!.!.!.!.!.
!.!.!.!.!.!.!.!.!.!.!.!.!.!.
!.!.!.!.!.!.!.!.!.!.!.!.!.!.!.!.!.!.!.!.!.!.!.!.!.!.!.
!.!.!.!.!.
!.!.!.!.!.!.!.
!.!.!.!.!.!.!.!.!.!.!.!.
!.!.!.!.!.!.!.!.!.!.!.!.!.!.!.!.!.!.!.!.
!.!.!.!.!.!.!.!.!.!.!.!.
!.!.!.!.!.!.!.!.!.!.!.!.!.!.!.!.!.!.!.!.!.!.!.!.!.
!.!.!.!.!.!.!.!.!.!.!.!.
!.!.!.!.!.!.!.!.!.!.!.!.!.!.!.!.!.!.!.
!.!.!.!.!.!.!.!.!.!.!.!.!.!.!.!.
!.!.!.!.
!.!.!.
!.!.!.!.!.!.!.!.!.!.!.!.!.!.!.!.
G
G
G
G
GGG
G
G G
GG
G G
G
GG
G
G
G
G
G GG
G
G
G
GG
G
G
G
GG
G G
G
GG GGG G
G
G G
G
GGGG
G G G
G
G
G
GG G
G
GG
G GGG G GG
G G GG
G
GGG
G
G
G
G
G
G G
G
G G
G G G G G G G
GGGG
G G
G
GGGGG GGG
GGGGGGG G GG GGGG G
G
G G
GGG G G GG G G GG G
GGG
G G
G
GG
G G GG GGG GG GGGGGGGGG
GG G GGGG
G
G
GGG GGG
GG G
G G GGGGGGGG
G G
GGG GG
G
GG
G
GG G GGG
G
G G G G G
G
G
GGG G
GGGG GG GG
GG
G
G
G
G G
G
GGG
G
GGG
G GG
G
GG G
G
G
G
G GG
GG
G
G
GG G
G
GGG
G
GG
G
GG
G
GG GGG
GG
GG
G
GGGGGGGGG
GG
G G G
G
GG G G G G
G
GGGGG GG G
GG
GG GG
G
G
G GG G
G
G
GG
G GGGG
G
G
G
G
GG
G G
G
G
GG
GG GG
GG
G G
G G
G
G
G
G GG
G
GG
G
G
G G
GG
G
G
GG
G
G
G
GGG
G G
G
G
GGG
G
G
GG
G
G
GG
GGGG
"6
"6 "6 "6"6"6"6
"6"6
"6"6
"6"6 "6
"6
"6
"6
"6
"6"6
"6 "6
"6
"6
"6
"6
"6
"6
"6"6
"6
"6"6
"6"6
"6
"6"6
"6"6
"6"6"6"6
"6"6"6
"6
"6
"6"6"6
"6
"6
"6
"6
"6"6"6"6"6"6"6"6"6"6"6
"6"6"6
"6"6
"6
"6
"6
"6
"6"6"6"6
"6
"6
"6
"6
"6"6"6
"6"6
"6"6
"6"6"6"6
"6
"6"6"6
"6"6 "6"6
"6
"6
"6
"6
"6"6
"6
"6
"6"6
"6
"6
"6
"6"6
"6
"6"6
"6
"6
"6"6
"6"6
"6"6"6
"6"6
"6
"6
"6"6
"6
"6
"6"6
"6
"6"6
"6"6
"6"6
!(!(!(!(
!(
!(
!(!(!(!(!(!(!(!(
!(
!(!(!(!(!(!(!(!(!(!(!(!(!( !( !(!(!(
!(
!( !(
!(!( !(
!(
!( !(!(!(!(!(!(!(
!(!(
!(!(!(!(!(!(
!(
!(
!(
!( !( !( !( !( !(
!(!(!(!(!(
!(
!(
!(
!(!(
!(
!(
!(
!(!(!(!(
!(
!(
!(
!(
!(
!( !( !( !( !( !( !( !(
!(
!(
!(!(
!(
!(
!(
!(
!(
!(!(!(
!(!(
!(!(
!(
!(!(
!(!(
!(
!(
!(
!(!( !(
!(
!(
!(
!(!(
!(!(
!( !(
!(
!(
!(!(!(
!(
!(!( !( !(
!(!(
!( !( !(!(
!(!(
!(
!( !(!( !(!(!(
!(
!(!(
!(!(!(!(!(!(
!(!(
!(
!(!(
!(
!(
!(
!(
!(
!(
!(
!(
!(
!(!(!(!(
!(
!(
!(
!(
!(
!(
!(
!(
!(
!(
!(
!(
!(!(
!(
!(!(
!(
!(
!(
!(!(
!(!(
!( !(
!(
!(!( !( !(
!(!(
!(
!(!(!(
!(
!(
!(
!(
!(!(
!(
!(
!(
!(
!(
!(!(
!(
!(
!(
!(
!(
!(
!(!(
!(
!(!(
!(
!(
!(
!(!(!(
Kenmore Industrial ParkKenmore Industrial Park(Lakepointe Development)(Lakepointe Development)
Lake WashingtonLake Washington
Sammamish RiverSammamish River
North LakeNorth LakeMarinaMarina
Kenmore AirKenmore AirHarborHarbor
Log Boom ParkLog Boom Park
Harbor VillageHarbor VillageMarinaMarina
ST522
NE 175th Street
Kenmore Naviga
tion Channel
Kenmore Naviga
tion Channel
DDT ExceedanceDMMU not dredged in 1997
TBT ExceedanceDMMU not dredged in 1997
Sammamish River Small Boat Navigation Channel
Sammamish River Small Boat Navigation Channel
1993 Dredge Area1993 Dredge Area
C1C1C2C2C3C3
PAH Exceedance
Tribu
tary 0
056
Tribu
tary 0
056
Motor BoatMotor BoatLaunchLaunch
EB1AEB1AEB1BEB1BEB1CEB1CEB2AEB2A
EB2BEB2BEB3AEB3AEB3BEB3B
S7/1/1S7/1/1
S9/1/1S9/1/1
S8/1/1S8/1/1
S13/3/1S13/3/1
L18493-1L18493-1
S1/1/1S1/1/1S2/1/1S2/1/1S3/1/1S3/1/1
S10/3/1S10/3/1
S6/2/1S6/2/1
S3/2/1S3/2/1
S11/3/1S11/3/1
S4/1/1S4/1/1S3/2/2S3/2/2
S13/2/1S13/2/1S14/2/1S14/2/1
S10/1/1S10/1/1
S12/2/1S12/2/1
LW-SS6-010LW-SS6-010
S11/2/1S11/2/1
S15/3/1S15/3/1
S6/1/1S6/1/1
S12/1/1S12/1/1
S15/2/1S15/2/1
S11/1/2S11/1/2
S8/2/1S8/2/1
S1/1/2S1/1/2S1/1/3S1/1/3LW-SS3-010LW-SS3-010
S13/1/1S13/1/1
S5/1/1S5/1/1
S3/1/3S3/1/3
S11/1/3S11/1/3
S3/1/2S3/1/2
Figure 1Existing Information
Sampling and Analysis PlanKenmore Sediment Characterization
Q:\Jo
bs\12
0891
-01.01
_Harb
or_Vil
lage_
Marin
a\Map
s\201
2_06
\Fig1
_Hist
oricS
ampli
ng.m
xd n
koch
ie 10
/12/20
12 2
:13:47
PM
0 200 400 600 800Feet
[
LEGEND!. Harbor Village Marina Cores!. Kenmore EIM-Sediment Results
Navigation ChannelDMMUs Not Dredged,Due to not meeting Open Water SuitabilityDMMUs Dredged
!( Catchbasin"6 Connections
GConveyanceStream

Introduction
Sampling and Analysis Plan October 2012 Kenmore Area Sediment and Water Characterization 3 120891-01.01
The Dredged Material Management Office (DMMO) at the USACE has indicated that a
screening level characterization will provide information about potential options for disposal
of dredged sediment. A full sediment characterization according to Dredged Material
Management Program (DMMP) protocols would provide information to determine if
sediment is suitable for unconfined open-water disposal. However, these results are only
valid for 2 years in areas ranked “High” by DMMP, which includes the Kenmore Navigation
Channel. Acquisition of funding and completion of maintenance dredging will not likely
occur within the next 2 years. Given the timing of the maintenance dredging, the DMMO
agreed that it made sense for the City to conduct a screening level assessment to provide
information to support pursuing federal funding for maintenance dredging, and hold off on a
full DMMP characterization effort until within two years of the anticipated maintenance
dredging event.
The owners of Northlake Marina are also participating in the sediment characterization
efforts in order to assess the options for sediment disposal in the event maintenance dredging
is conducted within the marina. The marina owners are interested in privately funding the
dredging of the marina in conjunction with the dredging of the Kenmore Navigation
Channel to save money and share costs (e.g., dredge equipment mobilization fees) with the
USACE.
1.2 Additional Nearshore Sediment and Surface Water Characterization
The City and Ecology will be conducting additional characterization activities to evaluate the
condition of nearshore sediment and surface water in the Kenmore area waterfront. The
purpose of the additional characterization is to determine sediment and water quality and
possible health and environmental risks. This information is to assist better understanding
whether potential contamination is present in sediment and surface water. The results are
intended to be used by Ecology for characterization activities to evaluate the presence and
concentration of chemicals and possible contamination in the lake and river waterfront areas
and to continue the MTCA evaluation of nearshore sediments. The SAP results will also be
used to support the Health Consultations to be developed by DOH in the vicinity of Log
Boom Park and adjacent to Kenmore Industrial Park (KIP) site also referred to as Lakepointe.
The results of this SAP may show that additional testing will be required to further detail

Introduction
Sampling and Analysis Plan October 2012 Kenmore Area Sediment and Water Characterization 4 120891-01.01
source or sources of contamination. The testing parameters and sample locations have been
reviewed by Ecology and DOH to support their anticipated evaluations.
1.2 Purpose and Objectives
Sampling for this project is intended to satisfy several objectives:
The screening level characterization for the Kenmore Navigation Channel and North
Lake Marina is intended to provide additional information on potential sediment
disposal options and preliminary future dredge budget costs in order to support
pursuing federal funding for maintenance dredging.
Additional characterization activities are intended to:
Describe the nearshore sediment matrix, grain size, chemical characteristics and
organic carbon content at the Kenmore area waterfront.
Evaluate the nearshore sediment and water column chemistry for human health
and environmental conditions as defined under MTCA by Ecology.
Evaluate the next step in determining waterfront conditions and may need further
testing and whether specific areas serve as sources of potential contamination.
Prepare Health Consultations by DOH in the vicinity of Log Boom Park and
nearshore to KIP site area.
This SAP has been developed in accordance with the 2008 DMMP User’s Manual (DMMO
2009) and Ecology’s Sediment Sampling and Analysis Plan Appendix (2008). The Ecology
sediment evaluation framework for freshwater is being revised and this information will be
available when published. For the screening level characterization in the navigation
channel, sample density is lower than required for a dredge material suitability
determination since this is a screening level investigation.
This SAP identifies specific sampling and analysis protocols for the sediment sampling
activities and provides detailed information regarding the field sampling objectives; sample
location and frequency, equipment, and procedures to be used during the sampling; and
sample handling and analysis. The SAP also provides the basis for planning field activities
and describes specific quality assurance (QA) protocols. All sample handling and analyses
will follow the most recent Puget Sound Estuary Program (PSEP) protocols for collecting and

Introduction
Sampling and Analysis Plan October 2012 Kenmore Area Sediment and Water Characterization 5 120891-01.01
handling sediment and water samples (PSEP 1986, 1997a, 1997b, 1997c) and the 2008
DMMP User’s Manual (including the 2009 update) and Clarification Papers and updates
(DMMO 2009; Hoffman 1998; Kendall 2001; USACE 2010; Inouye and Fox 2011).
A Health and Safety Plan for field sampling activities is also provided under separate cover
and presents the guidance for field health and safety procedures and considerations.
1.3 Background Information
1.3.1 Site Setting
The Kenmore Navigation Channel is located in the northeastern portion of Lake Washington
south of the City of Kenmore and northwest of the mouth of the Sammamish River. Lake
Washington is a freshwater lake that is connected to Lake Union by the Lake Washington
Ship Canal and to Puget Sound by way of the Hiram M. Chittenden Locks. Historical
activities in the area include lumber shipping and log booming. Current surrounding land
includes commercial, industrial and residential properties, parks, recreational marinas, and a
commercial float plane facility.
Washington Department of Fish and Wildlife operates a public boat launch west of the
Juanita Drive (68th Avenue NE) Bridge in Kenmore. There is also shoreline access at the
western portion of Log Boom Park that is used as a hand kayak launch (Figure 1).
One of the few remaining industrial ports on Lake Washington is in Kenmore at the mouth
of the Sammamish River. Businesses near the port include:
Rinker Materials Kenmore plant (cements and asphalts)
Kenmore Ready-Mix, a division of the CalPortland Company (cements and asphalt)
Kiewit General Manson (KGM; temporarily leasing property for the construction of
sections for the new State Route 520 bridge at the KIP site)
Kenmore Air Harbor (the nation's largest seaplane-only, commercial air facility)
North Lake Marina
Harbour Village Marina
Introduction
Sampling and Analysis Plan October 2012 Kenmore Area Sediment and Water Characterization 6 120891-01.01
CalPortland, Rinker Materials, and KGM rely on barge access to provide and distribute
materials (e.g., sand, gravel, landscape materials, and construction materials) for their
operations (ESA Adolfson 2010).
1.3.2 Summary of Previous Sediment Characterization and Dredging
The sediment data and dredging information presented in this section are from readily
available information. The sediment data were obtained from Washington State Department
of Ecology’s (Ecology) Environmental Information Management (EIM) database and from
dredge material evaluations from the DMMO, which also included the dredging information.
Previous suitability determinations were accessed from the DMMO website
(http://www.nws.usace.army.mil/Missions/CivilWorks/Dredging/SuitabilityDeterminations.a
spx).
In 1993, King County characterized and dredged 16,800 cy of sediment from the Sammamish
River Small Boat Navigation Channel (Figure 1). Four dredge material management units
(DMMUs) were characterized, with the DMMP Screening Level (SL) interpretive criteria for
dichlorodiphenyltrichloroethane (DDT) exceeded in one DMMU. This DMMU was
subsequently submitted for bioassay testing and passed, resulting in all four DMMUs
determined to be suitable for open water disposal. No dioxin and furan testing was
performed during this dredge characterization (USACE 1992).
Sediment from the Kenmore Navigation Channel was last characterized and dredged in 1996
(USACE 1996). Fifteen DMMUs were analyzed for DMMP analytes (metals, polychlorinated
biphenyls [PCBs], semi-volatile organic compounds [SVOCs], volatile organic compounds,
pesticides, tributyltin [TBT] and conventionals) to evaluate 60,000 cy of sediment. PCB
sediment concentrations from the DMMUs ranged from 17 to 88 micrograms per kilogram
(μg/kg), which is below the SL of 130 μg/kg (USACE 1996). Three of the DMMUs exceeded
DMMP interpretive criteria; DMMU each exceeded for polycyclic aromatic hydrocarbons
(PAHs), TBT and DDT. However, the one DMMU with PAH exceedances passed biological
Introduction
Sampling and Analysis Plan October 2012 Kenmore Area Sediment and Water Characterization 7 120891-01.01
testing and was determined to be suitable for non-dispersive open‐water disposal.1 The two
other DMMUs with TBT and DDT exceedances failed the biological interpretive criteria and
were unsuitable for open‐water disposal (Figure 1). The unsuitable material (8,000 cy) was
not dredged and 52,000 cy of sediment was dredged. No dioxin and furan testing was
performed during this dredge characterization.
In 2011, in preparation for proposed maintenance dredging of Harbour Village Marina, the
marina owners conducted dredge characterization sediment sampling and analysis. Three
DMMUs from the Harbour Village Marina, as shown in Figure 1, were evaluated for disposal
options for an anticipated 7,427 cy of sediment. From each DMMU, two or three (depending
on the DMMU) cores were composited and submitted for DMMP analytes to evaluate dredge
sediment. Additionally, z-samples were collected and composted for each DMMU from the
underlying sediment surface that would be exposed after dredging is completed (i.e., z-layer)
to evaluate the new sediment surface.
The DMMU samples from Harbour Village Marina had total PCB concentrations of 196, 237,
and 277 μg/kg (or parts per billion) and dioxin/furan toxic equivalency (TEQ) of 43.2, 77.3,
and 92.1 nanograms per kilogram (ng/kg; or parts per trillion), respectively. Additionally,
sediment within the underlying sediment surface that would be exposed after dredging is
completed (z-layer) had total PCB concentrations of 104, 126, and 237 μg/kg and
dioxin/furan TEQ of 0.9, 11.1, and 6 ng/kg. To address the elevated dioxin/furan and PCB
concentrations in the sediment that could be exposed by dredging, the DMMP agencies will
require the placement of a 1‐foot cover of clean sand as a special condition to the dredging
permit (USACE 2011). Further testing needs to be conducted. Dredging in Harbour Village
Marina has not been completed.
In 2005, a surface sediment sample (LW-SS3-010) and field duplicate sample (LW-SS6-010)
were collected adjacent to the Kenmore Navigation Channel as part of a regional background
investigation. The sediment samples were analyzed for dioxin and furans, and PCBs. PCBs
were not detected in either sample, however dioxin/furan TEQ, which was reported as an
1 PAH exceedances were based on 1996 interpretive criteria for acenaphthene, anthracene, fluorene, and
phenanthrene, which would not have been exceedances based on the current DMMP guidance.

Introduction
Sampling and Analysis Plan October 2012 Kenmore Area Sediment and Water Characterization 8 120891-01.01
average concentration between the sample and duplicate resulted in an estimated
concentration of 13.2 ng/kg (Windward 2010).
In 2000, as part of a lake-wide sediment evaluation investigation, one sample, L18493-1, was
collected near Kenmore (King County 2004). PCBs were not detected and no chemicals
exceeded DMMP interpretive criteria. Dioxin and furans were not analyzed.
1.3.3 Potential Sediment Loading and Contamination Sources
The principal sediment loading source for the Kenmore Navigation Channel is likely from
two sources: the Sammamish River and wind and wave transport on Lake Washington. The
14-mile Sammamish River drains from Lake Sammamish and flows through Redmond,
Woodinville, Bothell, and Kenmore, before emptying into Lake Washington bringing
suspended solids and sediment with the river. Also, the westerly winds blow across Lake
Washington towards the east and northeast, bringing increased wave action and suspended
solids within the lake water column towards the northeast shoreline of Lake Washington.
Sediment also enters the lake from small creeks and stormwater drains. Tributary 0056
discharges at the north shore at Harbour Village Marina, and Log Boom Park area. Creek
0056 diverges just before the Lake Washington shoreline, and drains to the central portion
and just to the west of Harbour Village Marina. The creek drains approximately 1.85 square
miles associated with State Route 522 (Northeast Bothell Way) and other residential and
urban areas (Herrera 2007) and has experienced flooding and sediment loading (ESA
Adolfson 2010). The City conducted investigations in 2005 and 2007 to investigate the
current and historical sediment production within this creek, develop sediment management
strategies, and evaluate sedimentation reduction alternatives (Herrera 2005, 2007). The City
reinforced the western part of the discharge in 2010 to prevent further erosion. Other
sources of sediments to the shoreline include stormwater outfalls, which are shown on
Figure 1.
There are several areas with historical activities that could have contributed to
contamination. One area is the KIP site located adjacent to and north of the mouth of the
Sammamish River. The 45-acre KIP site forms a peninsula that extends into Lake
Introduction
Sampling and Analysis Plan October 2012 Kenmore Area Sediment and Water Characterization 9 120891-01.01
Washington south of the Navigation Channel. Another area is a plywood mill that was
formerly located north of the KIP and east of the North Lake Marina. Other sources are
various commercial and industrial activities at the current location of the CalPortland
Company and Cemex in Kenmore Harbor.
In the late 1970s, at the current location of CalPortland Company, there was a fire on the
wharf that burned about half of the decking. The wharf was constructed of old creosote
timbers and the burned wharf remained along the Kenmore shoreline for several years
before the burned debris was removed (LaFlam 2012).
The KIP is currently under Consent Decree with Ecology for site cleanup and monitoring
activities (Ecology 2012a). This area was submerged prior to 1916, when the USACE lowered
the level of Lake Washington. Subsequently, the area was filled with demolition debris in
the 1950s and 1960s until 1969 to form its present day configuration. The site was operated
as a landfill from 1965 to 1981. Fill records indicate that debris from demolition and
construction projects, stumps, and restaurant waste were disposed of at the site. Some
records list medical wastes and electric transformers were deposited at the landfill; however,
testing has not identified medical wastes nor transformers at this site. The landfill was
subsequently graded, covered with clean soil, and used as an industrial park (AMEC 2001).
KIP soil, groundwater, and sediment testing have shown no known chemicals of concern are
migrating from the former landfill. Testing has shown the chemicals of concern at the
former landfill are petroleum diesel and oil, and three metals (arsenic, barium, and lead).
Testing in 2001, 2011, and 2012 show no PCBs detected at this site, with one exception. The
exception was a wood chip and the sample was dismissed as poor quality. Hence, the KIP
site does not appear to be a source for PCBs. No testing for dioxin and furans has occurred to
date. The proposed SAP will evaluate PCBs and dioxin and furans in addition to metals,
PAHs, pesticides and semi-volatile organic compounds, and tributyltin (bulk) off-shore of the
KIP site.
Historical operations at the KIP site included assorted small storage and manufacturing
industries, sand and gravel staging and support facilities, and associated offices. Currently,
the site is operated as an industrial park including SR 520 bridge reconstruction, a sand and

Introduction
Sampling and Analysis Plan October 2012 Kenmore Area Sediment and Water Characterization 10 120891-01.01
gravel stockpile yard, Lakeshore Marine Construction, and storage and light industrial
operations.
A contractor for the SR 520 bridge reconstruction, Kiewit General Manson (KGM) is
temporarily leasing the 14-acre western portion of the property for the construction of
sections for the new bridge and their work is estimated to be finished in 2015.
The KIP site conducts periodic groundwater monitoring to evaluate if any chemicals are
migrating from the site to adjacent waterways (i.e., Lake Washington, Sammamish River, and
the Kenmore Navigation Channel). Recent monitoring in 2009, 2010, and April 2012 show
continued compliance with the 2001 Consent Decree. The 2009-2012 groundwater
compliance results show all known chemicals of concern at this site (petroleum diesel and
oil, arsenic, barium, and lead) are below detection level and/or below cleanup action level
(Ecology 2012a). Next monitoring is scheduled for October, and these results will be
available in December 2012.
Sampling and Analysis Plan October 2012 Kenmore Sediment and Water Characterization 11 120891-01.01
2 PROJECT MANAGEMENT AND RESPONSIBILITIES
This section describes the overall project management strategy for implementing and
reporting for the SAP results.
2.1 Project Planning and Coordination
Dan Berlin of Anchor QEA will be the overall project manager responsible for developing
and completing the SAP. Following SAP approval by DMMO and Ecology, Mr. Berlin will
be responsible for administrative coordination to ensure the timely and successful
completion of the screening level characterization. He will provide a copy of the approved
SAP to all sampling and testing subcontractors. Any significant deviation from the approved
sampling plan will be coordinated with the DMMO and Ecology.
2.2 Field Sample Collection
David Gillingham of Anchor QEA will serve as the field coordinator (FC) and will provide
overall direction to the field sampling in logistics, personnel assignments, and field
operations. The FC will supervise field collection of the sediment and water samples and
will be responsible for ensuring accurate positioning and recording of sample locations,
depths, and identification; ensuring conformity to sampling and handling requirements,
including field decontamination procedures; physical evaluation and documentation of the
samples; and delivery of the samples to the laboratory. Ecology will participate in the
sampling event.
Anchor QEA will ensure that sediment and water samples are stored under proper
conditions in their custody until delivery to the laboratory. The FC will be responsible for
summarizing field sampling activities. This summary will include details of the sampling
effort, sample preparation, sample storage and transport procedures, field QA, and document
any deviation from the final SAP.
The sampling and analysis will be completed with equipment owned or rented by Anchor
QEA. All subconsultants, Ecology and Anchor QEA will follow the protocols established in
this SAP.
Project Management and Responsibilities
Sampling and Analysis Plan October 2012 Kenmore Area Sediment and Water Characterization 12 120891-01.01
2.3 Laboratory Preparation and Analyses
Sue Dunnihoo of Analytical Resources, Inc. (ARI), Tukwila, Washington, will be responsible
for physical and chemical analyses. Ms. Dunnihoo will ensure that the submitted samples
are handled and analyzed in accordance with DMMP analytical testing protocols, QA/quality
control (QC) requirements, and the requirements specified in this SAP (Section 5). ARI will
provide certified, pre-cleaned sample containers and sample preservatives as appropriate.
ARI will prepare a data package containing all analytical and QA/QC results.
2.4 Quality Assurance/Quality Control Management
Delaney Peterson of Anchor QEA, or her designee, will serve as QA/QC Manager for this
project and will be responsible for all coordination with the analytical laboratory. She will
perform oversight for both the field sampling and laboratory programs. She will be kept
fully informed of field program procedures and progress during sample collection and
laboratory activities during sample preparation. She will record and correct any activities
that vary from this SAP. Upon completion of the sampling and analytical program, she will
review laboratory QA/QC results and incorporate findings into the sampling and analysis
Results Memorandum. Any QA/QC problems will be brought to the attention of the DMMO
and Ecology as soon as possible to discuss issues related to the problem and to evaluate
potential solutions.
2.5 Sampling and Analysis Results Memorandum
Mr. Berlin, or his designee, will be responsible for preparation of the Results Memorandum
to support the suitability determination. The Results Memorandum will summarize the
sampling effort; analytical methods; QA/QC narrative; and analytical sediment results with
comparison to DMMP interpretive criteria (for screening level characterization sediment
samples) and Ecology’s interim freshwater Sediment Quality Values (SQV; for all sediment
samples) as shown in Table 2. The water sample analytical results will also be presented in
the Results Memorandum. The complete content of the Results Memorandum is described
in Section 6.
Sampling and Analysis Plan October 2012 Kenmore Area Sediment and Water Characterization 13 120891-01.01
3 SAMPLE COLLECTION, PROCESSING, AND HANDLING PROCEDURES
This section addresses the sample collection, processing, and handling procedures that will
be used to ensure data quality and chain-of-custody (COC).
3.1 Sampling Schedule
Sampling will occur within 3 weeks after approval of this SAP by DMMO and Ecology in fall
2012. The Anchor QEA project manager will coordinate with the appropriate City manager
and Ecology. It is anticipated that field sampling activities can be completed within three
days.
3.2 Station and Sample Identification and Nomenclature
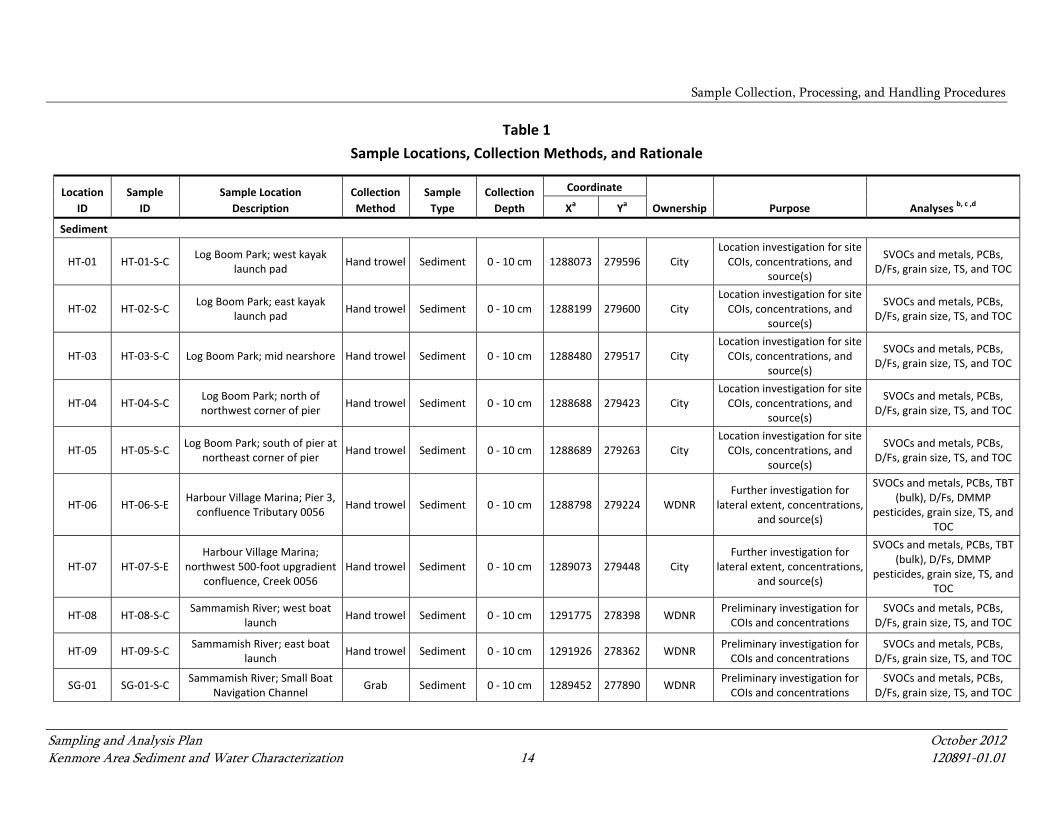
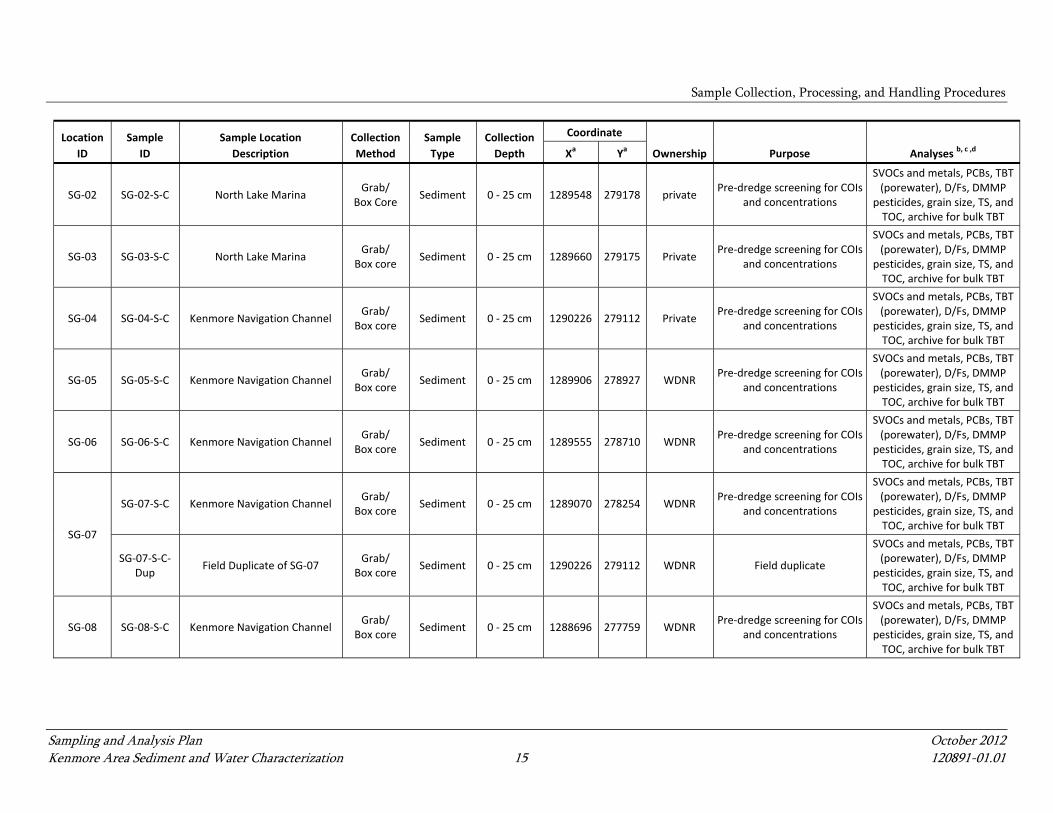
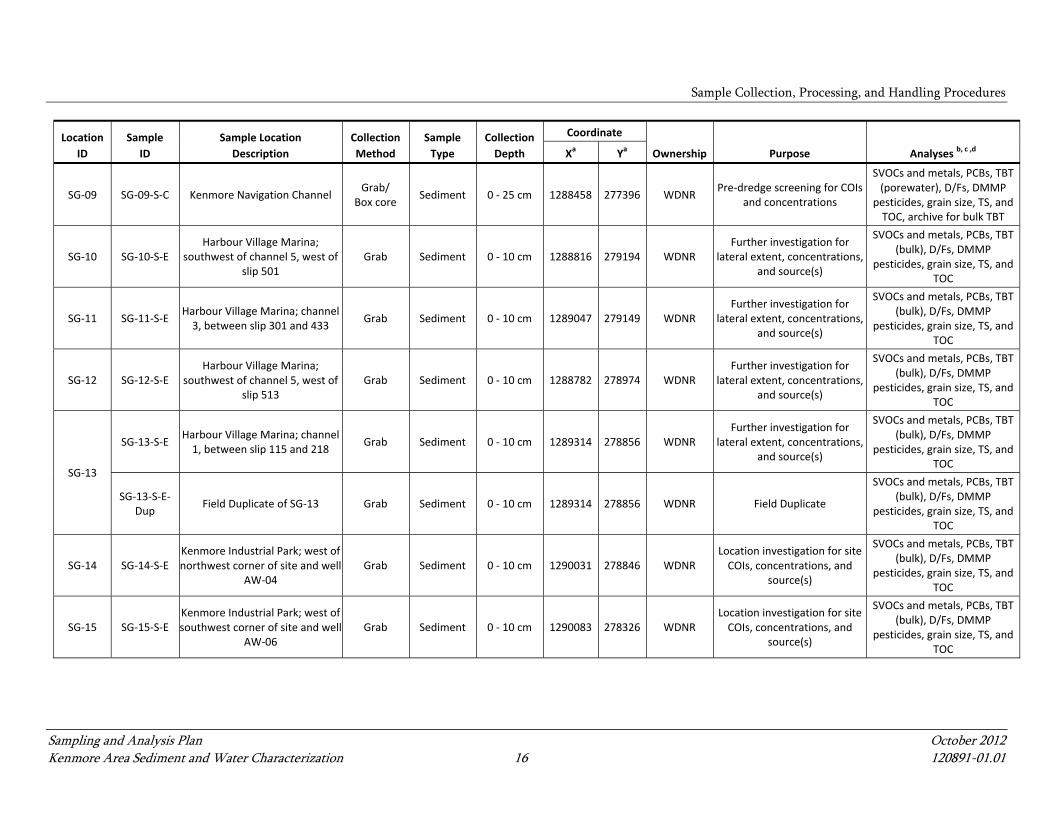
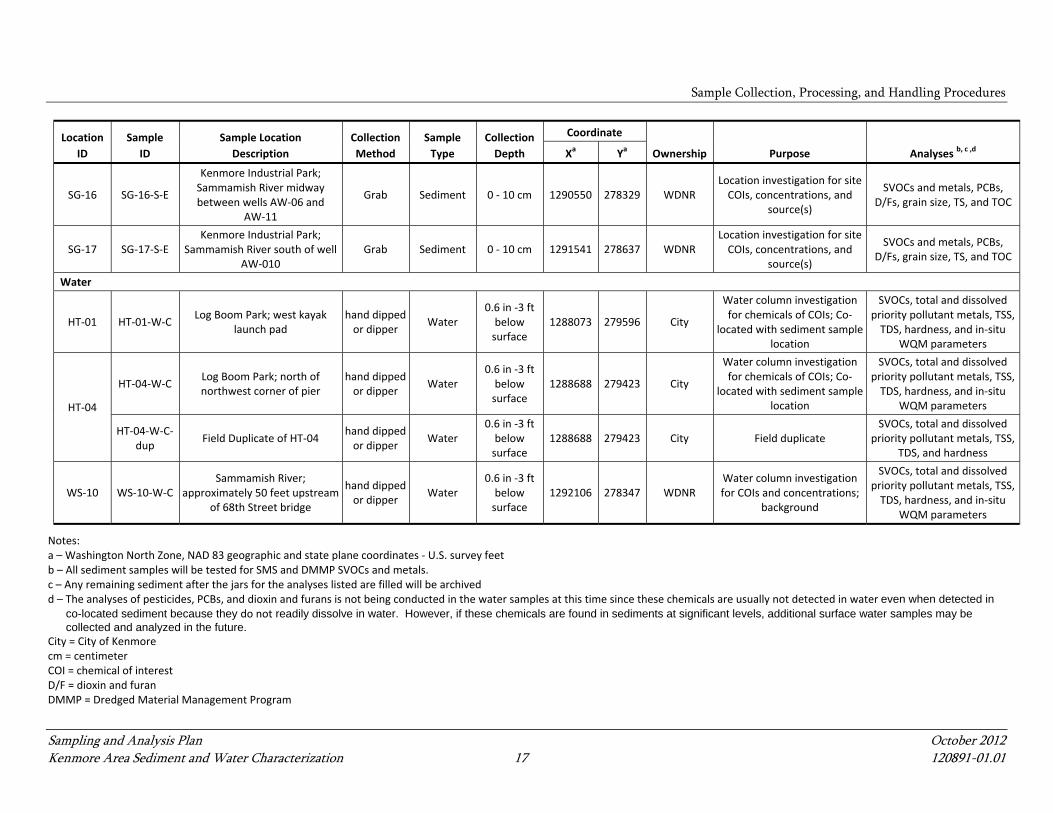
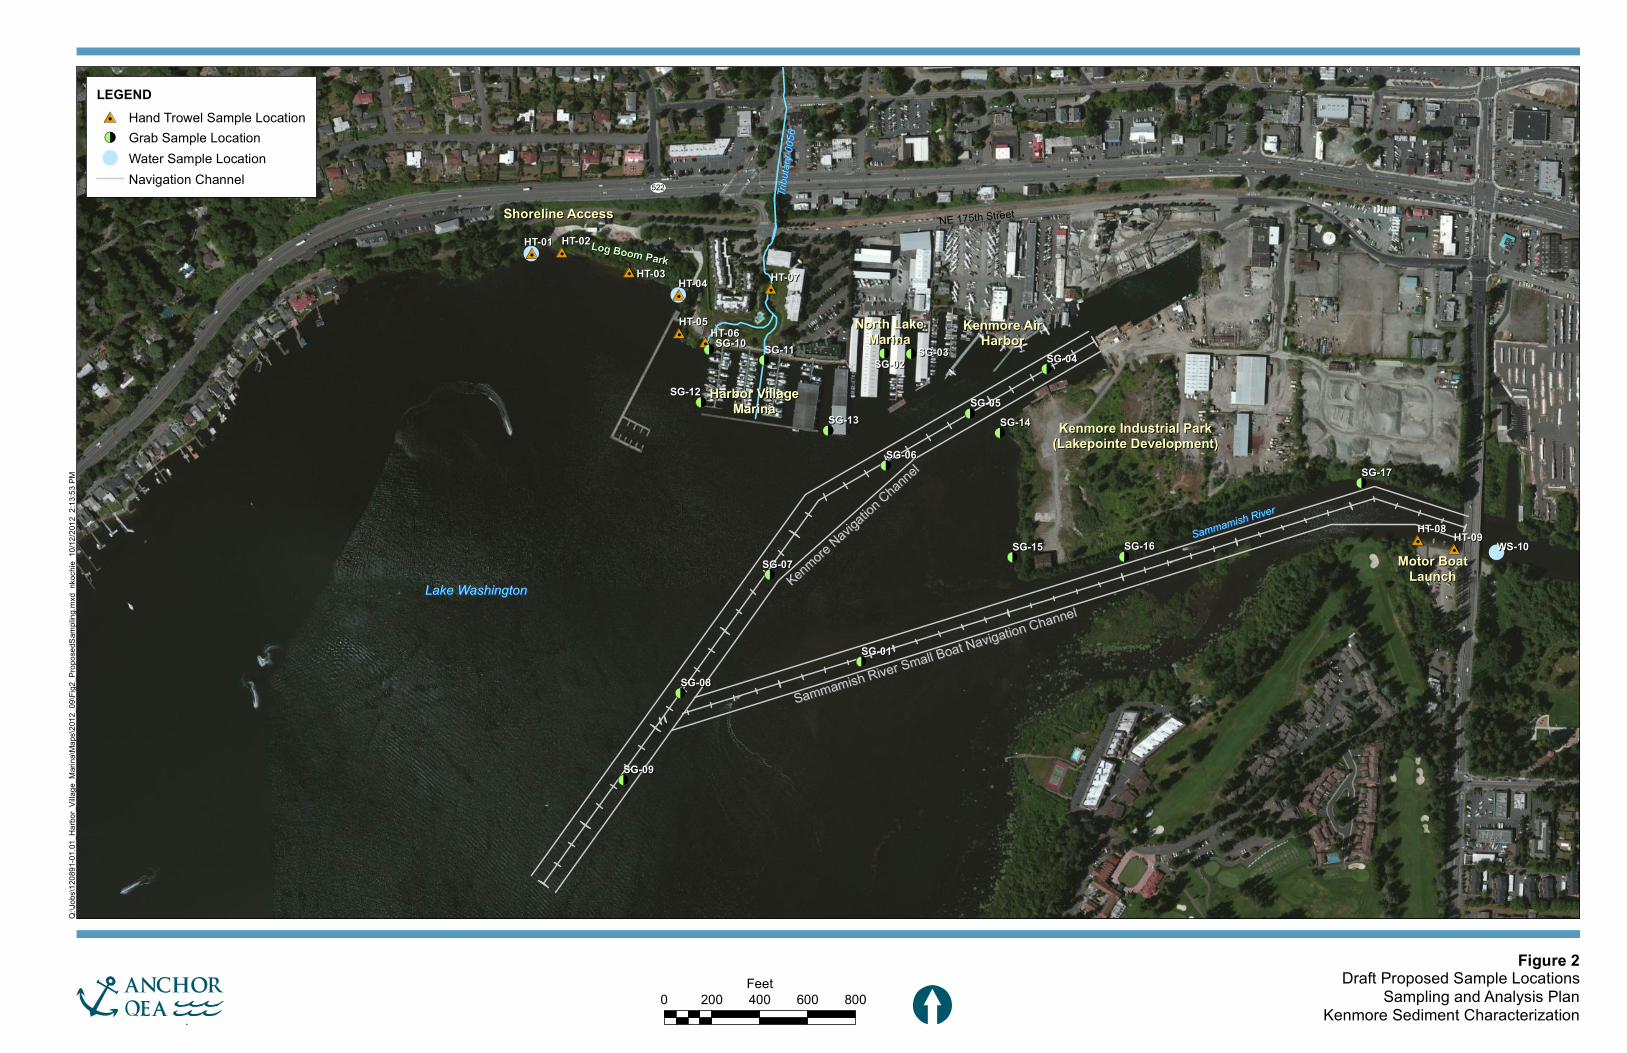
Figure 2 presents the proposed surface sediment and water sampling locations. Table 1
presents detailed summaries of the sediment and water sampling design including sample
nomenclature for each station and sample. The sample nomenclature is described below.
Each sample will be assigned a unique alphanumeric identifier according to the following
method:
Each sample identification (ID) will be identified by Sample Method-Location
Number-Matrix-Sample Sponsor
Sample method will be identified by two letters: SG for sediment grab, HT for
sediment hand trowel, WS for surface water (back ground location only). Three
of the water sample locations are co-located with hand trowel locations and
therefore will begin with HT and the same location number to indicate that the
sample is co-located and followed by W to indicate water sample.
Sample location number will be in order of sampling locations beginning with -01
(e.g., SG-01-S-C)
Sample matrix will be S for sediment and W for water
Sample sponsor will C for City and E for Ecology
A field duplicate collected from a sample will be identified by the addition of “Dup”
to the sample number. A duplicate sample of the above example would be SG-01-S-
C-Dup.
Sample Collection, Processing, and Handling Procedures
Sampling and Analysis Plan October 2012 Kenmore Area Sediment and Water Characterization 14 120891-01.01
Table 1
Sample Locations, Collection Methods, and Rationale
Location
ID
Sample
ID
Sample Location
Description
Collection
Method
Sample
Type
Collection
Depth
Coordinate
Ownership Purpose Analyses b, c ,d Xa Ya
Sediment
HT‐01 HT‐01‐S‐C Log Boom Park; west kayak
launch pad Hand trowel Sediment 0 ‐ 10 cm 1288073 279596 City
Location investigation for site COIs, concentrations, and
source(s)
SVOCs and metals, PCBs, D/Fs, grain size, TS, and TOC
HT‐02 HT‐02‐S‐C Log Boom Park; east kayak
launch pad Hand trowel Sediment 0 ‐ 10 cm 1288199 279600 City
Location investigation for site COIs, concentrations, and
source(s)
SVOCs and metals, PCBs, D/Fs, grain size, TS, and TOC
HT‐03 HT‐03‐S‐C Log Boom Park; mid nearshore Hand trowel Sediment 0 ‐ 10 cm 1288480 279517 City Location investigation for site COIs, concentrations, and
source(s)
SVOCs and metals, PCBs, D/Fs, grain size, TS, and TOC
HT‐04 HT‐04‐S‐C Log Boom Park; north of northwest corner of pier
Hand trowel Sediment 0 ‐ 10 cm 1288688 279423 City Location investigation for site COIs, concentrations, and
source(s)
SVOCs and metals, PCBs, D/Fs, grain size, TS, and TOC
HT‐05 HT‐05‐S‐C Log Boom Park; south of pier at
northeast corner of pier Hand trowel Sediment 0 ‐ 10 cm 1288689 279263 City
Location investigation for site COIs, concentrations, and
source(s)
SVOCs and metals, PCBs, D/Fs, grain size, TS, and TOC
HT‐06 HT‐06‐S‐E Harbour Village Marina; Pier 3, confluence Tributary 0056
Hand trowel Sediment 0 ‐ 10 cm 1288798 279224 WDNR Further investigation for
lateral extent, concentrations, and source(s)
SVOCs and metals, PCBs, TBT (bulk), D/Fs, DMMP
pesticides, grain size, TS, and TOC
HT‐07 HT‐07‐S‐E Harbour Village Marina;
northwest 500‐foot upgradient confluence, Creek 0056
Hand trowel Sediment 0 ‐ 10 cm 1289073 279448 City Further investigation for
lateral extent, concentrations, and source(s)
SVOCs and metals, PCBs, TBT (bulk), D/Fs, DMMP
pesticides, grain size, TS, and TOC
HT‐08 HT‐08‐S‐C Sammamish River; west boat
launch Hand trowel Sediment 0 ‐ 10 cm 1291775 278398 WDNR
Preliminary investigation for COIs and concentrations
SVOCs and metals, PCBs, D/Fs, grain size, TS, and TOC
HT‐09 HT‐09‐S‐C Sammamish River; east boat
launch Hand trowel Sediment 0 ‐ 10 cm 1291926 278362 WDNR
Preliminary investigation for COIs and concentrations
SVOCs and metals, PCBs, D/Fs, grain size, TS, and TOC
SG‐01 SG‐01‐S‐C Sammamish River; Small Boat
Navigation Channel Grab Sediment 0 ‐ 10 cm 1289452 277890 WDNR
Preliminary investigation for COIs and concentrations
SVOCs and metals, PCBs, D/Fs, grain size, TS, and TOC
Sample Collection, Processing, and Handling Procedures
Sampling and Analysis Plan October 2012 Kenmore Area Sediment and Water Characterization 15 120891-01.01
Location
ID
Sample
ID
Sample Location
Description
Collection
Method
Sample
Type
Collection
Depth
Coordinate
Ownership Purpose Analyses b, c ,d Xa Ya
SG‐02 SG‐02‐S‐C North Lake Marina Grab/
Box Core Sediment 0 ‐ 25 cm 1289548 279178 private
Pre‐dredge screening for COIs and concentrations
SVOCs and metals, PCBs, TBT (porewater), D/Fs, DMMP
pesticides, grain size, TS, and TOC, archive for bulk TBT
SG‐03 SG‐03‐S‐C North Lake Marina Grab/
Box core Sediment 0 ‐ 25 cm 1289660 279175 Private
Pre‐dredge screening for COIs and concentrations
SVOCs and metals, PCBs, TBT (porewater), D/Fs, DMMP
pesticides, grain size, TS, and TOC, archive for bulk TBT
SG‐04 SG‐04‐S‐C Kenmore Navigation Channel Grab/
Box core Sediment 0 ‐ 25 cm 1290226 279112 Private
Pre‐dredge screening for COIs and concentrations
SVOCs and metals, PCBs, TBT (porewater), D/Fs, DMMP
pesticides, grain size, TS, and TOC, archive for bulk TBT
SG‐05 SG‐05‐S‐C Kenmore Navigation Channel Grab/
Box core Sediment 0 ‐ 25 cm 1289906 278927 WDNR
Pre‐dredge screening for COIs and concentrations
SVOCs and metals, PCBs, TBT (porewater), D/Fs, DMMP
pesticides, grain size, TS, and TOC, archive for bulk TBT
SG‐06 SG‐06‐S‐C Kenmore Navigation Channel Grab/
Box core Sediment 0 ‐ 25 cm 1289555 278710 WDNR
Pre‐dredge screening for COIs and concentrations
SVOCs and metals, PCBs, TBT (porewater), D/Fs, DMMP
pesticides, grain size, TS, and TOC, archive for bulk TBT
SG‐07
SG‐07‐S‐C Kenmore Navigation Channel Grab/
Box core Sediment 0 ‐ 25 cm 1289070 278254 WDNR
Pre‐dredge screening for COIs and concentrations
SVOCs and metals, PCBs, TBT (porewater), D/Fs, DMMP
pesticides, grain size, TS, and TOC, archive for bulk TBT
SG‐07‐S‐C‐Dup
Field Duplicate of SG‐07 Grab/
Box core Sediment 0 ‐ 25 cm 1290226 279112 WDNR Field duplicate
SVOCs and metals, PCBs, TBT (porewater), D/Fs, DMMP
pesticides, grain size, TS, and TOC, archive for bulk TBT
SG‐08 SG‐08‐S‐C Kenmore Navigation Channel Grab/
Box core Sediment 0 ‐ 25 cm 1288696 277759 WDNR
Pre‐dredge screening for COIs and concentrations
SVOCs and metals, PCBs, TBT (porewater), D/Fs, DMMP
pesticides, grain size, TS, and TOC, archive for bulk TBT
Sample Collection, Processing, and Handling Procedures
Sampling and Analysis Plan October 2012 Kenmore Area Sediment and Water Characterization 16 120891-01.01
Location
ID
Sample
ID
Sample Location
Description
Collection
Method
Sample
Type
Collection
Depth
Coordinate
Ownership Purpose Analyses b, c ,d Xa Ya
SG‐09 SG‐09‐S‐C Kenmore Navigation Channel Grab/
Box core Sediment 0 ‐ 25 cm 1288458 277396 WDNR
Pre‐dredge screening for COIs and concentrations
SVOCs and metals, PCBs, TBT (porewater), D/Fs, DMMP
pesticides, grain size, TS, and TOC, archive for bulk TBT
SG‐10 SG‐10‐S‐E Harbour Village Marina;
southwest of channel 5, west of slip 501
Grab Sediment 0 ‐ 10 cm 1288816 279194 WDNR Further investigation for
lateral extent, concentrations, and source(s)
SVOCs and metals, PCBs, TBT (bulk), D/Fs, DMMP
pesticides, grain size, TS, and TOC
SG‐11 SG‐11‐S‐E Harbour Village Marina; channel 3, between slip 301 and 433
Grab Sediment 0 ‐ 10 cm 1289047 279149 WDNR Further investigation for
lateral extent, concentrations, and source(s)
SVOCs and metals, PCBs, TBT (bulk), D/Fs, DMMP
pesticides, grain size, TS, and TOC
SG‐12 SG‐12‐S‐E Harbour Village Marina;
southwest of channel 5, west of slip 513
Grab Sediment 0 ‐ 10 cm 1288782 278974 WDNR Further investigation for
lateral extent, concentrations, and source(s)
SVOCs and metals, PCBs, TBT (bulk), D/Fs, DMMP
pesticides, grain size, TS, and TOC
SG‐13
SG‐13‐S‐E Harbour Village Marina; channel 1, between slip 115 and 218
Grab Sediment 0 ‐ 10 cm 1289314 278856 WDNR Further investigation for
lateral extent, concentrations, and source(s)
SVOCs and metals, PCBs, TBT (bulk), D/Fs, DMMP
pesticides, grain size, TS, and TOC
SG‐13‐S‐E‐Dup
Field Duplicate of SG‐13 Grab Sediment 0 ‐ 10 cm 1289314 278856 WDNR Field Duplicate
SVOCs and metals, PCBs, TBT (bulk), D/Fs, DMMP
pesticides, grain size, TS, and TOC
SG‐14 SG‐14‐S‐E Kenmore Industrial Park; west of northwest corner of site and well
AW‐04 Grab Sediment 0 ‐ 10 cm 1290031 278846 WDNR
Location investigation for site COIs, concentrations, and
source(s)
SVOCs and metals, PCBs, TBT (bulk), D/Fs, DMMP
pesticides, grain size, TS, and TOC
SG‐15 SG‐15‐S‐E Kenmore Industrial Park; west of southwest corner of site and well
AW‐06 Grab Sediment 0 ‐ 10 cm 1290083 278326 WDNR
Location investigation for site COIs, concentrations, and
source(s)
SVOCs and metals, PCBs, TBT (bulk), D/Fs, DMMP
pesticides, grain size, TS, and TOC
Sample Collection, Processing, and Handling Procedures
Sampling and Analysis Plan October 2012 Kenmore Area Sediment and Water Characterization 17 120891-01.01
Location
ID
Sample
ID
Sample Location
Description
Collection
Method
Sample
Type
Collection
Depth
Coordinate
Ownership Purpose Analyses b, c ,d Xa Ya
SG‐16 SG‐16‐S‐E
Kenmore Industrial Park; Sammamish River midway between wells AW‐06 and
AW‐11
Grab Sediment 0 ‐ 10 cm 1290550 278329 WDNR Location investigation for site COIs, concentrations, and
source(s)
SVOCs and metals, PCBs, D/Fs, grain size, TS, and TOC
SG‐17 SG‐17‐S‐E Kenmore Industrial Park;
Sammamish River south of well AW‐010
Grab Sediment 0 ‐ 10 cm 1291541 278637 WDNR Location investigation for site COIs, concentrations, and
source(s)
SVOCs and metals, PCBs, D/Fs, grain size, TS, and TOC
Water
HT‐01 HT‐01‐W‐C Log Boom Park; west kayak
launch pad hand dipped or dipper
Water 0.6 in ‐3 ft below surface
1288073 279596 City
Water column investigation for chemicals of COIs; Co‐
located with sediment sample location
SVOCs, total and dissolved priority pollutant metals, TSS, TDS, hardness, and in‐situ
WQM parameters
HT‐04
HT‐04‐W‐C Log Boom Park; north of northwest corner of pier
hand dipped or dipper
Water 0.6 in ‐3 ft below surface
1288688 279423 City
Water column investigation for chemicals of COIs; Co‐
located with sediment sample location
SVOCs, total and dissolved priority pollutant metals, TSS, TDS, hardness, and in‐situ
WQM parameters
HT‐04‐W‐C‐dup
Field Duplicate of HT‐04 hand dipped or dipper
Water 0.6 in ‐3 ft below surface
1288688 279423 City Field duplicate SVOCs, total and dissolved
priority pollutant metals, TSS, TDS, and hardness
WS‐10 WS‐10‐W‐C Sammamish River;
approximately 50 feet upstream of 68th Street bridge
hand dipped or dipper
Water 0.6 in ‐3 ft below surface
1292106 278347 WDNR Water column investigation for COIs and concentrations;
background
SVOCs, total and dissolved priority pollutant metals, TSS, TDS, hardness, and in‐situ
WQM parameters
Notes: a – Washington North Zone, NAD 83 geographic and state plane coordinates ‐ U.S. survey feet b – All sediment samples will be tested for SMS and DMMP SVOCs and metals. c – Any remaining sediment after the jars for the analyses listed are filled will be archived d – The analyses of pesticides, PCBs, and dioxin and furans is not being conducted in the water samples at this time since these chemicals are usually not detected in water even when detected in
co-located sediment because they do not readily dissolve in water. However, if these chemicals are found in sediments at significant levels, additional surface water samples may be collected and analyzed in the future.
City = City of Kenmore cm = centimeter COI = chemical of interest D/F = dioxin and furan DMMP = Dredged Material Management Program

Sample Collection, Processing, and Handling Procedures
Sampling and Analysis Plan October 2012 Kenmore Area Sediment and Water Characterization 18 120891-01.01
m = meter PCB = polychlorinated biphenyl SMS = Sediment Management Standards SVOC = semivolatile organic compound TOC = total organic carbon TBT = tributyltin TS = total solids TSS = total suspended solids WDNR = Washington Department of Natural Resources
!
!
!
#0
#0
!<
!<
!<
!<
!<
!<
!<
#0
!< !<
#0
#0
#0!<
!<
!<
!<
!<
!<
!<
!<
#0
#0#0
Kenmore Industrial ParkKenmore Industrial Park(Lakepointe Development)(Lakepointe Development)
Lake WashingtonLake Washington
Sammamish RiverSammamish River
North LakeNorth LakeMarinaMarina
Kenmore AirKenmore AirHarborHarbor
Log Boom ParkLog Boom Park
Harbor VillageHarbor VillageMarinaMarina
ST522
NE 175th Street
Sammamish River Small Boat Navigation Channel
Sammamish River Small Boat Navigation ChannelKenmore N
avigation Channel
Kenmore Naviga
tion Channel
Motor BoatMotor BoatLaunchLaunch
Shoreline AccessShoreline Access
Tribu
tary 0
056
Tribu
tary 0
056
HT-01HT-01
HT-05HT-05
SG-04SG-04
SG-05SG-05
SG-06SG-06
SG-07SG-07
SG-08SG-08
SG-09SG-09
SG-01SG-01
HT-08HT-08
SG-02SG-02SG-03SG-03
HT-02HT-02
HT-03HT-03
HT-06HT-06SG-10SG-10
SG-12SG-12
SG-11SG-11
SG-13SG-13
SG-15SG-15
SG-14SG-14
SG-16SG-16
SG-17SG-17
HT-09HT-09
HT-07HT-07HT-04HT-04
WS-10WS-10
Figure 2Draft Proposed Sample Locations
Sampling and Analysis PlanKenmore Sediment Characterization
Q:\Jo
bs\12
0891
-01.01
_Harb
or_Vil
lage_
Marin
a\Map
s\201
2_09
\Fig2
_Prop
osed
Samp
ling.m
xd n
koch
ie 10
/12/20
12 2
:13:53
PM
0 200 400 600 800Feet
[
LEGEND#0 Hand Trowel Sample Location!< Grab Sample Location! Water Sample Location
Navigation Channel
Sample Collection, Processing, and Handling Procedures
Sampling and Analysis Plan October 2012 Kenmore Area Sediment and Water Characterization 20 120891-01.01
3.3 Station Positioning
Horizontal positioning will be determined by the onboard differential global positioning
system (DGPS) based on target coordinates shown in Table 1. Measured station positions
will be converted to latitudinal and longitudinal coordinates (North American Datum [NAD]
83) to the nearest 0.01 second. The accuracy of measured and recorded horizontal
coordinates is typically less than 1 meter and will be within 2 meters following DMMP
guidance. Vertical elevation of each station will be measured using a fathometer or lead line.
Lake elevations will be based the USACE’s monitoring station at the Lake Washington Ship
Canal Elevation at the Hiram M. Chittenden Locks and recorded each day of the sampling
event.
3.4 Collection Methods
Twenty-eight sediment samples will be collected from the following areas: Kenmore
Navigation Channel, Sammamish River, at the shoreline at Log Boom Park, near and offshore
of the KIP, at the public motor boat launch in the Sammamish River, from Tributary 0056,
and from the Harbor Village Marina and North Lake Marina. Three water samples
(including a duplicate) will be collected at Log Boom Park and, one background water
sample will be collected upstream of the 68th Avenue NE bridge on the Sammamish River.
The sediment and water sampling methods are described in greater detail below. The
location ID, sample ID, collection method, and collection depth are presented on Table 1.
The sample locations are shown on Figure 2.
3.4.1 Sediment
Samples from the navigation channel are anticipated to be collected using a box core or
power grab sampler or similar device to the maximum penetration possible (target 25
centimeter [cm] below mudline) to better represent what could be removed during dredging.
Samples from other submerged areas away from the shoreline will be collected from the top
10 cm using a grab sampler (e.g., VanVeen or Ekman sampler). Samples from Log Boom
Park, at the public motor boat launch, and in Tributary 0056 will be collected on foot using a
hand trowel from shallow submerged or exposed sediment areas. Care will be taken to
prevent re-suspension of sediment prior to and during sampling.
Sample Collection, Processing, and Handling Procedures
Sampling and Analysis Plan October 2012 Kenmore Area Sediment and Water Characterization 21 120891-01.01
For all other samples, sampling locations will be approached at slow boat speed with minimal
wake to minimize disturbance of bottom sediments prior to sampling. Sediment samples will
be handled carefully to minimize disturbance during collection and placement into
laboratory certified containers and transported to the laboratory under COC. The sampler
will be lowered over the side of the boat from a cable wire at an approximate speed of 0.3
feet per second. When the sampler reaches the mudline, the cable will be drawn taut and
DGPS measurements recorded.
Each surface grab sample will be retrieved aboard the vessel and evaluated for the following
acceptance criteria:
Overlying water is present and has low turbidity
Adequate penetration depth is achieved
Sampler is not overfilled
Sediment surface is undisturbed
No signs of winnowing or leaking from sampling device
Samples not meeting these criteria will be rejected near the location of sample collection.
The process will be repeated until criteria have been met. Deployments will be repeated
within a 20-foot radius of the proposed sample location. If adequate penetration is not
achieved after multiple attempts, less volume will be accepted and noted in the sediment
sampling log form. Once accepted, overlying water will be siphoned off and a
decontaminated stainless steel trowel, spoon, or equivalent will be used to collect the
required sediment from inside the sampler without touching the sidewalls. The sampler will
be decontaminated between stations and rinsed with site water between grabs.
After sample collection, the following information will be recorded on the Sediment
Sampling daily log form:
Date, time, and name of person logging sample
Weather conditions
Sample location number and coordinates
Project designation
Depth of water at the location and surface elevation

Sample Collection, Processing, and Handling Procedures
Sampling and Analysis Plan October 2012 Kenmore Area Sediment and Water Characterization 22 120891-01.01
Sediment penetration and depth
Sediment sample interval
Sample recovery
Physical observations in general accordance with the visual-manual description
procedure (ASTM D-2488 modified) such as apparent grain size, wood debris, color,
odor, layering, anoxic contact, and presence of sheen, shells or other debris
3.4.2 Surface Water
Prior to collecting the water sample, water quality parameters will be measured in the field
at each surface water sampling location using a multi-probe water quality meter (e.g., YSI).
The water quality meter will be lowered 1ft below the surface and allowed to equilibrate
before taking measurements of conductivity, temperature, dissolved oxygen, and pH. Results
for water quality parameters will be recorded on the water quality and sample collection
form (Appendix A).
At each water sample location, water will be collected according to Ecology’s Standard
Operating Procedure guidance (Ecology 2006) which is consistent with the protocols of the
Beach Environmental Assessment, Communication and Health (BEACH) program
(Schneider 2004). Water will be collected by hand by dipping the laboratory supplied water
bottle or by using a dipper attached to an extension rod to a depth of at least 6 inches below
the surface (Ecology 2006). Since the water samples will be collected from a beach, Ecology
recommends wading into knee deep water (2.5 feet) and avoid collecting disturbed sediment
or coming in contact with the bottom substrate (Ecology 2010).
The actual surface water sample location will be determined in the field, selected as the most
representative accessible location to safely sample and achieve the goals of the project.
Sample Collection, Processing, and Handling Procedures
Sampling and Analysis Plan October 2012 Kenmore Area Sediment and Water Characterization 23 120891-01.01
The total water depth and field parameters will be recorded on the surface water collection
form (Appendix A) at each water sample location. Water samples will be placed in a cooler
with ice, entered into COC and shipped or delivered on ice to the laboratory within 24 hours
of collection. Water quality field measurement data, sample collection information, and
ancillary information from each collection station and event will be recorded on field data
forms (Appendix A). Ancillary information will include:
Date and time of each sample/measurement collection
Water sample collection depth and total water column depth
Field parameter measures recorded on field data form
Weather conditions and general observations (e.g., boating traffic, river flow for the
sample in the Sammamish River, sheen, or turbid water)
Visual observations of water and samples at each sampling location
Field calibration check and calibration information
Names of personnel present collecting samples and recording data
General observations about collection procedures and any deviations from this SAP
Condition of equipment or meters that might impact water quality data
Generally, all information that might be pertinent to water quality will be recorded on the
field data forms. Each water grab sample will be treated as a discrete sample and labeled
with a unique sample number. The sample numbering scheme for each sample is provided in
Table 1. Each sample collected will be clearly labeled using a waterproof label with an
indelible pen. Each sample label will contain the project name and project number, the
unique sample identification number, date and time of sample collection, analysis to be
performed, preservative (as applicable), and the initials of the person collecting the sample.
3.4.3 Sample Processing
Sediment from the sampler will be placed into a stainless steel bowl and homogenized with a
stainless steel spoon. Homogenized surface sediment will be spooned immediately into
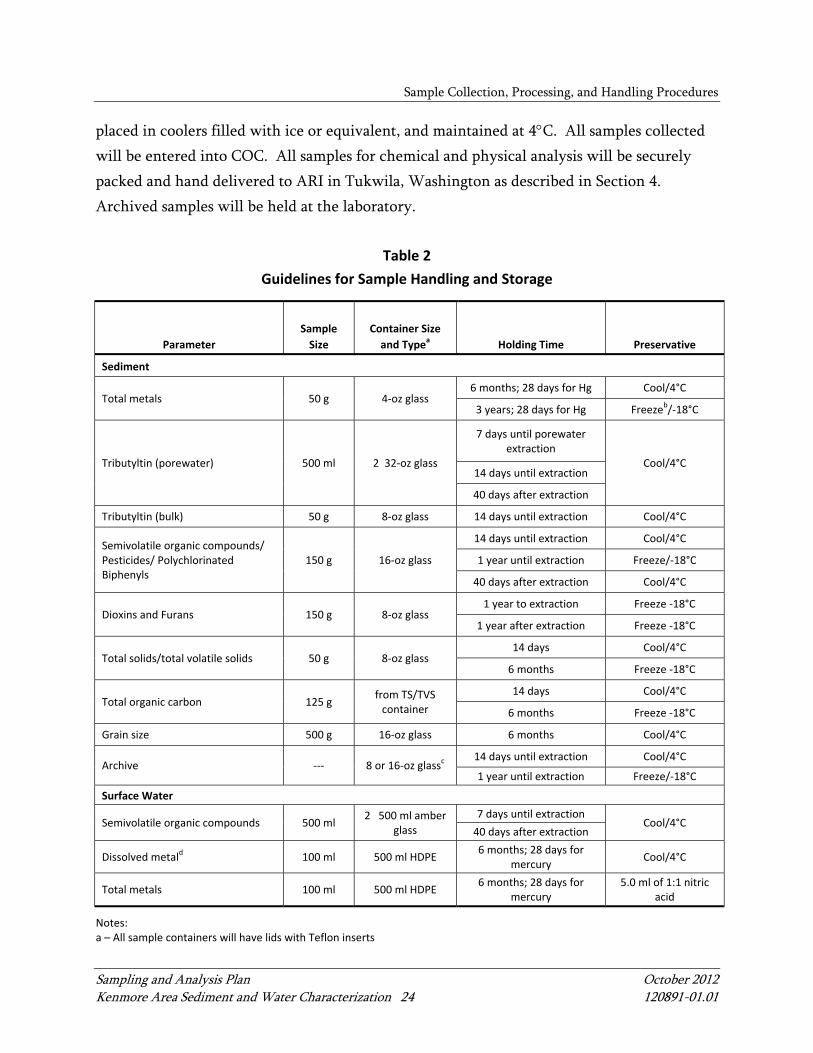
appropriate pre-cleaned, pre-labeled sample containers (Table 2), placed in coolers filled
with ice or equivalent, and maintained at 4C. Debris and materials more than 0.5 inch in
diameter will be omitted from sample containers. Water samples will be poured directly
from the sampler into appropriate pre-cleaned, pre-labeled sample containers (Table 2),
Sample Collection, Processing, and Handling Procedures
Sampling and Analysis Plan October 2012 Kenmore Area Sediment and Water Characterization 24 120891-01.01
placed in coolers filled with ice or equivalent, and maintained at 4C. All samples collected
will be entered into COC. All samples for chemical and physical analysis will be securely
packed and hand delivered to ARI in Tukwila, Washington as described in Section 4.
Archived samples will be held at the laboratory.
Table 2
Guidelines for Sample Handling and Storage
Parameter
Sample
Size
Container Size
and Typea Holding Time Preservative
Sediment
Total metals 50 g 4‐oz glass 6 months; 28 days for Hg Cool/4°C
3 years; 28 days for Hg Freezeb/‐18°C
Tributyltin (porewater) 500 ml 2 32‐oz glass
7 days until porewater extraction
Cool/4°C 14 days until extraction
40 days after extraction
Tributyltin (bulk) 50 g 8‐oz glass 14 days until extraction Cool/4°C
Semivolatile organic compounds/ Pesticides/ Polychlorinated Biphenyls
150 g 16‐oz glass
14 days until extraction Cool/4°C
1 year until extraction Freeze/‐18°C
40 days after extraction Cool/4°C
Dioxins and Furans 150 g 8‐oz glass 1 year to extraction Freeze ‐18°C
1 year after extraction Freeze ‐18°C
Total solids/total volatile solids 50 g 8‐oz glass 14 days Cool/4°C
6 months Freeze ‐18°C
Total organic carbon 125 g from TS/TVS container
14 days Cool/4°C
6 months Freeze ‐18°C
Grain size 500 g 16‐oz glass 6 months Cool/4°C
Archive ‐‐‐ 8 or 16‐oz glassc 14 days until extraction Cool/4°C
1 year until extraction Freeze/‐18°C
Surface Water
Semivolatile organic compounds 500 ml 2 500 ml amber
glass
7 days until extraction Cool/4°C
40 days after extraction
Dissolved metald 100 ml 500 ml HDPE 6 months; 28 days for
mercury Cool/4°C
Total metals 100 ml 500 ml HDPE 6 months; 28 days for
mercury 5.0 ml of 1:1 nitric
acid
Notes: a – All sample containers will have lids with Teflon inserts
Sample Collection, Processing, and Handling Procedures
Sampling and Analysis Plan October 2012 Kenmore Area Sediment and Water Characterization 25 120891-01.01
b – Samples will be analyzed for mercury before freezing c – Container size dependent on available amount of extra sediment; at a minimum 8 ounces will be archived, but not more
than 16 ounces d –Sample will be filtered in the lab with a0.45‐μm filter °C = degrees Celsius g = gram HDPE = high density polyethylene mL = milliliter oz = ounce TS/TVS = total solids/total volatile solids
3.5 Field Quality Assurance/Quality Control Samples
Field QA/QC samples will be used to evaluate the efficiency of field collection and
processing and decontamination procedures. All field QA/QC samples will be documented
in the field logs. Two sediment and one water field duplicate samples will be collected and
analyzed for the same chemical parameters as the original sample (Table 2).
3.6 Waste Management
All sediment and water remaining after sampling will be washed overboard at the collection
station prior to moving to the next sampling station. Any sediment spilled on the deck of the
sampling vessel will be washed into the surface waters at the collection site.
All disposable sampling materials and personnel protective equipment used in sample
processing, such as disposable coveralls, gloves, and paper towels, will be placed in heavy-
duty garbage bags or other appropriate containers.
Sampling and Analysis Plan October 2012 Kenmore Area Sediment and Water Characterization 26 120891-01.01
4 SAMPLE TRANSPORT AND CHAIN‐OF‐CUSTODY PROCEDURES
This section addresses the sampling program requirements for maintaining custody of the
samples throughout the sample collection and delivery process.
4.1 Sample Custody Procedures
Samples are considered to be in one’s custody if they are: 1) in the custodian’s possession or
view; 2) in a secured location (under lock) with restricted access; or 3) in a container that is
secured with an official seal such that the sample cannot be reached without breaking the
seal.
COC procedures will be followed for all samples throughout the collection, handling, and
analysis process. The principal document used to track possession and transfer of samples is
the COC form. Each sample will be represented on a COC form the day it is collected. All
data entries will be made using indelible ink pen. Corrections will be made by drawing a
single line through the error, writing in the correct information, then dating and initialing
the change. Blank lines/spaces on the COC form will be lined-out and dated and initialed by
the individual maintaining custody.
A COC form will accompany each cooler of samples to the analytical laboratory. Each
person who has custody of the samples will sign the COC form and ensure that the samples
are not left unattended unless properly secured. Copies of all COC forms will be retained in
the project files.
4.2 Sample Delivery and Receipt Requirements
All samples will be hand delivered to the analytical laboratory no later than 24 hours after
collection. Upon transfer of sample possession to the analytical laboratory, the persons
transferring custody of the sample container will sign the COC form and date, time, and
sample condition. Upon receipt of samples at the laboratory the receiver will record the
condition of the samples on a sample receipt form. COC forms will be used internally in the
laboratory to track sample handling and final disposition.

Sampling and Analysis Plan October 2012 Kenmore Area Sediment and Water Characterization 27 120891-01.01
5 CHEMICAL AND PHYSICAL ANALYTICAL TESTING
Surface sediment samples will be submitted for chemical and physical analyses for the full
DMMP analyte list (DMMO 2010, 2011) for the screening level characterization. The
DMMP analyte list includes laboratory analysis for metals, SVOCs, pesticides, PCBs, dioxin
and furans, and TBT porewater in the navigation channel and in North Lake Marina (or bulk
if insufficient porewater is available for those locations), TBT bulk for other locations, and
physical parameters including total organic carbon, grain size, and moisture content. These
results will be compared to DMMP interpretive criteria for open water disposal (DMMO
2010, 2011).
The remaining sediment samples collected in nearshore areas will be tested for the Sediment
Management Standards (Ecology 1995) including metals, semi-volatile organic compounds,
pesticides, PCBs, and dioxin furans; and physical parameters, including total organic carbon
and grain size. These results will be compared to Ecology’s Sediment Quality Values
(Ecology 2003, Sediment Evaluation Framework for fresh water [under review]).
Ecology’s Sediment Sampling Analysis Plan Appendix (SAPA; Ecology 2008) and the DMMP
User’s Manual (DMMO 2009) specify sampling and testing protocols for the chemical
characterization of sediment, with the DMMP process designed specifically for dredged
material being considered for open-water disposal. Method detection limits will be below
the RLs specified in Table 3, if technically feasible. To achieve the required RLs, some
modifications to the methods may be necessary. These modifications from the specified
analytical methods will be provided by the laboratory at the time of establishing the
laboratory contract. The modifications must be approved by DMMO and Ecology prior to
implementation.
Water samples will be submitted for Washington State drinking water primary and
secondary metals (246-290 WAC) as total and dissolved metals, SVOCs, hardness, total
suspended solids, and total dissolved solids. Surface water samples will be analyzed by ARI
for SVOCs and metals.
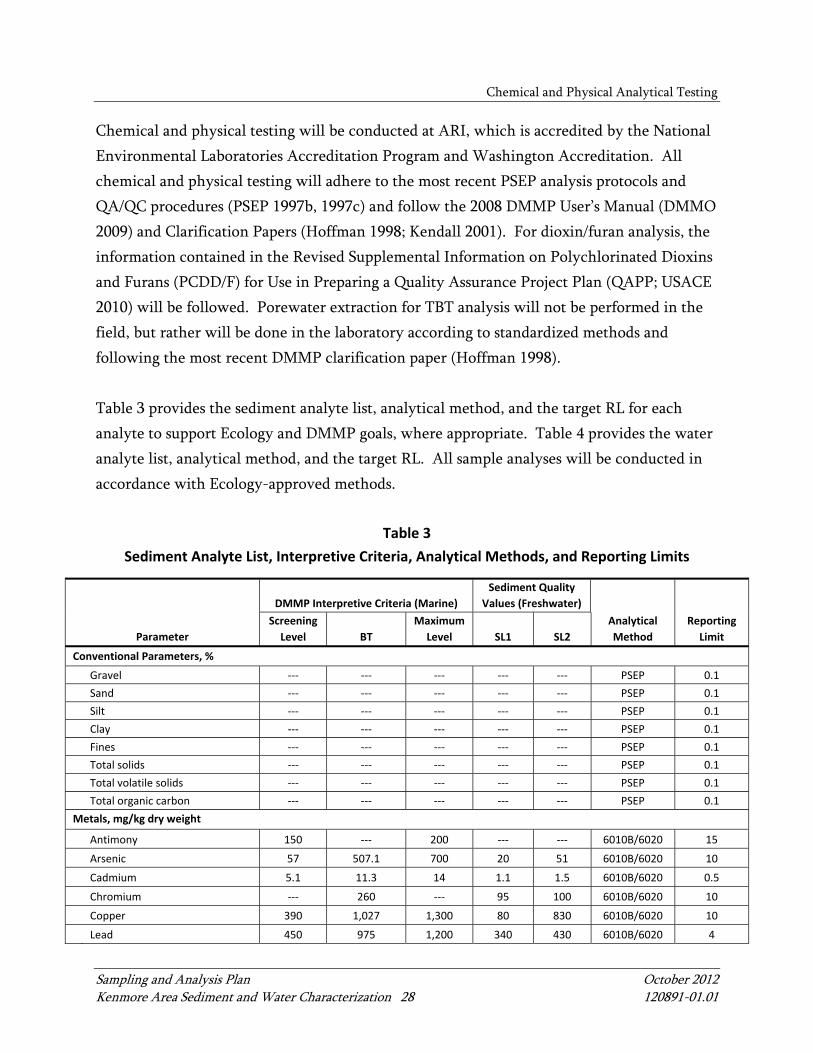
Chemical and Physical Analytical Testing
Sampling and Analysis Plan October 2012 Kenmore Area Sediment and Water Characterization 28 120891-01.01
Chemical and physical testing will be conducted at ARI, which is accredited by the National
Environmental Laboratories Accreditation Program and Washington Accreditation. All
chemical and physical testing will adhere to the most recent PSEP analysis protocols and
QA/QC procedures (PSEP 1997b, 1997c) and follow the 2008 DMMP User’s Manual (DMMO
2009) and Clarification Papers (Hoffman 1998; Kendall 2001). For dioxin/furan analysis, the
information contained in the Revised Supplemental Information on Polychlorinated Dioxins
and Furans (PCDD/F) for Use in Preparing a Quality Assurance Project Plan (QAPP; USACE
2010) will be followed. Porewater extraction for TBT analysis will not be performed in the
field, but rather will be done in the laboratory according to standardized methods and
following the most recent DMMP clarification paper (Hoffman 1998).
Table 3 provides the sediment analyte list, analytical method, and the target RL for each
analyte to support Ecology and DMMP goals, where appropriate. Table 4 provides the water
analyte list, analytical method, and the target RL. All sample analyses will be conducted in
accordance with Ecology-approved methods.
Table 3
Sediment Analyte List, Interpretive Criteria, Analytical Methods, and Reporting Limits
Parameter
DMMP Interpretive Criteria (Marine)
Sediment Quality
Values (Freshwater)
Screening
Level BT
Maximum
Level SL1 SL2
Analytical
Method
Reporting
Limit
Conventional Parameters, %
Gravel ‐‐‐ ‐‐‐ ‐‐‐ ‐‐‐ ‐‐‐ PSEP 0.1
Sand ‐‐‐ ‐‐‐ ‐‐‐ ‐‐‐ ‐‐‐ PSEP 0.1
Silt ‐‐‐ ‐‐‐ ‐‐‐ ‐‐‐ ‐‐‐ PSEP 0.1
Clay ‐‐‐ ‐‐‐ ‐‐‐ ‐‐‐ ‐‐‐ PSEP 0.1
Fines ‐‐‐ ‐‐‐ ‐‐‐ ‐‐‐ ‐‐‐ PSEP 0.1
Total solids ‐‐‐ ‐‐‐ ‐‐‐ ‐‐‐ ‐‐‐ PSEP 0.1
Total volatile solids ‐‐‐ ‐‐‐ ‐‐‐ ‐‐‐ ‐‐‐ PSEP 0.1
Total organic carbon ‐‐‐ ‐‐‐ ‐‐‐ ‐‐‐ ‐‐‐ PSEP 0.1
Metals, mg/kg dry weight
Antimony 150 ‐‐‐ 200 ‐‐‐ ‐‐‐ 6010B/6020 15
Arsenic 57 507.1 700 20 51 6010B/6020 10
Cadmium 5.1 11.3 14 1.1 1.5 6010B/6020 0.5
Chromium ‐‐‐ 260 ‐‐‐ 95 100 6010B/6020 10
Copper 390 1,027 1,300 80 830 6010B/6020 10
Lead 450 975 1,200 340 430 6010B/6020 4
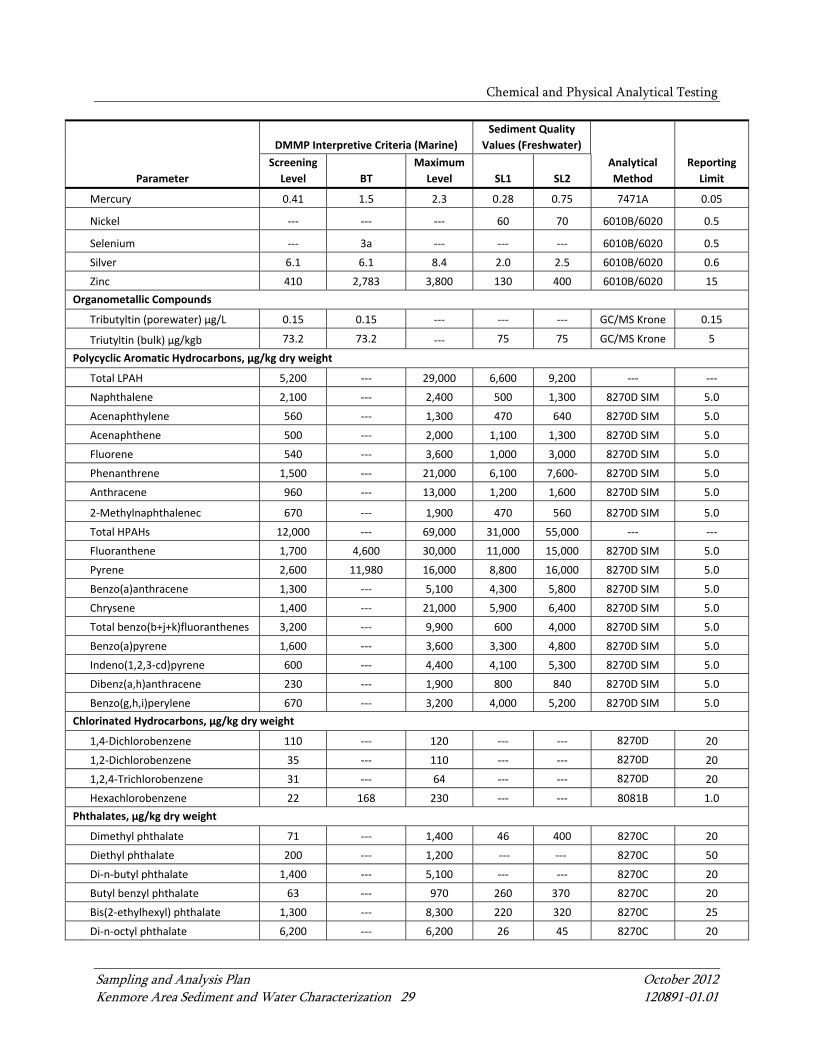
Chemical and Physical Analytical Testing
Sampling and Analysis Plan October 2012 Kenmore Area Sediment and Water Characterization 29 120891-01.01
Parameter
DMMP Interpretive Criteria (Marine)
Sediment Quality
Values (Freshwater)
Screening
Level BT
Maximum
Level SL1 SL2
Analytical
Method
Reporting
Limit
Mercury 0.41 1.5 2.3 0.28 0.75 7471A 0.05
Nickel ‐‐‐ ‐‐‐ ‐‐‐ 60 70 6010B/6020 0.5
Selenium ‐‐‐ 3a ‐‐‐ ‐‐‐ ‐‐‐ 6010B/6020 0.5
Silver 6.1 6.1 8.4 2.0 2.5 6010B/6020 0.6
Zinc 410 2,783 3,800 130 400 6010B/6020 15
Organometallic Compounds
Tributyltin (porewater) µg/L 0.15 0.15 ‐‐‐ ‐‐‐ ‐‐‐ GC/MS Krone 0.15
Triutyltin (bulk) µg/kgb 73.2 73.2 ‐‐‐ 75 75 GC/MS Krone 5
Polycyclic Aromatic Hydrocarbons, µg/kg dry weight
Total LPAH 5,200 ‐‐‐ 29,000 6,600 9,200 ‐‐‐ ‐‐‐
Naphthalene 2,100 ‐‐‐ 2,400 500 1,300 8270D SIM 5.0
Acenaphthylene 560 ‐‐‐ 1,300 470 640 8270D SIM 5.0
Acenaphthene 500 ‐‐‐ 2,000 1,100 1,300 8270D SIM 5.0
Fluorene 540 ‐‐‐ 3,600 1,000 3,000 8270D SIM 5.0
Phenanthrene 1,500 ‐‐‐ 21,000 6,100 7,600‐ 8270D SIM 5.0
Anthracene 960 ‐‐‐ 13,000 1,200 1,600 8270D SIM 5.0
2‐Methylnaphthalenec 670 ‐‐‐ 1,900 470 560 8270D SIM 5.0
Total HPAHs 12,000 ‐‐‐ 69,000 31,000 55,000 ‐‐‐ ‐‐‐
Fluoranthene 1,700 4,600 30,000 11,000 15,000 8270D SIM 5.0
Pyrene 2,600 11,980 16,000 8,800 16,000 8270D SIM 5.0
Benzo(a)anthracene 1,300 ‐‐‐ 5,100 4,300 5,800 8270D SIM 5.0
Chrysene 1,400 ‐‐‐ 21,000 5,900 6,400 8270D SIM 5.0
Total benzo(b+j+k)fluoranthenes 3,200 ‐‐‐ 9,900 600 4,000 8270D SIM 5.0
Benzo(a)pyrene 1,600 ‐‐‐ 3,600 3,300 4,800 8270D SIM 5.0
Indeno(1,2,3‐cd)pyrene 600 ‐‐‐ 4,400 4,100 5,300 8270D SIM 5.0
Dibenz(a,h)anthracene 230 ‐‐‐ 1,900 800 840 8270D SIM 5.0
Benzo(g,h,i)perylene 670 ‐‐‐ 3,200 4,000 5,200 8270D SIM 5.0
Chlorinated Hydrocarbons, µg/kg dry weight
1,4‐Dichlorobenzene 110 ‐‐‐ 120 ‐‐‐ ‐‐‐ 8270D 20
1,2‐Dichlorobenzene 35 ‐‐‐ 110 ‐‐‐ ‐‐‐ 8270D 20
1,2,4‐Trichlorobenzene 31 ‐‐‐ 64 ‐‐‐ ‐‐‐ 8270D 20
Hexachlorobenzene 22 168 230 ‐‐‐ ‐‐‐ 8081B 1.0
Phthalates, µg/kg dry weight
Dimethyl phthalate 71 ‐‐‐ 1,400 46 400 8270C 20
Diethyl phthalate 200 ‐‐‐ 1,200 ‐‐‐ ‐‐‐ 8270C 50
Di‐n‐butyl phthalate 1,400 ‐‐‐ 5,100 ‐‐‐ ‐‐‐ 8270C 20
Butyl benzyl phthalate 63 ‐‐‐ 970 260 370 8270C 20
Bis(2‐ethylhexyl) phthalate 1,300 ‐‐‐ 8,300 220 320 8270C 25
Di‐n‐octyl phthalate 6,200 ‐‐‐ 6,200 26 45 8270C 20
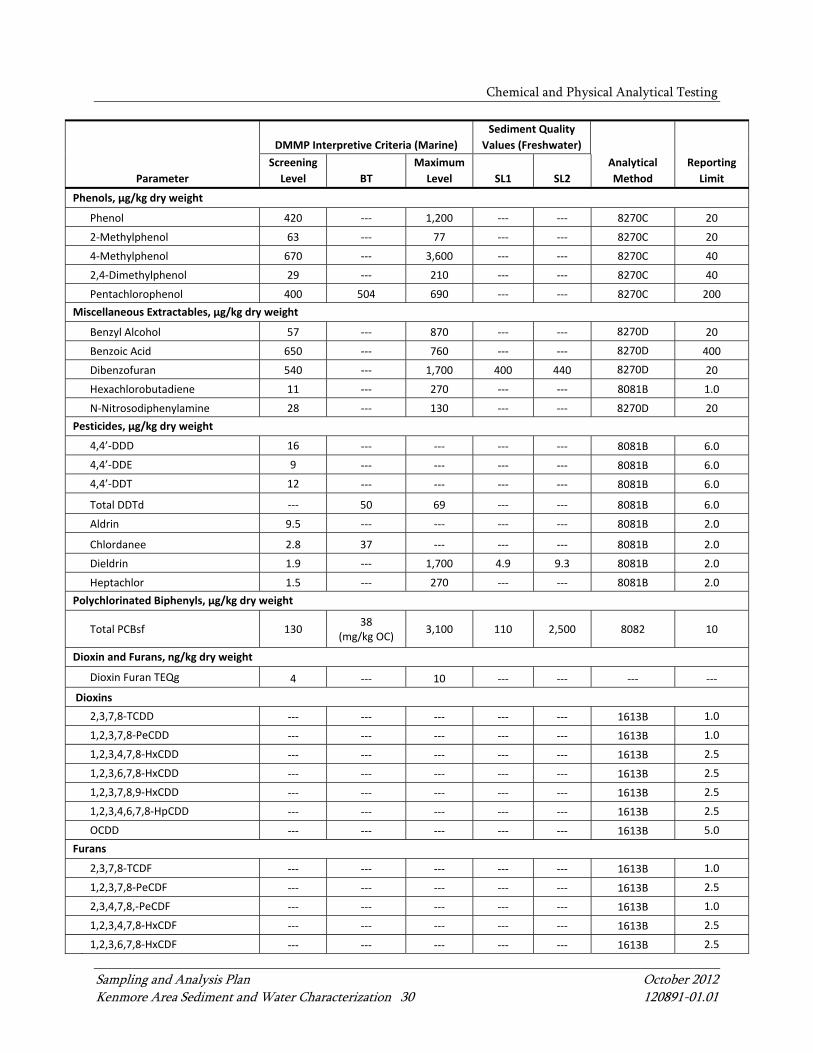
Chemical and Physical Analytical Testing
Sampling and Analysis Plan October 2012 Kenmore Area Sediment and Water Characterization 30 120891-01.01
Parameter
DMMP Interpretive Criteria (Marine)
Sediment Quality
Values (Freshwater)
Screening
Level BT
Maximum
Level SL1 SL2
Analytical
Method
Reporting
Limit
Phenols, µg/kg dry weight
Phenol 420 ‐‐‐ 1,200 ‐‐‐ ‐‐‐ 8270C 20
2‐Methylphenol 63 ‐‐‐ 77 ‐‐‐ ‐‐‐ 8270C 20
4‐Methylphenol 670 ‐‐‐ 3,600 ‐‐‐ ‐‐‐ 8270C 40
2,4‐Dimethylphenol 29 ‐‐‐ 210 ‐‐‐ ‐‐‐ 8270C 40
Pentachlorophenol 400 504 690 ‐‐‐ ‐‐‐ 8270C 200
Miscellaneous Extractables, µg/kg dry weight
Benzyl Alcohol 57 ‐‐‐ 870 ‐‐‐ ‐‐‐ 8270D 20
Benzoic Acid 650 ‐‐‐ 760 ‐‐‐ ‐‐‐ 8270D 400
Dibenzofuran 540 ‐‐‐ 1,700 400 440 8270D 20
Hexachlorobutadiene 11 ‐‐‐ 270 ‐‐‐ ‐‐‐ 8081B 1.0
N‐Nitrosodiphenylamine 28 ‐‐‐ 130 ‐‐‐ ‐‐‐ 8270D 20
Pesticides, µg/kg dry weight
4,4’‐DDD 16 ‐‐‐ ‐‐‐ ‐‐‐ ‐‐‐ 8081B 6.0
4,4’‐DDE 9 ‐‐‐ ‐‐‐ ‐‐‐ ‐‐‐ 8081B 6.0
4,4’‐DDT 12 ‐‐‐ ‐‐‐ ‐‐‐ ‐‐‐ 8081B 6.0
Total DDTd ‐‐‐ 50 69 ‐‐‐ ‐‐‐ 8081B 6.0
Aldrin 9.5 ‐‐‐ ‐‐‐ ‐‐‐ ‐‐‐ 8081B 2.0
Chlordanee 2.8 37 ‐‐‐ ‐‐‐ ‐‐‐ 8081B 2.0
Dieldrin 1.9 ‐‐‐ 1,700 4.9 9.3 8081B 2.0
Heptachlor 1.5 ‐‐‐ 270 ‐‐‐ ‐‐‐ 8081B 2.0
Polychlorinated Biphenyls, µg/kg dry weight
Total PCBsf 130
38 (mg/kg OC)
3,100 110 2,500 8082 10
Dioxin and Furans, ng/kg dry weight
Dioxin Furan TEQg 4 ‐‐‐ 10 ‐‐‐ ‐‐‐ ‐‐‐ ‐‐‐
Dioxins
2,3,7,8‐TCDD ‐‐‐ ‐‐‐ ‐‐‐ ‐‐‐ ‐‐‐ 1613B 1.0
1,2,3,7,8‐PeCDD ‐‐‐ ‐‐‐ ‐‐‐ ‐‐‐ ‐‐‐ 1613B 1.0
1,2,3,4,7,8‐HxCDD ‐‐‐ ‐‐‐ ‐‐‐ ‐‐‐ ‐‐‐ 1613B 2.5
1,2,3,6,7,8‐HxCDD ‐‐‐ ‐‐‐ ‐‐‐ ‐‐‐ ‐‐‐ 1613B 2.5
1,2,3,7,8,9‐HxCDD ‐‐‐ ‐‐‐ ‐‐‐ ‐‐‐ ‐‐‐ 1613B 2.5
1,2,3,4,6,7,8‐HpCDD ‐‐‐ ‐‐‐ ‐‐‐ ‐‐‐ ‐‐‐ 1613B 2.5
OCDD ‐‐‐ ‐‐‐ ‐‐‐ ‐‐‐ ‐‐‐ 1613B 5.0
Furans
2,3,7,8‐TCDF ‐‐‐ ‐‐‐ ‐‐‐ ‐‐‐ ‐‐‐ 1613B 1.0
1,2,3,7,8‐PeCDF ‐‐‐ ‐‐‐ ‐‐‐ ‐‐‐ ‐‐‐ 1613B 2.5
2,3,4,7,8,‐PeCDF ‐‐‐ ‐‐‐ ‐‐‐ ‐‐‐ ‐‐‐ 1613B 1.0
1,2,3,4,7,8‐HxCDF ‐‐‐ ‐‐‐ ‐‐‐ ‐‐‐ ‐‐‐ 1613B 2.5
1,2,3,6,7,8‐HxCDF ‐‐‐ ‐‐‐ ‐‐‐ ‐‐‐ ‐‐‐ 1613B 2.5
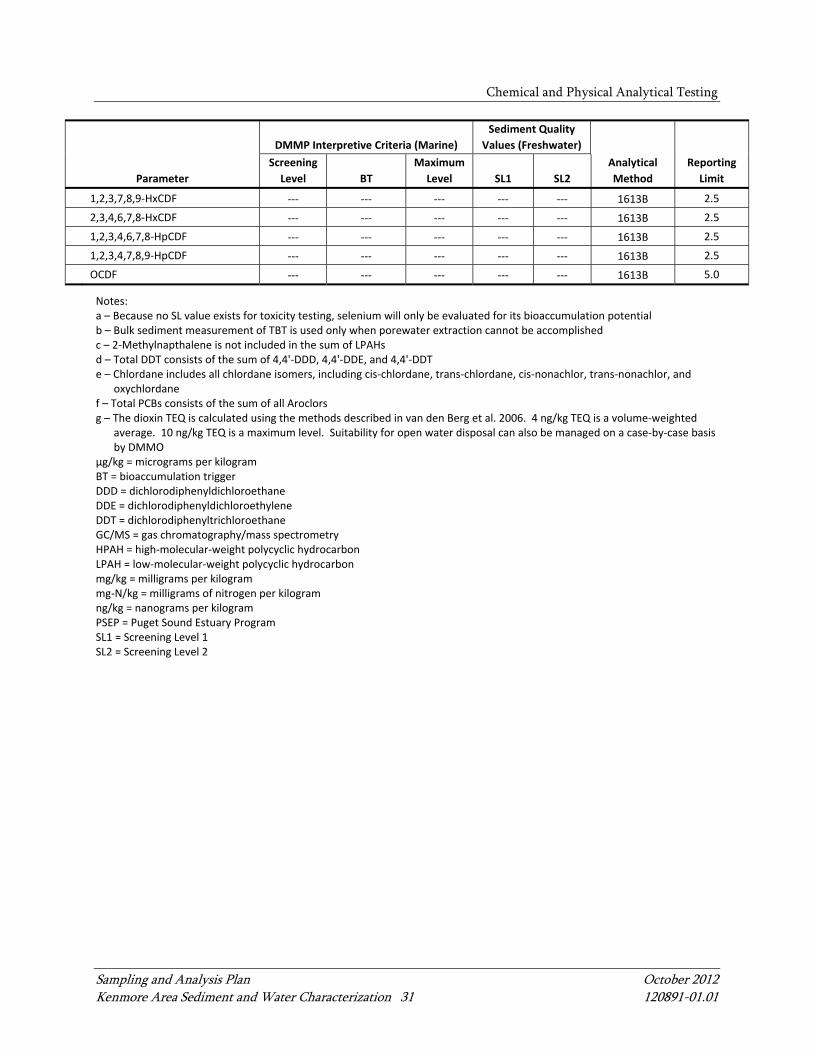
Chemical and Physical Analytical Testing
Sampling and Analysis Plan October 2012 Kenmore Area Sediment and Water Characterization 31 120891-01.01
Parameter
DMMP Interpretive Criteria (Marine)
Sediment Quality
Values (Freshwater)
Screening
Level BT
Maximum
Level SL1 SL2
Analytical
Method
Reporting
Limit
1,2,3,7,8,9‐HxCDF ‐‐‐ ‐‐‐ ‐‐‐ ‐‐‐ ‐‐‐ 1613B 2.5
2,3,4,6,7,8‐HxCDF ‐‐‐ ‐‐‐ ‐‐‐ ‐‐‐ ‐‐‐ 1613B 2.5
1,2,3,4,6,7,8‐HpCDF ‐‐‐ ‐‐‐ ‐‐‐ ‐‐‐ ‐‐‐ 1613B 2.5
1,2,3,4,7,8,9‐HpCDF ‐‐‐ ‐‐‐ ‐‐‐ ‐‐‐ ‐‐‐ 1613B 2.5
OCDF ‐‐‐ ‐‐‐ ‐‐‐ ‐‐‐ ‐‐‐ 1613B 5.0
Notes: a – Because no SL value exists for toxicity testing, selenium will only be evaluated for its bioaccumulation potential b – Bulk sediment measurement of TBT is used only when porewater extraction cannot be accomplished c – 2‐Methylnapthalene is not included in the sum of LPAHs d – Total DDT consists of the sum of 4,4'‐DDD, 4,4'‐DDE, and 4,4'‐DDT e – Chlordane includes all chlordane isomers, including cis‐chlordane, trans‐chlordane, cis‐nonachlor, trans‐nonachlor, and
oxychlordane f – Total PCBs consists of the sum of all Aroclors g – The dioxin TEQ is calculated using the methods described in van den Berg et al. 2006. 4 ng/kg TEQ is a volume‐weighted
average. 10 ng/kg TEQ is a maximum level. Suitability for open water disposal can also be managed on a case‐by‐case basis by DMMO
µg/kg = micrograms per kilogram BT = bioaccumulation trigger DDD = dichlorodiphenyldichloroethane DDE = dichlorodiphenyldichloroethylene DDT = dichlorodiphenyltrichloroethane GC/MS = gas chromatography/mass spectrometry HPAH = high‐molecular‐weight polycyclic hydrocarbon LPAH = low‐molecular‐weight polycyclic hydrocarbon mg/kg = milligrams per kilogram mg‐N/kg = milligrams of nitrogen per kilogram ng/kg = nanograms per kilogram PSEP = Puget Sound Estuary Program SL1 = Screening Level 1 SL2 = Screening Level 2

Chemical and Physical Analytical Testing
Sampling and Analysis Plan October 2012 Kenmore Area Sediment and Water Characterization 32 120891-01.01
Table 4
Surface Water Analyte List, Analytical Methods, and Reporting Limits
Parameter Analytical Method Reporting Limit
Metals
Antimony 200.8/6020A 0.2 µg/L
Arsenic 200.8/6020A 0.2 µg/L
Barium 200.8/6020A 0.5 µg/L
Beryllium 200.8/6020A 0.2 µg/L
Cadmium 200.8/6020A 0.1 µg/L
Chromium 200.8/6020A 0.5 µg/L
Copper 200.8/6020A 0.5 µg/L
Iron 200.8/6020A 20 µg/L
Lead 200.8/6020A 0.1 µg/L
Manganese 200.8/6020A 0.5 µg/L
Mercury 7471A 0.10 µg/L
Nickel 200.8/6020A 0.5 µg/L
Selenium 200.8/6020A 0.5 µg/L
Silver 200.8/6020A 0.2 µg/L
Thallium 200.8/6020A 0.2 µg/L
Zinc 200.8/6020A 4.0 µg/L
SVOCs
Polycyclic Aromatic Hydrocarbons
Naphthalene 8270‐SIM 0.1µg/L
Acenaphthylene 8270‐SIM 0.1 µg/L
Acenaphthene 8270‐SIM 0.1 µg/L
Fluorene 8270‐SIM 0.1 µg/L
Phenanthrene 8270‐SIM 0.1 µg/L
Anthracene 8270‐SIM 0.1 µg/L
2‐Methylnaphthalene 8270‐SIM 0.1 µg/L
Fluoranthene 8270‐SIM 0.1 µg/L
Pyrene 8270‐SIM 0.1 µg/L
Benz[a]anthracene 8270‐SIM 0.1 µg/L
Chrysene 8270‐SIM 0.1 µg/L
Total benzofluoranthenes 8270‐SIM 0.1 µg/L
Benzo[a]pyrene 8270‐SIM 0.1 µg/L
Indeno[1,2,3‐c,d]pyrene 8270‐SIM 0.1 µg/L
Dibenz[a,h]anthracene 8270‐SIM 0.1 µg/L
Benzo[g,h,i]perylene 8270‐SIM 0.1 µg/L
Chlorinated Benzenes
1,2‐Dichlorobenzene 8270D 1.0 µg/L

Chemical and Physical Analytical Testing
Sampling and Analysis Plan October 2012 Kenmore Area Sediment and Water Characterization 33 120891-01.01
Parameter Analytical Method Reporting Limit
1,4‐Dichlorobenzene 8270D 1.0 µg/L
1,2,4‐Trichlorobenzene 8270D 1.0 µg/L
Hexachlorobenzene 8270D 1.0 µg/L
Phthalates
Dimethyl phthalate 8270D 1.0 µg/L
Diethyl phthalate 8270D 1.0 µg/L
Di‐n‐butyl phthalate 8270D 1.0 µg/L
Butyl benzyl phthalate 8270D 1.0 µg/L
Bis[2‐ethylhexyl]phthalate 8270D 3.0 µg/L
Di‐n‐octyl phthalate 8270D 1.0 µg/L
Miscellaneous SVOCs
Dibenzofuran 8270D 1.0 µg/L
Hexachlorobutadiene 8270D/8081a 3.0 µg/L / 0.05 µg/L
N‐nitrosodiphenylamine 8270D 1.0 µg/L
Phenol 8270D 1.0 µg/L
2‐Methylphenol 8270D 1.0 µg/L
4‐Methylphenol 8270D 2.0 µg/L
2,4‐Dimethylphenol 8270D 3.0 µg/L
Pentachlorophenol 8270D/8041b 10.0 µg/L / 0.025 µg/L
Benzyl alcohol 8270D 2.0 µg/L
Benzoic acid 8270D 20.0 µg/L
Notes: a – Method 8081 will be used to achieve lower reporting limit for samples HT‐01 through HT‐05. b – Method 8041 will be used to achieve lower reporting limit for samples HT‐01 through HT‐05. µg/L = micrograms per liter SVOC = semivolatile organic compound
In completing chemical analyses for this project, the contract laboratory is expected to meet
the following minimum requirements:
Adhere to the methods outlined in this SAP, including methods referenced for each
analytical procedure (Table 2).
Deliver hard copy and electronic data as specified.
Meet reporting requirements for deliverables.
Meet turnaround times for deliverables.
Implement QA/QC procedures including data quality objectives (DQOs), laboratory
quality control requirements and performance evaluation testing requirements
(Tables 5 and 6).
Notify the project QA/QC Manager of any QA/QC problems when they are identified

Chemical and Physical Analytical Testing
Sampling and Analysis Plan October 2012 Kenmore Area Sediment and Water Characterization 34 120891-01.01
to allow for quick resolution.
Allow laboratory and data audits to be performed, if deemed necessary.
Laboratory QC procedures, where applicable, include initial and continuing instrument
calibrations, standard reference materials, laboratory control samples, matrix replicates,
matrix spikes, surrogate spikes (for organic analyses), and method blanks. Table 5 lists the
frequency of analysis for laboratory QA/QC samples, and Table 6 summarizes the data
quality objectives for precision, accuracy, and completeness.
Results of the QC samples from each sample group will be reviewed by the analyst
immediately after a sample group has been analyzed. All samples are diluted and reanalyzed
if target compounds are detected at levels that exceed their respective established calibration
ranges. Any cleanups will be conducted prior to the dilutions. The QC sample results will
be evaluated to determine if control limits have been exceeded. If control limits are
exceeded in the sample group, the QA/QC Manager will be contacted immediately, and
corrective action (e.g., method modifications followed by reprocessing the affected samples)
will be initiated prior to processing a subsequent group of samples.

Chemical and Physical Analytical Testing
Sampling and Analysis Plan October 2012 Kenmore Area Sediment and Water Characterization 35 120891-01.01
Table 5
Laboratory Quality Assurance/Quality Control Sample Analysis Summary for Sediment and Water
Analysis Type
Initial
Calibration
Ongoing
Calibration Replicates
Matrix
Spikes SRM/LCS
Matrix Spike
Duplicates
Method
Blanks
Surrogate
Spikes
Grain size Each batcha NA 1 per 20 samples
NA NA NA NA NA
Total solids Each batchb NA 1 per 20 samples
NA NA NA NA NA
Total volatile solids Each batchb NA 2 per 20 samples
NA NA NA NA NA
Total organic carbon Daily or each
batch 1 per 10 samples
1 per 20 samples
1 per 20 samples
1 per 20 samples
NA 1 per 20 samples
NA
Metals Daily 1 per 10 samples
1 per 20 samples
1 per 20 samples
1 per 20 samples
NA 1 per 20 samples
NA
Dioxin and Furans As neededc Every 12 hours
1 per 20 samples
NA 1 per 20 samples
NA 1 per 20 samples
Every sample
Tributyltin As neededc Every 12 hours
NA 1 per 20 samples
1 per 20 samples
1 per 20 samples
1 per 20 samples
Every sample
Semivolatile organics As neededc Every 12 hours
NA 1 per 20 samples
1 per 20 samples
1 per 20 samples
1 per 20 samples
Every sample
Pesticides/Polychlorinated biphenylsd As neededc 1 per 10 samples
NA 1 per 20 samples
1 per 20 samples
1 per 20 samples
1 per 20 samples
Every sample
Notes: a – Calibration and certification of drying ovens and weighing scales are conducted bi‐annually b – Initial calibration verification and calibration blank must be analyzed at the beginning of each batch c – Initial calibrations are considered valid until the ongoing continuing calibration no longer meets method specifications. At that point, a new initial calibration is
performed d – Pesticides and PCBs will have all detects confirmed via second column confirmation. The second column must be of a dissimilar stationary phase from the primary
column and meet all method requirements for acceptance. NA = not applicable SRM = standard reference material LCS = laboratory control sample

Chemical and Physical Analytical Testing
Sampling and Analysis Plan October 2012 Kenmore Area Sediment and Water Characterization 36 120891-01.01
Table 6
Data Quality Objectives for Sediment and Water
Parameter Precision Accuracy Completeness
Grain size ± 20% RPD NA 95%
Total solids/total volatile solids ± 20% RPD NA 95%
Total organic carbon ± 20% RPD 65‐135% R 95%
Total metals ± 35% RPD 75‐125% R 95%
Dioxin and Furans ± 50% RPD 50‐140% R 95%
Tributyltin ± 50% RPD 50‐150% R 95%
Semivolatile organic compounds ± 50% RPD 50‐150% R 95%
Pesticides/Polychlorinated biphenyls ± 50% RPD 50‐150% R 95%
Notes: R = recovery RPD = relative percent difference
5.1.1 Laboratory Instrument Calibration and Frequency
An initial calibration will be performed on each laboratory instrument to be used prior to the
start of the project, after each major interruption to the analytical instrument, and when any
ongoing calibration does not meet method control criteria. A calibration verification will be
analyzed following each initial calibration and will meet method criteria prior to analysis of
samples. Continuing calibration verifications (CCV) will be performed daily prior to any
sample analysis to track instrument performance. The frequency of CCVs varies with
method. For gas chromatograph/mass spectrometer (GC/MS) methods, one will be analyzed
every 12 hours. For GC, metals, and inorganic methods, one will be analyzed for every ten
field samples, or daily, whichever is specified in the method. If the ongoing continuing
calibration is out of control, the analysis must come to a halt until the source of the control
failure is eliminated or reduced to meet control specifications. All project samples analyzed
while instrument calibration was out of control will be reanalyzed.
Instrument blanks or continuing calibration blanks provide information on the stability of
the baseline established. Continuing calibration blanks will be analyzed immediately prior
to, or immediately following, CCV at the instrument for each type of applicable analysis.

Chemical and Physical Analytical Testing
Sampling and Analysis Plan October 2012 Kenmore Area Sediment and Water Characterization 37 120891-01.01
5.1.2 Laboratory Duplicates/Replicates
Analytical duplicates provide information on the precision of the analysis and are useful in
assessing potential sample heterogeneity and matrix effects. Analytical duplicates and
replicates are subsamples of the original sample that are prepared and analyzed as a separate
sample.
5.1.3 Matrix Spikes/Matrix Spike Duplicates
Analysis of MS samples provides information on the extraction efficiency of the method on
the sample matrix. By performing duplicate MS analyses, information on the precision of the
method is also provided for organic analyses.
5.1.4 Method Blanks
Method blanks are analyzed to assess possible laboratory contamination at all stages of
sample preparation and analysis. The method blank for all analyses must be less than the
MRL of any single target analyte/compound. If a laboratory method blank exceeds this
criterion for any analyte/compound, and the concentration of the analyte/compound in any
of the samples is less than five times the concentration found in the blank (ten times for
common contaminants), analyses must stop and the source of contamination must be
eliminated or reduced.
5.1.5 Laboratory Control Samples
Laboratory control samples (LCS) are analyzed to assess possible laboratory bias at all stages
of sample preparation and analysis. The LCS is a matrix-dependent spiked sample prepared
at the time of sample extraction along with the preparation of sample and the MSs. The LCS
will provide information on the precision of the analytical process, and when analyzed in
duplicate, will provide accuracy information as well.
5.1.6 Standard Reference Materials
Standard Reference Materials (SRM) is analyzed to assess possible matrix affects at all stages
of sample preparation and analysis. The SRM is a matrix-matched sample that is carried
through all aspects of preparation and analysis as a field sample and has a known

Chemical and Physical Analytical Testing
Sampling and Analysis Plan October 2012 Kenmore Area Sediment and Water Characterization 38 120891-01.01
concentration of target analytes. Puget Sound SRM will be used for dioxin and furan and PCB
analyses (DMMO 2012). Performance will be evaluated using the DQOs listed in Table 6 and
as outlined in DMMO (2010) and Ecology (2008).
5.2 Laboratory Data Package
ARI will prepare a detailed laboratory data package documenting all activities associated
with the sample analyses. The following information will be included in this data package:
Project Narrative: A detailed narrative that describes the samples received, analyses
performed, and corrective actions undertaken.
COC Documentation: Laboratory policy requires that COC documentation be
available for all samples received. The COC will document basic sample
demographics such as client and project names, sample identification, analyses
requested, and special instructions.
Data Summary Form: A tabular listing of concentrations and/or detection limits for
all target analytes. The data summary form will also list other pertinent information
such as amount of sample analyzed, dilution factors, sample processing dates, extract
cleanups, and surrogate recoveries.
QC Summary: Includes results of all QC analyses, specifically recovery information.
LCSs are reported with each batch. Additional QC analyses may include laboratory
replicates, MS, and SRMs.
Instrument Calibration Forms and Raw Data: Includes initial and continuing
calibration summaries and instrument tuning data, laboratory bench sheets, and
logbook pages.

Chemical and Physical Analytical Testing
Sampling and Analysis Plan October 2012 Kenmore Area Sediment and Water Characterization 39 120891-01.01
5.3 Data Validation and Verification
Laboratory data will be provided in both PDF and EQuIS electronic format. Once data are
received from the laboratory, a number of QC procedures will be followed to provide an
accurate evaluation of the data quality. A Stage 2A level (USEPA 2009) data quality review
(equivalent to a QA1 review) will be performed by Anchor QEA (or a subconsultant), in
accordance with U.S. Environmental Protection Agency (USEPA) National Functional
Guidelines (USEPA 2004, 2008) by considering the following:
Data completeness
Holding times
Method blanks
Surrogate recoveries
Detection limits
RLs
LCSs
MS/MSD samples
SRM results
The data will be validated in accordance with the project-specific DQOs (Table 6), analytical
method criteria, and the laboratory’s internal performance standards based on their Standard
Operating Procedures. Dioxin and furan data will be validated at a Stage 4 level (USEPA
2009) by a subconsultant using the DQOs outlined in DMMO (2010) and/or the SAPA
(Ecology 2008). The results of the data quality review, including text assigning qualifiers in
accordance with the USEPA National Functional Guidelines and a tabular summary of
qualifiers, will be generated by the Database Manager and submitted to the project QA/QC
Manager for final review and confirmation of the validity of the data. A copy of the
validation report will be submitted by the QA/QC Manager and will be presented as an
appendix to the Results Memorandum.
Laboratory data, which will be electronically provided and loaded into the database, will
undergo a 10% check against the laboratory hard copy data. Data will be validated or
reviewed manually, and qualifiers, if assigned, will be entered manually. The accuracy of all
Chemical and Physical Analytical Testing
Sampling and Analysis Plan October 2012 Kenmore Area Sediment and Water Characterization 40 120891-01.01
manually entered data will be verified by a second party. Data tables will be exported from
EquIS database to Microsoft Excel tables.
Sampling and Analysis Plan October 2012 Kenmore Area Sediment and Water Characterization 41 120891-01.01
6 SAMPLING AND ANALYSIS RESULTS MEMORANDUM
The Results Memorandum will be prepared by Anchor QEA documenting all activities
associated with sample collecting, compositing, transporting, and chemically analyzing
sediment and water samples. The laboratory data packages will be included as appendices
and also submitted in electronic formats including Ecology’s EIM format. The following will
be included in the Results Memorandum:
Summary of all field activities including a description of any deviations from the
approved SAP
Locations of sediment and water sampling stations in state plane coordinates to the
nearest foot (Washington North Zone), and in latitude and longitude in degrees and
minutes to four decimal places (NAD 83); all vertical elevations of mudline and water
surface will be reported to the nearest 0.1-foot
A project map with actual sampling locations
A QA/QC narrative for laboratory results
Summary data results tables
Summary of comparison of chemical results with DMMP interpretive criteria
(DMMO 2010, 2011) and Ecology’s interim freshwater SQV (Ecology 2003) as shown
in Table 2
Hard copies of field data will be provided with the Results Memorandum and laboratory
analysis results and associated QA/QC data will be available. Results of the laboratory
analyses will be submitted to the DMMO in DAIS format and to Ecology in EIM format. The
Results Memorandum will be submitted to DMMO, Ecology, and DOH within 12 weeks
after completion of the field sampling activities. Ecology and DOH will be responsible for
preparing separate reports with additional evaluations and interpretation based on the
information included in the Results Memorandum.

Sampling and Analysis Plan October 2012 Kenmore Area Sediment and Water Characterization 42 120891-01.01
7 PROJECT SCHEDULE
The estimated schedule for the sampling, analysis, and reporting activities are summarized in
Table 7. Finalization of the SAP is anticipated for late October, with sampling planned for
the end of October/early November.
Table 7
Estimated Schedule
Description Schedule
Approved Sampling and Analysis Plan late October/early November 2012
Field Sampling and Lab Coordination 1 week; initiated within 2‐3 weeks of SAP approval by Ecology and other agencies
Lab Testing 4 weeks for chemistry testing
Data Validation 4 weeks for data validation and QA/QC
Results Memorandum and Submittal of data to EIM
4 weeks after receipt of validated results and completion of QA/QC
Evaluations Conducted by Ecology 4‐8 weeks after submittal of Results Memorandum
Health Consultations Conducted by DOH Spring 2013
Notes: DOH = Washington State Department of Health Ecology = Washington State Department of Ecology EIM = Ecology’s Environmental Information Management database QA/QC = quality assurance/quality control

Sampling and Analysis Plan October 2012 Kenmore Area Sediment and Water Characterization 43 120891-01.01
8 REFERENCES
AMEC (AMEC Earth and Environmental, Inc.), 2001. Remedial Investigation/Feasibility
Study Kenmore Industrial Park NE Bothell Way and Juanita Drive NE. Kenmore,
Washington.
ASTM D-2488 modified, 2005. Standard Practice for Description and Identification of Soils.
ASTM International.
DMMO (Dredged Material Management Office), 2009. Dredged Material Evaluation and
Disposal Procedures (User’s Manual). Prepared by U.S. Army Corps of Engineers,
Seattle District; U.S. Environmental Protection Agency, Region 10; Washington
Department of Natural Resources; Washington Department of Ecology. Updated
November.
DMMO, 2010. Dredged Material Management Program New Interim Guidelines for Dioxins.
Prepared by U.S. Army Corps of Engineers, Seattle District; U.S. Environmental
Protection Agency, Region 10; Washington Department of Natural Resources;
Washington Department of Ecology. December 6, 2010. Available from:
http://www.nws.usace.army.mil/Portals/27/docs/civilworks/dredging/Updates/2010-
New_Interim_Guidelines_for_dioxin.pdf.
DMMO, 2011. DMMP Guideline Chemistry Values. Cited: October 2012. Available from:
http://www.nws.usace.army.mil/Portals/27/docs/civilworks/dredging/DMMP%20CO
Cs%20-%20marine%20and%2006%20freshwater%20values.pdf.
DMMO, 2012. Puget Sound Sediment Reference Material: Requesting and Analyzing
the SRM, and Reporting Data. May 2012. Available from:
http://www.nws.usace.army.mil/Portals/27/docs/civilworks/dredging/SRM/Guidance
%20for%20Distribution%20and%20Reporting%20SRM%205-29-12.pdf.
Ecology (Washington State Department of Ecology), 1995. Sediment Management Standards
- Chapter 173-204 WAC. Washington State Department of Ecology. December 1995.
Ecology, 2001. Kenmore Industrial Park Notice of Public Comment Period, Investigation
Results, Cleanup Plan, and Consent Decree for Public Review and Comment.
Publication 01-09-010.

References
Sampling and Analysis Plan October 2012 Kenmore Area Sediment and Water Characterization 44 120891-01.01
Ecology, 2003. Development of Freshwater Sediment Quality Values for Use in Washington
State. Washington Department of Ecology, Toxics Cleanup Program. Publication #
03-09-008. September.
Ecology, 2006. Standard Operating Procedure for Manually Obtaining Surface Water
Samples. Washington State Department of Ecology Environmental Assessment
Program, Olympia WA. October2005. Available from:
http://www.ecy.wa.gov/programs/eap/qa/docs/ECY_EAP_SOP_ManuallyObtainingSu
rfaceWaterSamples_v1_1EAP015.pdf.
Ecology, 2008. Sediment Sampling and Analysis Plan Appendix. Guidance on the
Development of Sediment Sampling and Analysis Plans Meeting the Requirements of
the Sediment Management Standards (Chapter 173-204 WAC). Ecology Publication
No. 03-09-043. Department of Ecology Sediment Management Unit. February 2008.
Ecology, 2012a. Document Repository for Kenmore Industrial Park AKA Lakepointe.
Accessed: July 17, 2012. Available from:
https://fortress.wa.gov/ecy/gsp/CleanupSiteDocuments.aspx?csid=2134.
ESA Adolfson, 2010. Kenmore Shoreline Master Program Update Inventory and Analysis.
Prepared for the City of Kenmore. February 2010.
Herrera (Herrera Environmental Consultants), 2005. Sedimentation Study Tributary 0056.
Prepared for the City of Kenmore. September 2005.
Herrera Environmental Consultants, 2007. North Lake Washington Tributary 0056
Feasibility Study. Prepared for the City of Kenmore. June 2007.
Hoffman, E., 1998. DMMP Clarification Paper/SMS Technical Information Memorandum.
Tributyltin Analysis: Clarifications of Interstitial Water Extraction and Analysis
Method-Interim. Prepared by the U.S. Environmental Protection Agency for the
DMMP agencies, December 1998.
Inouye, L and Fox, D. 2011. DMMP Clarification Paper. Marine Sediment Quality
Screening Levels: Adopting RSET Marine SLs for Use in DMMP. Prepared by Laura
Inouye (Ecology) and David Fox (USACE). June 2011. Available from:
http://www.nws.usace.army.mil/Portals/27/docs/civilworks/dredging/SMARM_2011-
changes_to_marine_SLs-final.pdf.
References
Sampling and Analysis Plan October 2012 Kenmore Area Sediment and Water Characterization 45 120891-01.01
Kendall, D.R., 2001. DMMP Clarification Paper: Clarifications to the DMMP Z-Sample
Analysis Guidance and/or Post Dredge Monitoring Policy. Prepared by the U.S.
Army Corps of Engineers for the DMMP agencies, October 2001.
King County, 2004. A Sediment Triad Analysis of Lakes Sammamish, Washington, and
Union. Prepared by Kari L. Moshenberg, Department of Natural Resources and
Parks, Seattle, Washington.
LaFlam, J., 2012. Personal communication with W. Joyce. Kenmore, Washington,
September 30, 2012.
PSEP (Puget Sound Estuary Program), 1986. Recommended protocols for measuring
conventional sediment variables in Puget Sound. Prepared for the Puget Sound
Estuary Program, U.S. Environmental Protection Agency, Region 10, Office of Puget
Sound, Seattle, Washington.
PSEP, 1997a. Puget Sound Estuary Program: Recommended Guidelines for Sampling
Marine Sediment, Water Column, and Tissue in Puget Sound. Prepared for the U.S.
Environmental Protection Agency Region 10, and the Puget Sound Water Quality
Authority. Puget Sound Water Quality Authority, Olympia, Washington.
PSEP, 1997b. Puget Sound Estuary Program: Recommended Guidelines for Measuring
Organic Compounds in Puget Sound Sediment and Tissue Samples. Prepared for the
U.S. Environmental Protection Agency Region 10, and the Puget Sound Water
Quality Authority. Puget Sound Water Quality Authority, Olympia, Washington.
PSEP, 1997c. Puget Sound Estuary Program: Recommended Protocols for Measuring Metals
in Puget Sound Sediment and Tissue Samples. Prepared for the U.S. Environmental
Protection Agency Region 10, and the Puget Sound Water Quality Authority. Puget
Sound Water Quality Authority, Olympia, Washington.
Schneider, Lynn, 2004. Quality Assurance Project Plan: BEACH Program. Environmental
Assessment Program of the Washington State Department of Ecology. Olympia,
Washington.
USACE, 1992. Decision on the Suitability of Dredge Material Tested Under PSDDA
Guidelines for the King County Sammamish River Small Boat Navigation Channel
References
Sampling and Analysis Plan October 2012 Kenmore Area Sediment and Water Characterization 46 120891-01.01
Project (92-2-00795). U.S. Army Corps of Engineers, Seattle, Washington. October
1992.
USACE, 1996. Decision on the Suitability of Dredge Material Tested Under PSDDA
Evaluation Procedures for USACE Kenmore Maintenance Dredging. U.S. Army
Corps of Engineers, Seattle, Washington. July 1996.
USACE, 2010. Revised Supplemental Information on Polychlorinated Dioxins and Furans
(PCDD/F) for Use in Preparing a Quality Assurance Project Plan (QAPP). November
8, 2010. Available from:
http://www.nws.usace.army.mil/Portals/27/docs/civilworks/dredging/Updates/2010-
Final_DMMP_dioxin_QAPP.pdf.
USACE, 2011. Determination on the Suitability of Supplemental Characterization of
Proposed Maintenance Dredged Material from Harbour Village Marina Dredging
Project in Lake Washington Evaluated Under Section 404 of the Clean Water Act.
U.S. Army Corps of Engineers, Seattle, Washington. October 2011.
USEPA, 2004. USEPA Contract Laboratory Program National Functional Guidelines for
Inorganic Data Review. EPA540-R-04-004, October 2004. USEPA, 2004. USEPA
Contract Laboratory Program National Functional Guidelines for Inorganic Data
Review. U.S. Environmental Protection Agency, Office of Superfund Remediation
and Technology Innovation (OSRTI). EPA 540-R-04-004. October.
USEPA, 2008. USEPA Contract Laboratory Program National Functional Guidelines for
Superfund Organic Methods Data Review. U.S. Environmental Protection Agency,
Office of Superfund Remediation and Technology Innovation. USEPA 540-R-08-01.
June.
van den Berg, M., L.S. Birnbaum, M. Denison, M. De Vito, W. Farland, M. Feeley, H. Fiedler,
H. Hakansson, A. Hanberg, L. Haws, M. Rose, S. Safe, D. Schrenk, C. Tohyama, A.
Trischer, J. Tuomisto, M. Tysklind, N. Walker, and R.E. Peterson, 2006. The 2005
World Health Organization re-evaluation of human and mammalian toxic
equivalency factors for dioxins and dioxin-like compounds. Toxicol Sci
93(2):223−241.

References
Sampling and Analysis Plan October 2012 Kenmore Area Sediment and Water Characterization 47 120891-01.01
WAC 246-290. Group A Public Water Systems. Washington Administrative Code, Olympia,
Washington. Available from: http://apps.leg.wa.gov/wac/default.aspx?cite=246-291-
330.
Windward, 2010. Lower Duwamish Waterway Remedial Investigation Report. Final.
Prepared by Windward Environmental LLC for the Lower Duwamish Waterway
Group. July 2010.

APPENDIX A FIELD FORMS AND LOGS
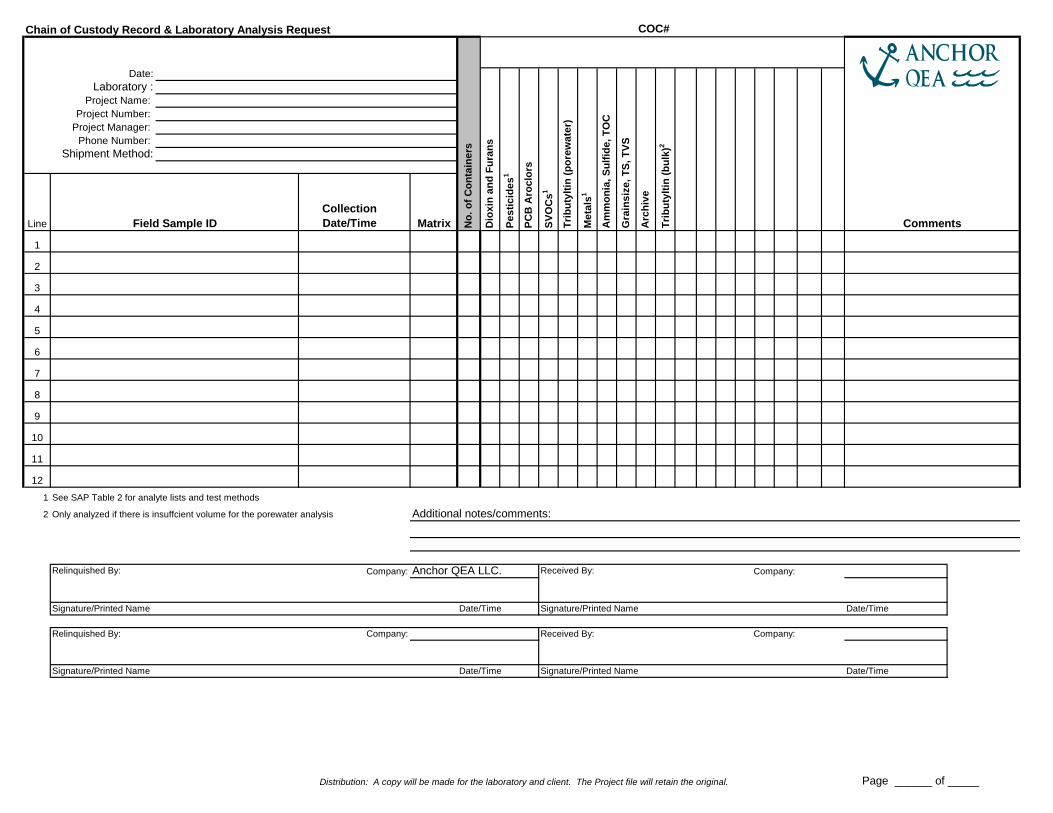
Distribution: A copy will be made for the laboratory and client. The Project file will retain the original. Page ______ of _____
Chain of Custody Record & Laboratory Analysis Request COC#
Date: Laboratory :
Project Name: Project Number:
Project Manager: Phone Number:
Shipment Method:
Line
Collection Date/Time Matrix
1
2
3
4
5
6
7
8
9
10
11
12
1 See SAP Table 2 for analyte lists and test methods
2 Only analyzed if there is insuffcient volume for the porewater analysis Additional notes/comments:
Relinquished By: Company: Anchor QEA LLC. Received By: Company:
Signature/Printed Name Date/Time Signature/Printed Name Date/Time
Relinquished By: Company: Received By: Company:
Signature/Printed Name Date/Time Signature/Printed Name Date/Time
SV
OC
s1
Me
tals
1
Pe
sti
cid
es
1
CommentsPC
B A
roc
lors
Am
mo
nia
, S
ulf
ide
, T
OC
Tri
bu
tylt
in (
bu
lk)2
Gra
ins
ize
, T
S,
TV
S
Arc
hiv
e
Tri
bu
tylt
in (
po
rew
ate
r)
Field Sample ID No
. o
f C
on
tain
ers
Dio
xin
an
d F
ura
ns
Daily LogAnchor QEA L.L.C.720 Olive Way, Suite 1900Seattle, WA 98101Phone 206.287.9130 Fax 206.287.9131
PROJECT NAME: DATE:
SITE ADDRESS: PERSONNEL:
WEATHER: WIND FROM: N NE E SE S SW W NW LIGHT MEDIUM HEAVYSUNNY CLOUDY RAIN ? TEMPERATURE: ° F . ° C
[Circle appropriate units]
TIME COMMENTS
See Field Logs for detailed logging and sampling
Equipment on site:
Notes: Work performed, Phone calls made, Problems Issues/Resolutions, Visitors on siteSafety infractions, Important comments/instructions to contractors
Signature:

Horizontal Datum: Long. Water Height Tide MeasurementsDTM Depth Sounder: Time: 1) Overlying water is present
2) Water has low turbidity
DTM Lead Line: Height: 3) Sampler is not overfilled
4) Surface is flat
5) Desired penetration depth
Mudline Elevation (lower low water-large tides): calculated after samplingNotes:
Longitude/Easting Lattidue/ Northing
Sample Description:
Sample Containers:
Analyses:
surface cover, (density), moisture, color, minor modifier, MAJOR modifier, other constituents, odor, sheen, layering, anoxic layer, debris, plant matter, shells, biota
Contractor: Target Coordinates: Lat.
Sample Acceptability Criteria:
Grab # TimeActual Coordinates
Sample Accept (Y/N)
Recovery Depth (cm)
Comments: jaws close, good seal, winnowing, overlying water, surface intact, etc
Field Staff: Sample Method:
Surface Sediment Field LogJob: Station: Job No: Date:

720 Olive Way, Suite 1900 Seattle, Washington 98101 Phone 206.287.9130 Fax 206.287.9131 www.anchorqea.com
Water Quality and Sample Collection Form Station ID:
Date:
Time:
Project Name:
Project Number:
Coordinates: Datum:
Lat/Northing
Long/Easting
Sample Depth: Total Water Depth:
Weather Observations: Field Parameters Temperature
°C
Turbidity NTU Others:
pH
DO mg/L
Conductivity
Sample Description
Evidence of floating or suspended materials:
Y / N
Evidence of oil/hydrocarbon sheen:
Y / N
Describe any discoloration and turbidity:
Odor
none, slight, moderate, strong H2S, petroleum, septic
Comments (e.g., boat activity, river flow rate, stormwater discharges in the vicinity) :
Recorded by: