Embed Size (px)
Citation preview
74:1 (2015) 43–50 | www.jurnalteknologi.utm.my | eISSN 2180–3722 |
Full paper Jurnal
Teknologi
Electrical Capacitance Tomography (ECT): An Improved Sensitivity Distribution Using Two-Differential Excitation Technique Elmy Johana Mohamada*, Hanis Liyana Mohmad Amerana, Ruzairi Abdul Rahimb, Omar Md. Faizan Marwahc
aJabatan Kejuruteraan Mekatronik & Robotik, Fakulti Kejuruteraan Elektrik & Elektronik, Universiti Tun Hussein Onn Malaysia, Malaysia bProcess Tomography and Instrumentation Engineering Research Group (PROTOM-i), Infocomm Research Alliance, Faculty of Electrical Engineering, Universiti Teknologi Malaysia, 81310 UTM Johor Bahru, Malaysia cJabatan Kejuruteraan Mekanikal & Pembuatan, Fakulti Kejuruteraan Pembuatan & Industri, Universiti Tun Hussein Onn Malaysia, Malaysia *Corresponding author: [email protected]
Article history
Received :9 November 2014 Received in revised form :
15 January 2015
Accepted :15 March 2015
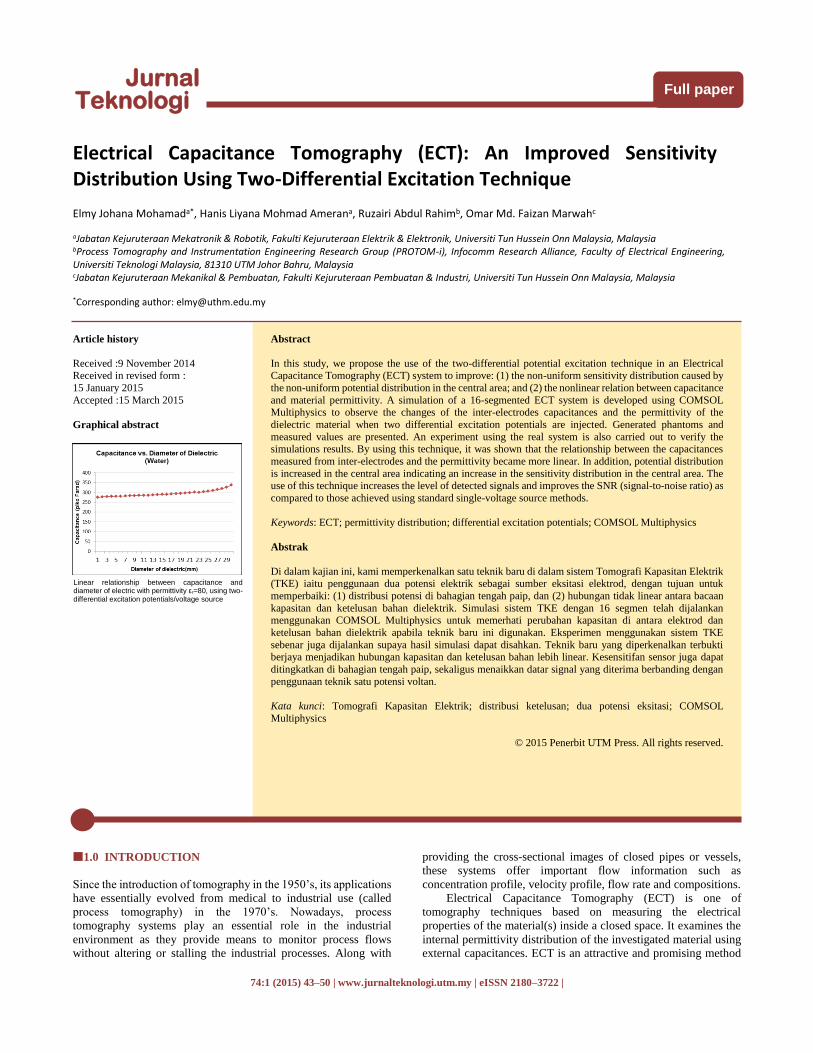
Graphical abstract
Abstract
In this study, we propose the use of the two-differential potential excitation technique in an Electrical Capacitance Tomography (ECT) system to improve: (1) the non-uniform sensitivity distribution caused by
the non-uniform potential distribution in the central area; and (2) the nonlinear relation between capacitance
and material permittivity. A simulation of a 16-segmented ECT system is developed using COMSOL Multiphysics to observe the changes of the inter-electrodes capacitances and the permittivity of the
dielectric material when two differential excitation potentials are injected. Generated phantoms and
measured values are presented. An experiment using the real system is also carried out to verify the simulations results. By using this technique, it was shown that the relationship between the capacitances
measured from inter-electrodes and the permittivity became more linear. In addition, potential distribution
is increased in the central area indicating an increase in the sensitivity distribution in the central area. The use of this technique increases the level of detected signals and improves the SNR (signal-to-noise ratio) as
compared to those achieved using standard single-voltage source methods.
Keywords: ECT; permittivity distribution; differential excitation potentials; COMSOL Multiphysics
Abstrak
Di dalam kajian ini, kami memperkenalkan satu teknik baru di dalam sistem Tomografi Kapasitan Elektrik (TKE) iaitu penggunaan dua potensi elektrik sebagai sumber eksitasi elektrod, dengan tujuan untuk
memperbaiki: (1) distribusi potensi di bahagian tengah paip, dan (2) hubungan tidak linear antara bacaan
kapasitan dan ketelusan bahan dielektrik. Simulasi sistem TKE dengan 16 segmen telah dijalankan menggunakan COMSOL Multiphysics untuk memerhati perubahan kapasitan di antara elektrod dan
ketelusan bahan dielektrik apabila teknik baru ini digunakan. Eksperimen menggunakan sistem TKE
sebenar juga dijalankan supaya hasil simulasi dapat disahkan. Teknik baru yang diperkenalkan terbukti berjaya menjadikan hubungan kapasitan dan ketelusan bahan lebih linear. Kesensitifan sensor juga dapat
ditingkatkan di bahagian tengah paip, sekaligus menaikkan datar signal yang diterima berbanding dengan
penggunaan teknik satu potensi voltan.
Kata kunci: Tomografi Kapasitan Elektrik; distribusi ketelusan; dua potensi eksitasi; COMSOL
Multiphysics
© 2015 Penerbit UTM Press. All rights reserved.
1.0 INTRODUCTION
Since the introduction of tomography in the 1950’s, its applications
have essentially evolved from medical to industrial use (called
process tomography) in the 1970’s. Nowadays, process
tomography systems play an essential role in the industrial
environment as they provide means to monitor process flows
without altering or stalling the industrial processes. Along with
providing the cross-sectional images of closed pipes or vessels,
these systems offer important flow information such as
concentration profile, velocity profile, flow rate and compositions.
Electrical Capacitance Tomography (ECT) is one of
tomography techniques based on measuring the electrical
properties of the material(s) inside a closed space. It examines the
internal permittivity distribution of the investigated material using
external capacitances. ECT is an attractive and promising method
Linear relationship between capacitance and diameter of electric with permittivity εr=80, using two-differential excitation potentials/voltage source
44 Elmy Johana Mohamad et al. / Jurnal Teknologi (Sciences & Engineering) 73:1 (2015), 43–50
for the measurement of two-phase flow as this measurement
technique is able to differentiate materials based on their
permittivity. Besides, ECT offers non-invasive measurement with
high-speed capabilities and good reliability. ECT has been utilized
successfully in numerous industrial applications of multiphase
flow1-4.
However, there are known principal difficulties of image
reconstruction using the conventional ECT system: (1) the
nonlinear relationship between the permittivity distribution and
capacitance due to the distortion of electric field caused by the
existence of the material in the vicinity (also known as fringe
capacitance effect)1,3,5; and (2) the poor signal-to-noise ratio (SNR)
in the central area of pipes as the sensor is more sensitive near the
pipe wall than in the central area (a typical maximum sensitivity of
an adjacent electrode pair in an 12-electrode ECT sensor with
single-electrode excitation and single-electrode detection is 100
times larger than that of an opposing electrode pair1), and
consequently causes the mutual capacitances to be small, which
leads to small electrode charges (and their change)1,6.
An ECT is a soft-field sensing method which means the sensor
field is sensitive to the component parameters distribution, both
inside and outside the measurement volume. The stray electric
fields from the sensors will cause fringe capacitance effect thus
alter the measured standing capacitance between electrodes. For
sensors with internal electrodes, the capacitance caused by the
electric field inside the sensor will always increase in proportion to
the material permittivity when the sensor is filled uniformly with a
higher permittivity material. The wall has a negative effect on the
measurement of the internal capacitance because the wall
capacitance is effectively in series with the internal capacitance5.
However, in the case of external electrodes sensor, which is used
in this project, the permittivity of the wall causes nonlinear changes
in capacitance. The capacitance value may increase or decrease
depending on the wall thickness, permittivity of the sensor’s wall
and permittivity of its contents7. In addition, the nonlinear change
of the capacitance due to an increase in conductivity has been
reported through software simulation and experiment8. As the
conductivity increased, the inter-electrode capacitance increased
and became less sensitive to the permittivity distribution in the
sensing region.
The conventional method of measuring the capacitances
between all electrode pairs in ECT system is the single-electrode
excitation scheme, where only one excitation potential or source is
applied to each of the sensor’s electrodes in turn (while the
remaining electrodes kept at ground potential). It has been stated
that the sensitivity is proportional to the electrical field strength9.
There are only few techniques proposed in earlier studies that
focus in improving the sensitivity, thus the SNR in the central area.
For example, a scheme called parallel field excitation has been
proposed previously5,10. In this scheme, the parallel field is
generated by applying excitation signals to all electrodes. However,
if excitation signals are applied to multiple electrodes, it is possible
to generate a parallel field within the ECT sensor. The sensitivity
maps of a parallel-field ECT sensor are simply linear
superimpositions of the sensitivity maps of the conventional ECT
sensor, and therefore, a parallel-field ECT sensor still does not have
a uniform sensitivity distribution.
In this work, we propose the use of two-differential potentials
excitation sources scheme instead of the single excitation source
scheme which is conventionally used. Two-differential potential
excitations are injected to electrode pairs to create a considerably
uniform excitation field across the sensor. This technique has never
been applied in an ECT system before. The SNR (signal noise to
ratio) can be improved proportionally with the increase in voltage
across the center of the pipes.
2.1 Single Excitation Potential
The standard excitation scheme used in an ECT system consists of
the injection of a single potential power source into the electrode.
Each of sixteen electrodes is excited at a time with similar
excitation source. All other electrodes will act as the detectors and
remain at zero potential. The capacitances between the excited
electrode and each of its detecting electrode pairs are measured. For
example, when the first electrode is excited and all other electrodes
are at zero potential, the charges between electrode 1 and electrodes
2–16 are measured and noted C2-1–C16-1. This procedure was
repeated by applying voltage to electrode n and measuring the
charge on the electrodes up to 16, until, as a final step, voltage is
applied to electrode 15 and the charge of 16 electrodes is measured.
In this way, 120 independent mutual capacitance values were
produced. In this project, a 25 Vpp signal is used as the excitation
source.
2.2 Two-Differential Excitation Potentials
We introduce a new scheme called two-differential excitation
potentials technique. A two-differential voltage source is applied at
an electrode pair. In the first step, to obtain a complete set of data
for one image, the first electrode (electrode 1) becomes the
excitation electrode/source electrode (which is supplied with a sine
wave), while all the other electrodes act as receivers, and receive
the capacitor value corresponding to the dielectric in between. For
example, capacitances between electrodes 1 and 2, 1 and 3, 1 and
4 until the adjunction electrode, electrode 1 and 14, 1 and 15 and
the last electrode 1 and 16 are measured, in parallel. In this time,
when electrode 1 was injected by the source, electrodes other than
electrode 1 are at the virtual earth potential imposed by the
transducer and they are called the detecting electrode.
During this measurement phase, electrode 1 was injected by
two differential excitation potentials/voltage sources (4Vpp and 24
Vpp) sequentially, where the lower excitation voltage source 4Vpp
will excited to receive adjunction electrode pairs, for example; 1
and 2, 1 and 3, 1 and 4 also 1 and 14, 1 and 15 then 1 and 16, while
an opposing electrode pair, in this case electrode 5 until electrode
13, will receive a high voltage excitation source of 24 Vpp. In the
next step, electrode 2 acts as excitation and electrodes 3-16 are used
for detection, obtaining 14 capacitance measurements. This process
continues until electrode 15 is used for excitation and electrode 16
for detection, which obtains only one capacitance measurement. In
this case, there will be 120 independent capacitance measurements.
In general, the number of independent capacitance measurements
is governed by N (N−1)/2, where N is the number of electrodes.
3.0 METHODOLOGY
In order to analyse the capability of the proposed technique, both
simulative and experimental study of a 16-segmented ECT system
were done. We verify the performance of this technique by
comparing the simulation and experiment results when two-
differential potential excitation is injected to the sensor with the
results obtained using the standard single potential excitation
source. The simulation of ECT sensor allows us to analyse the
permittivity distribution by observing the deflection of electric field
lines inside the pipe when the electrodes are excited. In this work,
we also investigate the changes of capacitance when the diameter
of the dielectric with the higher permittivity increases. Annular
phantoms with different combinations of dielectric permittivity are
generated for the simulations and experiments.
45 Elmy Johana Mohamad et al. / Jurnal Teknologi (Sciences & Engineering) 73:1 (2015), 43–50
3.1 ECT Simulation
The simulative study could be done by using commercial multi-
purpose simulation software e.g. COMSOL Multiphysics and
MATLAB, or by custom designed solvers11, 12. In this work, we
create a forward modeling of the real ECT sensor using COMSOL
Multiphysics. The software is able to quantify the capacitance
measurements between electrodes when an electric field is applied;
and to obtain the permittivity distribution inside the closed pipe
from the sensor by applying the Linear Finite Element Method
(FEM). The capacitance sensor model design in COMSOL holds
the purpose to apply numerical calculation for defining the electric
potential within the sensor. This indicates that it can solve the
problem of ECT forward which is to calculate the capacitances
between all possible electrode pairs.
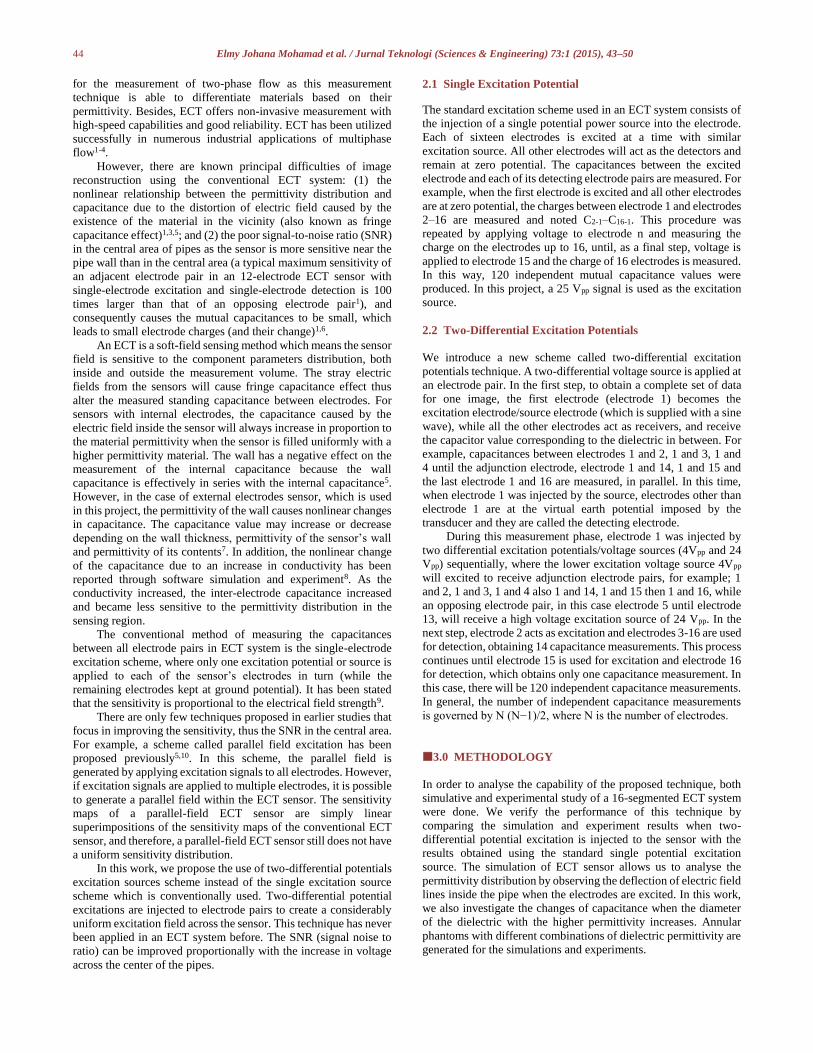
The shape of a pipeline is drawn as the first step in developing
the numerical modeling. The shape of a pipeline is actually an
illustration of a circle with some particular diameter. As for this
case, the applied drawing geometry will have to follow the actual
size and geometry of the hardware. Figure 1 illustrates the 16-
electrodes sensor arrangement which was used in this work. Each
electrode plate is 120 mm in length. The sensor has been designed
to cover an acrylic pipe with a diameter of 110 mm and a wall
thickness of 0.5 cm.
In this simulation, the geometry comprises the spatial
discretisation of the sensor inner part. This technique is called FEM
meshing and its purpose is to acquire a consistent definition in the
area to be observed. This is also to get a higher definition near the
electrodes, where more accuracy electrode-pairs are required by
means of the method described in.
To obtain the potential distribution and the electrical field
lines within the space of the sensor, we analyse the potential
difference between the excited electrodes and the detecting
electrode. This will allow the verification of the potential difference
between inter-electrode capacitance.
We firstly observe the permittivity distribution inside the pipe
when we fill it with single type of dielectric which is water. We
then generate different types of annular phantoms where we fill
them with different permittivity values to further investigate the
changes of capacitance due to the materials permittivity. We
injected both type of excitation for each simulation and compare
the results.
Figure 1 16-segmented sensor arrangement
3.2 ECT Hardware Development & Experimental Setup
An ECT sensor is developed in this work and will be used to
analyse the performance of the proposed technique. Experiments
were performed to compare the distribution of potentials between
using two differential excitation potentials and using the
conventional technique, which only applies one excitation
potential. The charges of the opposing electrodes to the adjunction
electrode, which was the last electrode, were measured.
The new approach of the developed sensing module is the
integration of intelligent electrode sensing circuit on each of
electrode sensors. A microcontroller unit and data acquisition
(DAQ) system has been integrated on the electrode sensing circuit,
making the sensor able to work independently. Each of the circuits
consists of; signal switching circuit, signal detection and amplifier
circuit, absolute value circuit, low pass filter circuit, programmable
gain amplifier (PGA), analog to digital converter circuit and a
microcontroller control unit. The desired sequence operation of
electrode’s signal selection, measuring data and conversion data
depends on the microcontroller programming.
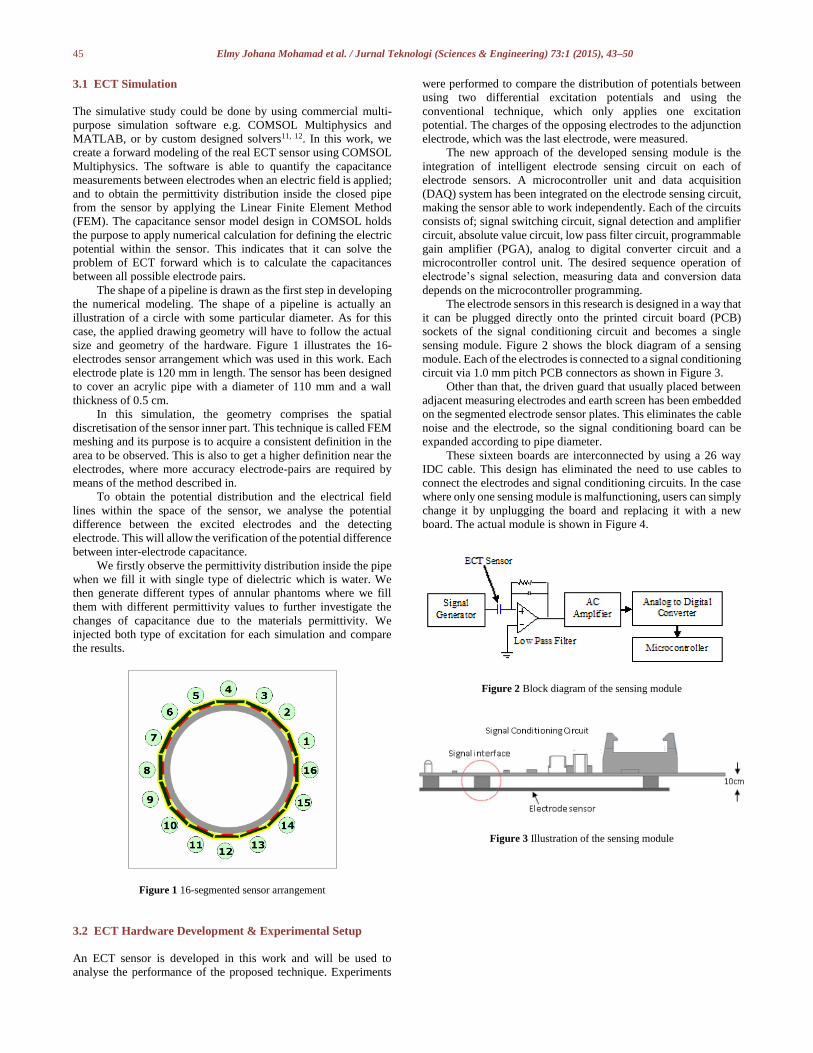
The electrode sensors in this research is designed in a way that
it can be plugged directly onto the printed circuit board (PCB)
sockets of the signal conditioning circuit and becomes a single
sensing module. Figure 2 shows the block diagram of a sensing
module. Each of the electrodes is connected to a signal conditioning
circuit via 1.0 mm pitch PCB connectors as shown in Figure 3.
Other than that, the driven guard that usually placed between
adjacent measuring electrodes and earth screen has been embedded
on the segmented electrode sensor plates. This eliminates the cable
noise and the electrode, so the signal conditioning board can be
expanded according to pipe diameter.
These sixteen boards are interconnected by using a 26 way
IDC cable. This design has eliminated the need to use cables to
connect the electrodes and signal conditioning circuits. In the case
where only one sensing module is malfunctioning, users can simply
change it by unplugging the board and replacing it with a new
board. The actual module is shown in Figure 4.
Figure 2 Block diagram of the sensing module
Figure 3 Illustration of the sensing module
46 Elmy Johana Mohamad et al. / Jurnal Teknologi (Sciences & Engineering) 73:1 (2015), 43–50
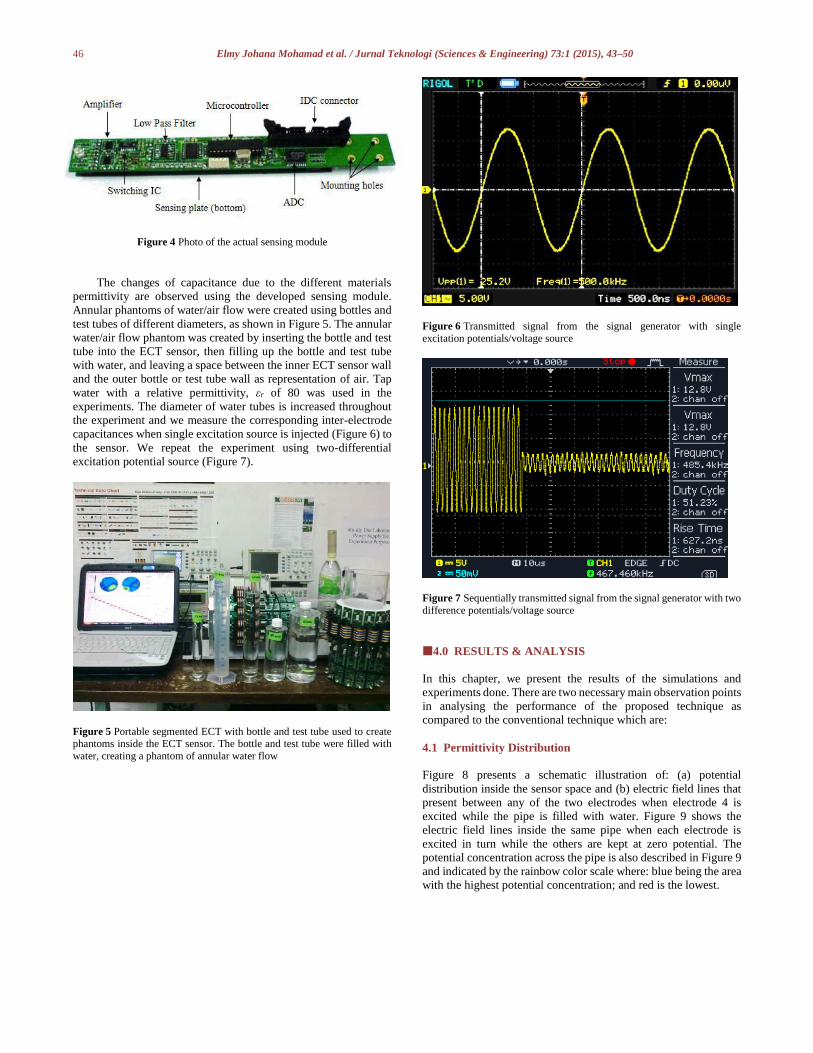
Figure 4 Photo of the actual sensing module
The changes of capacitance due to the different materials
permittivity are observed using the developed sensing module.
Annular phantoms of water/air flow were created using bottles and
test tubes of different diameters, as shown in Figure 5. The annular
water/air flow phantom was created by inserting the bottle and test
tube into the ECT sensor, then filling up the bottle and test tube
with water, and leaving a space between the inner ECT sensor wall
and the outer bottle or test tube wall as representation of air. Tap
water with a relative permittivity, εr of 80 was used in the
experiments. The diameter of water tubes is increased throughout
the experiment and we measure the corresponding inter-electrode
capacitances when single excitation source is injected (Figure 6) to
the sensor. We repeat the experiment using two-differential
excitation potential source (Figure 7).
Figure 5 Portable segmented ECT with bottle and test tube used to create phantoms inside the ECT sensor. The bottle and test tube were filled with
water, creating a phantom of annular water flow
Figure 6 Transmitted signal from the signal generator with single
excitation potentials/voltage source
Figure 7 Sequentially transmitted signal from the signal generator with two
difference potentials/voltage source
4.0 RESULTS & ANALYSIS
In this chapter, we present the results of the simulations and
experiments done. There are two necessary main observation points
in analysing the performance of the proposed technique as
compared to the conventional technique which are:
4.1 Permittivity Distribution
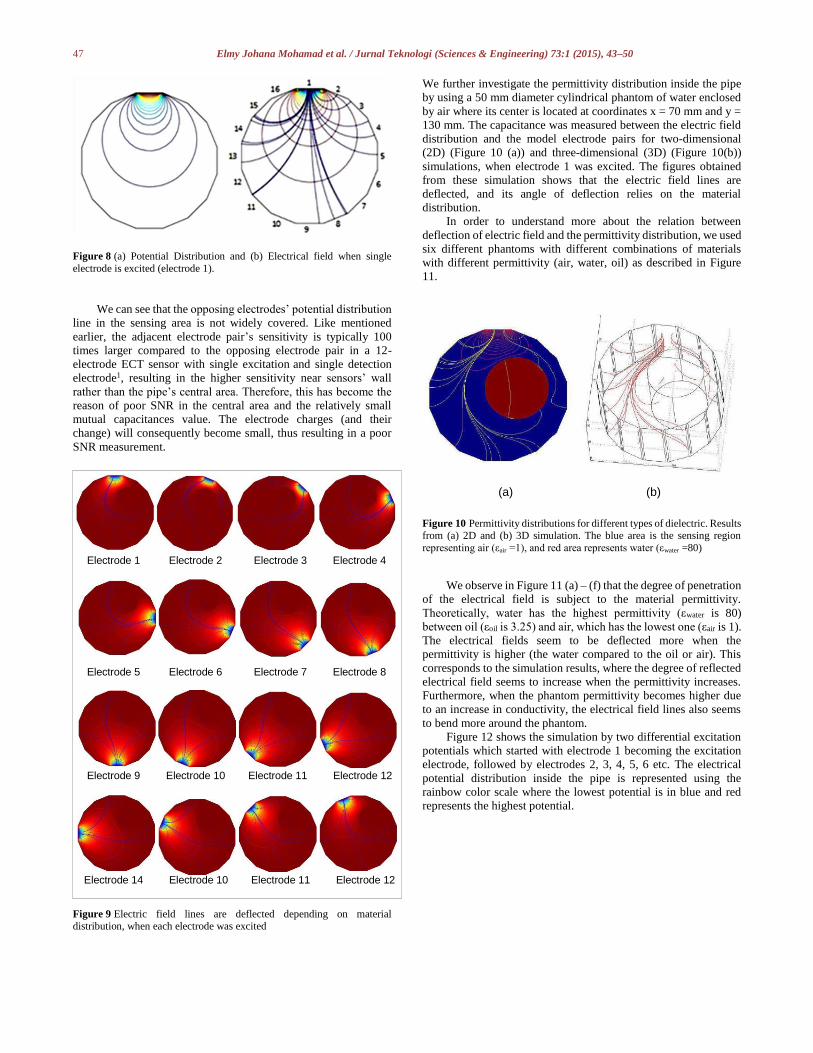
Figure 8 presents a schematic illustration of: (a) potential
distribution inside the sensor space and (b) electric field lines that
present between any of the two electrodes when electrode 4 is
excited while the pipe is filled with water. Figure 9 shows the
electric field lines inside the same pipe when each electrode is
excited in turn while the others are kept at zero potential. The
potential concentration across the pipe is also described in Figure 9
and indicated by the rainbow color scale where: blue being the area
with the highest potential concentration; and red is the lowest.
47 Elmy Johana Mohamad et al. / Jurnal Teknologi (Sciences & Engineering) 73:1 (2015), 43–50
Figure 8 (a) Potential Distribution and (b) Electrical field when single
electrode is excited (electrode 1).
We can see that the opposing electrodes’ potential distribution
line in the sensing area is not widely covered. Like mentioned
earlier, the adjacent electrode pair’s sensitivity is typically 100
times larger compared to the opposing electrode pair in a 12-
electrode ECT sensor with single excitation and single detection
electrode1, resulting in the higher sensitivity near sensors’ wall
rather than the pipe’s central area. Therefore, this has become the
reason of poor SNR in the central area and the relatively small
mutual capacitances value. The electrode charges (and their
change) will consequently become small, thus resulting in a poor
SNR measurement.
Figure 9 Electric field lines are deflected depending on material distribution, when each electrode was excited
We further investigate the permittivity distribution inside the pipe
by using a 50 mm diameter cylindrical phantom of water enclosed
by air where its center is located at coordinates x = 70 mm and y =
130 mm. The capacitance was measured between the electric field
distribution and the model electrode pairs for two-dimensional
(2D) (Figure 10 (a)) and three-dimensional (3D) (Figure 10(b))
simulations, when electrode 1 was excited. The figures obtained
from these simulation shows that the electric field lines are
deflected, and its angle of deflection relies on the material
distribution.
In order to understand more about the relation between
deflection of electric field and the permittivity distribution, we used
six different phantoms with different combinations of materials
with different permittivity (air, water, oil) as described in Figure
11.
Figure 10 Permittivity distributions for different types of dielectric. Results from (a) 2D and (b) 3D simulation. The blue area is the sensing region
representing air (εair =1), and red area represents water (εwater =80)
We observe in Figure 11 (a) – (f) that the degree of penetration
of the electrical field is subject to the material permittivity.
Theoretically, water has the highest permittivity (εwater is 80)
between oil (εoil is 3.25) and air, which has the lowest one (εair is 1).
The electrical fields seem to be deflected more when the
permittivity is higher (the water compared to the oil or air). This
corresponds to the simulation results, where the degree of reflected
electrical field seems to increase when the permittivity increases.
Furthermore, when the phantom permittivity becomes higher due
to an increase in conductivity, the electrical field lines also seems
to bend more around the phantom.
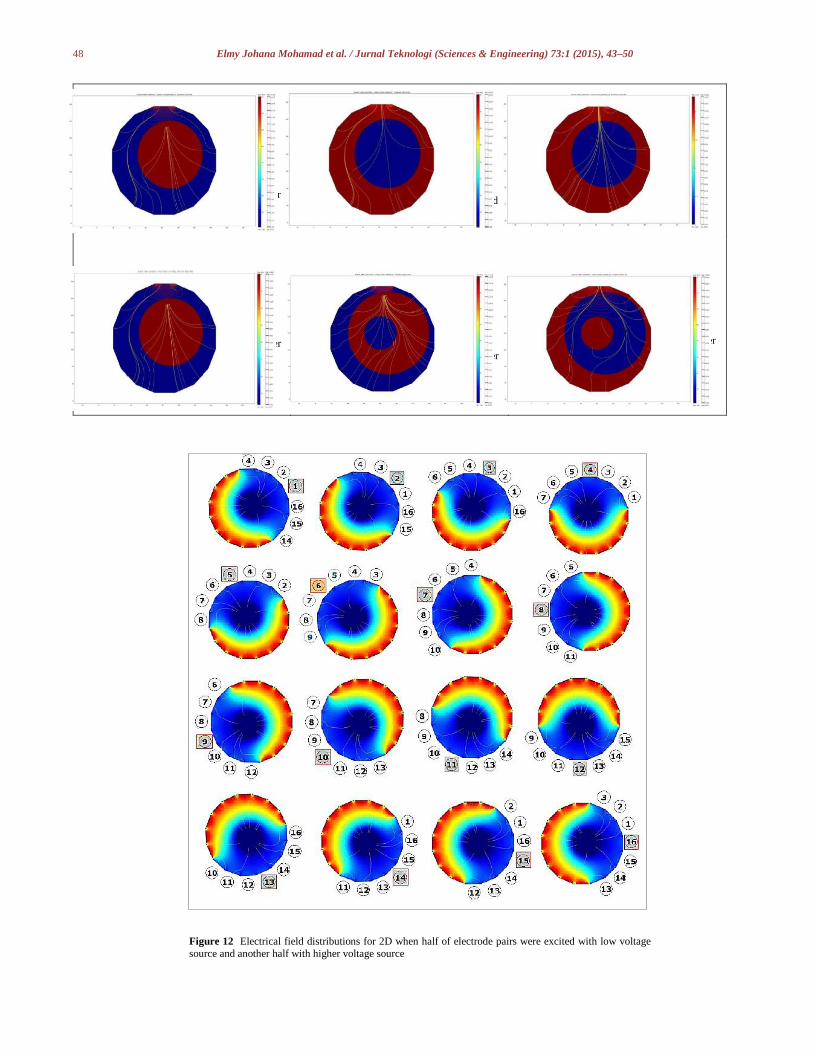
Figure 12 shows the simulation by two differential excitation
potentials which started with electrode 1 becoming the excitation
electrode, followed by electrodes 2, 3, 4, 5, 6 etc. The electrical
potential distribution inside the pipe is represented using the
rainbow color scale where the lowest potential is in blue and red
represents the highest potential.
Electrode 1 Electrode 2 Electrode 3 Electrode 4
Electrode 5 Electrode 6 Electrode 7 Electrode 8
Electrode 9 Electrode 10 Electrode 11 Electrode 12
Electrode 14 Electrode 10 Electrode 11 Electrode 12
(a) (b)
48 Elmy Johana Mohamad et al. / Jurnal Teknologi (Sciences & Engineering) 73:1 (2015), 43–50
(a) Electrical field lines of air (blue) and water
(red)
(b) Electrical field lines of water (red) and
air (blue)
(c) Electrical field lines of oil (red) and air (blue).
(d) Electrical field lines of oil (blue) and water
(red).
(e) Electrical field lines of air (blue) and water
(red)
(f) Electrical field lines of air (blue) and water
(red).
Figure 11 Permittivity distributions for different types of dielectric.
Figure 12 Electrical field distributions for 2D when half of electrode pairs were excited with low voltage
source and another half with higher voltage source
49 Elmy Johana Mohamad et al. / Jurnal Teknologi (Sciences & Engineering) 73:1 (2015), 43–50
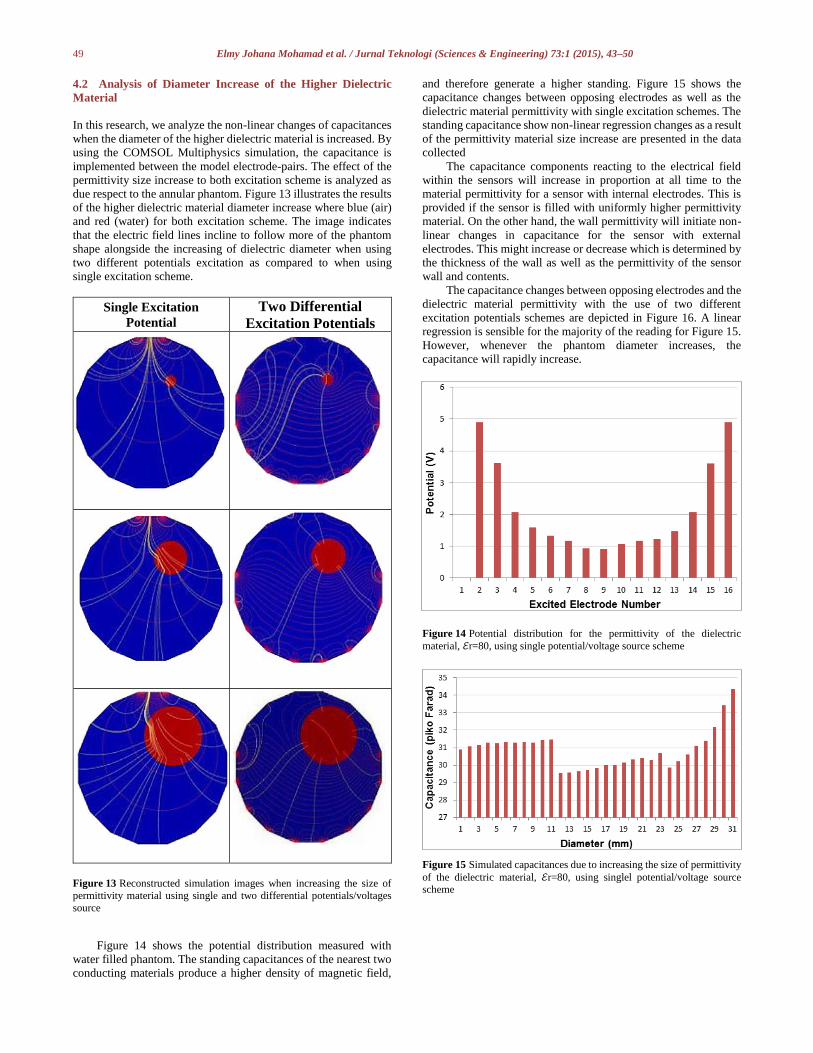
4.2 Analysis of Diameter Increase of the Higher Dielectric
Material
In this research, we analyze the non-linear changes of capacitances
when the diameter of the higher dielectric material is increased. By
using the COMSOL Multiphysics simulation, the capacitance is
implemented between the model electrode-pairs. The effect of the
permittivity size increase to both excitation scheme is analyzed as
due respect to the annular phantom. Figure 13 illustrates the results
of the higher dielectric material diameter increase where blue (air)
and red (water) for both excitation scheme. The image indicates
that the electric field lines incline to follow more of the phantom
shape alongside the increasing of dielectric diameter when using
two different potentials excitation as compared to when using
single excitation scheme.
Single Excitation
Potential
Two Differential
Excitation Potentials
Diameter = 5 mm
Diameter = 5 mm
Diameter = 15 mm
Diameter = 15 mm
Diameter = 25 mm
Diameter = 25 mm
Figure 13 Reconstructed simulation images when increasing the size of
permittivity material using single and two differential potentials/voltages
source
Figure 14 shows the potential distribution measured with
water filled phantom. The standing capacitances of the nearest two
conducting materials produce a higher density of magnetic field,
and therefore generate a higher standing. Figure 15 shows the
capacitance changes between opposing electrodes as well as the
dielectric material permittivity with single excitation schemes. The
standing capacitance show non-linear regression changes as a result
of the permittivity material size increase are presented in the data
collected
The capacitance components reacting to the electrical field
within the sensors will increase in proportion at all time to the
material permittivity for a sensor with internal electrodes. This is
provided if the sensor is filled with uniformly higher permittivity
material. On the other hand, the wall permittivity will initiate non-
linear changes in capacitance for the sensor with external
electrodes. This might increase or decrease which is determined by
the thickness of the wall as well as the permittivity of the sensor
wall and contents.
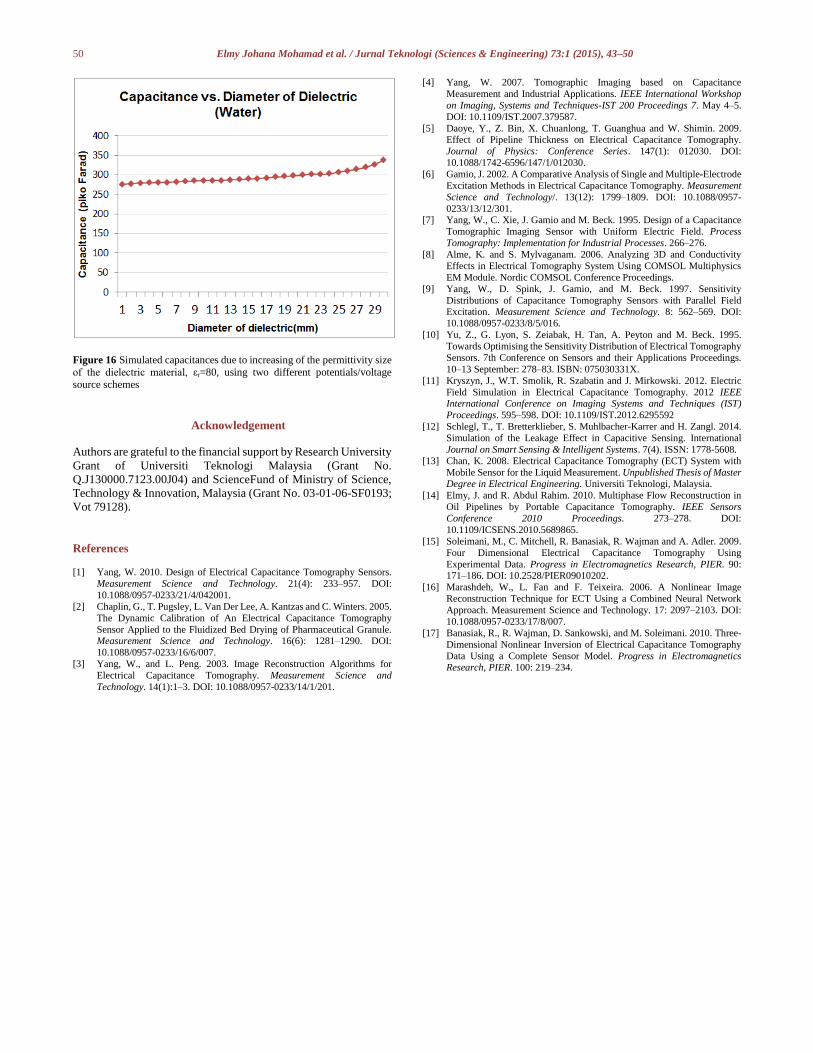
The capacitance changes between opposing electrodes and the
dielectric material permittivity with the use of two different
excitation potentials schemes are depicted in Figure 16. A linear
regression is sensible for the majority of the reading for Figure 15.
However, whenever the phantom diameter increases, the
capacitance will rapidly increase.
Figure 14 Potential distribution for the permittivity of the dielectric
material, ℰr=80, using single potential/voltage source scheme
Figure 15 Simulated capacitances due to increasing the size of permittivity
of the dielectric material, ℰr=80, using singlel potential/voltage source scheme
50 Elmy Johana Mohamad et al. / Jurnal Teknologi (Sciences & Engineering) 73:1 (2015), 43–50
Figure 16 Simulated capacitances due to increasing of the permittivity size
of the dielectric material, εr=80, using two different potentials/voltage
source schemes
Acknowledgement
Authors are grateful to the financial support by Research University
Grant of Universiti Teknologi Malaysia (Grant No.
Q.J130000.7123.00J04) and ScienceFund of Ministry of Science,
Technology & Innovation, Malaysia (Grant No. 03-01-06-SF0193;
Vot 79128).
References
[1] Yang, W. 2010. Design of Electrical Capacitance Tomography Sensors.
Measurement Science and Technology. 21(4): 233–957. DOI:
10.1088/0957-0233/21/4/042001.
[2] Chaplin, G., T. Pugsley, L. Van Der Lee, A. Kantzas and C. Winters. 2005.
The Dynamic Calibration of An Electrical Capacitance Tomography
Sensor Applied to the Fluidized Bed Drying of Pharmaceutical Granule. Measurement Science and Technology. 16(6): 1281–1290. DOI:
10.1088/0957-0233/16/6/007.
[3] Yang, W., and L. Peng. 2003. Image Reconstruction Algorithms for
Electrical Capacitance Tomography. Measurement Science and
Technology. 14(1):1–3. DOI: 10.1088/0957-0233/14/1/201.
[4] Yang, W. 2007. Tomographic Imaging based on Capacitance
Measurement and Industrial Applications. IEEE International Workshop
on Imaging, Systems and Techniques-IST 200 Proceedings 7. May 4–5.
DOI: 10.1109/IST.2007.379587.
[5] Daoye, Y., Z. Bin, X. Chuanlong, T. Guanghua and W. Shimin. 2009. Effect of Pipeline Thickness on Electrical Capacitance Tomography.
Journal of Physics: Conference Series. 147(1): 012030. DOI:
10.1088/1742-6596/147/1/012030.
[6] Gamio, J. 2002. A Comparative Analysis of Single and Multiple-Electrode
Excitation Methods in Electrical Capacitance Tomography. Measurement
Science and Technology/. 13(12): 1799–1809. DOI: 10.1088/0957-
0233/13/12/301. [7] Yang, W., C. Xie, J. Gamio and M. Beck. 1995. Design of a Capacitance
Tomographic Imaging Sensor with Uniform Electric Field. Process
Tomography: Implementation for Industrial Processes. 266–276.
[8] Alme, K. and S. Mylvaganam. 2006. Analyzing 3D and Conductivity
Effects in Electrical Tomography System Using COMSOL Multiphysics
EM Module. Nordic COMSOL Conference Proceedings.
[9] Yang, W., D. Spink, J. Gamio, and M. Beck. 1997. Sensitivity
Distributions of Capacitance Tomography Sensors with Parallel Field Excitation. Measurement Science and Technology. 8: 562–569. DOI:
10.1088/0957-0233/8/5/016.
[10] Yu, Z., G. Lyon, S. Zeiabak, H. Tan, A. Peyton and M. Beck. 1995.
Towards Optimising the Sensitivity Distribution of Electrical Tomography
Sensors. 7th Conference on Sensors and their Applications Proceedings.
10–13 September: 278–83. ISBN: 075030331X.
[11] Kryszyn, J., W.T. Smolik, R. Szabatin and J. Mirkowski. 2012. Electric
Field Simulation in Electrical Capacitance Tomography. 2012 IEEE International Conference on Imaging Systems and Techniques (IST)
Proceedings. 595–598. DOI: 10.1109/IST.2012.6295592
[12] Schlegl, T., T. Bretterklieber, S. Muhlbacher-Karrer and H. Zangl. 2014.
Simulation of the Leakage Effect in Capacitive Sensing. International
Journal on Smart Sensing & Intelligent Systems. 7(4). ISSN: 1778-5608.
[13] Chan, K. 2008. Electrical Capacitance Tomography (ECT) System with
Mobile Sensor for the Liquid Measurement. Unpublished Thesis of Master Degree in Electrical Engineering. Universiti Teknologi, Malaysia.
[14] Elmy, J. and R. Abdul Rahim. 2010. Multiphase Flow Reconstruction in
Oil Pipelines by Portable Capacitance Tomography. IEEE Sensors
Conference 2010 Proceedings. 273–278. DOI:
10.1109/ICSENS.2010.5689865.
[15] Soleimani, M., C. Mitchell, R. Banasiak, R. Wajman and A. Adler. 2009.
Four Dimensional Electrical Capacitance Tomography Using
Experimental Data. Progress in Electromagnetics Research, PIER. 90: 171–186. DOI: 10.2528/PIER09010202.
[16] Marashdeh, W., L. Fan and F. Teixeira. 2006. A Nonlinear Image
Reconstruction Technique for ECT Using a Combined Neural Network
Approach. Measurement Science and Technology. 17: 2097–2103. DOI:
10.1088/0957-0233/17/8/007.
[17] Banasiak, R., R. Wajman, D. Sankowski, and M. Soleimani. 2010. Three-
Dimensional Nonlinear Inversion of Electrical Capacitance Tomography
Data Using a Complete Sensor Model. Progress in Electromagnetics Research, PIER. 100: 219–234.