Embed Size (px)
Citation preview
Japan’s Achievement for Climate Changeafter the Great East Japan Earthquake
Takumi Ichikawa
Chief Official
Low-carbon Society Promotion OfficeGlobal Environment Bureau
Ministry of the Environment, Japan(MOE-J)
11 July 2018
1
0.0
0.5
1.0
1.5
2.0
2.5
3.0
3.5
4.0
4.5
0
100,000
200,000
300,000
400,000
500,000
600,000
19
75
19
77
19
79
19
81
19
83
19
85
19
87
19
89
19
91
19
93
19
95
19
97
19
99
20
01
20
03
20
05
20
07
20
09
20
11
20
13
20
15
(tCO2/百万円)(10億円)
(年度)
実質GDP
実質GDP当たりエネルギー起源CO2排出量
(tCO2/million yen)
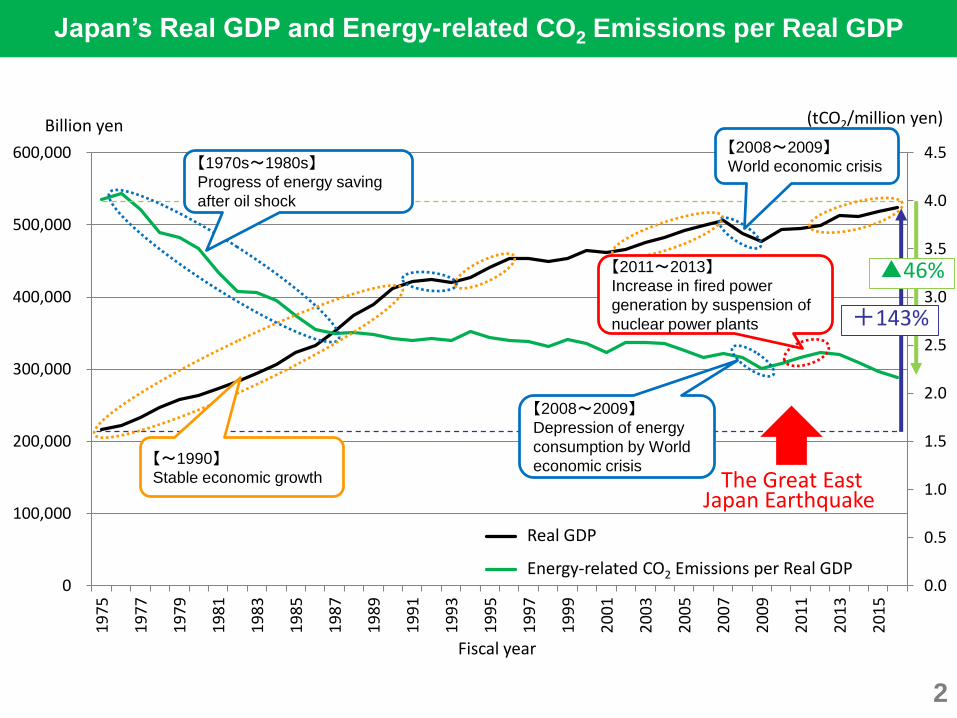
【2008~2009】World economic crisis
【~1990】Stable economic growth
【1970s~1980s】Progress of energy saving
after oil shock
【2008~2009】Depression of energy
consumption by World
economic crisis
【2011~2013】Increase in fired power
generation by suspension of
nuclear power plants
Japan’s Real GDP and Energy-related CO2 Emissions per Real GDP
The Great EastJapan Earthquake
+143%
▲46%
Real GDP
Energy-related CO2 Emissions per Real GDP
Fiscal year
Billion yen
2
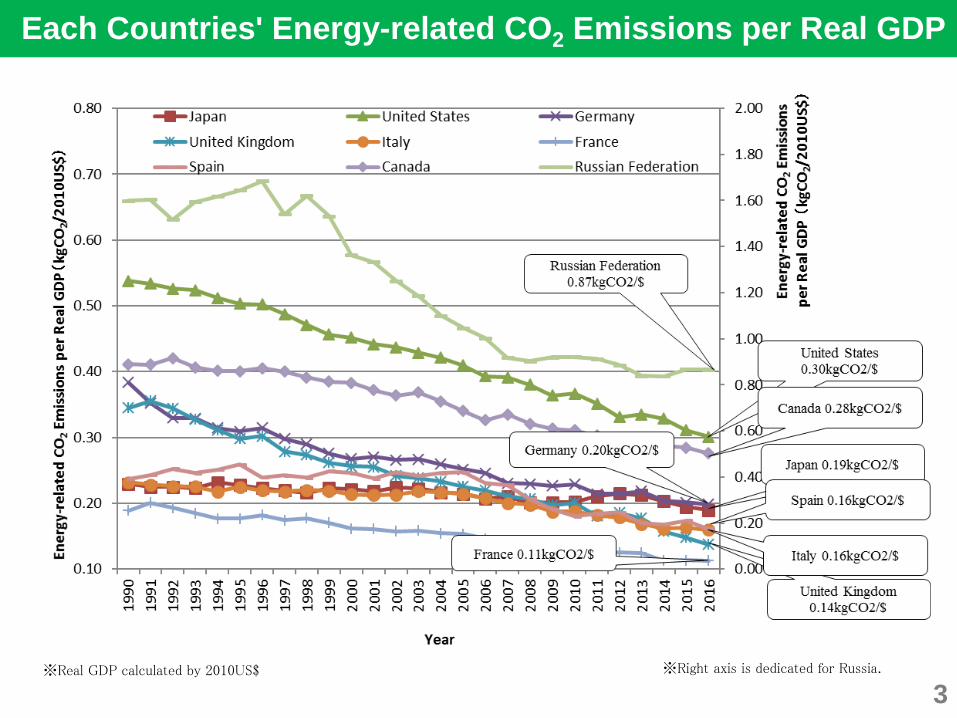
※Real GDP calculated by 2010US$ ※Right axis is dedicated for Russia.
Each Countries' Energy-related CO2 Emissions per Real GDP
3
1.3
1.0
1.1
1.2
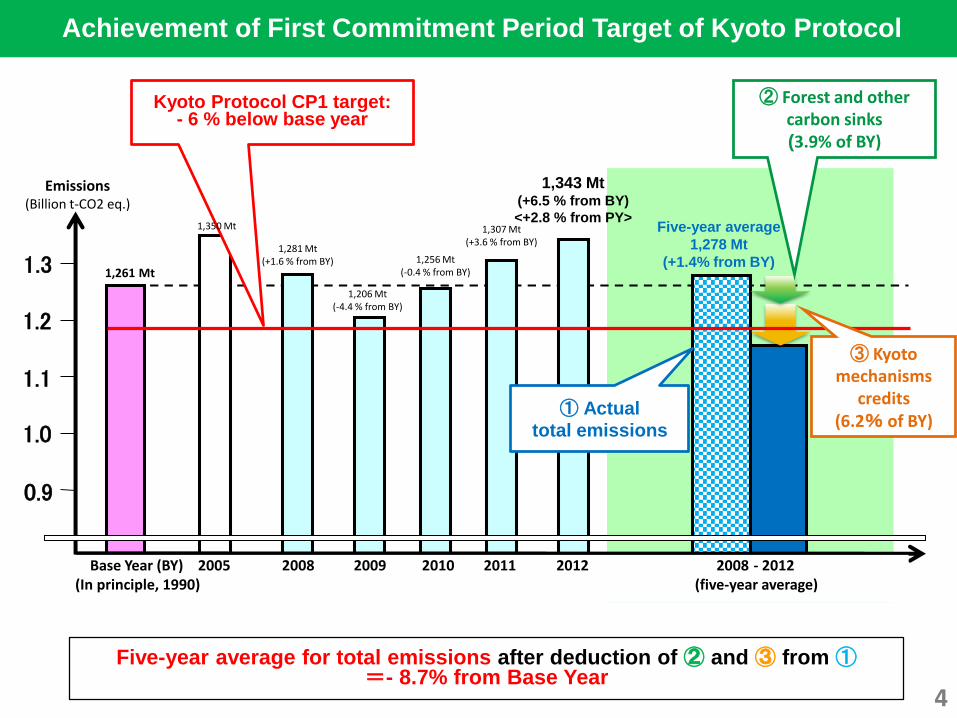
1,261 Mt
1,343 Mt(+6.5 % from BY)
<+2.8 % from PY>
1,256 Mt(-0.4 % from BY)
1,307 Mt(+3.6 % from BY)
2008~2012
5カ年平均
Five-year average
1,278 Mt
(+1.4% from BY)1,281 Mt
(+1.6 % from BY)
Kyoto Protocol CP1 target:- 6 % below base year
1,206 Mt(-4.4 % from BY)
1,350 Mt
③ Kyoto mechanisms
credits (6.2% of BY)
① Actual
total emissions
② Forest and other carbon sinks(3.9% of BY)
Emissions(Billion t-CO2 eq.)
0.9
Base Year (BY) 2005 2008 2009 2010 2011 2012 2008 - 2012(In principle, 1990) (five-year average)
Achievement of First Commitment Period Target of Kyoto Protocol
Five-year average for total emissions after deduction of ② and③ from ①=- 8.7% from Base Year
4
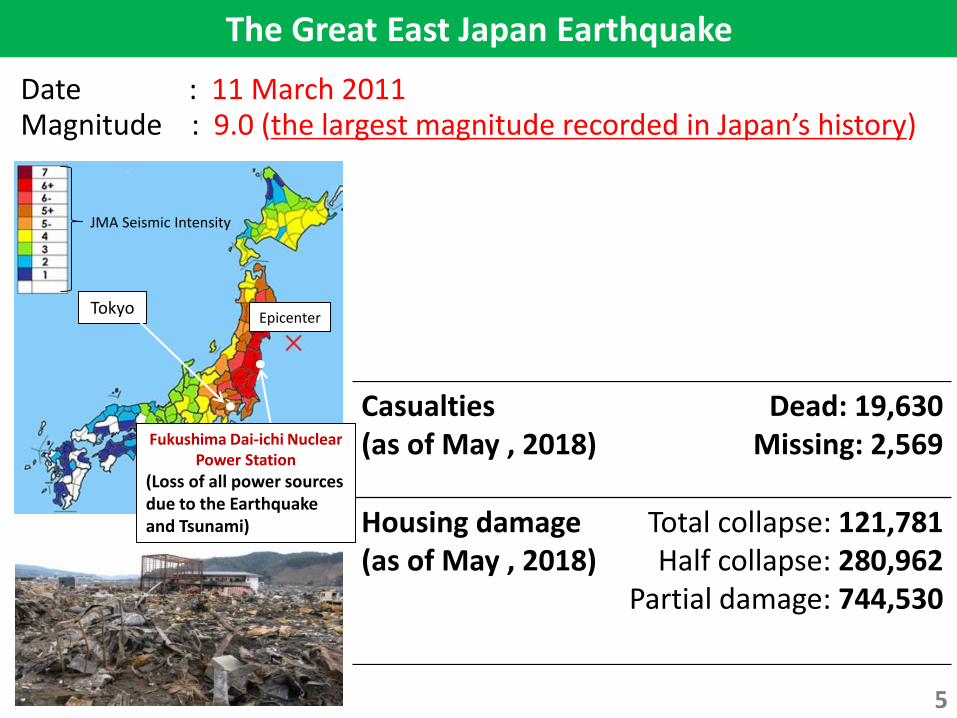
Date : 11 March 2011Magnitude : 9.0 (the largest magnitude recorded in Japan’s history)
Casualties(as of May , 2018)
Dead: 19,630Missing: 2,569
Housing damage(as of May , 2018)
Total collapse: 121,781Half collapse: 280,962
Partial damage: 744,530
JMA Seismic Intensity
Fukushima Dai-ichi Nuclear Power Station
(Loss of all power sources due to the Earthquake and Tsunami)
TokyoEpicenter
The Great East Japan Earthquake
5

All nuclear reactors (48 reactors) are suspended.
Trends in Electricity generation per sources
Change of National Circumstances after the Great East Japan Earthquake
Trends in GHG emission
【2011~2013】Increase by expansion of fossil fuel-fired power plants【2014】Decrease by progress with energy saving activities and renewable energy introduction 6
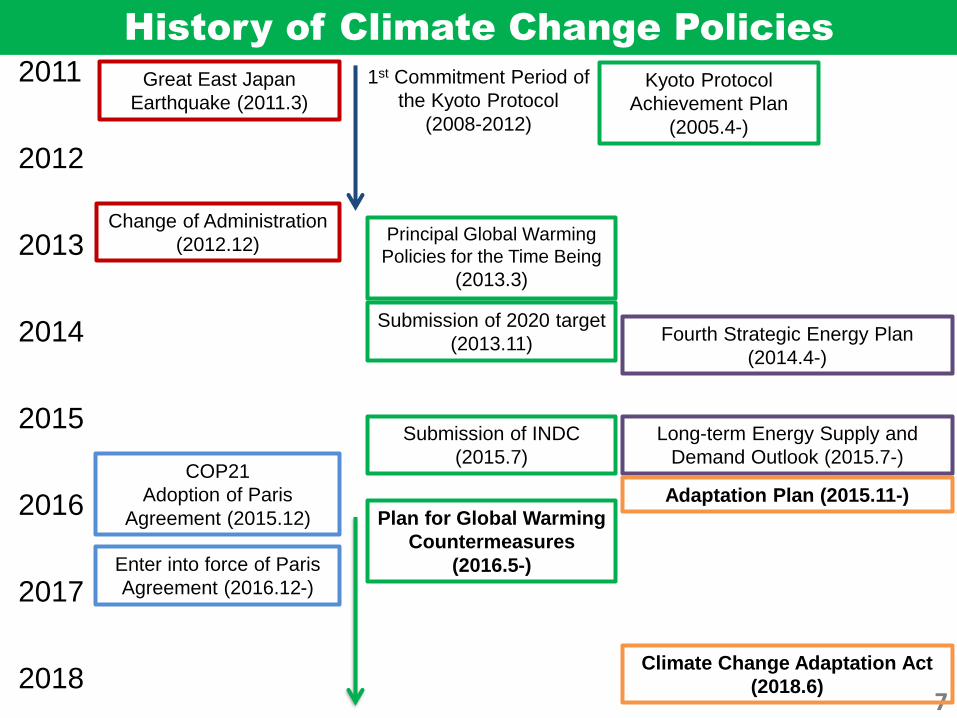
History of Climate Change Policies
2011
2012
2013
2014
2015
2016
2017
2018
Great East Japan
Earthquake (2011.3)
1st Commitment Period of
the Kyoto Protocol
(2008-2012)
Kyoto Protocol
Achievement Plan
(2005.4-)
Fourth Strategic Energy Plan
(2014.4-)
Plan for Global Warming
Countermeasures
(2016.5-)
7
COP21
Adoption of Paris
Agreement (2015.12)
Enter into force of Paris
Agreement (2016.12-)
Submission of INDC
(2015.7)
Long-term Energy Supply and
Demand Outlook (2015.7-)
Adaptation Plan (2015.11-)
Change of Administration
(2012.12)Principal Global Warming
Policies for the Time Being
(2013.3)
Submission of 2020 target
(2013.11)
Climate Change Adaptation Act
(2018.6)
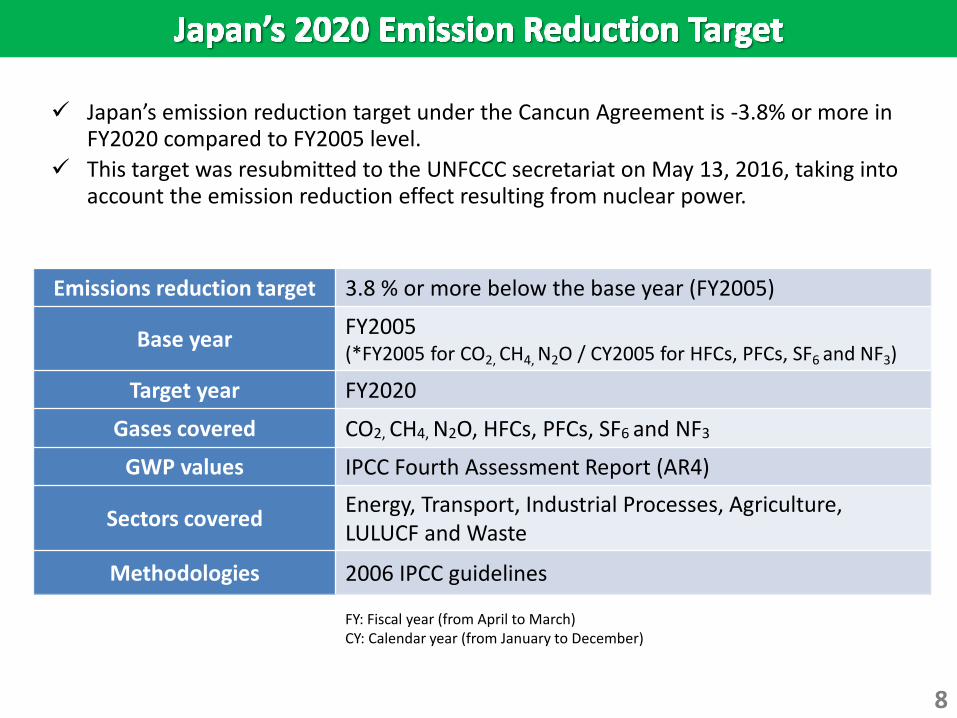
Emissions reduction target 3.8 % or more below the base year (FY2005)
Base yearFY2005(*FY2005 for CO2, CH4, N2O / CY2005 for HFCs, PFCs, SF6 and NF3)
Target year FY2020
Gases covered CO2, CH4, N2O, HFCs, PFCs, SF6 and NF3
GWP values IPCC Fourth Assessment Report (AR4)
Sectors coveredEnergy, Transport, Industrial Processes, Agriculture, LULUCF and Waste
Methodologies 2006 IPCC guidelines
✓ Japan’s emission reduction target under the Cancun Agreement is -3.8% or more in FY2020 compared to FY2005 level.
✓ This target was resubmitted to the UNFCCC secretariat on May 13, 2016, taking into account the emission reduction effect resulting from nuclear power.
FY: Fiscal year (from April to March)CY: Calendar year (from January to December)
8
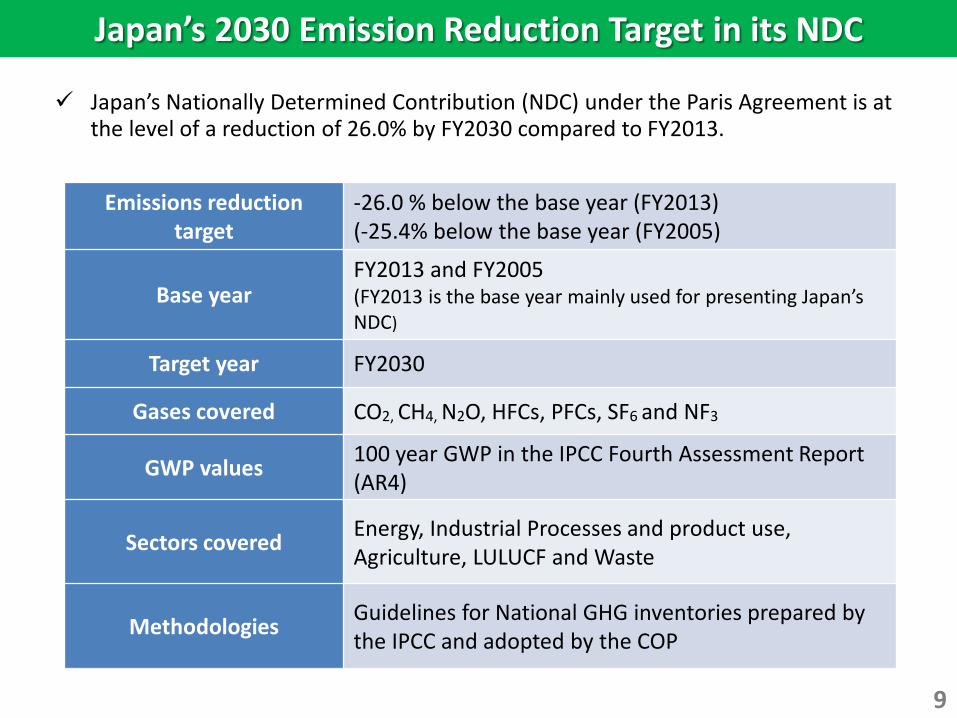
Japan’s 2030 Emission Reduction Target in its NDC
Emissions reduction target
-26.0 % below the base year (FY2013)(-25.4% below the base year (FY2005)
Base yearFY2013 and FY2005(FY2013 is the base year mainly used for presenting Japan’s NDC)
Target year FY2030
Gases covered CO2, CH4, N2O, HFCs, PFCs, SF6 and NF3
GWP values100 year GWP in the IPCC Fourth Assessment Report (AR4)
Sectors coveredEnergy, Industrial Processes and product use, Agriculture, LULUCF and Waste
MethodologiesGuidelines for National GHG inventories prepared by the IPCC and adopted by the COP
✓ Japan’s Nationally Determined Contribution (NDC) under the Paris Agreement is at the level of a reduction of 26.0% by FY2030 compared to FY2013.
9

(Total electricity generation)
1065 TWh
Energy Savings
196.1 TWh
(-17% compared to the case without savings)
Electricity
980.8
TWh
196.1
TWh
Electricity demand(Total electricity demand)
Breakdown of electricity generation(Total electricity generation)
1278 TWh
(Total electricity generation)
FY 2030 FY 2030FY 2013
Economic growth
1.7%/year
Electricity
966.6
TWh
Oil: 2%
Coal: 22%
LNG: 22%
Nuclear:
18-17%
Renewables:
19-20%
Energy savings:
17%
Renewables:
22-24%
Nuclear:
20-22%
LNG: 27%
Coal: 26%
Oil: 3%
Transmission
and distribution
losses
Hydropower:
8.8-9.2%
Solar: 7.0%
Wind: 1.7%
Biomass:
3.7-4.6%
Geothermal:
1.0-1.1%
(All figures in FY 2030 are approximate)
100% 100%
(Ref.) Composition of Electricity Generation Mix in FY2030
10
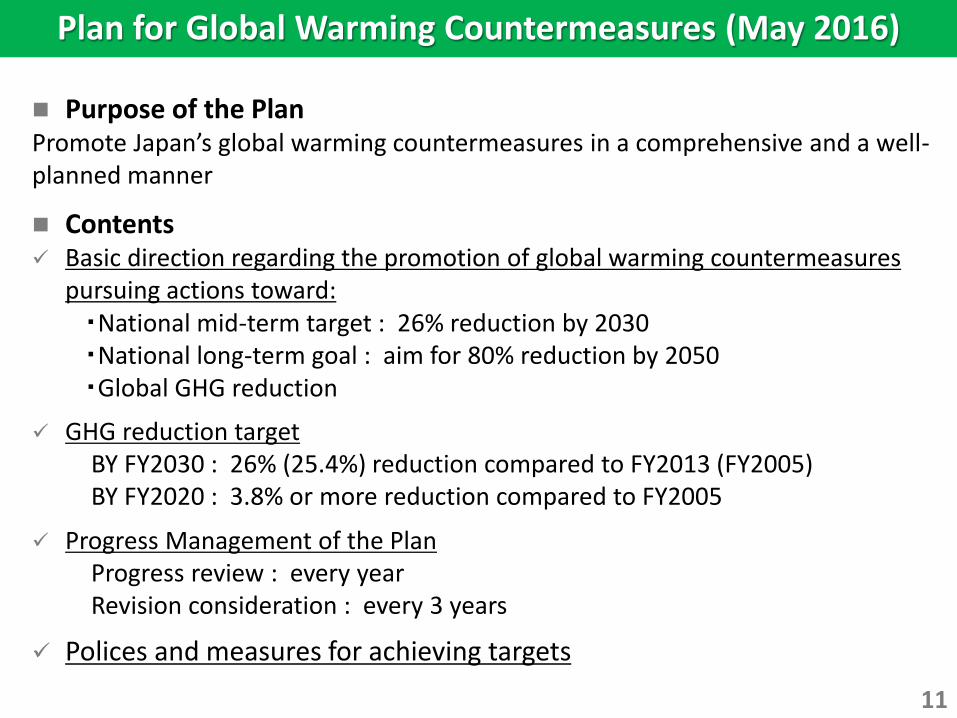
◼ Purpose of the PlanPromote Japan’s global warming countermeasures in a comprehensive and a well-planned manner
◼ Contents✓ Basic direction regarding the promotion of global warming countermeasures
pursuing actions toward:・National mid-term target : 26% reduction by 2030・National long-term goal : aim for 80% reduction by 2050・Global GHG reduction
✓ GHG reduction targetBY FY2030 : 26% (25.4%) reduction compared to FY2013 (FY2005)BY FY2020 : 3.8% or more reduction compared to FY2005
✓ Progress Management of the PlanProgress review : every yearRevision consideration : every 3 years
✓ Polices and measures for achieving targets
Plan for Global Warming Countermeasures (May 2016)
11
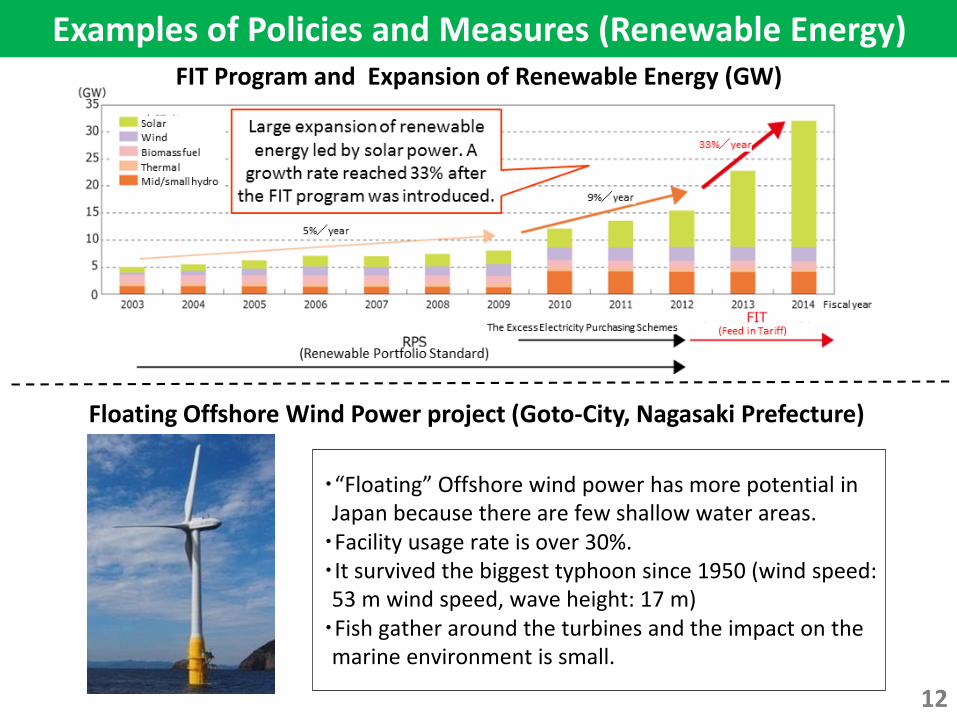
・“Floating” Offshore wind power has more potential in Japan because there are few shallow water areas.・Facility usage rate is over 30%.・It survived the biggest typhoon since 1950 (wind speed: 53 m wind speed, wave height: 17 m)・Fish gather around the turbines and the impact on themarine environment is small.
FIT Program and Expansion of Renewable Energy (GW)
Examples of Policies and Measures (Renewable Energy)
Floating Offshore Wind Power project (Goto-City, Nagasaki Prefecture)
12

(Ref.) Nuclear Power
Utilization Rate of Nuclear Power
◼ Utilizing nuclear power generation whose safety is confirmed
Fiscal year
Situation of Nuclear Reactors’ restart
13
Sendai Nuclear Power Plant Reactor No.1
Reactor No.2
Genkai Nuclear Power Plant Reactor No.3
※
Takahama Nuclear Power Plant Reactor No.3
Reactor No.4
Ikata Nuclear Power Plant Reactor No.3
Ohi Nuclear Power Plant Reactor No.3
Reactor No.4
※ Periodic inspection: 3.31~5.16
3.23Re-operation
2.26Re-operation
1.29Re-operation
1.29Injunction
3.9Injunction
12.16~2.26Periodic inspection
10.15Re-operation
4.23Periodic inspection
5.14~Periodic inspection
5.11Re-operation
5.17Re-operation
6.6Re-operation
10.3~Periodic inspection
8.12Re-operation
3.14Re-operation
Present
2018
10.6~12.8Periodic inspection
8.11Re-operation
1.29~Periodic inspection
Nuclear Power Plant 2015 2016 2017

Examples of Policies and Measures (Energy Saving①)
⚫ Mandatory compliance with energy efficiency standards for newly constructed residential housing and buildings gradually by 2020
⚫ Promotion of low-carbon buildings and acceleration of ZEB (Net Zero Energy Building)/ZEH (Net Zero Energy House). Achieve ZEB for the average of newly constructed buildings.
⚫ Proliferation of energy-saving household appliances and OA equipment by the top-achiever standard, etc.・Share of highly efficient LED and organic EL (possession base) is almost 100%・Introduction of water heaters for business use: 7% (2012) → 44%・Residential fuel cells: 55,000 units (2012) → 5.3 million units・Residential heat pump type water heaters: 4 million units (2012) → 14 million units・Introduction of HEMS (Home Energy Management System) in all households・Introduction of BEMS (Building Energy Management System) in about 50% of buildings
◆Perform thorough energy conservation countermeasures to reduce the energy demand by about 50.3 billion kL.
◆Realize extensive energy efficiency improvement (about 35%) equivalent to that after the oil crisis.
14
Examples of Policies and Measures (Energy Saving②)
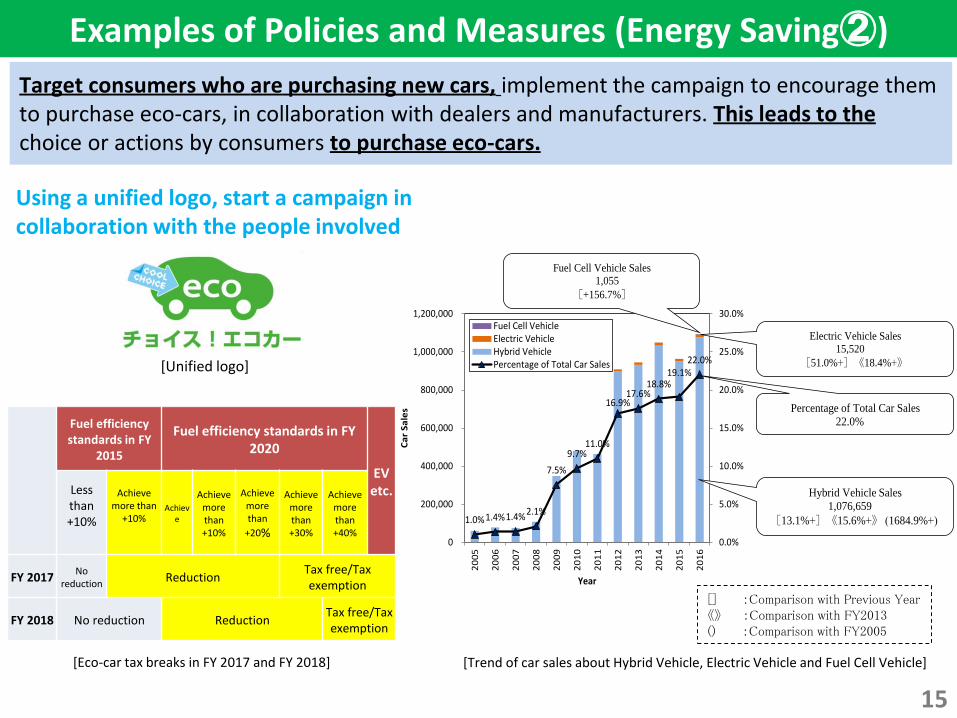
Target consumers who are purchasing new cars, implement the campaign to encourage them to purchase eco-cars, in collaboration with dealers and manufacturers. This leads to the choice or actions by consumers to purchase eco-cars.
[Eco-car tax breaks in FY 2017 and FY 2018]
Using a unified logo, start a campaign in collaboration with the people involved
[Unified logo]
15
1.0%1.4%1.4%2.1%
7.5%
9.7%11.0%
16.9%17.6%
18.8%19.1%
22.0%
0.0%
5.0%
10.0%
15.0%
20.0%
25.0%
30.0%
0
200,000
400,000
600,000
800,000
1,000,000
1,200,000
20
05
20
06
20
07
20
08
20
09
20
10
20
11
20
12
20
13
20
14
20
15
20
16
Ca
r S
ale
s
Year
Fuel Cell VehicleElectric VehicleHybrid VehiclePercentage of Total Car Sales
Fuel Cell Vehicle Sales
1,055
[+156.7%]
Electric Vehicle Sales
15,520
《+18.4%]》+51.0%[
Hybrid Vehicle Sales
1,076,659
+(1684.9% )《+15.6%]》+13.1%[
Percentage of Total Car Sales
22.0%
[] :Comparison with Previous Year《》 :Comparison with FY2013() :Comparison with FY2005
Fuel efficiency standards in FY
2015
Fuel efficiency standards in FY 2020
EVetc.Less
than +10%
Achieve more than
+10%Achiev
e
Achieve more than +10%
Achieve more than
+20%
Achieve more than +30%
Achieve more than +40%
FY 2017No
reductionReduction
Tax free/Tax exemption
FY 2018 No reduction ReductionTax free/Tax exemption
[Trend of car sales about Hybrid Vehicle, Electric Vehicle and Fuel Cell Vehicle]
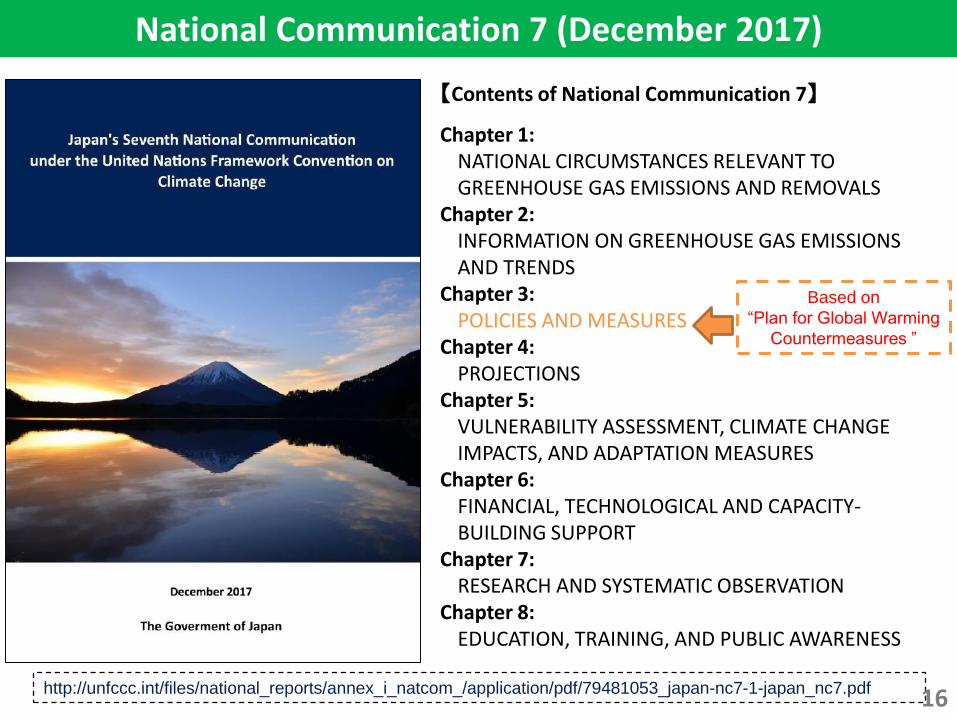
【Contents of National Communication 7】
Chapter 1: NATIONAL CIRCUMSTANCES RELEVANT TO GREENHOUSE GAS EMISSIONS AND REMOVALS
Chapter 2: INFORMATION ON GREENHOUSE GAS EMISSIONS AND TRENDS
Chapter 3: POLICIES AND MEASURES
Chapter 4: PROJECTIONS
Chapter 5: VULNERABILITY ASSESSMENT, CLIMATE CHANGE IMPACTS, AND ADAPTATION MEASURES
Chapter 6: FINANCIAL, TECHNOLOGICAL AND CAPACITY-BUILDING SUPPORT
Chapter 7:RESEARCH AND SYSTEMATIC OBSERVATION
Chapter 8:EDUCATION, TRAINING, AND PUBLIC AWARENESS
Based on
“Plan for Global Warming
Countermeasures ”
National Communication 7 (December 2017)
http://unfccc.int/files/national_reports/annex_i_natcom_/application/pdf/79481053_japan-nc7-1-japan_nc7.pdf 16
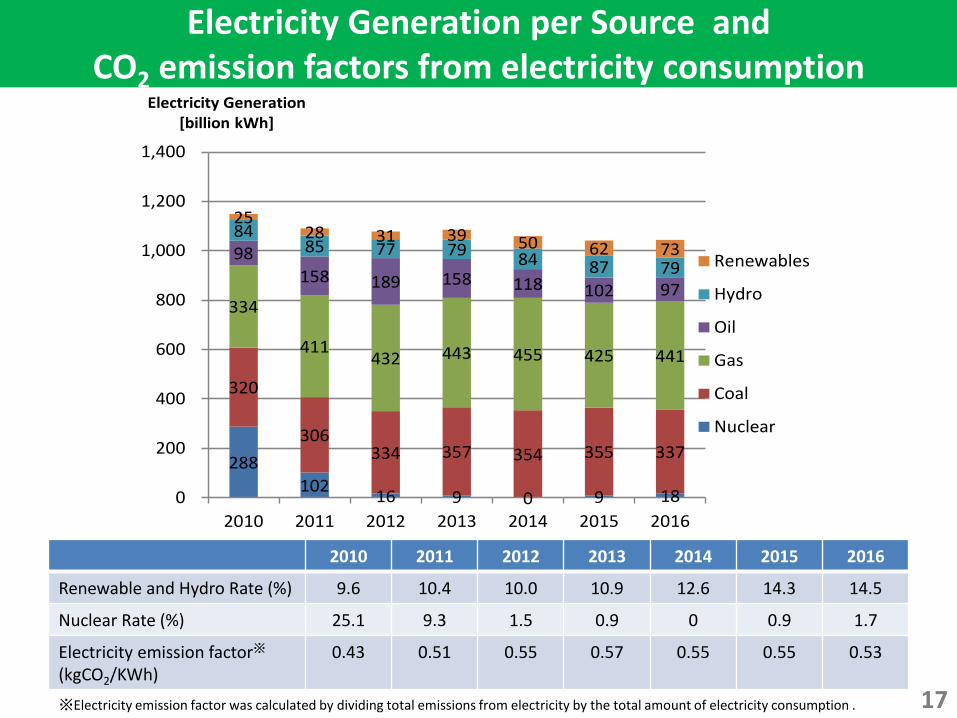
288
102 16 9 0 9 18
320
306 334 357 354 355 337
334
411 432 443 455 425 441
98
158 189 158 118 102 97
84 85 77 79
84 87 79
25 28 31 39 50 62 73
0
200
400
600
800
1,000
1,200
1,400
2010 2011 2012 2013 2014 2015 2016
Electricity Generation[billion kWh]
Renewables
Hydro
Oil
Gas
Coal
Nuclear
Electricity Generation per Source and CO2 emission factors from electricity consumption
2010 2011 2012 2013 2014 2015 2016
Renewable and Hydro Rate (%) 9.6 10.4 10.0 10.9 12.6 14.3 14.5
Nuclear Rate (%) 25.1 9.3 1.5 0.9 0 0.9 1.7
Electricity emission factor※
(kgCO2/KWh)0.43 0.51 0.55 0.57 0.55 0.55 0.53
17※Electricity emission factor was calculated by dividing total emissions from electricity by the total amount of electricity consumption .
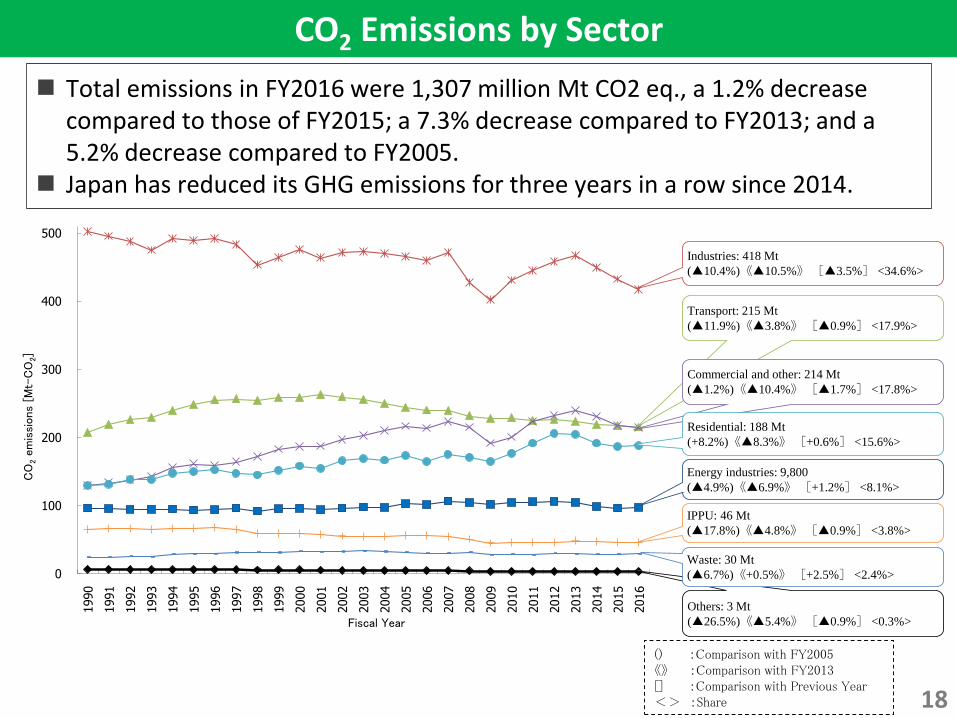
CO2 Emissions by Sector
() :Comparison with FY2005《》 :Comparison with FY2013[] :Comparison with Previous Year<> :Share 18
0
100
200
300
400
500
1990
1991
1992
1993
1994
1995
1996
1997
1998
1999
2000
2001
2002
2003
2004
2005
2006
2007
2008
2009
2010
2011
2012
2013
2014
2015
2016
CO
2em
issi
ons
[M
t-C
O2]
Fiscal Year
Others: 3 Mt
(▲26.5%)》▲5.4%《[▲0.9%] <0.3%>
Industries: 418 Mt
(▲10.4%)》▲10.5%《[▲3.5%] <34.6%>
Transport: 215 Mt
(▲11.9%)》▲3.8%《[▲0.9%] <17.9%>
Commercial and other: 214 Mt
(▲1.2%)》▲10.4%《[▲1.7%] <17.8%>
Residential: 188 Mt
(+8.2%)》▲8.3%《[+0.6%] <15.6%>
Energy industries: 9,800
(▲4.9%)》▲6.9%《[+1.2%] <8.1%>
Waste: 30 Mt
(▲6.7%)》+0.5%《[+2.5%] <2.4%>
IPPU: 46 Mt
(▲17.8%)》▲4.8%《[▲0.9%] <3.8%>
◼ Total emissions in FY2016 were 1,307 million Mt CO2 eq., a 1.2% decrease compared to those of FY2015; a 7.3% decrease compared to FY2013; and a 5.2% decrease compared to FY2005.
◼ Japan has reduced its GHG emissions for three years in a row since 2014.
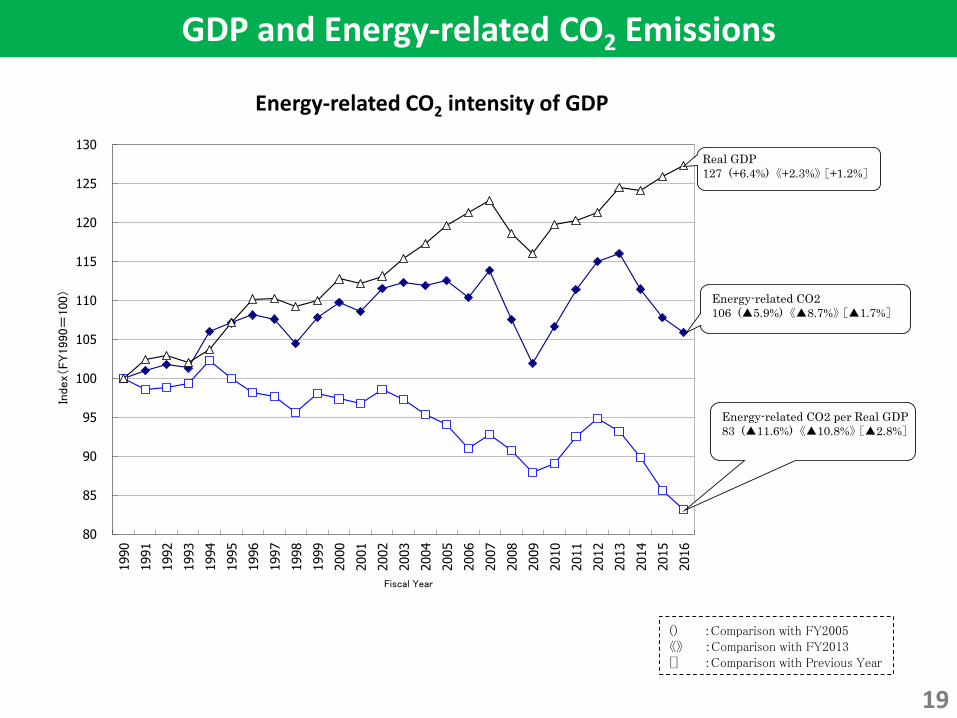
GDP and Energy-related CO2 Emissions
Energy-related CO2 intensity of GDP
19
80
85
90
95
100
105
110
115
120
125
130
1990
1991
1992
1993
1994
1995
1996
1997
1998
1999
2000
2001
2002
2003
2004
2005
2006
2007
2008
2009
2010
2011
2012
2013
2014
2015
2016
Index(
FY1990=
100)
Fiscal Year
Real GDP
127 (+6.4%) 《+2.3%》 [+1.2%]
Energy-related CO2
106 (▲5.9%) 《▲8.7%》 [▲1.7%]
Energy-related CO2 per Real GDP
83 (▲11.6%) 《▲10.8%》 [▲2.8%]
() :Comparison with FY2005《》 :Comparison with FY2013[] :Comparison with Previous Year

HFCs Emissions
20
() :Comparison with FY2005《》 :Comparison with FY2013[] :Comparison with Previous Year<> :Share
HFCs emissions 42,500 kt CO2 eq.(+232.6%)≪+32.5%≫[+8.3%]
0
5,000
10,000
15,000
20,000
25,000
30,000
35,000
40,000
45,000
1990
1991
1992
1993
1994
1995
1996
1997
1998
1999
2000
2001
2002
2003
2004
2005
2006
2007
2008
2009
2010
2011
2012
2013
2014
2015
2016
HFC
s em
issi
ons
[ki
lo t
onn
es C
O2
eq.]
Year
Fluorochemical production (By-product Emissions) 20kt
(▲96.0%)》+45.5%《[▲20.0%] <0.1%>
Refrigeration and air conditioning 38,900kt
(+338.3%)》+34.1%《[+8.4%] <91.5%>
Aerosols 600kt
(▲67.2%)》+13.5%《[+2.8%] <1.3%>
Semiconductors and Liquid crystals 100kt
(▲47.4%)》+6.9%《[+3.7%] <0.3%>
Fluorochemical production (Fugitive Emissions) 100kt
(▲66.9%)》+13.3%《[+79.1%] <0.3%>
Solvents 100kt
(+2879.5%)》+8.1%《[▲1.1%] <0.3%>
Foam blowing agents 2,700kt
(+182.8%)》+18.9%《[+6.7%] <6.2%>
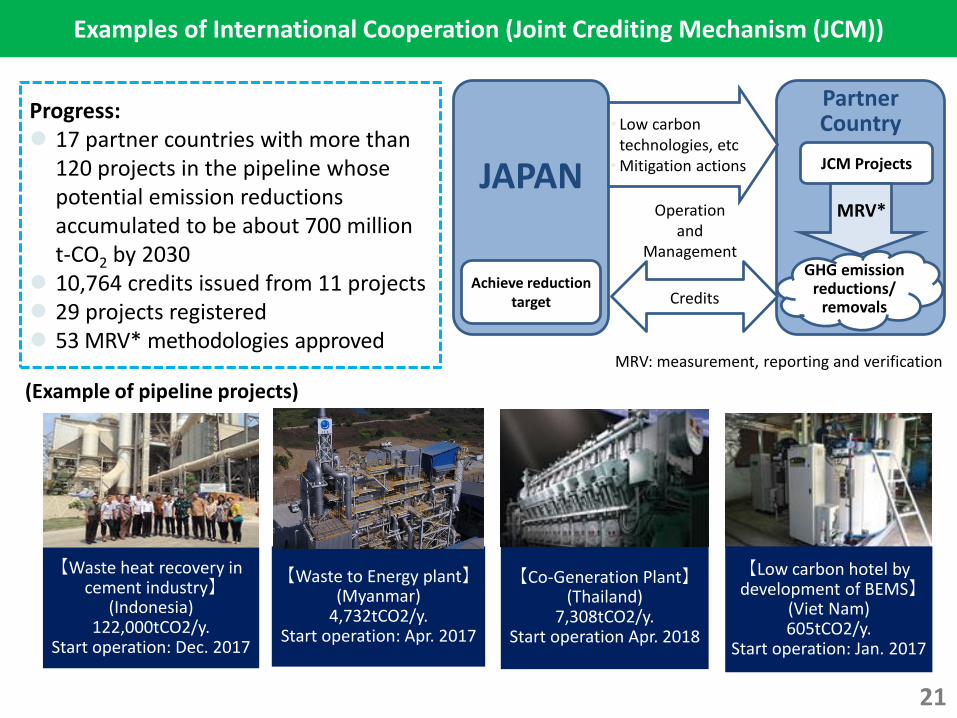
(Example of pipeline projects)
Progress:⚫ 17 partner countries with more than
120 projects in the pipeline whose potential emission reductions accumulated to be about 700 million t-CO2 by 2030
⚫ 10,764 credits issued from 11 projects⚫ 29 projects registered⚫ 53 MRV* methodologies approved
MRV: measurement, reporting and verification
【Waste heat recovery in cement industry】
(Indonesia)122,000tCO2/y.
Start operation: Dec. 2017
【Co-Generation Plant】(Thailand)
7,308tCO2/y. Start operation Apr. 2018
【Low carbon hotel by development of BEMS】
(Viet Nam)605tCO2/y.
Start operation: Jan. 2017
JAPAN
Partner Country• Low carbon
technologies, etc• Mitigation actions JCM Projects
GHG emission reductions/
removals
Achieve reduction target Credits
Operationand
Management
MRV*
【Waste to Energy plant】(Myanmar)
4,732tCO2/y. Start operation: Apr. 2017
Examples of International Cooperation (Joint Crediting Mechanism (JCM))
21

Summary
22
◼ Japan had addressed GHG emission reduction and energy saving, such as the dramatic progress of energy saving after oil shock and the achievement of first commitment period target of Kyoto Protocol.
◼ However, the Great East Japan Earthquake occurred in 2011 brought down the change of our energy structure, in addition to the enormous damage.
◼ After the earthquake, we decided the Plan for Global Warming Countermeasures to achieve our mid-term target of a reduction of 26.0% by FY2030 compared to FY2013.
◼ Based on the plan, we are proceeding the various measures, and has reduced our GHG emissions for three years in a row since 2014.
◼ Including the measure for HFCs, we continue to make further efforts by reducing GHG emissions both at home and abroad.

Thank you
23

![Kyoto Protocol Durban Preparation[1]](https://img.pdfslide.us/doc/110x75/577d24821a28ab4e1e9c9bda/kyoto-protocol-durban-preparation1.jpg)