Embed Size (px)
Citation preview

WELSPUN CORPPIPES AND PLATES
WCL /SE~2019
To,
June 26, 2019
BSE Ltd. National Stock Exchange of India Ltd.Listing Department, Exchange Plaza,P. J. Towers, Dalal Street, Bandra-Kurla Complex,Mumbai —400 001. Bandra (E), Mumbai —400051.
(Scrip Code-532144) (Symbol: WELCORP, Series EQ)
Dear Sirs/ Madam,
Subject: Intimation to Schedule Analyst / Institutional Investor meetings under theSEBI (Listing Obligations and Disclosure Requirements), Regulations, 2015.
DateThursday, June 27, 2019
Friday, June 28, 2019
PlaceHong KongSingapore
Please find enclosed the copy of the presentation, which would be used in the NDR. Thesame is also available on the website of the Company on www.welspuncorp.com.
Kindly note that changes mayCompany.
Thanking you.For Welspun Corp Limited
Pradeep JoshiCompany SecretaryFCS-4959
happen due to exigencies on the part of the Host /
Welspun Corp Urn tedWeispun House. 5th Floor, Kamala City, Senapati Bapat Marg. Lower Parel (West). Mumbai 400 013, India.7: +91 22 6613 6000 / 2490 8000 F: +91 22 2490 8020E-mail : companysecretary_wcI~welspun,com Website: www.welspuncorp.com
Registered Address: Welspun City. Village Versamedi, Taluka Arijar, District Kutch. Gujarat 370 110, India.T: +91 2836 662222 F: +91 2836 279060
Corporate Identity Number: L27100GJ1995PLC025609
In complianceRequirements)participating in
with Regulation 30(6) of SEBI (Listing Obligations and DisclosureRegulations, 2015, we hereby inform that the Company will bea non-deal roadshow (NDR), details of which is as under:
Organised byAntique Broking LtdAntique Broking Ltd I
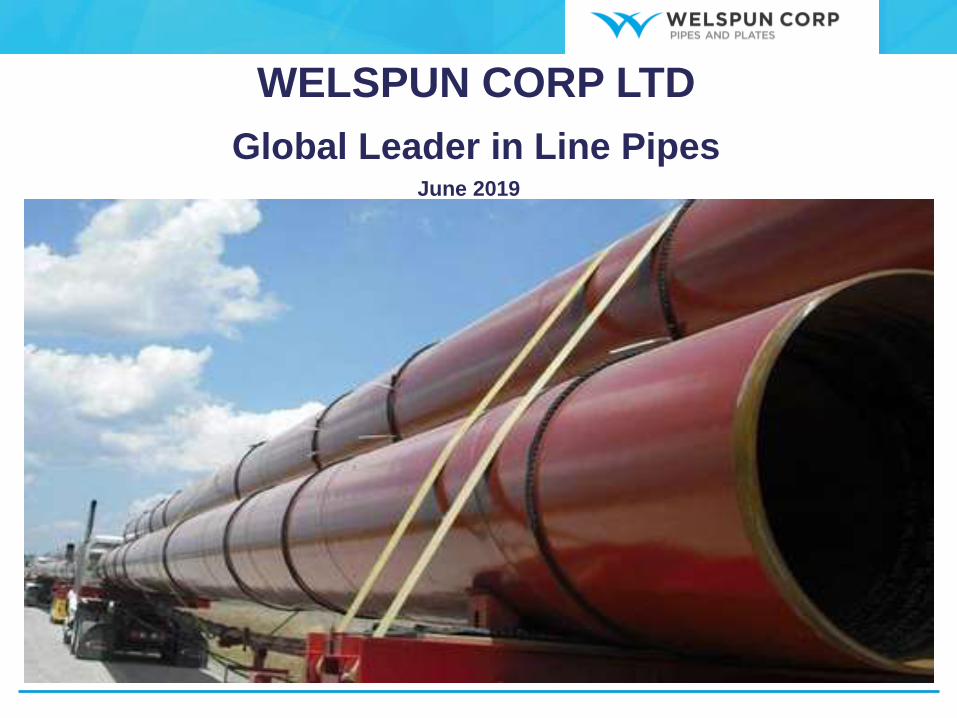
WELSPUN CORP LTD
Global Leader in Line PipesJune 2019
This presentation and the accompanying slides (the “Presentation”), which have been prepared by Welspun CorpLimited (the “Company”), have been prepared solely for information purposes and do not constitute any offer,recommendation or invitation to purchase or subscribe for any securities, and shall not form the basis or be relied on inconnection with any contract or binding commitment whatsoever. No offering of securities of the Company will be madeexcept by means of a statutory offering document containing detailed information about the Company.
This Presentation has been prepared by the Company based on information and data which the Company considersreliable, but the Company makes no representation or warranty, express or implied, whatsoever, and no reliance shallbe placed on, the truth, accuracy, completeness, fairness and reasonableness of the contents of this Presentation. ThisPresentation may not be all inclusive and may not contain all of the information that you may consider material. Anyliability in respect of the contents of, or any omission from, this Presentation is expressly excluded.
This presentation contains certain forward looking statements concerning the Company’s future business prospects andbusiness profitability, which are subject to a number of risks and uncertainties and the actual results could materiallydiffer from those in such forward looking statements. The risks and uncertainties relating to these statements include,but are not limited to, risks and uncertainties regarding fluctuations in earnings, our ability to manage growth,competition (both domestic and international), economic growth in India and abroad, ability to attract and retain highlyskilled professionals, time and cost over runs on contracts, our ability to manage our international operations,government policies and actions regulations, interest and other fiscal costs generally prevailing in the economy. Thecompany does not undertake to make any announcement in case any of these forward looking statements becomematerially incorrect in future or update any forward looking statements made from time to time by or on behalf of theCompany.
DISCLAIMER
2
3
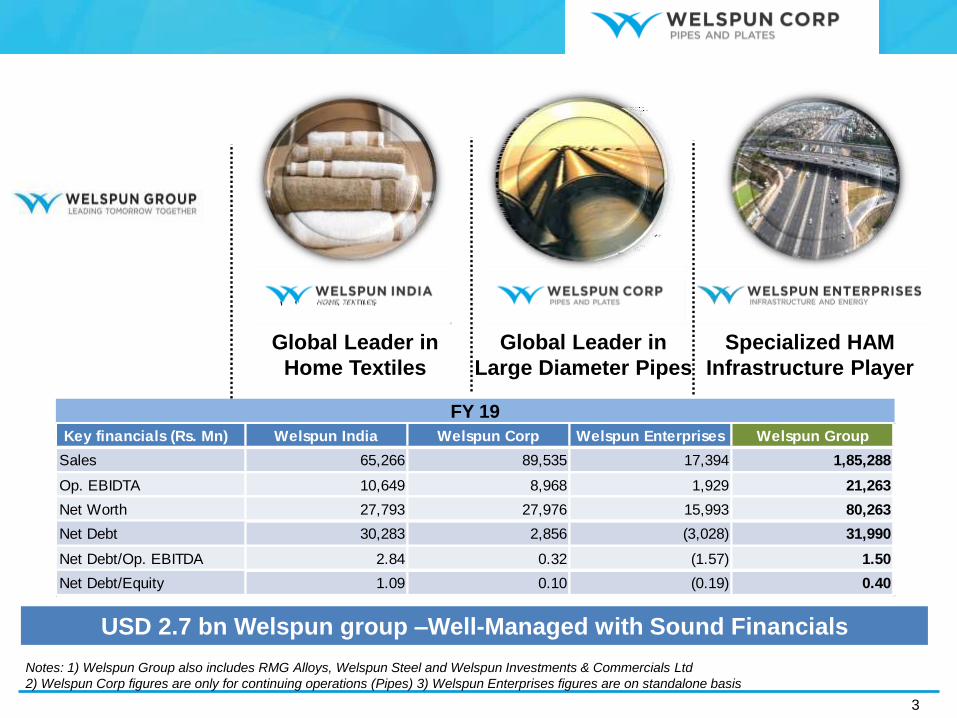
FY 19
Global Leader in
Large Diameter Pipes
Global Leader in
Home Textiles
Specialized HAM
Infrastructure Player
Key financials (Rs. Mn) Welspun India Welspun Corp Welspun Enterprises Welspun Group
Sales 65,266 89,535 17,394 1,85,288
Op. EBIDTA 10,649 8,968 1,929 21,263
Net Worth 27,793 27,976 15,993 80,263
Net Debt 30,283 2,856 (3,028) 31,990
Net Debt/Op. EBITDA 2.84 0.32 (1.57) 1.50
Net Debt/Equity 1.09 0.10 (0.19) 0.40
USD 2.7 bn Welspun group –Well-Managed with Sound Financials
Notes: 1) Welspun Group also includes RMG Alloys, Welspun Steel and Welspun Investments & Commercials Ltd
2) Welspun Corp figures are only for continuing operations (Pipes) 3) Welspun Enterprises figures are on standalone basis
4
• Professionally Managed Companies; No Cross Holdings Intra-Group
• Independent Board Structure with professional / independent Directors
• Big-4 auditors in most of the group companies ( PwC in WCL)
• Ring fenced financing in each company
• No corporate guarantee issued between businesses
• No cash flow transfer between the companies
• Pre-decided hedging policies across companies
• No shares of Promoters are pledged and no personal guarantees extended by them.
• All group companies have credit rating “AA” family (WCL is AA-)
WELSPUN GROUP PROFILE
Robust Corporate Governance Practices
5
FIN
AN
CIA
L S
TR
EN
GT
HO
PE
RA
TIO
NA
L E
XC
EL
LE
NC
E
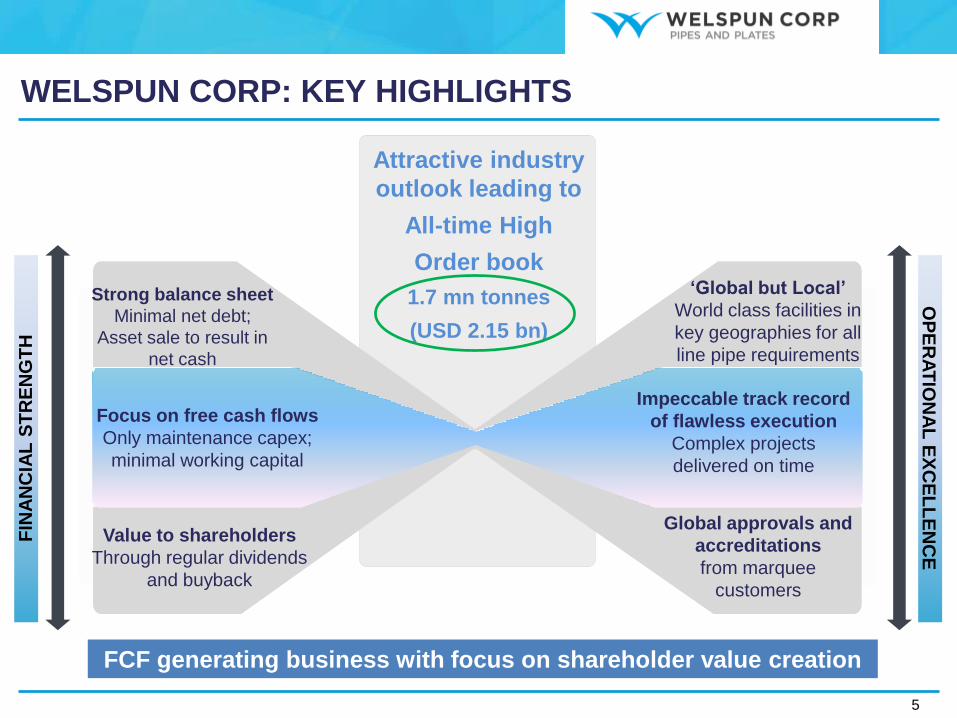
Attractive industry
outlook leading to
All-time High
Order book
1.7 mn tonnes
(USD 2.15 bn)
Impeccable track record
of flawless execution
Complex projects
delivered on time
Global approvals and
accreditations
from marquee
customers
Strong balance sheet
Minimal net debt;
Asset sale to result in
net cash
Focus on free cash flows
Only maintenance capex;
minimal working capital
‘Global but Local’
World class facilities in
key geographies for all
line pipe requirements
FCF generating business with focus on shareholder value creation
WELSPUN CORP: KEY HIGHLIGHTS
Value to shareholders
Through regular dividends
and buyback
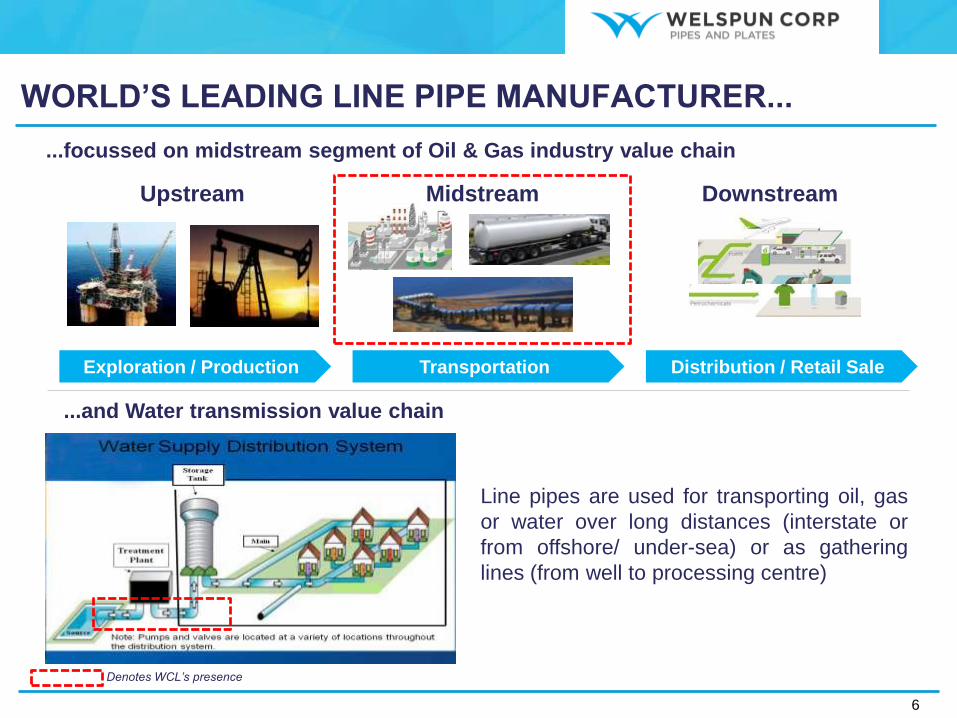
...focussed on midstream segment of Oil & Gas industry value chain
Exploration / Production
Upstream Midstream Downstream
...and Water transmission value chain
Transportation
Denotes WCL’s presence
Line pipes are used for transporting oil, gas
or water over long distances (interstate or
from offshore/ under-sea) or as gathering
lines (from well to processing centre)
WORLD’S LEADING LINE PIPE MANUFACTURER...
6
Distribution / Retail Sale
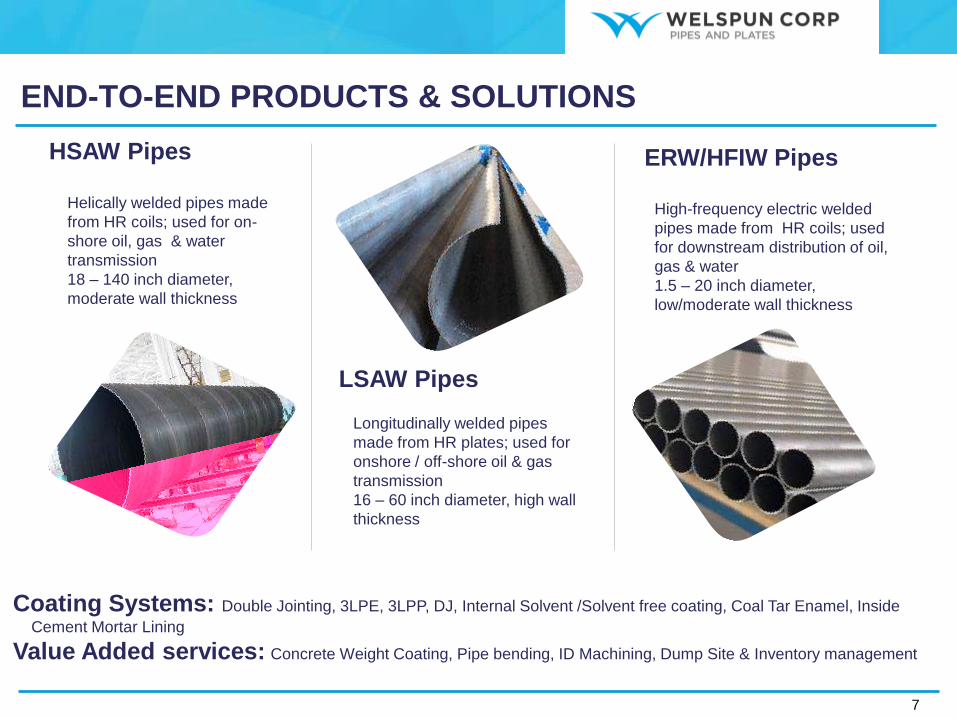
Longitudinally welded pipes
made from HR plates; used for
onshore / off-shore oil & gas
transmission
16 – 60 inch diameter, high wall
thickness
LSAW Pipes
Helically welded pipes made
from HR coils; used for on-
shore oil, gas & water
transmission
18 – 140 inch diameter,
moderate wall thickness
HSAW Pipes
High-frequency electric welded
pipes made from HR coils; used
for downstream distribution of oil,
gas & water
1.5 – 20 inch diameter,
low/moderate wall thickness
ERW/HFIW Pipes
Coating Systems: Double Jointing, 3LPE, 3LPP, DJ, Internal Solvent /Solvent free coating, Coal Tar Enamel, Inside
Cement Mortar Lining
Value Added services: Concrete Weight Coating, Pipe bending, ID Machining, Dump Site & Inventory management
END-TO-END PRODUCTS & SOLUTIONS
7

Plant Locations
● Anjar, India
● Dahej, India
● Mandya, India
● Bhopal, India
● Little Rock, USA
● Dammam, Saudi Arabia
Marketing Offices
● Mumbai, India
● Houston, USA
● Dammam, Saudi Arabia
Czech
Rep.
CanadaUSAMexicoBahamasTrinidad & TobagoVenezuelaColombiaPeruBoliviaSpainRussiaChinaBangladeshMalaysiaIndonesiaThailandIraqQatarSaudiOman
SudanEgyptAlgeriaNigeriaUAEAMERICASMENASOUTH EAST ASIA AND AUSTRALIAEUROPE & CISDOMESTICCountries ServicedManufacturing Plants ArgentinaDIVERSIFIED GLOBAL PRESENCE8India
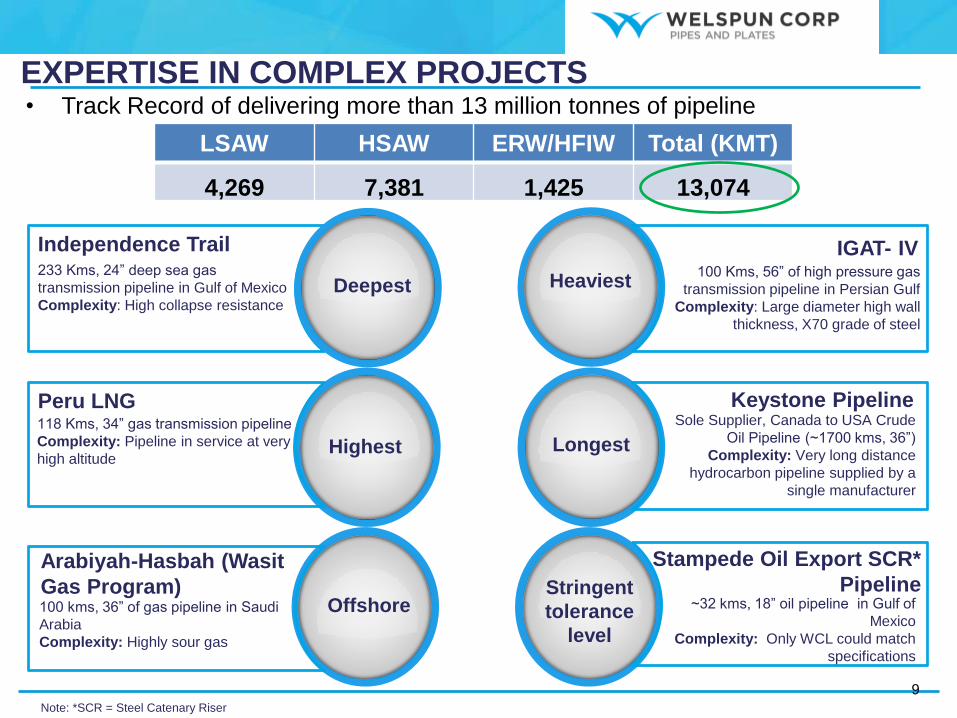
118 Kms, 34” gas transmission pipeline
Complexity: Pipeline in service at very
high altitude
Peru LNG
Highest
Sole Supplier, Canada to USA Crude
Oil Pipeline (~1700 kms, 36”)
Complexity: Very long distance
hydrocarbon pipeline supplied by a
single manufacturer
Keystone Pipeline
Longest
~32 kms, 18” oil pipeline in Gulf of
Mexico
Complexity: Only WCL could match
specifications
Stampede Oil Export SCR*
PipelineStringent
tolerance
level
100 kms, 36” of gas pipeline in Saudi
Arabia
Complexity: Highly sour gas
Arabiyah-Hasbah (Wasit
Gas Program)Offshore
Independence Trail
Deepest100 Kms, 56” of high pressure gas
transmission pipeline in Persian Gulf
Complexity: Large diameter high wall
thickness, X70 grade of steel
IGAT- IV
Heaviest233 Kms, 24” deep sea gas
transmission pipeline in Gulf of Mexico
Complexity: High collapse resistance
Note: *SCR = Steel Catenary Riser
EXPERTISE IN COMPLEX PROJECTS
9
LSAW HSAW ERW/HFIW Total (KMT)
4,269 7,381 1,425 13,074
• Track Record of delivering more than 13 million tonnes of pipeline
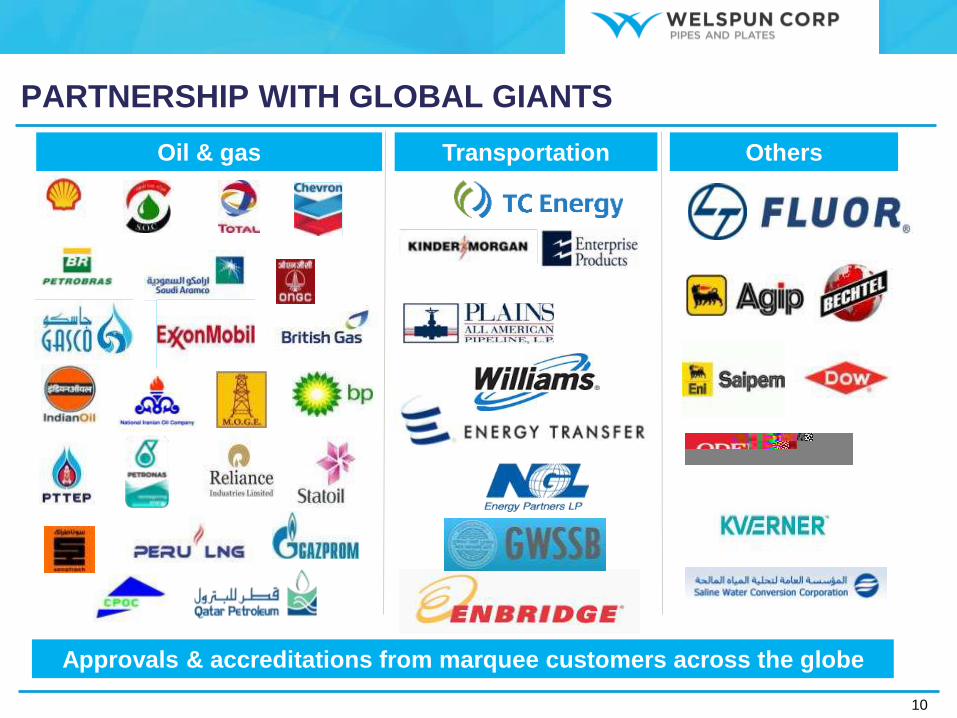
Approvals & accreditations from marquee customers across the globe
Oil & gas Transportation Others
PARTNERSHIP WITH GLOBAL GIANTS
10
Quality, Capability and Safety Certifications across facilities
GLOBAL CERTIFICATIONS ACROSS FACILITIES
11
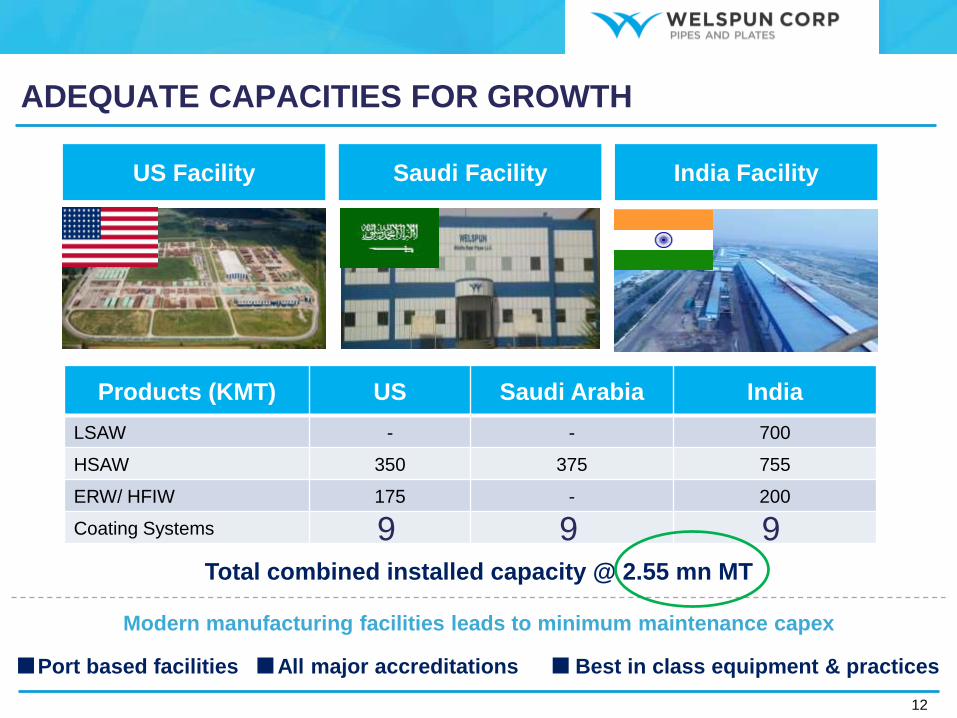
Saudi Facility
Products (KMT) US Saudi Arabia India
LSAW - - 700
HSAW 350 375 755
ERW/ HFIW 175 - 200
Coating Systems
Total combined installed capacity @ 2.55 mn MT
US Facility India Facility
ADEQUATE CAPACITIES FOR GROWTH
12
Port based facilities Best in class equipment & practicesAll major accreditations
Modern manufacturing facilities leads to minimum maintenance capex
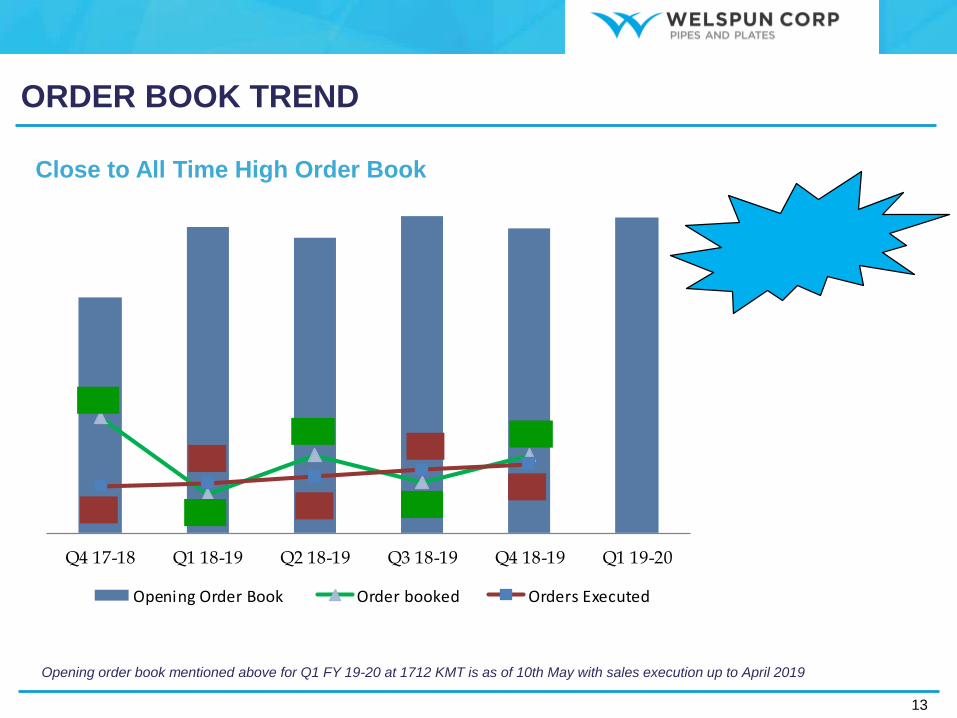
ORDER BOOK TREND
Opening order book mentioned above for Q1 FY 19-20 at 1712 KMT is as of 10th May with sales execution up to April 2019
13
1,2
79
1,6
57
1,6
02
1,7
21
1,6
56
1,7
12
632
212
423
274
425
254
267
304
339
369
Q4 17-18 Q1 18-19 Q2 18-19 Q3 18-19 Q4 18-19 Q1 19-20
Opening Order Book Order booked Orders Executed
Valued atUSD 2.15 Bn
Close to All Time High Order Book
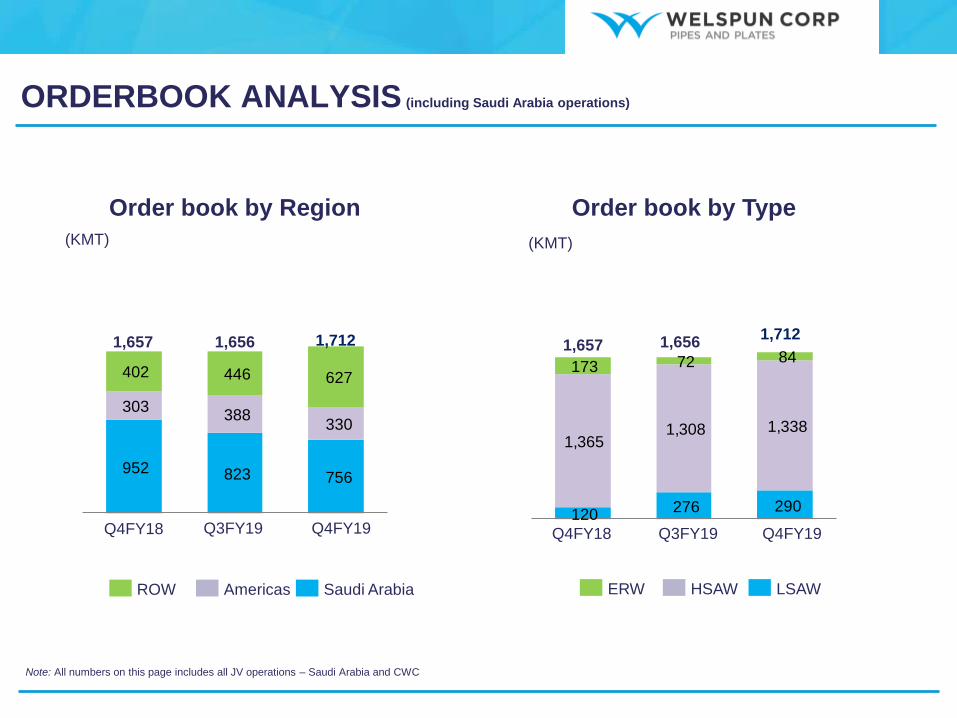
952 823 756
303 388
330
402 446 627
120 276 290
1,365 1,308 1,338
173 72 84
Order book by Region
ROW Saudi ArabiaAmericas
Order book by Type
1,657
Q4FY18
1,712
Q3FY19
1,656
Q4FY19
HSAW LSAWERW
(KMT) (KMT)
1,657 1,7121,656
Q3FY19 Q4FY19Q4FY18
ORDERBOOK ANALYSIS (including Saudi Arabia operations)
Note: All numbers on this page includes all JV operations – Saudi Arabia and CWC
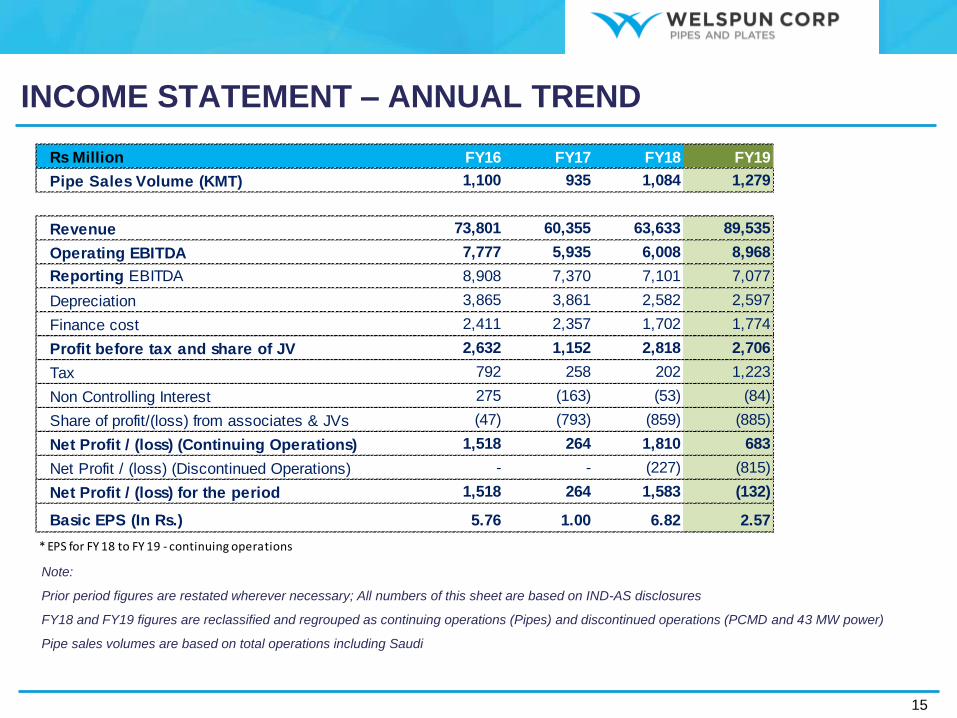
INCOME STATEMENT – ANNUAL TREND
Note:
Prior period figures are restated wherever necessary; All numbers of this sheet are based on IND-AS disclosures
FY18 and FY19 figures are reclassified and regrouped as continuing operations (Pipes) and discontinued operations (PCMD and 43 MW power)
Pipe sales volumes are based on total operations including Saudi
15
Rs Million FY16 FY17 FY18 FY19
Pipe Sales Volume (KMT) 1,100 935 1,084 1,279
Revenue 73,801 60,355 63,633 89,535
Operating EBITDA 7,777 5,935 6,008 8,968
Reporting EBITDA 8,908 7,370 7,101 7,077
Depreciation 3,865 3,861 2,582 2,597
Finance cost 2,411 2,357 1,702 1,774
Profit before tax and share of JV 2,632 1,152 2,818 2,706
Tax 792 258 202 1,223
Non Controlling Interest 275 (163) (53) (84)
Share of profit/(loss) from associates & JVs (47) (793) (859) (885)
Net Profit / (loss) (Continuing Operations) 1,518 264 1,810 683
Net Profit / (loss) (Discontinued Operations) - - (227) (815)
Net Profit / (loss) for the period 1,518 264 1,583 (132)
Basic EPS (In Rs.) 5.76 1.00 6.82 2.57
* EPS for FY 18 to FY 19 - continuing operations
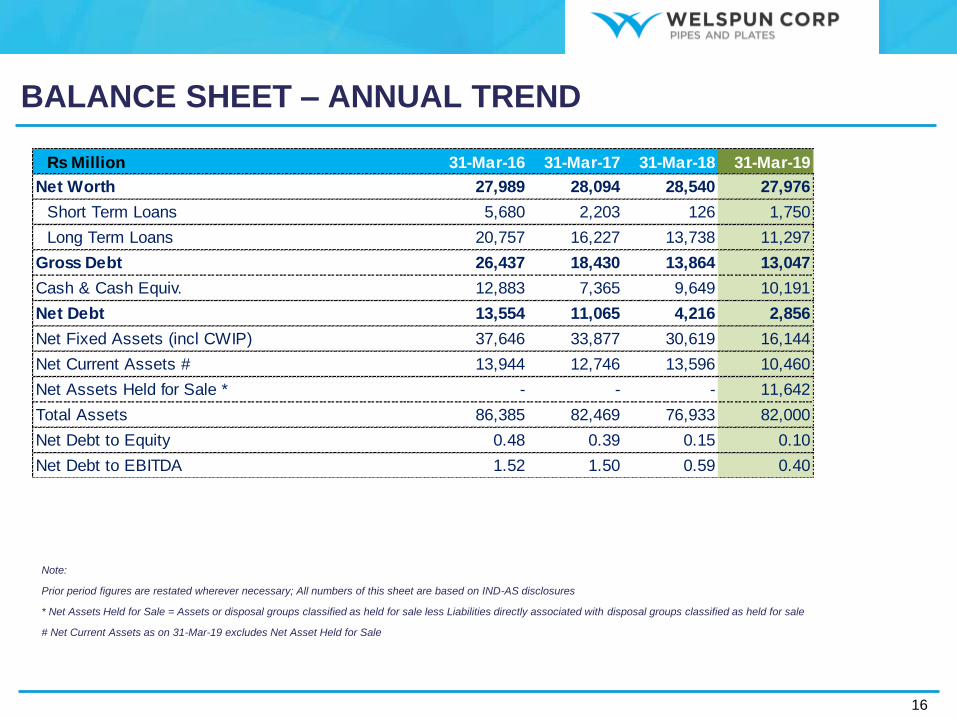
BALANCE SHEET – ANNUAL TREND
Note:
Prior period figures are restated wherever necessary; All numbers of this sheet are based on IND-AS disclosures
* Net Assets Held for Sale = Assets or disposal groups classified as held for sale less Liabilities directly associated with disposal groups classified as held for sale
# Net Current Assets as on 31-Mar-19 excludes Net Asset Held for Sale
16
Rs Million 31-Mar-16 31-Mar-17 31-Mar-18 31-Mar-19
Net Worth 27,989 28,094 28,540 27,976
Short Term Loans 5,680 2,203 126 1,750
Long Term Loans 20,757 16,227 13,738 11,297
Gross Debt 26,437 18,430 13,864 13,047
Cash & Cash Equiv. 12,883 7,365 9,649 10,191
Net Debt 13,554 11,065 4,216 2,856
Net Fixed Assets (incl CWIP) 37,646 33,877 30,619 16,144
Net Current Assets # 13,944 12,746 13,596 10,460
Net Assets Held for Sale * - - - 11,642
Total Assets 86,385 82,469 76,933 82,000
Net Debt to Equity 0.48 0.39 0.15 0.10
Net Debt to EBITDA 1.52 1.50 0.59 0.40
6348
7391
-103
-64
-4
-57
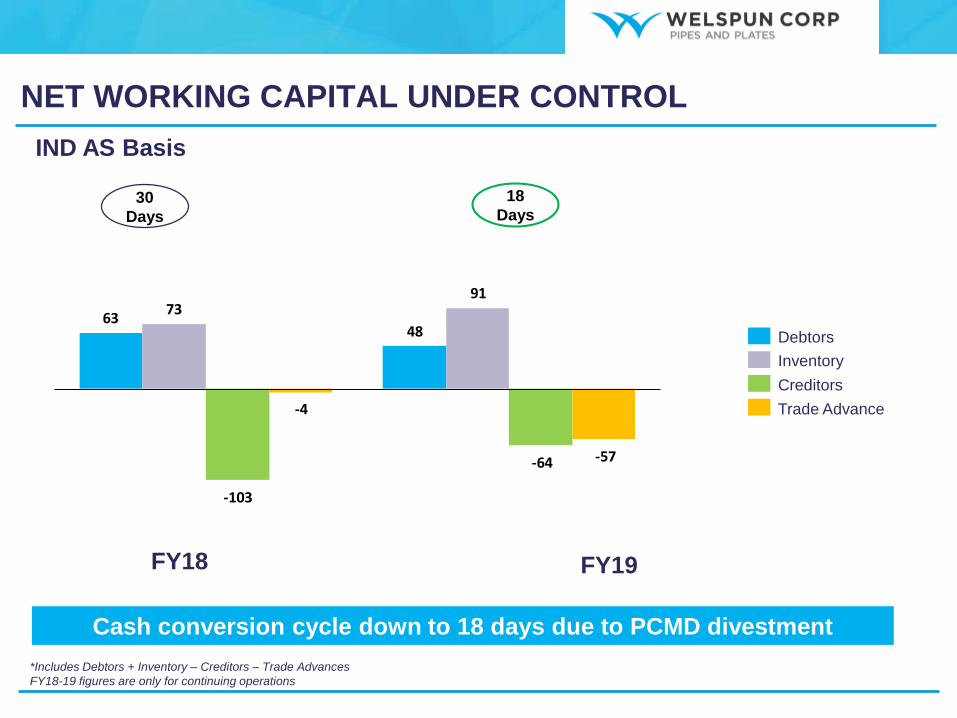
NET WORKING CAPITAL UNDER CONTROL
*Includes Debtors + Inventory – Creditors – Trade Advances
FY18-19 figures are only for continuing operations
18
Days30
Days
FY18 FY19
Creditors
Debtors
IND AS Basis
Trade Advance
Inventory
Cash conversion cycle down to 18 days due to PCMD divestment
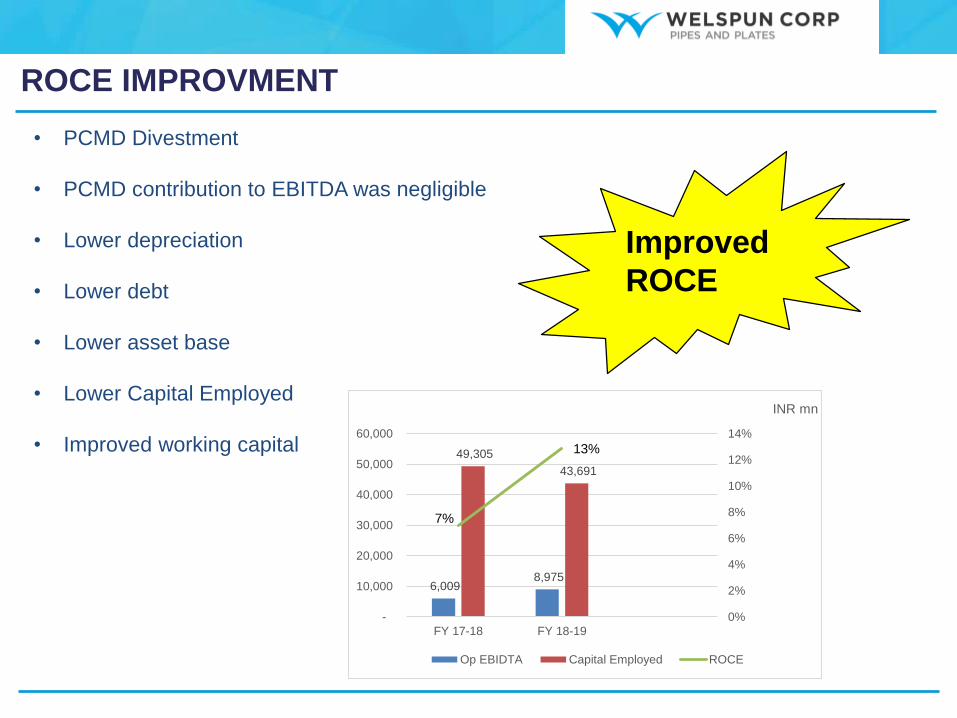
• PCMD Divestment
• PCMD contribution to EBITDA was negligible
• Lower depreciation
• Lower debt
• Lower asset base
• Lower Capital Employed
• Improved working capital
ROCE IMPROVMENT
Improved
ROCE
6,009 8,975
49,305
43,691
7%
13%
0%
2%
4%
6%
8%
10%
12%
14%
-
10,000
20,000
30,000
40,000
50,000
60,000
FY 17-18 FY 18-19
INR mn
Op EBIDTA Capital Employed ROCE
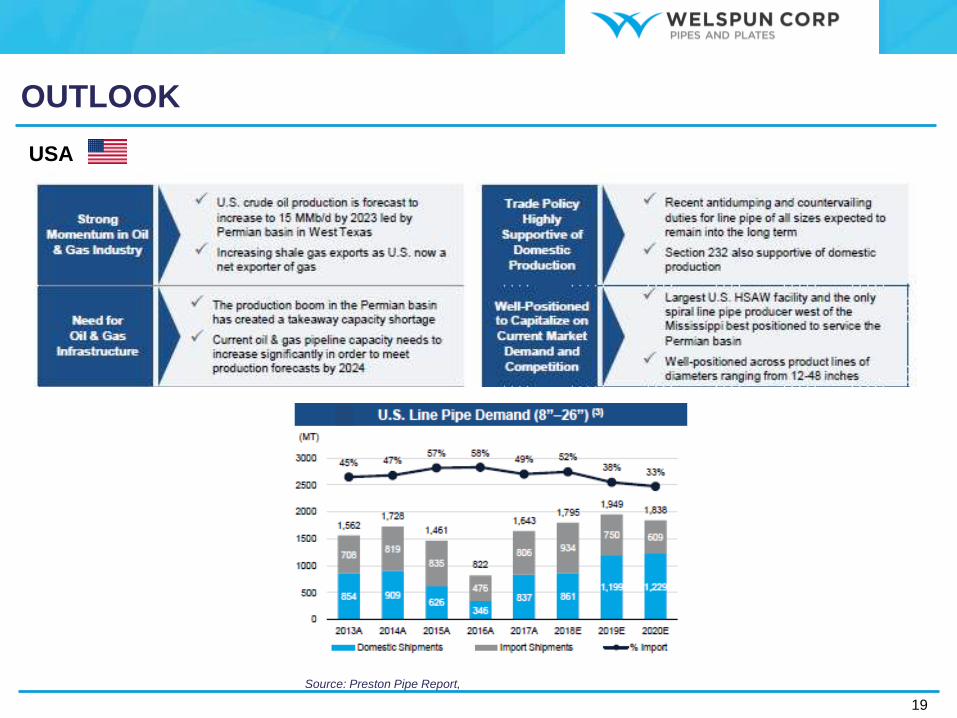
OUTLOOK
19
USA
Source: Preston Pipe Report,
OUTLOOK…..cont.
20
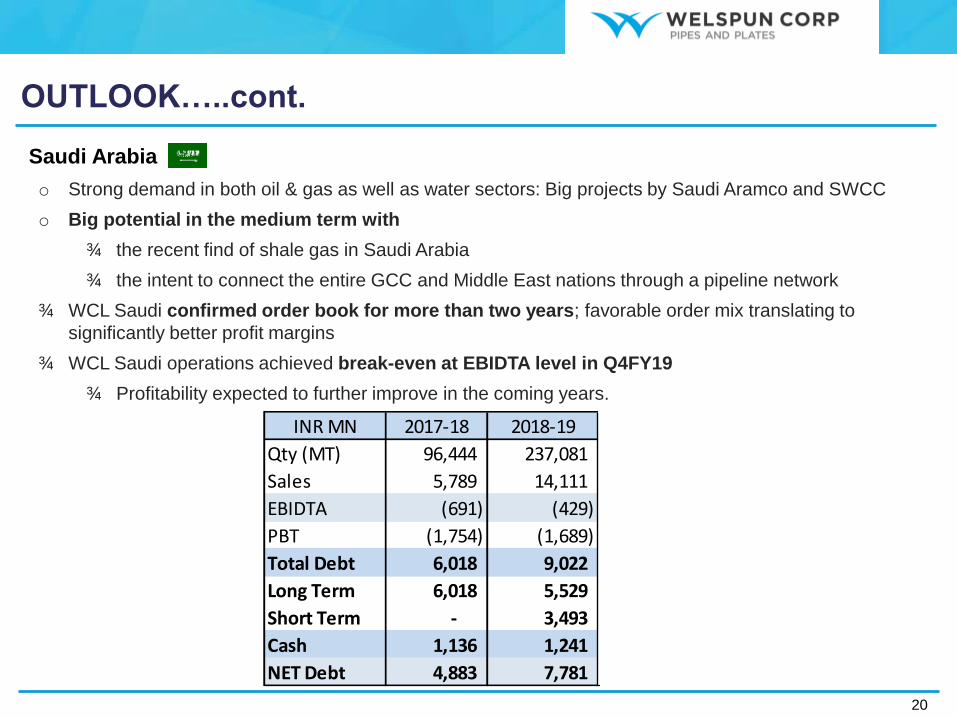
Saudi Arabia
o Strong demand in both oil & gas as well as water sectors: Big projects by Saudi Aramco and SWCC
o Big potential in the medium term with
the recent find of shale gas in Saudi Arabia
the intent to connect the entire GCC and Middle East nations through a pipeline network
WCL Saudi confirmed order book for more than two years; favorable order mix translating to
significantly better profit margins
WCL Saudi operations achieved break-even at EBIDTA level in Q4FY19
Profitability expected to further improve in the coming years.
INR MN 2017-18 2018-19
Qty (MT) 96,444 237,081
Sales 5,789 14,111
EBIDTA (691) (429)
PBT (1,754) (1,689)
Total Debt 6,018 9,022
Long Term 6,018 5,529
Short Term - 3,493
Cash 1,136 1,241
NET Debt 4,883 7,781
OUTLOOK….cont.
21
India
o Large-diameter pipe demand driven by gas grid development of GAIL & oil pipeline network by IOCL
o Small-diameter pipe demand from City Gas Distribution projects
o New government policy to grant pricing freedom to new gas discoveries Increase in exploration
activities in the country higher pipeline demand
o Government focus on issues surrounding water scarcity & stress Significant demand from water
projects is expected across states river linking projects foreseen.
o WCL Bhopal Facility: Geared to meet local demand & become a sizeable player in Central India
o WCL well-placed to service LSAW pipes demand across geographies with
o its global approvals and accreditations
o an impeccable track record of supplying pipes for complex projects for Oil & Gas majors
o shortly commencing production for highest operating pressure line pipe (X 80 Grade) in the world
to be supplied in North America.
o Export markets showing buoyancy across Middle East, South East Asia, Australia and East Africa
o With oil demand & price remaining strong, the export business from India is expected to improve
Oil & Gas:
Water:
Exports:
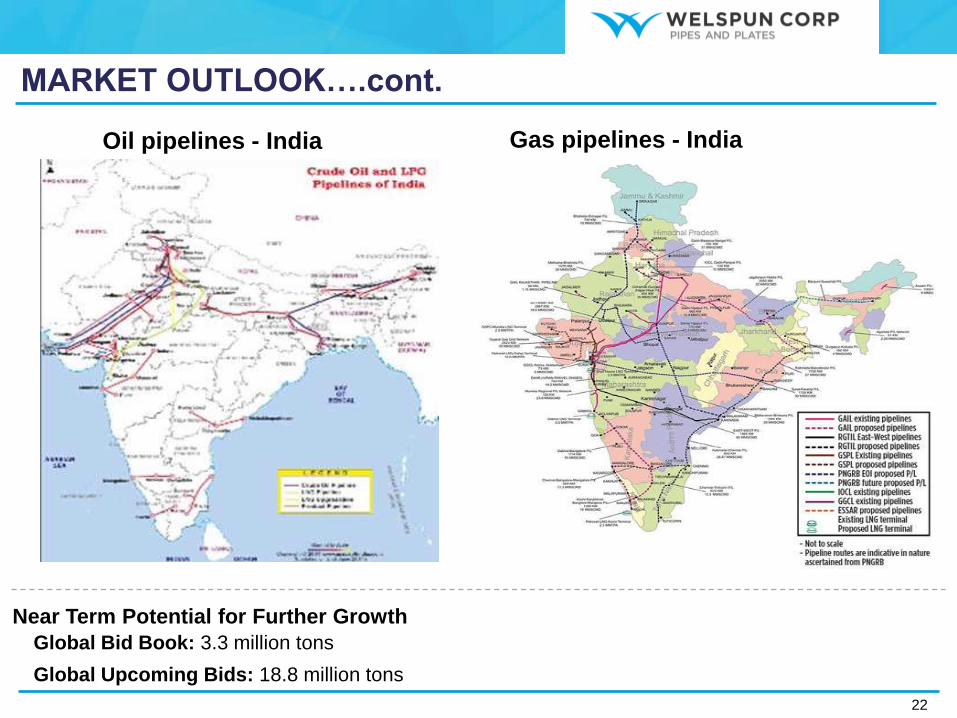
MARKET OUTLOOK….cont.
22
Global Bid Book: 3.3 million tons
Global Upcoming Bids: 18.8 million tons
Near Term Potential for Further Growth
Oil pipelines - India Gas pipelines - India
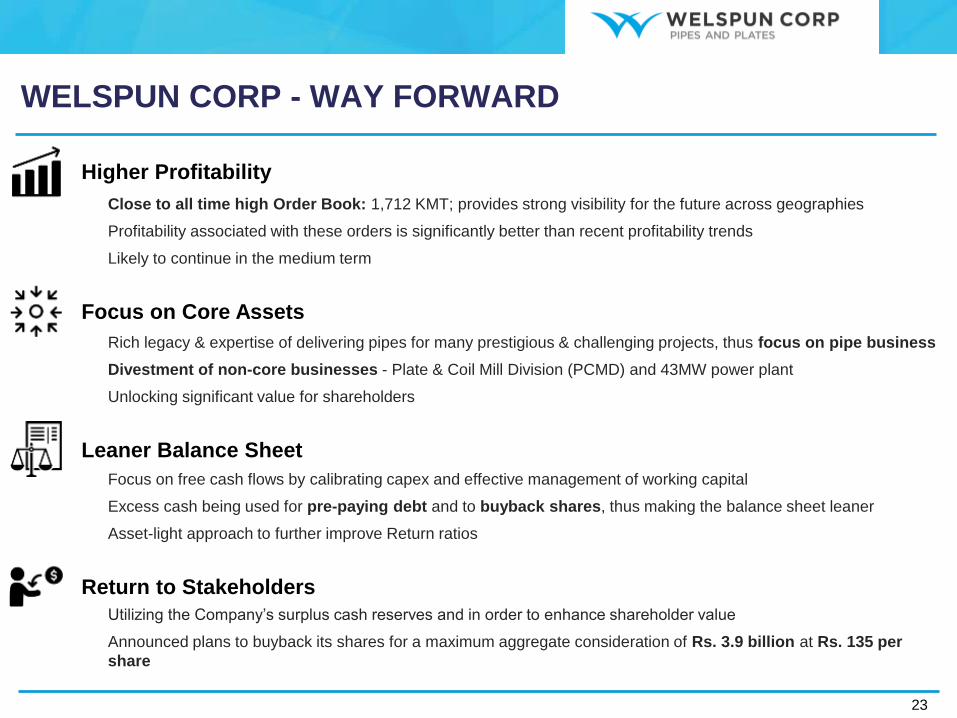
WELSPUN CORP - WAY FORWARD
23
Higher Profitability
Close to all time high Order Book: 1,712 KMT; provides strong visibility for the future across geographies
Profitability associated with these orders is significantly better than recent profitability trends
Likely to continue in the medium term
Rich legacy & expertise of delivering pipes for many prestigious & challenging projects, thus focus on pipe business
Divestment of non-core businesses - Plate & Coil Mill Division (PCMD) and 43MW power plant
Unlocking significant value for shareholders
Focus on Core Assets
Focus on free cash flows by calibrating capex and effective management of working capital
Excess cash being used for pre-paying debt and to buyback shares, thus making the balance sheet leaner
Asset-light approach to further improve Return ratios
Leaner Balance Sheet
Utilizing the Company’s surplus cash reserves and in order to enhance shareholder value
Announced plans to buyback its shares for a maximum aggregate consideration of Rs. 3.9 billion at Rs. 135 per
share
Return to Stakeholders
THANK YOU
Welspun Corp Limited
CIN: L27100GJ1995PLC025609
Mr Rupak Ranjan Ghosh
Mr. Harish Venkateswaran
www.welspuncorp.com
24