Embed Size (px)
Citation preview
Please refer to important disclosures/disclaimers inside
April 15, 2015
Initiation Welspun India Ltd.
Leading player in the global home textile market BUY
Welspun India Ltd. (Welspun) is amongst the top three global home textile manufacturers having a strong delivery network in more than 50 countries (exports ~95% of sales). The company supplies to 14 of the top 30 global retailers like Wal-Mart, JC Penney and Macy’s. Welspun’s brands include Christy, Kingsley, Welhome and Spaces. It offers innovative products with technologies like Hygro cotton, Flexifit, Quick dry etc. Its quality product offerings have helped maintain healthy relationships with key retailers which led to the company ranking no.1 among the home textile suppliers to the US consecutively for 3 years. The home textile industry has seen clients moving towards vendor consolidation which resulted in Welspun being the largest terry towel producer in India and the second largest bed sheet producer having a current capacity utilization level of 100% and 90%, respectively. Welspun is in the process of expanding its manufacturing facilities over the next 1-2 years with an aim to cater to the increasing demand for its products. We anticipate revenue and profit CAGR of 19% and 30%, respectively over FY2015-17E. We initiate coverage on the stock with a BUY rating and a target price of Rs530.
Leader in the home textile market: India’s market share in global home
textile exports ($45 billion) currently stands at 11% as it is benefiting from the increasing competitiveness of manufacturers. In India, Welspun is the largest terry towel producer having a capacity of 45,000 tonne and is the 2
nd largest
bed sheet producer with a capacity of 55 million metres in FY2014. The company’s size, focus on quality products and strong relationships with key clients globally has helped Welspun’s revenue grow at 22% over FY2010-15E.
Better product mix enables to capture large consumer base: Welspun
offers products across the bath, bedding and flooring categories. The company owns premium international brands like Christy, Kingsley and Indian brands like Spaces and Welhome. It also focuses in to innovative products (~25% of FY2015 sales) with technologies like ‘Hygro cotton’ (ultra-soft, ultra-absorbent, quick dry etc.) and ‘Flexifit’ sheets. These products under various retailers’ brand carry Welspun’s patented technology and helps in differentiating its offering.
Capacity expansion to aid growth: Welspun has been consistently
increasing its capacity to cater to the increasing demand in the home textile market. The company plans to invest Rs1,000-1,200 crore over the next 12-18 months funded mainly through internal accruals. Post the capex, its capacity for terry towels will increase by 15,000 tonne to 60,000 tonne and sheets will increase by 17 million metres to 72 million metres by FY2016E.
Healthy financials: The company enjoys better EBITDA margins of ~22%
and high RoEs of ~30% as compared to its peers who have average EBITDA margins of ~15% and RoEs of ~23%, respectively. The company is likely to end FY2015E with a net debt of Rs2,731 crore (debt of Rs3,064 crore and cash and equivalents of Rs333 crore). With the expected growth in profit and better cash generation, we anticipate net debt to equity to improve from 1.8x in FY2015E to 0.9x in FY2017E.
Risk factors: 1) Availability of raw materials and rise in input costs, 2)
Currency risk, 3) Government policies and 4) Trade barriers.
Valuation: At the CMP, Welspun is trading at 5.8x P/E and 3.9x EV/EBITDA
on FY2017E basis. We expect new capacities, focus on innovative products and higher branded sales to help improve realizations and drive revenue growth. We initiate coverage with a BUY rating and a target price of Rs530, valuing it at 4.5x its FY2017E EV/EBITDA.
Recommendation Current Market Price (Rs)* 428
Target Price (Rs) 530
Potential upside (%) 23.8
Sector Relative to Market In-line
Stock Relative to Sector Outperform
Stock Information* BSE Code 514162
NSE Code WELSPUNIND
Face value (Rs/share) 10.0
No. of shares (Cr.) 10.0
Market Cap (Rs Cr.) 4,299
Free float (Rs Cr.) 1,147
52 Week H / L (Rs) 435 / 100
Avg. Daily turnover (12M, Rs Cr.) 4.6
Shareholding Pattern (%)
Dec-14 Dec-13
Promoters 73.3 68.8
FII 2.3 -
DII 5.5 16.7
Others 18.9 14.5
Source: Bloomberg, Centrum Wealth Research
1 year Indexed Price Performance*
80
130
180
230
280
330
380
430
480
Apr-14 Jul-14 Oct-14 Jan-15 Apr-15
Welspun India BSE 500
Source: Bloomberg, Centrum Wealth Research
Price Performance (%)*
1M 3M 6M 12M
WELSPUN INDIA 30.8 29.8 44.1 320.5
BSE 500 2.6 7.2 14.5 36.7
* As on April 13, 2015
Source: Bloomberg, Centrum Wealth Research
Mrinalini Chetty, Research Analyst
Siddhartha Khemka, VP Research
Centrum Wealth Research is also available on:
Bloomberg: CBWM <GO>,
Thomson Reuters, Capital IQ and Factset
Financial Summary - Consolidated Y/E Mar (Rs Cr.) Revenue YoY (%) EBITDA EBITDA (%) Adj. PAT YoY (%) EPS (Rs) P/E (x) EV/EBITDA(x) RoE (%)
FY2013A 3,647 13.3 595 16.3 227 243.3 22.62 18.9 10.1 26.2
FY2014A* 4,495 23.3 921 20.5 428 88.5 42.64 10.0 7.4 40.8
FY2015E 5,302 17.9 1,182 22.3 441 2.9 43.87 9.8 5.9 33.9
FY2016E 6,257 18.0 1,420 22.7 565 28.3 56.27 7.6 4.9 32.6
FY2017E 7,445 19.0 1,720 23.1 741 31.1 73.74 5.8 3.9 32.3
Source: Company, Centrum Wealth Research Note: * Normalised for one time depreciation charge of Rs496 crore - due to change in method.
Wealth Research
Centrum Wealth Research Welspun India Ltd
Centrum Broking Ltd. 2
About the Company
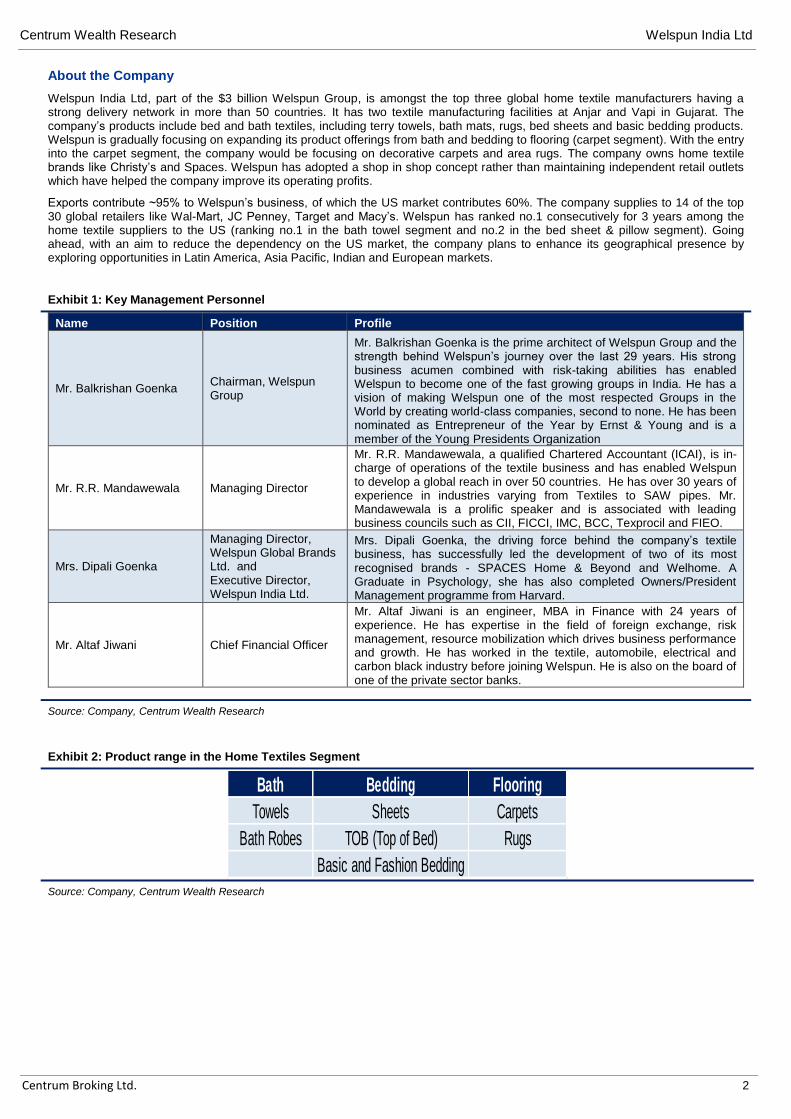
Welspun India Ltd, part of the $3 billion Welspun Group, is amongst the top three global home textile manufacturers having a strong delivery network in more than 50 countries. It has two textile manufacturing facilities at Anjar and Vapi in Gujarat. The company’s products include bed and bath textiles, including terry towels, bath mats, rugs, bed sheets and basic bedding products. Welspun is gradually focusing on expanding its product offerings from bath and bedding to flooring (carpet segment). With the entry into the carpet segment, the company would be focusing on decorative carpets and area rugs. The company owns home textile brands like Christy’s and Spaces. Welspun has adopted a shop in shop concept rather than maintaining independent retail outlets which have helped the company improve its operating profits.
Exports contribute ~95% to Welspun’s business, of which the US market contributes 60%. The company supplies to 14 of the top 30 global retailers like Wal-Mart, JC Penney, Target and Macy’s. Welspun has ranked no.1 consecutively for 3 years among the home textile suppliers to the US (ranking no.1 in the bath towel segment and no.2 in the bed sheet & pillow segment). Going ahead, with an aim to reduce the dependency on the US market, the company plans to enhance its geographical presence by exploring opportunities in Latin America, Asia Pacific, Indian and European markets.
Exhibit 1: Key Management Personnel
Name Position Profile
Mr. Balkrishan Goenka Chairman, Welspun Group
Mr. Balkrishan Goenka is the prime architect of Welspun Group and the strength behind Welspun’s journey over the last 29 years. His strong business acumen combined with risk-taking abilities has enabled Welspun to become one of the fast growing groups in India. He has a vision of making Welspun one of the most respected Groups in the World by creating world-class companies, second to none. He has been nominated as Entrepreneur of the Year by Ernst & Young and is a member of the Young Presidents Organization
Mr. R.R. Mandawewala Managing Director
Mr. R.R. Mandawewala, a qualified Chartered Accountant (ICAI), is in-charge of operations of the textile business and has enabled Welspun to develop a global reach in over 50 countries. He has over 30 years of experience in industries varying from Textiles to SAW pipes. Mr. Mandawewala is a prolific speaker and is associated with leading business councils such as CII, FICCI, IMC, BCC, Texprocil and FIEO.
Mrs. Dipali Goenka
Managing Director, Welspun Global Brands Ltd. and Executive Director, Welspun India Ltd.
Mrs. Dipali Goenka, the driving force behind the company’s textile business, has successfully led the development of two of its most recognised brands - SPACES Home & Beyond and Welhome. A Graduate in Psychology, she has also completed Owners/President Management programme from Harvard.
Mr. Altaf Jiwani Chief Financial Officer
Mr. Altaf Jiwani is an engineer, MBA in Finance with 24 years of experience. He has expertise in the field of foreign exchange, risk management, resource mobilization which drives business performance and growth. He has worked in the textile, automobile, electrical and carbon black industry before joining Welspun. He is also on the board of one of the private sector banks.
Source: Company, Centrum Wealth Research
Exhibit 2: Product range in the Home Textiles Segment
Bath Bedding Flooring
Towels Sheets Carpets
Bath Robes TOB (Top of Bed) Rugs
Basic and Fashion Bedding
Source: Company, Centrum Wealth Research
Centrum Wealth Research Welspun India Ltd
Centrum Broking Ltd. 3
Leader in the home textile market
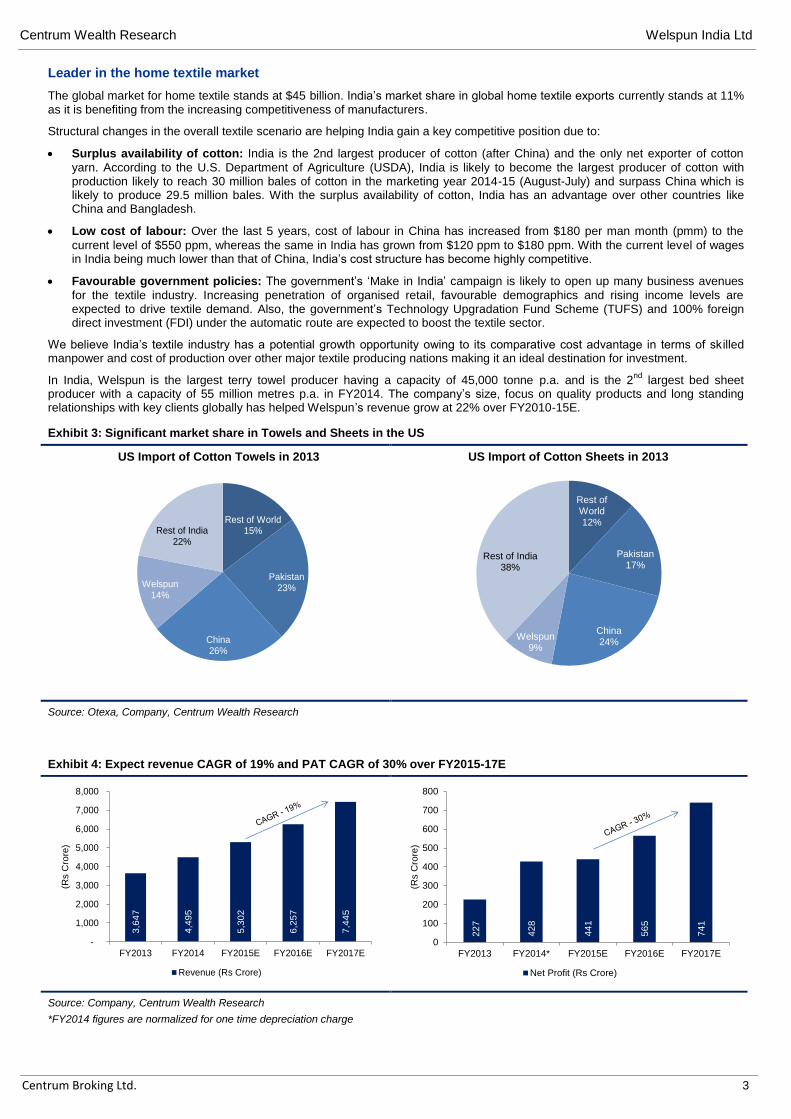
The global market for home textile stands at $45 billion. India’s market share in global home textile exports currently stands at 11% as it is benefiting from the increasing competitiveness of manufacturers.
Structural changes in the overall textile scenario are helping India gain a key competitive position due to:
Surplus availability of cotton: India is the 2nd largest producer of cotton (after China) and the only net exporter of cotton
yarn. According to the U.S. Department of Agriculture (USDA), India is likely to become the largest producer of cotton with production likely to reach 30 million bales of cotton in the marketing year 2014-15 (August-July) and surpass China which is likely to produce 29.5 million bales. With the surplus availability of cotton, India has an advantage over other countries like China and Bangladesh.
Low cost of labour: Over the last 5 years, cost of labour in China has increased from $180 per man month (pmm) to the
current level of $550 ppm, whereas the same in India has grown from $120 ppm to $180 ppm. With the current level of wages in India being much lower than that of China, India’s cost structure has become highly competitive.
Favourable government policies: The government’s ‘Make in India’ campaign is likely to open up many business avenues
for the textile industry. Increasing penetration of organised retail, favourable demographics and rising income levels are expected to drive textile demand. Also, the government’s Technology Upgradation Fund Scheme (TUFS) and 100% foreign direct investment (FDI) under the automatic route are expected to boost the textile sector.
We believe India’s textile industry has a potential growth opportunity owing to its comparative cost advantage in terms of sk illed manpower and cost of production over other major textile producing nations making it an ideal destination for investment.
In India, Welspun is the largest terry towel producer having a capacity of 45,000 tonne p.a. and is the 2nd
largest bed sheet producer with a capacity of 55 million metres p.a. in FY2014. The company’s size, focus on quality products and long standing relationships with key clients globally has helped Welspun’s revenue grow at 22% over FY2010-15E.
Exhibit 3: Significant market share in Towels and Sheets in the US
US Import of Cotton Towels in 2013
Rest of World15%
Pakistan23%
China26%
Welspun 14%
Rest of India22%
US Import of Cotton Sheets in 2013
Rest of World12%
Pakistan17%
China24%
Welspun 9%
Rest of India38%
Source: Otexa, Company, Centrum Wealth Research
Exhibit 4: Expect revenue CAGR of 19% and PAT CAGR of 30% over FY2015-17E
3,6
47
4,4
95
5,3
02
6,2
57
7,4
45
-
1,000
2,000
3,000
4,000
5,000
6,000
7,000
8,000
FY2013 FY2014 FY2015E FY2016E FY2017E
(Rs C
rore
)
Revenue (Rs Crore)
227
428
441
565
741
0
100
200
300
400
500
600
700
800
FY2013 FY2014* FY2015E FY2016E FY2017E
(Rs C
rore
)
Net Profit (Rs Crore)
Source: Company, Centrum Wealth Research
*FY2014 figures are normalized for one time depreciation charge
Centrum Wealth Research Welspun India Ltd
Centrum Broking Ltd. 4
Better product mix enables to capture large consumer base
On the international front, in 2006, Welspun acquired 85% stake in CHT Holdings Ltd., holding company of Britain's leading towel brand Christy. In 2009, it acquired the remaining 15% stake making it a 100% subsidiary. Through this, the company gained access to the premium brand and retail stores in the UK and European markets. Christy is an exclusive licensee to the Wimbledon Championships.
On the domestic front, Welspun has presence through brands like Welhome and SPACES Home & Beyond. The company has adopted a shop in shop model for its domestic business with an aim to variabalise costs and enhance profitability. Over FY2012-14, Welspun’s branded sales grew at a CAGR of 24%.
The company being a market leader has constantly focused on quality product offerings, ready supply and on time delivery which has enabled it to maintain long standing relationships with key retailers like Wal-Mart, JC Penney, Target and Macy’s. Welspun covers the entire spectrum from super premium to value with brands like Christy, Kingsley, Welhome and Spaces within India and overseas.
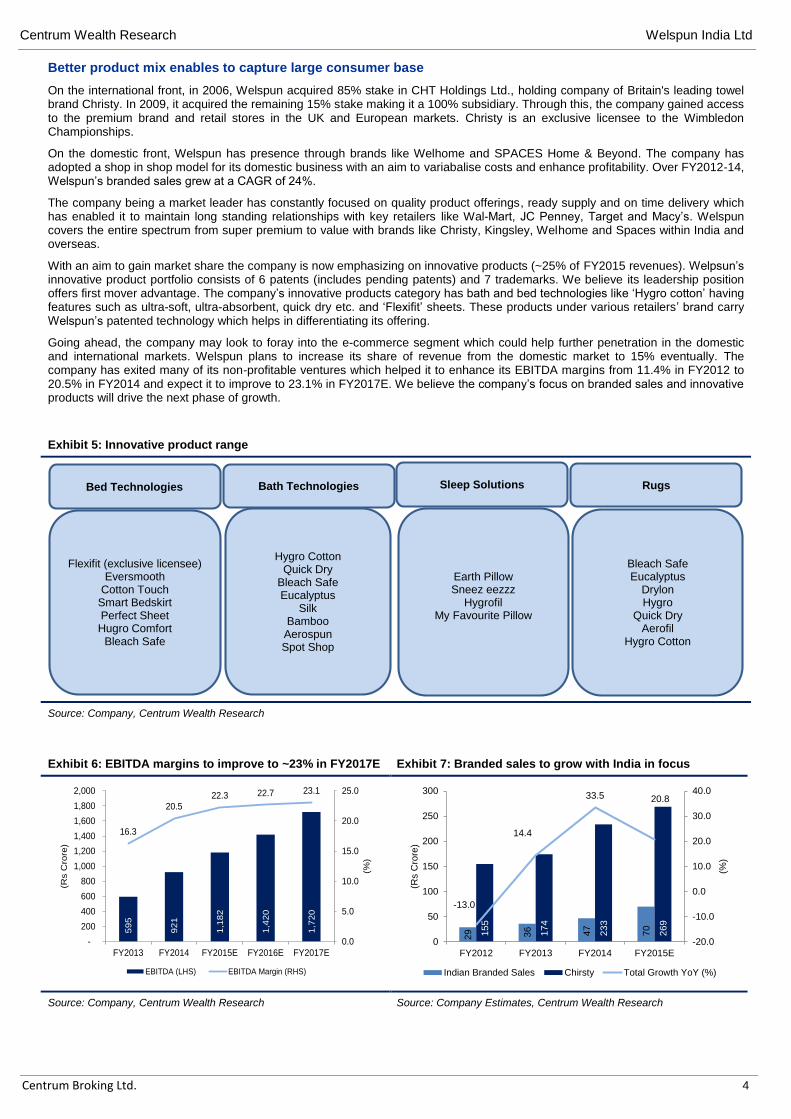
With an aim to gain market share the company is now emphasizing on innovative products (~25% of FY2015 revenues). Welpsun’s innovative product portfolio consists of 6 patents (includes pending patents) and 7 trademarks. We believe its leadership position offers first mover advantage. The company’s innovative products category has bath and bed technologies like ‘Hygro cotton’ having features such as ultra-soft, ultra-absorbent, quick dry etc. and ‘Flexifit’ sheets. These products under various retailers’ brand carry Welspun’s patented technology which helps in differentiating its offering.
Going ahead, the company may look to foray into the e-commerce segment which could help further penetration in the domestic and international markets. Welspun plans to increase its share of revenue from the domestic market to 15% eventually. The company has exited many of its non-profitable ventures which helped it to enhance its EBITDA margins from 11.4% in FY2012 to 20.5% in FY2014 and expect it to improve to 23.1% in FY2017E. We believe the company’s focus on branded sales and innovative products will drive the next phase of growth.
Exhibit 5: Innovative product range
Bed Technologies Bath Technologies Sleep Solutions Rugs
Flexifit (exclusive licensee)Eversmooth
Cotton TouchSmart BedskirtPerfect SheetHugro Comfort
Bleach Safe
Hygro CottonQuick Dry
Bleach SafeEucalyptus
SilkBambooAerospunSpot Shop
Earth PillowSneez eezzz
HygrofilMy Favourite Pillow
Bleach SafeEucalyptus
DrylonHygro
Quick DryAerofil
Hygro Cotton
Source: Company, Centrum Wealth Research
Exhibit 6: EBITDA margins to improve to ~23% in FY2017E Exhibit 7: Branded sales to grow with India in focus
59
5
92
1
1,1
82
1,4
20
1,7
20
16.3
20.522.3 22.7 23.1
0.0
5.0
10.0
15.0
20.0
25.0
-
200
400
600
800
1,000
1,200
1,400
1,600
1,800
2,000
FY2013 FY2014 FY2015E FY2016E FY2017E
(%)
(Rs C
rore
)
EBITDA (LHS) EBITDA Margin (RHS)
29 36 47
70
155
17
4
23
3
26
9
-13.0
14.4
33.5 20.8
-20.0
-10.0
0.0
10.0
20.0
30.0
40.0
0
50
100
150
200
250
300
FY2012 FY2013 FY2014 FY2015E
(%)
(Rs C
rore
)
Indian Branded Sales Chirsty Total Growth YoY (%)
Source: Company, Centrum Wealth Research Source: Company Estimates, Centrum Wealth Research
Centrum Wealth Research Welspun India Ltd
Centrum Broking Ltd. 5
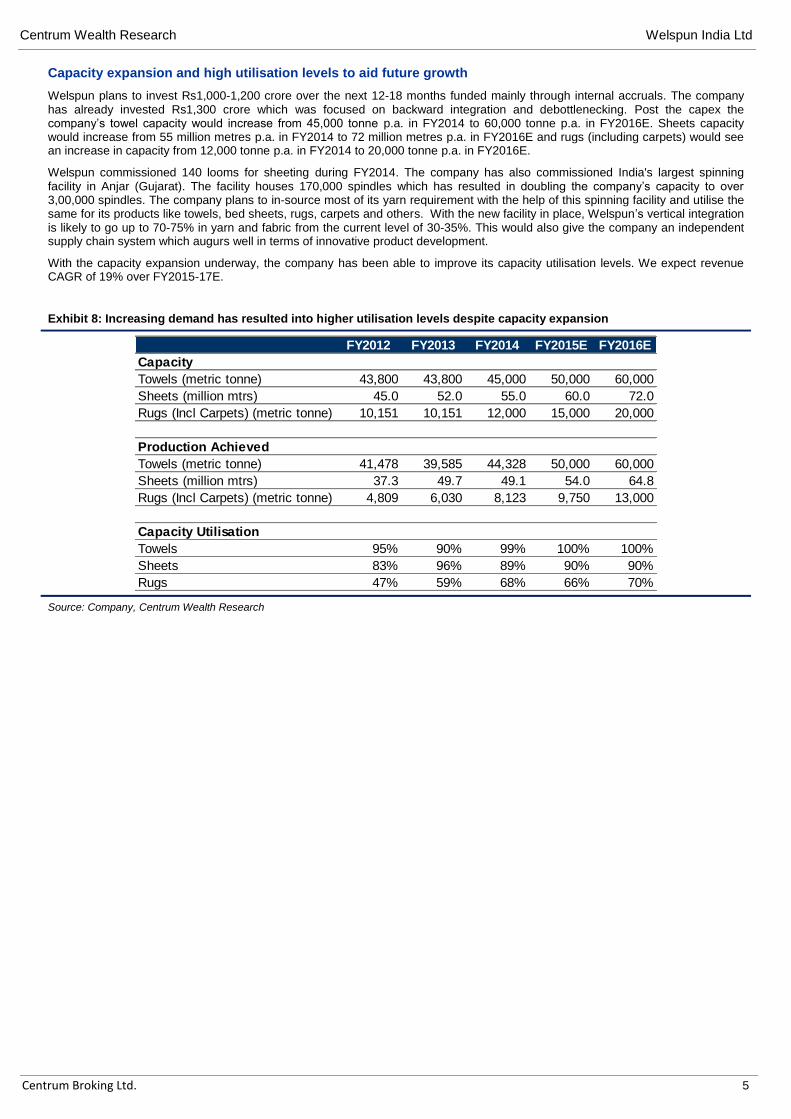
Capacity expansion and high utilisation levels to aid future growth
Welspun plans to invest Rs1,000-1,200 crore over the next 12-18 months funded mainly through internal accruals. The company has already invested Rs1,300 crore which was focused on backward integration and debottlenecking. Post the capex the company’s towel capacity would increase from 45,000 tonne p.a. in FY2014 to 60,000 tonne p.a. in FY2016E. Sheets capacity would increase from 55 million metres p.a. in FY2014 to 72 million metres p.a. in FY2016E and rugs (including carpets) would see an increase in capacity from 12,000 tonne p.a. in FY2014 to 20,000 tonne p.a. in FY2016E.
Welspun commissioned 140 looms for sheeting during FY2014. The company has also commissioned India's largest spinning facility in Anjar (Gujarat). The facility houses 170,000 spindles which has resulted in doubling the company’s capacity to over 3,00,000 spindles. The company plans to in-source most of its yarn requirement with the help of this spinning facility and utilise the same for its products like towels, bed sheets, rugs, carpets and others. With the new facility in place, Welspun’s vertical integration is likely to go up to 70-75% in yarn and fabric from the current level of 30-35%. This would also give the company an independent supply chain system which augurs well in terms of innovative product development.
With the capacity expansion underway, the company has been able to improve its capacity utilisation levels. We expect revenue CAGR of 19% over FY2015-17E.
Exhibit 8: Increasing demand has resulted into higher utilisation levels despite capacity expansion
FY2012 FY2013 FY2014 FY2015E FY2016E
Capacity
Towels (metric tonne) 43,800 43,800 45,000 50,000 60,000
Sheets (million mtrs) 45.0 52.0 55.0 60.0 72.0
Rugs (Incl Carpets) (metric tonne) 10,151 10,151 12,000 15,000 20,000
Production Achieved
Towels (metric tonne) 41,478 39,585 44,328 50,000 60,000
Sheets (million mtrs) 37.3 49.7 49.1 54.0 64.8
Rugs (Incl Carpets) (metric tonne) 4,809 6,030 8,123 9,750 13,000
Capacity Utilisation
Towels 95% 90% 99% 100% 100%
Sheets 83% 96% 89% 90% 90%
Rugs 47% 59% 68% 66% 70%
Source: Company, Centrum Wealth Research
Centrum Wealth Research Welspun India Ltd
Centrum Broking Ltd. 6
Healthy financial performance
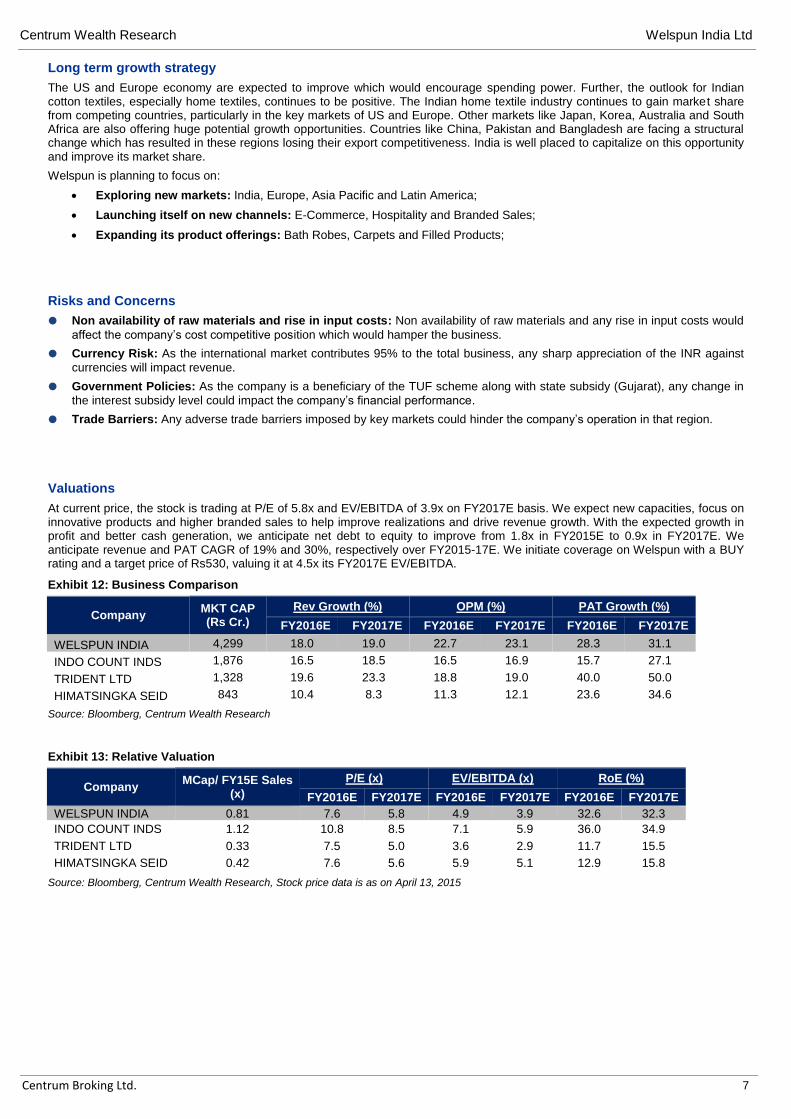
On a consolidated basis, for Q3FY2015, Welspun’s revenue grew by 22% YoY to Rs1,346 crore on the back of robust volume growth in the sheets and rugs segment. EBITDA grew by 42% YoY to Rs340 crore, with EBITDA margins expanding by 348 bps YoY to 25.3%. Margin expansion was mainly on account of declining cotton prices and also due to the commissioning of the company’s spindle facility at Anjar which aided higher vertical integration. Net profit grew by 31% YoY to Rs144 crore. Going ahead, the management expects to achieve a revenue growth of 15% for FY2015E and expects to maintain EBITDA margins in the range of 20-22%. Currently, terry towels which contributes ~55% to revenue is operating at 100% capacity, Sheets which contributes ~35% to revenue is operating at 90% capacity and Rugs which contributes ~10% is operating at 60-65% capacity. Rugs being a fairly new segment is witnessing lower levels of capacity utilisation, we anticipate this to improve going ahead.
The company enjoys better EBITDA margins of ~22% and high RoEs of ~30% as compared to its peers who have average EBITDA margins of ~15% and RoEs of ~23%, respectively (Please refer to Exhibit 12 and 13).
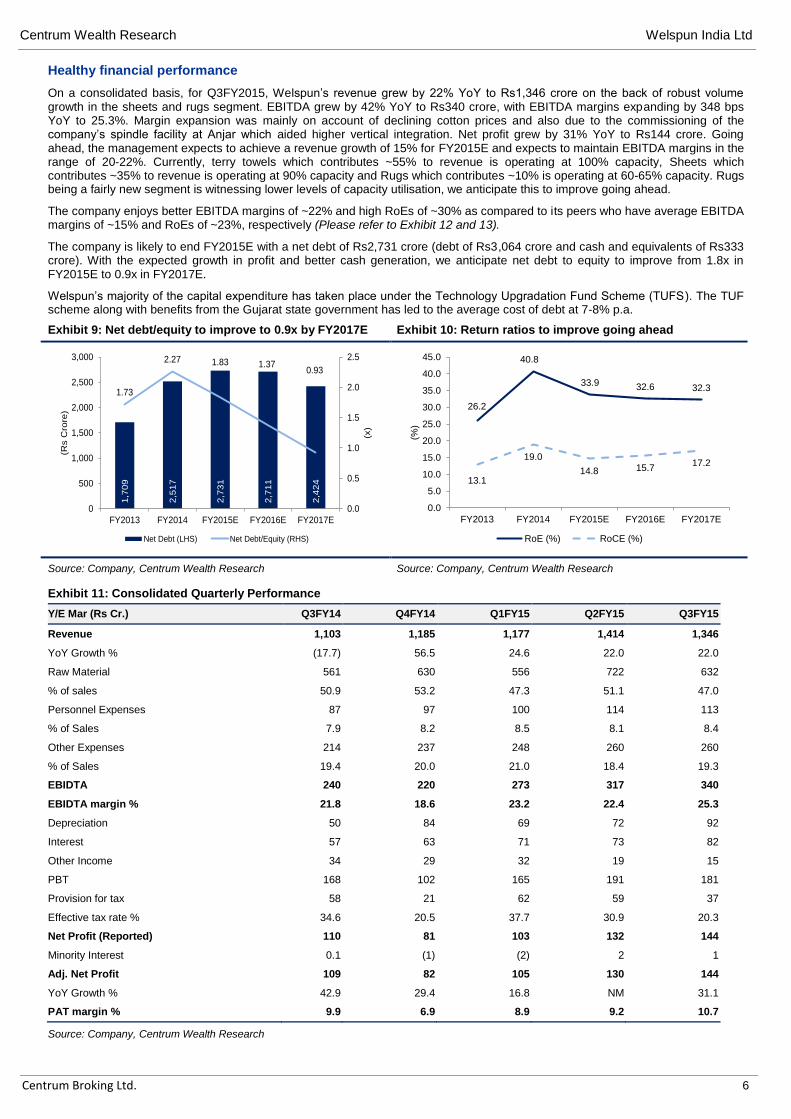
The company is likely to end FY2015E with a net debt of Rs2,731 crore (debt of Rs3,064 crore and cash and equivalents of Rs333 crore). With the expected growth in profit and better cash generation, we anticipate net debt to equity to improve from 1.8x in FY2015E to 0.9x in FY2017E.
Welspun’s majority of the capital expenditure has taken place under the Technology Upgradation Fund Scheme (TUFS). The TUF scheme along with benefits from the Gujarat state government has led to the average cost of debt at 7-8% p.a.
Exhibit 9: Net debt/equity to improve to 0.9x by FY2017E Exhibit 10: Return ratios to improve going ahead
1,7
09
2,5
17
2,7
31
2,7
11
2,4
24
1.73
2.27 1.83 1.370.93
0.0
0.5
1.0
1.5
2.0
2.5
0
500
1,000
1,500
2,000
2,500
3,000
FY2013 FY2014 FY2015E FY2016E FY2017E
(x)
(Rs C
rore
)
Net Debt (LHS) Net Debt/Equity (RHS)
26.2
40.8
33.9 32.6 32.3
13.1
19.0
14.8 15.717.2
0.0
5.0
10.0
15.0
20.0
25.0
30.0
35.0
40.0
45.0
FY2013 FY2014 FY2015E FY2016E FY2017E
(%)
RoE (%) RoCE (%)
Source: Company, Centrum Wealth Research Source: Company, Centrum Wealth Research
Exhibit 11: Consolidated Quarterly Performance
Y/E Mar (Rs Cr.) Q3FY14 Q4FY14 Q1FY15 Q2FY15 Q3FY15
Revenue 1,103 1,185 1,177 1,414 1,346
YoY Growth % (17.7) 56.5 24.6 22.0 22.0
Raw Material 561 630 556 722 632
% of sales 50.9 53.2 47.3 51.1 47.0
Personnel Expenses 87 97 100 114 113
% of Sales 7.9 8.2 8.5 8.1 8.4
Other Expenses 214 237 248 260 260
% of Sales 19.4 20.0 21.0 18.4 19.3
EBIDTA 240 220 273 317 340
EBIDTA margin % 21.8 18.6 23.2 22.4 25.3
Depreciation 50 84 69 72 92
Interest 57 63 71 73 82
Other Income 34 29 32 19 15
PBT 168 102 165 191 181
Provision for tax 58 21 62 59 37
Effective tax rate % 34.6 20.5 37.7 30.9 20.3
Net Profit (Reported) 110 81 103 132 144
Minority Interest 0.1 (1) (2) 2 1
Adj. Net Profit 109 82 105 130 144
YoY Growth % 42.9 29.4 16.8 NM 31.1
PAT margin % 9.9 6.9 8.9 9.2 10.7
Source: Company, Centrum Wealth Research
Centrum Wealth Research Welspun India Ltd
Centrum Broking Ltd. 7
Long term growth strategy
The US and Europe economy are expected to improve which would encourage spending power. Further, the outlook for Indian cotton textiles, especially home textiles, continues to be positive. The Indian home textile industry continues to gain market share from competing countries, particularly in the key markets of US and Europe. Other markets like Japan, Korea, Australia and South Africa are also offering huge potential growth opportunities. Countries like China, Pakistan and Bangladesh are facing a structural change which has resulted in these regions losing their export competitiveness. India is well placed to capitalize on this opportunity and improve its market share.
Welspun is planning to focus on:
Exploring new markets: India, Europe, Asia Pacific and Latin America;
Launching itself on new channels: E-Commerce, Hospitality and Branded Sales;
Expanding its product offerings: Bath Robes, Carpets and Filled Products;
Risks and Concerns
Non availability of raw materials and rise in input costs: Non availability of raw materials and any rise in input costs would
affect the company’s cost competitive position which would hamper the business.
Currency Risk: As the international market contributes 95% to the total business, any sharp appreciation of the INR against
currencies will impact revenue.
Government Policies: As the company is a beneficiary of the TUF scheme along with state subsidy (Gujarat), any change in
the interest subsidy level could impact the company’s financial performance.
Trade Barriers: Any adverse trade barriers imposed by key markets could hinder the company’s operation in that region.
Valuations
At current price, the stock is trading at P/E of 5.8x and EV/EBITDA of 3.9x on FY2017E basis. We expect new capacities, focus on innovative products and higher branded sales to help improve realizations and drive revenue growth. With the expected growth in profit and better cash generation, we anticipate net debt to equity to improve from 1.8x in FY2015E to 0.9x in FY2017E. We anticipate revenue and PAT CAGR of 19% and 30%, respectively over FY2015-17E. We initiate coverage on Welspun with a BUY rating and a target price of Rs530, valuing it at 4.5x its FY2017E EV/EBITDA.
Exhibit 12: Business Comparison
Company MKT CAP (Rs Cr.)
Rev Growth (%) OPM (%) PAT Growth (%)
FY2016E FY2017E FY2016E FY2017E FY2016E FY2017E
WELSPUN INDIA 4,299 18.0 19.0 22.7 23.1 28.3 31.1
INDO COUNT INDS 1,876 16.5 18.5 16.5 16.9 15.7 27.1
TRIDENT LTD 1,328 19.6 23.3 18.8 19.0 40.0 50.0
HIMATSINGKA SEID 843 10.4 8.3 11.3 12.1 23.6 34.6
Source: Bloomberg, Centrum Wealth Research
Exhibit 13: Relative Valuation
Company MCap/ FY15E Sales
(x)
P/E (x) EV/EBITDA (x) RoE (%)
FY2016E FY2017E FY2016E FY2017E FY2016E FY2017E
WELSPUN INDIA 0.81 7.6 5.8 4.9 3.9 32.6 32.3
INDO COUNT INDS 1.12 10.8 8.5 7.1 5.9 36.0 34.9
TRIDENT LTD 0.33 7.5 5.0 3.6 2.9 11.7 15.5
HIMATSINGKA SEID 0.42 7.6 5.6 5.9 5.1 12.9 15.8
Source: Bloomberg, Centrum Wealth Research, Stock price data is as on April 13, 2015
Centrum Wealth Research Welspun India Ltd
Centrum Broking Ltd. 8
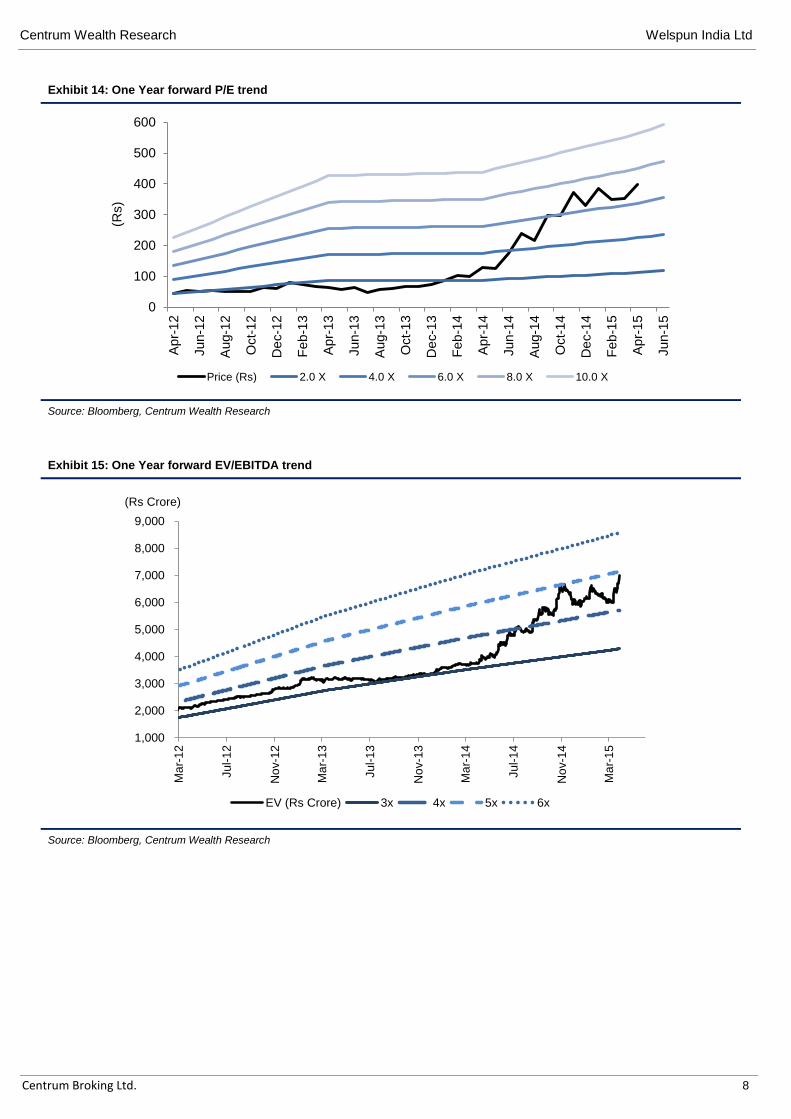
Exhibit 14: One Year forward P/E trend
0
100
200
300
400
500
600
Apr-
12
Jun-1
2
Aug-1
2
Oct-
12
De
c-1
2
Feb
-13
Apr-
13
Jun-1
3
Aug-1
3
Oct-
13
De
c-1
3
Feb
-14
Apr-
14
Jun-1
4
Aug-1
4
Oct-
14
De
c-1
4
Feb
-15
Apr-
15
Jun-1
5
(Rs)
Price (Rs) 2.0 X 4.0 X 6.0 X 8.0 X 10.0 X
Source: Bloomberg, Centrum Wealth Research
Exhibit 15: One Year forward EV/EBITDA trend
1,000
2,000
3,000
4,000
5,000
6,000
7,000
8,000
9,000
Ma
r-1
2
Ju
l-1
2
No
v-1
2
Ma
r-1
3
Ju
l-1
3
No
v-1
3
Ma
r-1
4
Ju
l-1
4
No
v-1
4
Ma
r-1
5
(Rs Crore)
EV (Rs Crore) 3x 4x 5x 6x
Source: Bloomberg, Centrum Wealth Research
Centrum Wealth Research Welspun India Ltd
Centrum Broking Ltd. 9
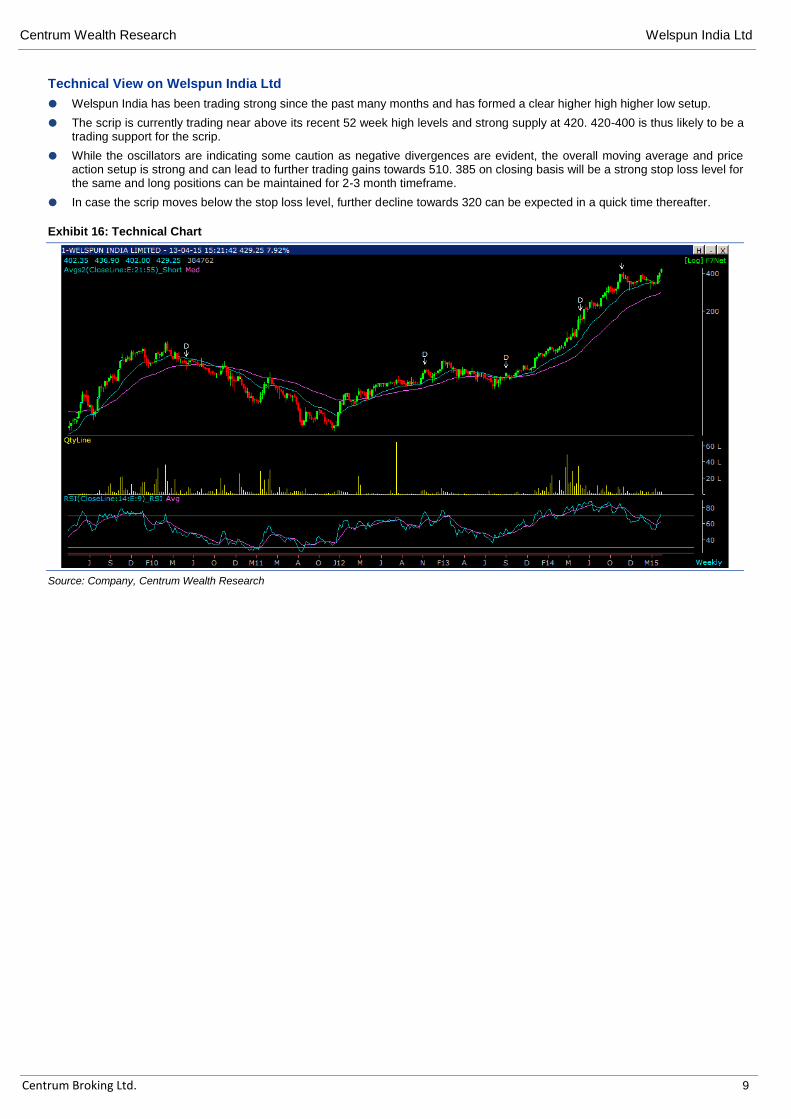
Technical View on Welspun India Ltd
Welspun India has been trading strong since the past many months and has formed a clear higher high higher low setup.
The scrip is currently trading near above its recent 52 week high levels and strong supply at 420. 420-400 is thus likely to be a trading support for the scrip.
While the oscillators are indicating some caution as negative divergences are evident, the overall moving average and price action setup is strong and can lead to further trading gains towards 510. 385 on closing basis will be a strong stop loss level for the same and long positions can be maintained for 2-3 month timeframe.
In case the scrip moves below the stop loss level, further decline towards 320 can be expected in a quick time thereafter.
Exhibit 16: Technical Chart
Source: Company, Centrum Wealth Research
Centrum Wealth Research Welspun India Ltd
Centrum Broking Ltd. 10
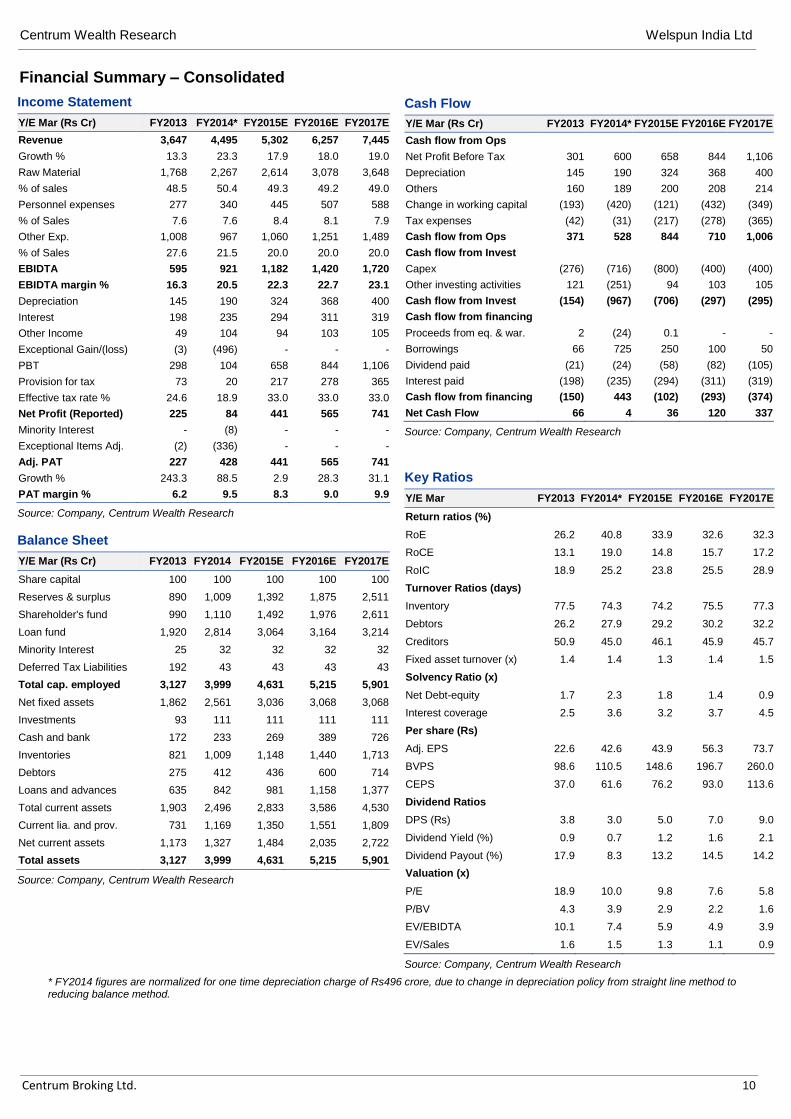
Financial Summary – Consolidated
Income Statement
Y/E Mar (Rs Cr) FY2013 FY2014* FY2015E FY2016E FY2017E
Revenue 3,647 4,495 5,302 6,257 7,445
Growth % 13.3 23.3 17.9 18.0 19.0
Raw Material 1,768 2,267 2,614 3,078 3,648
% of sales 48.5 50.4 49.3 49.2 49.0
Personnel expenses 277 340 445 507 588
% of Sales 7.6 7.6 8.4 8.1 7.9
Other Exp. 1,008 967 1,060 1,251 1,489
% of Sales 27.6 21.5 20.0 20.0 20.0
EBIDTA 595 921 1,182 1,420 1,720
EBIDTA margin % 16.3 20.5 22.3 22.7 23.1
Depreciation 145 190 324 368 400
Interest 198 235 294 311 319
Other Income 49 104 94 103 105
Exceptional Gain/(loss) (3) (496) - - -
PBT 298 104 658 844 1,106
Provision for tax 73 20 217 278 365
Effective tax rate % 24.6 18.9 33.0 33.0 33.0
Net Profit (Reported) 225 84 441 565 741
Minority Interest - (8) - - -
Exceptional Items Adj. (2) (336) - - -
Adj. PAT 227 428 441 565 741
Growth % 243.3 88.5 2.9 28.3 31.1
PAT margin % 6.2 9.5 8.3 9.0 9.9
Source: Company, Centrum Wealth Research
Balance Sheet
Y/E Mar (Rs Cr) FY2013 FY2014 FY2015E FY2016E FY2017E
Share capital 100 100 100 100 100
Reserves & surplus 890 1,009 1,392 1,875 2,511
Shareholder's fund 990 1,110 1,492 1,976 2,611
Loan fund 1,920 2,814 3,064 3,164 3,214
Minority Interest 25 32 32 32 32
Deferred Tax Liabilities 192 43 43 43 43
Total cap. employed 3,127 3,999 4,631 5,215 5,901
Net fixed assets 1,862 2,561 3,036 3,068 3,068
Investments 93 111 111 111 111
Cash and bank 172 233 269 389 726
Inventories 821 1,009 1,148 1,440 1,713
Debtors 275 412 436 600 714
Loans and advances 635 842 981 1,158 1,377
Total current assets 1,903 2,496 2,833 3,586 4,530
Current lia. and prov. 731 1,169 1,350 1,551 1,809
Net current assets 1,173 1,327 1,484 2,035 2,722
Total assets 3,127 3,999 4,631 5,215 5,901
Source: Company, Centrum Wealth Research
Cash Flow
Y/E Mar (Rs Cr) FY2013 FY2014* FY2015E FY2016E FY2017E
Cash flow from Ops
Net Profit Before Tax 301 600 658 844 1,106
Depreciation 145 190 324 368 400
Others 160 189 200 208 214
Change in working capital (193) (420) (121) (432) (349)
Tax expenses (42) (31) (217) (278) (365)
Cash flow from Ops 371 528 844 710 1,006
Cash flow from Invest
Capex (276) (716) (800) (400) (400)
Other investing activities 121 (251) 94 103 105
Cash flow from Invest (154) (967) (706) (297) (295)
Cash flow from financing
Proceeds from eq. & war. 2 (24) 0.1 - -
Borrowings 66 725 250 100 50
Dividend paid (21) (24) (58) (82) (105)
Interest paid (198) (235) (294) (311) (319)
Cash flow from financing (150) 443 (102) (293) (374)
Net Cash Flow 66 4 36 120 337
Source: Company, Centrum Wealth Research
Key Ratios
Y/E Mar FY2013 FY2014* FY2015E FY2016E FY2017E
Return ratios (%)
RoE 26.2 40.8 33.9 32.6 32.3
RoCE 13.1 19.0 14.8 15.7 17.2
RoIC 18.9 25.2 23.8 25.5 28.9
Turnover Ratios (days)
Inventory 77.5 74.3 74.2 75.5 77.3
Debtors 26.2 27.9 29.2 30.2 32.2
Creditors 50.9 45.0 46.1 45.9 45.7
Fixed asset turnover (x) 1.4 1.4 1.3 1.4 1.5
Solvency Ratio (x)
Net Debt-equity 1.7 2.3 1.8 1.4 0.9
Interest coverage 2.5 3.6 3.2 3.7 4.5
Per share (Rs)
Adj. EPS 22.6 42.6 43.9 56.3 73.7
BVPS 98.6 110.5 148.6 196.7 260.0
CEPS 37.0 61.6 76.2 93.0 113.6
Dividend Ratios
DPS (Rs) 3.8 3.0 5.0 7.0 9.0
Dividend Yield (%) 0.9 0.7 1.2 1.6 2.1
Dividend Payout (%) 17.9 8.3 13.2 14.5 14.2
Valuation (x)
P/E 18.9 10.0 9.8 7.6 5.8
P/BV 4.3 3.9 2.9 2.2 1.6
EV/EBIDTA 10.1 7.4 5.9 4.9 3.9
EV/Sales 1.6 1.5 1.3 1.1 0.9
Source: Company, Centrum Wealth Research
* FY2014 figures are normalized for one time depreciation charge of Rs496 crore, due to change in depreciation policy from straight line method to reducing balance method.
Centrum Wealth Research Welspun India Ltd
Centrum Broking Ltd. 11
Appendix
Disclaimer Centrum Broking Limited (“CBL”) is a full-service, Stock Broking Company and a member of The Stock Exchange, Mumbai (BSE), National Stock Exchange of India Ltd. (NSE) and MCX-SX Stock Exchange Limited (MCX-SX). One of our group companies, Centrum Capital Ltd is an investment banker and an underwriter of securities. As a group Centrum has Investment Banking, Advisory and other business relationships with a significant percentage of the companies covered by our Research Group. Our research professionals provide important inputs into the Group's Investment Banking and other business selection processes.
Recipients of this report should assume that our Group is seeking or may seek or will seek Investment Banking, advisory, project finance or other businesses and may receive commission, brokerage, fees or other compensation from the company or companies that are the subject of this material/report. Our Company and Group companies and their officers, directors and employees, including the analysts and others involved in the preparation or issuance of this material and their dependants, may on the date of this report or from, time to time have "long" or "short" positions in, act as principal in, and buy or sell the securities or derivatives thereof of companies mentioned herein. CBLor its affiliates do not own 1% or more in the equity of this company Our sales people, dealers, traders and other professionals may provide oral or written market commentary or trading strategies to our clients that reflect opinions that are contrary to the opinions expressed herein, and our proprietary trading and investing businesses may make investment decisions that are inconsistent with the recommendations expressed herein. We may have earlier issued or may issue in future reports on the companies covered herein with recommendations/ information inconsistent or different those made in this report. In reviewing this document, you should be aware that any or all of the foregoing, among other things, may give rise to or potential conflicts of interest. We and our Group may rely on information barriers, such as "Chinese Walls" to control the flow of information contained in one or more areas within us, or other areas, units, groups or affiliates of CBL. CBL and its affiliates do not make a market in the security of the company for which this report or any report was written. Further, CBL or its affiliates did not make a market in the subject company’s securities at the time that the research report was published.
This report is for information purposes only and this document/material should not be construed as an offer to sell or the solicitation of an offer to buy, purchase or subscribe to any securities, and neither this document nor anything contained herein shall form the basis of or be relied upon in connection with any contract or commitment whatsoever. This document does not solicit any action based on the material contained herein. It is for the general information of the clients of CBL. Though disseminated to clients simultaneously, not all clients may receive this report at the same time. Centrum will not treat recipients as clients by virtue of their receiving this report. It does not constitute a personal recommendation or take into account the particular investment objectives, financial situations, or needs of individual clients. Similarly, this document does not have regard to the specific investment objectives, financial situation/circumstances and the particular needs of any specific person who may receive this document. The securities discussed in this report may not be suitable for all investors. The securities described herein may not be eligible for sale in all jurisdictions or to all categories of investors. The countries in which the companies mentioned in this report are organized may have restrictions on investments, voting rights or dealings in securities by nationals of other countries. The appropriateness of a particular investment or strategy will depend on an investor's individual circumstances and objectives. Persons who may receive this document should consider and independently evaluate whether it is suitable for his/ her/their particular circumstances and, if necessary, seek professional/financial advice. Any such person shall be responsible for conducting his/her/their own investigation and analysis of the information contained or referred to in this document and of evaluating the merits and risks involved in the securities forming the subject matter of this document.
The projections and forecasts described in this report were based upon a number of estimates and assumptions and are inherently subject to significant uncertainties and contingencies. Projections and forecasts are necessarily speculative in nature, and it can be expected that one or more of the estimates on which the projections and forecasts were based will not materialize or will vary significantly from actual results, and such variances will likely increase over time. All projections and forecasts described in this report have been prepared solely by the authors of this report independently of the Company. These projections and forecasts were not prepared with a view toward compliance with published guidelines or generally accented accounting principles. No independent accountants have expressed an opinion or any other form of assurance on these projections or forecasts. You should not regard the inclusion of the projections and forecasts described herein as a representation or warranty by or on behalf of the Company, CBL, Centrum group, the authors of this report or any other person that these projections or forecasts or their underlying assumptions will be achieved. For these reasons, you should only consider the projections and forecasts described in this report after carefully evaluating all of the information in this report, including the assumptions underlying such projections and forecasts.
The price and value of the investments referred to in this document/material and the income from them may go down as well as up, and investors may realize losses on any investments. Past performance is not a guide for future performance. Future returns are not guaranteed and a loss of original capital may occur. Actual results may differ materially from those set forth in projections. Forward-looking statements are not predictions and may be subject to change without notice. We do not provide tax advice to our clients, and all investors are strongly advised to consult regarding any potential investment. CBL and its affiliates accept no liabilities for any loss or damage of any kind arising out of the use of this report. Foreign currencies denominated securities are subject to fluctuations in exchange rates that could have an adverse effect on the value or price of or income derived from the investment. In addition, investors in securities such as ADRs, the value of which are influenced by foreign currencies effectively assume currency risk. Certain transactions including those involving futures, options, and other derivatives as well as non-investment-grade securities give rise to substantial risk and are not suitable for all investors. Please ensure that you have read and understood the current risk disclosure documents before entering into any derivative transactions.
This report/document has been prepared by CBL, based upon information available to the public and sources, believed to be reliable. No representation or warranty, express or implied is made that it is accurate or complete. CBL has reviewed the report and, in so far as it includes current or historical information, it is believed to be reliable, although its accuracy and completeness cannot be guaranteed. The opinions expressed in this document/material are subject to change without notice and have no obligation to tell you when opinions or information in this report change.
This report or recommendations or information contained herein do/does not constitute or purport to constitute investment advice in publicly accessible media and should not be reproduced, transmitted or published by the recipient. The report is for the use and consumption of the recipient only. This publication may not be distributed to the public used by the public media without the express written consent of CBL. This report or any portion hereof may not be printed, sold or distributed without the written consent of CBL.
The distribution of this document in other jurisdictions may be restricted by law, and persons into whose possession this document comes should inform themselves about, and observe, any such restrictions. Neither CBL nor its directors, employees, agents or representatives shall be liable for any damages whether direct or indirect, incidental, special or consequential including lost revenue or lost profits that may arise from or in connection with the use of the information.
This document does not constitute an offer or invitation to subscribe for or purchase or deal in any securities and neither this document nor anything contained herein shall form the basis of any contract or commitment whatsoever. This document is strictly confidential and is being furnished to you solely for your information, may not be distributed to the press or other media and may not be reproduced or redistributed to any other person. The distribution of this report in other jurisdictions may be restricted by law and persons into whose possession this report comes should inform themselves about, and observe any such restrictions. By accepting this report, you agree to be bound by the fore going limitations. No representation is made that this report is accurate or complete.
The opinions and projections expressed herein are entirely those of the author and are given as part of the normal research activity of CBL and are given as of this date and are subject to change without notice. Any opinion estimate or projection herein constitutes a view as of the date of this report and there can be no assurance that future results or events will be consistent with any such opinions, estimate or projection.
This document has not been prepared by or in conjunction with or on behalf of or at the instigation of, or by arrangement with the company or any of its directors or any other person. Information in this document must not be relied upon as having been authorized or approved by the company or its directors or any other person. Any opinions and projections contained herein are entirely those of the authors. None of the company or its directors or any other person accepts any liability whatsoever for any loss arising from any use of this document or its contents or otherwise arising in connection therewith.
CBL and its affiliates have not managed or co-managed a public offering for the subject company in the preceding twelve months. CBL and affiliates have not received compensation from the companies mentioned in the report during the period preceding twelve months from the date of this report for service in respect of public offerings, corporate finance, debt restructuring, investment banking or other advisory services in a merger/acquisition or some other sort of specific transaction.
As per the declarations given by his/her, research analyst and the author of this report and/or any of his/her family members do not serve as an officer, director or any way connected to the company/companies mentioned in this report. Further, as declared by his/her, he/she has not received any compensation from the above companies in the preceding twelve months. Our entire research professionals are our employees and are paid a salary. They do not have any other material conflict of interest of the research analyst or member of which the research analyst knows of has reason to know at the time of publication of the research report or at the time of the public appearance.
While we would endeavor to update the information herein on a reasonable basis, CBL, its associated companies, their directors and employees are under no obligation to update or keep the information current. Also, there may be regulatory, compliance or other reasons that may prevent Centrum from doing so.
Non-rated securities indicate that rating on a particular security has been suspended temporarily and such suspension is in compliance with applicable regulations and/or Centrum policies, in circumstances where CBL is acting in an advisory capacity to this company, or any certain other circumstances.
This report is not directed to or intended for distribution to or use by, any person or entity who is a citizen or resident of or located in any locality, state, country or other jurisdiction where such distribution, publication, availability or use would be contrary to law or regulation or which would subject Centrum Broking Limited or its group companies to any registration or licensing requirement within such jurisdiction. Specifically, this document does not constitute an offer to or solicitation to any U.S. person for the purchase or sale of any financial instrument or as an official confirmation of any transaction to any U.S. person unless otherwise stated, this message should not be construed as official confirmation of any transaction. No part of this document may be distributed in Canada or used by private customers in United Kingdom.
The information contained herein is not intended for publication or distribution or circulation in any manner whatsoever and any unauthorized reading, dissemination, distribution or copying of this communication is prohibited unless otherwise expressly authorized. Please ensure that you have read “Risk Disclosure Document for Capital Market and Derivatives Segments” as prescribed by Securities and Exchange Board of India before investing in Indian Securities Market.
Centrum Wealth Research Welspun India Ltd
Centrum Broking Ltd. 12
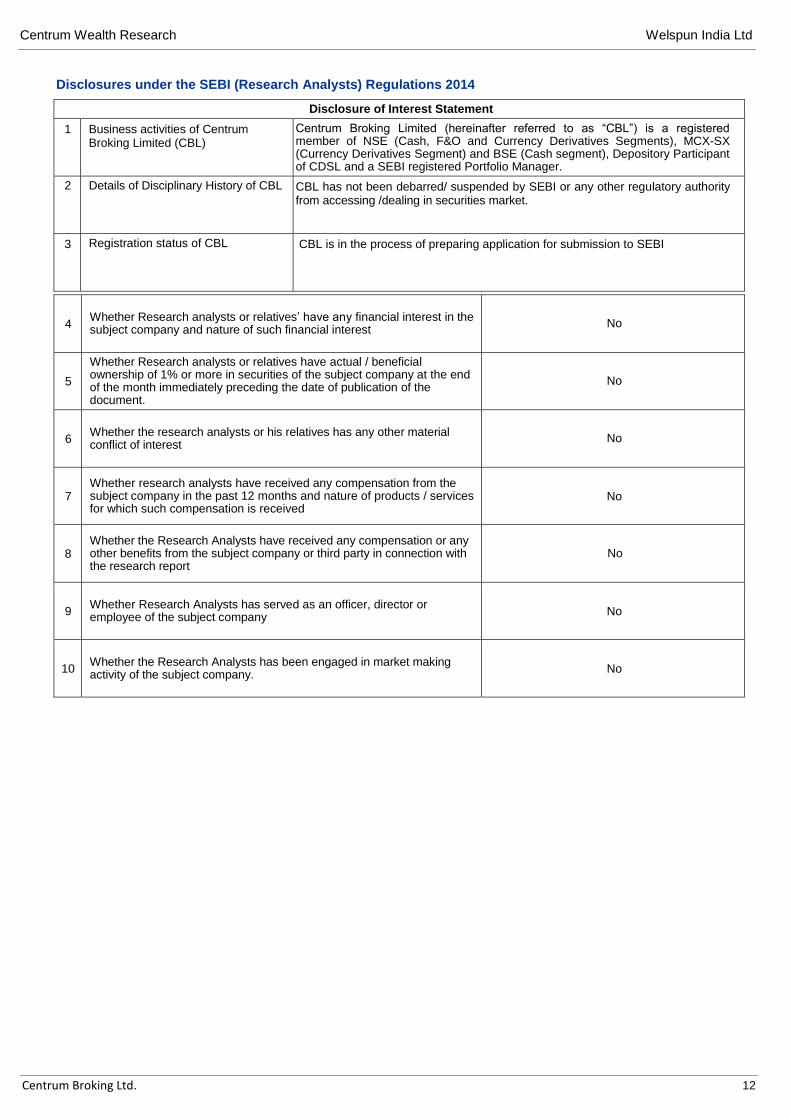
Disclosures under the SEBI (Research Analysts) Regulations 2014
Disclosure of Interest Statement
1 Business activities of Centrum Broking Limited (CBL)
Centrum Broking Limited (hereinafter referred to as “CBL”) is a registered member of NSE (Cash, F&O and Currency Derivatives Segments), MCX-SX (Currency Derivatives Segment) and BSE (Cash segment), Depository Participant of CDSL and a SEBI registered Portfolio Manager.
2 Details of Disciplinary History of CBL CBL has not been debarred/ suspended by SEBI or any other regulatory authority from accessing /dealing in securities market.
3 Registration status of CBL CBL is in the process of preparing application for submission to SEBI
4 Whether Research analysts or relatives’ have any financial interest in the subject company and nature of such financial interest
No
5
Whether Research analysts or relatives have actual / beneficial ownership of 1% or more in securities of the subject company at the end of the month immediately preceding the date of publication of the document.
No
6 Whether the research analysts or his relatives has any other material conflict of interest
No
7 Whether research analysts have received any compensation from the subject company in the past 12 months and nature of products / services for which such compensation is received
No
8 Whether the Research Analysts have received any compensation or any other benefits from the subject company or third party in connection with the research report
No
9 Whether Research Analysts has served as an officer, director or employee of the subject company
No
10 Whether the Research Analysts has been engaged in market making activity of the subject company.
No
Centrum Wealth Research Welspun India Ltd
Centrum Broking Ltd. 13
Member (NSE and BSE)
Regn No.: CAPITAL MARKET SEBI REGN. NO.: BSE: INB011454239 CAPITAL MARKET SEBI REGN. NO.: NSE: INB231454233
DERIVATIVES SEBI REGN. NO.: NSE: INF231454233 (TRADING & CLEARING MEMBER)
CURRENCY DERIVATIVES: MCX-SX INE261454230 CURRENCY DERIVATIVES:NSE (TM & SCM) – NSE 231454233
Depository Participant (DP) CDSL DP ID: 120 – 12200
SEBI REGD NO. : CDSL : IN-DP-CDSL-661-2012
PORTFOLIO MANAGER
SEBI REGN NO.: INP000004383
Website: www.centrum.co.in Investor Grievance Email ID: [email protected]
Compliance Officer Details:
Kavita Ravichandran (022) 4215 9842; Email ID: [email protected]
Centrum Broking Ltd. (CIN: U67120MH1994PLC078125)
REGD. OFFICE Address Bombay Mutual Bldg.,
2nd Floor, Dr. D.N. Road,
Fort, Mumbai - 400 001
Corporate Office & Correspondence Address Centrum House
6th Floor, CST Road, Near Vidya Nagari Marg,
Kalina, Santacruz (E) Mumbai 400 098.
Tel: (022)4215 9000 Fax: +91 22 4215 9344