Embed Size (px)
Citation preview

INVESTOR PRESENTATION MAY 2017
1
Owned Brands
Licenses
Innovations
DISCLAIMER
2
The information contained in this presentation is provided by Welspun India Limited (the “Company”) to you solely for your reference. This document is highly confidential and being
given solely for your information and for your use and may not be retained by you and neither this presentation nor any part thereof may be (i) used or relied upon by any other
party or for any other purpose; (ii) copied, photocopied, duplicated or otherwise reproduced in any form or by any means; or (iii) re-circulated, redistributed, passed on, published in
any media, website or otherwise disseminated, to any other person, in any form or manner, in part or as a whole, without the prior written consent of the Company. This
presentation does not purport to be a complete description of the markets conditions or developments referred to in the material.
Although care has been taken to ensure that the information in this presentation is accurate, and that the opinions expressed are fair and reasonable, the information is subject to
change without notice, its accuracy, fairness or completeness is not guaranteed and has not been independently verified and no express or implied warranty is made thereto. You
must make your own assessment of the relevance, accuracy and adequacy of the information contained in this presentation and must make such independent investigation as you
may consider necessary or appropriate for such purpose. Neither the Company nor any of its directors assume any responsibility or liability for, the accuracy or completeness of, or
any errors or omissions in, any information or opinions contained herein. Neither the Company nor any of its directors, officers, employees or affiliates nor any other person accepts
any liability (in negligence, or otherwise) whatsoever for any loss howsoever arising from any use of this presentation or its contents or otherwise arising in connection therewith.
Any unauthorized use, disclosure or public dissemination of information contained herein is prohibited. The distribution of this presentation in certain jurisdictions may be restricted
by law. Accordingly, any persons in possession of the aforesaid should inform themselves about and observe such restrictions.
The statements contained in this document speak only as at the date as of which they are made, and the Company expressly disclaims any obligation or undertaking to
supplement, amend or disseminate any updates or revisions to any statements contained herein to reflect any change in events, conditions or circumstances on which any such
statements are based. By preparing this presentation, none of the Company, its management, and their respective advisers undertakes any obligation to provide the recipient with
access to any additional information or to update this presentation or any additional information or to correct any inaccuracies in any such information which may become apparent.
This document is for informational purposes and private circulation only and does not constitute or form part of a prospectus, a statement in lieu of a prospectus, an offering
circular, offering memorandum, an advertisement, and should not be construed as an offer to sell or issue or the solicitation of an offer or an offer document to buy or acquire or sell
securities of the Company or any of its subsidiaries or affiliates under the Companies Act, 2013, the Securities and Exchange Board of India (Issue of Capital and Disclosure
Requirements) Regulations, 2009, both as amended, or any applicable law in India or as an inducement to enter into investment activity. No part of this document should be
considered as a recommendation that any investor should subscribe to or purchase securities of the Company or any of its subsidiaries or affiliates and should not form the basis
of, or be relied on in connection with, any contract or commitment or investment decision whatsoever. This document is not financial, legal, tax, investment or other product advice.
This presentation contains statements of future expectations and other forward-looking statements which involve risks and uncertainties. These statements include descriptions
regarding the intent, belief or current expectations of the Company or its officers with respect to the consolidated results of operations and financial condition, and future events and
plans of the Company. These statements can be recognized by the use of words such as “expects,” “plans,” “will,” “estimates,” or words of similar meaning. Such forward-looking
statements are not guarantees of future performance and actual results, performances or events may differ from those in the forward-looking statements as a result of various
factors and assumptions. You are cautioned not to place undue reliance on these forward looking statements, which are based on the current view of the management of the
Company on future events. No assurance can be given that future events will occur, or that assumptions are correct. The Company does not assume any responsibility to amend,
modify or revise any forward-looking statements, on the basis of any subsequent developments, information or events, or otherwise.
This presentation is not an offer of securities for sale in the United States or in any other jurisdiction. Securities may not be offered or sold in the United States absent registration or
an exemption from registration under the U.S Securities Act of 1933, as amended.
Any reference herein to "the Company" shall mean Welspun India Limited, together with its consolidated subsidiaries.
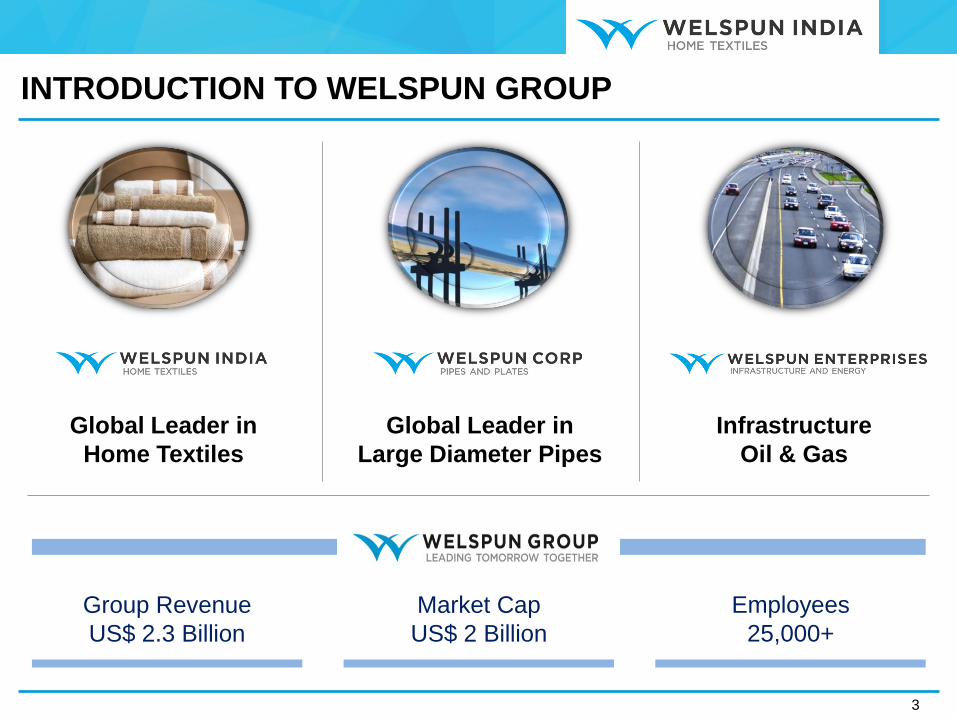
INTRODUCTION TO WELSPUN GROUP
3
Global Leader in
Large Diameter Pipes
Global Leader in
Home Textiles
Infrastructure
Oil & Gas
Employees
25,000+
Market Cap
US$ 2 Billion
Group Revenue
US$ 2.3 Billion
AGENDA
1. Welspun India: An Introduction
2. Industry Overview
3. Welspun India: Key Differentiators
4. Welspun 2.0 & Way Forward
5. Key Strategic Initiatives
6. Sustainability Initiatives
4
AGENDA
5
WELSPUN INDIA:
AN INTRODUCTION
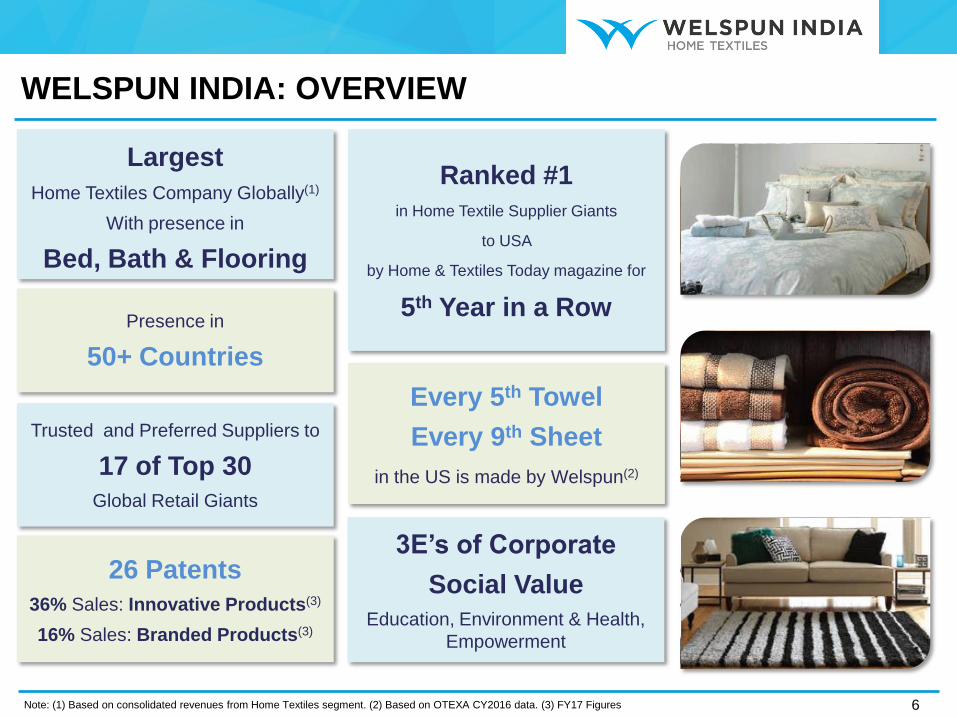
WELSPUN INDIA: OVERVIEW
6
Trusted and Preferred Suppliers to
17 of Top 30
Global Retail Giants
Ranked #1
in Home Textile Supplier Giants
to USA
by Home & Textiles Today magazine for
5th Year in a Row
Largest Home Textiles Company Globally(1)
With presence in
Bed, Bath & Flooring
Every 5th Towel
Every 9th Sheet
in the US is made by Welspun(2)
Presence in
50+ Countries
Note: (1) Based on consolidated revenues from Home Textiles segment. (2) Based on OTEXA CY2016 data. (3) FY17 Figures
26 Patents
36% Sales: Innovative Products(3)
16% Sales: Branded Products(3)
3E’s of Corporate
Social Value
Education, Environment & Health,
Empowerment
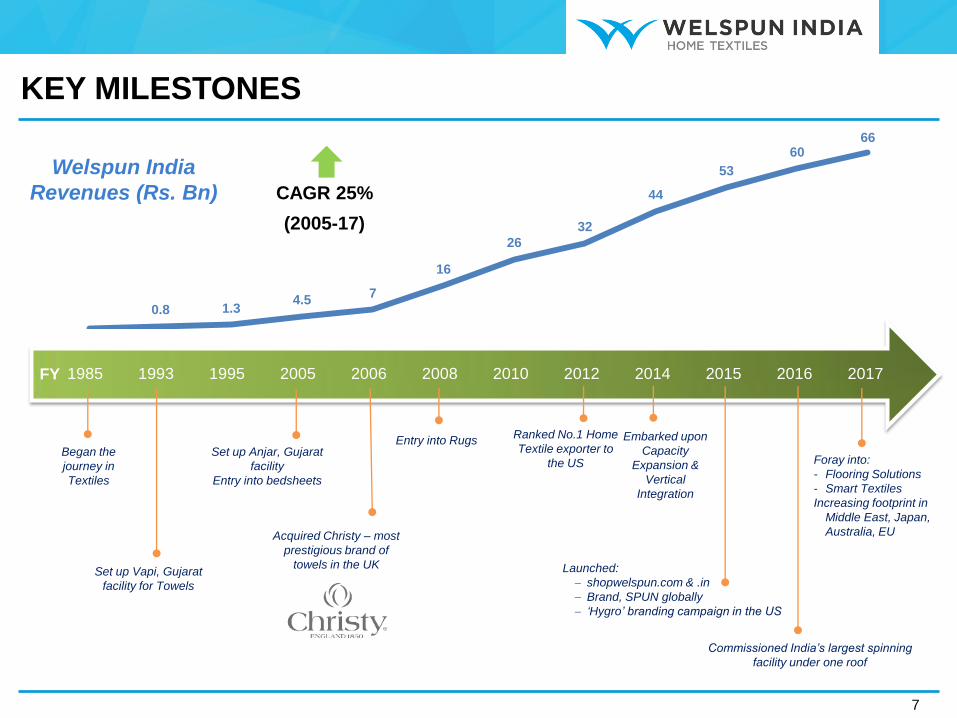
0.8 1.3 4.5
7
16
26
32
44
53
60 66
KEY MILESTONES
7
2010 1995
Set up Vapi, Gujarat
facility for Towels
1993
Embarked upon
Capacity
Expansion &
Vertical
Integration
2014
Began the
journey in
Textiles
1985
Acquired Christy – most
prestigious brand of
towels in the UK
2006
Launched:
shopwelspun.com & .in
Brand, SPUN globally
‘Hygro’ branding campaign in the US
2015
Commissioned India’s largest spinning
facility under one roof
2016
Entry into Rugs
2008
Welspun India
Revenues (Rs. Bn)
2017
Foray into:
- Flooring Solutions
- Smart Textiles
Increasing footprint in
Middle East, Japan,
Australia, EU
CAGR 25%
(2005-17)
2012
Ranked No.1 Home
Textile exporter to
the US
FY 2005
Set up Anjar, Gujarat
facility
Entry into bedsheets
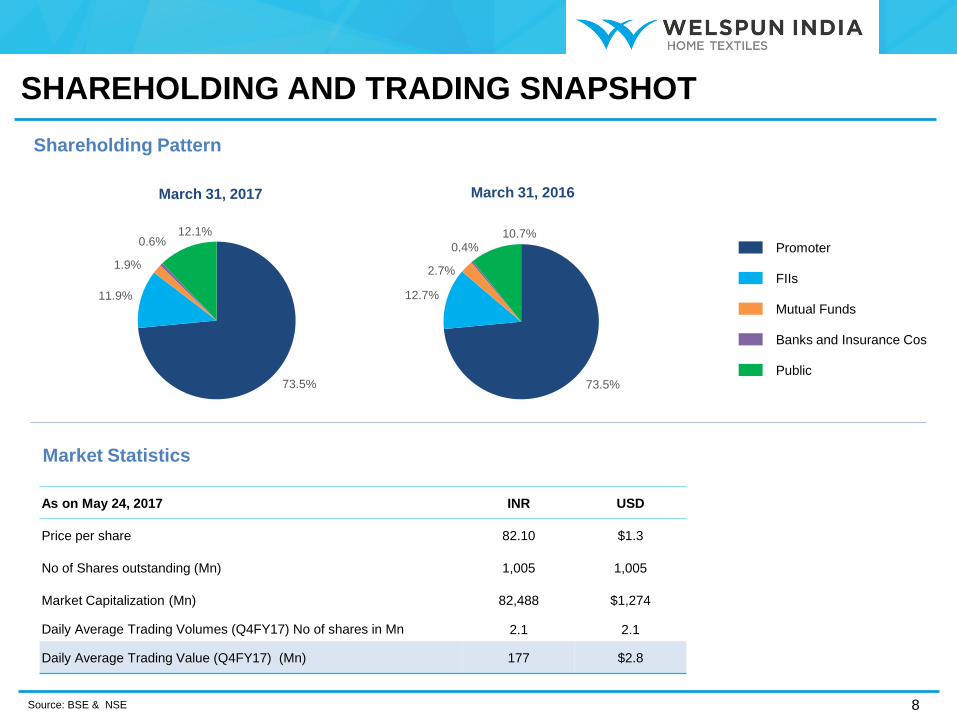
73.5%
11.9%
1.9%
0.6% 12.1%
73.5%
12.7%
2.7%
0.4% 10.7%
Shareholding Pattern
Market Statistics
As on May 24, 2017 INR USD
Price per share 82.10 $1.3
No of Shares outstanding (Mn) 1,005 1,005
Market Capitalization (Mn) 82,488 $1,274
Daily Average Trading Volumes (Q4FY17) No of shares in Mn 2.1 2.1
Daily Average Trading Value (Q4FY17) (Mn) 177 $2.8
March 31, 2017 March 31, 2016
Promoter
FIIs
Mutual Funds
Banks and Insurance Cos
Public
8 Source: BSE & NSE
SHAREHOLDING AND TRADING SNAPSHOT
AGENDA
9
INDUSTRY OVERVIEW
10
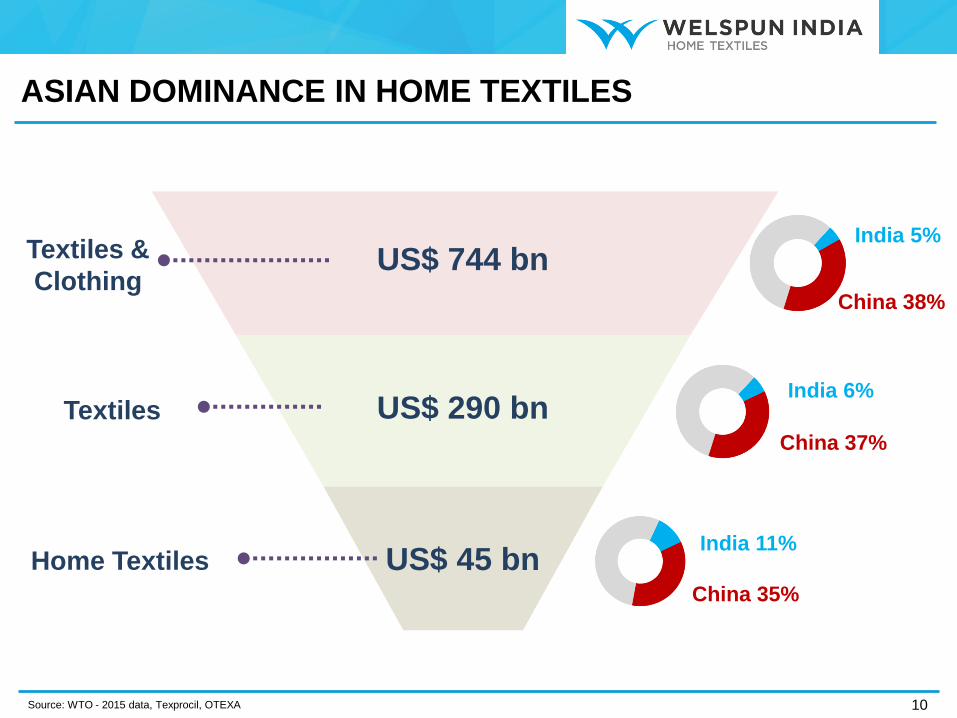
ASIAN DOMINANCE IN HOME TEXTILES
Source: WTO - 2015 data, Texprocil, OTEXA
India 5%
China 38%
India 6%
China 37%
India 11%
China 35%
Textiles
Textiles &
Clothing
Home Textiles
US$ 744 bn
US$ 290 bn
US$ 45 bn
Strong Presence of India Next Opportunity for India
11
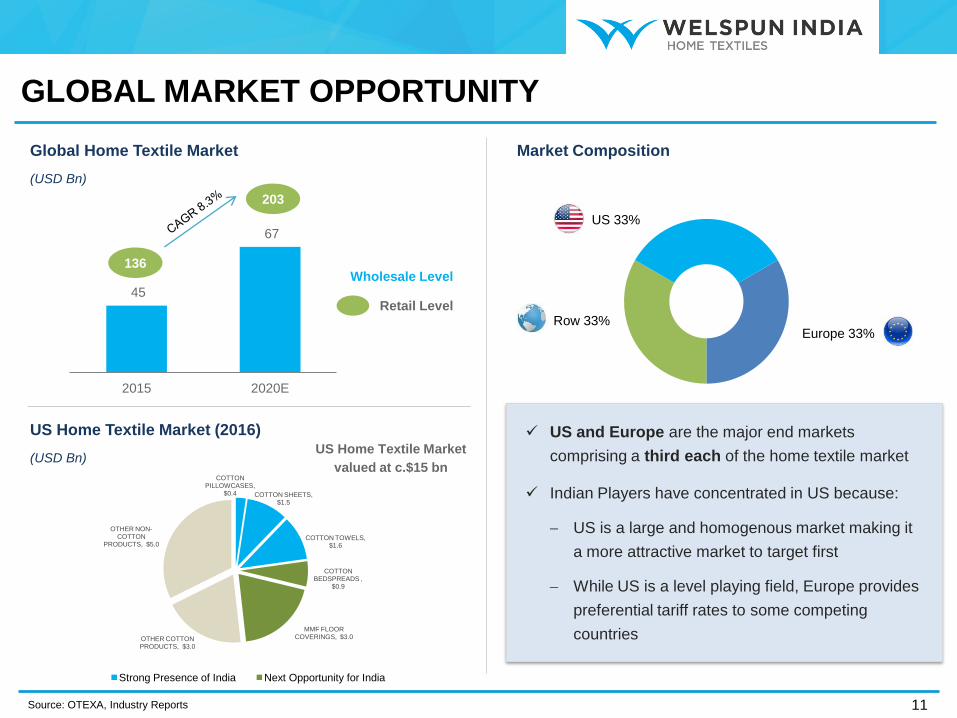
GLOBAL MARKET OPPORTUNITY
Global Home Textile Market
(USD Bn)
US and Europe are the major end markets
comprising a third each of the home textile market
Indian Players have concentrated in US because:
US is a large and homogenous market making it
a more attractive market to target first
While US is a level playing field, Europe provides
preferential tariff rates to some competing
countries
45
67
2015 2020E
Wholesale Level 136
203
Retail Level
Market Composition
Europe 33%
US 33%
Row 33%
Source: OTEXA, Industry Reports
US Home Textile Market (2016)
(USD Bn)
COTTON PILLOWCASES,
$0.4 COTTON SHEETS, $1.5
COTTON TOWELS, $1.6
COTTON BEDSPREADS ,
$0.9
MMF FLOOR COVERINGS, $3.0 OTHER COTTON
PRODUCTS, $3.0
OTHER NON-COTTON
PRODUCTS, $5.0
US Home Textile Market
valued at c.$15 bn
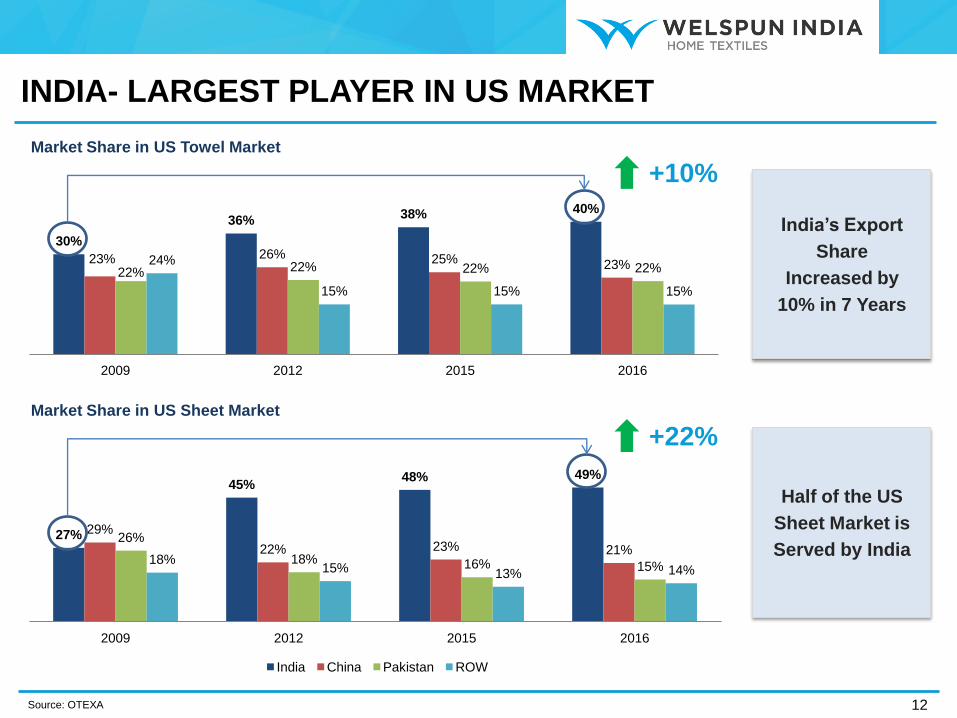
India’s Export
Share
Increased by
10% in 7 Years
27%
45% 48% 49%
29%
22% 23% 21% 26%
18% 16% 15% 18%
15% 13% 14%
2009 2012 2015 2016
India China Pakistan ROW
30%
36% 38% 40%
23% 26% 25% 23% 22% 22% 22% 22%
24%
15% 15% 15%
2009 2012 2015 2016
12
INDIA- LARGEST PLAYER IN US MARKET
Market Share in US Towel Market
Market Share in US Sheet Market
Half of the US
Sheet Market is
Served by India
Source: OTEXA
+10%
+22%
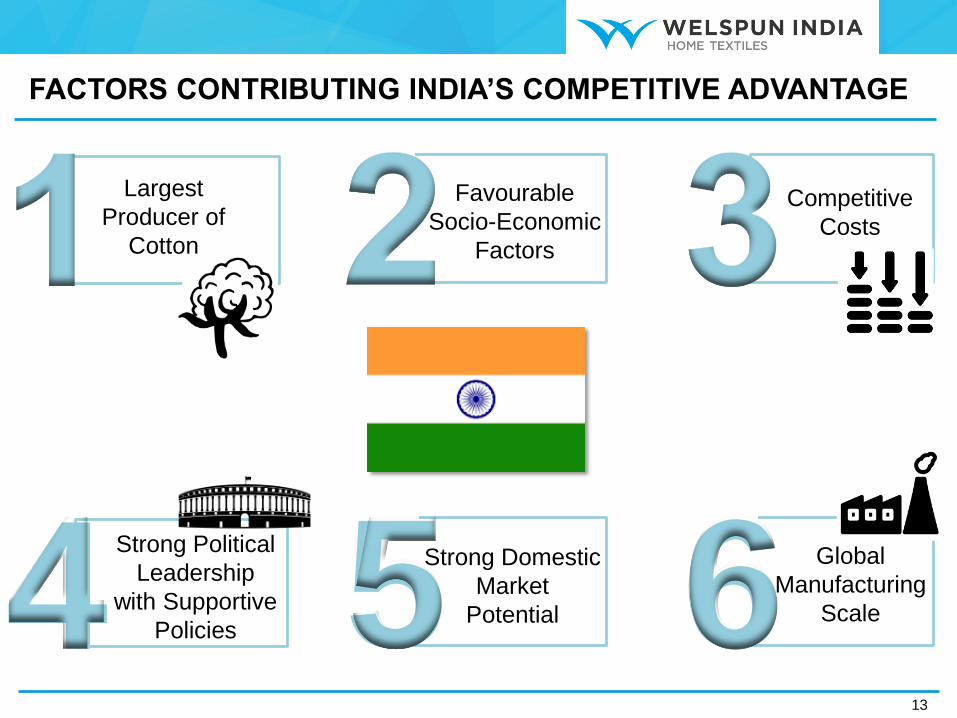
13
4 5 6
Largest
Producer of
Cotton
Strong Political
Leadership
with Supportive
Policies
Strong Domestic
Market
Potential
Global
Manufacturing
Scale
Favourable
Socio-Economic
Factors
Competitive
Costs
FACTORS CONTRIBUTING INDIA’S COMPETITIVE ADVANTAGE
AGENDA
14
WELSPUN INDIA:
KEY
DIFFERENTIATORS
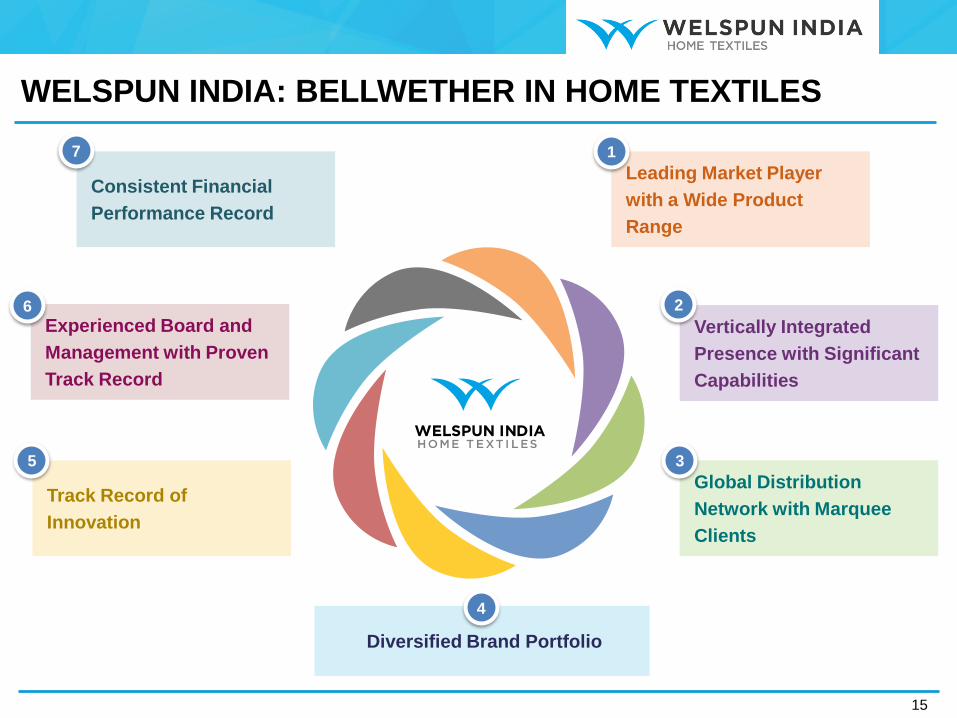
15
Leading Market Player
with a Wide Product
Range
1
Diversified Brand Portfolio
4
Experienced Board and
Management with Proven
Track Record
6
Consistent Financial
Performance Record
7
Vertically Integrated
Presence with Significant
Capabilities
2
Global Distribution
Network with Marquee
Clients
3
Track Record of
Innovation
5
WELSPUN INDIA: BELLWETHER IN HOME TEXTILES
16
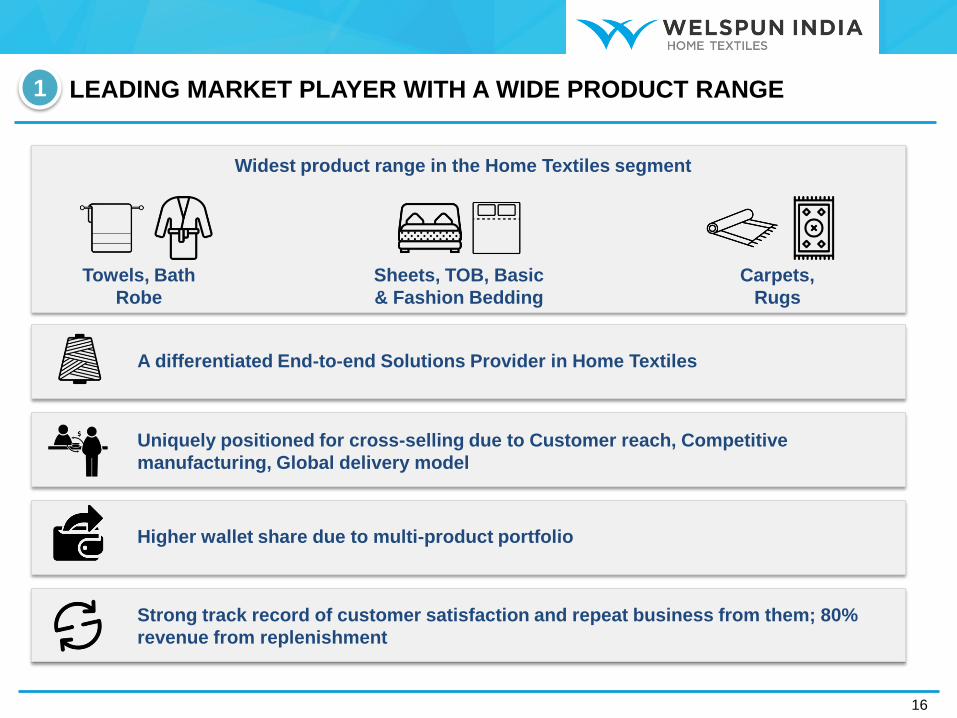
LEADING MARKET PLAYER WITH A WIDE PRODUCT RANGE 1
Widest product range in the Home Textiles segment
Towels, Bath
Robe
Sheets, TOB, Basic
& Fashion Bedding
Carpets,
Rugs
A differentiated End-to-end Solutions Provider in Home Textiles
Uniquely positioned for cross-selling due to Customer reach, Competitive
manufacturing, Global delivery model
Higher wallet share due to multi-product portfolio
Strong track record of customer satisfaction and repeat business from them; 80%
revenue from replenishment
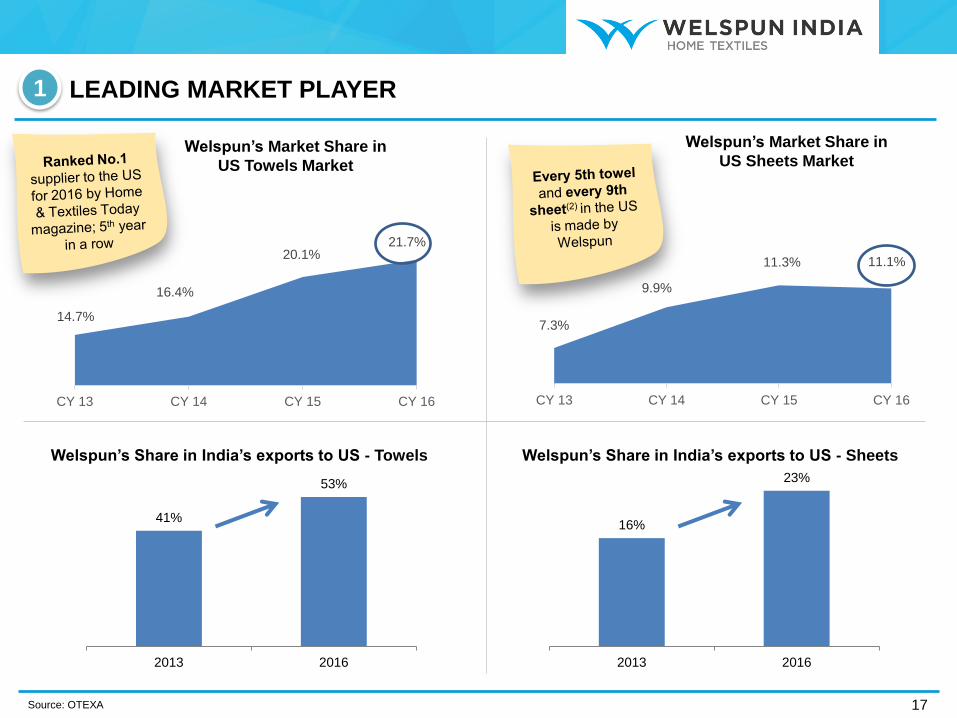
14.7%
16.4%
20.1% 21.7%
CY 13 CY 14 CY 15 CY 16
LEADING MARKET PLAYER
17
1
7.3%
9.9%
11.3% 11.1%
CY 13 CY 14 CY 15 CY 16
Welspun’s Market Share in
US Towels Market
Welspun’s Market Share in
US Sheets Market
Source: OTEXA
Welspun’s Share in India’s exports to US - Towels Welspun’s Share in India’s exports to US - Sheets
41%
53%
2013 2016
16%
23%
2013 2016
18
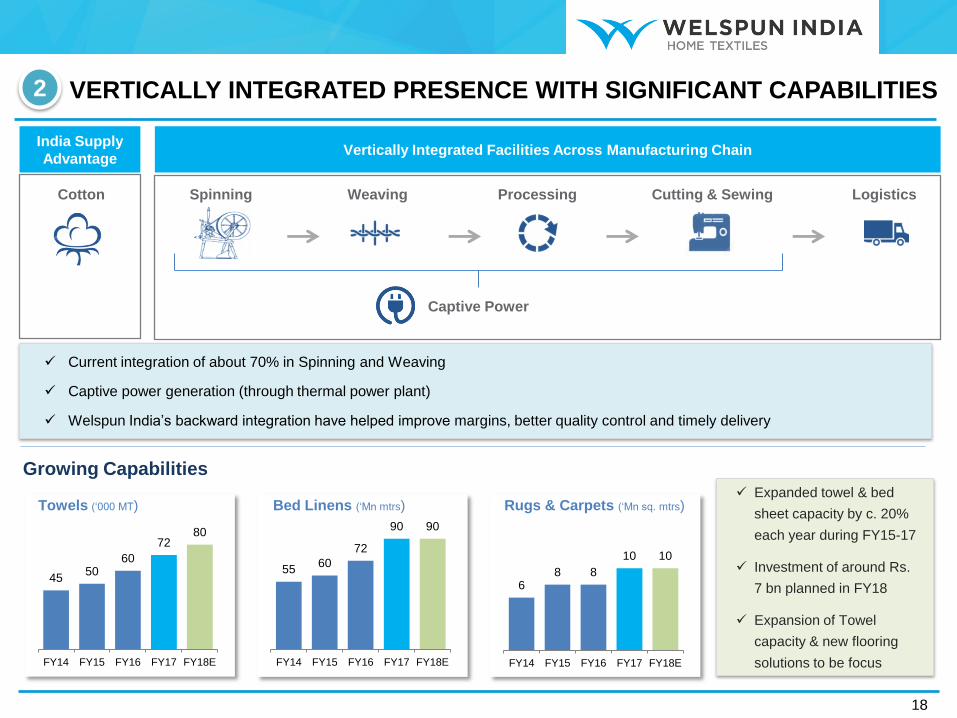
Growing Capabilities
Expanded towel & bed
sheet capacity by c. 20%
each year during FY15-17
Investment of around Rs.
7 bn planned in FY18
Expansion of Towel
capacity & new flooring
solutions to be focus
Cotton Spinning Weaving Processing Cutting & Sewing Logistics
India Supply
Advantage Vertically Integrated Facilities Across Manufacturing Chain
Current integration of about 70% in Spinning and Weaving
Captive power generation (through thermal power plant)
Welspun India’s backward integration have helped improve margins, better quality control and timely delivery
45 50
60
72 80
FY14 FY15 FY16 FY17 FY18E
Towels (‘000 MT)
55 60
72
90 90
FY14 FY15 FY16 FY17 FY18E
Bed Linens (‘Mn mtrs)
6 8 8
10 10
FY14 FY15 FY16 FY17 FY18E
Rugs & Carpets (‘Mn sq. mtrs)
VERTICALLY INTEGRATED PRESENCE WITH SIGNIFICANT CAPABILITIES 2
Captive Power
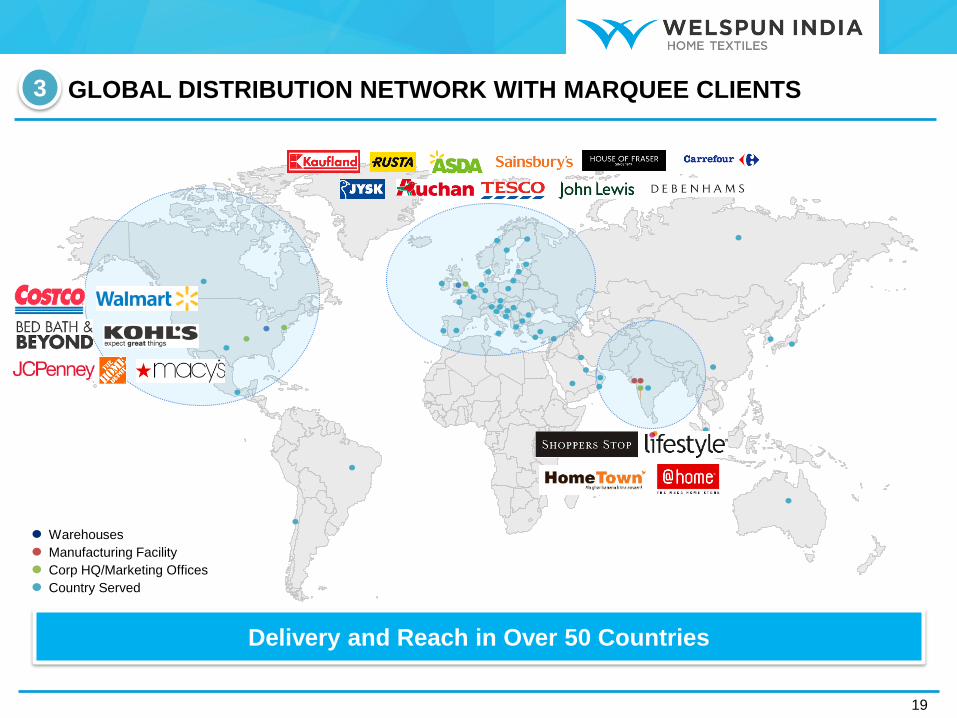
GLOBAL DISTRIBUTION NETWORK WITH MARQUEE CLIENTS
19
3
Delivery and Reach in Over 50 Countries
Country Served
Corp HQ/Marketing Offices
Manufacturing Facility
Warehouses
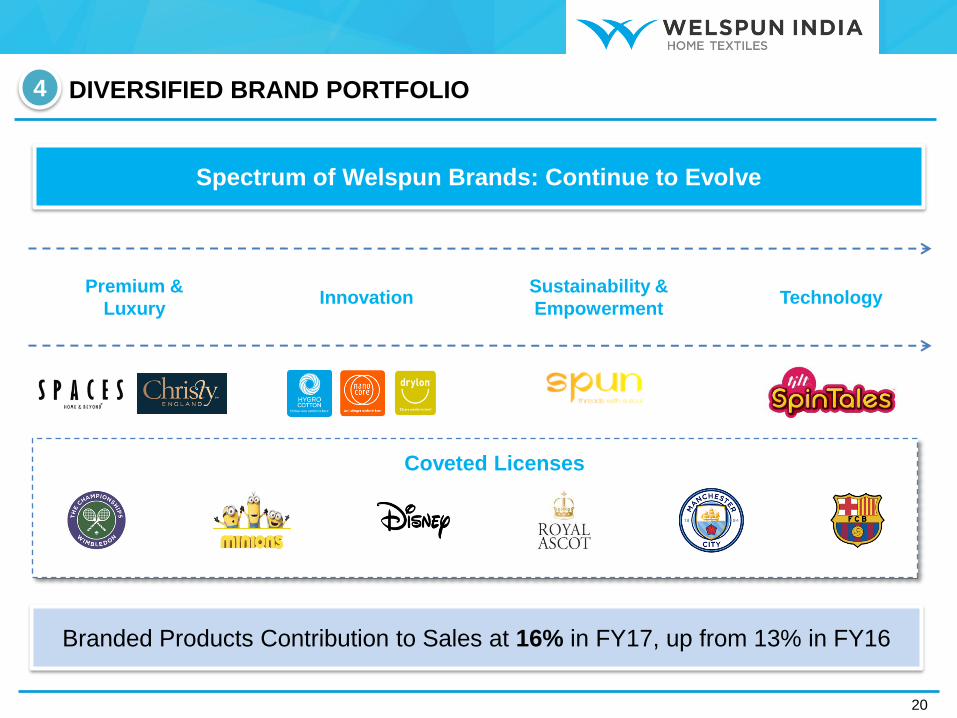
DIVERSIFIED BRAND PORTFOLIO
20
4
Spectrum of Welspun Brands: Continue to Evolve
Premium &
Luxury Innovation
Sustainability &
Empowerment Technology
Coveted Licenses
Branded Products Contribution to Sales at 16% in FY17, up from 13% in FY16
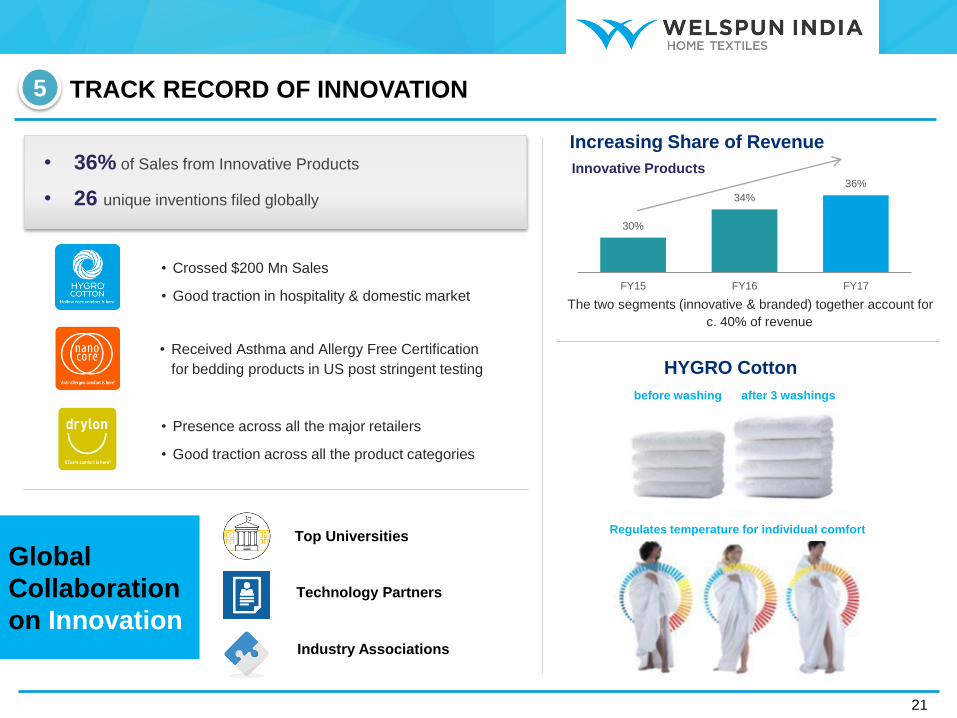
TRACK RECORD OF INNOVATION
21
5
• 36% of Sales from Innovative Products
• 26 unique inventions filed globally
• Crossed $200 Mn Sales
• Good traction in hospitality & domestic market
• Received Asthma and Allergy Free Certification
for bedding products in US post stringent testing
• Presence across all the major retailers
• Good traction across all the product categories
Global
Collaboration
on Innovation
Top Universities
Technology Partners
Industry Associations
Increasing Share of Revenue
30%
34%
36%
FY15 FY16 FY17
Innovative Products
The two segments (innovative & branded) together account for
c. 40% of revenue
HYGRO Cotton
Regulates temperature for individual comfort
before washing after 3 washings
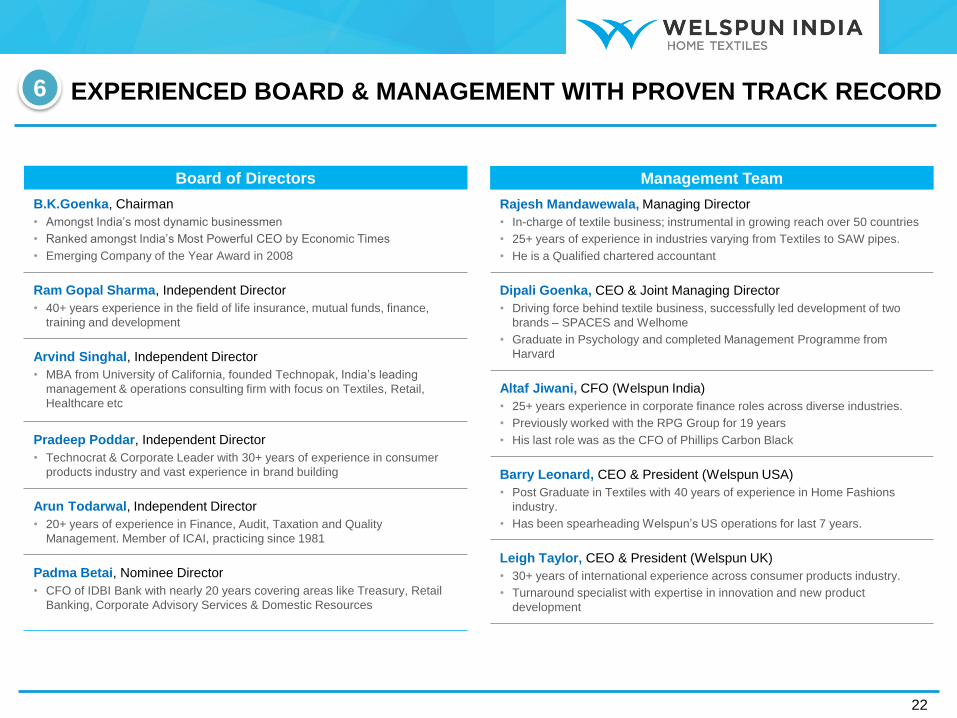
EXPERIENCED BOARD & MANAGEMENT WITH PROVEN TRACK RECORD 6
22
B.K.Goenka, Chairman
• Amongst India’s most dynamic businessmen
• Ranked amongst India’s Most Powerful CEO by Economic Times
• Emerging Company of the Year Award in 2008
Ram Gopal Sharma, Independent Director
• 40+ years experience in the field of life insurance, mutual funds, finance,
training and development
Arvind Singhal, Independent Director
• MBA from University of California, founded Technopak, India’s leading
management & operations consulting firm with focus on Textiles, Retail,
Healthcare etc
Pradeep Poddar, Independent Director
• Technocrat & Corporate Leader with 30+ years of experience in consumer
products industry and vast experience in brand building
Arun Todarwal, Independent Director
• 20+ years of experience in Finance, Audit, Taxation and Quality
Management. Member of ICAI, practicing since 1981
Padma Betai, Nominee Director
• CFO of IDBI Bank with nearly 20 years covering areas like Treasury, Retail
Banking, Corporate Advisory Services & Domestic Resources
Board of Directors
Rajesh Mandawewala, Managing Director
• In-charge of textile business; instrumental in growing reach over 50 countries
• 25+ years of experience in industries varying from Textiles to SAW pipes.
• He is a Qualified chartered accountant
Dipali Goenka, CEO & Joint Managing Director
• Driving force behind textile business, successfully led development of two
brands – SPACES and Welhome
• Graduate in Psychology and completed Management Programme from
Harvard
Altaf Jiwani, CFO (Welspun India)
• 25+ years experience in corporate finance roles across diverse industries.
• Previously worked with the RPG Group for 19 years
• His last role was as the CFO of Phillips Carbon Black
Barry Leonard, CEO & President (Welspun USA)
• Post Graduate in Textiles with 40 years of experience in Home Fashions
industry.
• Has been spearheading Welspun’s US operations for last 7 years.
Leigh Taylor, CEO & President (Welspun UK)
• 30+ years of international experience across consumer products industry.
• Turnaround specialist with expertise in innovation and new product
development
Management Team
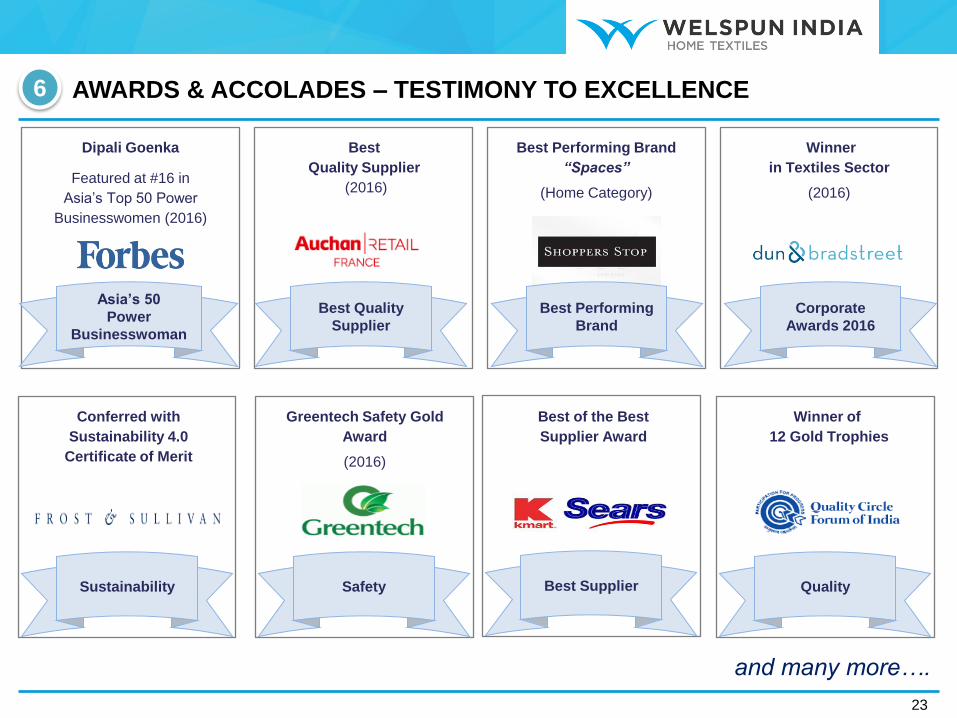
AWARDS & ACCOLADES – TESTIMONY TO EXCELLENCE
23
Asia’s 50
Power
Businesswoman
Best Quality
Supplier
Best Performing
Brand
Corporate
Awards 2016
Best Performing Brand
“Spaces”
(Home Category)
Dipali Goenka
Featured at #16 in
Asia’s Top 50 Power
Businesswomen (2016)
Best
Quality Supplier
(2016)
Winner
in Textiles Sector
(2016)
Conferred with
Sustainability 4.0
Certificate of Merit
Quality
Winner of
12 Gold Trophies
Sustainability
and many more….
Best Supplier
Best of the Best
Supplier Award
Safety
Greentech Safety Gold
Award
(2016)
6
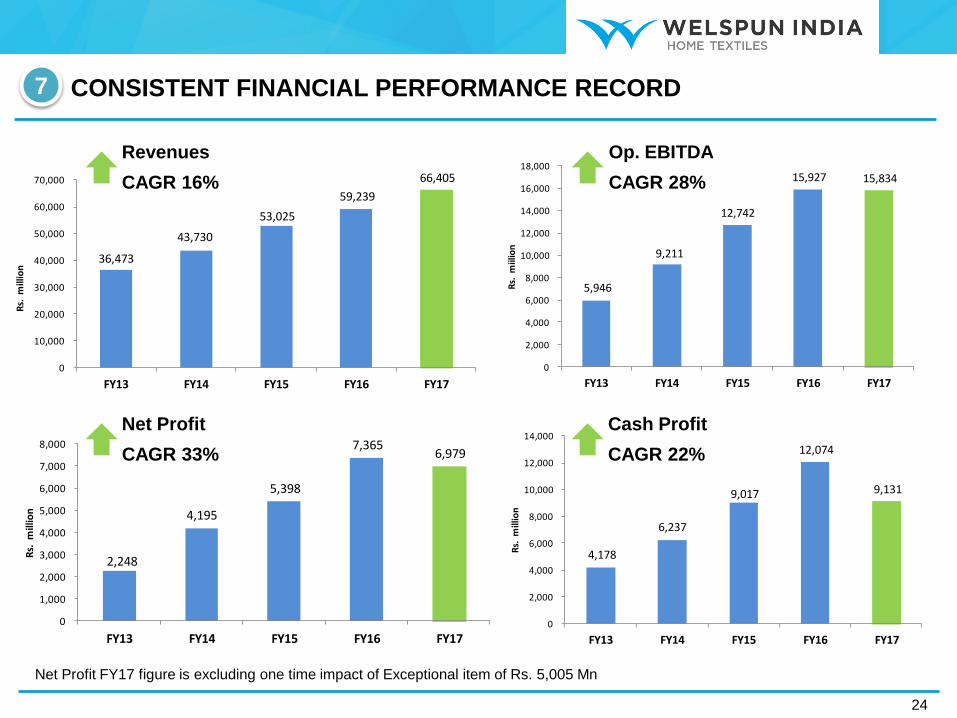
5,946
9,211
12,742
15,927 15,834
0
2,000
4,000
6,000
8,000
10,000
12,000
14,000
16,000
18,000
FY13 FY14 FY15 FY16 FY17
Rs.
miil
ion
36,473
43,730
53,025
59,239
66,405
0
10,000
20,000
30,000
40,000
50,000
60,000
70,000
FY13 FY14 FY15 FY16 FY17
Rs.
mill
ion
4,178
6,237
9,017
12,074
9,131
0
2,000
4,000
6,000
8,000
10,000
12,000
14,000
FY13 FY14 FY15 FY16 FY17
Rs.
mill
ion
2,248
4,195
5,398
7,365 6,979
0
1,000
2,000
3,000
4,000
5,000
6,000
7,000
8,000
FY13 FY14 FY15 FY16 FY17
Rs.
mill
ion
Net Profit FY17 figure is excluding one time impact of Exceptional item of Rs. 5,005 Mn
24
Revenues
CAGR 16%
Op. EBITDA
CAGR 28%
Net Profit
CAGR 33%
Cash Profit
CAGR 22%
7 CONSISTENT FINANCIAL PERFORMANCE RECORD
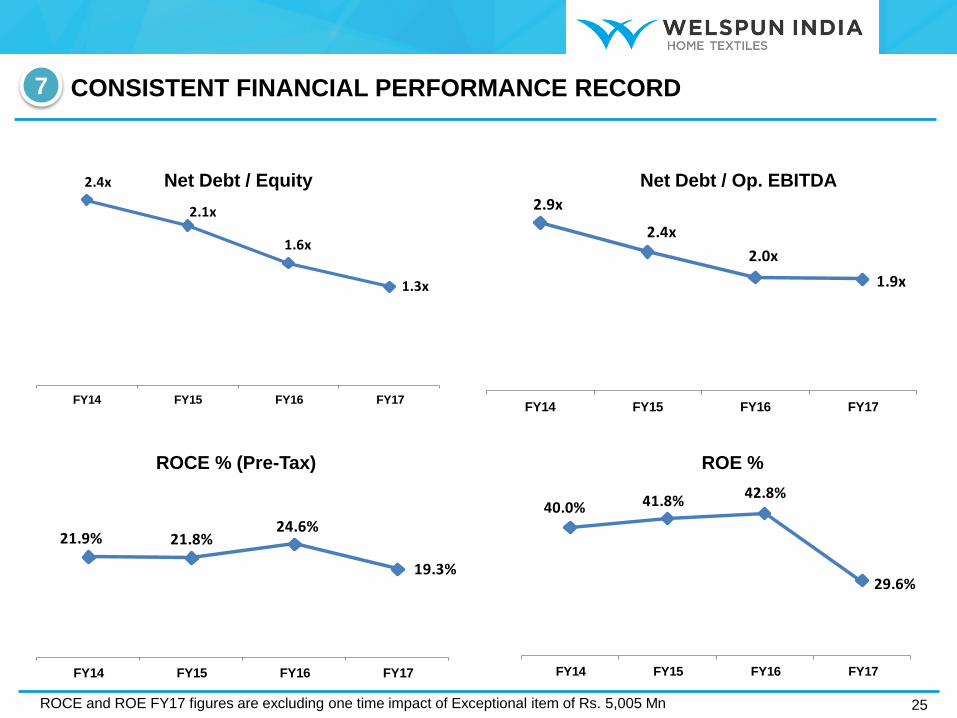
25 ROCE and ROE FY17 figures are excluding one time impact of Exceptional item of Rs. 5,005 Mn
21.9% 21.8%24.6%
19.3%
FY14 FY15 FY16 FY17
40.0% 41.8%42.8%
29.6%
FY14 FY15 FY16 FY17
2.4x
2.1x
1.6x
1.3x
FY14 FY15 FY16 FY17
2.9x
2.4x
2.0x
1.9x
FY14 FY15 FY16 FY17
ROCE % (Pre-Tax) ROE %
Net Debt / Equity Net Debt / Op. EBITDA
7 CONSISTENT FINANCIAL PERFORMANCE RECORD
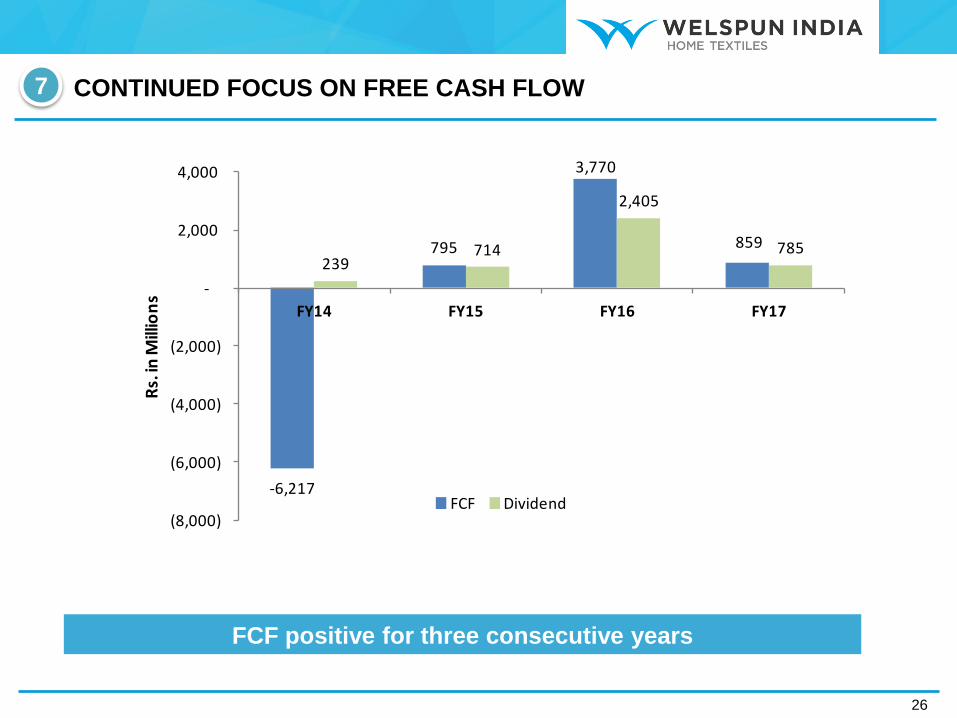
FCF positive for three consecutive years
26
-6,217
795
3,770
859
239714
2,405
785
(8,000)
(6,000)
(4,000)
(2,000)
-
2,000
4,000
FY14 FY15 FY16 FY17
Rs.
in M
illio
ns
FCF Dividend
7 CONTINUED FOCUS ON FREE CASH FLOW
AGENDA
27
WELSPUN 2.0
& WAY FORWARD
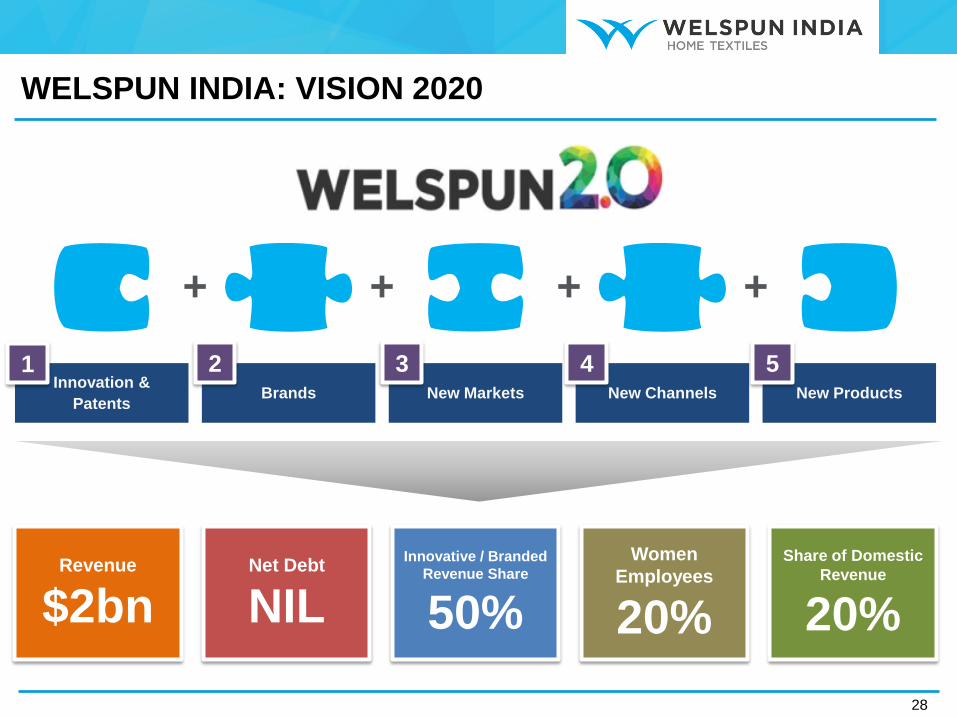
WELSPUN INDIA: VISION 2020
28
+ +
Innovation &
Patents Brands New Markets
Women
Employees
20%
Share of Domestic
Revenue
20%
Revenue
$2bn
Innovative / Branded
Revenue Share
50%
Net Debt
NIL
New Channels New Products
+ +
1 2 3 4 5
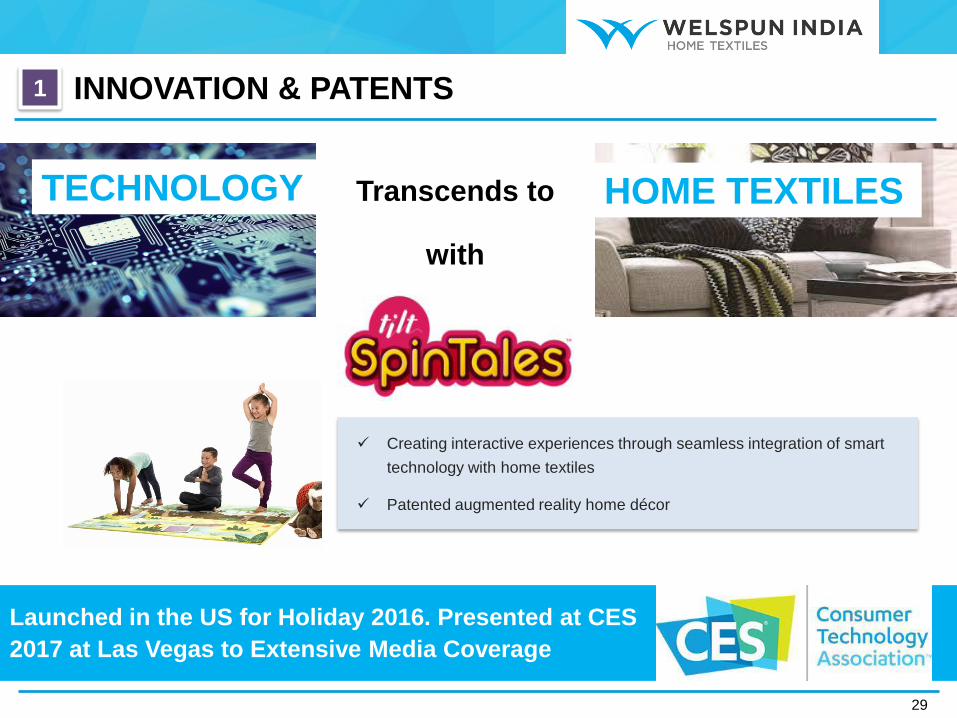
INNOVATION & PATENTS
29
1
TECHNOLOGY Transcends to
with
Launched in the US for Holiday 2016. Presented at CES
2017 at Las Vegas to Extensive Media Coverage
Creating interactive experiences through seamless integration of smart
technology with home textiles
Patented augmented reality home décor
HOME TEXTILES
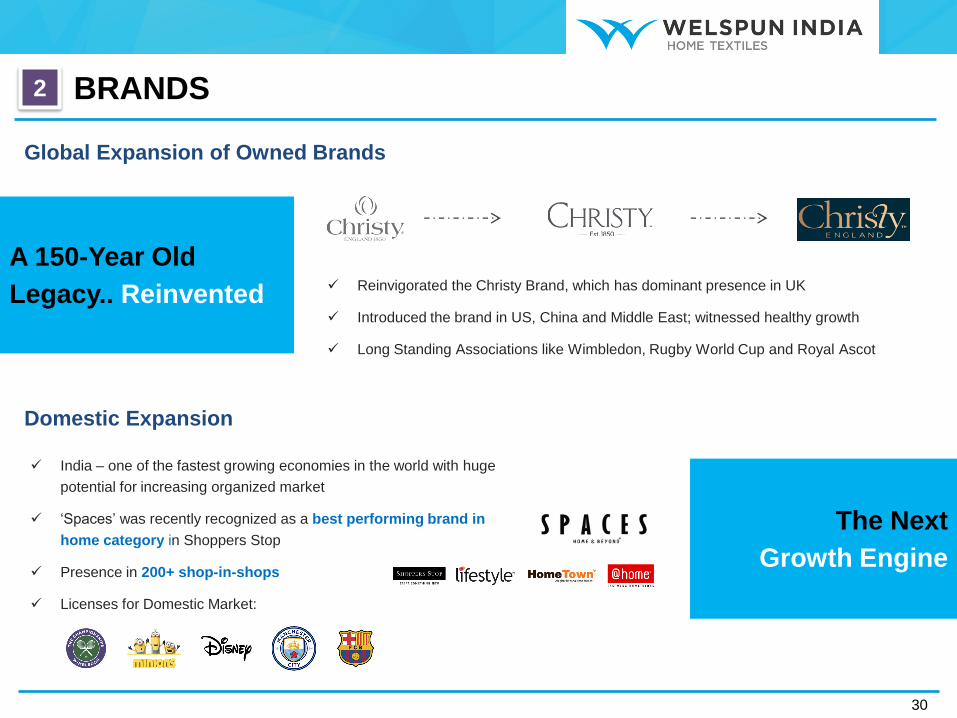
BRANDS
30
2
Reinvigorated the Christy Brand, which has dominant presence in UK
Introduced the brand in US, China and Middle East; witnessed healthy growth
Long Standing Associations like Wimbledon, Rugby World Cup and Royal Ascot
India – one of the fastest growing economies in the world with huge
potential for increasing organized market
‘Spaces’ was recently recognized as a best performing brand in
home category in Shoppers Stop
Presence in 200+ shop-in-shops
Licenses for Domestic Market:
Global Expansion of Owned Brands
Domestic Expansion
A 150-Year Old
Legacy.. Reinvented
The Next
Growth Engine
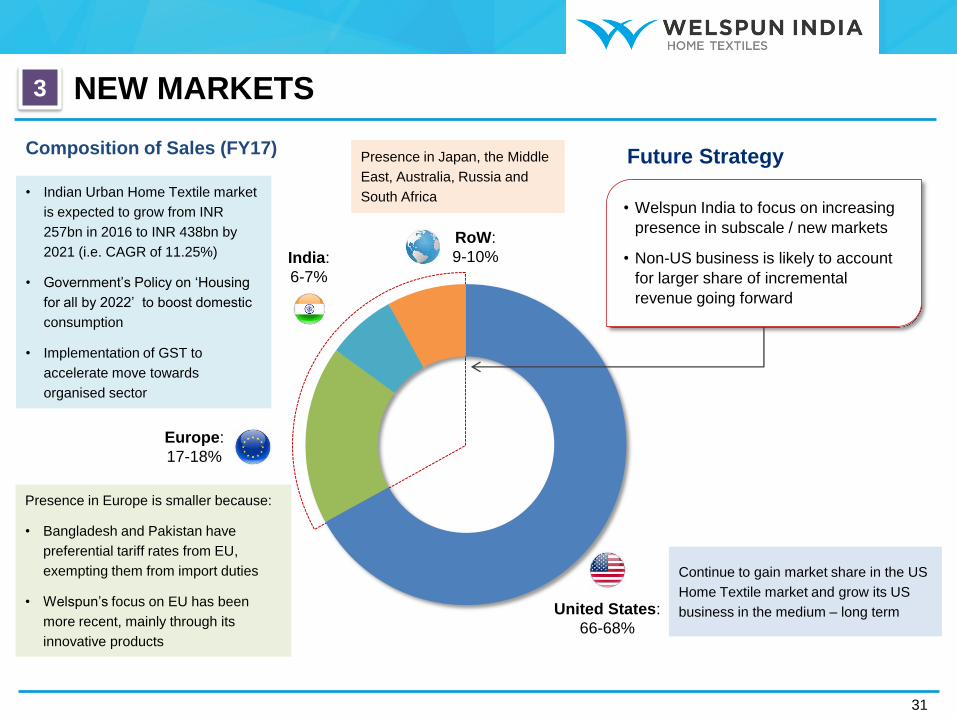
NEW MARKETS
31
3
United States:
66-68%
Europe:
17-18%
India:
6-7%
RoW:
9-10%
Presence in Japan, the Middle
East, Australia, Russia and
South Africa
Presence in Europe is smaller because:
• Bangladesh and Pakistan have
preferential tariff rates from EU,
exempting them from import duties
• Welspun’s focus on EU has been
more recent, mainly through its
innovative products
Continue to gain market share in the US
Home Textile market and grow its US
business in the medium – long term
• Welspun India to focus on increasing
presence in subscale / new markets
• Non-US business is likely to account
for larger share of incremental
revenue going forward
Future Strategy Composition of Sales (FY17)
• Indian Urban Home Textile market
is expected to grow from INR
257bn in 2016 to INR 438bn by
2021 (i.e. CAGR of 11.25%)
• Government’s Policy on ‘Housing
for all by 2022’ to boost domestic
consumption
• Implementation of GST to
accelerate move towards
organised sector
NEW CHANNELS
32
4
Hospitality and Healthcare
E-Commerce
The US hospitality and healthcare market is c. $1.5bn (i.e. for towels and sheets); Welspun currently
earns c. $50mn from these categories indicating huge growth potential
Focus on domestic as well as international markets
Tied up with leading hotel chains and wellness centers
Created Drop-Ship facility in US, UK & India
Leveraging distribution infrastructure to serve customers of:
Online channel of Brick & Mortar retailers
Online marketplaces
Own e-commerce portal (shopwelspun.in for India and shopwelspun.com for the US)
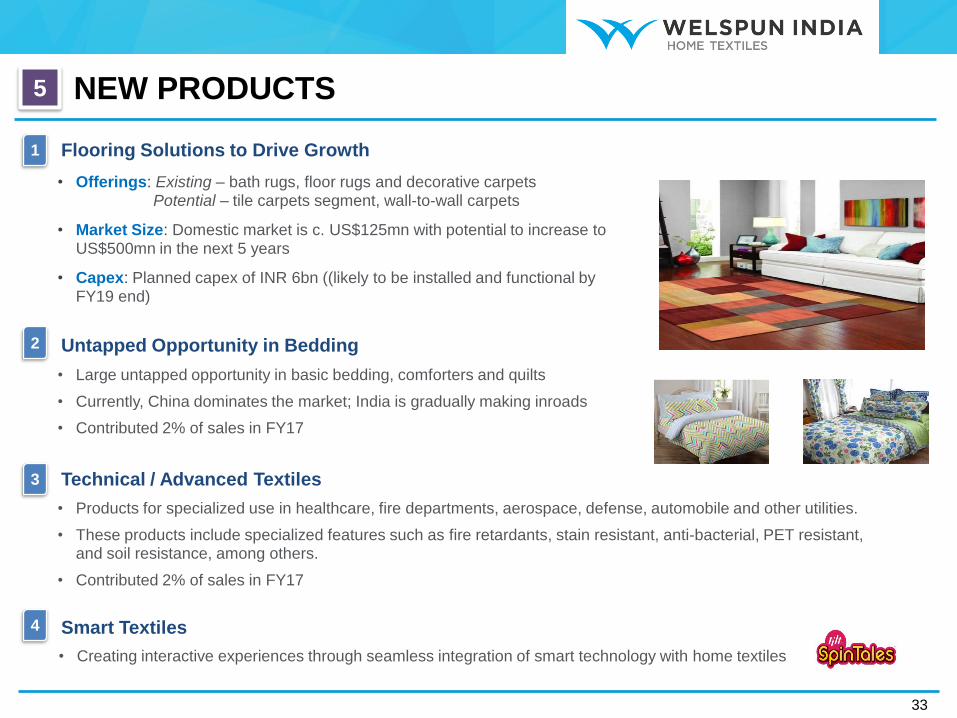
NEW PRODUCTS
33
5
Flooring Solutions to Drive Growth
• Offerings: Existing – bath rugs, floor rugs and decorative carpets Potential – tile carpets segment, wall-to-wall carpets
• Market Size: Domestic market is c. US$125mn with potential to increase to US$500mn in the next 5 years
• Capex: Planned capex of INR 6bn ((likely to be installed and functional by FY19 end)
1
Untapped Opportunity in Bedding
• Large untapped opportunity in basic bedding, comforters and quilts
• Currently, China dominates the market; India is gradually making inroads
• Contributed 2% of sales in FY17
2
Smart Textiles 4
• Creating interactive experiences through seamless integration of smart technology with home textiles
Technical / Advanced Textiles 3
• Products for specialized use in healthcare, fire departments, aerospace, defense, automobile and other utilities.
• These products include specialized features such as fire retardants, stain resistant, anti-bacterial, PET resistant, and soil resistance, among others.
• Contributed 2% of sales in FY17
AGENDA
34
KEY STRATEGIC
INITIATIVES
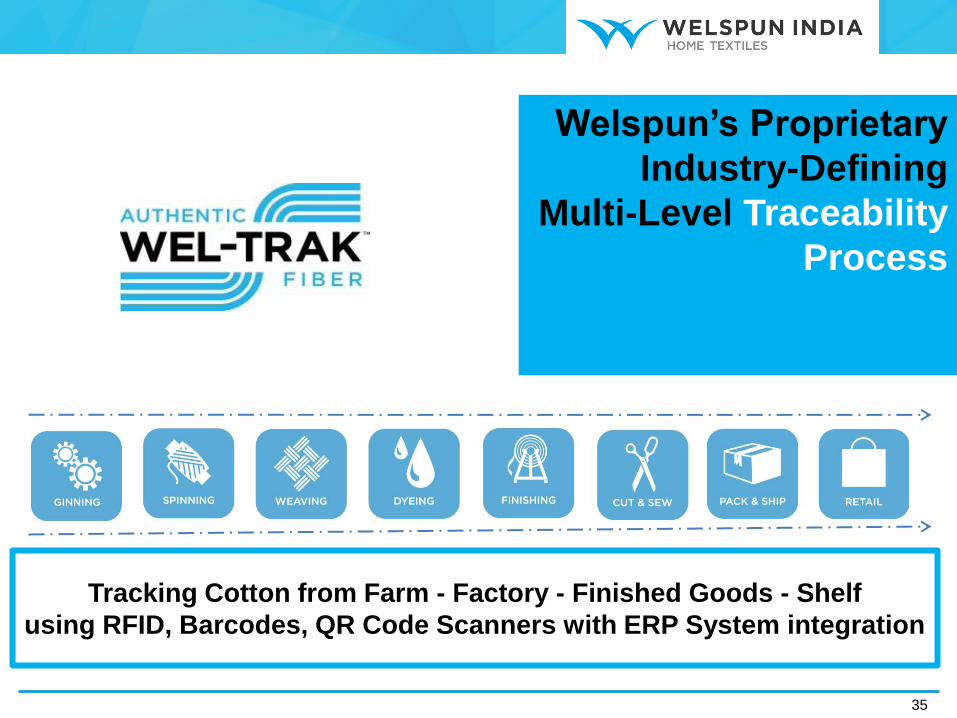
Welspun’s Proprietary
Industry-Defining
Multi-Level Traceability
Process
Tracking Cotton from Farm - Factory - Finished Goods - Shelf
using RFID, Barcodes, QR Code Scanners with ERP System integration
35
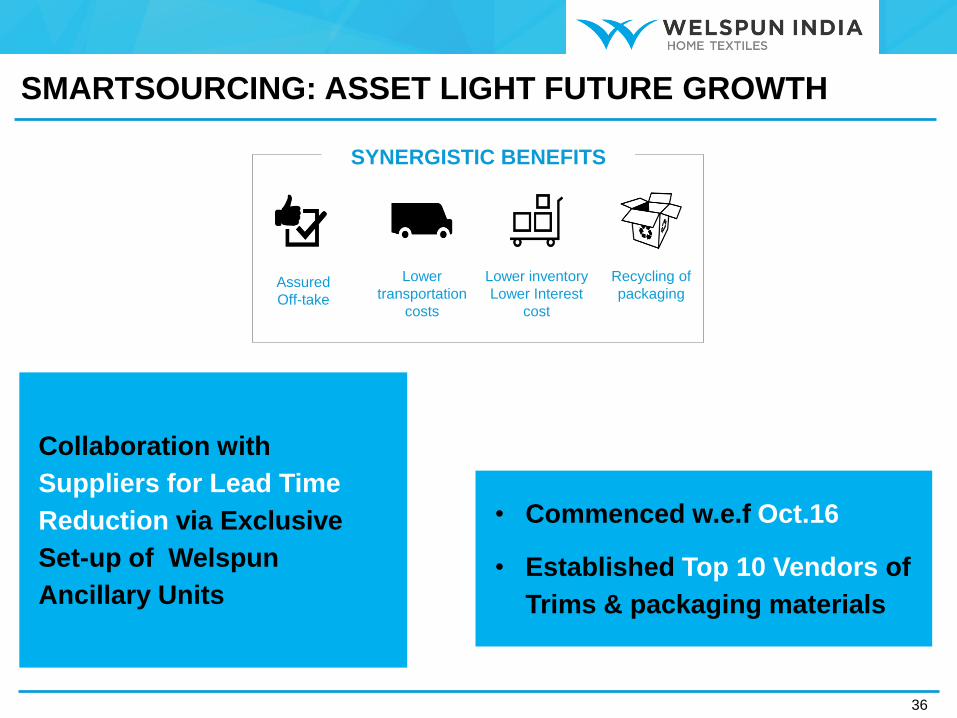
SMARTSOURCING: ASSET LIGHT FUTURE GROWTH
36
Collaboration with
Suppliers for Lead Time
Reduction via Exclusive
Set-up of Welspun
Ancillary Units
Assured
Off-take
Lower
transportation
costs
Lower inventory
Lower Interest
cost
Recycling of
packaging
SYNERGISTIC BENEFITS
• Commenced w.e.f Oct.16
• Established Top 10 Vendors of
Trims & packaging materials
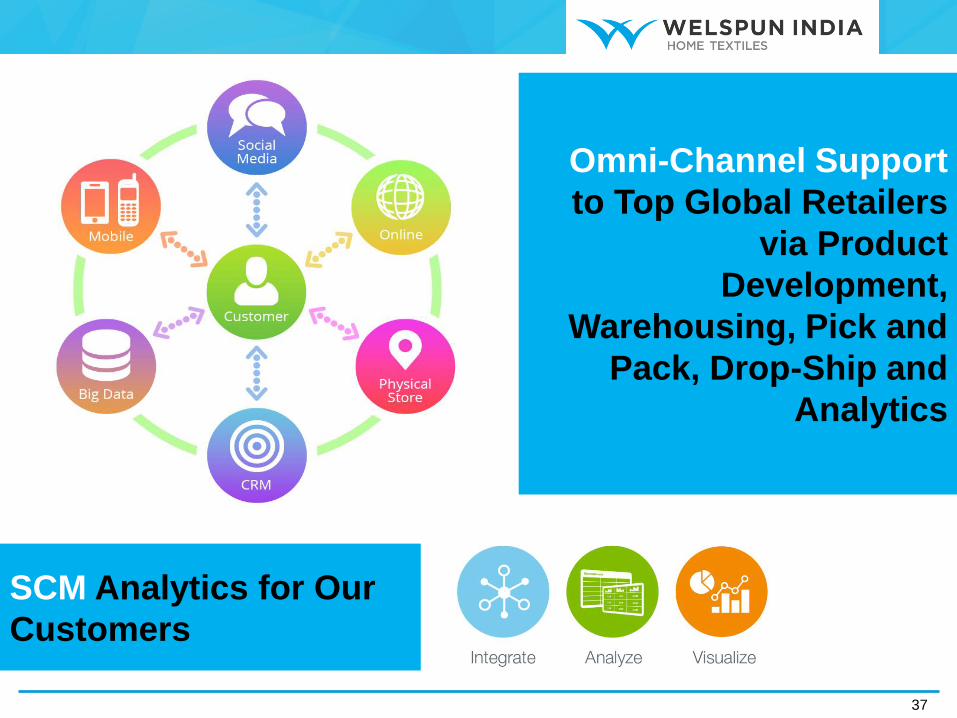
Omni-Channel Support
to Top Global Retailers
via Product
Development,
Warehousing, Pick and
Pack, Drop-Ship and
Analytics
SCM Analytics for Our
Customers
37
AGENDA
38
SUSTAINABILITY
INITIATIVES
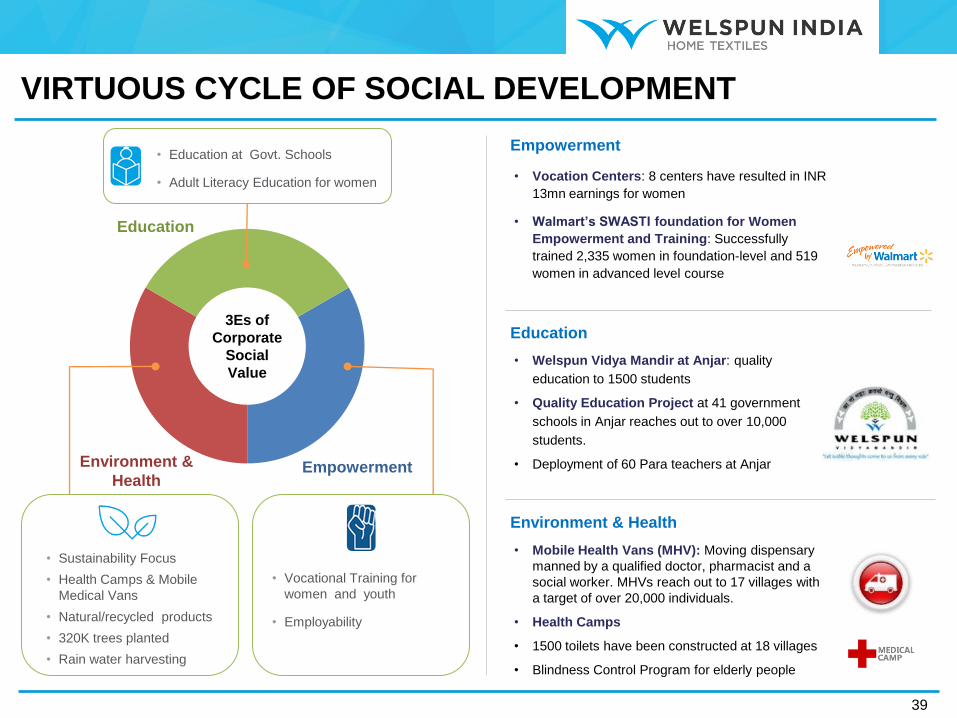
VIRTUOUS CYCLE OF SOCIAL DEVELOPMENT
39
• Sustainability Focus
• Health Camps & Mobile
Medical Vans
• Natural/recycled products
• 320K trees planted
• Rain water harvesting
• Vocational Training for
women and youth
• Employability
• Education at Govt. Schools
• Adult Literacy Education for women
3Es of
Corporate
Social
Value
Education
Empowerment Environment &
Health
Empowerment
Education
Environment & Health
• Vocation Centers: 8 centers have resulted in INR
13mn earnings for women
• Walmart’s SWASTI foundation for Women
Empowerment and Training: Successfully
trained 2,335 women in foundation-level and 519
women in advanced level course
• Welspun Vidya Mandir at Anjar: quality
education to 1500 students
• Quality Education Project at 41 government
schools in Anjar reaches out to over 10,000
students.
• Deployment of 60 Para teachers at Anjar
• Mobile Health Vans (MHV): Moving dispensary
manned by a qualified doctor, pharmacist and a
social worker. MHVs reach out to 17 villages with
a target of over 20,000 individuals.
• Health Camps
• 1500 toilets have been constructed at 18 villages
• Blindness Control Program for elderly people
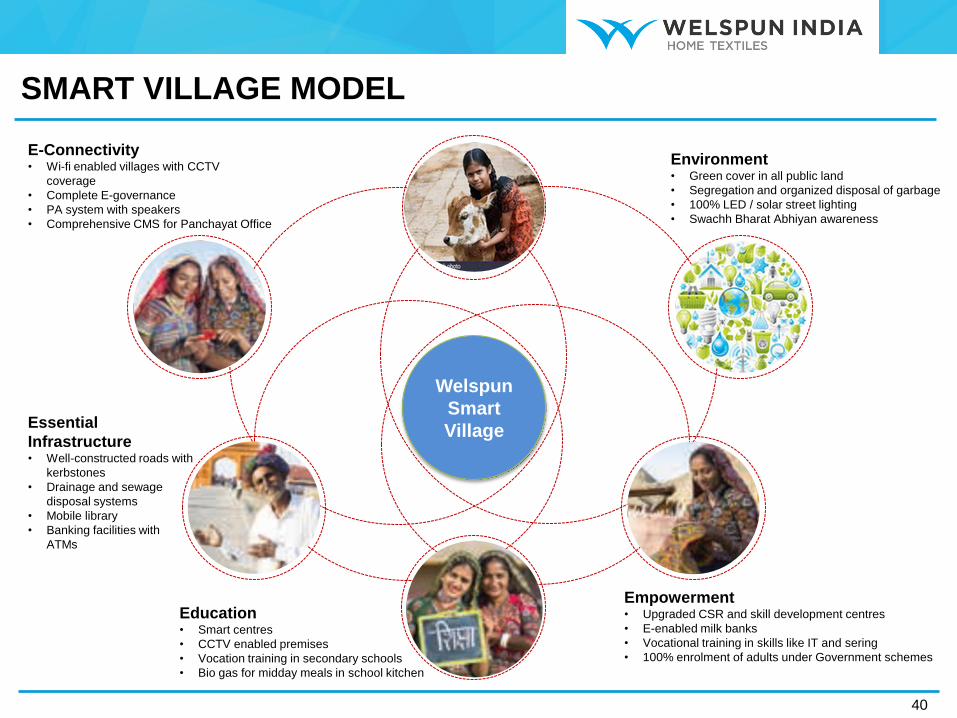
SMART VILLAGE MODEL
40
Welspun
Smart
Village
Environment • Green cover in all public land
• Segregation and organized disposal of garbage
• 100% LED / solar street lighting
• Swachh Bharat Abhiyan awareness
Empowerment • Upgraded CSR and skill development centres
• E-enabled milk banks
• Vocational training in skills like IT and sering
• 100% enrolment of adults under Government schemes
Education • Smart centres
• CCTV enabled premises
• Vocation training in secondary schools
• Bio gas for midday meals in school kitchen
Essential
Infrastructure • Well-constructed roads with
kerbstones
• Drainage and sewage
disposal systems
• Mobile library
• Banking facilities with
ATMs
E-Connectivity • Wi-fi enabled villages with CCTV
coverage
• Complete E-governance
• PA system with speakers
• Comprehensive CMS for Panchayat Office
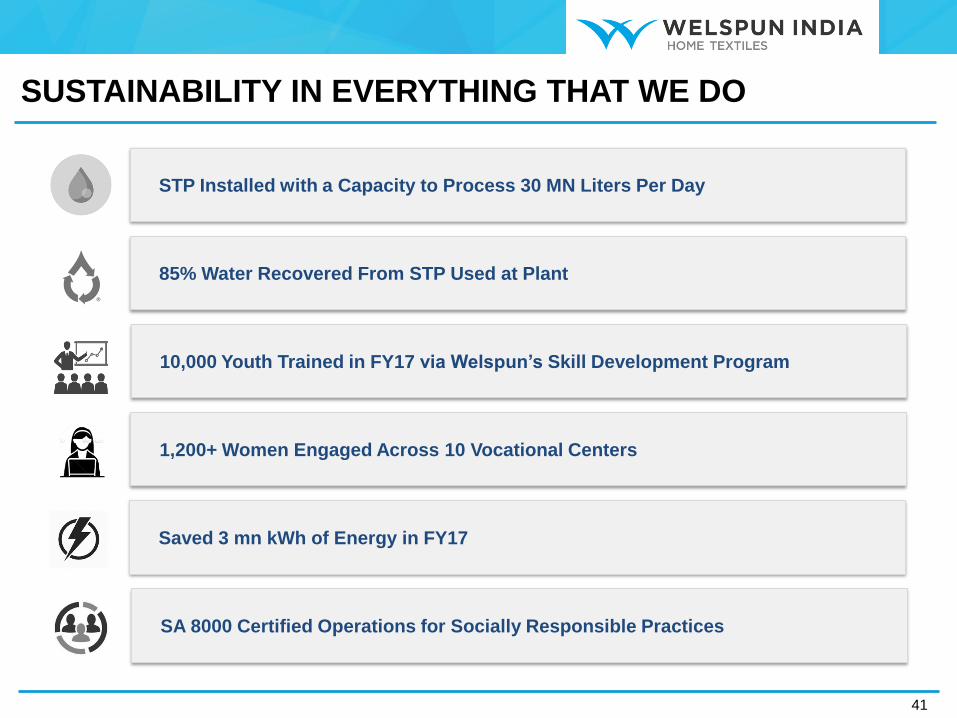
SUSTAINABILITY IN EVERYTHING THAT WE DO
SA 8000 Certified Operations for Socially Responsible Practices
STP Installed with a Capacity to Process 30 MN Liters Per Day
10,000 Youth Trained in FY17 via Welspun’s Skill Development Program
1,200+ Women Engaged Across 10 Vocational Centers
Saved 3 mn kWh of Energy in FY17
41
85% Water Recovered From STP Used at Plant
THANK YOU
42
For further details, please contact:
Harish Venkateswaran
Sr. General Manager - Group Finance and Strategy
Email: [email protected]
Altaf Jiwani
Director (Finance) & CFO - Welspun India Limited
Email: [email protected]
AGENDA
43
APPENDIX
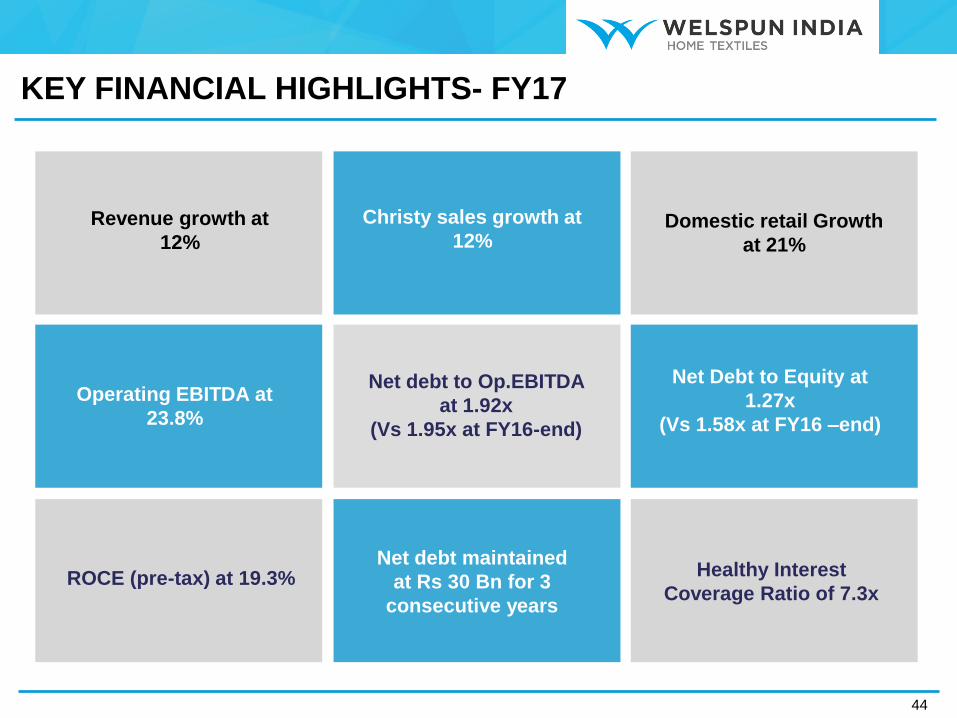
Operating EBITDA at
23.8%
Net Debt to Equity at
1.27x
(Vs 1.58x at FY16 –end)
Revenue growth at
12%
ROCE (pre-tax) at 19.3%
Net debt to Op.EBITDA
at 1.92x
(Vs 1.95x at FY16-end)
Christy sales growth at
12%
44
Net debt maintained
at Rs 30 Bn for 3
consecutive years
Domestic retail Growth
at 21%
Healthy Interest
Coverage Ratio of 7.3x
KEY FINANCIAL HIGHLIGHTS- FY17
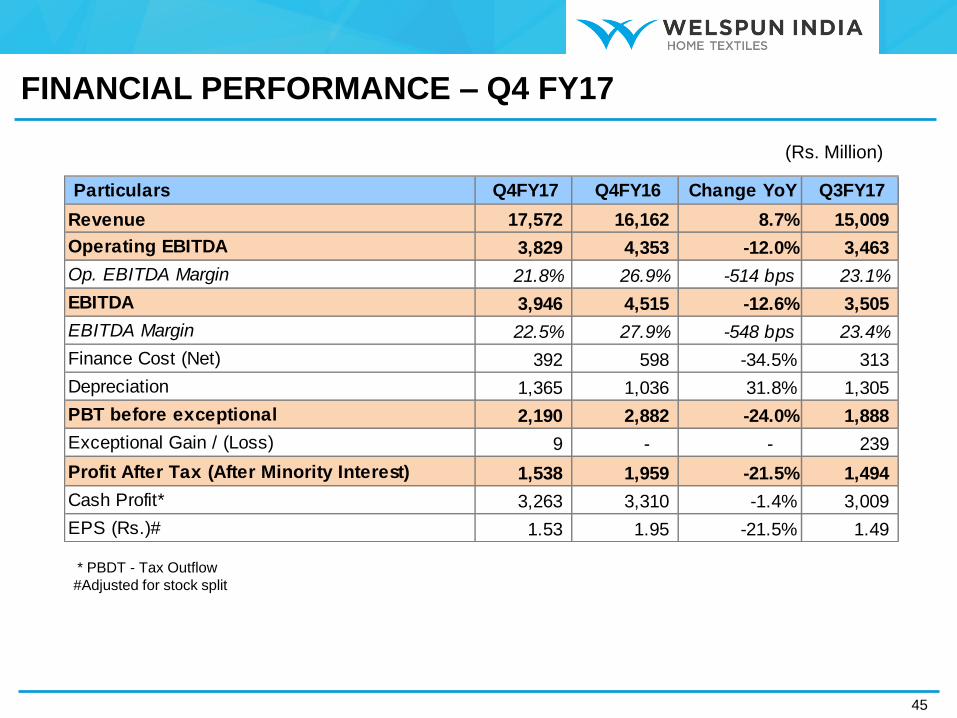
(Rs. Million)
* PBDT - Tax Outflow
#Adjusted for stock split
45
Particulars Q4FY17 Q4FY16 Change YoY Q3FY17
Revenue 17,572 16,162 8.7% 15,009
Operating EBITDA 3,829 4,353 -12.0% 3,463
Op. EBITDA Margin 21.8% 26.9% -514 bps 23.1%
EBITDA 3,946 4,515 -12.6% 3,505
EBITDA Margin 22.5% 27.9% -548 bps 23.4%
Finance Cost (Net) 392 598 -34.5% 313
Depreciation 1,365 1,036 31.8% 1,305
PBT before exceptional 2,190 2,882 -24.0% 1,888
Exceptional Gain / (Loss) 9 - - 239
Profit After Tax (After Minority Interest) 1,538 1,959 -21.5% 1,494
Cash Profit* 3,263 3,310 -1.4% 3,009
EPS (Rs.)# 1.53 1.95 -21.5% 1.49
FINANCIAL PERFORMANCE – Q4 FY17
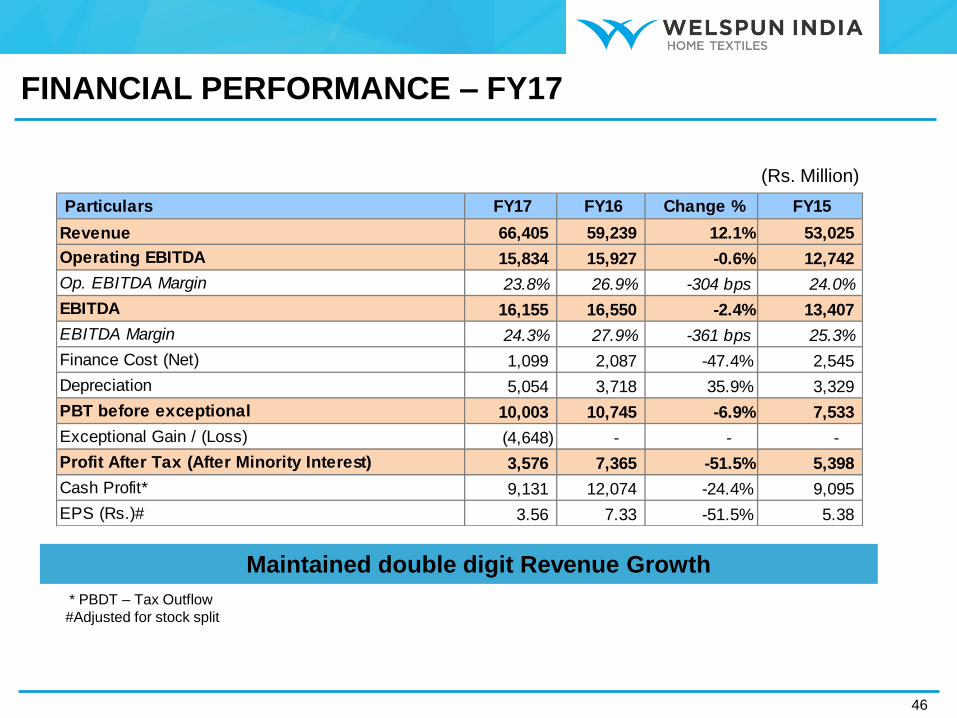
(Rs. Million)
* PBDT – Tax Outflow
#Adjusted for stock split
46
Particulars FY17 FY16 Change % FY15
Revenue 66,405 59,239 12.1% 53,025
Operating EBITDA 15,834 15,927 -0.6% 12,742
Op. EBITDA Margin 23.8% 26.9% -304 bps 24.0%
EBITDA 16,155 16,550 -2.4% 13,407
EBITDA Margin 24.3% 27.9% -361 bps 25.3%
Finance Cost (Net) 1,099 2,087 -47.4% 2,545
Depreciation 5,054 3,718 35.9% 3,329
PBT before exceptional 10,003 10,745 -6.9% 7,533
Exceptional Gain / (Loss) (4,648) - - -
Profit After Tax (After Minority Interest) 3,576 7,365 -51.5% 5,398
Cash Profit* 9,131 12,074 -24.4% 9,095
EPS (Rs.)# 3.56 7.33 -51.5% 5.38
Maintained double digit Revenue Growth
FINANCIAL PERFORMANCE – FY17
(Rs. Million)
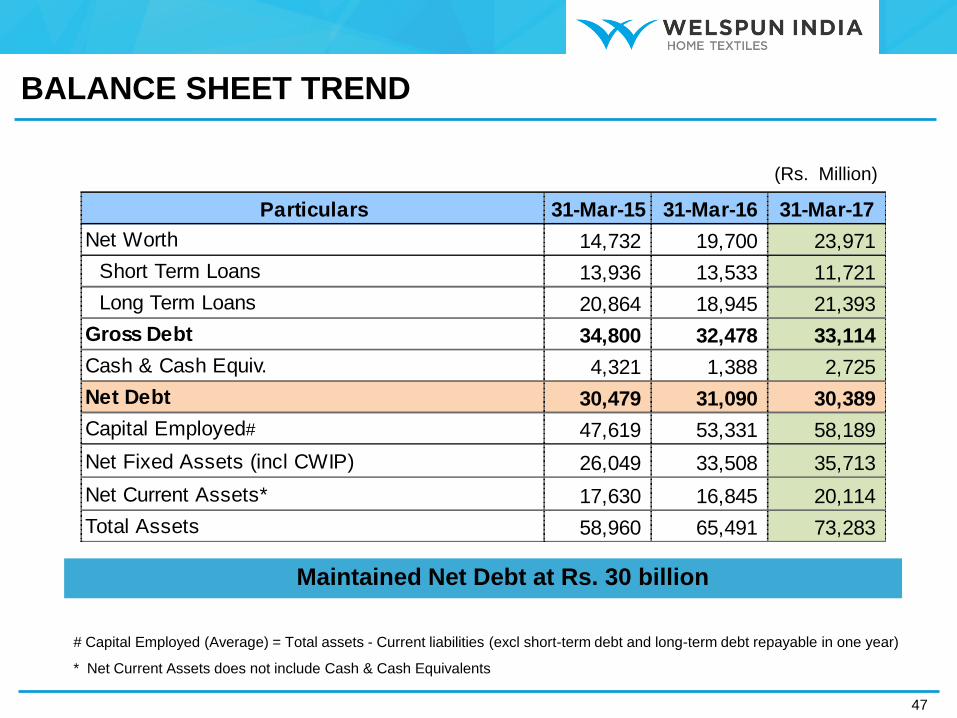
# Capital Employed (Average) = Total assets - Current liabilities (excl short-term debt and long-term debt repayable in one year)
* Net Current Assets does not include Cash & Cash Equivalents
47
Particulars 31-Mar-15 31-Mar-16 31-Mar-17
Net Worth 14,732 19,700 23,971
Short Term Loans 13,936 13,533 11,721
Long Term Loans 20,864 18,945 21,393
Gross Debt 34,800 32,478 33,114
Cash & Cash Equiv. 4,321 1,388 2,725
Net Debt 30,479 31,090 30,389
Capital Employed# 47,619 53,331 58,189
Net Fixed Assets (incl CWIP) 26,049 33,508 35,713
Net Current Assets* 17,630 16,845 20,114
Total Assets 58,960 65,491 73,283
Maintained Net Debt at Rs. 30 billion
BALANCE SHEET TREND
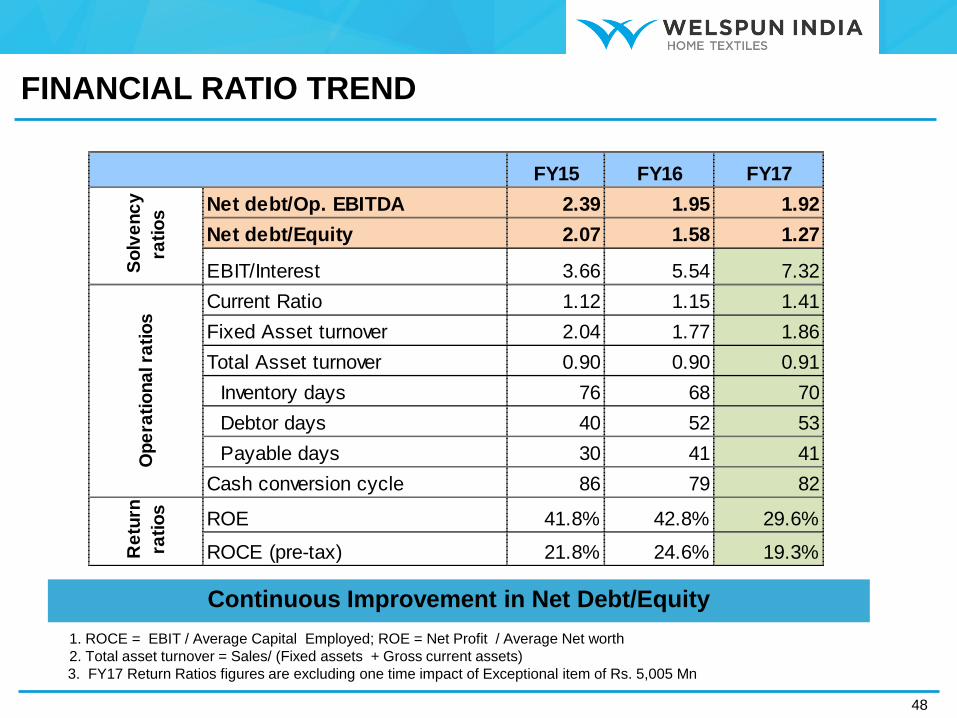
1. ROCE = EBIT / Average Capital Employed; ROE = Net Profit / Average Net worth
2. Total asset turnover = Sales/ (Fixed assets + Gross current assets)
3. FY17 Return Ratios figures are excluding one time impact of Exceptional item of Rs. 5,005 Mn
Continuous Improvement in Net Debt/Equity
48
FY15 FY16 FY17
Net debt/Op. EBITDA 2.39 1.95 1.92
Net debt/Equity 2.07 1.58 1.27
EBIT/Interest 3.66 5.54 7.32
Current Ratio 1.12 1.15 1.41
Fixed Asset turnover 2.04 1.77 1.86
Total Asset turnover 0.90 0.90 0.91
Inventory days 76 68 70
Debtor days 40 52 53
Payable days 30 41 41
Cash conversion cycle 86 79 82
ROE 41.8% 42.8% 29.6%
ROCE (pre-tax) 21.8% 24.6% 19.3%Re
turn
rati
os
So
lve
nc
y
rati
os
Op
era
tio
na
l ra
tio
s
FINANCIAL RATIO TREND
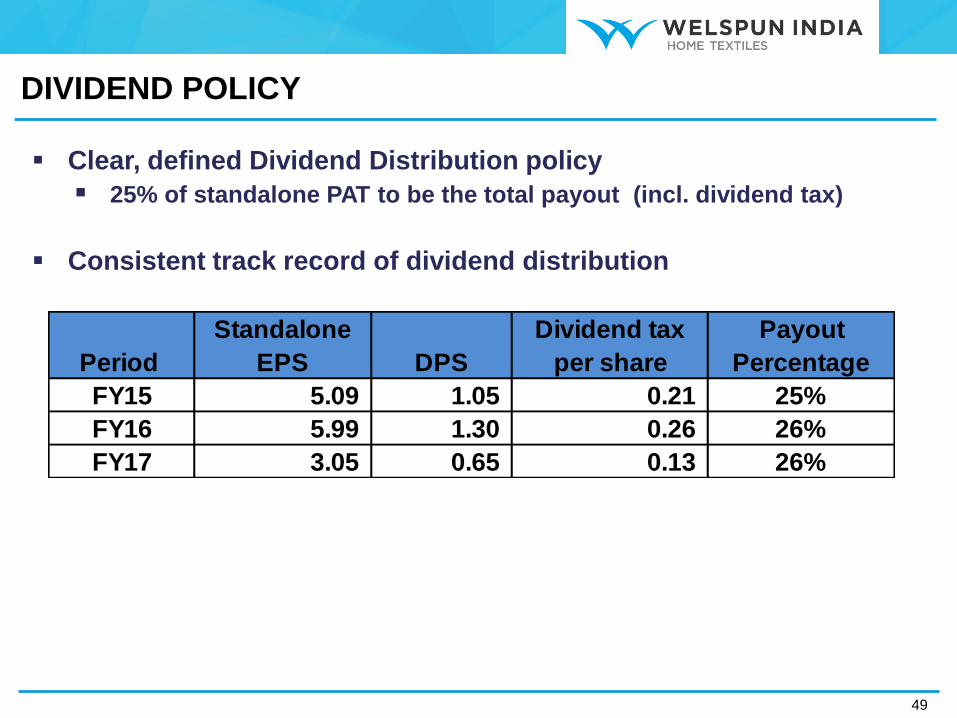
Clear, defined Dividend Distribution policy
25% of standalone PAT to be the total payout (incl. dividend tax)
Consistent track record of dividend distribution
49
Period
Standalone
EPS DPS
Dividend tax
per share
Payout
Percentage
FY15 5.09 1.05 0.21 25%
FY16 5.99 1.30 0.26 26%
FY17 3.05 0.65 0.13 26%
DIVIDEND POLICY