Embed Size (px)
Citation preview
Welspun India Limited (WIL) Investor Presentation
……………………………………………..……………………………………………………………………….……..
……………………………………………………………………….……..
May 2015
Agenda
Financial Highlights
Industry Overview:
Advantage India
Welspun India: Global
Leader in Home Textiles WIL – An Overview
Way forward
2
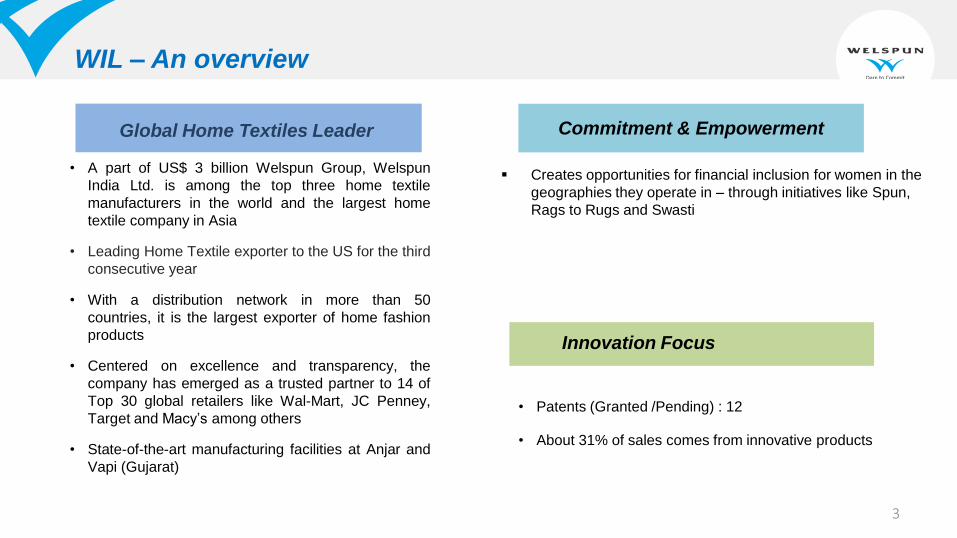
Commitment & Empowerment Global Home Textiles Leader
• A part of US$ 3 billion Welspun Group, Welspun
India Ltd. is among the top three home textile
manufacturers in the world and the largest home
textile company in Asia
• Leading Home Textile exporter to the US for the third
consecutive year
• With a distribution network in more than 50
countries, it is the largest exporter of home fashion
products
• Centered on excellence and transparency, the
company has emerged as a trusted partner to 14 of
Top 30 global retailers like Wal-Mart, JC Penney,
Target and Macy’s among others
• State-of-the-art manufacturing facilities at Anjar and
Vapi (Gujarat)
Creates opportunities for financial inclusion for women in the
geographies they operate in – through initiatives like Spun,
Rags to Rugs and Swasti
Innovation Focus
• Patents (Granted /Pending) : 12
• About 31% of sales comes from innovative products
WIL – An overview
3
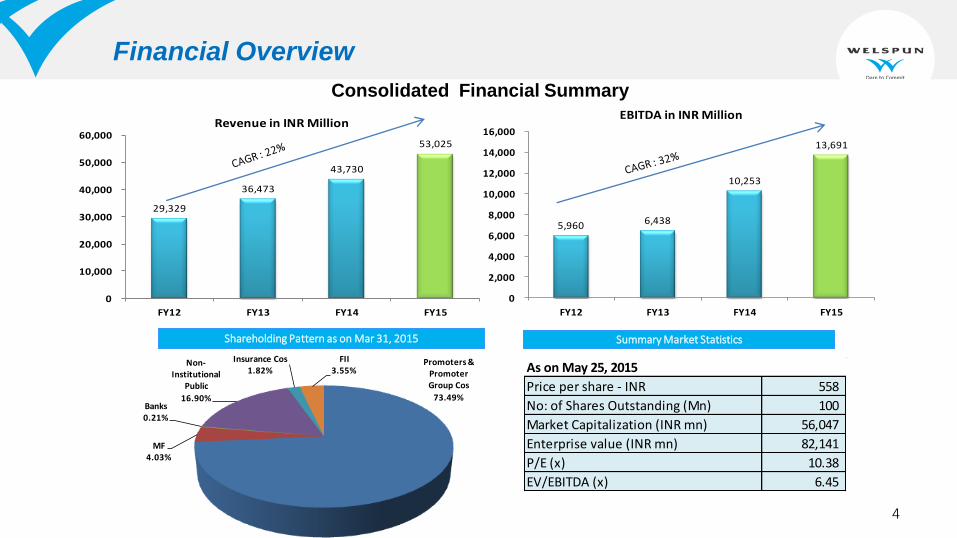
5,960 6,438
10,253
13,691
0
2,000
4,000
6,000
8,000
10,000
12,000
14,000
16,000
FY12 FY13 FY14 FY15
EBITDA in INR Million
Financial Overview
Shareholding Pattern as on Mar 31, 2015 Summary Market Statistics
Consolidated Financial Summary
As on May 25, 2015
Price per share - INR 558
No: of Shares Outstanding (Mn) 100
Market Capitalization (INR mn) 56,047
Enterprise value (INR mn) 82,141
P/E (x) 10.38
EV/EBITDA (x) 6.45
29,329
36,473
43,730
53,025
0
10,000
20,000
30,000
40,000
50,000
60,000
FY12 FY13 FY14 FY15
Revenue in INR Million
Promoters & Promoter Group Cos
73.49%
MF4.03%
Banks0.21%
Non-Institutional
Public
16.90%
Insurance Cos 1.82%
FII3.55%
4
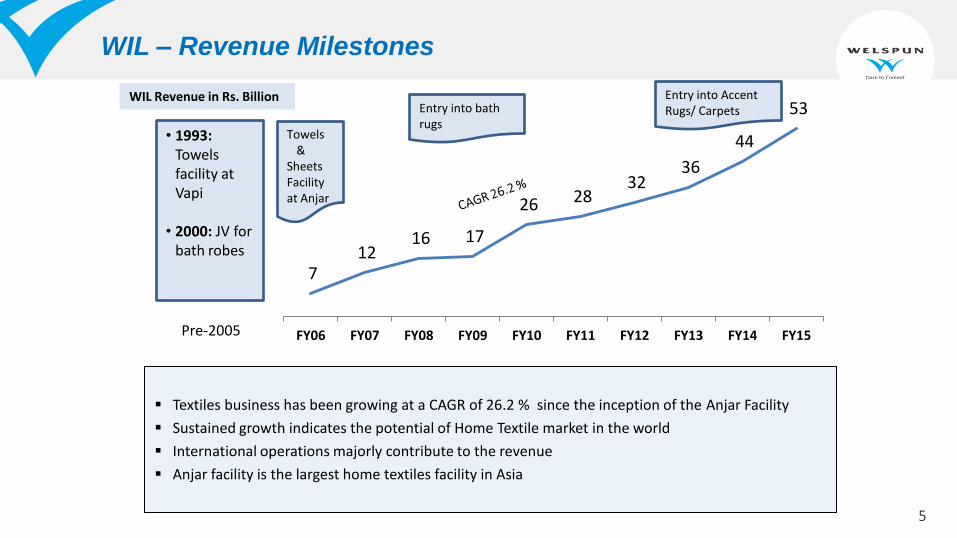
7 12
16 17
26 28 32
36
44
53
FY06 FY07 FY08 FY09 FY10 FY11 FY12 FY13 FY14 FY15
WIL – Revenue Milestones
WIL Revenue in Rs. Billion
Textiles business has been growing at a CAGR of 26.2 % since the inception of the Anjar Facility
Sustained growth indicates the potential of Home Textile market in the world
International operations majorly contribute to the revenue
Anjar facility is the largest home textiles facility in Asia
• 1993: Towels facility at Vapi
• 2000: JV for bath robes
Pre-2005
Towels &
Sheets Facility at Anjar
Entry into bath rugs
Entry into Accent Rugs/ Carpets
5

Industry Overview: Advantage India
6
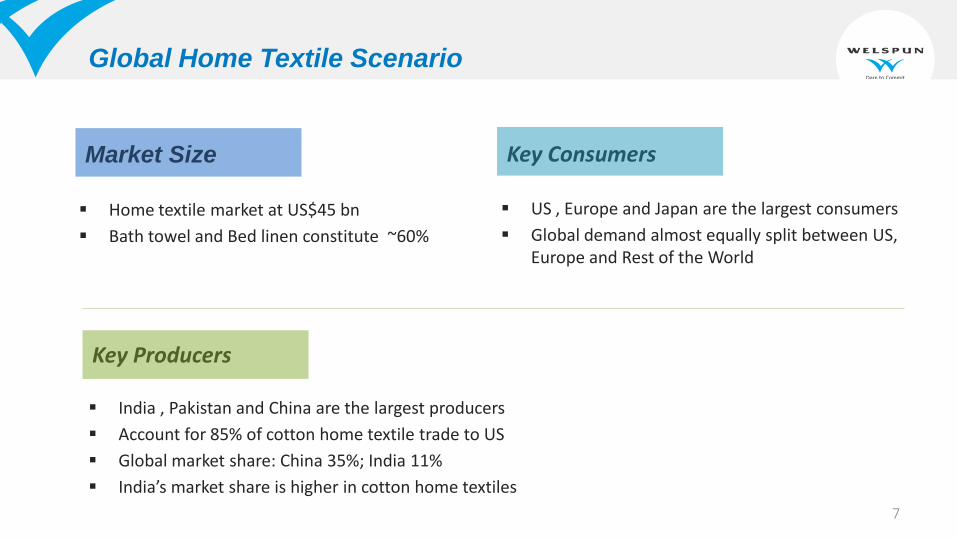
Global Home Textile Scenario
Market Size
Home textile market at US$45 bn
Bath towel and Bed linen constitute ~60%
Key Consumers
US , Europe and Japan are the largest consumers
Global demand almost equally split between US, Europe and Rest of the World
Key Producers
India , Pakistan and China are the largest producers
Account for 85% of cotton home textile trade to US
Global market share: China 35%; India 11%
India’s market share is higher in cotton home textiles
7
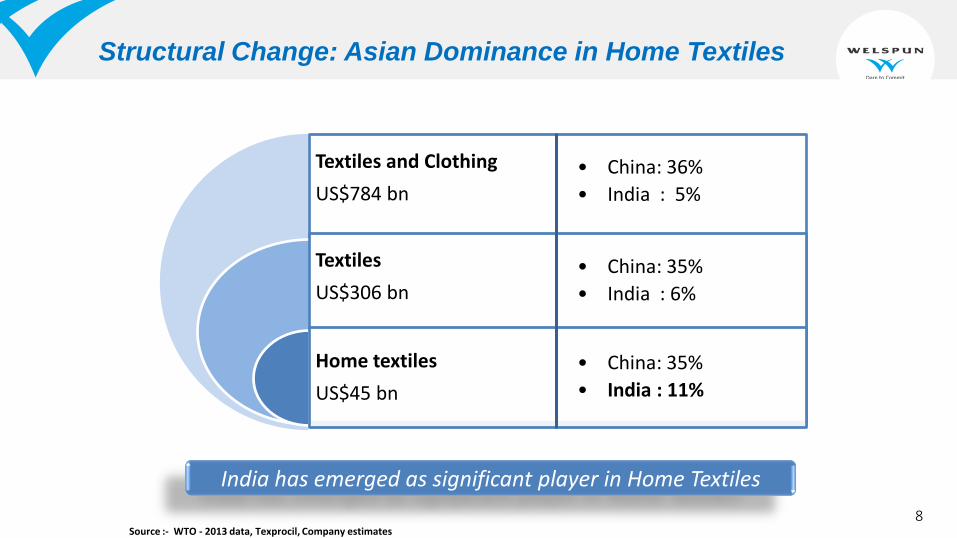
Structural Change: Asian Dominance in Home Textiles
Textiles and Clothing
US$784 bn
Textiles
US$306 bn
Home textiles
US$45 bn
• China: 36%
• India : 5%
• China: 35%
• India : 6%
• China: 35%
• India : 11%
Source :- WTO - 2013 data, Texprocil, Company estimates
India has emerged as significant player in Home Textiles
8
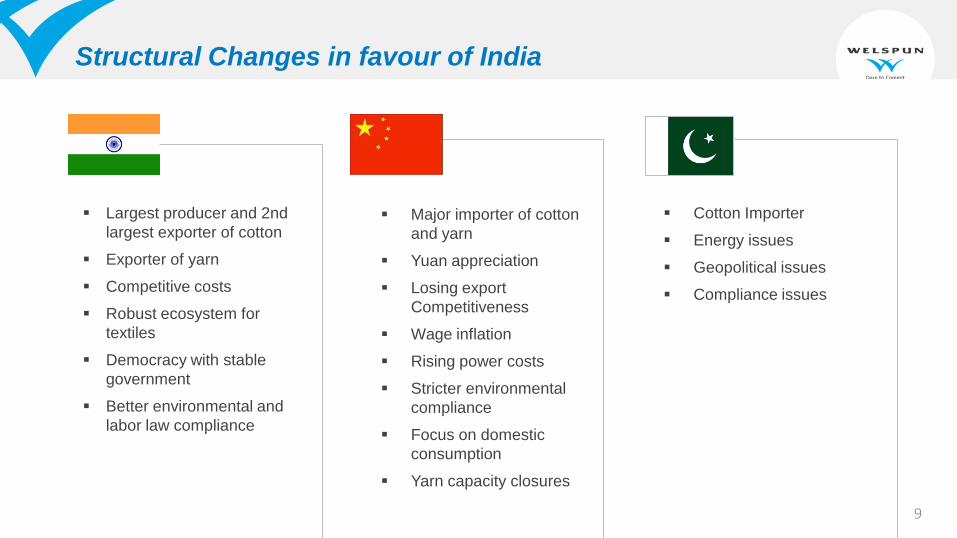
Structural Changes in favour of India
Largest producer and 2nd
largest exporter of cotton
Exporter of yarn
Competitive costs
Robust ecosystem for
textiles
Democracy with stable
government
Better environmental and
labor law compliance
Major importer of cotton
and yarn
Yuan appreciation
Losing export
Competitiveness
Wage inflation
Rising power costs
Stricter environmental
compliance
Focus on domestic
consumption
Yarn capacity closures
Cotton Importer
Energy issues
Geopolitical issues
Compliance issues
9
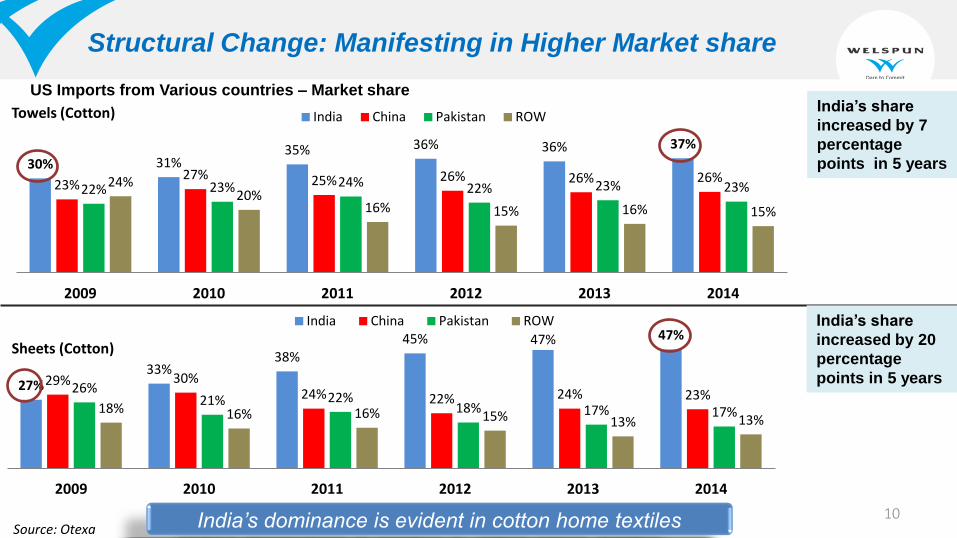
27% 33%
38% 45% 47% 47%
29% 30% 24% 22% 24% 23% 26%
21% 22% 18% 17% 17% 18% 16% 16% 15% 13% 13%
2009 2010 2011 2012 2013 2014
Sheets (Cotton)
India China Pakistan ROW
30% 31% 35% 36% 36% 37%
23% 27% 25% 26% 26% 26%
22% 23% 24% 22% 23% 23% 24% 20%
16% 15% 16% 15%
2009 2010 2011 2012 2013 2014
Towels (Cotton) India China Pakistan ROW
US Imports from Various countries – Market share
Structural Change: Manifesting in Higher Market share
Source: Otexa
India’s share
increased by 7
percentage
points in 5 years
India’s share
increased by 20
percentage
points in 5 years
India’s dominance is evident in cotton home textiles 10
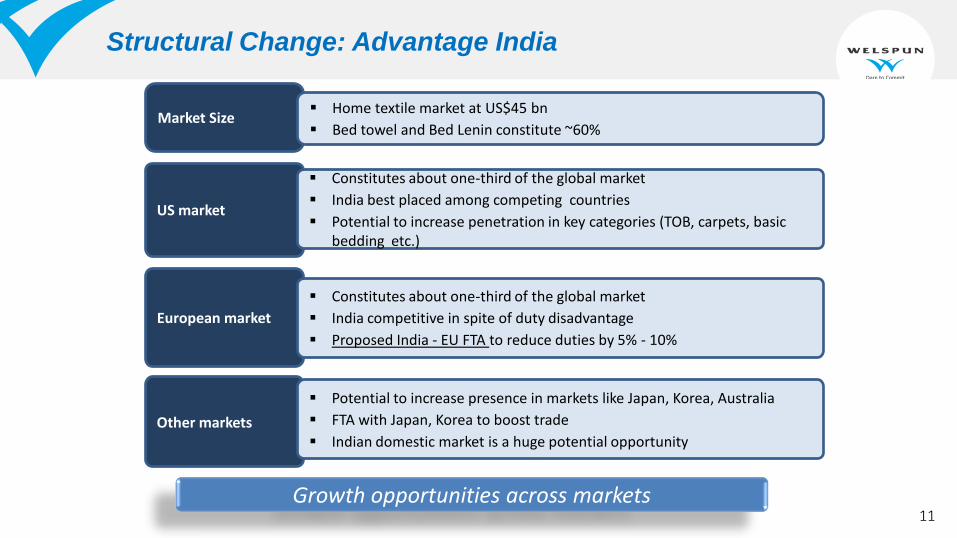
Structural Change: Advantage India
Market Size
US market
European market
Other markets
Home textile market at US$45 bn
Bed towel and Bed Lenin constitute ~60%
Constitutes about one-third of the global market
India best placed among competing countries
Potential to increase penetration in key categories (TOB, carpets, basic bedding etc.)
Constitutes about one-third of the global market
India competitive in spite of duty disadvantage
Proposed India - EU FTA to reduce duties by 5% - 10%
Potential to increase presence in markets like Japan, Korea, Australia
FTA with Japan, Korea to boost trade
Indian domestic market is a huge potential opportunity
Growth opportunities across markets 11

Welspun India
12
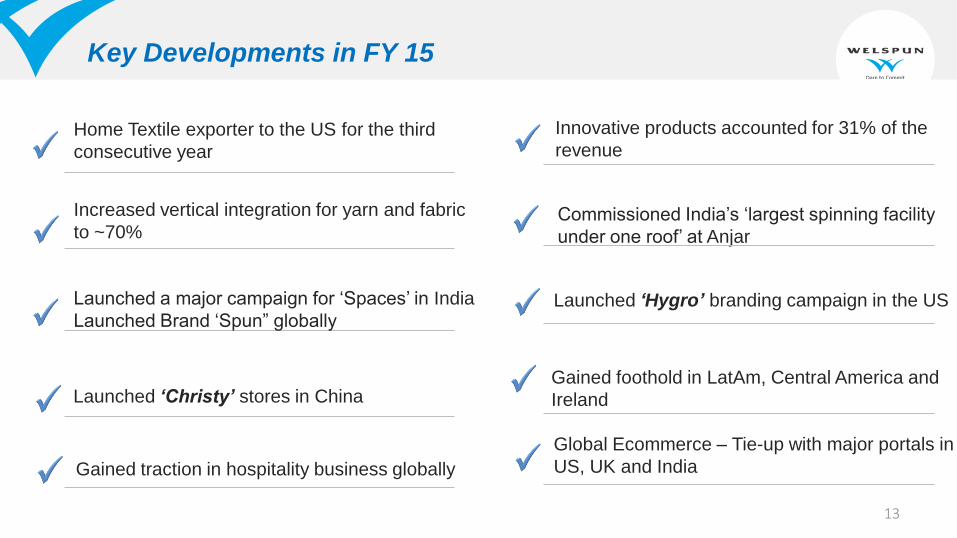
Key Developments in FY 15
Home Textile exporter to the US for the third
consecutive year
Commissioned India’s ‘largest spinning facility
under one roof’ at Anjar
Launched a major campaign for ‘Spaces’ in India
Launched Brand ‘Spun” globally Launched ‘Hygro’ branding campaign in the US
Global Ecommerce – Tie-up with major portals in
US, UK and India Gained traction in hospitality business globally
Increased vertical integration for yarn and fabric
to ~70%
Launched ‘Christy’ stores in China
Innovative products accounted for 31% of the
revenue
Gained foothold in LatAm, Central America and
Ireland
13
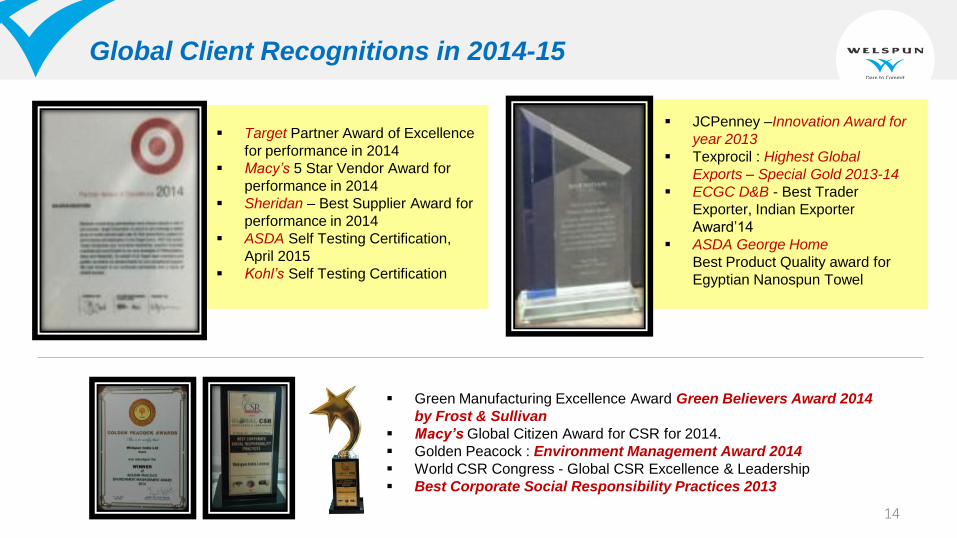
Global Client Recognitions in 2014-15
Green Manufacturing Excellence Award Green Believers Award 2014
by Frost & Sullivan
Macy’s Global Citizen Award for CSR for 2014.
Golden Peacock : Environment Management Award 2014
World CSR Congress - Global CSR Excellence & Leadership
Best Corporate Social Responsibility Practices 2013
Target Partner Award of Excellence
for performance in 2014
Macy’s 5 Star Vendor Award for
performance in 2014
Sheridan – Best Supplier Award for
performance in 2014
ASDA Self Testing Certification,
April 2015
Kohl’s Self Testing Certification
JCPenney –Innovation Award for
year 2013
Texprocil : Highest Global
Exports – Special Gold 2013-14
ECGC D&B - Best Trader
Exporter, Indian Exporter
Award’14
ASDA George Home
Best Product Quality award for
Egyptian Nanospun Towel
14
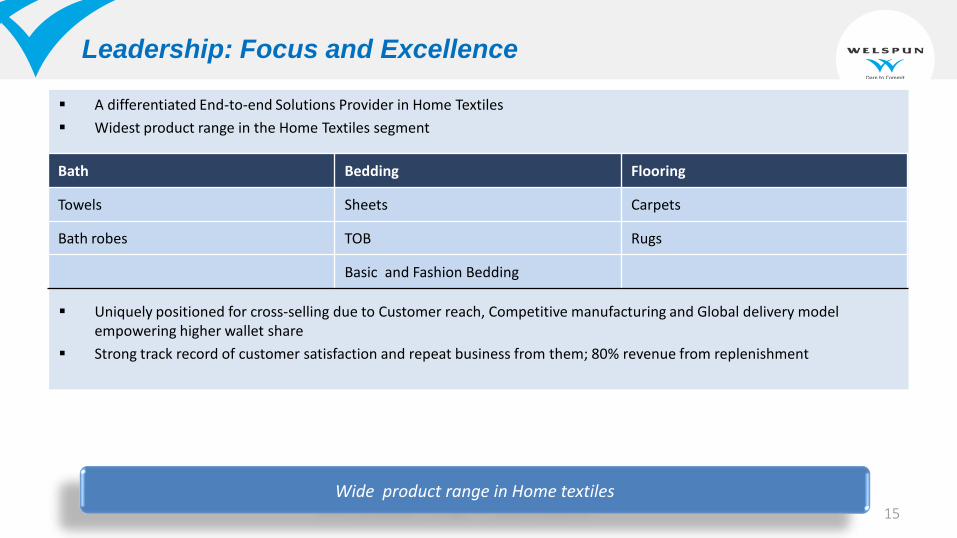
A differentiated End-to-end Solutions Provider in Home Textiles
Widest product range in the Home Textiles segment
Uniquely positioned for cross-selling due to Customer reach, Competitive manufacturing and Global delivery model empowering higher wallet share
Strong track record of customer satisfaction and repeat business from them; 80% revenue from replenishment
Bath Bedding Flooring
Towels Sheets Carpets
Bath robes TOB Rugs
Basic and Fashion Bedding
Wide product range in Home textiles
Leadership: Focus and Excellence
15
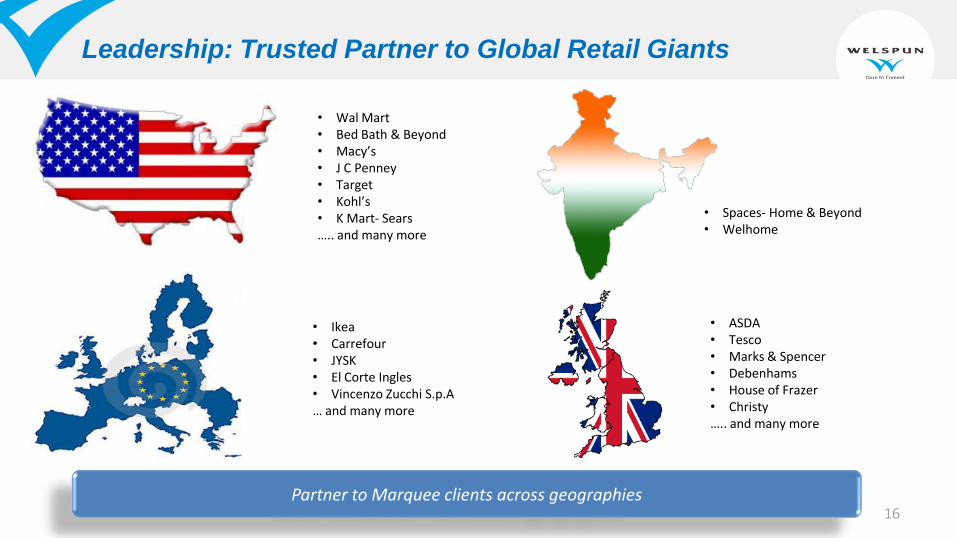
Leadership: Trusted Partner to Global Retail Giants
• Wal Mart • Bed Bath & Beyond • Macy’s • J C Penney • Target • Kohl’s • K Mart- Sears ….. and many more
• Ikea • Carrefour • JYSK • El Corte Ingles • Vincenzo Zucchi S.p.A … and many more
• ASDA • Tesco • Marks & Spencer • Debenhams • House of Frazer • Christy ….. and many more
• Spaces- Home & Beyond • Welhome
Partner to Marquee clients across geographies 16
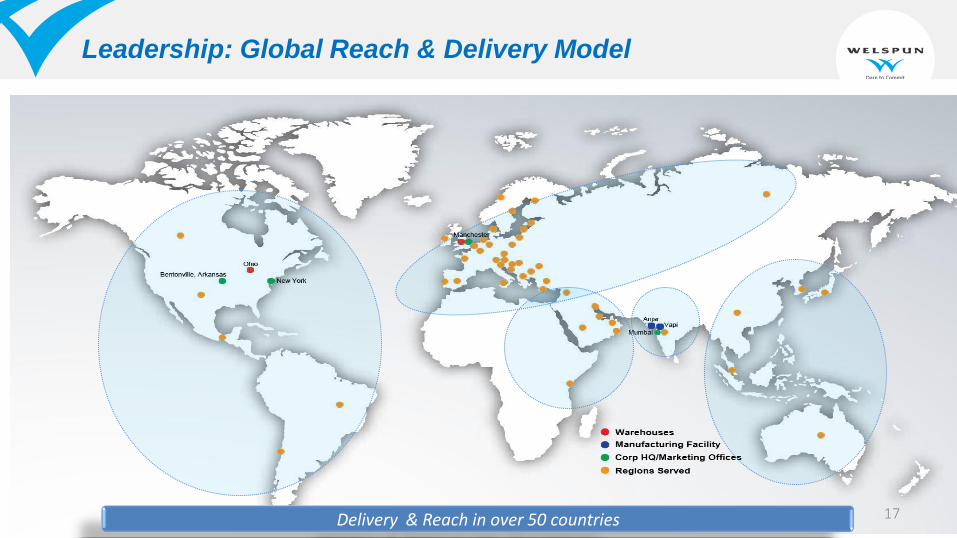
Leadership: Global Reach & Delivery Model
Delivery & Reach in over 50 countries 17
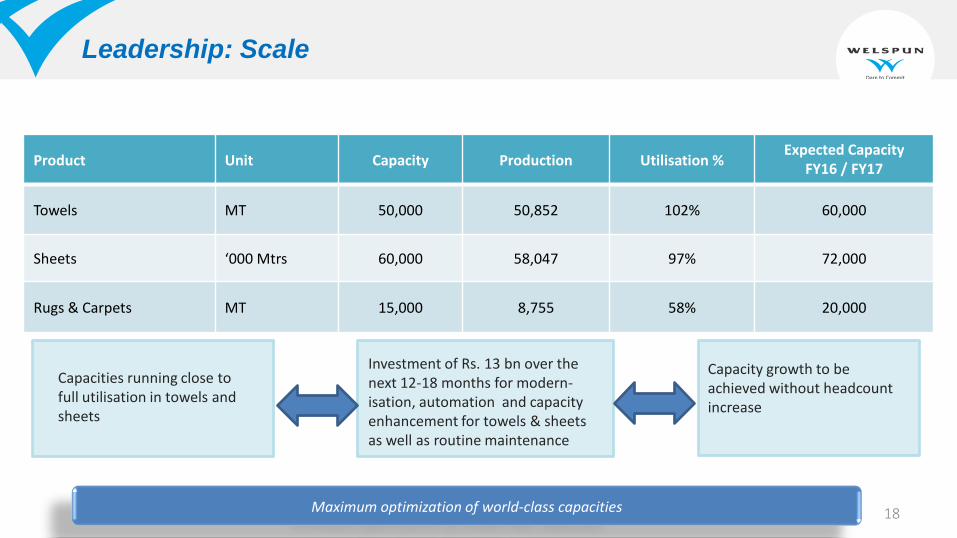
Leadership: Scale
Maximum optimization of world-class capacities
Product Unit Capacity Production Utilisation % Expected Capacity
FY16 / FY17
Towels MT 50,000 50,852 102% 60,000
Sheets ‘000 Mtrs 60,000 58,047 97% 72,000
Rugs & Carpets MT 15,000 8,755 58% 20,000
Capacities running close to full utilisation in towels and sheets
Investment of Rs. 13 bn over the next 12-18 months for modern-isation, automation and capacity enhancement for towels & sheets as well as routine maintenance
Capacity growth to be achieved without headcount increase
18
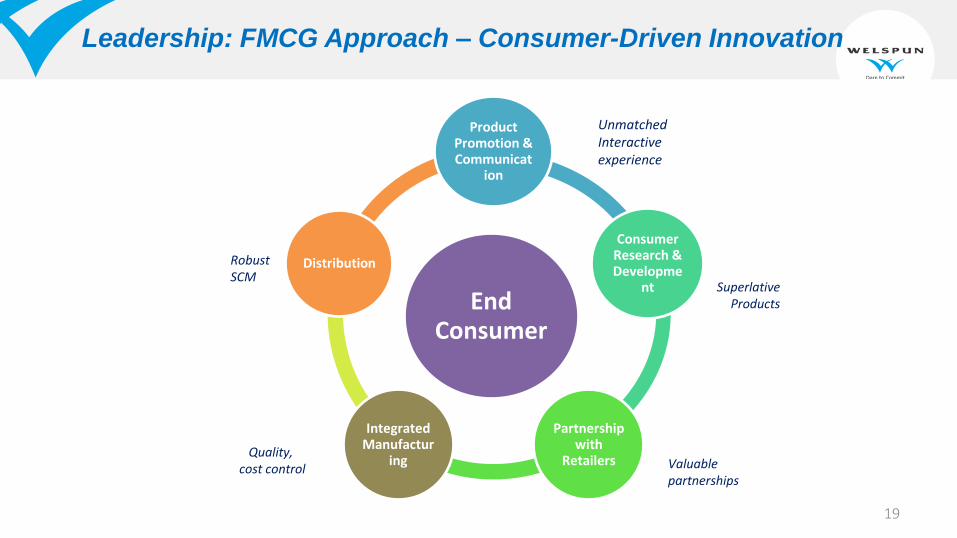
Leadership: FMCG Approach – Consumer-Driven Innovation
End Consumer
Product Promotion & Communicat
ion
Consumer Research & Developme
nt
Partnership with
Retailers
Integrated Manufactur
ing
Distribution
Unmatched Interactive experience
Superlative Products
Valuable partnerships
Quality, cost control
Robust SCM
19
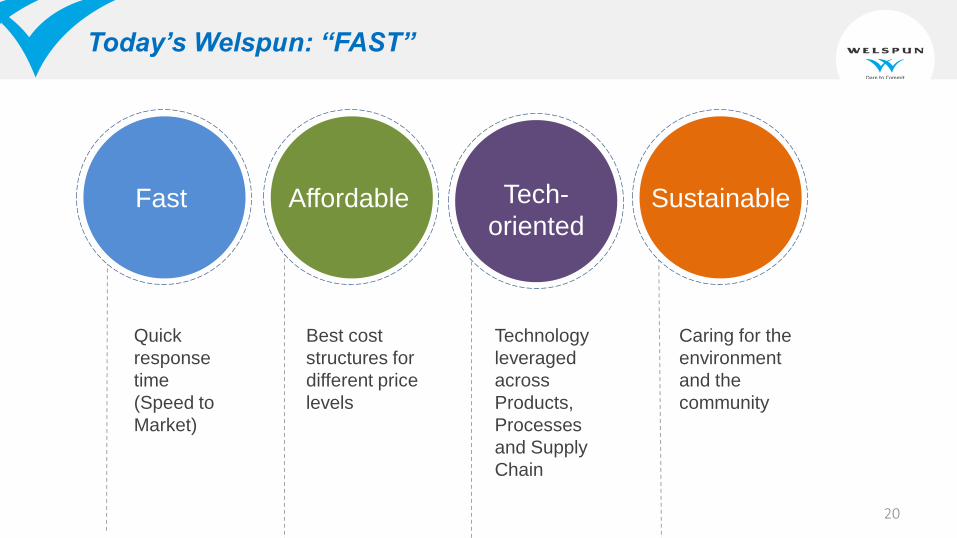
Today’s Welspun: “FAST”
Fast Affordable Tech-
oriented Sustainable
Quick
response
time
(Speed to
Market)
Best cost
structures for
different price
levels
Technology
leveraged
across
Products,
Processes
and Supply
Chain
Caring for the
environment
and the
community
20
20.9%
25.7%23.2%
15.6%
Welspun 14.7%
0.0%
5.0%
10.0%
15.0%
20.0%
25.0%
30.0%
35.0%
40.0%
India China Pakistan ROW
2013
20.1%
25.8%22.7%
14.9%
Welspun 16.4%
India China Pakistan ROW
2014
39.3%
23.6%
17.2%
12.6%
Welspun 7.3%
0.0%
5.0%
10.0%
15.0%
20.0%
25.0%
30.0%
35.0%
40.0%
45.0%
50.0%
India China Pakistan ROW
2013
37.0%
23.3%
16.5%13.3%
Welspun 9.9%
India China Pakistan ROW
2014
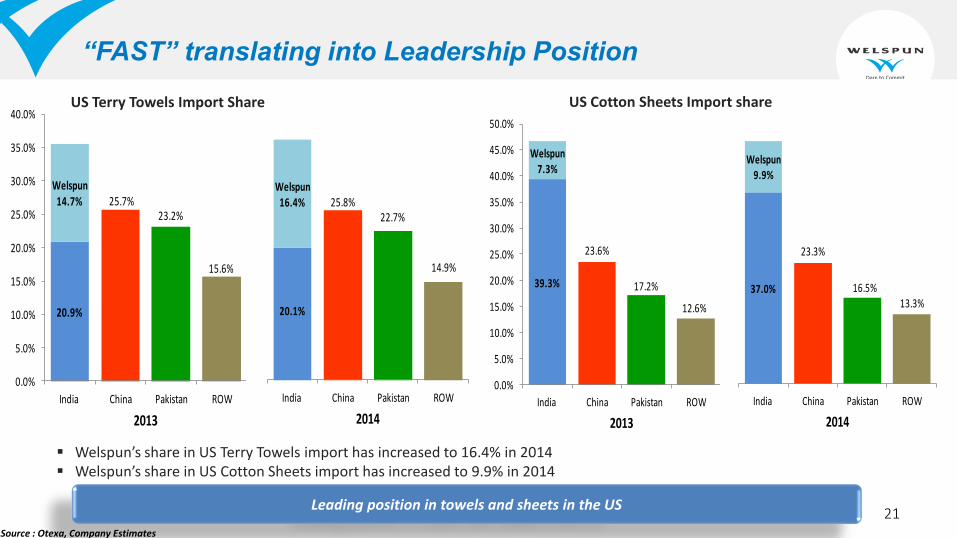
“FAST” translating into Leadership Position
Source : Otexa, Company Estimates
Welspun’s share in US Terry Towels import has increased to 16.4% in 2014 Welspun’s share in US Cotton Sheets import has increased to 9.9% in 2014
US Terry Towels Import Share US Cotton Sheets Import share
Leading position in towels and sheets in the US 21
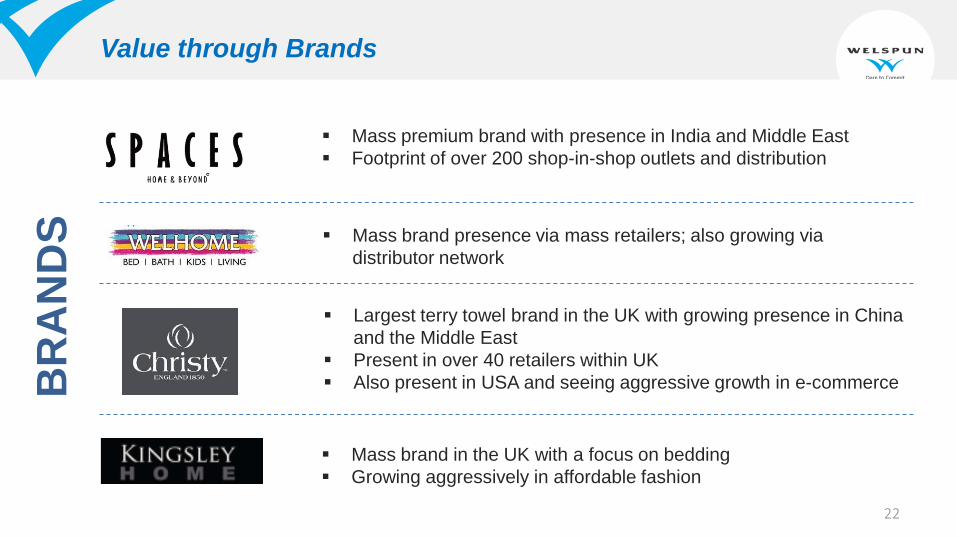
Value through Brands
Mass premium brand with presence in India and Middle East
Footprint of over 200 shop-in-shop outlets and distribution
BR
AN
DS
Mass brand presence via mass retailers; also growing via
distributor network
Largest terry towel brand in the UK with growing presence in China
and the Middle East
Present in over 40 retailers within UK
Also present in USA and seeing aggressive growth in e-commerce
Mass brand in the UK with a focus on bedding
Growing aggressively in affordable fashion
22
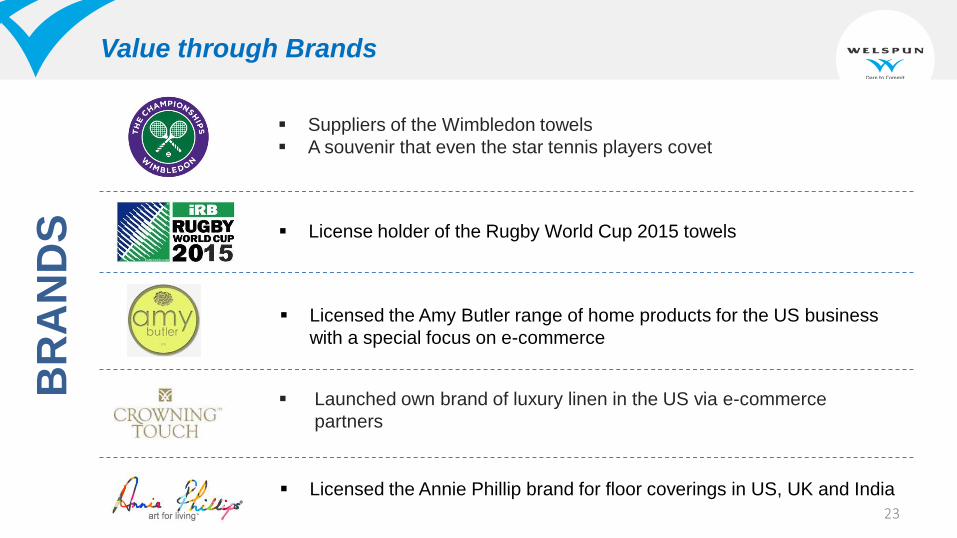
Value through Brands
Suppliers of the Wimbledon towels
A souvenir that even the star tennis players covet
BR
AN
DS
License holder of the Rugby World Cup 2015 towels
Licensed the Amy Butler range of home products for the US business
with a special focus on e-commerce
Launched own brand of luxury linen in the US via e-commerce
partners
Licensed the Annie Phillip brand for floor coverings in US, UK and India
23
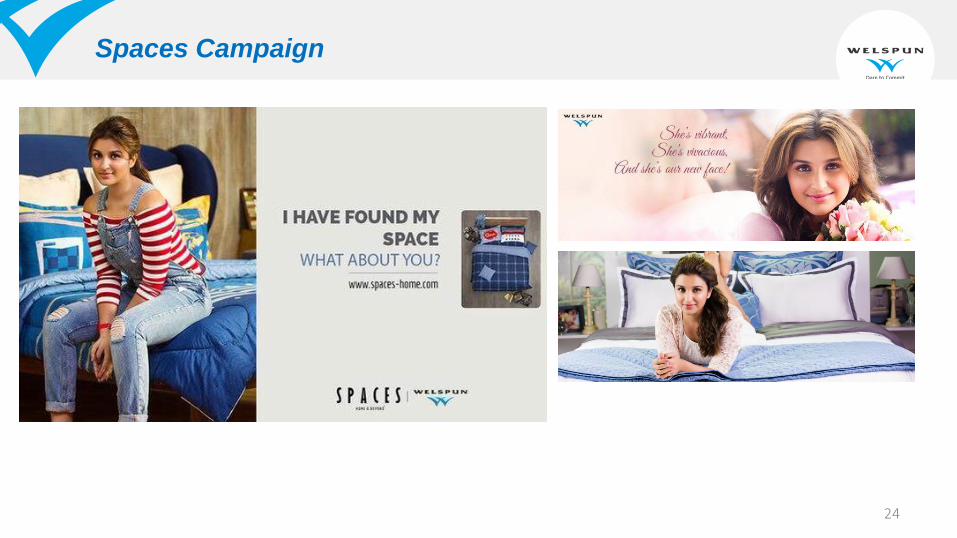
Spaces Campaign
24
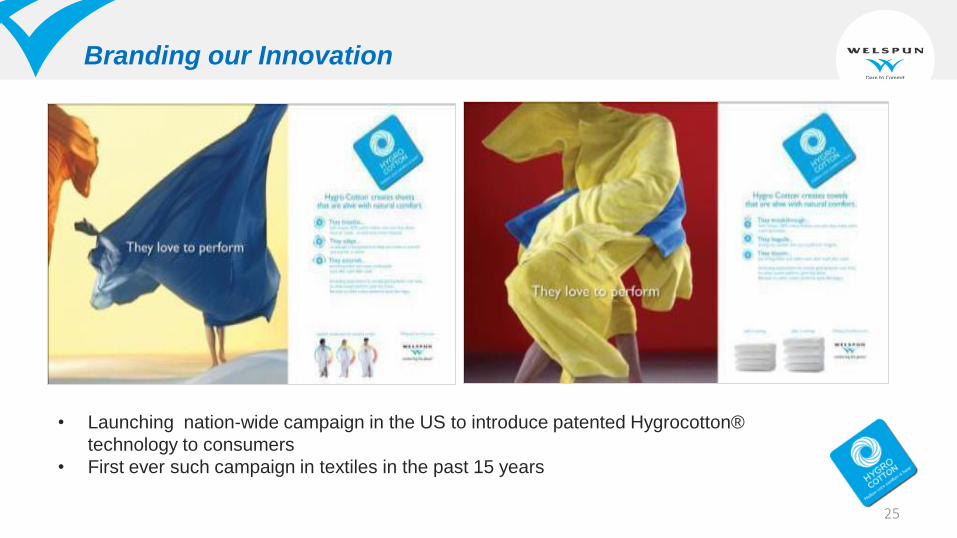
Branding our Innovation
• Launching nation-wide campaign in the US to introduce patented Hygrocotton®
technology to consumers
• First ever such campaign in textiles in the past 15 years
25
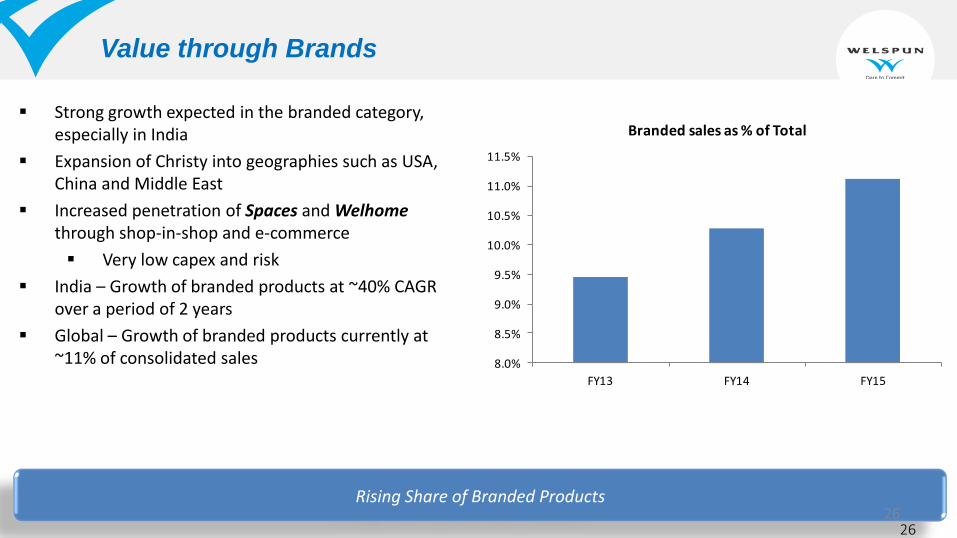
Value through Brands
Strong growth expected in the branded category, especially in India
Expansion of Christy into geographies such as USA, China and Middle East
Increased penetration of Spaces and Welhome through shop-in-shop and e-commerce
Very low capex and risk
India – Growth of branded products at ~40% CAGR over a period of 2 years
Global – Growth of branded products currently at ~11% of consolidated sales
Rising Share of Branded Products
8.0%
8.5%
9.0%
9.5%
10.0%
10.5%
11.0%
11.5%
FY13 FY14 FY15
Branded sales as % of Total
26 26
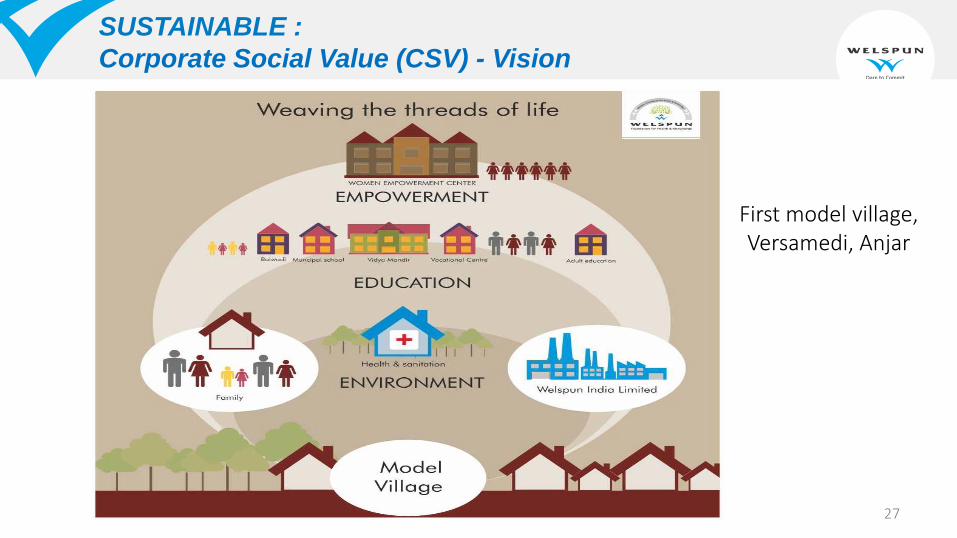
First model village, Versamedi, Anjar
SUSTAINABLE :
Corporate Social Value (CSV) - Vision
27
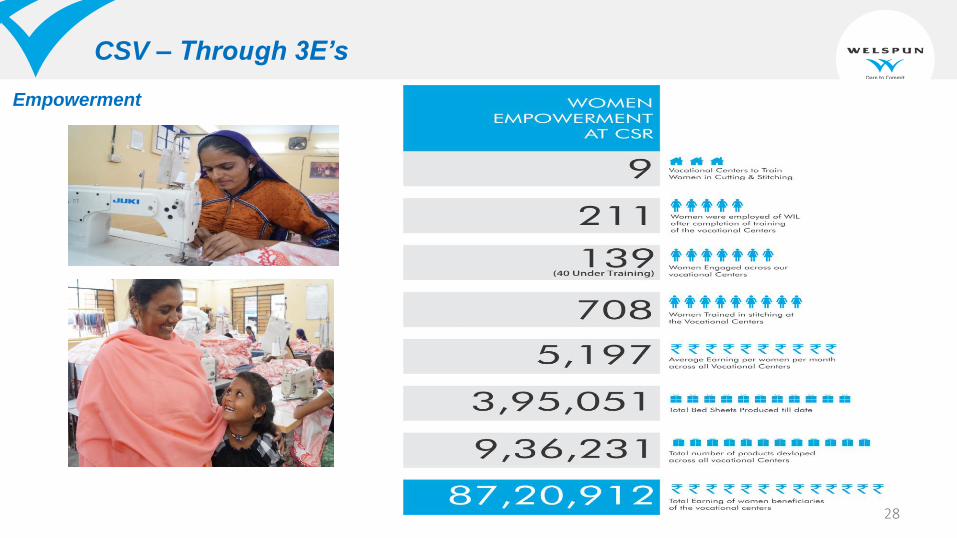
CSV – Through 3E’s
Empowerment
28
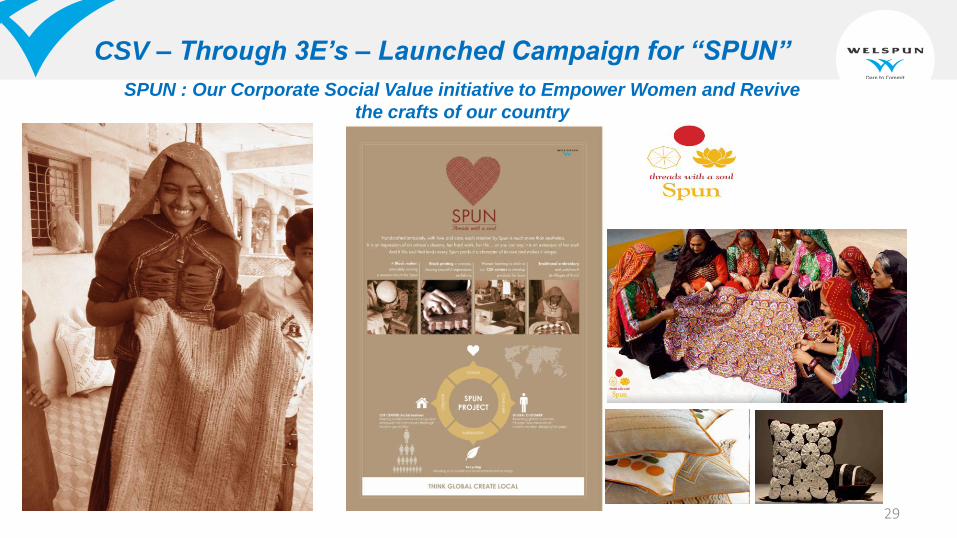
SPUN : Our Corporate Social Value initiative to Empower Women and Revive
the crafts of our country
CSV – Through 3E’s – Launched Campaign for “SPUN”
29
Welspun Group | Welspun Corp Ltd
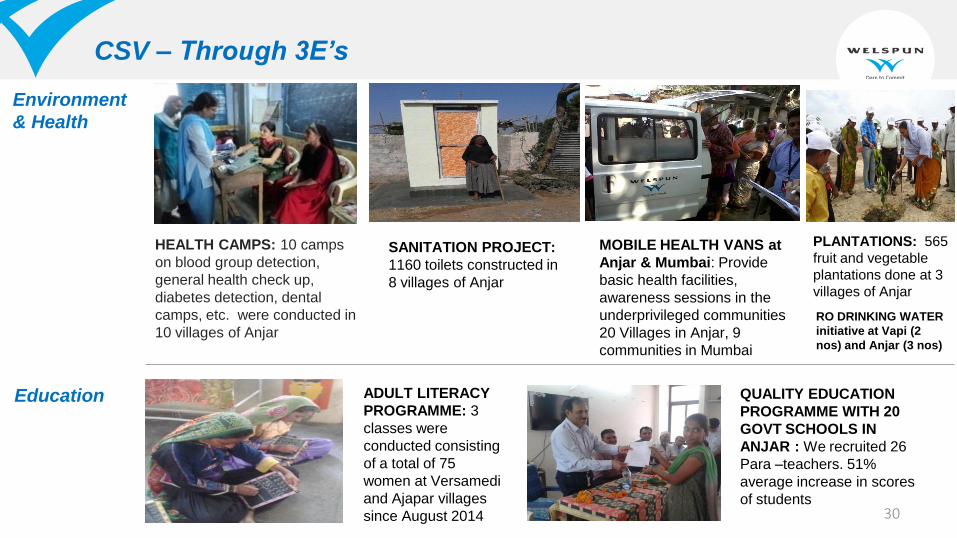
PLANTATIONS: 565
fruit and vegetable
plantations done at 3
villages of Anjar
MOBILE HEALTH VANS at
Anjar & Mumbai: Provide
basic health facilities,
awareness sessions in the
underprivileged communities
20 Villages in Anjar, 9
communities in Mumbai
SANITATION PROJECT:
1160 toilets constructed in
8 villages of Anjar
HEALTH CAMPS: 10 camps
on blood group detection,
general health check up,
diabetes detection, dental
camps, etc. were conducted in
10 villages of Anjar
Environment
& Health
Education
ADULT LITERACY
PROGRAMME: 3
classes were
conducted consisting
of a total of 75
women at Versamedi
and Ajapar villages
since August 2014
QUALITY EDUCATION
PROGRAMME WITH 20
GOVT SCHOOLS IN
ANJAR : We recruited 26
Para –teachers. 51%
average increase in scores
of students
RO DRINKING WATER
initiative at Vapi (2
nos) and Anjar (3 nos)
CSV – Through 3E’s
30

Financial Highlights
31
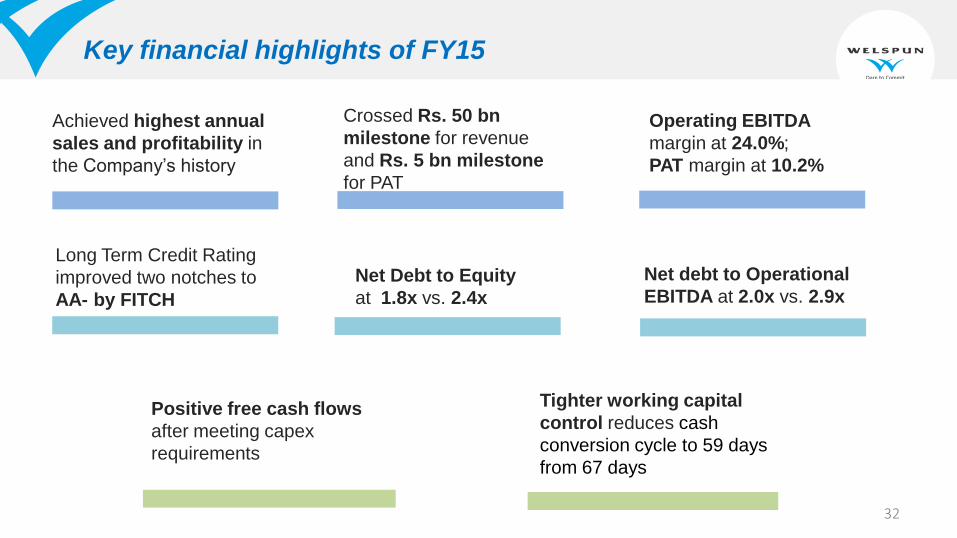
Key financial highlights of FY15
Achieved highest annual
sales and profitability in
the Company’s history
Long Term Credit Rating
improved two notches to
AA- by FITCH
Net Debt to Equity
at 1.8x vs. 2.4x
Net debt to Operational
EBITDA at 2.0x vs. 2.9x
Positive free cash flows
after meeting capex
requirements
Tighter working capital
control reduces cash
conversion cycle to 59 days
from 67 days
Crossed Rs. 50 bn
milestone for revenue
and Rs. 5 bn milestone
for PAT
Operating EBITDA
margin at 24.0%;
PAT margin at 10.2%
32
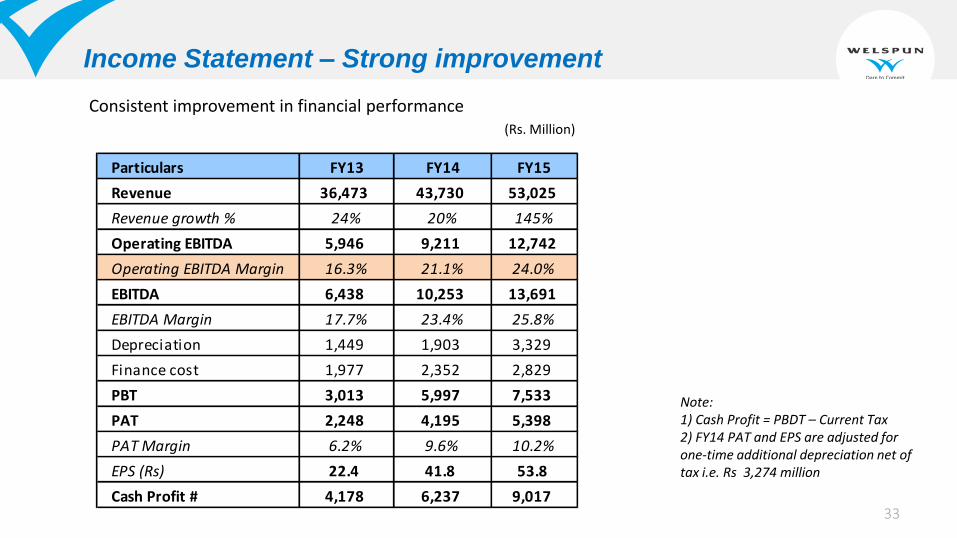
Income Statement – Strong improvement
(Rs. Million)
Consistent improvement in financial performance
Note: 1) Cash Profit = PBDT – Current Tax 2) FY14 PAT and EPS are adjusted for one-time additional depreciation net of tax i.e. Rs 3,274 million
Particulars FY13 FY14 FY15
Revenue 36,473 43,730 53,025
Revenue growth % 24% 20% 145%
Operating EBITDA 5,946 9,211 12,742
Operating EBITDA Margin 16.3% 21.1% 24.0%
EBITDA 6,438 10,253 13,691
EBITDA Margin 17.7% 23.4% 25.8%
Depreciation 1,449 1,903 3,329
Finance cost 1,977 2,352 2,829
PBT 3,013 5,997 7,533
PAT 2,248 4,195 5,398
PAT Margin 6.2% 9.6% 10.2%
EPS (Rs) 22.4 41.8 53.8
Cash Profit # 4,178 6,237 9,01733
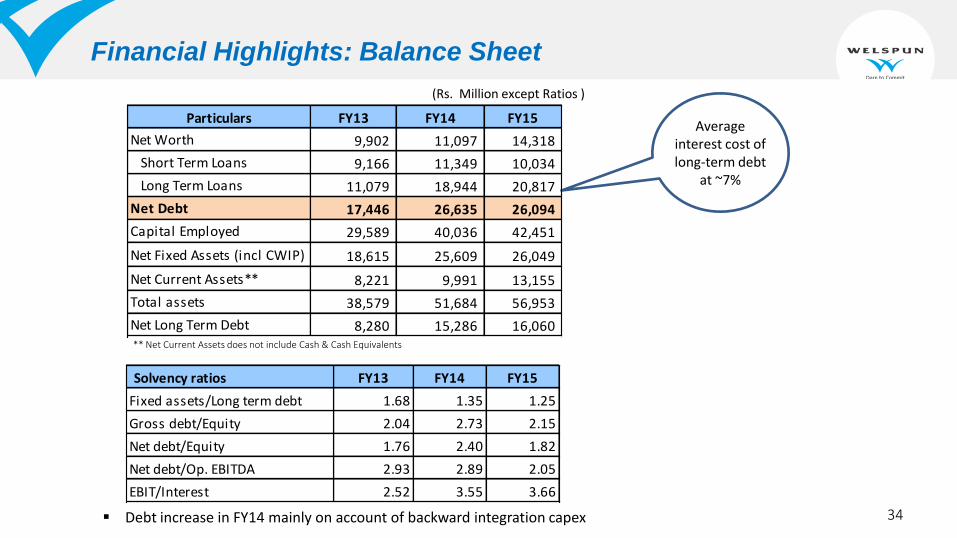
Financial Highlights: Balance Sheet
Debt increase in FY14 mainly on account of backward integration capex
(Rs. Million except Ratios )
Average interest cost of long-term debt
at ~7%
** Net Current Assets does not include Cash & Cash Equivalents
Particulars FY13 FY14 FY15
Net Worth 9,902 11,097 14,318
Short Term Loans 9,166 11,349 10,034
Long Term Loans 11,079 18,944 20,817
Net Debt 17,446 26,635 26,094
Capital Employed 29,589 40,036 42,451
Net Fixed Assets (incl CWIP) 18,615 25,609 26,049
Net Current Assets** 8,221 9,991 13,155
Total assets 38,579 51,684 56,953
Net Long Term Debt 8,280 15,286 16,060
Solvency ratios FY13 FY14 FY15
Fixed assets/Long term debt 1.68 1.35 1.25
Gross debt/Equity 2.04 2.73 2.15
Net debt/Equity 1.76 2.40 1.82
Net debt/Op. EBITDA 2.93 2.89 2.05
EBIT/Interest 2.52 3.55 3.66
34
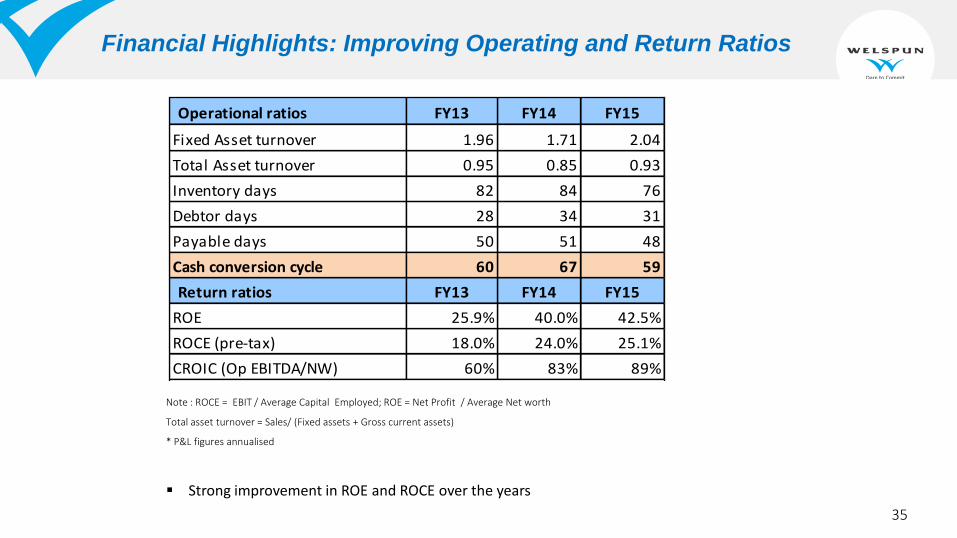
Financial Highlights: Improving Operating and Return Ratios
Strong improvement in ROE and ROCE over the years
Note : ROCE = EBIT / Average Capital Employed; ROE = Net Profit / Average Net worth
Total asset turnover = Sales/ (Fixed assets + Gross current assets)
* P&L figures annualised
Operational ratios FY13 FY14 FY15
Fixed Asset turnover 1.96 1.71 2.04
Total Asset turnover 0.95 0.85 0.93
Inventory days 82 84 76
Debtor days 28 34 31
Payable days 50 51 48
Cash conversion cycle 60 67 59
Return ratios FY13 FY14 FY15
ROE 25.9% 40.0% 42.5%
ROCE (pre-tax) 18.0% 24.0% 25.1%
CROIC (Op EBITDA/NW) 60% 83% 89%
35
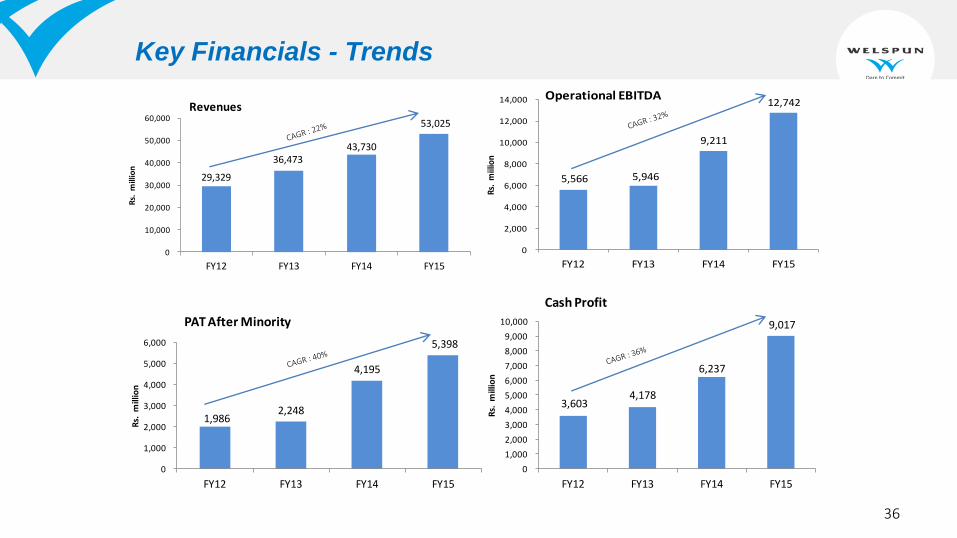
29,329
36,473 43,730
53,025
0
10,000
20,000
30,000
40,000
50,000
60,000
FY12 FY13 FY14 FY15
Rs.
mill
ion
Revenues
5,566 5,946
9,211
12,742
0
2,000
4,000
6,000
8,000
10,000
12,000
14,000
FY12 FY13 FY14 FY15
Rs.
miil
ion
Operational EBITDA
1,986 2,248
4,195
5,398
0
1,000
2,000
3,000
4,000
5,000
6,000
FY12 FY13 FY14 FY15
Rs.
mill
ion
PAT After Minority
3,603 4,178
6,237
9,017
0
1,000
2,000
3,000
4,000
5,000
6,000
7,000
8,000
9,000
10,000
FY12 FY13 FY14 FY15R
s. m
illio
n
Cash Profit
Key Financials - Trends
36
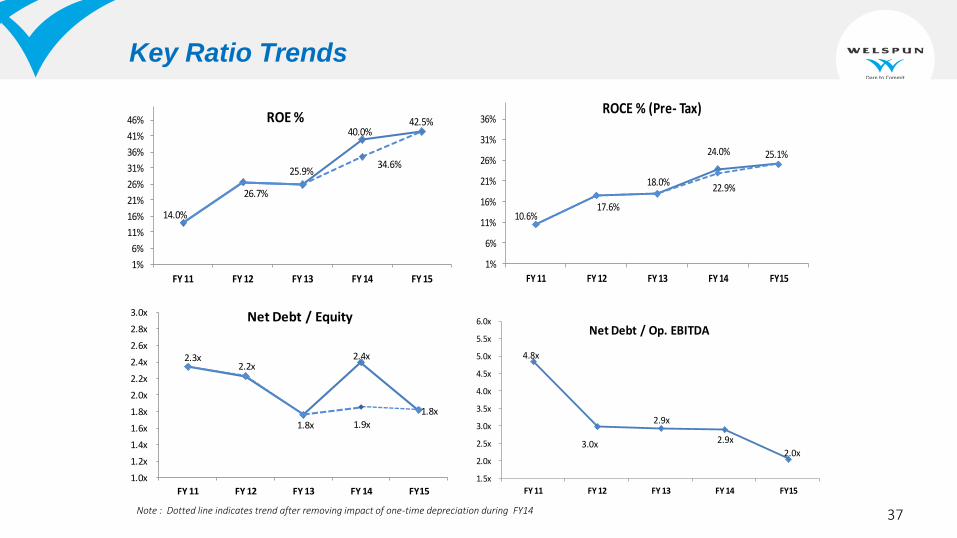
Key Ratio Trends
14.0%
26.7%
25.9%
40.0%42.5%
34.6%
1%
6%
11%
16%
21%
26%
31%
36%
41%
46%
FY 11 FY 12 FY 13 FY 14 FY 15
ROE %
10.6%17.6%
18.0%
24.0% 25.1%
22.9%
1%
6%
11%
16%
21%
26%
31%
36%
FY 11 FY 12 FY 13 FY 14 FY15
ROCE % (Pre- Tax)
2.3x 2.2x
1.8x
2.4x
1.8x
1.9x
1.0x
1.2x
1.4x
1.6x
1.8x
2.0x
2.2x
2.4x
2.6x
2.8x
3.0x
FY 11 FY 12 FY 13 FY 14 FY15
Net Debt / Equity
4.8x
3.0x
2.9x
2.9x
2.0x
1.5x
2.0x
2.5x
3.0x
3.5x
4.0x
4.5x
5.0x
5.5x
6.0x
FY 11 FY 12 FY 13 FY 14 FY15
Net Debt / Op. EBITDA
Note : Dotted line indicates trend after removing impact of one-time depreciation during FY14 37
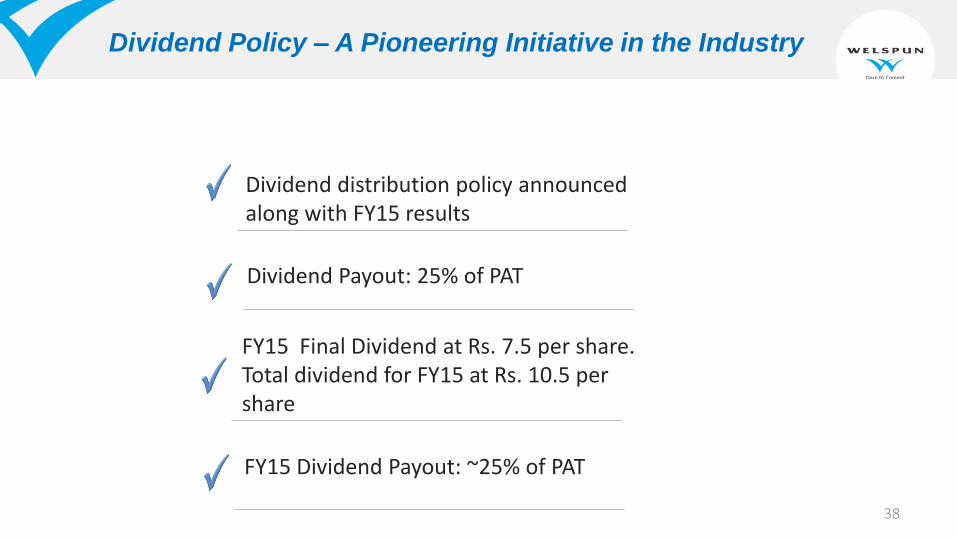
Dividend Policy – A Pioneering Initiative in the Industry
Dividend distribution policy announced along with FY15 results
Dividend Payout: 25% of PAT
FY15 Final Dividend at Rs. 7.5 per share. Total dividend for FY15 at Rs. 10.5 per share
FY15 Dividend Payout: ~25% of PAT
38

Way Forward
39
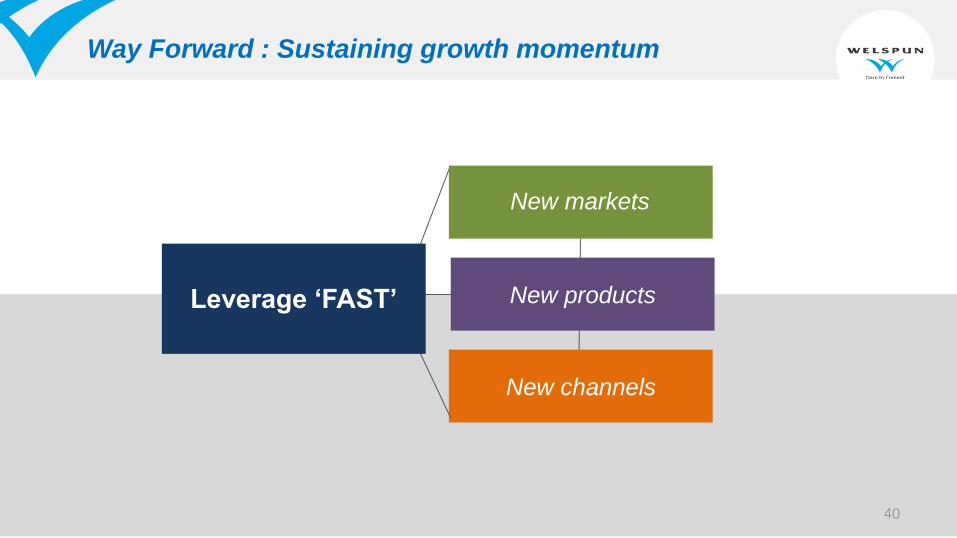
Way Forward : Sustaining growth momentum
New products
New channels
New markets
Leverage ‘FAST’
40
Thank You
For further details, please contact:
Altaf Jiwani
Director (Finance) - Welspun India Limited
Email: [email protected]
Akhil Jindal
Director – Group Finance and Strategy
Email: [email protected]
Company Website: www.welspunindia.com
Harish Venkateswaran
General Manager - Group Finance and Strategy
Email: [email protected]
41