Embed Size (px)
Citation preview
J. K. Dietrich - FBE 532 – Spring, 2006
Module IV: Financial Management:Strategy -- Business and Financial
Planning
Week 10 – March 30, 2006
J. K. Dietrich - FBE 532 – Spring, 2006
Objectives
This class discussion will show you how to analyze a firm’s proposed financial strategy is linked to its business strategy using the concept of sustainable growth
We also examine the strategic role of financial flexibility
We use two examples to illustrate these concepts: Telefonos of Chile and Massey-Ferguson Ltd.
J. K. Dietrich - FBE 532 – Spring, 2006
Sustainable Growth Theory
How fast can a firm grow when it does not rely on new equity for funding?
Sustainable growth theory is useful because it highlights– Limits of internal financing– The need for external financing– Inconsistencies between business and financial
objectives
J. K. Dietrich - FBE 532 – Spring, 2006
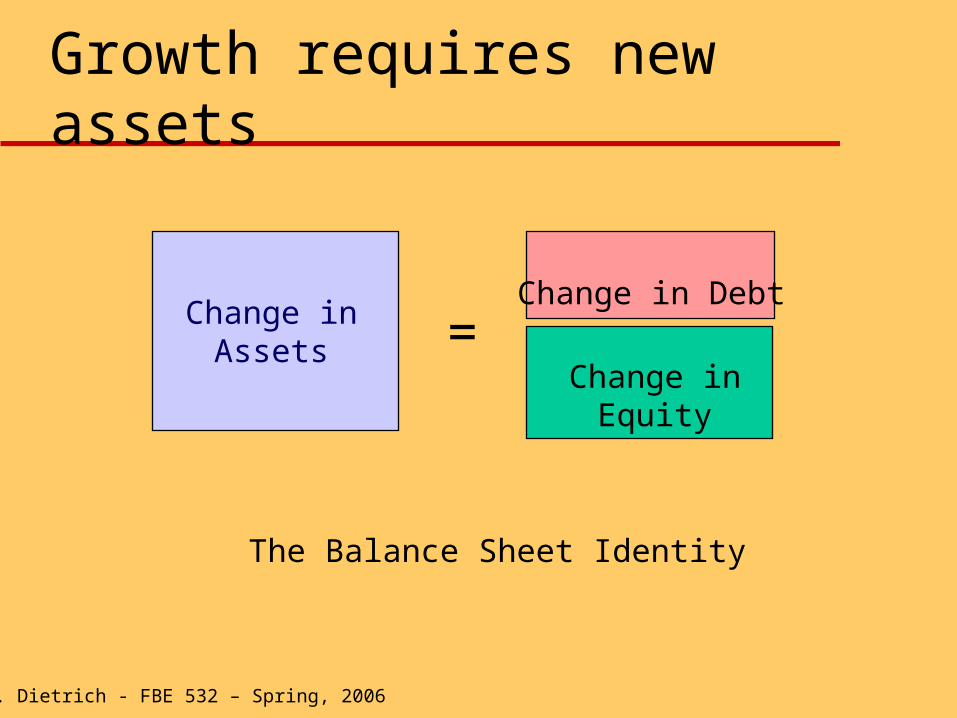
Growth requires new assets
Change in Assets =
Change in Equity
Change in Debt
The Balance Sheet Identity
J. K. Dietrich - FBE 532 – Spring, 2006
Sustainable Growth: Derivation
Sustainable growth models are based on a number of simplifying assumptions
Assumptions– Constant returns to scale technology– Fixed reinvestment ratio– New equity only from retained earnings
J. K. Dietrich - FBE 532 – Spring, 2006
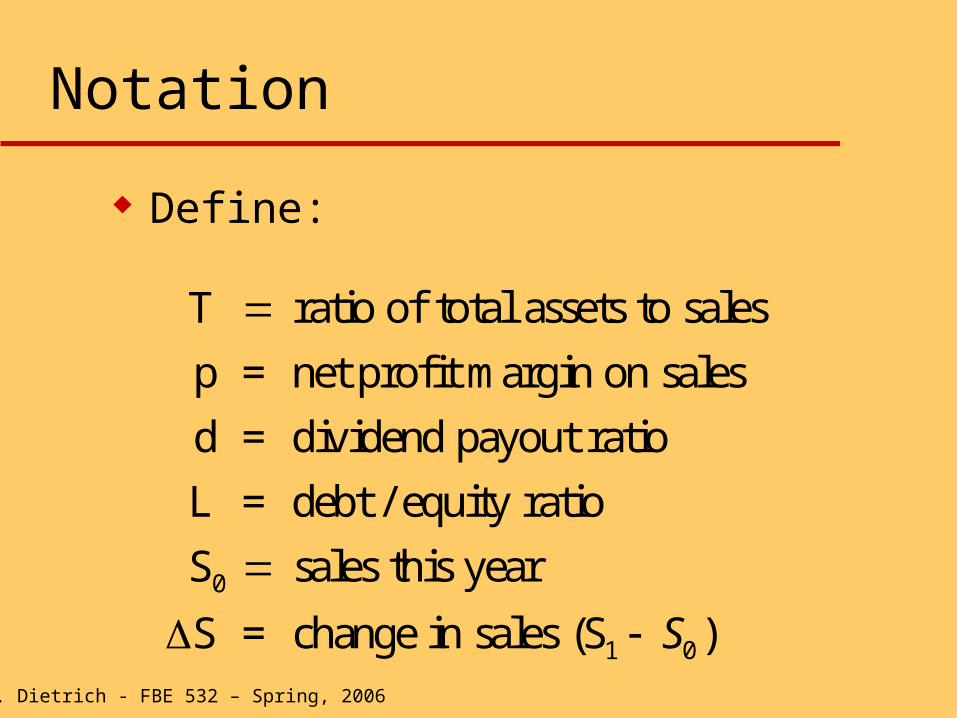
Notation
Define:
T ratio of total assets to sales
p = net profit margin on sales
d = dividend payout ratio
L = debt / equity ratio
S sales this year
S = change in sales (S0
1
S0)
J. K. Dietrich - FBE 532 – Spring, 2006
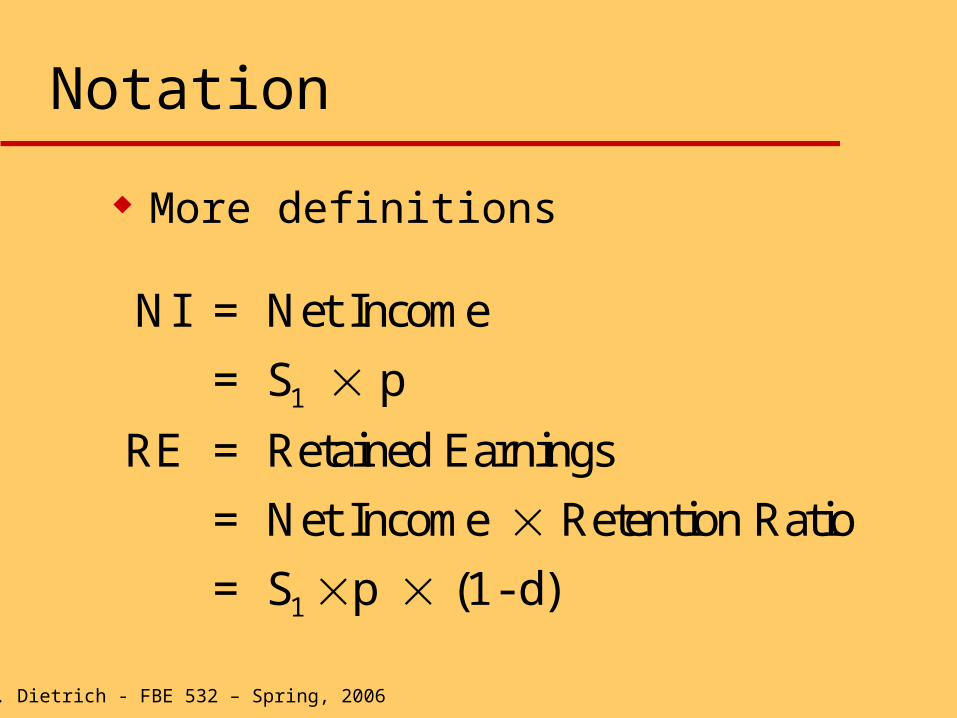
Notation
More definitions
NI = Net Income
= S p
RE = Retained Earnings
= Net Income Retention Ratio
= S p (1- d)
1
1
J. K. Dietrich - FBE 532 – Spring, 2006
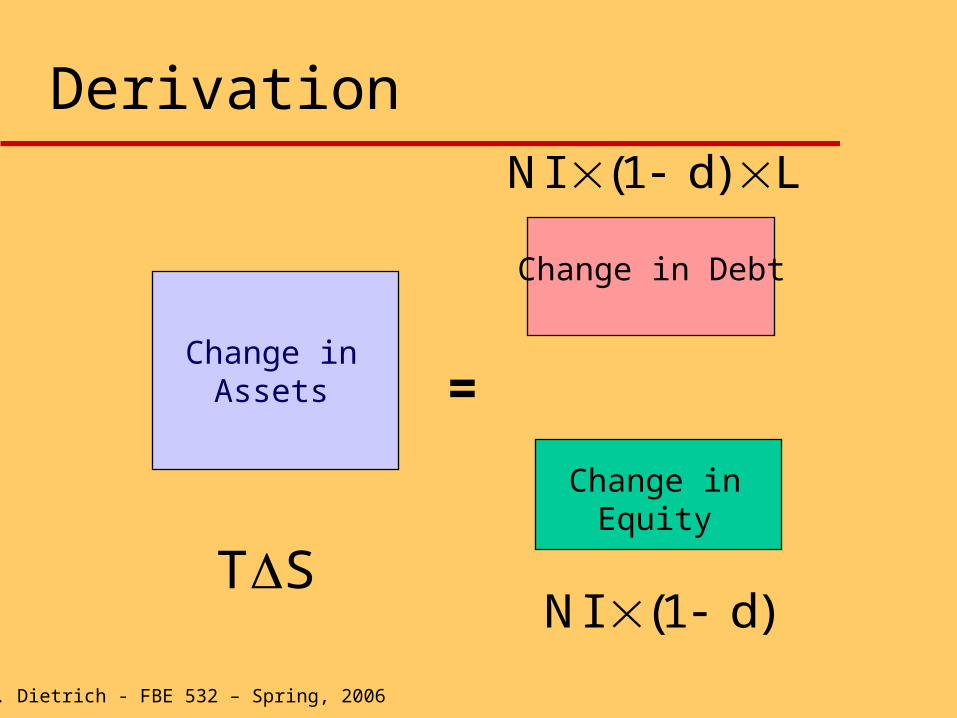
Derivation
Change in Assets
T S
=
Change in Debt
Change in Equity
NI (1 d) L
NI (1 d)
J. K. Dietrich - FBE 532 – Spring, 2006
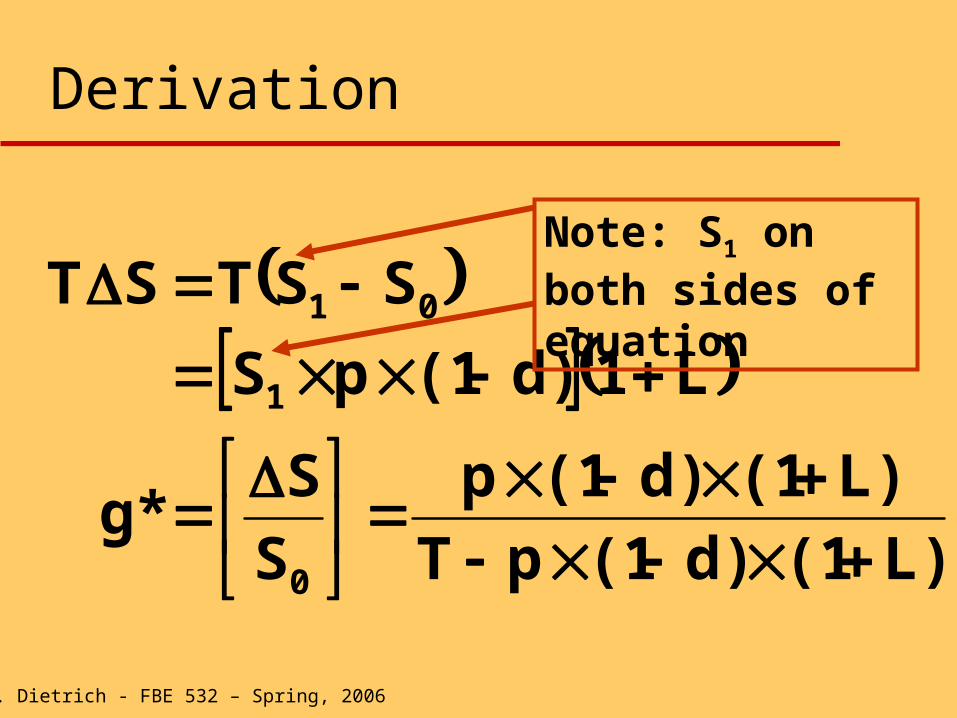
Derivation
L)(1d)(1pT
L)(1d)(1p
S
Sg*
L1d)(1pS
SSTST
0
1
01
Note: S1 on both sides of equation
J. K. Dietrich - FBE 532 – Spring, 2006
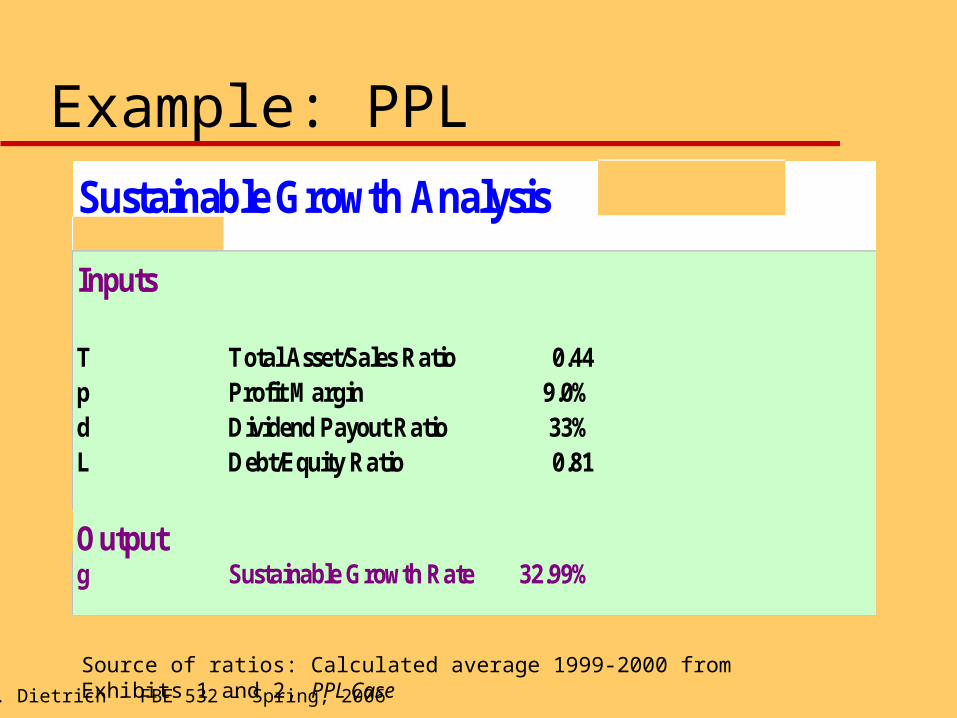
Example: PPLSustainable Growth Analysis
Inputs
T Total Asset/Sales Ratio 0.44p Profit Margin 9.0%d Dividend Payout Ratio 33%L Debt/Equity Ratio 0.81
Outputg Sustainable Growth Rate 32.99%
Source of ratios: Calculated average 1999-2000 from Exhibits 1 and 2, PPL Case
11J. K. Dietrich - FBE 532 – Spring, 2006
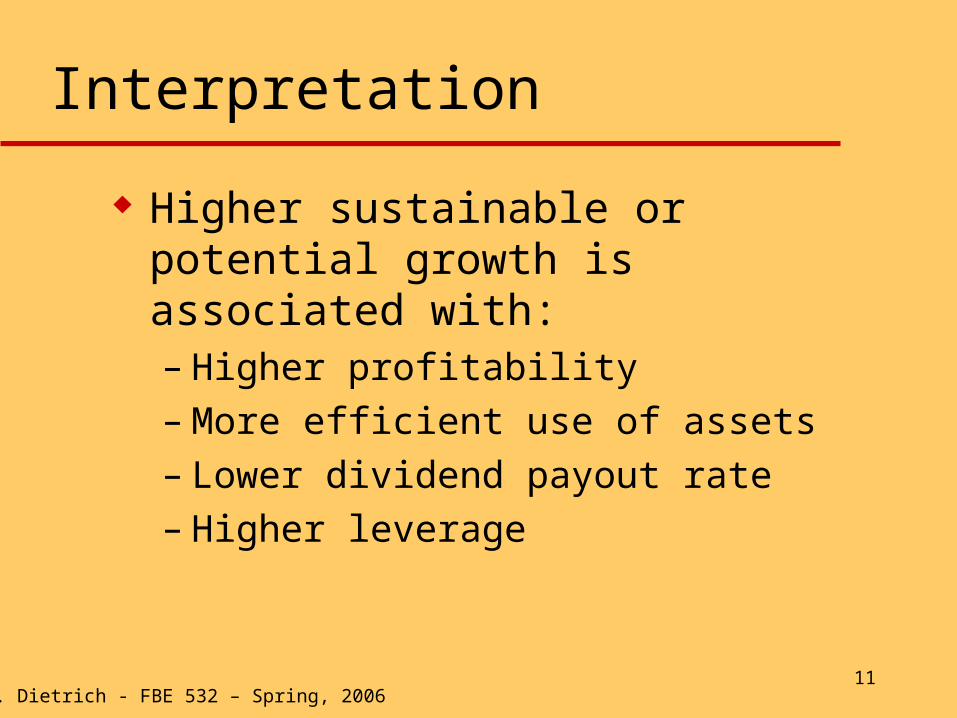
Interpretation
Higher sustainable or potential growth is associated with:– Higher profitability– More efficient use of assets– Lower dividend payout rate– Higher leverage
12J. K. Dietrich - FBE 532 – Spring, 2006
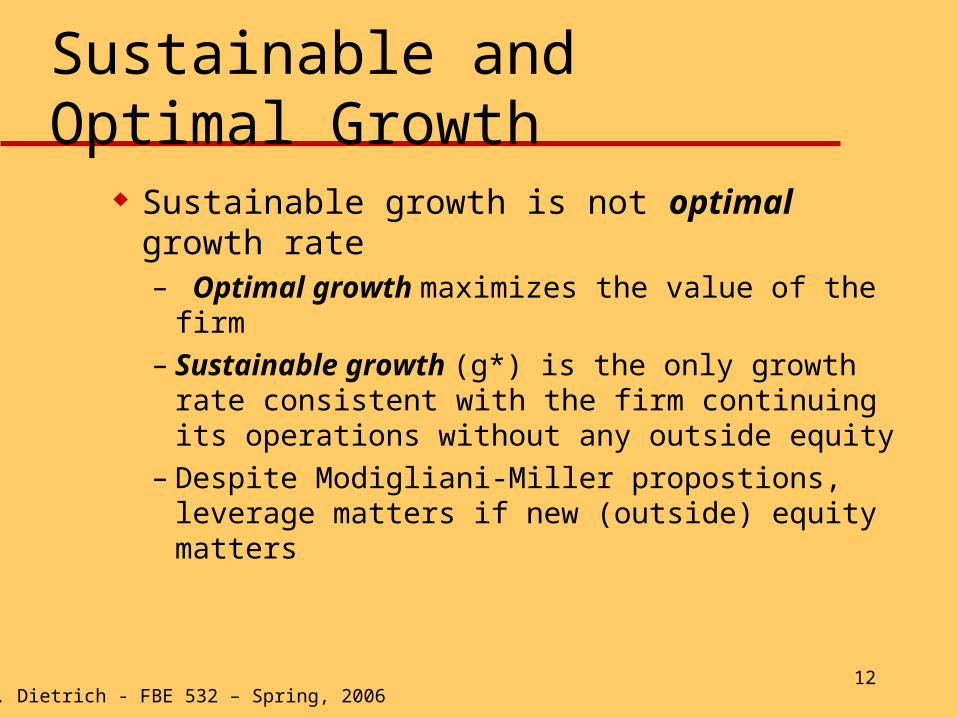
Sustainable and Optimal Growth
Sustainable growth is not optimal growth rate– Optimal growth maximizes the value of the firm– Sustainable growth (g*) is the only growth rate
consistent with the firm continuing its operations without any outside equity
– Despite Modigliani-Miller propostions, leverage matters if new (outside) equity matters
J. K. Dietrich - FBE 532 – Spring, 2006
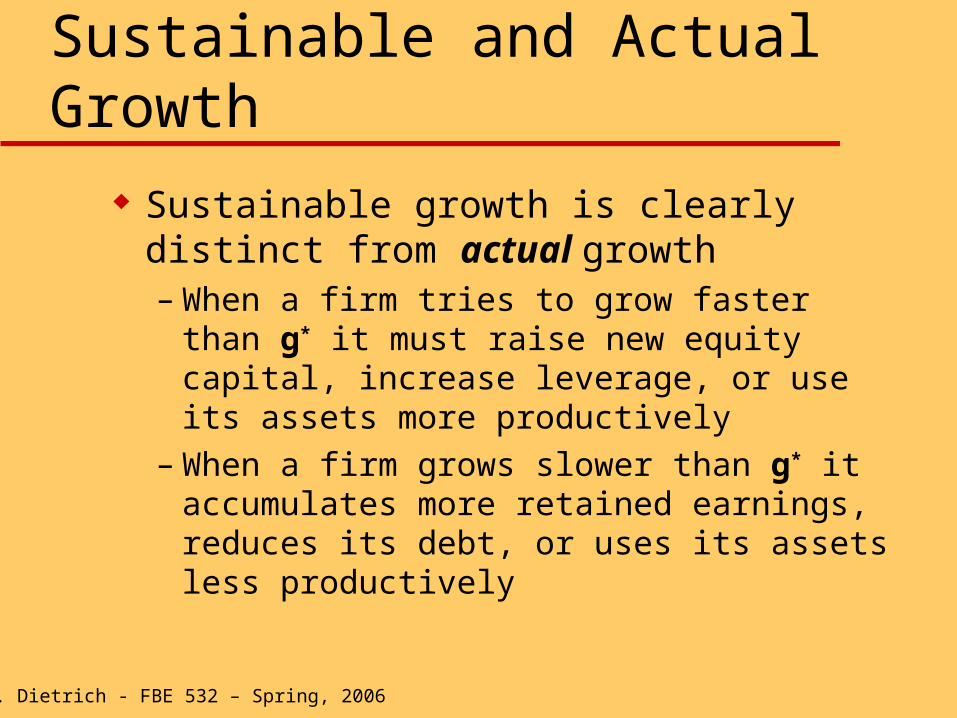
Sustainable and Actual Growth
Sustainable growth is clearly distinct from actual growth– When a firm tries to grow faster than g* it must
raise new equity capital, increase leverage, or use its assets more productively
– When a firm grows slower than g* it accumulates more retained earnings, reduces its debt, or uses its assets less productively
J. K. Dietrich - FBE 532 – Spring, 2006
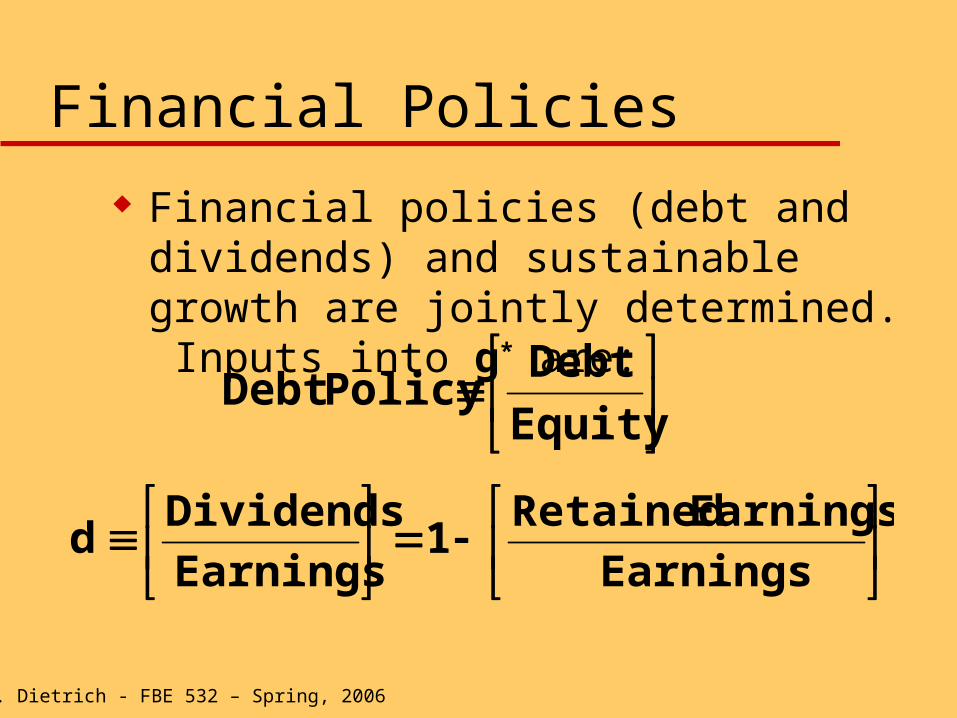
Financial Policies
Financial policies (debt and dividends) and sustainable growth are jointly determined. Inputs into g* are:
Equity
Debt PolicyDebt
Earnings
Earnings Retained1
Earnings
Dividendsd
J. K. Dietrich - FBE 532 – Spring, 2006
Key is Consistency
You cannot choose dividend and debt policy independently of your desired product market strategy expressed in terms of growth in sales or assets
Recognition of the consistency between financial constraints and growth plans is essential in making intelligent strategic decisions
J. K. Dietrich - FBE 532 – Spring, 2006
Useful Simplification of g*
A convenient simplification of the sustainable growth model is:
(Rough estimate you can do in your head.) You can use spreadsheet SUSGROW.XLS
to compute using complete formula
ROEd1g*
J. K. Dietrich - FBE 532 – Spring, 2006
Example: Telefonos de Chile
Following privatization in 1991, Telefonos was growing at 30% annual rate
It needed $2 to $5 billion to finance demand in Chile– Use data in following slides– What is sustainable growth rate and what can
you conclude from this analysis?
J. K. Dietrich - FBE 532 – Spring, 2006
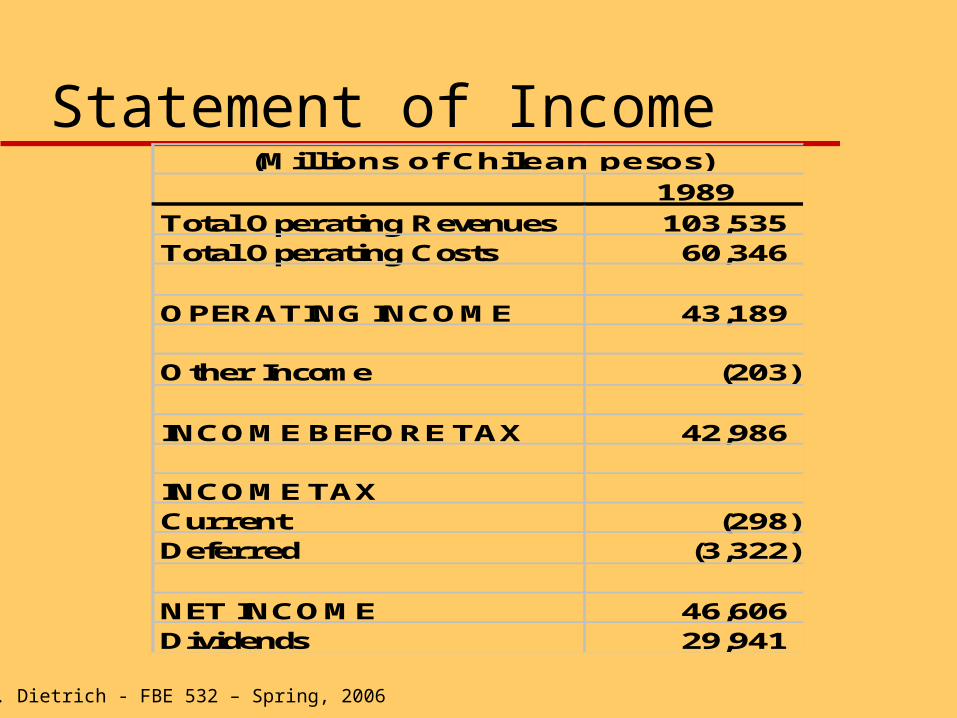
Statement of Income1989
Total Operating Revenues 103,535 Total Operating Costs 60,346
OPERATING INCOME 43,189
Other Income (203)
INCOME BEFORE TAX 42,986
INCOME TAXCurrent (298) Deferred (3,322)
NET INCOME 46,606 Dividends 29,941
(Millions of Chilean pesos)
J. K. Dietrich - FBE 532 – Spring, 2006
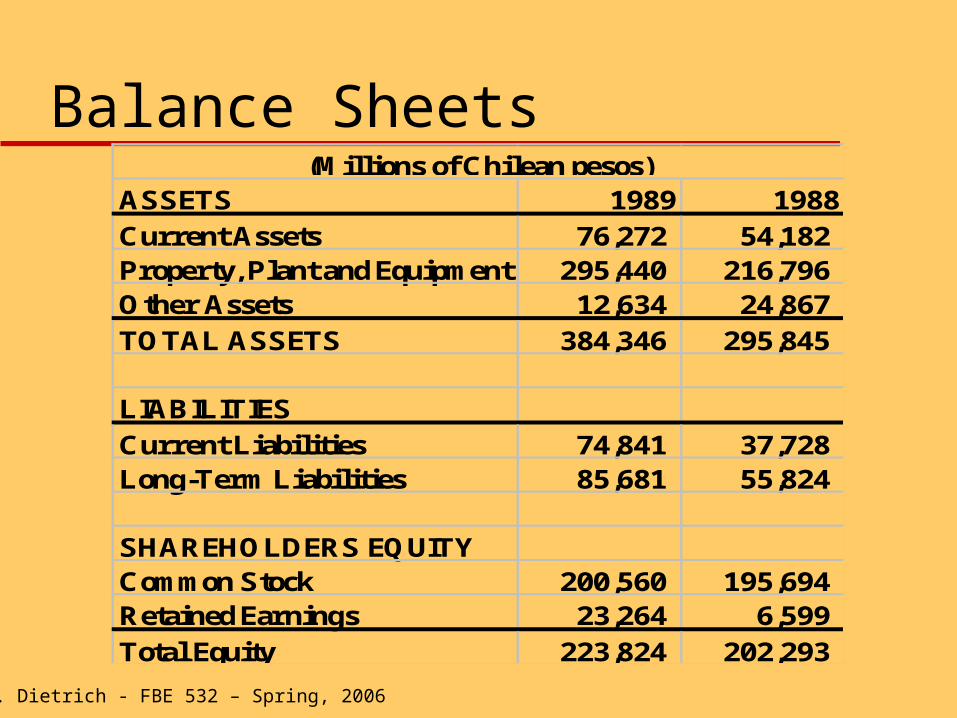
Balance SheetsASSETS 1989 1988
Current Assets 76,272 54,182 Property, Plant and Equipment 295,440 216,796 Other Assets 12,634 24,867
TOTAL ASSETS 384,346 295,845
LIABILITIES
Current Liabilities 74,841 37,728 Long-Term Liabilities 85,681 55,824
SHAREHOLDERS EQUITYCommon Stock 200,560 195,694 Retained Earnings 23,264 6,599
Total Equity 223,824 202,293
(Millions of Chilean pesos)
J. K. Dietrich - FBE 532 – Spring, 2006
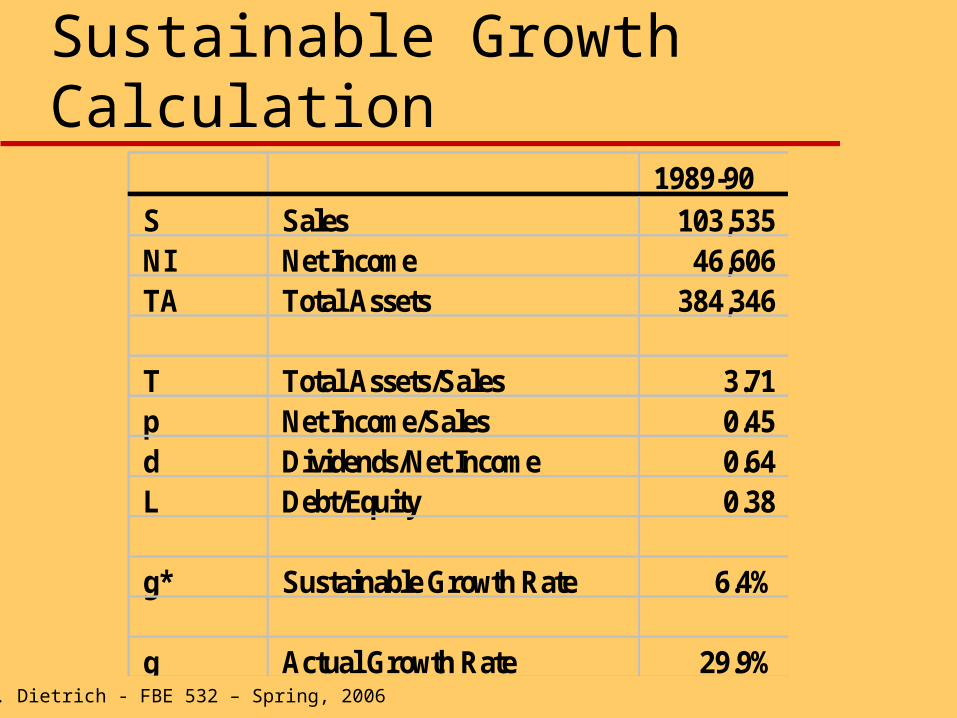
Sustainable Growth Calculation1989-90
S Sales 103,535 NI Net Income 46,606 TA Total Assets 384,346
T Total Assets/Sales 3.71 p Net Income/Sales 0.45 d Dividends/Net Income 0.64 L Debt/Equity 0.38
g* Sustainable Growth Rate 6.4%
g Actual Growth Rate 29.9%
J. K. Dietrich - FBE 532 – Spring, 2006
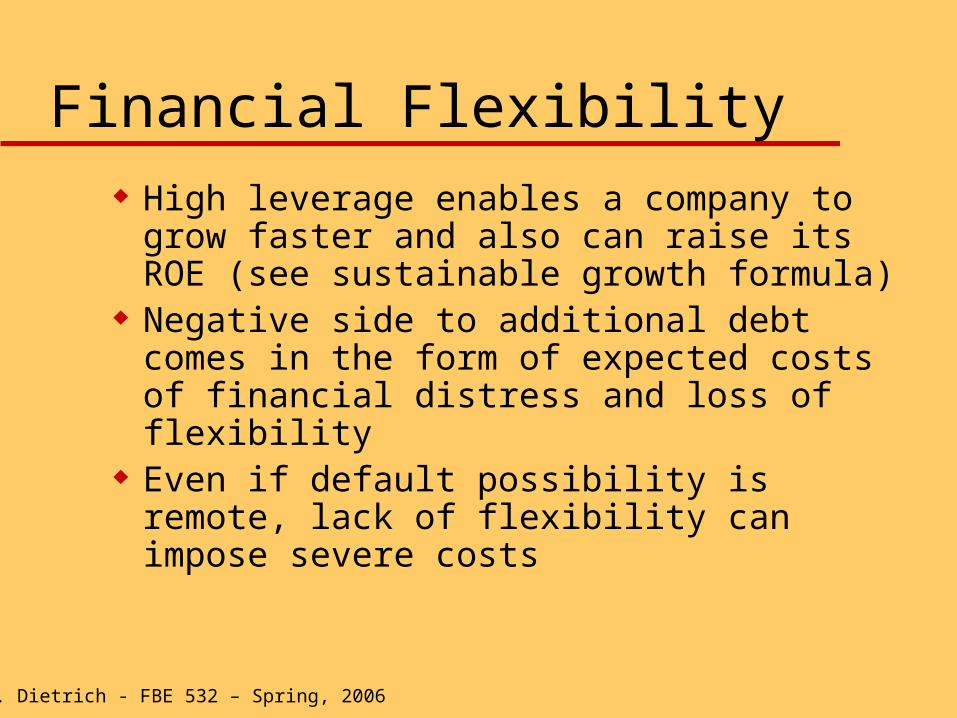
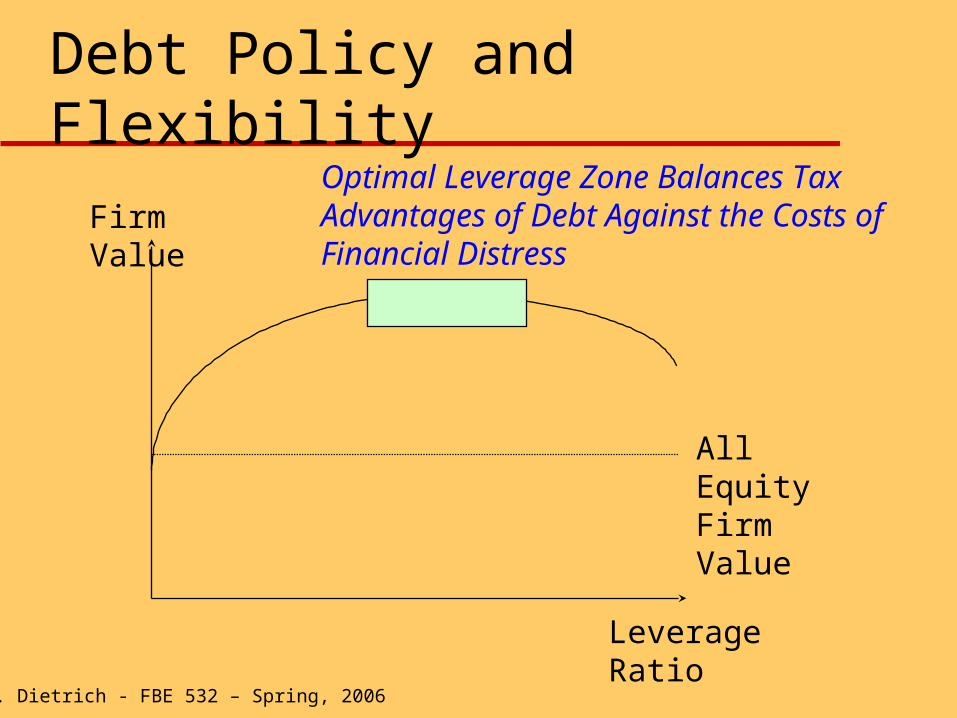
Financial Flexibility
High leverage enables a company to grow faster and also can raise its ROE (see sustainable growth formula)
Negative side to additional debt comes in the form of expected costs of financial distress and loss of flexibility
Even if default possibility is remote, lack of flexibility can impose severe costs
J. K. Dietrich - FBE 532 – Spring, 2006
Debt Policy and Flexibility
Leverage Ratio
Firm Value
All Equity Firm Value
Optimal Leverage Zone Balances Tax Advantages of Debt Against the Costs of Financial Distress
J. K. Dietrich - FBE 532 – Spring, 2006
Example: Massey-Ferguson
In the 1970s, Massey-Ferguson, John Deere, and International Harvester (Navistar) had virtually all the North American market in heavy farm equipment
Massey increased its leverage to finance acquisitions and undertook an aggressive growth strategy targeting less-developed countries and Europe
J. K. Dietrich - FBE 532 – Spring, 2006
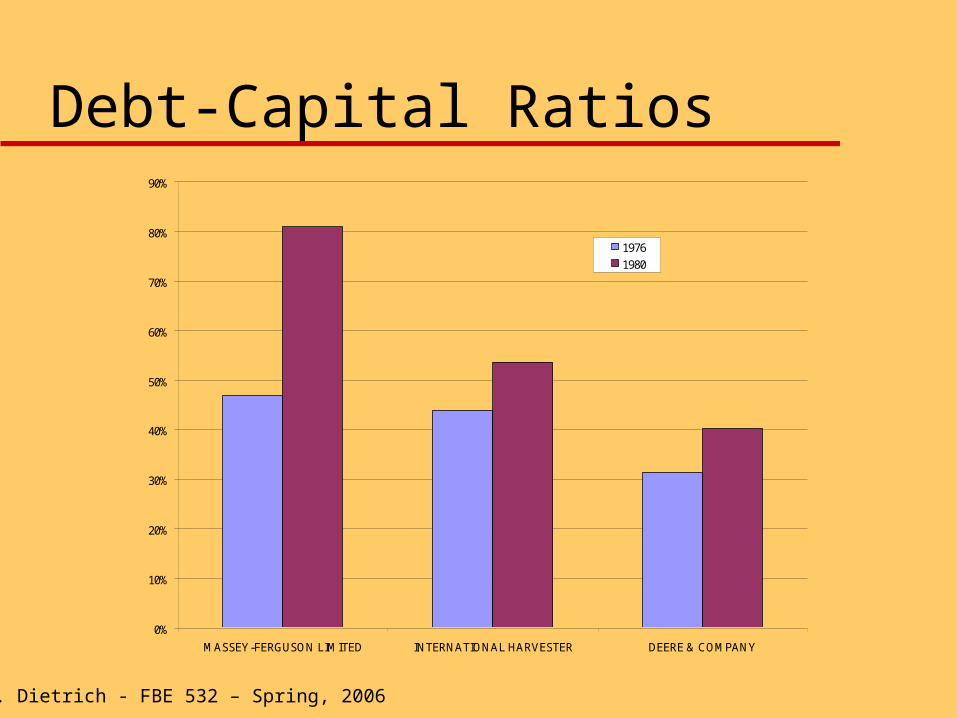
Debt Policy
Massey financed its aggressive growth with debt, as did International Harvester
Deere was more conservatively financed, especially with respect to use of short-term debt
All three had roughly equal shares of the market
J. K. Dietrich - FBE 532 – Spring, 2006
Debt-Capital Ratios
0%
10%
20%
30%
40%
50%
60%
70%
80%
90%
MASSEY-FERGUSON LIMITED INTERNATIONAL HARVESTER DEERE & COMPANY
1976
1980
J. K. Dietrich - FBE 532 – Spring, 2006
Events
When the Fed raised interest rates, interest payments for Massey and Harvester increased dramatically
Simultaneously, durable good purchases fell as producers faced higher service costs.
As a result, Massey and Harvester suffered huge losses while Deere used new debt financing to expand aggressively.
J. K. Dietrich - FBE 532 – Spring, 2006
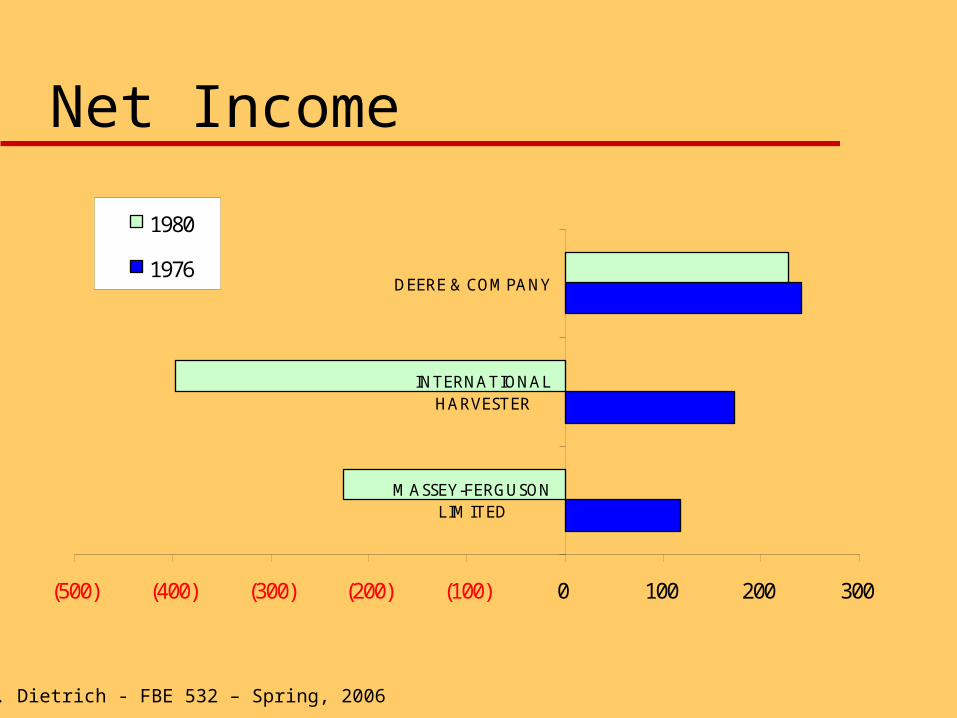
Net Income
(500) (400) (300) (200) (100) 0 100 200 300
MASSEY-FERGUSONLIMITED
INTERNATIONALHARVESTER
DEERE & COMPANY
1980
1976
J. K. Dietrich - FBE 532 – Spring, 2006
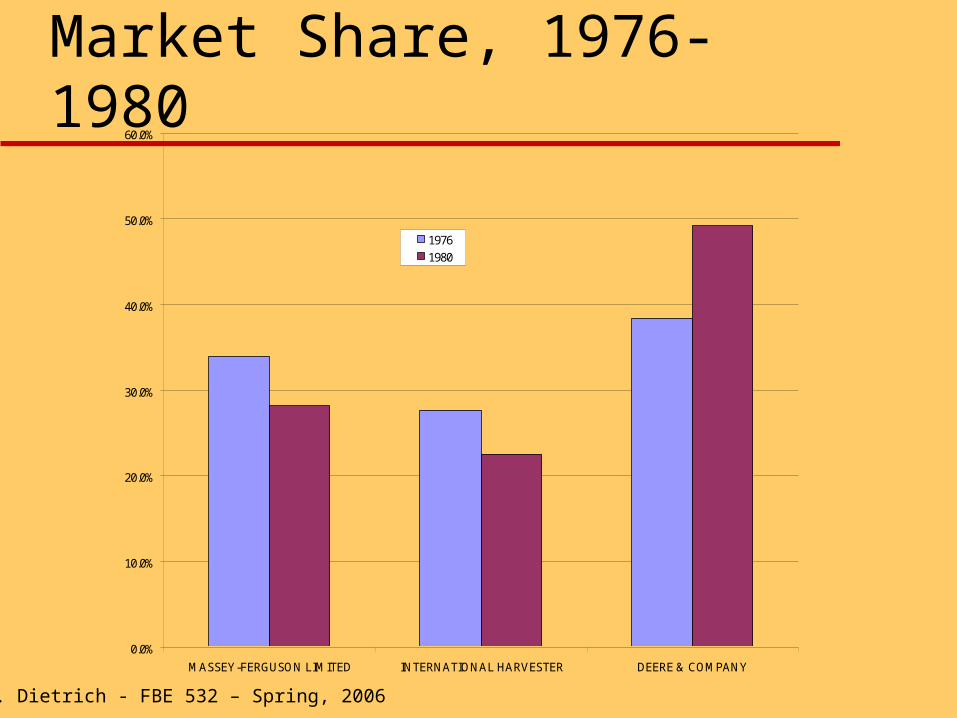
Market Share, 1976-1980
0.0%
10.0%
20.0%
30.0%
40.0%
50.0%
60.0%
MASSEY-FERGUSON LIMITED INTERNATIONAL HARVESTER DEERE & COMPANY
1976
1980
J. K. Dietrich - FBE 532 – Spring, 2006
Outcome
Faced with falling market share, rising costs, and customers who were concerned about obtaining spare parts and service should Massey fail, the firm fell into financial distress.
Massey’s original shareholders were wiped out as a result of the restructuring.
J. K. Dietrich - FBE 532 – Spring, 2006
Review
The business and financial strategies of the firm are not independent.– The sustainable growth model is useful as a
diagnostic tool, but use it wisely. A key element of financial strategy is
flexibility. This is hard to quantify, but is often critical in practice.
J. K. Dietrich - FBE 532 – Spring, 2006
Next Week – April 4 & 6, 2006
Review RWJ, Chapter 18, on dividend strategy for make-up class on April 4
We will also discuss Clarkson Lumber case then Prepare Avon Products case for discussion, although
write-up and discussion will not be due until Thursday, April 6
Begin analysis of international sources of capital and review of Genset Initial Public Offering case as soon as possible for write-up and discussion on April 13