Embed Size (px)
Citation preview
J. Fluid Mech. (2013), vol. 730, pp. 379–391. c© Cambridge University Press 2013 379doi:10.1017/jfm.2013.362
Three-dimensionality in the wake of a rapidlyrotating cylinder in uniform flow
A. Rao1, J. S. Leontini1,†, M. C. Thompson1 and K. Hourigan1,2
1Fluids Laboratory for Aeronautical and Industrial Research (FLAIR), Department of Mechanical andAerospace Engineering, Monash University, Melbourne, Victoria 3800, Australia
2Division of Biological Engineering, Monash University, Melbourne, Victoria 3800, Australia
(Received 25 February 2013; revised 23 April 2013; accepted 10 July 2013)
The flow around an isolated cylinder spinning at high rotation rates in free streamis investigated. The existence of two steady two-dimensional states is confirmed, asis the existence of a secondary mode of vortex shedding. The stability of the twosteady states to three-dimensional perturbations is established using linear stabilityanalysis. At lower rotation rates on the first steady state, two three-dimensional modesare confirmed, and their structure and curves of marginal stability as a functionof rotation rate and Reynolds number are determined. One mode (named mode E)appears consistent with a hyperbolic instability in the wake, while the second (namedmode F) appears to be a centrifugal instability of the flow very close to the cylindersurface. At higher rotation rates on the second steady state, a single three-dimensionalmode due to centrifugal instability (named mode F′) is found. This mode becomesincreasingly difficult to excite as the rotation rate is increased.
Key words: parametric instability, vortex flows, wakes/jets
1. IntroductionThe flow associated with a rapidly rotating isolated cylinder in free stream is
investigated. The flow is a function of two independent parameters: the Reynoldsnumber Re= UD/ν, and the normalized rotation rate α = ωD/2U. Here, U is the freestream velocity, D is the cylinder diameter, ν is the kinematic viscosity and ω is therotation rate. The definition of α is such that it represents the ratio of the cylindersurface speed to the free stream velocity. When α = 0 (no rotation), the well-studiedproblem of the flow past a rigid cylinder is recovered. With zero inflow (only rotation),the flow becomes that of a rotating cylinder in a quiescent fluid. As such, α acts asa type of bridge between these two fundamental flows, one wake-dominated, the otherrotation-dominated. For the wake flows, the two-dimensional flows for α < 2.5, andtheir subsequent loss of stability due to a range of three-dimensional instabilities, hasbeen well described by Rao et al. (2013).
The pertinent results from that study to the current paper are as follows. Benard-von Karman-type vortex shedding was found to be suppressed for all Re for α > 1.9,confirming and extending the findings of Mittal & Kumar (2003). On this steady
† Email address for correspondence: [email protected]
380 A. Rao, J. S. Leontini, M. C. Thompson and K. Hourigan
flow, two three-dimensional instabilities were discovered using linear stability analysis,named mode E and mode F. Mode E was shown to have an aspect of hyperbolicinstability occurring at the cusp of a single recirculation region in the wake. Mode E isstationary, representing the transition from a steady two-dimensional flow to a steadythree-dimensional flow. Mode F was shown to be due to a centrifugal instability ofthe closed region encircling the cylinder. Unlike mode E, mode F varies with time,introducing a new frequency to the flow. This frequency appears to be associated witha travelling or modulated wave solution along the span of the cylinder.
A number of studies exist at higher rotation rates, particularly in the range2.5 < α < 6. Mittal & Kumar (2003) covered this range for Re = 200 in detail,explicitly showing the existence of two steady solutions, with a hysteretic transitionbetween the two in the range 4.8 6 α 6 5.0. These two solutions were differentiatedby a change in length of the trailing shear layers that form the wake, and a movementof the hyperbolic point that forms in the flow where the fluid that orbits the cylinderrejoins the fluid that flows past. Using this movement of the hyperbolic point as adistinguishing feature, the results of Stojkovic, Breuer & Durst (2002) at Re = 100also show evidence of a change in the steady solution in the range 4.56 α 6 5.5.
The study from Pralits, Brandt & Giannetti (2010) explicitly tracked the motion ofthis hyperbolic point in the flow as α was varied for Re = 100. The hyperbolic pointwas shown to typically move away from the cylinder across the flow, before alsomoving upstream (in fact moving beyond the central axis of the cylinder) for α > 5.This paper then showed that near α = 5, the flow changes between the two previouslyidentified solutions. In fact, three stable solutions were identified as part of a carefulcontinuation study.
As well as the two steady solutions, a periodic solution also exists at highervalues of α. Stojkovic et al. (2003) identified this low-frequency single-sided vortexshedding over the range 60 6 Re 6 200, and Mittal & Kumar (2003) showed that itstems from a Hopf bifurcation from the steady solution at lower rotation rates. Thisshedding regime, commonly known as mode II shedding, was observed in the recentexperimental investigations of Kumar, Cantu & Gonzalez (2011). The two-dimensionalDNS studies of El Akoury et al. (2008) showed that the range of rotation rates overwhich the mode II shedding was observed increased with Reynolds number.
A stability analysis and full three-dimensional DNS study at Re = 200 fromMeena et al. (2011) showed that the flow was unstable to spanwise perturbationsfor 3.1 6 α 6 5, spanning the two previously established steady solutions. Forα 6 4.3, the unstable modes were found to have purely real eigenvalues, and forα > 4.3 (presumably a different base flow), the unstable modes obtained had complexeigenvalues. Interestingly, their three-dimensional simulations at α ' 3 show theonset of centrifugal instabilities along the span of the cylinder, which Rao et al.(2013) demonstrated using stability analysis should have complex eigenvalues, or betemporally varying. Therefore, there seems to be some further work required to fullyexplain what occurs at these moderate values of α.
This paper confirms the existence of two steady solution states (here referred toas steady state I and steady state II ), and the existence of a low-frequency vortexshedding for a small range of α for Re> 50. The stability of steady state I and steadystate II to three-dimensional perturbations is then ascertained using linear stabilityanalysis. Two three-dimensional modes are found to grow in steady state I; these arethe modes identified as mode E and mode F in Rao et al. (2013). However, the shapeof the curve of marginal stability in the (Re, α) plane is quite complicated for bothmodes, relating to very subtle changes in steady state I. A third three-dimensional

Three-dimensionality in the wake of a rapidly rotating cylinder 381
mode is found to grow in steady state II. Like mode F, this mode appears to be due toa centrifugal instability of the enclosed region of fluid orbiting the cylinder, and so itis named mode F′. The curve of marginal stability for this mode is quite simple, withRec increasing almost linearly with α.
2. Method and validation2.1. Numerical method and stability analysis
The numerical method employed is identical to that described in Rao et al. (2013),and so only a brief overview is provided here. Simulations of the two-dimensional flowwere conducted using a spectral-element method (Thompson, Hourigan & Sheridan1996; Karniadakis & Sherwin 2005; Thompson et al. 2006; Leontini, Thompson &Hourigan 2007; Lo Jacono et al. 2010; Stewart et al. 2010). Typically, the time-dependent Navier–Stokes equations were integrated until the flow reached a steadystate, or converged to a periodic oscillation. For cases where a steady solution wasdesired, but the flow was naturally periodic (where mode II shedding was observed),the steady spectral-element representation of the Navier–Stokes equations was solvedusing a Newton–Raphson method.
The stability of these steady solutions was then investigated using global linearstability analysis (Barkley & Henderson 1996; Schmid & Henningson 2001).Essentially, this method assesses whether linear perturbations, with a fixed spanwisewavelength λ, grow or decay over time. If they grow, the two-dimensional base flow issaid to be unstable to three-dimensional perturbations at the given wavelength.
The two primary outputs of this method are the growth rate (which governs stability)and the mode shape associated with this growth rate. The growth rate is defined bya complex multiplier, µ, which can be interpreted as the ratio of the size of theperturbation from one time to the next. If |µ|> 1, the perturbation grows and the baseflow is unstable. Hence, when |µ| = 1, the flow is said to be marginally stable. If µhas a non-zero imaginary component, the three-dimensional mode introduces a newfrequency to the flow. If the base flow is steady (as the base flows of this paper are),then the three-dimensional mode is periodic in time. The complex growth rate σ isrelated to the multiplier µ = eσT , where T is the period of sampling. For base flowsthat are periodic, the value of T is equal to the shedding period, while for steady baseflows such as those studied in this paper, the value of T can be an arbitrary quantity.
The mode shape gives some indication of the regions of the base flow whereperturbations grow, and therefore provides insight into the physical mechanism thatleads to instability. A more detailed explanation is provided in Rao et al. (2013).
2.2. Resolution studiesTwo meshes, M1 and M2, were employed to obtain the solutions for rotation ratesbelow and above α = 5, respectively. The distribution of the elements was moreconcentrated in the vicinity of the cylinder for M2, where large gradients in the floware observed, particularly for high rotation rates. Both meshes used polynomial shapefunctions of seventh order and the boundaries were located 100D from the cylinder toavoid any blockage. Spatial resolution of the two domains was tested at the highestReynolds number, Re = 400, at four different rotation rates. Lift and drag forces werefound to vary by <1 % with further increases in resolution, giving a high degree ofconfidence in the results obtained.
To validate these results, lift and drag coefficients at Re = 200 as a function of αare compared to the results of previous studies in table 1. Some discrepancy exists,
382 A. Rao, J. S. Leontini, M. C. Thompson and K. Hourigan
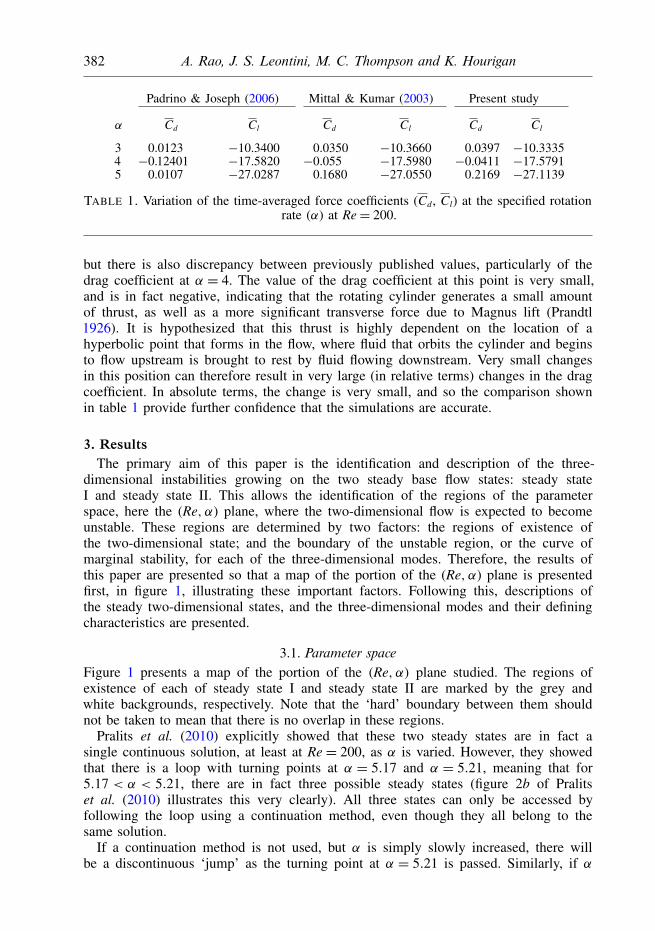
Padrino & Joseph (2006) Mittal & Kumar (2003) Present study
α Cd Cl Cd Cl Cd Cl
3 0.0123 −10.3400 0.0350 −10.3660 0.0397 −10.33354 −0.12401 −17.5820 −0.055 −17.5980 −0.0411 −17.57915 0.0107 −27.0287 0.1680 −27.0550 0.2169 −27.1139
TABLE 1. Variation of the time-averaged force coefficients (Cd, Cl) at the specified rotationrate (α) at Re= 200.
but there is also discrepancy between previously published values, particularly of thedrag coefficient at α = 4. The value of the drag coefficient at this point is very small,and is in fact negative, indicating that the rotating cylinder generates a small amountof thrust, as well as a more significant transverse force due to Magnus lift (Prandtl1926). It is hypothesized that this thrust is highly dependent on the location of ahyperbolic point that forms in the flow, where fluid that orbits the cylinder and beginsto flow upstream is brought to rest by fluid flowing downstream. Very small changesin this position can therefore result in very large (in relative terms) changes in the dragcoefficient. In absolute terms, the change is very small, and so the comparison shownin table 1 provide further confidence that the simulations are accurate.
3. ResultsThe primary aim of this paper is the identification and description of the three-
dimensional instabilities growing on the two steady base flow states: steady stateI and steady state II. This allows the identification of the regions of the parameterspace, here the (Re, α) plane, where the two-dimensional flow is expected to becomeunstable. These regions are determined by two factors: the regions of existence ofthe two-dimensional state; and the boundary of the unstable region, or the curve ofmarginal stability, for each of the three-dimensional modes. Therefore, the results ofthis paper are presented so that a map of the portion of the (Re, α) plane is presentedfirst, in figure 1, illustrating these important factors. Following this, descriptions ofthe steady two-dimensional states, and the three-dimensional modes and their definingcharacteristics are presented.
3.1. Parameter spaceFigure 1 presents a map of the portion of the (Re, α) plane studied. The regions ofexistence of each of steady state I and steady state II are marked by the grey andwhite backgrounds, respectively. Note that the ‘hard’ boundary between them shouldnot be taken to mean that there is no overlap in these regions.
Pralits et al. (2010) explicitly showed that these two steady states are in fact asingle continuous solution, at least at Re = 200, as α is varied. However, they showedthat there is a loop with turning points at α = 5.17 and α = 5.21, meaning that for5.17 < α < 5.21, there are in fact three possible steady states (figure 2b of Pralitset al. (2010) illustrates this very clearly). All three states can only be accessed byfollowing the loop using a continuation method, even though they all belong to thesame solution.
If a continuation method is not used, but α is simply slowly increased, there willbe a discontinuous ‘jump’ as the turning point at α = 5.21 is passed. Similarly, if α
Three-dimensionality in the wake of a rapidly rotating cylinder 383
Mode EMode F
Mode F
Re
2
3
4
5
6
7
50 100 150 200 250 3000
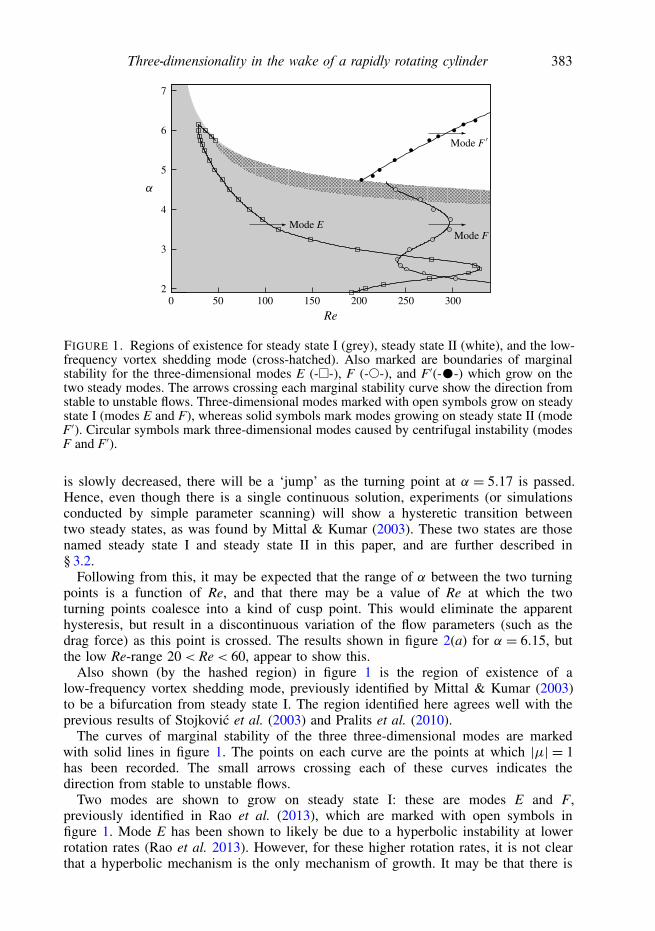
FIGURE 1. Regions of existence for steady state I (grey), steady state II (white), and the low-frequency vortex shedding mode (cross-hatched). Also marked are boundaries of marginalstability for the three-dimensional modes E (-�-), F (-©-), and F′(-•-) which grow on thetwo steady modes. The arrows crossing each marginal stability curve show the direction fromstable to unstable flows. Three-dimensional modes marked with open symbols grow on steadystate I (modes E and F), whereas solid symbols mark modes growing on steady state II (modeF′). Circular symbols mark three-dimensional modes caused by centrifugal instability (modesF and F′).
is slowly decreased, there will be a ‘jump’ as the turning point at α = 5.17 is passed.Hence, even though there is a single continuous solution, experiments (or simulationsconducted by simple parameter scanning) will show a hysteretic transition betweentwo steady states, as was found by Mittal & Kumar (2003). These two states are thosenamed steady state I and steady state II in this paper, and are further described in§ 3.2.
Following from this, it may be expected that the range of α between the two turningpoints is a function of Re, and that there may be a value of Re at which the twoturning points coalesce into a kind of cusp point. This would eliminate the apparenthysteresis, but result in a discontinuous variation of the flow parameters (such as thedrag force) as this point is crossed. The results shown in figure 2(a) for α = 6.15, butthe low Re-range 20< Re< 60, appear to show this.
Also shown (by the hashed region) in figure 1 is the region of existence of alow-frequency vortex shedding mode, previously identified by Mittal & Kumar (2003)to be a bifurcation from steady state I. The region identified here agrees well with theprevious results of Stojkovic et al. (2003) and Pralits et al. (2010).
The curves of marginal stability of the three three-dimensional modes are markedwith solid lines in figure 1. The points on each curve are the points at which |µ| = 1has been recorded. The small arrows crossing each of these curves indicates thedirection from stable to unstable flows.
Two modes are shown to grow on steady state I: these are modes E and F,previously identified in Rao et al. (2013), which are marked with open symbols infigure 1. Mode E has been shown to likely be due to a hyperbolic instability at lowerrotation rates (Rao et al. 2013). However, for these higher rotation rates, it is not clearthat a hyperbolic mechanism is the only mechanism of growth. It may be that there is
384 A. Rao, J. S. Leontini, M. C. Thompson and K. Hourigan
30 40 50
Steady state II
(b)(c)
Steadystate I
Steadystate II
(e) ( f )
Steadystate I
–0.15
0
0.15
0.30
20 60
Re
–0.10
0
0.10
0.20
0.30
0.40
4.5 5.0 5.54.0 6.0
–0.30
0.45(a) (b) (c)
(e) ( f )(d)
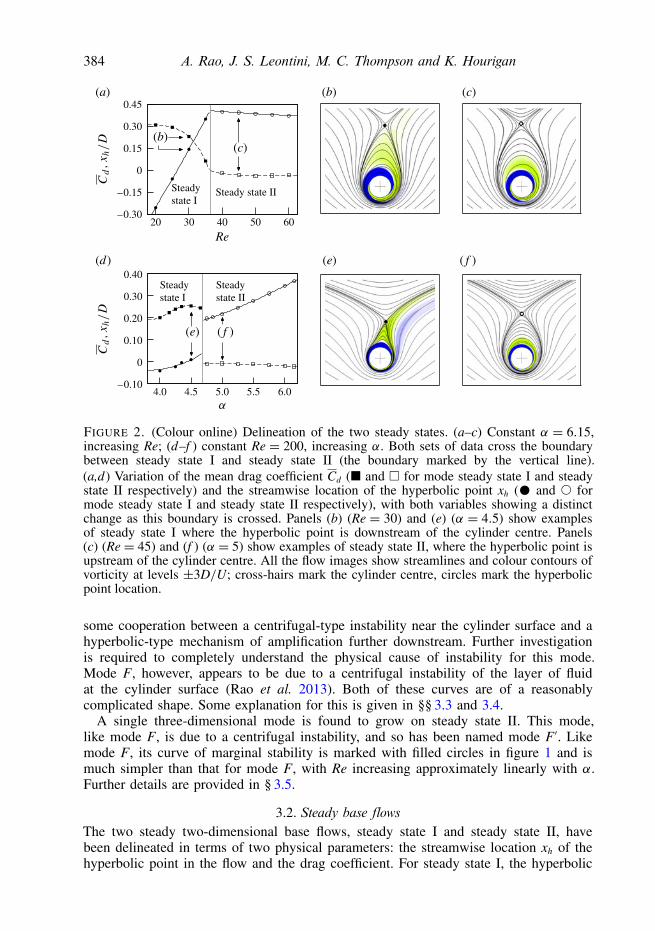
FIGURE 2. (Colour online) Delineation of the two steady states. (a–c) Constant α = 6.15,increasing Re; (d–f ) constant Re = 200, increasing α. Both sets of data cross the boundarybetween steady state I and steady state II (the boundary marked by the vertical line).(a,d) Variation of the mean drag coefficient Cd (� and � for mode steady state I and steadystate II respectively) and the streamwise location of the hyperbolic point xh (• and © formode steady state I and steady state II respectively), with both variables showing a distinctchange as this boundary is crossed. Panels (b) (Re = 30) and (e) (α = 4.5) show examplesof steady state I where the hyperbolic point is downstream of the cylinder centre. Panels(c) (Re = 45) and (f ) (α = 5) show examples of steady state II, where the hyperbolic point isupstream of the cylinder centre. All the flow images show streamlines and colour contours ofvorticity at levels ±3D/U; cross-hairs mark the cylinder centre, circles mark the hyperbolicpoint location.
some cooperation between a centrifugal-type instability near the cylinder surface and ahyperbolic-type mechanism of amplification further downstream. Further investigationis required to completely understand the physical cause of instability for this mode.Mode F, however, appears to be due to a centrifugal instability of the layer of fluidat the cylinder surface (Rao et al. 2013). Both of these curves are of a reasonablycomplicated shape. Some explanation for this is given in §§ 3.3 and 3.4.
A single three-dimensional mode is found to grow on steady state II. This mode,like mode F, is due to a centrifugal instability, and so has been named mode F′. Likemode F, its curve of marginal stability is marked with filled circles in figure 1 and ismuch simpler than that for mode F, with Re increasing approximately linearly with α.Further details are provided in § 3.5.
3.2. Steady base flowsThe two steady two-dimensional base flows, steady state I and steady state II, havebeen delineated in terms of two physical parameters: the streamwise location xh of thehyperbolic point in the flow and the drag coefficient. For steady state I, the hyperbolic

Three-dimensionality in the wake of a rapidly rotating cylinder 385
point lies downstream of the centre of the cylinder, while for steady state II, thehyperbolic point is upstream of the centre of the cylinder. There is also a distinctchange in drag coefficient moving from one solution to the other, clearly related tothe change in location of this hyperbolic point and other associated changes in theflow structure. For example, steady state I has tail-like structures in the wake, while insteady state II, the shear layers wrap around the cylinder.
Plots of the streamwise location of the hyperbolic point and the drag coefficient, asthe transition from steady state I to steady state II is crossed, are shown in figure 2.Also shown are examples of the steady flows on either side of the transition. Datafor α = 6.15 and varying Re are shown, as are data for Re = 200 and varying α.Both show the hyperbolic point moving from downstream to upstream as the transitionoccurs, as well as a distinct change in drag coefficient.
3.3. The mode E instabilityMode E was first described in Rao et al. (2013). There, it was shown that the stabilitymultiplier µ was purely real, indicating that the mode introduces no new frequencies.It therefore represents a bifurcation from a steady two-dimensional flow to a steadythree-dimensional flow. It was also attributed to a hyperbolic instability mechanism,in the high-strain region emanating from the hyperbolic point at the rear of a singlerecirculation region in the wake.
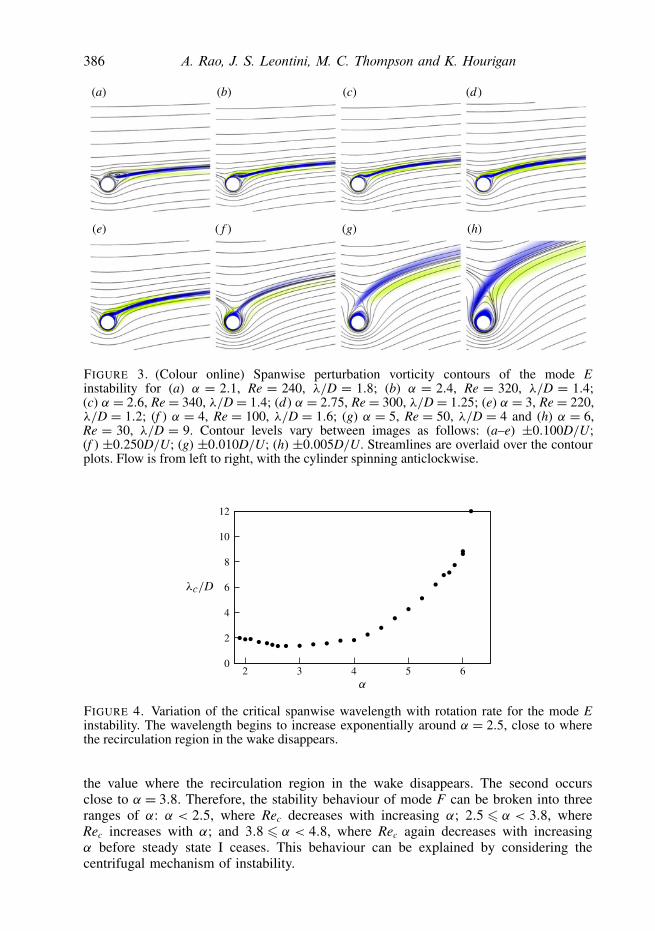
Images of mode E, progressing along the curve of marginal stability presentedin figure 1, are shown in figure 3. A pertinent feature of the base flow (shown asstreamlines in the images of figure 3) is that for α < 3 (images a–e), the singlerecirculation region in the flow behind the body diminishes in size with increasingα. The hyperbolic point that forms at the rear of this recirculation region is broughtcloser to the cylinder, moving upstream and ‘down’ (transversely to the flow towardsthe wake centreline). For α > 3 (images f –h), this recirculation region does not form.Increasing α sees the hyperbolic point continue to move upstream, but also move ‘up’(transversely away from the wake centreline), away from the cylinder.
The structure of the perturbation (shown as colour contours of vorticity in theimages of figure 3) also varies. When the recirculation region is present, the modegrows primarily in the high-strain region emanating from the hyperbolic point at itsrear, the same structure as shown in Rao et al. (2013). However, for α > 3 where therecirculation region has disappeared, the perturbation grows again near the hyperbolicpoint, but also in the enclosed layer of fluid near the cylinder surface. It is thereforeplausible that at higher α, mode E is amplified by both hyperbolic and centrifugalinstability mechanisms.
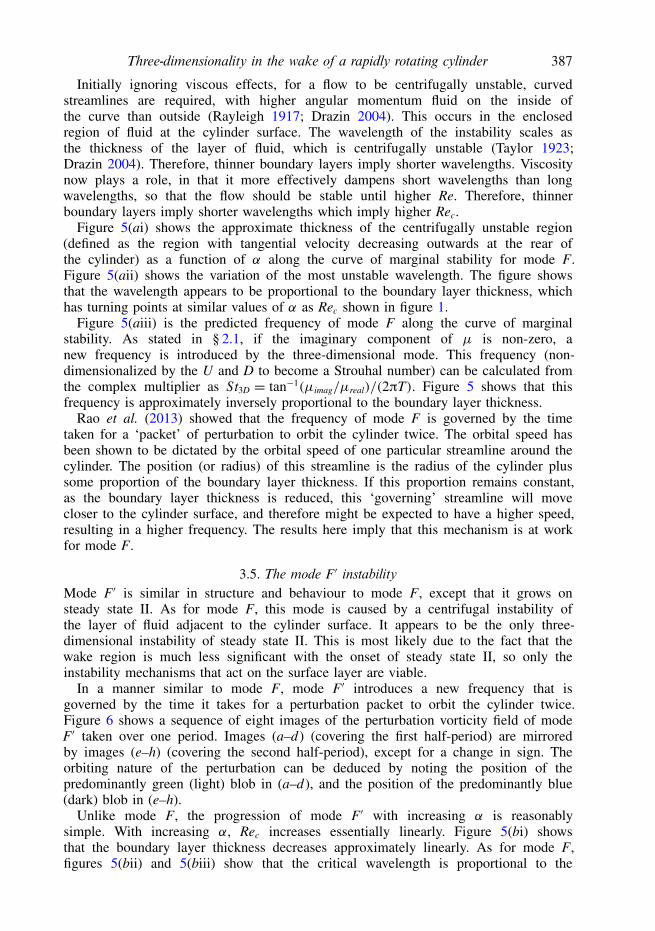
Inspection of figure 1 shows that as α is increased, Rec (the value of Re at marginalstability for mode E) first increases, then decreases. The turning point is aroundα ' 2.5, close to where the recirculation region disappears. For α > 2.5, Rec rapidlydecreases. This is accompanied by an apparent exponential increase in the spanwisewavelength λ, as shown in figure 4. It should also be noted that at high α > 5.7, theupper value of Re at which mode E is unstable is not at the boundary of existence ofsteady state I. Rather, the mode restabilizes before this boundary is reached.
3.4. The mode F instabilityMode F appears to be caused by a centrifugal instability of the layer of fluid closeto the cylinder surface (Rao et al. 2013). At the higher values of α studied in thispaper, the relationship between Rec and α is reasonably complicated, with two turningpoints as shown in figure 1. The first of these occurs around α = 2.5, again close to
386 A. Rao, J. S. Leontini, M. C. Thompson and K. Hourigan
(a) (b) (c) (d )
(e) ( f ) (g) (h)
FIGURE 3. (Colour online) Spanwise perturbation vorticity contours of the mode Einstability for (a) α = 2.1, Re = 240, λ/D = 1.8; (b) α = 2.4, Re = 320, λ/D = 1.4;(c) α = 2.6, Re= 340, λ/D= 1.4; (d) α = 2.75, Re= 300, λ/D= 1.25; (e) α = 3, Re= 220,λ/D = 1.2; (f ) α = 4, Re = 100, λ/D = 1.6; (g) α = 5, Re = 50, λ/D = 4 and (h) α = 6,Re = 30, λ/D = 9. Contour levels vary between images as follows: (a–e) ±0.100D/U;(f ) ±0.250D/U; (g) ±0.010D/U; (h) ±0.005D/U. Streamlines are overlaid over the contourplots. Flow is from left to right, with the cylinder spinning anticlockwise.
2
4
6
8
10
2 3 4 5 60
12
FIGURE 4. Variation of the critical spanwise wavelength with rotation rate for the mode Einstability. The wavelength begins to increase exponentially around α = 2.5, close to wherethe recirculation region in the wake disappears.
the value where the recirculation region in the wake disappears. The second occursclose to α = 3.8. Therefore, the stability behaviour of mode F can be broken into threeranges of α: α < 2.5, where Rec decreases with increasing α; 2.5 6 α < 3.8, whereRec increases with α; and 3.8 6 α < 4.8, where Rec again decreases with increasingα before steady state I ceases. This behaviour can be explained by considering thecentrifugal mechanism of instability.
Three-dimensionality in the wake of a rapidly rotating cylinder 387
Initially ignoring viscous effects, for a flow to be centrifugally unstable, curvedstreamlines are required, with higher angular momentum fluid on the inside ofthe curve than outside (Rayleigh 1917; Drazin 2004). This occurs in the enclosedregion of fluid at the cylinder surface. The wavelength of the instability scales asthe thickness of the layer of fluid, which is centrifugally unstable (Taylor 1923;Drazin 2004). Therefore, thinner boundary layers imply shorter wavelengths. Viscositynow plays a role, in that it more effectively dampens short wavelengths than longwavelengths, so that the flow should be stable until higher Re. Therefore, thinnerboundary layers imply shorter wavelengths which imply higher Rec.
Figure 5(ai) shows the approximate thickness of the centrifugally unstable region(defined as the region with tangential velocity decreasing outwards at the rear ofthe cylinder) as a function of α along the curve of marginal stability for mode F.Figure 5(aii) shows the variation of the most unstable wavelength. The figure showsthat the wavelength appears to be proportional to the boundary layer thickness, whichhas turning points at similar values of α as Rec shown in figure 1.
Figure 5(aiii) is the predicted frequency of mode F along the curve of marginalstability. As stated in § 2.1, if the imaginary component of µ is non-zero, anew frequency is introduced by the three-dimensional mode. This frequency (non-dimensionalized by the U and D to become a Strouhal number) can be calculated fromthe complex multiplier as St3D = tan−1(µimag/µreal)/(2πT). Figure 5 shows that thisfrequency is approximately inversely proportional to the boundary layer thickness.
Rao et al. (2013) showed that the frequency of mode F is governed by the timetaken for a ‘packet’ of perturbation to orbit the cylinder twice. The orbital speed hasbeen shown to be dictated by the orbital speed of one particular streamline around thecylinder. The position (or radius) of this streamline is the radius of the cylinder plussome proportion of the boundary layer thickness. If this proportion remains constant,as the boundary layer thickness is reduced, this ‘governing’ streamline will movecloser to the cylinder surface, and therefore might be expected to have a higher speed,resulting in a higher frequency. The results here imply that this mechanism is at workfor mode F.
3.5. The mode F′ instabilityMode F′ is similar in structure and behaviour to mode F, except that it grows onsteady state II. As for mode F, this mode is caused by a centrifugal instability ofthe layer of fluid adjacent to the cylinder surface. It appears to be the only three-dimensional instability of steady state II. This is most likely due to the fact that thewake region is much less significant with the onset of steady state II, so only theinstability mechanisms that act on the surface layer are viable.
In a manner similar to mode F, mode F′ introduces a new frequency that isgoverned by the time it takes for a perturbation packet to orbit the cylinder twice.Figure 6 shows a sequence of eight images of the perturbation vorticity field of modeF′ taken over one period. Images (a–d) (covering the first half-period) are mirroredby images (e–h) (covering the second half-period), except for a change in sign. Theorbiting nature of the perturbation can be deduced by noting the position of thepredominantly green (light) blob in (a–d), and the position of the predominantly blue(dark) blob in (e–h).
Unlike mode F, the progression of mode F′ with increasing α is reasonablysimple. With increasing α, Rec increases essentially linearly. Figure 5(bi) showsthat the boundary layer thickness decreases approximately linearly. As for mode F,figures 5(bii) and 5(biii) show that the critical wavelength is proportional to the

388 A. Rao, J. S. Leontini, M. C. Thompson and K. Hourigan
35
40
45
50
253035404550
15
20
30
35
40
45
25
30
35
40
45
35
45
55
65
75
2.0 2.5 3.0 3.5 4.0 2.0 2.5 3.0 3.5 4.02.0 2.5 3.0 3.5 4.0
4.75 5.25 5.75 6.25 4.75 5.25 5.75 6.25 5.25 5.75
10
25(× 10–3)
(× 10–3)
(× 10–2)
(× 10–2)
(× 10–2)
(× 10–2)
(ai)
(bi)
(aii)
(bii)
(aiii)
(biii)
4.75 6.25
FIGURE 5. (i) Boundary layer thickness δ/D, (ii) critical wavelength λc/D, (iii) Strouhalnumber of the three-dimensional mode, St3D, for (a) mode F and (b) mode F′, all measuredalong the relevant marginal stability curve (note that Re is also a function of α as shownin figure 1). Dots (•) are measurements, dashed lines (− − −) are approximated trendlines. Both modes are centrifugally unstable, and the figures show that in both cases λc/D isapproximately proportional to δ/D, and St3D is approximately inversely proportional to δ/D.
(a) (b) (c) (d )
(e) ( f ) (g) (h)
FIGURE 6. (Colour online) Spanwise perturbation vorticity contours of the modeF′ instability over one period of shedding at α = 6, Re = 320 and λ/D = 0.3, withstreamlines in the vicinity of the cylinder overlaid: (a) T = 0,T; (b) T = T/8; (c) T = 2T/8;(d) T = 3T/8; (e) T = 4T/8; (f ) T = 5T/8; (g) T = 6T/8; (h) T = 7T/8.
boundary layer thickness, and the frequency is approximately inversely proportional tothe boundary layer thickness. This implies that the same argument presented in § 3.4for the scaling of the wavelength and frequency for mode F also applies for mode F′.
Three-dimensionality in the wake of a rapidly rotating cylinder 389
4.25
2
4
6
80.040.020
0.2
0.3
0.4
0.5
0.4
2.5 3.0 3.5 4.8 5.2 5.6 6.0
0.20.10
0.060.030
0.3
0.5(a) (b) (c)
3.75 4.75
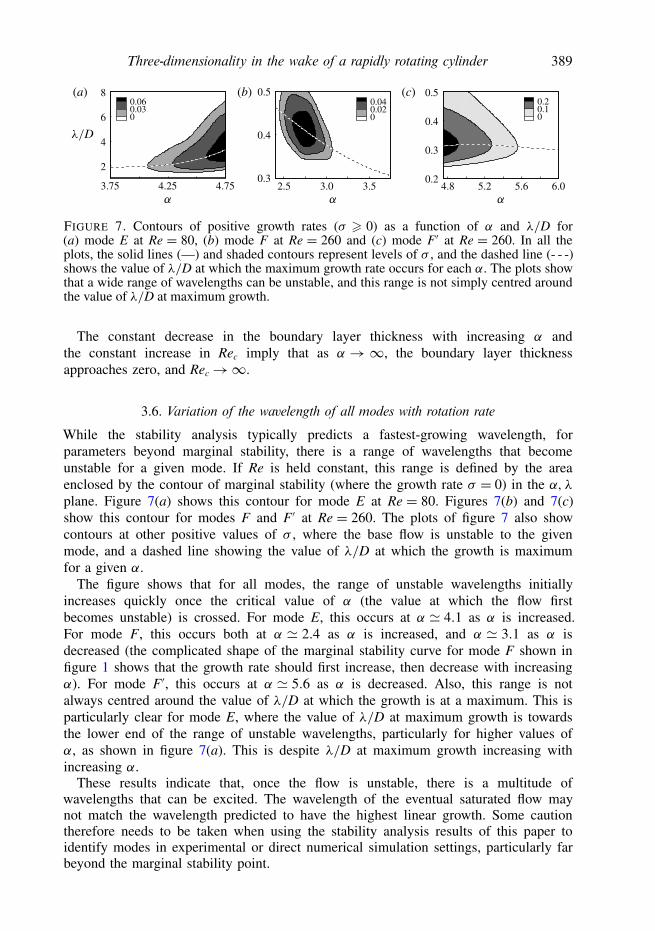
FIGURE 7. Contours of positive growth rates (σ > 0) as a function of α and λ/D for(a) mode E at Re = 80, (b) mode F at Re = 260 and (c) mode F′ at Re = 260. In all theplots, the solid lines (—) and shaded contours represent levels of σ , and the dashed line (- - -)shows the value of λ/D at which the maximum growth rate occurs for each α. The plots showthat a wide range of wavelengths can be unstable, and this range is not simply centred aroundthe value of λ/D at maximum growth.
The constant decrease in the boundary layer thickness with increasing α andthe constant increase in Rec imply that as α →∞, the boundary layer thicknessapproaches zero, and Rec→∞.
3.6. Variation of the wavelength of all modes with rotation rate
While the stability analysis typically predicts a fastest-growing wavelength, forparameters beyond marginal stability, there is a range of wavelengths that becomeunstable for a given mode. If Re is held constant, this range is defined by the areaenclosed by the contour of marginal stability (where the growth rate σ = 0) in the α, λplane. Figure 7(a) shows this contour for mode E at Re = 80. Figures 7(b) and 7(c)show this contour for modes F and F′ at Re = 260. The plots of figure 7 also showcontours at other positive values of σ , where the base flow is unstable to the givenmode, and a dashed line showing the value of λ/D at which the growth is maximumfor a given α.
The figure shows that for all modes, the range of unstable wavelengths initiallyincreases quickly once the critical value of α (the value at which the flow firstbecomes unstable) is crossed. For mode E, this occurs at α ' 4.1 as α is increased.For mode F, this occurs both at α ' 2.4 as α is increased, and α ' 3.1 as α isdecreased (the complicated shape of the marginal stability curve for mode F shown infigure 1 shows that the growth rate should first increase, then decrease with increasingα). For mode F′, this occurs at α ' 5.6 as α is decreased. Also, this range is notalways centred around the value of λ/D at which the growth is at a maximum. This isparticularly clear for mode E, where the value of λ/D at maximum growth is towardsthe lower end of the range of unstable wavelengths, particularly for higher values ofα, as shown in figure 7(a). This is despite λ/D at maximum growth increasing withincreasing α.
These results indicate that, once the flow is unstable, there is a multitude ofwavelengths that can be excited. The wavelength of the eventual saturated flow maynot match the wavelength predicted to have the highest linear growth. Some cautiontherefore needs to be taken when using the stability analysis results of this paper toidentify modes in experimental or direct numerical simulation settings, particularly farbeyond the marginal stability point.

390 A. Rao, J. S. Leontini, M. C. Thompson and K. Hourigan
4. ConclusionsThe stability of the flow past a rotating cylinder at higher rotation rates in a free
stream has been investigated using linear stability analysis. The existence of twosteady states has been confirmed. The first of these states, named steady state I, hasbeen confirmed to be unstable to two three-dimensional modes. The first, mode Eis essentially an instability of the wake, yet shows some possible dependence on acentrifugal instability mechanism with increasing rotation rates. The second, mode F,is purely due to centrifugal instability, and the variation of Rec for this mode has beenexplained by considering this. The second steady state, steady state II, occurs at higherrotation rates and has been shown to be unstable to a single three-dimensional mode,mode F′. This mode is also due to a centrifugal instability.
AcknowledgementsThe authors acknowledge computing-time support from the Victorian Life Sciences
Computation Initiative (VLSCI), the National Computational Infrastructure (NCI)and the Monash Sungrid, Clayton. The authors acknowledge financial supportfrom Australian Research Council (ARC) grants DP0877327, DP110102141 andDP130100822. A.R. acknowledges the financial support of Monash University througha Postgraduate Publication Award. J.S.L. acknowledges the financial support of theARC through an Australian Postdoctoral Fellowship.
R E F E R E N C E S
BARKLEY, D. & HENDERSON, R. D. 1996 Three-dimensional Floquet stability analysis of the wakeof a circular cylinder. J. Fluid Mech. 322, 215–241.
DRAZIN, P. G. 2004 Hydrodynamic Stability, 2nd edn. Cambridge University Press.EL AKOURY, R., BRAZA, M., PERRIN, R., HARRAN, G. & HOARAU, Y. 2008 The
three-dimensional transition in the flow around a rotating cylinder. J. Fluid Mech. 607, 1–11.KARNIADAKIS, G. E. & SHERWIN, S. J. 2005 Spectral/hp Methods for Computational Fluid
Dynamics. Oxford University Press.KUMAR, S., CANTU, C. & GONZALEZ, B. 2011 Flow past a rotating cylinder at low and high
rotation rates. Trans. ASME: J. Fluids Engng 133 (4), 041201.LEONTINI, J. S., THOMPSON, M. C. & HOURIGAN, K. 2007 Three-dimensional transition in the
wake of a transversely oscillating cylinder. J. Fluid Mech. 577, 79–104.LO JACONO, D., LEONTINI, J. S., THOMPSON, M. C. & SHERIDAN, J. 2010 Modification of
three-dimensional transition in the wake of a rotationally oscillating cylinder. J. Fluid Mech.643, 349–362.
MEENA, J., SIDHARTH, G. S., KHAN, M. H. & MITTAL, S. 2011 Three-dimensional instabilities inflow past a spinning and translating cylinder. In IUTAM Symposium on Bluff Body Flows,pp. 59–62. Indian Institute of Technology Kanpur.
MITTAL, S. & KUMAR, B. 2003 Flow past a rotating cylinder. J. Fluid Mech. 476, 303–334.PADRINO, J. C. & JOSEPH, D. D. 2006 Numerical study of the steady-state uniform flow past a
rotating cylinder. J. Fluid Mech. 557, 191–223.PRALITS, J. O., BRANDT, L. & GIANNETTI, F. 2010 Instability and sensitivity of the flow around a
rotating circular cylinder. J. Fluid Mech. 650, 513–536.PRANDTL, L. 1926 Application of the ‘Magnus Effect’ to the Wind Propulsion of Ships. National
Advisory Committee for Aeronautics.RAO, A., LEONTINI, J., THOMPSON, M. C. & HOURIGAN, K. 2013 Three-dimensionality in the
wake of a rotating cylinder in a uniform flow. J. Fluid Mech. 717, 1–29.RAYLEIGH, J. W. STRUTT, LORD 1917 On the dynamics of revolving fluids. Proc. R. Soc. Lond.
Ser. A 93, 148–154.SCHMID, P. J. & HENNINGSON, D. S. 2001 Stability and Transition in Shear Flows. Springer.

Three-dimensionality in the wake of a rapidly rotating cylinder 391
STEWART, B. E., THOMPSON, M. C., LEWEKE, T. & HOURIGAN, K. 2010 The wake behind acylinder rolling on a wall at varying rotation rates. J. Fluid Mech. 648, 225–256.
STOJKOVIC, D., BREUER, M. & DURST, F. 2002 Effect of high rotation rates on the laminar flowaround a circular cylinder. Phys. Fluids 1 (9), 3160–3178.
STOJKOVIC, D., SCHON, P., BREUER, M. & DURST, F. 2003 On the new vortex shedding modepast a rotating circular cylinder. Phys. Fluids 15 (5), 1257–1260.
TAYLOR, G. I. 1923 Stability of a viscous liquid contained between two rotating cylinders. Phil.Trans. R. Soc. Lond. Ser. A 223, 289–343.
THOMPSON, M. C., HOURIGAN, K., CHEUNG, A. & LEWEKE, T. 2006 Hydrodynamics of aparticle impact on a wall. Appl. Math. Model. 30, 1356–1369.
THOMPSON, M. C., HOURIGAN, K. & SHERIDAN, J. 1996 Three-dimensional instabilities in thewake of a circular cylinder. Exp. Therm. Fluid Sci. 12 (2), 190–196.