Embed Size (px)
Citation preview
ISSN 1045-6333
THE EFFECTS OF MANDATORY SEAT BELT LAWS ON DRIVING BEHAVIOR AND
TRAFFIC FATALITIES
Alma Cohen Liran Einav
Discussion Paper No. 341
11/2001
Harvard Law School Cambridge, MA 02138
The Center for Law, Economics, and Business is supported by a grant from the John M. Olin Foundation.
This paper can be downloaded without charge from:
The Harvard John M. Olin Discussion Paper Series: http://www.law.harvard.edu/programs/olin_center/
Last revision: October 2001
The Effects of Mandatory Seat Belt Laws on Driving Behavior and Traffic Fatalities^
Alma Cohen Department of Economics
Harvard University [email protected]
Liran Einav
Department of Economics Harvard University
This paper investigates the effects of mandatory seat belt laws on driver behavior and traffic fatalities. Using a unique panel data set on seat belt usage rates in all U.S. jurisdictions, we analyze how such laws, by influencing seat belt use, affect traffic fatalities. Controlling for the endogeneity of seat belt usage, we find that it decreases overall traffic fatalities. The magnitude of this effect, however, is significantly smaller than the estimate used by the National Highway Traffic Safety Administration. Testing the compensating behavior theory, which suggests that seat belt use also has an adverse effect on fatalities by encouraging careless driving, we find that this theory is not supported by the data. Finally, we identify factors, especially the type of enforcement used, that make seat belt laws more effective in increasing seat belt usage.
JEL Classifications: C13, I12, K32, K42, R40
^ We are grateful to Lucian Bebchuk, Gary Chamberlain, David Cutler, John Graham, Shigeo Hirano, Caroline Hoxby, Lawrence Katz, Ariel Pakes, Jack Porter, Manuel Trajtenberg, Kip Viscusi and seminars participants at Harvard University for helpful comments. We thank the NHSTA and the Highway Safety Offices of many states for providing us with the data on seat belt usage rate. Any remaining errors are our own.
1
I. INTRODUCTION
Traffic accidents are a major source of fatalities and serious injuries. Every day more than 100
Americans are killed in motor vehicle crashes. Traffic accidents are the leading cause of death for
Americans between the ages of 5 and 32.1 One important policy tool that has been used to combat
this problem is the passage of mandatory seat belt laws. Indeed, the federal government set in 1997
an ambitious goal of increasing seat belt usage from the 1996 national level of 68% to 85% by the
year 2000 (a target which was not achieved) and to 90% by 2005. To increase seat belt usage, the
federal government has been encouraging states to adopt stronger mandatory seat belt laws.
The aim of this paper is to conduct, using a unique data set, an empirical investigation of the
effectiveness of mandatory seat belt laws in reducing traffic fatalities. Our analysis makes it possible
to reach unambiguous conclusions concerning two questions: (i) whether increasing seat belt usage
rates is overall beneficial in reducing fatalities and, if so, by how much; and (ii) what aspects of seat
belt legislation and its enforcement are particularly effective in increasing seat belt usage. Our
findings have substantial implications for policymaking in this area.
We use a rich panel data set of the 50 U.S. states and the District of Columbia for the years
1983 to 1997. During this period, all of these jurisdictions, except New Hampshire, have adopted
some seat belt legislation. New York was the first state to do so in December 1984, and other
states gradually followed. This pattern of adoption makes it possible to obtain a clean
identification of the effects of these laws, controlling for year and state fixed effects. An
additional advantage of our data set is that it includes data on seat belt usage rates from several
sources, which enable us to put together reliable figures on state- level usage rates. Given the
wide variation in usage rates across states, we can allow the effect of the mandatory seat belt law
to vary as a function of the usage rate level.
In analyzing the effectiveness of mandatory seat belt laws we focus on two questions. The first
question is whether increasing seat belt usage reduces traffic fatalities overall. This requires us to
test the “compensating behavior” theory of Peltzman (1975). According to this theory, increased
usage rate might have an overall adverse effect on traffic fatalities. Drivers wearing seat belts feel
more secure, and they therefore drive less carefully, leading to more traffic accidents. Thus, while
seat belts decrease fatalities among drivers wearing them, fatalities of other individuals go up,
offsetting the beneficial effects of seat belts.
1 See Insurance Information Institute (1995b).
2
To test Peltzman’s compensating behavior theory, it is necessary to measure the effect of an
increase in usage rate on driving behavior. Following the literature, we distinguish between two
types of traffic fatalities: fatalities among car occupants who may use seat belts, and fatalities
among pedestrians and bicyclists (non-occupants), who clearly cannot use seat belts. According to
Peltzman’s theory, traffic fatalities are influenced by seat belt usage in two ways. The direct effect
operates to reduce the probability that a driver wearing a seat belt will be killed in the event of an
accident. The indirect effect operates to increase the incidence of accidents, by inducing less careful
driving by drivers who wear seat belts. While car occupants might be subject to these two effects,
which go in opposite directions, non-occupants (pedestrians and bicyclists) can be subject only to
the indirect effect. Thus, the compensating behavior theory predicts positive correlation between
seat belt usage rate and fatalities among non-occupants. Accordingly, focusing on the effect of seat
belt usage on non-occupants provides a clean test of the theory.2
The substantial empirical work on the subject has obtained mixed findings concerning the
theory of compensating behavior. However, the papers that found support for a Peltzman effect
did not take into account the likely endogeneity of usage rate. Our analysis explicitly takes into
account this endogeneity and corrects for it, thus enabling us to test adequately the validity of the
theory. The results imply that correcting for the endogeneity problem significantly changes the
results. Our findings indicate that seat belt usage does significantly reduce fatalities among car
occupants, but does not appear to have any significant effect on fatalities among non-occupants.
Thus, we find no significant presence of compensating behavior.
Overall, we find that seat belt legislation unambiguously reduces traffic fatalities. Specifically,
we estimate that a 10 percent increase in usage rate reduces occupant fatalities by about 1.35 percent
and has no significant effect on fatalities among non-occupants. This implies that a 10 percent
increase in the national level of seat belt usage rate will save about 500 lives annually. Interestingly,
although the effect of increased seat belt usage on lives saved is substantial, its magnitude is
considerably smaller than the estimate that has been used by the federal government.
The second question on which we focus is which factors of seat belt legislation make it
effective in increasing usage rate. We find that the factor that is most important for obtaining a
substantial increase in usage rate is having primary enforcement (violators may be stopped and
fined by the police even if they do not engage in other offenses) rather than secondary enforcement
2 A more direct test would be to look at number of accidents instead of at non-occupant fatalities. Data on number of accidents is considered problematic (see Data Appendix), so we focus our attention on non-occupants. Nevertheless, we use such data and find similar results to those we obtain for non-occupants (see Section V).
3
(violators may be fined by the police only when stopped for another offense). Primary enforcement
increases the probability of citation in a case of non-compliance and thus raises the expected
sanction. While observers and policymakers have noticed that states with primary enforcement
have on average higher usage rates, we are able to identify and estimate the effect of primary
enforcement in a statistically more reliable way than the existing literature.
We find that whereas a mandatory seat belt law with secondary enforcement increases usage
rate by about 11 percentage points, a mandatory seat belt law backed up by primary enforcement
increases usage rate by about 22 percentage points. This finding supports the recent initiative by
the federal government to encourage states to adopt primary enforcement. Indeed, we estimate
that if all states now having secondary enforcement were to switch to primary enforcement, the
national usage rate would shoot up from the current 68 percent to about 77 percent, producing an
annual saving of about 500 lives.
The paper is organized as follows. Section II provides background and discusses the existing
literature. Section III motivates the estimation strategy, and discusses the way it helps to answer
the two questions that we address. Section IV describes the data, Section V presents and
discusses the results, and Section VI concludes.
II. BACKGROUND, LITERATURE AND MOTIVATION
A. A Brief History of Seat Belt Legislation and Federal Policy
While in Europe and Australia mandatory seat belt laws were implemented in the 1970’s, it
was not until December 1984 that New York became the first state in the U.S. to adopt such a law.
In the following 16 years, all but one of the states passed some kind of mandatory seat belt law, with
New Hampshire being the exception. 3 Table 1 provides the dates at which the laws were passed in
each state.
State seat belt laws differ along several dimensions. One major difference concerns the type of
enforcement. There are two types of enforcement: primary enforcement and secondary enforcement.
Under primary enforcement, a police officer may issue a citation for failure to wear a seat belt based
solely on probable cause of such violation. In contrast, under secondary enforcement, an officer is
authorized to issue such a citation for a failure to wear a seat belt only if the officer has first stopped
3 In fact, New Hampshire has passed a mandatory seat belt law with secondary enforcement in 1999, but requires only drivers or passengers under the age of 18 to wear seat belts.
4
the person for some other violation of the law. At present, only 16 jurisdictions in the U.S. have
primary enforcement.
Laws also differ with respect to the passengers required to wear seat belts. Most states require
only front seat passengers to wear seat belts, but a significant number of states (13 at present)
require all passengers to do so. Fines also vary across states, from $0 in Rhode Island (verbal
warning only) to $100 in Virginia. In addition, in some states auto insurance coverage for an
accident will be reduced if the seat belt law was violated at the time of an accident.
In recent years the federal government has been encouraging states to strengthen their seat belt
laws. In 1997, the federal government set a goal of increasing national seat belt use from 68 percent
to 85 percent by 2000 and to 90 percent by 2005. According to the estimates of the National
Highway Traffic Safety Administration (NHTSA), increasing seat belt use to 90 percent would
prevent an estimated 5,536 fatalities and 132,700 injuries annually and would save $8.8 billon
annually. The main strategy that the federal government has been pursuing to increase seat belt
usage has been to seek stronger state legislation, encouraging states to move to primary enforcement
and higher fines.
B. The Effect of Seat Belt Use on Fatalities
It is widely agreed that, holding the number of accidents fixed, the direct effect of seat belt
usage reduces fatalities among those wearing seat belts. Government analysts concluded, on the
basis of their survey of laboratory evidence, that seat belt use by front seat passengers could
prevent 40 percent to 50 percent fatalities when compared to otherwise unrestrained individuals
(Department of Transportation, 1984). Furthermore, most of the empirical papers that
investigated this direct effect found results consistent with the laboratory studies. Evans (1986)
and Graham et al (1997) estimated that the direct effect of using seat belts reduces fatality risk by
40 percent to 50 percent. Levitt and Porter (1999), correcting for sample selection that was
present in earlier papers, found even a larger direct effect, ranging from 50 percent to 70 percent.
Although it is widely accepted that seat belt usage reduces occupant fatality risk in the event
of an accident, it has been argued that the overall effect of higher seat belt usage rate on fatalities
might be insignificant or even positive. This argument was first advanced by Peltzman (1975) in
a well-known paper about compensating behavior. His theory suggests that, due to risk
compensation, using seat belts might encourage careless driving. Peltzman pointed out that by
making careless driving less costly, seat belt use may increase the probability of an accident and
5
therefore put non-occupants, namely pedestrians, bicyclists and motorcyclists, in greater fatality
risk. This effect might make mandatory seat belt laws less desirable or even counter-productive.4
There is a large empirical literature that tries to estimate the effect of mandatory seat belt laws
on fatalities. Some of the existing papers consider the effect of such laws on aggregate fatalities
without trying to distinguish between fatalities among those seated in a car and wearing seat belts
and those not in a car, such as pedestrians, bicyclists and motorcyclists.5 Others have tried to test
for compensating behavior by distinguishing between two kinds of fatalities: occupants fatalities,
i.e. fatalities of those who are better secured by using seat belt (the driver, front seat passengers
and sometimes rear seat passengers), and non-occupants (pedestrians, bicyclists and
motorcyclists). Such distinction allows the researcher to use the non-occupant fatalities as a group
that should not be affected directly by seat belts, but only through changes in driving behavior.
Thus, if compensating behavior does exist, then we would expect to observe a positive association
between seat belt usage and non-occupant fatalities.6 Testing for the presence of such a positive
association, studies have reached different conclusions.7
The above empirical work, however, has substantial limitations that the present study seeks to
overcome. To start with, many of the papers surveyed use time series data and look at traffic
fatalities before and after a mandatory seat belt law was passed.8 Such studies could not take into
account other “macro effects”, unrelated to the mandatory seat belt laws, which might have affected
the changes in the time trend of fatalities.9 Second, another limitation of most of the studies is that 4 In the psychology literature, Wilde (1982) takes this argument to an extreme with his theory of risk homeostasis. He argues that individuals adopt a fixed target level of fatality risk and adjust their driving accordingly. 5 McCarthy (1999) finds that a mandatory seat belt law increases the number of fatal accidents, while Bhattacharyya and Layton (1979) and Houston et al (1995) find that seat belt laws have significant negative effect on traffic fatalities. 6 This statement, used throughout in the literature, implicitly assumes that, in response to a careless driving, non-occupants do not take precautions that completely eliminate the adverse effect of such driving on them. This assumption seems reasonable, and we use it as well. 7 Garbacz (1991), Loeb (1995), and Wagenaar et al (1988) find a significant negative effect of mandatory seat belt laws on occupant fatalities. Evans and Graham (1991) and Harvey and Durbin (1986) find a significant positive effect on non-occupant fatalities. Asch et al (1991) find that, while the number of fatalities per accident decreased after the passage of the mandatory seat belt law, there was a significant increase in the number of accidents. The most puzzling results are found by Garbacz (1990, 1992a and 1992b) and Risa (1994), who find that seat belt usage rate is either insignificant or positively associated with occupant and non-occupant fatalities. 8 See, for example, Bhattacharyya and Layton (1979), Garbacz (1991), Harvey and Durbin (1986), and Wagenaar et al (1988). 9 For example, the passage of a mandatory seat belt law is likely to be one element in a more comprehensive package of policy measures aimed at reducing traffic fatalities. Additional measures could include other laws (e.g. speed limits and child passenger safety laws), public campaign for traffic safety, and more. If such measures were always used together with the seat belt law, then there no way to distinguish between the effect of the seat belt law
6
their results cannot be used for further policy evaluations, because the results depend only on one
change in the law. Lacking variation in changes in the laws, the results might depend on the values
of other variables in the specific year at which the law was passed, and in particular on the initial
level of usage rate.10 The comprehensive panel data that we use in this paper allows us to overcome
these limitations, by basing the identification on changes in legislation, that took place at different
points in time.11
Furthermore, and perhaps most importantly, the existing empirical work failed to break up
the law’s effect, as we do, into the effect of the law on increasing usage rate and the effect of
increasing usage rate on traffic fatalities. Mandatory seat belt laws presumably do not affect
fatalities directly but only through their effect on usage rate, which in turn affects traffic fatalities.
Hence, to conclude that mandatory seat belt laws are beneficial, we must first find that increasing
seat belt usage rate is effective in reducing fatalities. We view traffic fatalities as an element of
the policymaker’s objective function, while the law serves as the decision-maker’s policy
instrument. Seat belt usage, in that context, is an interim variable. However, it is quite important
to understand the role of seat belt usage rate in order to better design the mandatory seat belt
laws.
Prior work did not break up the effect of mandatory seat belt laws into its two components,
but rather looked at the (reduced-form) effect of seat belt laws on the number of occupant and
non-occupant fatalities. However, analyzing separately the two effects, as our data permits us to
do, has significant advantages. First, the effect of a mandatory seat belt law might depend
substantially on the initial level of seat belt use at the time the law is passed.12 The typical
and the effect of the other policy measures. The use of panel data that include multiple changes in the laws, and controlling for other laws as we do in our study, partially helps to remedy such identification problems. 10 The same type of concerns arises when panel data is used, if the law or the change in the law does not vary across the different groups. For example, in Risa (1994), Asch et al (1991) and McCarthey (1999), the identification of the effect of the mandatory seat belt law is based solely on the average effect across groups. Therefore, their analysis can be thought of as time series data of averages, with, perhaps, better control variables. 11 Evans and Graham (1991), Houston et al (1995), and Sen (2001) do use the variation in the mandatory seat belt laws across U.S. states or Canadian provinces. However, these papers do not use data on usage rate, thus can only analyze the reduced-form, indirect, effect of mandatory seat belt laws on fatalities. As we discuss next, such analysis may be significantly improved upon by using data on seatbelt use. 12 For example, such legislation might have a big effect in states in which seat belt use rate is quite low to begin with, but only a small effect in states where everybody was already using seat belts prior to the passage of the law. As Figure 4 indicates, seat belt usage rate varies a great deal across states. In our data set, usage rate levels in state-years without any mandatory seat belt law vary between 4% and 59%, with a mean and median of 30% and standard deviation of about 13%, implying that wide variation in initial usage rates is likely to lead to a wide variation in the impact of seatbelt laws on traffic fatalities.
7
analysis, using only dummy variables for the existence of mandatory seat belt laws, restricts the
law to have an impact on fatalities that is constant across different initial levels of usage. By
incorporating data on seat belt usage rate, we can allow for varying effects of the law, which
seem important and more plausible.
Moreover, usage rate data allows for a more direct test of the theory of compensating
behavior. The theory suggests that careless driving is associated with seat belt use, not with the
existence of mandatory seat belt laws, which can only be used as a proxy. Hence, testing the
theory on the basis of usage rates is preferable.
The few studies that used data on seat belt usage rate have some serious limitations. Garbacz
(1990, 1991, 1992a) and Risa (1994) used seat belt usage rate data in their analysis, but they did
not take into account that the decision to wear a seat belt is an individual’s choice variable, and
as such is likely to be endogenous.13 For example, if the probability of being involved in an
accident is low, then the incentive to wear seat belt will be lower. If the probability of an
accident is high, however, individuals will be more likely to protect themselves and to use seat
belts. Hence, by regressing fatalities on usage rate without controlling for this endogeneity, we
would expect to find a positive correlation between the usage rate and the error term, which
would lead to an upward bias in the coefficient on usage rate. Indeed, this was probably the
reason why Garbacz (1990, 1992a) and Risa (1994) obtained positive coefficients on usage rate,
which led them to accept the theory of compensating behavior. As we show in Section V, this
bias disappears once the endogeneity of usage rate is taken into account.
C. What Makes Seat Belt legislation Effective
We also study the factors that make seat belt legislation successful in increasing seat belt use.
This question is of interest to federal and state officials who have been putting a great deal of effort
in trying to increase seat belt use. This question also follows naturally from our findings (as reported
in Section V) that increasing seat belt use reduces fatalities overall.
Most of the empirical studies that have investigated this question mainly focus on the effect
of the two different types of enforcement on usage rate. The general findings are that laws
increase usage, and that primary enforcement does it significantly better.14 The problems with the
13 See, for example, Traynor (1993), who provides evidence that drivers are more likely to take different precautions, such as wearing seat belt, when driving conditions are bad. 14 See, for example, Campbell (1988), Campbell, Stewart, and Campbell (1988), Dee (1998), Evans and Graham (1991), Wagenaar et al (1987), and Patryka (1987).
8
existing studies is that they generally focus on the short-term effects of adopting seat belt usage,
because they do not have panel data sets that are sufficiently long.
As various writers have emphasized (Peltzman (1977), Evans and Graham (1991)), the long-
term effects of the considered legislation might differ from the short-term effects. Since our panel
data of seat belt usage rate is based on a fairly long period, we can obtain reliable findings
concerning what makes seat belts laws effective. Consequently, we can test whether a difference
exists between the short-term and the long-term effects of the law.
Some of the empirical studies also investigate the effects of different individuals’
characteristics on their decisions to use seat belts. It has been found that heterogeneity across
individuals is important, and that the more risk-averse individuals are more likely to comply with
the law.15 This heterogeneity creates another difficulty in measuring the impact of the law. It
might suggest, for example, that an increase of usage rate from 40 to 60 percent captures
different individuals who begin to wear seat belt, when compared to an increase from 80 to 100
percent. This may lead to different effects on fatalities. We address these issues in Section V.
III. EMPIRICAL STRATEGY
A. The Effect of Usage Rate on Fatalities
As discussed above, during our observation period, all U.S. states except New Hampshire
gradually passed mandatory seat belt laws. The variation in our data comes from the fact that states
have passed such laws in different years and adopted laws that differ along several dimensions, such
as the type of enforcement or the level of the fine. Another variation comes from the fact that states
revised their laws. In particular, several states moved from secondary enforcement to primary
enforcement.16 Figure 1 shows the number of states with mandatory seat belt laws and the type of
enforcement, as it evolved during our observation period. The fact that the move towards having
mandatory seat belt laws was quite gradual helps us identify the effects of the law.
15 See Center for Disease Control (1986), Dee (1998), Evans (1987), Evans and Wasielewski (1983), Hunter et al (1990), Houston (1995), Porter and Levitt (1999), and Singh and Thayer (1992). 16 The two other papers that use similar panel data sets did not have such richness, because of the time at which they were written. Evans and Graham (1991) had only data for 1984 to 1987, and Houston et al (1995) covered the period from 1967 to 1991.
9
Using our unique data, we address the various problems discussed in the preceding section in
order to quantify the effect of usage rate on fatalities, test the compensating behavior hypothesis,
and measure the effects of different elements of mandatory seat belt laws on seat belt usage rate.
We estimate a simple linear equation of traffic fatalities on usage rate. The basic equation is:
itFt
Fi
Fit
Fitit XUF εταγβ ++++= )ln()ln()1(
where Fit is the number of traffic fatalities at state i in year t, Uit is the seat belt usage rate, Xit is a
vector of control variables, and αiF and τt
F are state and year fixed effects.
The year fixed effects control for any time specific “macro effects” which shift the level of
traffic fatalities for all states. In our context, examples of such macro effects might be
technological changes that introduced safer cars, or national campaigns that affected the behavior
of drivers. The time effects also capture the increased penetration of air bags over time.17 The
state fixed effects should capture any unobserved state characteristics, which are fixed over time,
such as population characteristics, general weather conditions, traffic conditions, and others. Our
control variables thus capture characteristics that are changed over time and across states and that
might affect traffic fatalities.
As pointed out in the preceding section, using ordinary least squares regression to estimate
equation (1) is likely to be incorrect. In particular, it is likely to introduce an upward bias to the
coefficient of usage rate because of the endogeneity of the decision to wear seat belt. To address
this endogeneity we control for state fixed effects. These effects take into account, for example,
that in states with more dangerous traffic conditions (say, due to weather or road conditions)
people are more likely to use seat belts, but are also more likely to be involved in a traffic
accident. Of course, adding state fixed effects cannot eliminate completely problems of
endogeneity. The probable positive correlation between usage rate and the error term is likely to
be lower once fixed effects are controlled for, but it might still remain. Conditions in any given
state change over time. For example, states that experienced an increase in traffic fatalities might
invest in promoting seat belt use. Such investments might lead to an increase in usage rate, which
again might generate a positive correlation between the usage rate and the error term and thereby
introduce an upward bias to our estimated coefficient.
Therefore, it is worthwhile instrumenting for the usage rate. In our case, variables that are
related to the mandatory seat belt laws are natural candidates for instrumental variables. The 17 Air bags effects would not be captured completely by the year effects if there were cross effects between seat belts and air bags. However, it was suggested that these two protection devices are almost independent, in the sense that each is found useful in different types of accidents. See, for example, footnote 19 in Levitt and Porter (1999).
10
elements of the law are likely relevant in the sense that they are correlated with the usage rate
(after all, this is what the laws are for), and it is also reasonable to assume that they are not
correlated with the error term. As already discussed earlier, it seems reasonable to assume that
mandatory seat belt laws have no direct effect on traffic fatalities other than their effect through
the change in the usage rate.
There might still be a concern with respect to the possible endogeneity of the mandatory
seat belt laws. In particular, it might be argued that states that faced an increase in their traffic
fatalities had a higher propensity to pass the law or to pass a specific type of law. While the
above concern might be important for cross sectional analysis 18, we believe that, once we control
for state and year fixed effects, this concern becomes much less important. It is worth
reemphasizing that all jurisdictions, except New Hampshire, eventually passed the law, so the
considered concern might arise only with respect to the type of the law and the time at which it
was passed. The passage of the law is a political process that is likely to take time and whose
outcome might depend on different political factors, which are likely to be unrelated to
fatalities.19 The main opposition to the seat belt laws was based on arguments that are related to
individual rights20 and to discriminatory enforcement 21, but not to traffic fatalities. Thus, the
political balance of power and “administrative” political factors are likely to be the primary
factors that affected the timing in which the legislation passed in any given state. Indeed, the
National Highway Traffic Safety Administration (1999), in a detailed survey of the legislative
process of mandatory seat belt laws, never mentioned that high levels of traffic fatalities
facilitated or had any effect on the passage of the law. Instead, this survey viewed administrative
and political problems as deciding the timing of the passage of the law. To quote:
“Traffic safety measures were introduced when the agenda for the legislative session allowed it. Some sessions, highly influenced by the Governor’s agenda, were dedicated to gun control issues or revenue concerns while others were concerned with traffic safety measures, making it the right time for the introduction of safety belt laws. Timing of legislative priorities was crucial to passage. In most cases, legislators who supported traffic safety issues were able to generate the necessary votes for only a limited
18 For example, the results in Garbacz (1992b) are likely to be driven by such endogeneity bias. 19 See Levitt (1996) for a similar argument, when using prison-overcrowding litigation as an instrument for the number of prisoners. 20 The argument is that unlike other traffic violations, seat belt law violators do not put anyone else at risk, other than themselves, and hence should be free to choose whether to use seat belt or not. 21 The term “Driving While Black” was used in the media to bring attention to this. It is argued that police officers use mandatory seat belt laws, and in particular primary enforcement, in order to stop Afro-Americans and harass them. In practice, statistical studies have shown that this is not true.
11
number of such measures in any given legislative session. These issues included child passenger safety and speed limit initiatives.” (NHTSA 1999, page 24)
In general, the procedure needed for a state to pass and enforce such a law is long and
complicated, making the timing of the law independent of the error term on fatalities. In
particular, this is a reasonable assumption once state and year fixed effects are included. It is also
worth noting that fatalities series are quite noisy, so even a short delay in passing the law is
enough to make the actual timing of the passage of the law to satisfy standard exogeneity
requirements.
While there is no direct statistical test for the validity of the instruments, we run several tests
and find results that are consistent with the above arguments. It is also important to note that the
use of instrumental variables does not only remedy the endogeneity problem, but it also solves
any estimation problems that might result from measurement errors in the usage rate variable
(the potential measurement errors are discussed in Section IV). As will be discussed in Section
V, our results indicate that using the state fixed effects and the instrumental variables indeed
helps, and significantly changes our estimated coefficient in the predicted direction.
We follow the existing literature and estimate equation (1) twice. We first use the number of
occupant fatalities as the dependent variable, and we then use the number of non-occupant
fatalities as the dependent variable. In the first regression we expect to obtain a negative
coefficient on usage rate, which would be in line with the expected direct effect of seat belts as a
protection device. The second regression tests for the compensating behavior hypothesis testing
for a positive association between non-occupant fatalities and seat belt usage rates. A positive
coefficient on usage rate in the second regression would be consistent with the compensating
behavior hypothesis, whereas an insignificant or a negative coefficient would not support the
hypothesis.22 The results are discussed in Section V. 23
22 Note that much of the endogeneity problem of usage rate that is discussed in the text is less severe for the non-occupant regression than it is for the occupant one. It is less obvious that an increase in non-occupant fatalities would make drivers use more seat belts. However, it is likely that it is not always the case that people obtain (through the media, for example) separated statistics of traffic fatalities for occupants and non-occupants. Hence, not being able to separate out the two, an increase in non-occupant fatalities is predicted to affect seat belt decisions in a similar way to an increase in occupant fatalities, so endogeneity may still be an issue. 23 Another way to test the Peltzman effect would be to look at change in the number of accidents that result from an increase in the use of seat belt. The past work has not used changes in the number of accidents because data on the number of accidents is viewed as problematic (as “accidents” are not well defined). As will be discussed in Section V, we also tested the Peltzman hypothesis using limited panel data set on number of accidents and obtained results consistent with those we obtained using the number of non-occupant fatalities.
12
B. Factors that Make Seat Belt Legislation Effective in Increasing Seat Belt Use
To investigate which factors make seat belt laws effective we use our data on the usage of seat
belts in the 50 U.S. states that have passed such a mandatory seat belt law during the period 1983 to
1997. Although all these states passed such laws, their laws differ significantly in various ways.
This provides us with a panel data set that enables us to identify the factors that make such
regulation effective.
The main difference among the states is the type of enforcement – primary vs. secondary. In
addition, some states have switched their type of enforcement from secondary to primary
enforcement, providing an additional layer of variation in the data. This variation in the data across
states and over time enables us to perform our analysis. Of the 16 states with primary enforcement,
8 states passed the law with primary enforcement to begin with, and 8 states switched from
secondary to primary enforcement after the initial adoption (see Table 1). Figure 4 shows the
variation in usage rates across the different states, and gives a sense that usage rates are higher in
states with primary enforcement, and lower in the absence of any mandatory seat belt law.
We also estimate how usage rates are affected by the level of the fine, the passage of time since
the adoption of the law, the initial level of seat belt usage rate, and whether the insurance coverage
is reduced for violation of the seat belt law. We use a simple linear regression to estimate the
effects of the various features of the law of the law on the level of seat belt usage rate. Box-Cox
regression supports this functional form, as discussed in detail in Section V. Our standard
specification is:
itUt
Ui
Uit
Uitit vXLU ++++= ταγβ)2(
where Uit is seat belt usage rate at state i at year t, Lit stands for different elements of the law, Xit
is a set of controls, and αiU and τt
U are state and year fixed effects. An alternative specification
would use seat belt as a dynamic decision by adding to equation (2) the lagged usage rate, Uit-1,
as a regressor. We briefly discuss this specification in Section V. 24
24 When using fixed effect, one should be concerned that the coefficient on the lagged dependent variable would be biased because of the correlation between the lagged usage rate and the within error term. Therefore, to remedy the bias, we instrument for it by using the lagged difference in usage rate.
13
IV. DATA
We use a panel of annual state- level variables for all 50 U.S. states and the District of
Columbia. Unless otherwise noted, all variables over the period between 1983 and 1997. Our
data can be split into four parts: data on fatalities (the dependent variable), data on seat belt usage
rate, control variables and law-related variables (the instruments). The Data Appendix defines all
the variables, describes their sources and their relevance, and provides some descriptive
statistics. In this section we focus on the most important variables, namely traffic fatalities and
seat belt usage rate.
The data on traffic fatalities was obtained from the Fatality Analysis Reporting System
(FARS), which is publicly available through the National Center for Statistics and Analysis
(NCSA). FARS contains detailed information on all fatal traffic accidents within the United
States.25 We used the FARS system to obtain the number of annual fatalities by state for different
types of victims. We aggregated the different types of victims into two groups: occupant and
non-occupant fatalities.26 There are roughly 35,000 occupant fatalities, and roughly 5,000 non-
occupant fatalities every year. Figure 2 shows the trend in total fatalities, for occupants and non-
occupants, during our sample period. It indicates that there is no clear trend over time. Once we
normalize by vehicle mile traveled (VMT), we can observe a drop in fatalities over the sample
period for both occupants and non-occupants.
An important and unique part of our data set is the state- level data on seat belt usage rate.
We obtained data on seat belt usage rates from three different sources: (i) a data set which we
collected from states’ Highway Safety Offices, (ii) the official usage rate level reported by the
National Highway Traffic Safety Administration (NHTSA), and (iii) the Behavioral Risk Factor
Surveillance System (BRFSS), which is an annual survey run by the Center for Disease Control
(CDC).
25 A fatal accident is defined as any traffic accident that results in fatality to a vehicle occupant or non-motorist, or in fatality from injuries resulting from traffic crash that occurs within 30 days of the crash. 26 Non-occupants are the sum of pedestrians and bicyclists fatalities. Occupants are the sum of drivers and passengers. We do not distinguish between front seat and rear seat passengers, although it may be argued that rear seat passengers, in many states, are not required to use seat belt, and hence should be treated as non-occupants. If this is the case, then it only makes our results stronger.

14
(i) Data from the Highway Safety Offices of each state: We first collected data on the seat
belt usage rate by contacting the Highway Safety Offices of each state. The states obtain their
estimates of seat belt usage rate by conducting periodical observational surveys.27
Most of the states had separate estimates for front seat occupants and for rear seat
occupants. We used only the information on front seat occupants, which was available for all
states for which we had data. Consistent with NHTSA guidelines, the data were then weighted to
reflect the regional sampling design and the average daily traffic volume.
Most of the states provided us with annual usage rate figures, starting at the year prior to the
passage of the law, and continuing thereafter. Other states provided more limited data, only for
selected years in which they conducted the observational survey. Out of the 50 U.S. states and
the District of Columbia, 37 states provided us with a full set of data that includes annual usage
rate from the passage of the law until 1998. Five states provided us with incomplete data for
some of the years in our observation period. We were unable to obtain data from 9 states, either
because they did not have any organized data, or because we were unable to get the data from the
state’s Highway Safety Office.
(ii) Data from the National Highway Traffic Safety Administration: an additional source of
data on usage rate was provided from the National Highway Traffic Safety Administration
(NHTSA). These data include annual state- level usage rate from 1990 until 1999, for all 51
jurisdictions. Prior to 1990, NHTSA used to determine the national seat belt usage rate by a 19-
city survey, and NHTSA thus does not have usage rate data for years prior to 1990. For most of
the states we were able to compare the NHTSA figures with those we obtained from the state’s
Highway Safety Office, and they were quite similar.28 The NHTSA data that we use is also the
one used by the federal government to estimate the effect of seat belt legislation and to allocate
federal budget among states.
27 The way the observational survey is conducted is the following: each state chooses a number of counties, which usually account for more than 85% of the population. In each county the survey is held in several chosen sites (intersections). The sites are chosen from a list of potential sites by a standard unbiased sampling procedure, which is recommended by the NHTSA. Potential sites are places where the driver has to either slow down or to stop completely, so that the observation is made easier and more accurate. After a short training, each observer is randomly assigned to a specific site and to a specific time of day (the observation slots are generally a 40-60 minutes time window during daylight hours in midweek days). 28 In more than 95% of the cases, the differences between the NHTSA figures and the state provided figures were not more than 1-2 percentage points. In most cases, the figures were identical, which is of no surprise, because the states’ offices are generally the source for the NHTSA data.
15
To obtain a data set on seat belt usage rate that is as full as possible, we merged the data we
obtained from each state’s Highway Safety Office with the NHTSA data. The reported results
use this combined data.
A concern might be raised with respect to the reliability of the figures we obtained from the
two sources described above. It might be claimed that states declare intentionally higher usage
rate than the actual one in order to win federal budgets that are promised to states that are able to
reach some threshold level of usage rate. There might be also some concern with respect to the
comparability of the usage rate figures across states and over time. Different states use
observational methods that might somewhat vary even if they are similar in spirit. In addition,
some of the states changed the way they conduct their observational surveys over time. For
example, some states changed the number of counties or sites.
We address the above concerns in several ways. First, we try to mitigate estimation
problems that might arise from the nature of the usage rate data. In particular, we use state and
time fixed effects to control for state-specific biases that are fixed over time, as well as for biases
that might result from changes in reporting requirements by NHTSA. Second, we use
instrumental variables for usage rate, thereby addressing any non-systematic measurement errors.
Third, as described below, we obtained data on seat belt usage rate from a totally independent
source, and this enables us to test further the robustness of our results.
(iii) Data form the Center for Disease Control: we also obtained an alternative and
independent data set on usage rates from the Behavioral Risk Factor Surveillance System
(BRFSS) survey of the CDC. The BRFSS is a state- level survey designed to help state health
agencies in reducing behavioral risks and their consequent illnesses. One of the questions asked
in this survey is: “How often do you use seat belts when you drive or ride in a car?”. There are
five possible answers: never, seldom, sometimes, almost always, and always. We assigned
weights to each one of the answers29 and aggregated them by state over all surveyed individuals,
adjusting for sampling weights.30 Obviously, this variable is far from being optimal for
measuring usage rate. In particular, the data suffer from all the problems that arise from self-
reporting, and from subjective answers. Nevertheless, because these data were obtained
29 The weights we have used were (0,0.1,0.3,0.75,1). We tried few other quintuplets of weights, without much difference in the results. 30 The BRFSS is a random telephone survey. Hence, sampling weights try to adjust mainly for different number of telephone lines and different number of persons in each household.
16
independently from our actual usage rate data, a strong relationship between the two data sets
confirms the reliability of our original usage rate data and the robustness of the results.
The BRFSS data is available from 1984 until 1997, with varying numbers of states surveyed
each year. Only 12 states were surveyed in 1984, but starting from 1990 almost all states were
surveyed. From 1993 on, the question about seat belt use was asked on a regular basis only every
other year, so for 1994 and 1996 there are only 10 states for which we have data.
In general, the BRFSS data, with the weights we use, suggests significantly higher usage
rates than the data created by merging the data of the states and the NHTSA. However, the
correlation between the two data sets is remarkably high.31 The simple pooled correlation
coefficient between the two series is about 0.85. Cross-sectional correlation coefficients for each
year separately are above 0.7 for all years, and most of the correlation coefficients over time for
a given state are above 0.8. Figure 3 shows the increasing national level usage rate over time,
with the very similar trend in the usage rate, as calculated from the BRFSS survey. In addition to
these simple comparisons, and in order to address any potential concern about the accuracy of
our usage rate data, we replicated our analysis, presented in Section V, using the CDC usage rate
data. Using the CDC usage rate we obtained remarkably similar results both for the point
estimates and for the significance levels.
V. RESULTS
A. The Effect of Seat Belt Use on Occupant Fatalities
Table 2 presents a set of log- log regressions of occupant fatalities on usage rate and other
controls. The first column reports an OLS regression, without controlling for state fixed effects.
The coefficient on usage rate is positive and significant, suggesting that higher seat belt usage
rate increases occupant fatalities. As argued before, this is likely to be the result of strong
endogeneity of the usage rate variable. Indeed, once we control for state fixed-effects, as
reported in the second column of Table 2, the coefficient on usage rate changes sign and
becomes negative and statistically significant. However, the inclusion of state fixed effects
corrects only for part of the endogeneity problem, the part that arises from cross-sectional
differences across states. The usage rate variable is still likely to be positively correlated with the
31 Similar procedure is used by Garbacz (1990, 1992b), who compares the BRFSS data to the North Carolina official data, and find remarkably similar correlation coefficients to ours.

17
error term, and hence be biased upwards, towards zero. Another potential source of bias in the
coefficient on usage rate is that of measurement errors. This source of bias would also lead to a
bias towards zero in the coefficient.
Fortunately, by instrumenting for usage rate using the mandatory seat belt law and type of
enforcement dummies we solve both problems. Indeed, as reported in the third column of Table
2, once instrumented for, the usage rate coefficient becomes higher in absolute value, with
elasticity of about –0.13. Our data sources also allow us to separate between the two sources of
bias. To eliminate the bias caused by measurement error, without changing the endogeneity bias,
we use the other measure of usage rate, the one obtained from the CDC, as an instrument for the
usage rate.32 By doing so, we obtain a coefficient of –0.097 on the usage rate, suggesting that
about half of the bias in the fixed effects OLS coefficient may be attributable to measurement
errors, whereas the other half comes from endogeneity.
The coefficients on the control variables deserve attention as well. Note the extreme change
in most of them once we move from the simple OLS regression in the first column to the fixed
effects specification in the second column. Because most of the variation in these variables is
between states rather than within states (see the Data Appendix), the simple OLS results are
driven by the former, while the fixed-effects results are driven by the latter. Some of the popular
views expressed in the press or other publications seem to be driven by the cross-sectional
variation, and they disappear once state fixed effects are controlled for.
The third column of Table 2 indicates that the coefficient on income is positive and the
coefficient on unemployment rate is negative. This suggests that traffic fatalities are lower in bad
times, which is consistent with Ruhm (2000) findings that in recessions mortality rates are
smaller. Ruhm claims that traffic fatalities are higher in booms because people drive more. We
control for traffic density and VMT, however, and we still find a positive coefficient on income
and a negative one on unemployment. This suggests that economic booms increase traffic
fatalities not only because people tend to drive more in booms but also for other reasons. In
booms the opportunity cost of driving time might be higher, which might induce people to drive
faster.
The coefficients on the other demographic variables do not turn out to be statistically
significant once fixed effects are controlled for. This result is inconsistent with the widespread
32 This seems as a reasonable assumption because it is most likely that the measurement errors in the CDC usage rate are uncorrelated with measurement errors in the observed usage rate.
18
perception that Afro-Americans are involved in more fatal traffic accidents. This popular view is
consistent with the OLS results, but it disappears once we control for state fixed effects.
Traffic density, in both rural and urban roads, has a negative effect on fatalities. Denser
traffic might results in slower or more careful driving and hence less accidents. The
interpretation of the coefficients on VMT is indirect because VMT is also used in the
construction of the dependent variable. The fact that urban VMT is negative while rural VMT is
insignificant suggests that a mile traveled in rural roads is more dangerous than a mile traveled in
urban roads, which seems plausible.
The coefficients on the crime variables change significantly when moving to the fixed
effects specification. While the coefficient on violent crime becomes insignificant, the one on
property crime turns out to be positive. This may result from the fact that higher rate of property
crime might be driven by the same unobservables that cause careless driving so that the two go
together. Another reason might arise from the size and focus of the police force. Holding the
police size fixed, it seems reasonable to assume that in periods of higher crime rate greater police
force will be targeted at crime, so that traffic enforcement will be lower and traffic fatalities
higher.
The controls for other laws are in line with the results in some earlier studies. Higher fuel
taxes reduce fatalities (again, even after controlling for VMT) and so do stricter speed limits and
MLDA laws.
B. The Effect of Seat Belt Use on Non-Occupant Fatalities
Table 3 is identical to Table 2 except for the dependent variable - which is now the non-
occupant fatalities. Again, it is easy to notice the dramatic changes in the coefficient on usage
rate once we control for state fixed-effects. In the simple OLS regression, the coefficient on
usage rate is positive and statistically significant, which could be interpreted as an indication of a
Peltzman effect. We view this as a replication of the results reported by Garbacz (1992b) and
Risa (1994). However, once state fixed effects are controlled for, the coefficient on usage rate
becomes negative and statistically significant, suggesting the reverse story. This result is
consistent with the story that the use of seat belts makes drivers more mindful of safety issues,
thus inducing them to drive more carefully. However, once we treat the usage rate as
endogenous, the coefficient on usage rate decreases in absolute value and becomes statistically
19
insignificant. Thus, we conclude that the effect of usage rate on non-occupant fatalities is non-
positive, and that there is thus no support to the Peltzman effect.
Table 3 indicates that, whereas many of the coefficients on the control variables obtain
significant coefficients when we do not control for state fixed effects, almost all of them become
insignificant once we control for state fixed effects. This suggests that the within variation in
non-occupant fatalities is quite noisy, and it cannot be explained by our control variables.
Another possibility is that we need other controls to explain non-occupant fatalities, such as the
number of bicycles or pedestrians in each state or the level of activity (i.e., the equivalent of
VMT) per bicyclist and pedestrian in each state. This kind of data, however, is not available. The
only two controls that do have significant coefficients in Table 3 are age and the dummy for high
speed limits. The latter is positive, suggesting that higher speeds are likely to lead to more non-
occupant fatalities. The coefficient on age is positive and very high. This may be the result of
higher likelihood of non-occupant (mainly pedestrians probably) fatalities of elderly persons.
It might be suggested that bicyclists are subject to technological changes such as better
bicycle and the introduction of bike helmets in the 1980’s. Such changes might affect the
interpretation of the results we obtain for non-occupant fatalities. To deal with this concern, we
ran the above regressions for pedestrians only whose activity presumably is not subject to
technological changes. The coefficient we obtain on usage rate remains insignificant as before.
The Peltzman effect might be tested also by looking at the change in the number of
accidents, instead of the change in non-occupant fatalities, that results from an increase in the
use of seat belt. The number of accidents might reflect the possible change in driving behavior.
However, data on the number of accidents is viewed as problematic and has not been used
heavily in the literature because unlike fatalities, “accidents” are not well defined.33
Nevertheless, we used such data to check our previous results. Using a panel data of 17 states
over six years for the number of accidents (see Data Appendix), instead of non-occupant
fatalities, we find that the coefficient on usage rate was insignificant. This result is similar to the
results presented in Table 3, and it is consistent with those findings of ours that suggest that
compensating behavior does not have a significant effect.
33 In this case, for example, an accident is the count of police accident reports. While police is likely to be present at any series accident, the arrival of police to the scene of a minor accident may depend crucially on the region, the time of day, the day of the week and on many other factors. Many crashes are not reported to police and therefore go undetected in state records. Studies have concluded that these cases make up a sizable portion of motor vehicle crashes (see Blincoe and Faigin (1992) and NHTSA (1994)).
20
C. The Effect of Mandatory Seat Belt Laws on Seat Belt Usage Rate
The “first step” of our instrumental variable estimation is also of interest. As discussed
earlier, identifying how the different elements of mandatory seat belt laws affect usage rate may
have substantial implications for policymaking.
Table 4 reports the results of regressing seat belt usage rate on the law variables and
different controls. The first regression does not use state fixed effects and the second one does.
We also considered several functional forms for the usage rate variable, but a Box-Cox
regression, allowing the dependent variable to have flexible functional form, suggests that a
linear specification is the most suitable functional form, with L equal to 1.025 and insignificantly
different from one (p-value > 0.65).34 It is also worth noting that the linear specification also can
be seen easily from looking at plots of the usage rate series state by state, of which some are
presented in Figure 5.
As expected, mandatory seat belt laws significantly increase the level of seat belt usage rate,
and primary enforcement does this more effectively than secondary enforcement. Primary
enforcement increases usage rate by about 22 percentage points, whereas secondary enforcement
increases usage rates by only half as much. Switching from secondary to primary enforcement
increases the usage rate by about 13 percentage points. Our results suggest that adopting primary
enforcement initially has a similar effect on usage rates to that of first adopting secondary
enforcement and then switching to primary enforcement. Indeed, we cannot reject the hypothesis
that both effects are equal – the sum of the coefficients on secondary enforcement and on the
switch to primary enforcement is not significantly different from the coefficient on primary
enforcement.
It is also interesting to discuss the variables that are excluded from our final regression.
Some of the existing literature suggests that the short-term effects of mandatory seat belt laws
might differ from the long-term effects. We therefore defined new variables, which were equal to
the time passed since the law was adopted for each one of the enforcement types. None of these
variables was found to be significant. This suggests that the effect of the law is immediate and
permanent. This phenomenon can also be verified from looking at usage rate plots state by state,
as demonstrated in Figure 5 for three selected states.
34 If y is the dependent variable, a Box-Cox regression is a Maximum Likelihood estimation that searches for the transformation of y that best fits the data. The search is over a parametric family of transformation of the form (yL-1)/L. The special case of L=1 is a linear form, while the special case of L=0 is a logarithmic form.
21
We also tested the significance of other components of the law. We found that the
coefficient on who is required to use seat belts is not significant.35 Similarly, the coefficients on
whether not wearing seat belt can account for a deduction in the insurance coverage in case of an
accident, and the coefficient on the level of the fine, turned out to be insignificant as well.
In addition, most of our control variables lose significance once state fixed effects are
included. It is also interesting to note that the percentage of Afro-Americans or Hispanics is not
significant, even when state fixed effects are not included. This contradicts the common view
that minorities are more likely not to use seat belts and hence should be specifically targeted in
seat belt campaigns.
While traffic fatalities seem to be a static variable, seat belt usage rate might have some
dynamic effects as well. Wearing a seat belt might become a habit; so once an individual begins
to wear a seat belt, she is more likely to wear it later on. Therefore, we also estimated a
regression which used lagged seat belt usage rate as an explanatory variable.36 As expected, the
lagged usage rate variables turned out to be significant, with a coefficient of about one third,
taking about one third of the explanatory power from the law-related dummies. However, given
that the laws largely moved only in one direction, from not having a law to having one or from
having secondary enforcement to having primary enforcement, it is not clear that our data can
distinguish between dynamic and static effects.
Ideally, one would use longitudinal data to identify the different effects. Alternatively, to
address this problem, one would want to examine cases in which the law was changed in the
other direction. Such changes have in fact happened in four states in the late 80’s
(Massachusetts, Nebraska, North Dakota, and Oregon). In these states mandatory seat belt laws
were passed, repealed, and reinstated again. In all these cases, however, the time period between
the changes did not exceed two years, which thus precluded using it for identification given our
annual usage rate data. Still, the few data points from these episodes are not consistent with the
view that static decisions are more important than dynamic habits; usage rates dropped
drastically with the repeal of the laws and increased immediately after the laws were reinstated.
35 Recall that our usage data is on front seat passengers only, so this result is not very surprising. It is quite likely that this component of the law would affect usage rate of rare seat passengers, but the available data do not allow us to test this. 36 With the fixed effects specification, the lagged usage rate is correlated with the error term, and hence needs to be instrumented. We used lagged first difference as instruments.
22
D. Robustness and Specification Tests
We have used different specifications and have run different tests, to check whether our
results are robust. We have also done so to examine whether our assumptions regarding the
validity of the instruments and the functional form are supported by the data.37
First, we tested different sets of controls by omitting and adding variables to the set of
controls reported in Tables 2 and 3. Additional controls were proxies for the state population’s
level of risk aversion, which we obtained from the CDC data. These controls inc luded data on
diet, smoking habits and frequency of exercising. 38 Other controls that we included are the
number of licensed drivers and registered vehicles. We also included the fraction of new car
registrations out of the overall registered cars in the state. We did that in order to capture
differences in the safety level of cars resulting from different distributions of vintages of cars
across states. The fraction of trucks out of the overall registered vehicles has been investigated as
well. None of the additional controls significantly influenced our estimates of the usage rate
coefficient. We also ran the same specification substituting our usage rate data with the CDC’s
usage rate data. The results had the same patterns for the coefficients, as well as similar point
estimates. In addition, we ran a first difference regression instead of a fixed effects regression to
take into account serial correlation problems, and the results were not altered much (although
their significance levels decreased).
Functional form is also an issue. Earlier papers showed that less careful drivers are less
likely to use seat belts. Thus, drivers that are least likely to use seat belts might be those who are
more likely to be involved in an accident. If this is the case, one may think that by increasing seat
belt usage rate from, for example, 80% to 90%, more lives will be saved compared to an increase
in usage rate from 20% to 30%. In other words, it might be argued that the relationship between
fatalities and usage rate is concave. Our log- log specification, however, suggests exactly the
opposite. Fixing the number of fatalities, the log- log specification means that the same
percentage points increase in usage rate is more effective at low levels of usage rate, so that the
relationship between fatalities and usage rate is convex. In order to test for this, we included in
our specification two more variables – a linear term for usage rate, and the logarithm of one
minus the usage rate. Somewhat surprisingly, the coefficients on these variables turned out to be
37 Most of these tests are reported only in the text, but will be gladly provided by the authors upon request. 38 These variables are not used in the reported regressions because using them required us to reduce significantly the number of observations we could use for estimation.
23
very low and completely insignificant, without much changing the estimated coefficient on the
original logarithmic term.
Another possible concern is that our identification for the usage rate variable might be
driven by long-term within-state differences – and not by the actual change in the mandatory seat
belt laws. Table 5 provides the estimated coefficients for both occupant and non-occupant
regressions for different choices of time windows around the passage or the change of the
mandatory seat belt law. Although the coefficients are naturally not the same, their magnitude as
well as their significance level are quite stable over the different time windows, and quite similar
to those obtained in our reported regressions (third column of tables 2 and 3). This is also the
case if we omit from our sample the years around the law, just in case there is a concern that the
exact timing of the law is not well identified by the annual level dummy variable.
We have also investigated statistically the validity of the instruments. We argued earlier that
the timing of the passage of the law is exogenously determined, and has no relation to preceding
trends in fatalities. To test this, we regressed fatalities on all the variables and fixed effects
except usage rate, and we looked at the residuals across states for the years that preceded the
passage of the law. In order to analyze whether there exists any trend or pattern in the fatalities
series, we regressed these residuals on variables that account for the years prior to the law and
the type of enforcement chosen by the legislators. Table 6 reports the results. It can be seen that
such trends or patterns do not exists, and in none of the regressions the explanatory variables
have any explanatory power. All F statistics are very low, with all corresponding p-values above
15%. These results strengthen our assumption (discussed in detail in Section III) about the
validity of the instruments.
Similarly, one might be concerned that mandatory seat belt laws have other effects on
fatalities than the effect through increasing in usage rate. For example, the passage of mandatory
seat belt laws might be accompanied by a general campaign for traffic safety, thus making
drivers more attentive to safety issues. While there is no formal test to check whether this is the
case, Table 7 reports the reduced form coefficients, when fatalities are regressed directly on the
instruments, the law dummy variables. The idea is that, if the assumptions are correct, and the
laws affect fatalities only through seat belt usage rate, then it will be possible to approximate
their effect on fatalities by calculating it indirectly through the effect on usage rate (as can be
calculated from the results reported in tables 2, 3, and 4). Indeed, back-of-the-envelope
calculations suggest that there is no major difference in the order of magnitude of the average
24
effect of the law if we calculate it from this regression rather than from the results reported in
Tables 2, 3, and 4.
A remaining puzzle concerns the positive and highly significant coefficient on the primary
enforcement dummy for the non-occupant regression, as reported in Table 7. This coefficient
seems quite robust, even when we include usage rate in the regression, as well as for different
choices of subsamples.39 Taken at face value, this coefficient might suggest that some sort of
Peltzman effect does exist, and it replicates some of the results in the existing literature.
However, given our results for usage rate, it seems that this is not the right interpretation, but
rather that there is something else, left unexplained, that makes non-occupant fatalities go up
when primary enforcement laws are passed. This strengthens our point that usage rate data is
essential for a rigorous test of the Peltzman effect.
VI. CONCLUSIONS
This paper uses a unique data set on seat belt usage rate in order to estimate the
effectiveness of mandatory seat belt laws. In contrast to earlier work, we analyze separately the
effect of the law on usage rate and the effect of the usage rate on fatalities, take into account the
endogeneity of usage rate, and take advantage of variation in laws. Along the way, we replicate
the results obtained in past work and show why the implications drawn form them were not
warranted.
The comprehensive data on seat belt usage rate enables us to test directly the theory of
compensating behavior suggested by Peltzman (1975). We find, contrary to the prediction of the
theory of compensating behavior, that higher seat belt usage does not have any significant effect
on driving behavior.
Our results indicate that, overall, mandatory seat belt laws unambiguously reduce traffic
fatalities. We estimate the elasticity of occupant fatalities with respect to usage rate to be about
-0.135. This estimate implies that about 1000-1500 lives would be saved annually if the national
seat belt usage rate increased from 68% to the (still unattained) target level of 85% for 2000.
39 In fact, the significance of primary dummy in the non-occupant regression, together with the insignificance of usage rate in the IV regression, makes the primary dummy invalid as an instrument in the non-occupant regression that is reported in Table 3. Still, the secondary dummy remains a valid instrument, and using only secondary dummy as an instrument for the non-occupant regression does not alter the results.
25
This estimate is less than a half of the estimate used by the National Highway Traffic Safety
Administration (NHTSA). The significant difference in these estimates results from the fact that
the NHTSA uses 45% as the estimated elasticity of seat belt usage. Note that the 45% elasticity
is based on the actual usage rate, as estimated from the usage rate of drivers involved in traffic
fatalities. This usage rate might differ from the one calculated in observational studies and used
for the calculation of the national usage rate. Hence, our estimates provide a better guide for
policymaking in this area than the estimates currently used.
Finally, our work enables us to identify and measure the effect of various features of
mandatory seat belt laws on their effectiveness in increasing seat belt use. In particular, having
primary enforcement can considerably enhance this effectiveness. Our estimates indicate that the
national usage rate would increase from 68% to 77%, and 500 lives will be saved annually if all
states now having secondary enforcement were to move to primary enforcement. Thus, the
recent initiative by the federal government to encourage states to move to primary enforcement is
warranted.
Our findings provide support for a policy encouraging the use of seat belt law. By providing
more accurate and reliable measure of the potential benefits of such policy, and of the
consequences of various changes in its design, our findings can aid policy making in this area.
26
REFERENCES
Bhattacharyya, M., and Layton A. (1979), “Effectiveness of Seat Belt Legislation on the
Queensland Road Toll – An Australian Case Study in Intervention Analysis,” Journal of the
American Statistical Association, Vol. 74, No. 367, pp: 596-603.
Blincoe, L., and Faigin B. (1992), “The Economic Costs of Motor Vehicle Crashes 1990,”
Department of Transportation HS, pp. 807-876.
Campbell, B. (1988), “The Association Between Enforcement and Seat Belt Use,” Journal of Safety
Research, Vol. 19, pp. 159-163.
Campbell, B., Stewart J. and Campbell F. (1986), “Early results of seat belt Legislation in the
United states of America,” Working Paper A-123, University of North Carolina Highway Safety
Research Center, Chapel Hill, North Carolina.
Center for Disease Control (1986), “Behavioral Risk Factor Surveillance – Selected States, 1984,”
Morbidity and Mortality Weekly Report , Vol. 35, pp: 253-254.
Dee, T. S. (1998), “Reconsidering the Effects of Seat Belt Laws and Their Enforcement Status,”
Accident Analysis and Prevention, Vol. 30, pp. 1-10.
Department of Transportation (1984), “Regulatory Impact Analysis of FMVSS 208: Occupant
Crash Protection,” Washington DC.
Evans, L. (1986), “The Effectiveness of safety Belts in Preventing fatalities,” Accident Analysis and
Prevention, Vol. 18, pp. 229-241.
Evans, L. (1987), “Belted and Unbelted Drivers Accident Involvement Rates Compared,” Journal
of Safety Research, Vol. 18, pp: 57-64.
Evans, L. and Wasielewski, P. (1983), “Risky Driving Related to Driver and Vehicle
Characteristics,” Accident Analysis and Prevention, Vol. 15, pp: 121-136.
Evans, W. and Graham J. (1991), “Risk Reduction or Risk Compensation? The Case of Mandatory
Safety-Belt Use Laws,” Journal of Risk and Uncertainty, pp. 61-73.
Garbacz, C. (1990a), “Estimating Seat Belt Effectiveness with Seat Belt Usage Data from the
Center for Disease Control,” Economics Letters, Vol. 34, pp. 83-88.
Garbacz, C. (1990b), “How Effective is Automobile Safety Legislation?,” Applied Economics, Vol.
22, pp. 1705-1714.
Garbacz, C. (1991), “Impact of the New Zealand Seat Belt Law,” Economic Enquiry, Vol. 29, pp.
310-316.
27
Garbacz, C. (1992), “More Evidence on the Effectiveness of Seat Belt Laws,” Applied Economics,
Vol. 24, pp. 313-315.
Graham, J. D., Thompson K. M., Goldie S. J., Segui-Gomez M. and Weinstein M. C. (1997), “The
Cost-Effectiveness of Air Bags by Seating Position,” Journal of American Medical Association,
Vol. 278 (17), pp. 1418-1425.
Harvey, A. C. and Durbin J. (1986), “The Effect of Seat Belt Legislation on British Road
Casualties: A Case Study in Structural Time Series Modeling,” Journal of the Royal Statistical
Society Series A-Statistics in Society, Vol. 149 (3), pp. 187-210.
Houston, D. J., Richardson L. E. and Neeley G. W. (1995), “Legislation Traffic Safety: A Pooled
Time Series Analysis,” Social Science Quarterly, Vol. 76 (2), pp. 328-345.
Hunter, W., Stutts, J., Stewart, R., and Rodgman, E. (1990), “Characteristics of Seat Belt Users and
Non-Users in a State with a Mandatory Belt Use Law,” Health Education Research: Theory and
Practice, Vol. 5, pp: 161-173.
Insurance Institute for Highway Safety, Status Report, July 1995.
Insurance Information Institute (1990-1998), The Fact Book: Property/Casualty Insurance Facts,
Annual Publication.
Kim, K. (1991), “Effects of Enforcement on Seat Belt Use in Hawaii,” Transportation Research
Records, No. 1325, pp. 51-56.
Levitt, S. D. (1996), “The Effect of Prison Population Size on Crime Rates: Evidence from Prison
Overcrowding Litigation,” The Quarterly Journal of Economics, Vol. 111 (2). pp 319-51.
Levitt, S. D., and Porter, J. (1999), “Sample Selection in the Estimation of Air Bags and Seat Belt
Effectiveness,” NBER Working Paper 7210.
Loeb, P. D. (1995), “The Effectiveness of Seat Belt Legislation in Reducing Injury rates in Texas,”
Economic Analysis of Safety and Health Regulation, Vol. 85 (2), pp. 81-84.
McCarthy, P. S. (1999), “Public Policy and Highway Safety: A City-Wide Perspective,” Regional
Science and Urban Economics, Vol. 29, pp. 231-244.
National Highway Traffic Safety Administration (1994), Estimating the Benefits from Increased
Safety Belt Use, Department of Transportation.
National Highway Traffic Safety Administration (1999), Legislative History of Recent Primary
Safety Belt Laws, Department of Transportation.
Patryka, S. (1987), “Mandatory Belt Use Laws in 1985,” Journal of the American Association for
Automotive Medicine, Vol. 9.
28
Peltzman, S. (1975), “The Effects of Automobile Safety Regulation,” Journal of Political
Economy, Vol. 83, pp. 667-725.
Peltzman, S. (1977), “The Effects of Automobile Safety Regulation: Reply,” Journal of Economic
Issues, Vol. 11 (3), 672-678.
Risa, A. E. (1994), “Adverse Incentives from Improved Technology: Traffic Safety Regulation in
Norway,” Southern Economic Journal, Vol. 60 (4), pp. 844-857.
Ruhm, C. J. (2000), “Are Recessions Good for Your Health?,” The Quarterly Journal of
Economics, Vol. 115 (2), pp. 617-650.
Sen, A. (2001), “An Empirical Test of the Offset Hypothesis,” mimeo, University of Waterloo.
Singh, H. and Thayer M. (1992), “Impact of Seat Belt on Driving Behavior,” Economic Inquiry,
Vol. 30, pp. 649-658.
Traynor, T. L. (1993), “The Peltzman Hypothesis Revisited: An Isolated Evaluation of Offsetting
Driver Behavior,” Journal of Risk and Uncertainty, Vol. 7 (2), pp. 237-247.
Wagenaar, A. C., Maybee, R. G. and Sullivan, K. P. (1988), “Mandatory Seat Belt Laws in Eight
States: A Time-Series Evaluation,” Journal of Safety Research, Vol. 19, pp. 51-70.
Wilde G. J. S. (1982), ”The Theory of Risk Homeostasis: Implications for Safety and Health,”
Risk Analysis, Vol. 2, pp. 209-225.
Wagenaar, A., R. Maybee and K. Sullivan (1987), “Effects of Mandatory Seat Belt Laws on
Traffic Fatalities in the First Eight States Enacting Seat belt Laws,” Working Paper, The
University of Michigan Transportation Research Institute.
29
Data Appendix In this appendix, we describe all the variables used in the analysis (those which are used in the reported regression and those which were eventually excluded), motivate their use when necessary, and provide descriptive statistics for the continuous variables. Fatalities:
Data obtained from the Fatalities Analysis Reporting System (FARS): • Non-Occupant Fatalities – The number of traffic fatalities of pedestrians and bicyclists • Occupant Fatalities – The number of traffic fatalities of drivers and passengers (of any seating
position) of a motor vehicle in transport
Controls: Data obtained from the U.S. Census: • % Blacks – The percent of Afro-Americans in the state population • % Hispanics – The percent of people of Hispanic origin in the state population • Mean Age – Mean age in years • Median Income – Median income in current U.S. dollars Data obtained from the annual publication Highway Statistics: • Traffic Density Rural – Registered vehicles over length of rural roads in miles • Traffic Density Urban – Registered vehicles over length of urban roads in miles • VMT Rural – Vehicles Mile Travel in rural roads • VMT Urban – Vehicles Mile Travel in urban roads Data obtained from the Bureau of Labor Statistics (BLS): • Unemployment Rate – Unemployment Ratea Data obtained from the Department of Justice: • Violent Crimes – Number of violent crimes per capita (homicide, rape, and robbery)b • Property Crimes – Number of property crimes per capita (burglary, larceny, and auto theft)b
Other Related Laws:c
Data obtained from The Fact Book: Property/Casualty Insurance Facts: • 65 mph Speed Limit – A dummy variable that is equal to one for 65 mph top speed limit in the
state (55 mph is the base category) • 70 mph Speed Limit or above – A dummy variable that is equal to one for 70 mph or higher top
speed limit in the state (55 mph is the base category) • BAC is 0.08 – A dummy variable that is equal to one for a maximum of 0.08 Blood Alcohol
Content (0.1 is the base category) • Fuel Tax – The tax on fuel (in current cents) • MLDA of 21 Years – A dummy variable that is equal to one for a minimum legal drinking age of
21 years (18 years is the base category)
30
Elements of the Mandatory Seat Belt Law: Data obtained from The Fact Book: Property/Casualty Insurance Facts: • Secondary Dummy – A dummy variable that is equal to one for the periods in which the state had
a secondary enforcement mandatory seat belt law, or a primary enforcement that preceded by a secondary enforcement law (no seat belt law is the base category).
• Primary Dummy – A dummy variable that is equal to one for the periods in which the state had a primary enforcement mandatory seat belt law that has not preceded by a secondary enforcement law (no seat belt law is the base category).
• Secondary to Primary Dummy – A dummy variable that is equal to one for the periods in which the state had a primary enforcement mandatory seat belt law that has preceded by a secondary enforcement law (no seat belt law is the base category).
Usage rate:
Data obtained from both states’ observational surveys, National Highway Traffic Safety Administration (NHTSA) and from the Center for Disease Control (CDC) (for more details see Section IV): • CDC Seat Belt Usage Rate – The frequency of seat belt usage, as self-reported by state
population surveyed. • Seat belt Usage Rate – The observed percentage of front-seat passengers who use seat belt.
Variables, which were excluded from the reported regressions: Data obtained from the CDC: • Diet – whether people are aware of their diet.d • Drunk driver – how much alcohol a person drink before driving.d • Frequency of exercising – how often do people exercise.d • Smoking habits – how often do people smoke.d Data Obtained from the Ward’s Automotive Yearbook: • Number of licensed drivers. • Number of registered vehicles. • Fraction of new car registrations – out if the overall registered cars.e • Fraction of trucks – out of the overall registered cars. Data obtained from the National Center for Statistics and Analysis (NCSA): • Number of accidents – then number of accidents which were reported by a police officer at the
traffic crash scene.f Data obtained from The Fact Book: Property/Casualty Insurance Facts: • Required – who is required to wear seat belt (front seat passengers only or all passengers). • Fine – the level of the fine. • Repeat fine--whether there is a different fine for repeated violation of the law. • DM – whether non-usage is allowed for damage mitigation (this means that insurance companies
can reduce payments to occupants if it is proved that the occupants have not used seat belt during the crash).
Notes: a State-level data on unemployment rates is supposed to capture general economic conditions, and it indeed proved to be important in explaining fatalities in previous papers.
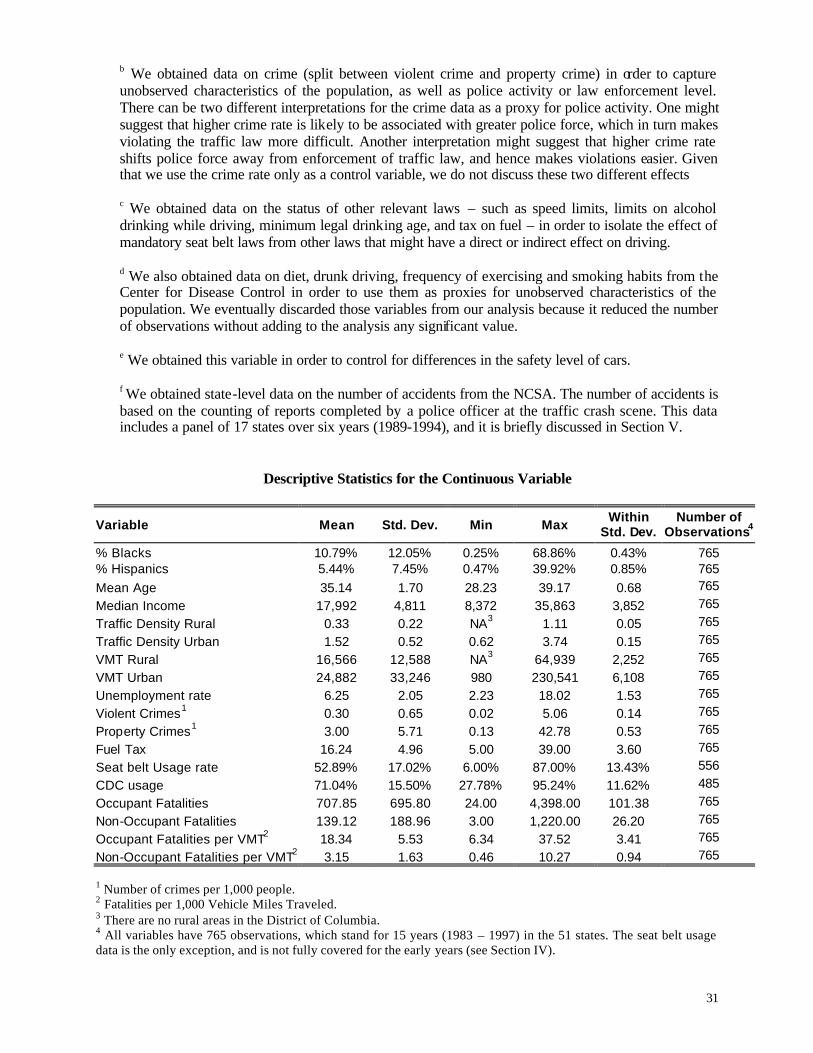
31
b We obtained data on crime (split between violent crime and property crime) in order to capture unobserved characteristics of the population, as well as police activity or law enforcement level. There can be two different interpretations for the crime data as a proxy for police activity. One might suggest that higher crime rate is likely to be associated with greater police force, which in turn makes violating the traffic law more difficult. Another interpretation might suggest that higher crime rate shifts police force away from enforcement of traffic law, and hence makes violations easier. Given that we use the crime rate only as a control variable, we do not discuss these two different effects c We obtained data on the status of other relevant laws – such as speed limits, limits on alcohol drinking while driving, minimum legal drinking age, and tax on fuel – in order to isolate the effect of mandatory seat belt laws from other laws that might have a direct or indirect effect on driving. d We also obtained data on diet, drunk driving, frequency of exercising and smoking habits from the Center for Disease Control in order to use them as proxies for unobserved characteristics of the population. We eventually discarded those variables from our analysis because it reduced the number of observations without adding to the analysis any significant value. e We obtained this variable in order to control for differences in the safety level of cars. f We obtained state-level data on the number of accidents from the NCSA. The number of accidents is based on the counting of reports completed by a police officer at the traffic crash scene. This data includes a panel of 17 states over six years (1989-1994), and it is briefly discussed in Section V.
Descriptive Statistics for the Continuous Variable
Variable Mean Std. Dev. Min Max Within
Std. Dev. Number of
Observations4
% Blacks 10.79% 12.05% 0.25% 68.86% 0.43% 765 % Hispanics 5.44% 7.45% 0.47% 39.92% 0.85% 765 Mean Age 35.14 1.70 28.23 39.17 0.68 765
Median Income 17,992 4,811 8,372 35,863 3,852 765
Traffic Density Rural 0.33 0.22 NA3 1.11 0.05 765
Traffic Density Urban 1.52 0.52 0.62 3.74 0.15 765
VMT Rural 16,566 12,588 NA3 64,939 2,252 765
VMT Urban 24,882 33,246 980 230,541 6,108 765
Unemployment rate 6.25 2.05 2.23 18.02 1.53 765
Violent Crimes1 0.30 0.65 0.02 5.06 0.14 765
Property Crimes1 3.00 5.71 0.13 42.78 0.53 765
Fuel Tax 16.24 4.96 5.00 39.00 3.60 765
Seat belt Usage rate 52.89% 17.02% 6.00% 87.00% 13.43% 556
CDC usage 71.04% 15.50% 27.78% 95.24% 11.62% 485
Occupant Fatalities 707.85 695.80 24.00 4,398.00 101.38 765
Non-Occupant Fatalities 139.12 188.96 3.00 1,220.00 26.20 765
Occupant Fatalities per VMT2 18.34 5.53 6.34 37.52 3.41 765
Non-Occupant Fatalities per VMT2 3.15 1.63 0.46 10.27 0.94 765
1 Number of crimes per 1,000 people. 2 Fatalities per 1,000 Vehicle Miles Traveled. 3 There are no rural areas in the District of Columbia. 4 All variables have 765 observations, which stand for 15 years (1983 – 1997) in the 51 states. The seat belt usage data is the only exception, and is not fully covered for the early years (see Section IV).
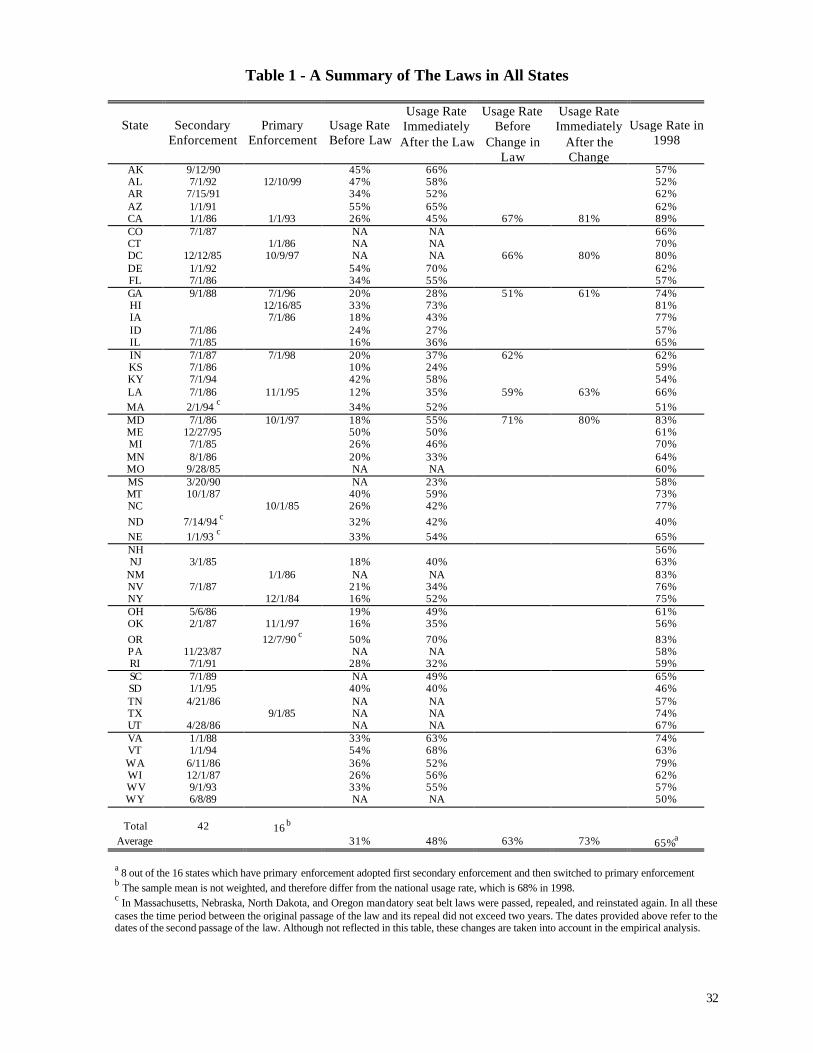
32
Table 1 - A Summary of The Laws in All States
State
Secondary Enforcement
Primary Enforcement
Usage Rate Before Law
Usage Rate Immediately After the Law
Usage Rate Before
Change in Law
Usage Rate Immediately
After the Change
Usage Rate in 1998
AK 9/12/90 45% 66% 57% AL 7/1/92 12/10/99 47% 58% 52% AR 7/15/91 34% 52% 62% AZ 1/1/91 55% 65% 62% CA 1/1/86 1/1/93 26% 45% 67% 81% 89% CO 7/1/87 NA NA 66% CT 1/1/86 NA NA 70% DC 12/12/85 10/9/97 NA NA 66% 80% 80% DE 1/1/92 54% 70% 62% FL 7/1/86 34% 55% 57% GA 9/1/88 7/1/96 20% 28% 51% 61% 74% HI 12/16/85 33% 73% 81% IA 7/1/86 18% 43% 77% ID 7/1/86 24% 27% 57% IL 7/1/85 16% 36% 65% IN 7/1/87 7/1/98 20% 37% 62% 62% KS 7/1/86 10% 24% 59% KY 7/1/94 42% 58% 54% LA 7/1/86 11/1/95 12% 35% 59% 63% 66% MA 2/1/94 c 34% 52% 51% MD 7/1/86 10/1/97 18% 55% 71% 80% 83% ME 12/27/95 50% 50% 61% MI 7/1/85 26% 46% 70% MN 8/1/86 20% 33% 64% MO 9/28/85 NA NA 60% MS 3/20/90 NA 23% 58% MT 10/1/87 40% 59% 73% NC 10/1/85 26% 42% 77% ND 7/14/94 c 32% 42% 40% NE 1/1/93 c 33% 54% 65% NH 56% NJ 3/1/85 18% 40% 63%
NM 1/1/86 NA NA 83% NV 7/1/87 21% 34% 76% NY 12/1/84 16% 52% 75% OH 5/6/86 19% 49% 61% OK 2/1/87 11/1/97 16% 35% 56% OR 12/7/90 c 50% 70% 83% PA 11/23/87 NA NA 58% RI 7/1/91 28% 32% 59% SC 7/1/89 NA 49% 65% SD 1/1/95 40% 40% 46% TN 4/21/86 NA NA 57% TX 9/1/85 NA NA 74% UT 4/28/86 NA NA 67% VA 1/1/88 33% 63% 74% VT 1/1/94 54% 68% 63% WA 6/11/86 36% 52% 79% WI 12/1/87 26% 56% 62% WV 9/1/93 33% 55% 57% WY 6/8/89 NA NA 50%
Total 42 16 b
Average 31% 48% 63% 73% 65%a a 8 out of the 16 states which have primary enforcement adopted first secondary enforcement and then switched to primary enforcement b The sample mean is not weighted, and therefore differ from the national usage rate, which is 68% in 1998. c In Massachusetts, Nebraska, North Dakota, and Oregon mandatory seat belt laws were passed, repealed, and reinstated again. In all these cases the time period between the original passage of the law and its repeal did not exceed two years. The dates provided above refer to the dates of the second passage of the law. Although not reflected in this table, these changes are taken into account in the empirical analysis.
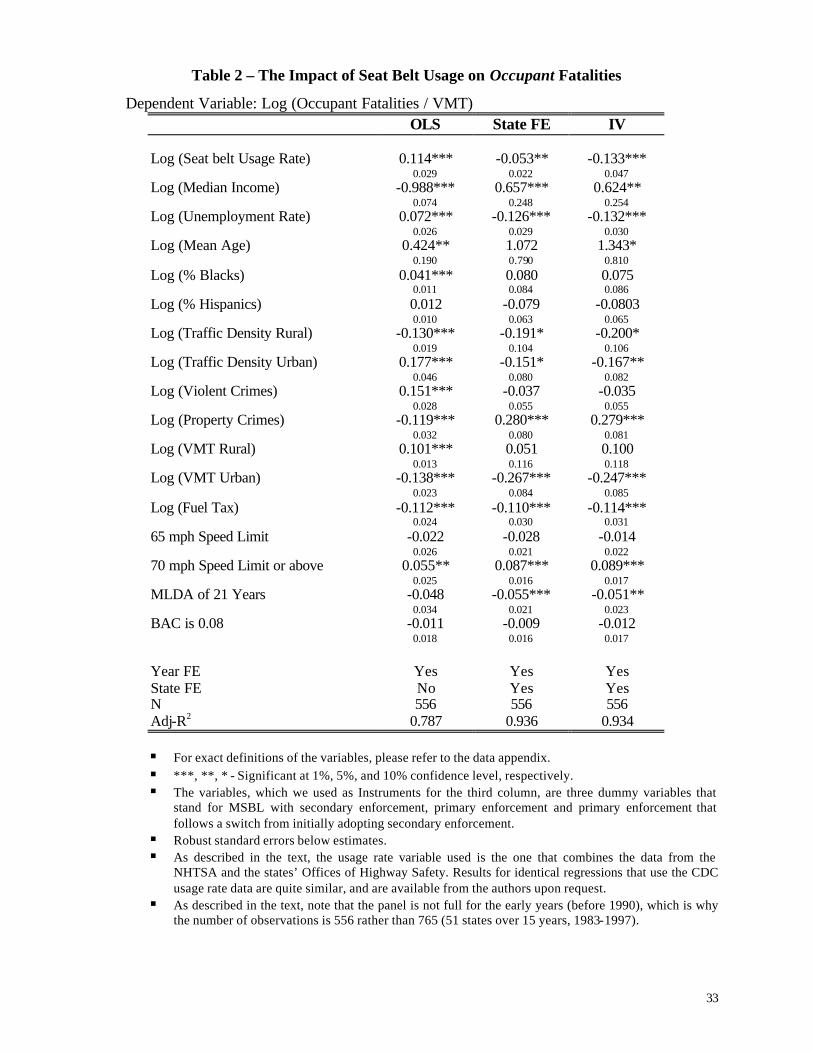
33
Table 2 – The Impact of Seat Belt Usage on Occupant Fatalities
Dependent Variable: Log (Occupant Fatalities / VMT) OLS State FE IV Log (Seat belt Usage Rate) 0.114*** -0.053** -0.133*** 0.029 0.022 0.047 Log (Median Income) -0.988*** 0.657*** 0.624** 0.074 0.248 0.254 Log (Unemployment Rate) 0.072*** -0.126*** -0.132***
0.026 0.029 0.030 Log (Mean Age) 0.424** 1.072 1.343* 0.190 0.790 0.810 Log (% Blacks) 0.041*** 0.080 0.075 0.011 0.084 0.086 Log (% Hispanics) 0.012 -0.079 -0.0803 0.010 0.063 0.065 Log (Traffic Density Rural) -0.130*** -0.191* -0.200* 0.019 0.104 0.106 Log (Traffic Density Urban) 0.177*** -0.151* -0.167** 0.046 0.080 0.082 Log (Violent Crimes) 0.151*** -0.037 -0.035 0.028 0.055 0.055 Log (Property Crimes) -0.119*** 0.280*** 0.279***
0.032 0.080 0.081 Log (VMT Rural) 0.101*** 0.051 0.100
0.013 0.116 0.118 Log (VMT Urban) -0.138*** -0.267*** -0.247***
0.023 0.084 0.085 Log (Fuel Tax) -0.112*** -0.110*** -0.114*** 0.024 0.030 0.031 65 mph Speed Limit -0.022 -0.028 -0.014
0.026 0.021 0.022 70 mph Speed Limit or above 0.055** 0.087*** 0.089***
0.025 0.016 0.017 MLDA of 21 Years -0.048 -0.055*** -0.051**
0.034 0.021 0.023 BAC is 0.08 -0.011 -0.009 -0.012
0.018 0.016 0.017
Year FE Yes Yes Yes State FE No Yes Yes N 556 556 556 Adj-R2 0.787 0.936 0.934
§ For exact definitions of the variables, please refer to the data appendix. § ***, **, * - Significant at 1%, 5%, and 10% confidence level, respectively. § The variables, which we used as Instruments for the third column, are three dummy variables that
stand for MSBL with secondary enforcement, primary enforcement and primary enforcement that follows a switch from initially adopting secondary enforcement.
§ Robust standard errors below estimates. § As described in the text, the usage rate variable used is the one that combines the data from the
NHTSA and the states’ Offices of Highway Safety. Results for identical regressions that use the CDC usage rate data are quite similar, and are available from the authors upon request.
§ As described in the text, note that the panel is not full for the early years (before 1990), which is why the number of observations is 556 rather than 765 (51 states over 15 years, 1983-1997).
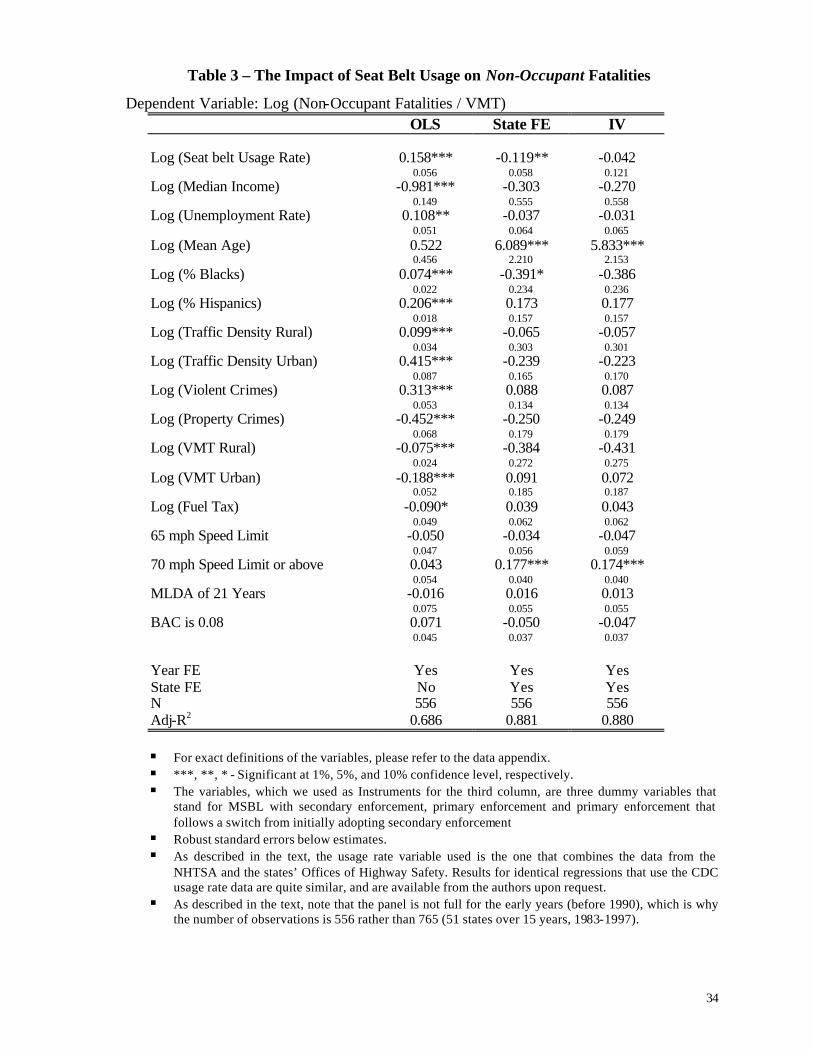
34
Table 3 – The Impact of Seat Belt Usage on Non-Occupant Fatalities
Dependent Variable: Log (Non-Occupant Fatalities / VMT) OLS State FE IV Log (Seat belt Usage Rate) 0.158*** -0.119** -0.042 0.056 0.058 0.121 Log (Median Income) -0.981*** -0.303 -0.270 0.149 0.555 0.558 Log (Unemployment Rate) 0.108** -0.037 -0.031
0.051 0.064 0.065 Log (Mean Age) 0.522 6.089*** 5.833*** 0.456 2.210 2.153 Log (% Blacks) 0.074*** -0.391* -0.386 0.022 0.234 0.236 Log (% Hispanics) 0.206*** 0.173 0.177 0.018 0.157 0.157 Log (Traffic Density Rural) 0.099*** -0.065 -0.057 0.034 0.303 0.301 Log (Traffic Density Urban) 0.415*** -0.239 -0.223 0.087 0.165 0.170 Log (Violent Crimes) 0.313*** 0.088 0.087 0.053 0.134 0.134 Log (Property Crimes) -0.452*** -0.250 -0.249
0.068 0.179 0.179 Log (VMT Rural) -0.075*** -0.384 -0.431
0.024 0.272 0.275 Log (VMT Urban) -0.188*** 0.091 0.072
0.052 0.185 0.187 Log (Fuel Tax) -0.090* 0.039 0.043 0.049 0.062 0.062 65 mph Speed Limit -0.050 -0.034 -0.047
0.047 0.056 0.059 70 mph Speed Limit or above 0.043 0.177*** 0.174***
0.054 0.040 0.040 MLDA of 21 Years -0.016 0.016 0.013
0.075 0.055 0.055 BAC is 0.08 0.071 -0.050 -0.047
0.045 0.037 0.037
Year FE Yes Yes Yes State FE No Yes Yes N 556 556 556 Adj-R2 0.686 0.881 0.880
§ For exact definitions of the variables, please refer to the data appendix. § ***, **, * - Significant at 1%, 5%, and 10% confidence level, respectively. § The variables, which we used as Instruments for the third column, are three dummy variables that
stand for MSBL with secondary enforcement, primary enforcement and primary enforcement that follows a switch from initially adopting secondary enforcement
§ Robust standard errors below estimates. § As described in the text, the usage rate variable used is the one that combines the data from the
NHTSA and the states’ Offices of Highway Safety. Results for identical regressions that use the CDC usage rate data are quite similar, and are available from the authors upon request.
§ As described in the text, note that the panel is not full for the early years (before 1990), which is why the number of observations is 556 rather than 765 (51 states over 15 years, 1983-1997).
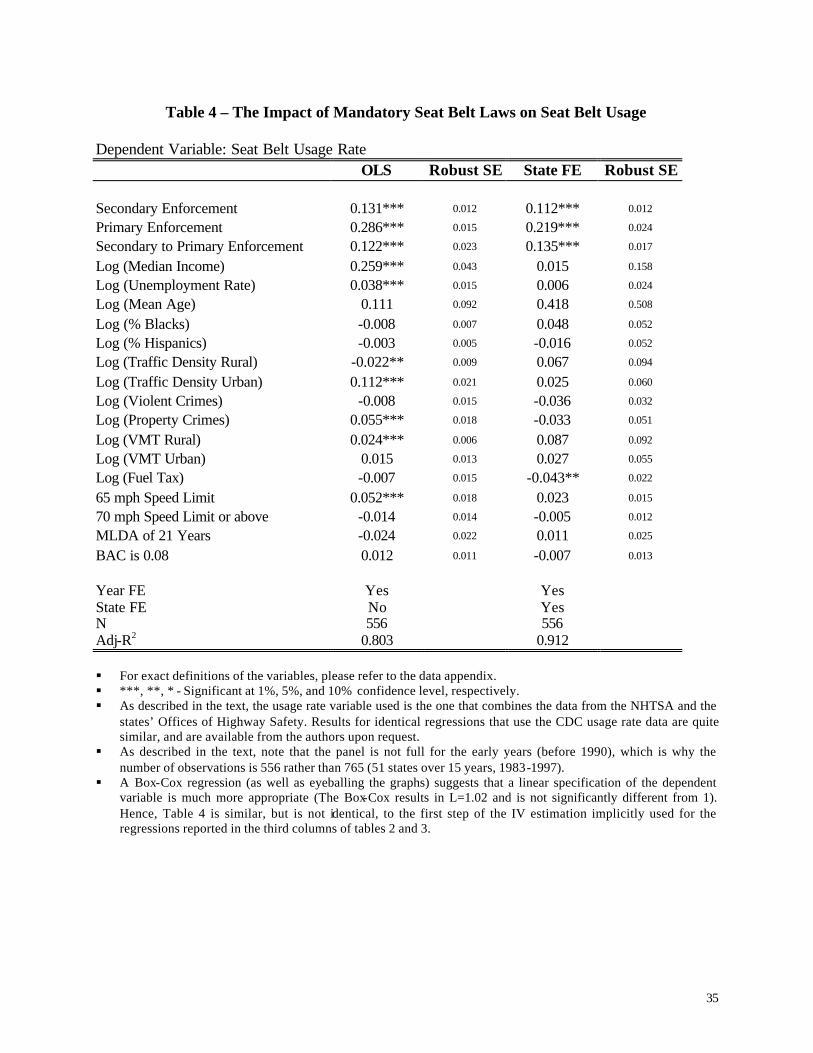
35
Table 4 – The Impact of Mandatory Seat Belt Laws on Seat Belt Usage Dependent Variable: Seat Belt Usage Rate
OLS Robust SE State FE Robust SE
Secondary Enforcement 0.131*** 0.012 0.112*** 0.012
Primary Enforcement 0.286*** 0.015 0.219*** 0.024
Secondary to Primary Enforcement 0.122*** 0.023 0.135*** 0.017
Log (Median Income) 0.259*** 0.043 0.015 0.158
Log (Unemployment Rate) 0.038*** 0.015 0.006 0.024
Log (Mean Age) 0.111 0.092 0.418 0.508
Log (% Blacks) -0.008 0.007 0.048 0.052
Log (% Hispanics) -0.003 0.005 -0.016 0.052
Log (Traffic Density Rural) -0.022** 0.009 0.067 0.094
Log (Traffic Density Urban) 0.112*** 0.021 0.025 0.060
Log (Violent Crimes) -0.008 0.015 -0.036 0.032
Log (Property Crimes) 0.055*** 0.018 -0.033 0.051
Log (VMT Rural) 0.024*** 0.006 0.087 0.092
Log (VMT Urban) 0.015 0.013 0.027 0.055
Log (Fuel Tax) -0.007 0.015 -0.043** 0.022
65 mph Speed Limit 0.052*** 0.018 0.023 0.015
70 mph Speed Limit or above -0.014 0.014 -0.005 0.012
MLDA of 21 Years -0.024 0.022 0.011 0.025
BAC is 0.08 0.012 0.011 -0.007 0.013
Year FE Yes Yes
State FE No Yes
N 556 556
Adj-R2 0.803 0.912
§ For exact definitions of the variables, please refer to the data appendix. § ***, **, * - Significant at 1%, 5%, and 10% confidence level, respectively. § As described in the text, the usage rate variable used is the one that combines the data from the NHTSA and the
states’ Offices of Highway Safety. Results for identical regressions that use the CDC usage rate data are quite similar, and are available from the authors upon request.
§ As described in the text, note that the panel is not full for the early years (before 1990), which is why the number of observations is 556 rather than 765 (51 states over 15 years, 1983-1997).
§ A Box-Cox regression (as well as eyeballing the graphs) suggests that a linear specification of the dependent variable is much more appropriate (The Box-Cox results in L=1.02 and is not significantly different from 1). Hence, Table 4 is similar, but is not identical, to the first step of the IV estimation implicitly used for the regressions reported in the third columns of tables 2 and 3.
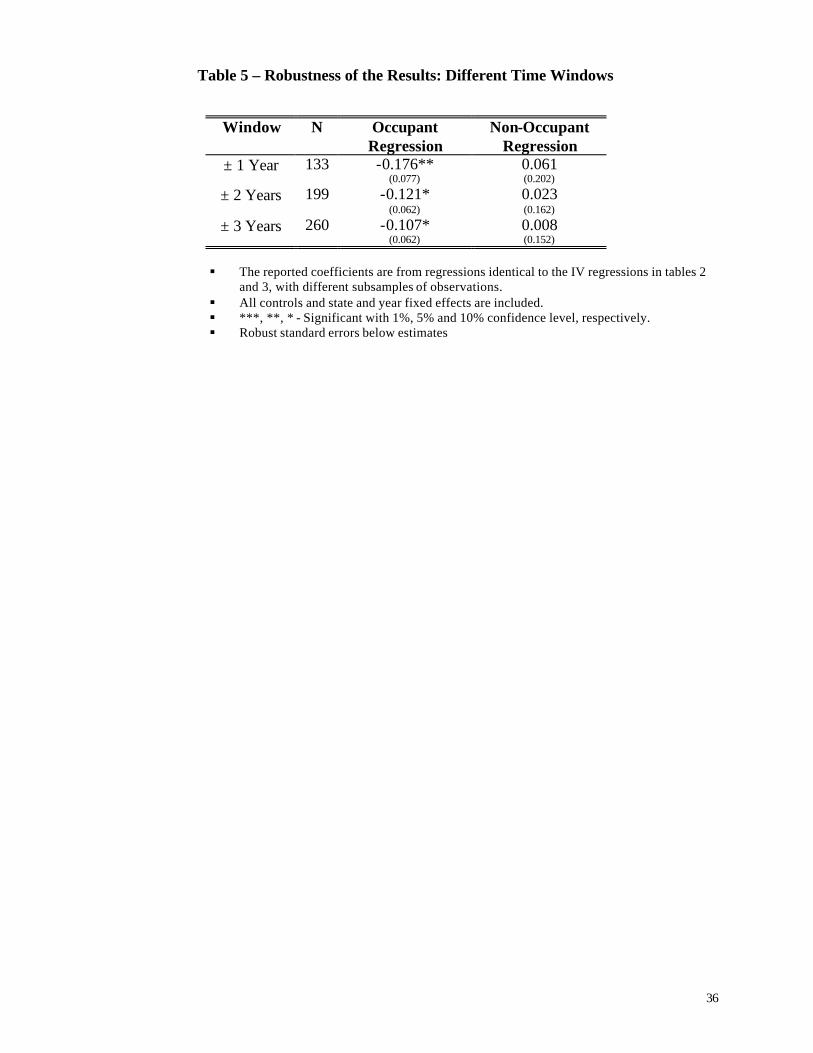
36
Table 5 – Robustness of the Results: Different Time Windows
Window N Occupant Regression
Non-Occupant Regression
± 1 Year 133 -0.176** (0.077)
0.061 (0.202)
± 2 Years 199 -0.121* (0.062)
0.023 (0.162)
± 3 Years 260 -0.107* (0.062)
0.008 (0.152)
§ The reported coefficients are from regressions identical to the IV regressions in tables 2
and 3, with different subsamples of observations. § All controls and state and year fixed effects are included. § ***, **, * - Significant with 1%, 5% and 10% confidence level, respectively. § Robust standard errors below estimates
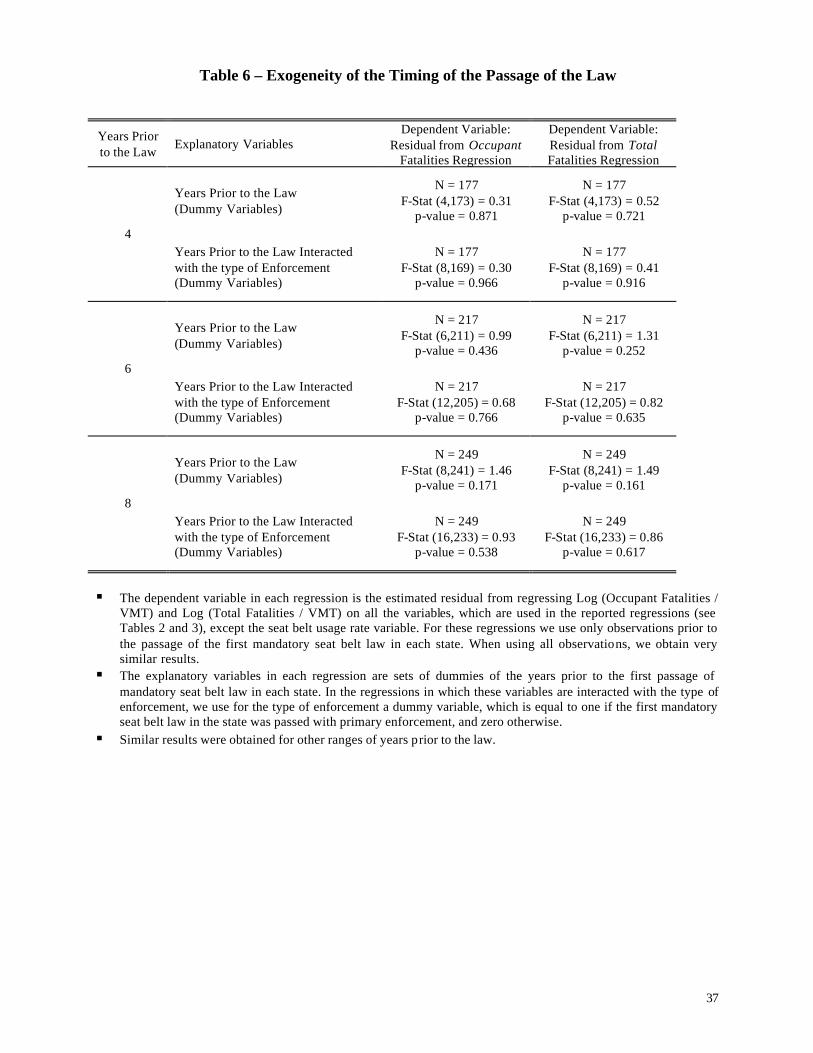
37
Table 6 – Exogeneity of the Timing of the Passage of the Law
Years Prior to the Law
Explanatory Variables Dependent Variable:
Residual from Occupant Fatalities Regression
Dependent Variable: Residual from Total Fatalities Regression
Years Prior to the Law (Dummy Variables)
N = 177 F-Stat (4,173) = 0.31
p-value = 0.871
N = 177 F-Stat (4,173) = 0.52
p-value = 0.721 4
Years Prior to the Law Interacted with the type of Enforcement (Dummy Variables)
N = 177 F-Stat (8,169) = 0.30
p-value = 0.966
N = 177 F-Stat (8,169) = 0.41
p-value = 0.916
Years Prior to the Law (Dummy Variables)
N = 217 F-Stat (6,211) = 0.99
p-value = 0.436
N = 217 F-Stat (6,211) = 1.31
p-value = 0.252 6
Years Prior to the Law Interacted with the type of Enforcement (Dummy Variables)
N = 217 F-Stat (12,205) = 0.68
p-value = 0.766
N = 217 F-Stat (12,205) = 0.82
p-value = 0.635
Years Prior to the Law (Dummy Variables)
N = 249 F-Stat (8,241) = 1.46
p-value = 0.171
N = 249 F-Stat (8,241) = 1.49
p-value = 0.161 8
Years Prior to the Law Interacted with the type of Enforcement (Dummy Variables)
N = 249 F-Stat (16,233) = 0.93
p-value = 0.538
N = 249 F-Stat (16,233) = 0.86
p-value = 0.617
§ The dependent variable in each regression is the estimated residual from regressing Log (Occupant Fatalities /
VMT) and Log (Total Fatalities / VMT) on all the variables, which are used in the reported regressions (see Tables 2 and 3), except the seat belt usage rate variable. For these regressions we use only observations prior to the passage of the first mandatory seat belt law in each state. When using all observations, we obtain very similar results.
§ The explanatory variables in each regression are sets of dummies of the years prior to the first passage of mandatory seat belt law in each state. In the regressions in which these variables are interacted with the type of enforcement, we use for the type of enforcement a dummy variable, which is equal to one if the first mandatory seat belt law in the state was passed with primary enforcement, and zero otherwise.
§ Similar results were obtained for other ranges of years prior to the law.
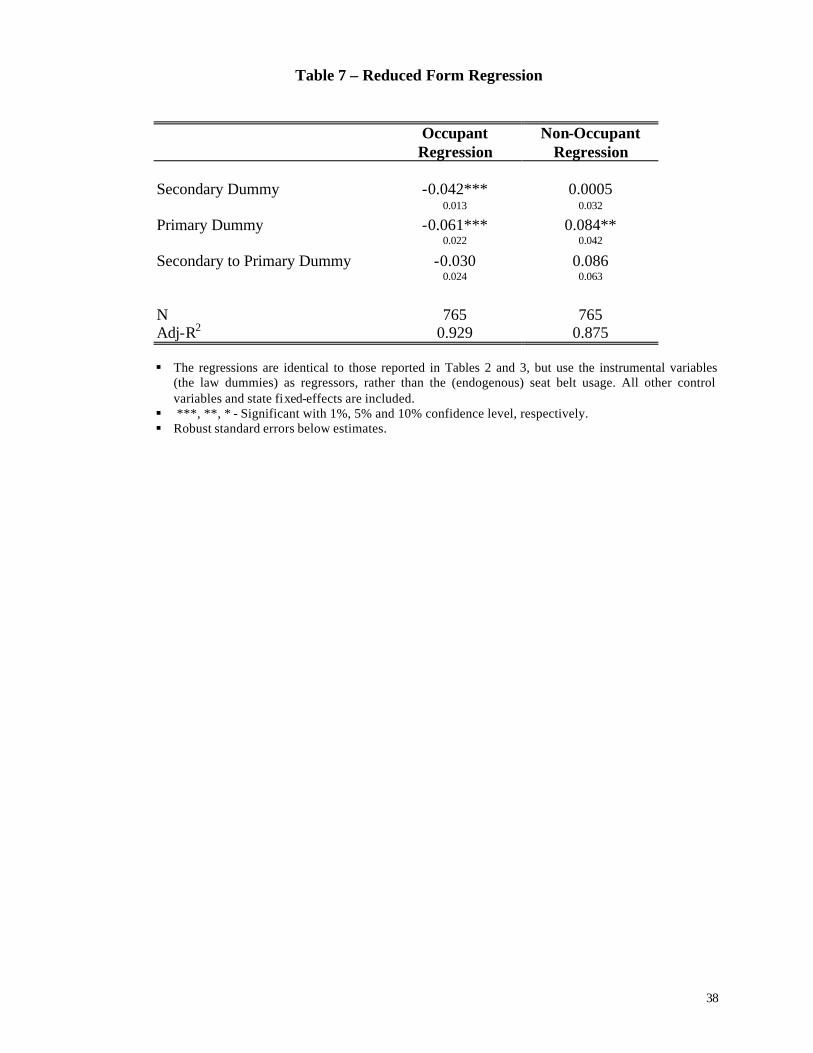
38
Table 7 – Reduced Form Regression
Occupant Regression
Non-Occupant Regression
Secondary Dummy -0.042*** 0.0005 0.013 0.032
Primary Dummy -0.061*** 0.084** 0.022 0.042
Secondary to Primary Dummy -0.030 0.086 0.024 0.063
N 765 765 Adj-R2 0.929 0.875
§ The regressions are identical to those reported in Tables 2 and 3, but use the instrumental variables
(the law dummies) as regressors, rather than the (endogenous) seat belt usage. All other control variables and state fixed-effects are included.
§ ***, **, * - Significant with 1%, 5% and 10% confidence level, respectively. § Robust standard errors below estimates.
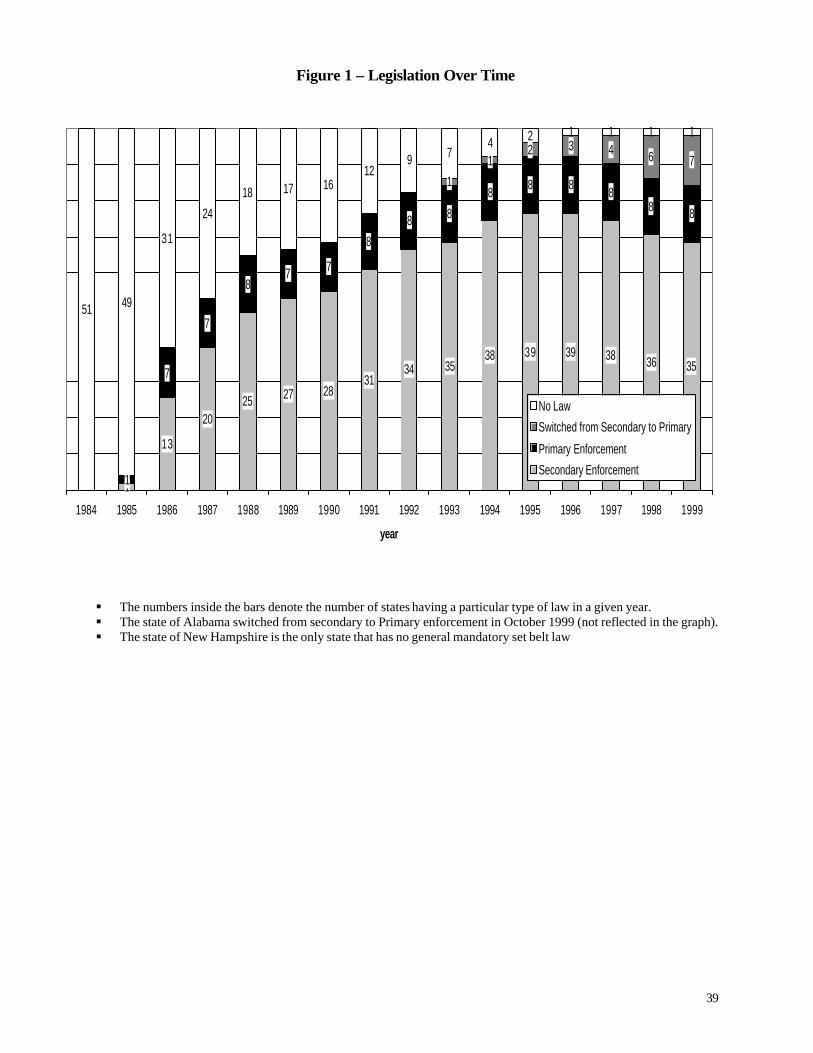
39
Figure 1 – Legislation Over Time
§ The numbers inside the bars denote the number of states having a particular type of law in a given year. § The state of Alabama switched from secondary to Primary enforcement in October 1999 (not reflected in the graph). § The state of New Hampshire is the only state that has no general mandatory set belt law
1
13
2025 27 28
3134 35
38 39 39 38 36 35
1
7
7
87 7
8
8 8
8 8 8 88 8
1
12 3 4 6 7
51 49
31
24
18 17 1612
9 74 2 1 1 1 1
1984 1985 1986 1987 1988 1989 1990 1991 1992 1993 1994 1995 1996 1997 1998 1999
year
No Law
Switched from Secondary to Primary
Primary Enforcement
Secondary Enforcement
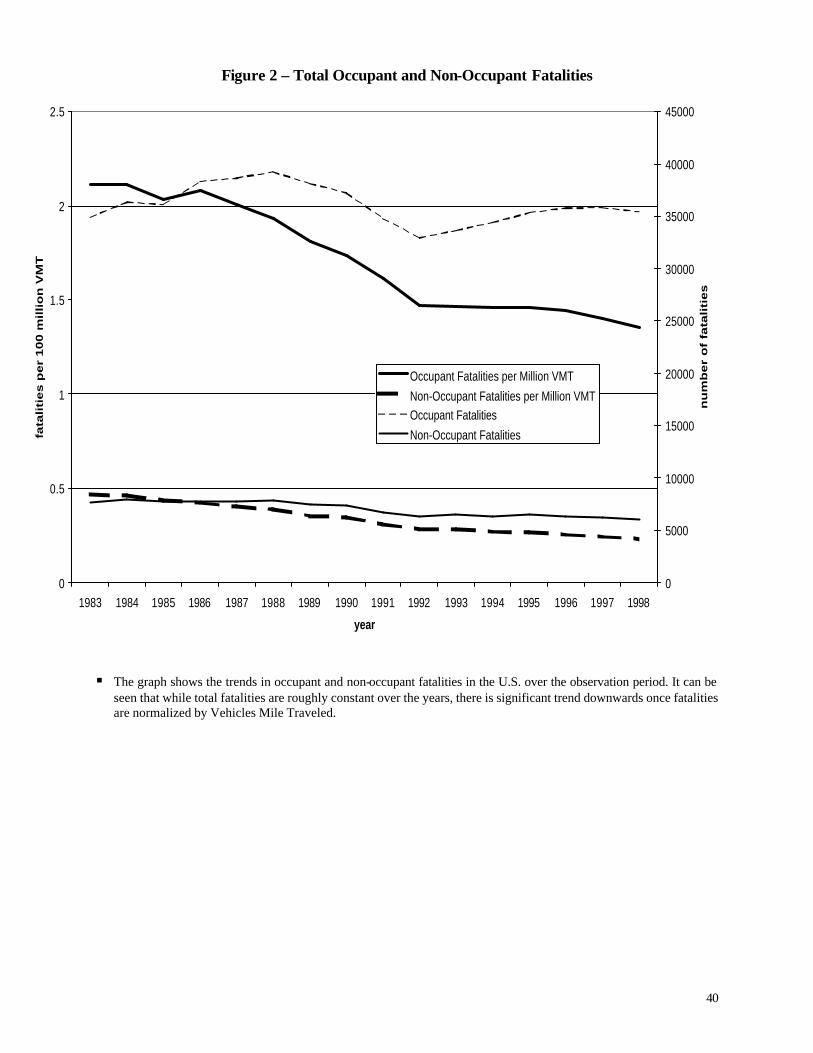
40
Figure 2 – Total Occupant and Non-Occupant Fatalities
§ The graph shows the trends in occupant and non-occupant fatalities in the U.S. over the observation period. It can be seen that while total fatalities are roughly constant over the years, there is significant trend downwards once fatalities are normalized by Vehicles Mile Traveled.
0
0.5
1
1.5
2
2.5
1983 1984 1985 1986 1987 1988 1989 1990 1991 1992 1993 1994 1995 1996 1997 1998
year
fata
liti
es
pe
r 1
00
mil
lio
n V
MT
0
5000
10000
15000
20000
25000
30000
35000
40000
45000
nu
mb
er
of
fata
liti
es
Occupant Fatalities per Million VMTNon-Occupant Fatalities per Million VMTOccupant FatalitiesNon-Occupant Fatalities

41
Figure 3 – Average Seat Belt Usage Rate Over Time
§ The solid line represents the average (equal weights) of seat belt usage, as reported by the observational surveys. This variable is the one used in our reported regressions.
§ The dashed line is the average of seat belt usage, as implied by the BRFSS survey of the CDC. Note that the averages for 1994 and 1996 are based only on 10 states, as explained in the text (Section IV).
0
0.1
0.2
0.3
0.4
0.5
0.6
0.7
0.8
0.9
1982 1983 1984 1985 1986 1987 1988 1989 1990 1991 1992 1993 1994 1995 1996 1997 1998
year
usa
ge
rate
National Usage Rate
National Usage Rate from BRFSS (CDC)
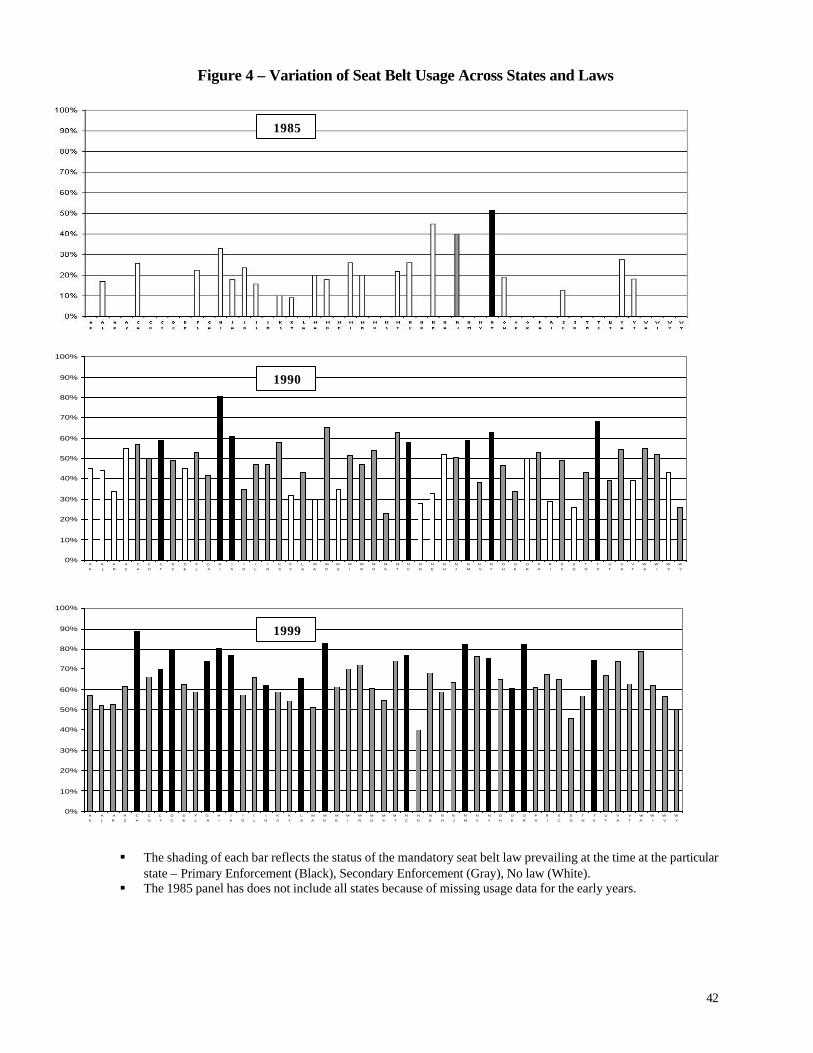
42
Figure 4 – Variation of Seat Belt Usage Across States and Laws
§ The shading of each bar reflects the status of the mandatory seat belt law prevailing at the time at the particular
state – Primary Enforcement (Black), Secondary Enforcement (Gray), No law (White). § The 1985 panel has does not include all states because of missing usage data for the early years.
0%
10%
20%
30%
40%
50%
60%
70%
80%
90%
100%
A
K
A
L
A
R
A
Z
C
A
C
O
C
T
D
C
D
E
F
L
G
A
H
I
I
A
I
D
I
L
I
N
K
S
K
Y
L
A
M
A
M
D
M
E
M
I
M
N
M
O
M
S
M
T
N
C
N
D
N
E
N
H
N
J
N
M
N
V
N
Y
O
H
O
K
O
R
P
A
R
I
S
C
S
D
T
N
T
X
U
T
V
A
V
T
W
A
W
I
W
V
W
Y
0%
10%
20%
30%
40%
50%
60%
70%
80%
90%
100%
A
K
A
L
A
R
A
Z
C
A
C
O
C
T
D
C
D
E
F
L
G
A
H
I
I
A
I
D
I
L
I
N
K
S
K
Y
L
A
M
A
M
D
M
E
M
I
M
N
M
O
M
S
M
T
N
C
N
D
N
E
N
H
N
J
N
M
N
V
N
Y
O
H
O
K
O
R
P
A
R
I
S
C
S
D
T
N
T
X
U
T
V
A
V
T
W
A
W
I
W
V
W
Y
1999
1985
1990

43
Figure 5 – Example of State-Specific Trends of Seat Belt Usage
§ S – Passage of a Secondary enforcement law § P – Passage of a Primary enforcement law § SP – Switch from a Secondary to a Primary enforcement law
Seat Belt Usage Rate in Ohio
00.10.20.30.40.5
0.60.70.80.9
1
year
usag
e
Seat Belt Usage Rate in Oregon
00.10.20.30.40.50.60.70.80.9
1
year
usag
e
Seat Belt Usage Rate in California
00.10.20.30.40.50.60.70.80.9
1
year
usag
e
S
SP
S
P