Embed Size (px)
Citation preview
ISSN 1045-6333
AVOIDING SUBOPTIMAL BEHAVIORIN INTELLECTUAL ASSET TRANSACTIONS:
ECONOMIC AND ORGANIZATIONALPERSPECTIVES ON THE SALE OF KNOWLEDGE
Gavin Clarkson
Discussion Paper No. 330
6/2001
Harvard Law SchoolCambridge, MA 02138
The Center for Law, Economics, and Business is supported bya grant from the John M. Olin Foundation.
This paper can be downloaded without charge from:
The Harvard John M. Olin Discussion Paper Series:http://www.law.harvard.edu/programs/olin_center/
*Olin Fellow in Law, Economics, and Business and KPMG Fellow at the Harvard Business School. The authorwould like to thank Professors Lynda Applegate, Lee Fleming, Joni Hersch, Howell Jackson, Josh Lerner, Jay Lorsch,and Kathleen Valley for their thoughtful comments on various portions of this manuscript during its development. TomArnold, Bryan Benoit, Karen Copenhaver, and Bob Curfiss also provided invaluable feedback and perspectives asexperienced practitioners in the intellectual asset marketplace.
JEL Class: D23, D45, G12, K11, L65
AVOIDING SUBOPTIMAL BEHAVIOR IN INTELLECTUAL ASSET TRANSACTONS:ECONOMIC AND ORGANIZATIONAL PERSPECTIVES ON THE SALE OF
KNOWLEDGE
Gavin Clarkson*
ABSTRACT
Although some of the most important elements of a knowledge-based economy in thecoming century will be intellectual asset transactions, the current marketplace for intellectualasset transactions is murky at best. With patent litigation costs skyrocketing, mostorganizations have only recently begun licensing and cross-licensing their intellectual assetportfolios. Because robust valuation metrics for intellectual assets have not been fullydeveloped, most licensing negotiations are based on rules of thumb rather than quantitativemethods, rules of thumb that can often be economically disadvantageous to either thelicensee or the licensor. With only two percent of the millions of innovations created in thiscountry utilized under license, billions of dollars worth of intellectual assets areunderutilized.
Economic theory might suggest that the information necessary for quantitative analysis istoo costly to acquire (i.e. difficult to obtain or not available at all), resulting in a relativelysmall number of market transactions involving intellectual assets, with valuations generallycovered by rules of thumb. Different organizational behavior theories would probablysuggest that some forms of bounded rationality are responsible for the use of these rules ofthumb. The true answer probably lies somewhere in the middle of the spectrum betweenthose perspectives.
This article explores the nature of intellectual assets and the dynamics of intellectualasset transactions. After examining various organizational behavior and economicperspectives in search of an explanation for the current state of the marketplace forintellectual asset transactions, the article concludes by proposing valuation metrics that mightbetter inform the negotiations surrounding an intellectual asset transaction.
© 2001 Gavin Clarkson. All rights reserved.
* Olin Fellow in Law, Economics, and Business and KPMG Fellow at the HarvardBusiness School.
AVOIDING SUBOPTIMAL BEHAVIORIN INTELLECTUAL ASSET TRANSACTONS:
ECONOMIC AND ORGANIZATIONALPERSPECTIVES ON THE SALE OF KNOWLEDGE
Gavin Clarkson*
TABLE OF CONTENTS
I. INTRODUCTION . . . . . . . . . . . . . . . . . . . . . . . . . . . . . . . . . . . . . . 2
II. BACKGROUND . . . . . . . . . . . . . . . . . . . . . . . . . . . . . . . . . . . . . . . 4A. The Nature of Intellectual Assets . . . . . . . . . . . . . . . . . . . . . 5B. The Nature of Intellectual Asset Transactions . . . . . . . . . . . 7
III. POSSIBLE EXPLANATIONS . . . . . . . . . . . . . . . . . . . . . . . . . . . . . 11A. Economic Perspective . . . . . . . . . . . . . . . . . . . . . . . . . . . . 11B. Organizational Behavior Perspective . . . . . . . . . . . . . . . . 16
IV. POSSIBLE IMPROVEMENTS . . . . . . . . . . . . . . . . . . . . . . . . . . . . . 19A. Theoretical Basis . . . . . . . . . . . . . . . . . . . . . . . . . . . . . . . . 19B. Proposed Methodology . . . . . . . . . . . . . . . . . . . . . . . . . . . . 22
1. Contribution to Profit of IntangibleAssets (CPIA) . . . . . . . . . . . . . . . . . . . . . . . . . . . . . . . 23
2. Contribution to Profit of IntellectualAssets (CPIPIA) . . . . . . . . . . . . . . . . . . . . . . . . . . . . . . 25
C. Empirical Analysis and Validation of Metrics . . . . . . . . . . 25D. Application of the CPIPIA Metric . . . . . . . . . . . . . . . . . . . 27
V. CONCLUSION . . . . . . . . . . . . . . . . . . . . . . . . . . . . . . . . . . . . . . . 28
VI. APPENDIX . . . . . . . . . . . . . . . . . . . . . . . . . . . . . . . . . . . . . . . . . 30
© 2001 Gavin Clarkson. All rights reserved.
Intellectual Asset Transactions2
* Olin Fellow in Law, Economics, and Business and KPMG Fellow at the HarvardBusiness School.
1. See Katherine Bouton, Academic Research and Big Business: A DelicateBalance, N.Y. TIMES, Sept. 11, 1983, § 6 (Magazine), at 62, 123.
2. Several of these rules of thumb are discussed in detail in Part II.B, infra.3. Cf. John Milward, A Five-Year Journey to a Better Mousetrap, N.Y. TIMES, May
24, 1998, § 3, at 8 (“[O]nly 2 percent of all patents are ever licensed to majorcorporations.”).
AVOIDING SUBOPTIMAL BEHAVIORIN INTELLECTUAL ASSET TRANSACTONS:
ECONOMIC AND ORGANIZATIONALPERSPECTIVES ON THE SALE OF KNOWLEDGE
Gavin Clarkson*
© 2001 Gavin Clarkson. All rights reserved.
I. INTRODUCTION
An oft-quoted rule of thumb suggests that of tenlaboratory inventions, only one will receive a patent;only one in ten patents will be licensed by acompany, and only one in ten licenses results inmore than $25,000 per year in income1
Although some of the most important elements of a knowledge-based economy in the coming century will be intellectual assettransactions, the current marketplace for these transactions is murkyat best. While patent litigation costs are skyrocketing, mostorganizations have only recently begun licensing and cross-licensingtheir intellectual asset portfolios. Because robust valuation metricsfor intellectual assets have not been fully developed, most licensingnegotiations are based on rules of thumb rather than quantitativemethods—rules of thumb that are often economicallydisadvantageous to either the licensee or the licensor.2 With only twopercent of the millions of innovations created in this country utilizedunder license,3 billions of dollars worth of intellectual assets areunderutilized. Such a situation leads to the obvious question . . .why?
Intellectual Asset Transactions 3
4. See Nancy T. Gallini, Deterrence by Market Sharing: A Strategic Incentive forLicensing, 74 AM. ECON. REV. 931 (1984); Nancy T. Gallini & Ralph A. Winter,Licensing in the Theory of Innovation, 16 RAND J. ECON. 237 (1985); Morton I. Kamien& Yair Tauman, Fees Versus Royalties and the Private Value of a Patent, 101 Q.J. ECON.471 (1986); Michael L. Katz & Carl Shapiro, How to License Intangible Property, 101Q.J. ECON. 567 (1986); Michael L. Katz & Carl Shapiro, On the Licensing of Innovations,16 RAND J. ECON. 504 (1985).
5. See, e.g., C.T. TAYLOR & Z.A. SILBERSTON, THE ECONOMIC IMPACT OF THE
PATENT SYSTEM: A STUDY OF THE BRITISH EXPERIENCE (1973); Zvi Griliches, PatentStatistics as Economic Indicators: A Survey, 28 J. ECON. LITERATURE 1661 (1990); ZviGriliches, Patents: Recent Trends and Puzzles, 1989 BROOKINGS PAPERS ON ECON.ACTIVITY 291; Zvi Griliches et al., The Value of Patents as Indicators of InventiveActivity, in ECONOMIC POLICY AND TECHNOLOGICAL PERFORMANCE 97 (Partha Dasgupta& Paul Stoneman eds., 1987); F.M. Scherer, Firm Size, Market Structure, Opportunity,and the Output of Patented Inventions, 55 AM. ECON. REV. 1097 (1965); JacobSchmookler, Economic Sources of Inventive Activity, 22 J. ECON. HIST. 1 (1962).
6. See, e.g., Jerry Hausman et al., Econometric Models for Count Data with anApplication to the Patents-R & D Relationship, 52 ECONOMETRICA 909 (1984); JeanOlson Lanjouw et al., How to Count Patents and Value Intellectual Property: The Usesof Patent Renewal and Application Data, 46 J. INDUS. ECON. 405 (1998).
7. See, e.g., John Bound et al., Who Does R & D and Who Patents?, in R & D,PATENTS, AND PRODUCTIVITY 21 (Zvi Griliches ed., 1984); Zvi Griliches, Market Value,R & D, and Patents, in R & D, PATENTS, AND PRODUCTIVITY 249 (Zvi Griliches ed.,1984); Bronwyn H. Hall et al., Patents and R and D: Is There a Lag?, 27 INT’L ECON.REV. 265 (1986); Ariel Pakes & Zvi Griliches, Patents and R & D at the Firm Level: AFirst Look, in R & D, PATENTS, AND PRODUCTIVITY 55 (Zvi Griliches ed., 1984).
8. See, e.g., Zhen Deng et al., Science and Technology as Predictors of StockPerformance, FIN. ANALYSTS J., May-June 1999, at 20; Zvi Griliches et al., R & D, andPatents, and Market Value Revisited: Is There a Second (Technological Opportunity)Factor?, 1 ECON. INNOVATION & NEW TECH. 183 (1991); Bronwyn H. Hall, Innovationand Market Value, in PRODUCTIVITY, INNOVATION AND ECONOMIC PERFORMANCE (Ray
Economic theory suggests that the information necessary forquantitative analysis is too costly to acquire (i.e., difficult to obtain ornot available at all), resulting in a relatively small number of well-valued market transactions involving intellectual assets, with mostvaluations generally covered by rules of thumb. Differentorganizational behavior theories suggest that some form of boundedrationality is responsible for the use of these rules of thumb. The trueanswer probably lies somewhere between these perspectives.
Parties to intangible asset licensing negotiations need a better setof metrics to enable them to reach successful technology licensingagreements. Much of the available economic literature on licensing,while theoretically sound, is neither empirically based nor instructiveon how to develop an industry-based metric for royalty rates.4 Theliterature on patents, R&D expenditures, and market value is alsoinformative but does not provide clear guidance for examination ofactual royalty rate provisions. Significant literature exists regardingeconomic examination of patents,5 patent counts,6 comparisons ofpatents and R&D,7 and evaluating returns from intellectual assets.8
Intellectual Asset Transactions4
Barrell et al. eds., 2000); Richard C. Levin et al., Appropriating the Returns fromIndustrial Research and Development, 1987 BROOKINGSPAPERSONECON.ACTIVITY 783;Ariel Pakes, On Patents, R & D, and the Stock Market Rate of Return, 93 J. POL. ECON.390 (1985); Bronwyn H. Hall et al., Market Value and Patent Citations: A First Look,NBER Working Paper No. 7741 (2000).
9. See TAYLOR & SILBERSTON, supra note 5; Bharat N. Anand & Tarun Khanna,The Structure of Licensing Contracts, 48 J. INDUS. ECON. 103 (2000); Ashish Arora,Patents, Licensing, and Market Structure in the Chemical Industry, 26 RES. POL’Y. 391(1997); Christian Bessy & Eric Brousseau, Technology Licensing Contracts Features andDiversity, 18 INT’L REV. LAW & ECON. 451 (1998); Richard E. Caves et al., The ImperfectMarket for Technology Licenses, 45 OXFORD BULL. ECON. & STAT. 249 (1983); StephenA. Degnan & Corwin Horton, A Survey of Licensed Royalties, LES NOUVELLES, June1997, at 91; Inés Macho-Stadler et al., The Role of Information in Licensing ContractDesign, 25 RES. POL’Y. 43 (1996); M.D. Rostoker, PTC Research Report: A Survey ofCorporate Licensing, 24 IDEA 59 (1983).
10. See TWM Mfg. Co. v. Dura Corp., 789 F.2d 895 (Fed. Cir. 1986); Georgia-Pacific Corp. v. United States Plywood Corp., 318 F. Supp. 1116 (S.D.N.Y. 1970);RUSSELL L. PARR & PATRICK H. SULLIVAN, TECHNOLOGY LICENSING: CORPORATE
STRATEGIES FOR MAXIMIZING VALUE (1996); GORDON V. SMITH & RUSSELL L. PARR,VALUATION OF INTELLECTUAL PROPERTY AND INTANGIBLE ASSETS (3d ed. 2000); LaurenJohnston Stiroh & Richard T. Rapp, Modern Methods for the Valuation of IntellectualProperty, in PROTECTING YOUR INTELLECTUAL PROPERTY ASSETS 171 (PLI Pats.,Copyrights, Trademarks, and Literary Prop. Course, Handbook Series No. 526, 1998);Richard S. Toikka, Patent Licensing Under Competitive and Non-Competitive Conditions,82 J. PAT. & TRADEMARK OFF. SOC'Y 279 (2000).
11. PARR & SULLIVAN, supra note 10; SMITH & PARR, supra note 10.
Yet, other than a small number of empirical studies,9 little or no in-depth examination of royalty rate calculations has been performed.
Several authors, as well as jurists, however, have suggested that agood, industry-specific metric for use in royalty rate negotiationswould be based on the difference between the aggregate earningsrates from companies with intellectual asset portfolios and theaggregate earnings rates from companies without such portfolios.10
Parr & Sullivan and Smith & Parr11 in particular have suggested thatsuch a metric could be derived from the well-established financialmeasure known as the Weighted Average Cost of Capital, but aspecific metric has never been reduced to a workable form.
Part II of this article presents some background on the nature ofintellectual assets and the dynamics of intellectual asset transactions.Part III examines various organizational behavior and economicperspectives in search of possible explanations for the current state ofthe marketplace for intellectual asset transactions. Part IV offerspossible improvements by proposing valuation metrics that mightbetter inform the negotiations surrounding an intellectual assettransaction.
II. BACKGROUND
Intellectual Asset Transactions 5
12. Microsoft’s intellectual property and intangible assets account for almost 95% ofits market value. See GAVIN CLARKSON & LYNDA APPLEGATE, INTELLECTUAL ASSET
VALUATION 2, 15 ( Harv. Bus. School Pub. No. 801-192, 2000).13. LESLEY ELLEN HARRIS, DIGITAL PROPERTY: CURRENCY OF THE 21ST CENTURY
51 (1998).14. Certain countries, including the United States, have created additional areas of
specialized intellectual property protection such as photolithography masks and plantvariety patents. See 17 U.S.C § 901–914 (1994) (photoilthography masks); 7 U.S.C. §2321–2582 (1994) (plant variety protection).
The balance sheet of a successful company occasionally includesan entry for Intangible Assets. Given the microscopic level of studydevoted to other elements of a company’s financial statement, it issurprising to note the scant attention given to intangible assets.Nevertheless, the information economy includes numerous companieswhose value is almost entirely based on intangible assets.12 Moreoften than not, the value of these intangible assets is not reflectedanywhere in a company’s financial statements.
Intellectual assets, a subset of intangible assets, have become oneof the most important commodities in our globally connectedeconomy, accounting for “more than 20 percent of world trade, orapproximately US$740 billion.”13 Despite the importance ofintellectual asset transactions it would seem they are often the leastunderstood of all types of economic transactions, and perhaps themost poorly managed. A closer look at the nature of intellectualassets may provide a better understanding of these transactions.
A. The Nature of Intellectual Assets
Intellectual property (IP) is a primary class of intangible assets.More specifically, it is intangible property that has some form of legalprotection. Intellectual property law identifies five major sources oflegal protection: patents, trademarks, industrial designs, confidentialinformation/trade secrets, and copyright.14 In general, patents protectinventions, such as new medicines or new processes for makingsomething. Trademark law protects words, names, symbols, pictures,logos, designs, or shapes associated with a product (for instance, thewords “Coca-Cola” or “Microsoft”). Industrial designs protect theaesthetic appearance of a product rather than its functional features.Trade secret law protects concepts, ideas, and factual informationkept in confidence, such as customer lists or the idea for a computerprogram. Copyright law, the last major area of protection, deals withprotection of ideas; however, copyright law differs from other formsof intellectual property protection in that it protects the expression ofan idea rather than the idea itself.
Intellectual Asset Transactions6
15. See, e.g., Hausman et al., supra note 6.16. William Taylor, The Business of Innovation: An Interview with Paul Cook, HARV.
BUS. REV., Mar.-Apr. 1990, at 96.17. Because intangible assets and intellectual assets would both have the same
acronym, and since the concept of intellectual assets almost always includes intellectualproperty, IPIA is used to refer collectively to intellectual property and intellectual assets.
18. HIROYUKI ITAMI & THOMAS W. ROEHL, MOBILIZING INVISIBLE ASSETS 12–13(1987).
19. For a discussion of the technologist’s viewpoint, see William J. Abernathy & KimB. Clark, Innovation: Mapping the Winds of Creative Destruction, RESEARCH POLICY,Feb. 1985, at 3 and Rebecca M. Henderson & Kim B. Clark, Architectural Innovation:The Reconfiguration of Existing Product Technologies and the Failure of EstablishedFirms, ADMIN. SCI. Q., Mar. 1990, at 9.
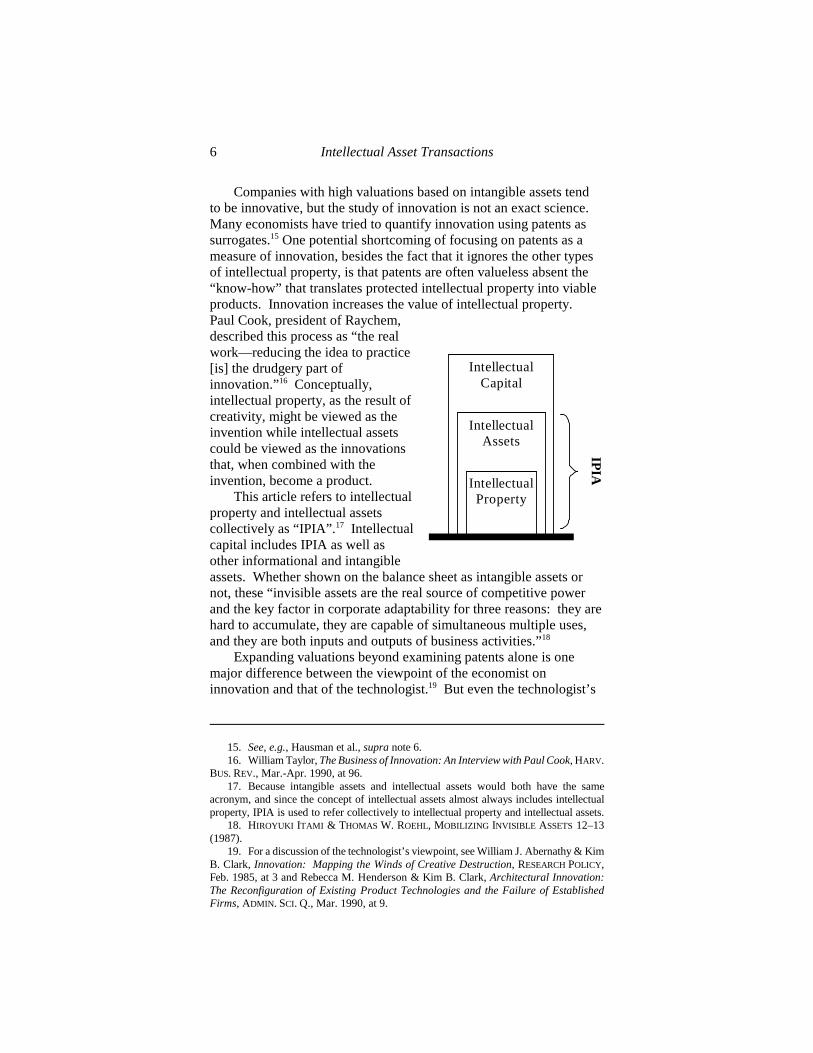
IntellectualCapital
IntellectualAssets
IntellectualProperty
IPIA
Companies with high valuations based on intangible assets tendto be innovative, but the study of innovation is not an exact science.Many economists have tried to quantify innovation using patents assurrogates.15 One potential shortcoming of focusing on patents as ameasure of innovation, besides the fact that it ignores the other typesof intellectual property, is that patents are often valueless absent the“know-how” that translates protected intellectual property into viableproducts. Innovation increases the value of intellectual property.Paul Cook, president of Raychem,described this process as “the realwork—reducing the idea to practice[is] the drudgery part ofinnovation.”16 Conceptually,intellectual property, as the result ofcreativity, might be viewed as theinvention while intellectual assetscould be viewed as the innovationsthat, when combined with theinvention, become a product.
This article refers to intellectualproperty and intellectual assetscollectively as “IPIA”.17 Intellectualcapital includes IPIA as well asother informational and intangibleassets. Whether shown on the balance sheet as intangible assets ornot, these “invisible assets are the real source of competitive powerand the key factor in corporate adaptability for three reasons: they arehard to accumulate, they are capable of simultaneous multiple uses,and they are both inputs and outputs of business activities.”18
Expanding valuations beyond examining patents alone is onemajor difference between the viewpoint of the economist oninnovation and that of the technologist.19 But even the technologist’s
Intellectual Asset Transactions 7
20. Wesley M. Cohen & Richard C. Levin, Empirical Studies of Innovation andMarket Structure, in 2 HANDBOOK OF INDUSTRIAL ORGANIZATION 1059, 1062 (RichardSchmalensee & Robert D. Willig eds., 1989).
21. GARY A. STEINMAN, CONFERENCE BOARD, REP. NO. 1182-97-CH, MANAGING,VALUING, AND PROTECTING INTELLECTUAL ASSETS 7 (1997).
viewpoint is still constrained by the same fundamental problem: “[I]nthe study of innovation and technical change in industry [there are no]satisfactory measures of new knowledge and its contribution totechnological progress. There exists no measure of innovation thatpermits readily interpretable cross-industry comparisons.”20
Companies such as Dow Chemical have encouraged theiremployees to invent as much and generate as many patents aspossible, without necessarily focusing on the strategic value of suchactivities. Dow “produced a lot of knowledge, patents, andintellectual property that did not create value” directly for Dow.21 Butthose same assets might be extremely valuable to other organizations.
The difficulty of measuring and valuing innovation as embodiedin a company’s intellectual assets becomes particularly apparent whena company wants to acquire another company or the rights to exploitits intellectual assets. In the absence of a standardized marketplacefor intellectual assets, a company might not even be aware that it hasan intellectual asset that is valued by another company. Evenorganizations that are aware of their intellectual assets may tend tochoose royalty rates based on a rule of thumb rather than rates basedon quantitative metrics or analyses of profitability. Before examiningquantitative methods that can be employed to calculate royalty rates,it is necessary to explore the nature of intellectual asset transactions.
B. The Nature of Intellectual Asset Transactions
Unlike real estate, a given intellectual asset can be “sold” manytimes and to multiple entities and for use in different placessimultaneously. This range of possibilities gives rise to a multitude ofoptions for transferring rights to an intellectual asset. In general,rights can be either licensed or sold outright. A licensor exacts from alicensee a fee for the right to exploit in a defined way an asset towhich the former retains ownership. In a sale, sometimes referred toas an assignment, the asset is transferred to a new owner. Owing tothe uncertain absolute value of intellectual assets, licensing is farmore common than sale unless the entire company is being sold.
Intellectual asset rights for a technology can be licensedindividually or aggregated and licensed as a bundle. Licensing can beeither exclusive (to only one licensee) or nonexclusive (to potentiallymultiple licensees). The scope of a license can be further limited
Intellectual Asset Transactions8
22. Tom Arnold, Basic Considerations in Licensing, LES NOUVELLES, Sept. 1980.23. See MAX BAZERMAN, JUDGMENT IN MANAGERIAL DECISION MAKING 125 (4th
ed. 1998); MAX H. BAZERMAN & MARGARET A. NEALE, NEGOTIATING RATIONALLY 95(1992); Max H. Bazerman & James J. Gillespie, Betting on the Future: The Virtues ofContingent Contracts, HARV. BUS. REV., Sept.-Oct. 1999, at 155.
24. See INTELLECTUAL PROP. RESEARCH ASSOCS., THE ROYALTY RATE REPORT FOR
PHARMACEUTICALS & BIOTECHNOLOGY (3d ed. 1996); TAYLOR & SILBERSTON, supranote 5; Anand & Khanna, supra note 9; Bessy & Brousseau, supra note 9; Caves et al.,supra note 9. Note that the royalty rates themselves were not analyzed in these studies.
geographically, temporally, or by field of use. Additionally, licenseesmight be permitted to sublicense the rights to a technology andappropriate the benefits derived therefrom. Moreover, “most favorednation” status can guarantee specific licensees as good or better termsand conditions than are granted to other licensees.
Although quite different in many ways, the licensing ofintellectual assets is still somewhat analogous to a real estate lease.The owner retains ownership of the property and assigns certain rightsto another party for a defined period of time and in return receivescompensation, monetary or otherwise. The similarity ends ratherabruptly, however, when the task turns to determining what thecompensation should be, particularly if it is solely monetary. TomArnold, one of the original founders of the Licensing ExecutivesSociety (“LES”), aptly described licensing as follows:
The licensing process is an art practiced innegotiation between two or more parties. Theprocess is frequently difficult since its successrequires that the parties agree on the exploitation ofoften highly valuable intellectual property rights inwhich both have, claim or want an interest. Therange of interests, intellectual property rights, andexploitation arrangements is limitless, making theprocess of negotiating a mutually desirableagreement from the myriad possibilities indeed anart.22
However “artistic” the negotiation of a license, the result is anagreement that affects both parties economically. More common thana lump sum license payment for a technology, particularly anunproven technology, is the negotiation of a royalty rate or contingentlicense fee on future earnings or sales. The negotiation literatureclearly indicates a strong theoretical basis for using contingentcontracts for transactions with high degrees of uncertainty,23 and thefew empirical explorations of technology licensing agreements havefound a high incidence of contingent contracts.24
Intellectual Asset Transactions 9
Even the IPRA study did not examine the use of heuristic licensing rates other than tomention that the 5% of sales regime was found in unrelated industries.
25. Robert Goldscheider, Measuring Damages in U.S. Patent Litigation, 5 J.PROPRIETARY RTS. No. 5, at 2, 6–7 (1993).
26. INTELLECTUAL PROP. RESEARCH ASSOCS., supra note 24, at 17.
If a lump sum arrangement is used, either instead of or in additionto a royalty rate, the amount of the payment is usually based on thepresent value of a stream of royalty payments. The challenge in anyof these transactions is thus to determine what the appropriate royaltyrate should be. The rate should approximate, as nearly as possible,the fair rate of return on the intellectual asset rights that are to betransferred. Historically, intellectual asset licenses have rarely usedsignificant quantitative analysis and have instead relied on commonrules of thumb. Another founder of LES, Robert Goldscheider, haslong been a proponent of one of the more common rules of thumb, the25 percent rule:
The 25 Percent Rule originally occurred to [me] as aresult of a series of successful commercial licenseswith which [I] became involved back in the late1950s. . . . . Having noticed [an] empiricalrelationship whereby there was a 25-75 split in thepre-tax profitability rate in a series of successfullicenses, [I] developed a methodology that hasproven its worth over the years in commercialnegotiations. One starts with a 25 percent split [ofthe pre-tax profits] to the licensor and then either“tunes” this figure up or down, depending on thepeculiar circumstances of each case . . . .25
In an empirical examination of royalty rates for a variety oftechnologies, the Intellectual Property Research Associates foundanother rule of thumb royalty rate:
For unknown reasons, one of the most popularroyalty rates is 5% of sales. . . . . It shows up in a lotof different industries. It is associated withembryonic technology and mature trademarks. It hasbeen found in the food, industrial equipment,electronics, construction and medical deviceindustries. Forget profits, capital investment,earnings growth, operating expenses, investment riskand even development costs. Somehow 5% of salesprevails. Don’t be fooled. It’s not a magic bulletanswer.26
Intellectual Asset Transactions10
27. See SMITH & PARR, supra note 10, at 368; PARR & SULLIVAN, supra note 10, at184.
28. HERMAN MELVILLE, MOBY DICK 330 (Heritage Press 1956) (1851), quoted inGORDON V. SMITH & RUSSELL L. PARR, VALUATION OF INTELLECTUAL PROPERTY AND
INTANGIBLE ASSETS 377(2d ed. 1994)).29. See, e.g., SMITH & PARR, supra note 10; PARR & SULLIVAN, supra note 10; Stiroh
& Rapp, supra note 10; Toikka, supra note 10.30. See Gavin Clarkson & Jasjit Singh, Optimal Structures in Contingent Licensing
Contracts (2001) (unpublished manuscript, on file with author) (developing a theoreticalproof demonstrating that, all else being equal, a percentage of revenue regime is superiorto a percentage of profits regime).
31. Similar problems also exist for the licensee, although they are not the main focusof this article. It is possible for a rule of thumb license to place a licensee in a worseeconomic position than if it had done nothing at all. For a more detailed examination, seeCLARKSON & APPLEGATE, supra note 12. See also SMITH & PARR, supra note 10, at372–78.
32. See Mark Gimein, Palm and Handspring Go Hand to Hand, FORTUNE, Sept. 18,2000, at 319, available at 2000 WL 24218220.
33. See id.
A third rule of thumb is the so-called industry norm that relies onthe potentially faulty assumption that the negotiators of the earlierlicenses in the industry had correctly considered and interpreted themyriad of factors affecting royalty rates.27 All of the prior mistakesmade are passed along “as silly sheep leap over a vacuum, becausetheir leader originally leaped there when a stick was held.”28
Each of these rules of thumb has been criticized29 and some haveeven been shown to be suboptimal,30 but over time they have becomeentrenched as industry standards without necessarily reflecting theactual value of the intellectual asset rights being transferred. Both the25 percent of profits and 5 percent of sales methods are obviousoversimplifications and do not take into account variations in industryand relative contributions to profit by different types of intellectualassets.
Worse yet, in some instances the licensor may end up “leavingmoney on the table” by not extracting value comparable to theaverage contribution to profit of intellectual property and intellectualassets for the industry as a whole (i.e., companies that exploit theirintellectual assets internally are generating a higher rate of return thanthe rate earned by a rule of thumb royalty).31 One such example maybe Handspring’s license of the Palm operating system. Some analystshave indicated that Palm receives as little as $8 per unit (orapproximately 5 percent of the average price) of the various modelsof Handspring’s Visor.32 By comparison, Palm generates a grossprofit margin of 40 percent on sales of its own devices, a large portionof which can be allocated to profits due to intellectual assets.33
Intellectual Asset Transactions 11
34. See, e.g., Paper Converting Mach. Co. v. Magna-Graphics Corp., 745 F.2d 11,21–22 (Fed. Cir. 1984); Polaroid Corp. v. Eastman Kodak Co., 16 U.S.P.Q. 2d 1481, 1535(D. Mass. 1990); Syntex Inc. v. Paragon Optical Inc., 7 U.S.P.Q. 2d 1001, 1027 (D. Ariz.1987); Tektronix, Inc. v. United States, 552 F.2d 343, 350 (Ct. Cl. 1977).
35. 75 T.C.M. (CCH) 2575 (T.C. 1998).36. Id. at 2588 n.9 (citing Kerwit Med. Prods., Inc. v. N & H Instruments, Inc., 224
U.S.P.Q. 679, 691 n.6 (N.D. Tex. 1984)).
Unfortunately, courts have not been immune to application ofthese rules of thumb, particularly the 25 Percent Rule.34 Courts havebeen induced to apply rules of thumb such as the 25 Percent Rule inpart because expert witnesses, such as Mr. Goldscheider, are often thestrongest advocates for these heuristics. In Podd v. Commissioner ofInternal Revenue,35 the judge noted that in
a previous case before a Federal District Court inTexas, Mr. Goldscheider offered expert testimony onthe subject of what a reasonable royalty would beand the judge in that case commented that Mr.Goldscheider’s credibility was adversely affecteddue to his appearance as an advocate rather than adetached expert.36
The advocacy of expert witnesses, however, cannot be the onlyexplanation for the use of royalty rates based on rules of thumb.There must be other explanations.
III. POSSIBLE EXPLANATIONS
In order to look for ways to improve the marketplace forintellectual asset transactions, it is first necessary to examine possibleexplanations for how the present situation arose and why it has notcorrected itself on its own. Economic theory suggests that thenecessary information is too costly to acquire (i.e., difficult to obtainor not available at all), resulting in only a small number of intellectualasset transactions based on rigorous quantitative analysis, with theremainder covered by rules of thumb. Economic theory also suggestspossible reasons why organizations internalize innovation and thuswhy licensing is not more widespread. Organizational behaviortheory suggests that some forms of bounded rationality or heuristicusage, as well as organizational inertia, are responsible for thecontinued use of these rules of thumb. The answer probably liessomewhere in the middle.
A. Economic Perspective
Intellectual Asset Transactions12
37. See Oliver Hart, An Economist’s Perspective on the Theory of the Firm, inORGANIZATION THEORY 154, 160 (Oliver E. Williamson ed., 1995); see also Sanford J.Grossman & Oliver D. Hart, The Costs and Benefits of Ownership: A Theory of Verticaland Lateral Integration, 94 J. POL. ECON. 694 (1986).
38. Hart, supra note 37, at 160.39. See id. at 161.40. Id.41. KENNETH J. ARROW, THE LIMITS OF ORGANIZATION 33 (1974).
The economic perspective contributes at least three concepts thatare helpful in understanding the present situation in intellectual assettransactions. First, the property rights view of the firm is a goodstarting point for examining the arena of intellectual assetsthemselves. Second, certain economic explanations for why firmsorganize are helpful in understanding why firms internalizeinnovative activity rather than licensing innovations from outside.The third set of ideas, transaction cost theory, lends the most insightinto why rules of thumb are used rather than quantitative methods fordetermining licensing rates in intellectual asset transactions.Information regarding the value of intellectual assets is expensive andhas historically been difficult, if not impossible, to obtain.
The economic view of the firm as a collection of property rightshas particular relevance in the arena of intellectual asset transactions.This approach is complementary to the transaction cost economictheories of Coase and Williamson, but it focuses on non-humanassets, particularly in contractual relationships.37 The basic premisefor this view is that the right to control the usage of an asset “resideswith the owner of the asset. Ownership of an asset goes together withthe possession of residual rights of control over that asset, that is, theowner has the right to use the asset any way that is not inconsistentwith a prior contract, a custom, or any law.”38 Furthermore, theproperty rights view of the firm specifically includes intellectualassets such as patents and copyrights.39 The resulting theory is that in“a world of transaction costs and incomplete contracts, ex-postresidual rights of control are important because, through theirinfluence on asset usage, they affect ex-post bargaining power and thedivision of ex-post surplus in a relationship.”40 It is that division ofex post surplus from intellectual assets transactions that is of interest.
Economic theory has also contributed insight into whytechnology licensing has historically been somewhat rare relative tothe level of innovation. Arrow asserts that “organizations are a meansof achieving the benefits of collective action in situations in which theprice system fails.”41 Since, in the past, there has not been much of amarketplace for intellectual asset transactions, the best way for an
Intellectual Asset Transactions 13
42. W.RICHARDSCOTT,ORGANIZATIONS: RATIONAL,NATURAL, ANDOPENSYSTEMS
156 (4th ed. 1998) (citing OLIVER E. WILLIAMSON, MARKETS AND HIERARCHIES:ANALYSIS AND ANTITRUST IMPLICATIONS (1975)).
43. SCOTT, supra note 42, at 155 (citing Ronald H. Coase, The Nature of the Firm,4 ECONOMICA 386 (1937)); see also OLIVER E. WILLIAMSON, THE ECONOMIC
INSTITUTIONS OF CAPITALISM (1985); OLIVER E. WILLIAMSON, MARKETS AND
HIERARCHIES: ANALYSIS AND ANTITRUST IMPLICATIONS(1975); OLIVER E. WILLIAMSON,TRANSACTION COST ECONOMICS AND ORGANIZATIONAL THEORY, in THE HANDBOOK OF
ECONOMIC SOCIOLOGY 77 (Neil J. Smelser & Richard Swedberg eds., 1994).44. SCOTT, supra note 42, at 155–56.
organization to obtain intellectual assets was to create them internallyrather than try to license them from another organization. Thispremise is bolstered by the fact that intellectual asset transactions arenot entirely understood by the average manager, in part because theyare legal in nature. Williamson’s model of the conditions underwhich markets tend to give way to organizations adds the idea that“under certain environmental conditions, . . . an individual’scognitive capacities are insufficient. It is the coupling of cognitivelimitations with high levels of uncertainty and complexity thatencourage individuals to move the affected transactions out ofmarkets and into organizations.”42 Such reasoning clearly relates toSimon’s concept of bounded rationality and Kahneman & Tversky’sconcept of heuristics, which are discussed in the next section.
Although the relatively low number of intellectual assetstransactions as compared to the level of innovation is consistent witheconomic theory’s view of the firm, the question of why still remains.What causes the high levels of complexity and uncertainty, resultingin such a small marketplace for intellectual asset transactions? Canthis marketplace ever be expanded and fully realized, sincedetermining the optimal way to divide the ex post surplus from anintellectual asset transaction requires a great deal of information aboutthe transaction’s environment?
One source of answers is transaction cost economics, particularlyits focus on the cost of obtaining information. This theory, based onwork done by Coase and later by Williamson, “shifts attention fromtechnology and production costs to transaction costs—the costsassociated with reaching and policing agreements about the exchangeof goods and services between persons or across boundaries. . . . .These costs range from those of obtaining information, . . .negotiating agreements, policing agreements, to settling disputes.”43
Whereas “[s]imple market transactions work well as a framework forspot contracts, . . . . [t]hey fare less well when the transactions involvefuture values.”44 Since most intellectual asset transactions arelicenses for future royalty payments, it becomes easier to understand
Intellectual Asset Transactions14
45. Id. at 200 (citing BAZERMAN & NEALE, supra note 23).46. SCOTT, supra note 42, at 160 (citing ARROW, supra note 41, at 69).47. ROBERT C. HIGGINS, ANALYSIS FOR FINANCIAL MANAGEMENT 318 (5th ed.
1998). “[T]he FMV of a business is the higher of its liquidation value and its going-concern value,” where going-concern value is “the present worth of expected future cashflows generated by a business.” Id. This concept is similar to the income approach tovaluation, discussed infra text accompanying note 54.
48. Georgia-Pacific Corp. v. United States Plywood Corp., 318 F. Supp. 1116, 1121(S.D.N.Y. 1970).
49. SMITH & PARR, supra note 10, at 160.
the historically small level of market transactions for intellectualassets.
Similarly, because licensing negotiations ultimately requiredecisions to agree when there is insufficient information tocomfortably support those decisions, the number of such transactionswill be small. As Scott points out, “bargaining and negotiation arecomplex activities, requiring knowledge of one’s own interests andpriorities, those of others, information about the current and likelyfuture states of affairs, knowledge of rule systems and normsgoverning agreements, and related matters.”45 Arrow notes that thegathering of information is also essential to arriving at a decision.46
Thus, absent sufficient information, such negotiations are unlikely toconclude satisfactorily, if they take place at all, without resorting to arule of thumb which requires less information than a quantitativeanalysis.
But what exactly is the information that is so difficult to obtain?It is the fair market value (“FMV”) of the various rights to theintellectual assets involved in the transaction. In general, FMV “isthe price at which an asset would trade between two rationalindividuals, each in command of all of the information necessary tovalue the asset and neither under any pressure to trade.”47 Relatingthis concept to royalty rates, courts have often used a variation ofFMV in the form of a “willing buyer and willing seller” rule in anattempt to calculate patent infringement damages.48 The difficultieslie in the fact that intellectual asset valuations are not easy to obtain,unlike valuations of real estate, where market comparables give afairly close approximation of the FMV of a piece of land.
In general, the market approach “measures the present value offuture benefits by obtaining a consensus of what others in themarketplace have judged it to be. There are two requisites: an active,public market and an exchange of comparable properties.”49
Unfortunately, these two requisites rarely exist for a sufficientlystrong estimate of value of intellectual assets; it is often difficult, ifnot impossible, to find even one market comparable transaction thatcan be used to assist in valuing another transaction. The example
Intellectual Asset Transactions 15
50. See generally Joseph Costello, Overcoming the Behemoth: The Urgent Need fora Private Legal System in Electronics, in CAPITAL FOR OUR TIME: THE ECONOMIC,LEGAL, AND MANAGEMENT CHALLENGES OF INTELLECTUAL CAPITAL 51 (NicholasImparato ed., 1999).
51. The IPEX is available at http://www.ipex.net. Other exchanges include Yet2.com(http://www.yet2.com), the Patent and Licensing Exchange (http://www.pl-x.com), andthe Intellectual Property Technology Exchange (http://www.techex.com).
52. See SMITH & PARR, supra note 10, at 164.53. See Eric N. Berg, Now “Intrapreneurship” Is Hot, N.Y. TIMES, Apr. 4, 1985, at
D1 (describing the development of Post-It Notes).54. See SMITH & PARR, supra note 10, at 257.
closest to a public market is the Virtual Socket Alliance (“VSA”), aconsortium of 125 semiconductor companies that has created aprivate system for exchanging intellectual assets related to theelectronics industry.50 Along with the VSA, other initiatives such asPricewaterhouseCoopers’ Intellectual Property Exchange (“IPEX”)51
are attempting to create public markets for intellectual assets, butthese efforts are in the early stages of development.
Cost basis valuations are not very helpful either. The costapproach attempts to measure the future benefits of the license of atechnology by quantifying the investment that would be required toreplace the future service capability of the technology, frequentlyreferred to as replacement cost.52 Often the cost approach is a veryconservative if not a poor method of valuation because a companycan invest very little in technology and invent something with valuethat greatly exceeds cost. One such example of a breakthroughtechnology is Post-It Notes, which 3M introduced in 1980. Thissimple invention cost 3M very little to develop,53 but the company hasreaped huge profits from an entire line of products based on theoriginal invention.
The third method, the income approach, is based on the premisethat the FMV of an intellectual asset—or any asset for thatmatter—can be expressed as the present value of the anticipatedstream of economic benefits that can be secured by ownership of theasset.54 In essence, this approach examines the income-producingcapability of an intellectual asset to determine its value. The threemain questions answered by the income approach are:
(1) What is the income stream that will be generated over time bythe intellectual asset?(2) How long will that stream last?(3) What is the likelihood that the forecasted income stream willmaterialize?
Intellectual Asset Transactions16
55. See supra note 42 and accompanying text.56. See Oliver E. Williamson, Chester Barnard and the Incipient Science of
Organization, in ORGANIZATION THEORY 172, 179 (Oliver E. Williamson ed., expandeded. 1995) (summarizing the economic perspective on bounded rationality as “all complexcontracts are unavoidably incomplete.”).
57. HERBERT A. SIMON, MODELS OF MAN: SOCIAL AND RATIONAL 198 (1957).
In addition to the fact that the income approach is not readilyunderstood by managers when applied to intellectual assets, it is clearfrom these three questions that the income approach is rife withuncertainty and speculation absent some form of robust metrics. Thusthe view of the environment for intellectual asset transactions is onein which these transactions are moved out of markets and intoorganizations,55 and rules of thumb are used for whatever markettransactions remain.
At this point, it would seem appropriate to merge the economicperspective with the organizational behavior perspective, particularlyregarding the concepts of bounded rationality and heuristics. Theorganizational behavior perspective on bounded rationality andheuristics provide superior insight into the present status ofintellectual asset transactions than does the economic perspective onbounded rationality.56
B. Organizational Behavior Perspective
Since managers normally have neither sufficient information norquantitative metrics to make fully informed decisions in intellectualasset negotiations, their use of a rule of thumb in the few transactionsthat do take place in the market seems to be evidence of “satisficing,”or settling for a method that is good enough, rather than expendingadditional effort to find a superior approach. Simon’s definition ofbounded rationality describes this situation almost exactly:
The capacity of the human mind for formulating andsolving complex problems is very small comparedwith the size of the problems whose solution isrequired for objectively rational behavior in the realworld.57
Simon continued, stating that
[t]he key to simplification of the choice process . . .is the replacement of the goal of maximizing with thegoal of satisficing, or finding a course of action thatis ‘good enough.’ . . . [T]his substitution is an
Intellectual Asset Transactions 17
58. Id., at 204–05 (emphasis in original).59. SCOTT, supra note 42, at 50.60. Daniel Kahneman & Amos Tversky, Judgment Under Uncertainty: Heuristics
and Biases, 185 SCIENCE 1124, 1124 (1974).61. See BAZERMAN, supra note 23, at 6 (“Managers assess the frequency, probability,
or likely causes of an event by the degree to which instances or occurrences of that eventare readily ‘available’ in memory.”).
62. See id. at 7(“Managers make assessments by starting from an initial value andadjusting to yield a final decision. . . . . In ambiguous situations, a trivial factor can havea profound effect on our decision if it serves as a starting point from which we makeadjustments.”).
63. See id. (“Managers assess the likelihood of an event’s occurrence by thesimilarity of that occurrence to their stereotypes of similar occurrences.”).
64. See BAZERMAN & NEALE, supra note 23; BAZERMAN, supra note 23.65. WALTER W. POWELL & PAUL J. DIMAGGIO, THE NEW INSTITUTIONALISM IN
ORGANIZATIONAL ANALYSIS 19 (1991).
essential step in the application of the principle ofbounded rationality.58
Simon provided this concept as an alternative to “the ‘economicman’ motivated by self-interest and completely informed about allavailable alternatives . . . [and who] is willing to settle for an adequatesolution in contrast with an optimal one.”59
Fifteen years after Simon’s original publication of his theories ofbounded rationality, Kahneman and Tversky extended the theory byintroducing heuristics and explaining the potential pitfalls of their use.
[P]eople rely on a limited number of heuristicprinciples which reduce the complex tasks ofassessing probabilities and predicting values tosimpler judgmental operations. In general, theseheuristics are quite useful, but sometimes they leadto severe and systematic errors.60
Availability,61 Anchoring and Adjustment,62 andRepresentativeness63 are the heuristics elucidated by Kahneman andTversky that Bazerman identifies as potentially impactingnegotiations.64 These heuristics should be considered whenevaluating heuristic behavior in licensing.
Such concepts explain the use of rules of thumb in intellectualasset transactions. DiMaggio and Powell have credited March andSimon with the observation that “organizational behavior, particularlydecision making, involves rule following more than [quantitative]calculation.”65 March and Simon have also been credited with theidea that “organizations face environments of varying complexity,that they must adjust their internal decision-making apparatus to take
Intellectual Asset Transactions18
66. SCOTT, supra note 42, at 110–11.67. Id. at 53–54 (quoting JAMES D. THOMPSON, ORGANIZATIONS IN ACTION 54
(1967)).68. Id. at 54.69. Id. at 213.70. Id. at 54 (citing Paul J. DiMaggio & Walter W. Powell, The Iron Cage Revisited:
Institutional Isomorphism and Collective Rationality in Organizational Fields, AM. SOC.REV., Apr. 1983, at 147, 152).
71. See generally Irving L. Janis, Groupthink, in READINGS IN MANAGERIAL
PSYCHOLOGY 439 (Harold J. Leavitt et al. eds., 1971).72. See BAZERMAN, supra note 23, at 151–52 (recognizing that the Kahneman and
Tversky heuristics can also play a role with groups)
these variations into account, and that some environments pose levelsof complexity that the organizations cannot manage unless theyimpose simplifying restrictions on the information processed.”66
Similarly, Thompson elucidated the concept of bounded rationalityarising from organizational structure: “‘structure is a fundamentalvehicle by which organizations achieve bounded rationality.’ Thespecification of positions, role definitions, procedural rules andregulations [as] inputs that guide decision making—all function tocanalize behavior in the service of predetermined goals.”67 Accordingto Scott, bounded rationality can beceome part of the organizationalstructure rather than reemain a part of the individuals themselves as“rules that assure participants will behave in ways calculated toachieve desired objectives.”68
Not only does the organizational behavior perspective shed lighton why a single firm might “satisfice” by choosing a rule of thumbfor valuing an intellectual asset transaction, it also helps to explainwhy such heuristics become commonplace through organizationalconformity. Actors in the current marketplace for intellectual assettransactions use these rules of thumb because the lack of preferablealternatives entrench them as the only viable methods of choice. “Wedo it this way because this is the way we have always done it, and thisis how everyone expects it to be done in the industry.” Scottelaborates on this concept in his discussion of structural conformity:“Sometimes environmental actors impose very specific structuralrequirements on organizations as a condition for acceptance andsupport. Organizations are required to adopt specific structuralelements [such as rules of thumb] in order to merit approval.”69
Similarly, DiMaggio and Powell point out that “organizationsconfronting high levels of uncertainty often borrow structural forms,sometimes by consciously modeling a successful form.”70
“Groupthink”71 may also be a factor in highly cohesive groups.72 It is
Intellectual Asset Transactions 19
73. See generally S.E. Asch, Effects of Group Pressure upon the Modification andDistortion of Judgements, in BASIC STUDIES IN SOCIAL PSYCHOLOGY 393 (Harold M.Proshansky & Bernard Seidenberg eds., 1965).
74. SCOTT, supra note 42, at 215.75. Id. at 215 (citing EUGENE BARDACH & ROBERT A. KAGAN, GOING BY THE BOOK:
THE PROBLEM OF REGULATORY UNREASONABLENESS (1982)).76. Id. at 54.77. See generally FREDERICK W. TAYLOR, THE PRINCIPLES OF SCIENTIFIC
MANAGEMENT (1911).
thus possible that rational participants might be persuaded to adoptheuristic positions because of group pressure.73
In Scott’s discussion of procedural conformity, he places someblame for the need to satisfice rather than optimize in intellectualasset transactions on lawyers: “Even when the demands beingenforced are primarily technical, the requirements are often couchedin procedural language—the language of lawyers—rather than inlanguage that attempts to specify [efficient] outcomes.”74 He alsoidentifies other criticisms of lawyers, noting that “these proceduresreadily become disconnected from outcomes, creating legalisticmazes and bureaucratic rituals rather than providing a framework tosupport rational decision making.”75 Finally, Scott notes that fordecisions made near the top of an organization, including intellectualasset transactions, “as long as [the value premises that governdecision making] are specific enough to provide clear criteria forchoice, these premises can support a ‘rational’ structure no matterhow monstrous or perverted their content.”76 It is probably a bit harshto describe the rules of thumb used in intellectual asset transactions as“monstrous or perverted”; nevertheless, there must be ways toimprove the situation to make these transactions both more efficientand more numerous.
IV. POSSIBLE IMPROVEMENTS
A. Theoretical Basis
In addition to shedding light on the present state of the market forintellectual asset transactions, these perspectives, particularly theorganizational behavior perspective, provide guidance on how thesetransactions might be made both more efficient and more numerous.Oddly enough, the basis for these improvements can be found in thescientific management approach developed by Frederick Taylor in theearly 1900s.77 Citing Taylor’s work, Scott defines “performanceprograms” as
Intellectual Asset Transactions20
78. SCOTT, supra note 42, at 250 (citing TAYLOR, supra note 77; FREDERICK W.TAYLOR, SCIENTIFIC MANAGEMENT 189 (1947)).
79. FREDERICK W. TAYLOR, SCIENTIFIC MANAGEMENT 189 (1947).80. SCOTT, supra note 42, at 51–52.81. Id. at 86.
sets of activities that are performed in a regular andpredictable way to carry out the work of theorganization, [and according to rational systemstheory,] these programs can and should berationalized: engineers and technical staff mustanalyze the work requirements and design thenecessary operations so as to minimize time andresource use.78
For organizations dealing with intellectual assets, the valuationmetrics for intellectual assets could be considered performanceprograms.
If Taylor’s principles apply to intellectual assets, it must bepossible to analyze intellectual asset transactions scientifically inorder to discover those procedures that would produce the maximumefficiency while still minimizing the input of information and theamount of uncertainty. Taylor would probably seek to replace rulesof thumb with analytical, scientific procedures. According to Taylor,the decision maker “under scientific management is governed by rulesand laws which have been developed through hundreds ofexperiments.”79 In the arena of intellectual asset transactions,however, it may not be necessary to conduct experiments if theinformation can be obtained from publicly available data.
Suppose that the necessary information is available to optimizeintellectual asset transactions, but the marketplace is not aware of it.If the marketplace could be made aware of the information and giventhe metrics to utilize it, then it is likely that intellectual assettransactions would become more efficient and more numerous. Manyelements of organizational behavior theory support this conclusion.According to Scott, organizations “support participants in thedecisions they must make . . . by providing them with the necessarymeans to handle them: resources, information, equipment.”80
Systems theory states that “the setting of goals is based oninformation received from the environment so that favorableexchanges between the environment and organization can occur.”81
Thus, the organization must be convinced that the information isavailable if it is to view increased efficiency in intellectual assettransactions as a reachable goal.
Intellectual Asset Transactions 21
82. JAY R. GALBRAITH, ORGANIZATION DESIGN 36 (1977).83. SCOTT, supra note 42, at 112 (discussing the work of Oliver Williamson).84. JAMES G. MARCH, A PRIMER ON DECISION MAKING: HOW DECISIONS HAPPEN
10 (1994).85. See JEFFREY PFEFFER & GERALD R. SALANCIK, THE EXTERNAL CONTROL OF
ORGANIZATIONS: A RESOURCE DEPENDENCE PERSPECTIVE 74 (1978).86. Id. at 75.
Intellectual asset transactions will always, by nature, be complexand subject to uncertainty and risk. Therefore, greater availability ofinformation will be critical to any increase in the efficiency or numberof these transactions. According to Galbraith, “the greater the taskuncertainty, the greater the amount of information that must beprocessed among decision makers during task execution in order toachieve a given level of performance.”82 A mere increase ininformation is insufficient, however, to overcome the problems ofbounded rationality.
Metrics that facilitate the processing of the information are alsorequired. According to transaction cost theory, “as exchangesbecome more complex and uncertain—because the environment is notstable or predictable . . .—various kinds of external controls andsupports must be devised to aid the exchanges—that is, to reduce thetransaction costs.”83 This conclusion is also reinforced when oneconsiders March’s concept of attention structure. If the organization isswamped with information, it will not be able to process theinformation adequately in order to optimize the intellectual assettransaction. According to March,
Time and capabilities for attention are limited. Noteverything can be attended to at once. Too manysignals are received. Too many things are relevantto a decision. Because of these limitations, theoriesof decision making are often better described astheories of attention or search than as theories ofchoice. They are concerned with the way in whichscarce attention is allocated.84
However, if the organization has sufficient metrics or informationprocessing systems, as defined by Pfeffer and Salancik,85 then theorganization can focus its scarce attention on optimizing theintellectual asset transaction because the “information systems aredesigned and created to provide the information that the decisionmaker requires.”86
Intellectual Asset Transactions22
87. See supra text accompanying notes 10–11.88. See supra note 17.89. The terms CPIA (contribution to profit of intangible assets), IPIA (intellectual
property and intellectual assets), and CPIPIA (contribution to profit of IPIA) are newterms contrived for this discussion of intellectual asset valuation. The author accepts fullblame (or credit) for their relative utility in this analysis.
90. A somewhat similar measure, the Knowledge Capital Scoreboard developed byProfessor Baruch Lev of New York University, identifies the total intangible asset valuefor several companies, but does not readily generate proxies for royalty rates. See BaruchLev & S.L. Mintz, Seeing is Believing: A Better Approach to Estimating KnowledgeCapital, CFO MAGAZINE, Feb. 1999, at 29, available at 1999 WL 8850771.
B. Proposed Methodology
After exploring economic and behavioral concepts in order toexplain the current state of affairs in the marketplace for intellectualasset transactions, it is clear that those same perspectives also providethe impetus for increasing both transaction efficiency and numerosityby obtaining additional information and by providing metrics toprocess that information. As mentioned previously,87 one potentialquantitative approach to determining asking price involves the use ofpublicly available industry information together with basic financialformulas to determine the contribution to profit of intellectual assets.Expressed as percentage of sales, this result can be used as a startingpoint for royalty rate negotiations or as a “reality check” for royaltyrates determined by other means.
This proposed method follows from the premise that the licensorshould be able to extract from the licensee a royalty stream that iscomparable to its own return on intellectual property and intellectualassets (“IPIA”).88 Alternatively, a licensor can look to its industry forthe average return on IPIA. Since returns on intellectual assets arenot normally reported in company financial statements, it is necessaryto derive them from whatever data is available. An industry averagecontribution to profit from intellectual property and intellectual assets(“CPIPIA”)89 can be derived from annual reports and other publiclyavailable information. Before a measure for intellectual assets can bederived, however, the contribution to profit of intangible assets(“CPIA”), which includes intellectual assets, must be derived. OnceCPIA is determined, the calculation of CPIPIA is straightforward.
For those not familiar with corporate finance concepts, the CPIAmetric is, in essence, an expression of the percentage of a company’sprofits that are due to its intangible assets. Intangible assets are assetsother than monetary assets (i.e., cash and liquid securities on hand)and tangible assets (i.e., property, plant and equipment).90 CPIPIA isderived in a given industry by subtracting the average CPIA value fordistributors from the CPIA value for a given manufacturer or a
Intellectual Asset Transactions 23
91. See generally Higgins, supra note 47, at 277–78 (providing an excellentdiscussion of the derivation of WACC).
92. Id. at 278.93. SMITH & PARR, supra note 10, at 360.
portfolio of manufacturers. For those more familiar with corporatefinance, the remainder of this section describes the derivation ofCPIA and the resulting CPIPIA.
1. Contribution to Profit of Intangible Assets – CPIA
This first metric is based on the existence of two formulations ofthe Weighted Average Cost of Capital (“WACC”). The traditionalformulation of WACC91 is
WACC E R D R R E R i ti i f p= + = + × + × −( ) ( ) ( ) ( )β 1
where
E(Ri): expected rate of return for equity investorsD(Ri): expected rate of return for debt investorsRf: risk free rate of return$: beta or systematic riskE(Rp): expected risk premiumi: interest rate on debtt: effective federal and state tax rate
The theoretical underpinnings of WACC are based on the ideathat “a company’s cost of capital is the cost of the individual sourcesof capital, weighted according to their importance in the firm’s capitalstructure.”92 WACC can thus be broken down into its relativecomponents, and be represented as a weighted average of the requiredreturn from monetary, tangible, and intangible assets:93
WACCV
VR
V
VR
V
VRm
bevm
t
bevt
i
bevi= + +
Rm: return on monetary assetsRt: return on tangible assetsRi: return on intangible assetsVm: fair market value of the monetary assetsVt: fair market value of the tangible assets
Intellectual Asset Transactions24
94. Note that Lev’s methodology for deriving knowledge-based earnings is based ona very similar residual calculation. See Lev & Mintz, supra note 90.
95. Cf. RICHARD A. BREALEY & STEWART C. MYERS, PRINCIPLES OF CORPORATE
FINANCE 548 & n.8 (6th ed. 2000) (suggesting use of T-Bill and T-Bond rates to representreturn on monetary and tangible assets respectively).
96. The mechanics of these calculations are fairly straightforward. From the balancesheet of a given firm,Vm is the total Working Capital, Vt is the total Fixed Assets, and Vbev
is the total Market Cap of the firm plus the short term and long term debt.V V V Vi bev m t= − − .
97. DFNI is roughly equivalent to EBIAT, Earnings Before Interest but After Taxes.
Vi: fair market value of the intangible assetsVbev: the fair market value of the business enterprise (the sum ofVm, Vt, and Vi).
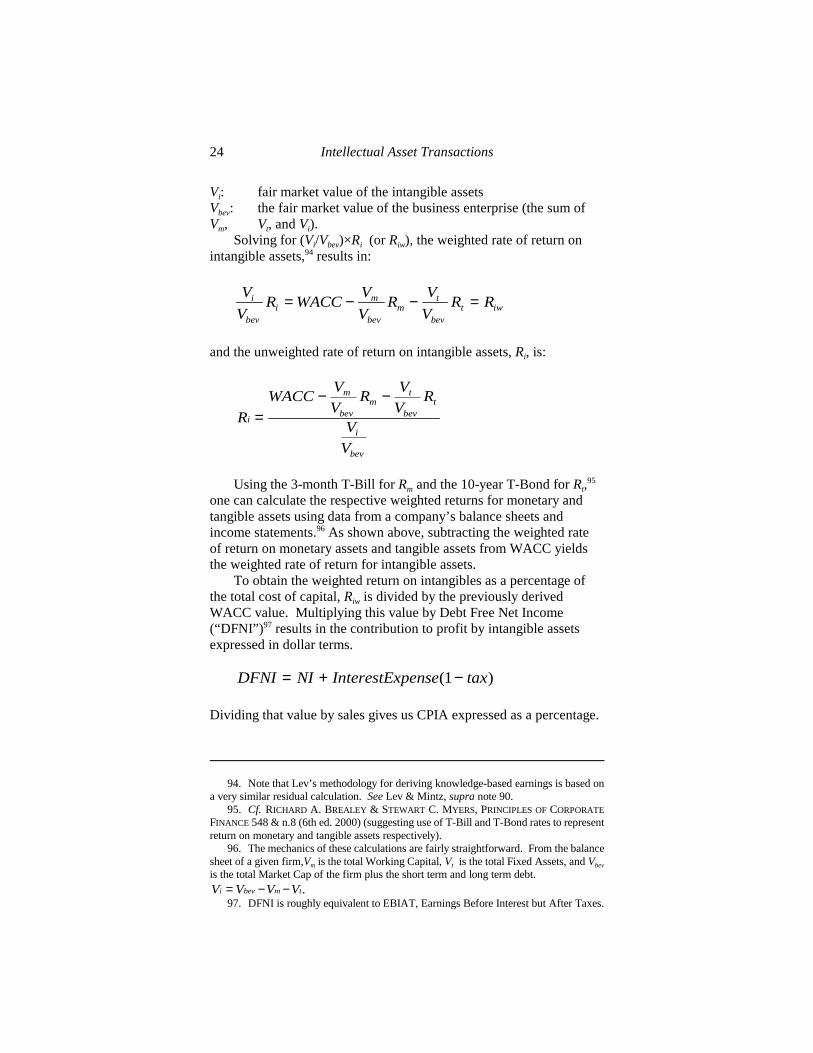
Solving for (Vi/Vbev)×Ri (or Riw), the weighted rate of return onintangible assets,94 results in:
V
VR WACC
V
VR
V
VR Ri
bevi
m
bevm
t
bevt iw= − − =
and the unweighted rate of return on intangible assets, Ri, is:
R
WACCV
VR
V
VR
V
V
i
m
bevm
t
bevt
i
bev
=− −
Using the 3-month T-Bill for Rm and the 10-year T-Bond for Rt,95
one can calculate the respective weighted returns for monetary andtangible assets using data from a company’s balance sheets andincome statements.96 As shown above, subtracting the weighted rateof return on monetary assets and tangible assets from WACC yieldsthe weighted rate of return for intangible assets.
To obtain the weighted return on intangibles as a percentage ofthe total cost of capital, Riw is divided by the previously derivedWACC value. Multiplying this value by Debt Free Net Income(“DFNI”)97 results in the contribution to profit by intangible assetsexpressed in dollar terms.
DFNI NI InterestExpense tax= + −( )1
Dividing that value by sales gives us CPIA expressed as a percentage.

Intellectual Asset Transactions 25
98. For example, pharmaceutical companies such as Amerisource, McKesson, andBergen Brunswig do not engage in substantial IPIA creation, whereas companies such asAbbott Laboratories, Bristol-Myers Squibb, and Schering-Plough have substantial IPIAportfolios. Similar dichotomies have been observed in the electronics, computerhardware, computer software, chemical, cosmetics, and food products industries. See,e.g., PARR &SULLIVAN, supra note 10, at 232 (computer hardware); SMITH & PARR, supranote 10, at 228–38 (pharmaceuticals and food products).
CPIA
R
WACCDFNI
Sales
iw
=
To recap, (Riw / WACC)×DFNI expresses the portion of a firm'sprofits that are due to intangible assets. Contingent royalties,however, are properly expressed as a percentage of sales. Dividing(Riw / WACC)×DFNI by sales results in such a percentage. Thiscalculation can be repeated for all of the companies in an industry toarrive at an average CPIA.
2. Contribution to Profit of Intellectual Assets – CPIPIA
Because CPIA still includes the contribution to profit ofintangible assets other than intellectual property and intellectualassets, these non-IPIA elements must be filtered out in order to arriveat a CPIPIA that can then be used as the licensor’s starting point forroyalty rate negotiations. In a given industry, some companies mighthave strong IPIA portfolios while other, equally well-run companiesmay lack IPIA.98 Subtracting an industry average for CPIA forcompanies without IPIA from the CPIA value for a company with anIPIA portfolio, or an industry average for companies with IPIAportfolios, yields a value for CPIPIA, the contribution to profit ofboth intellectual property and intellectual assets for a given companyor industry.
C. Empirical Analysis and Validation of Metrics
Although not an exact measure of a company’s intellectual assetvalue, CPIPIA seems to be a good industry-based approximation.CPIPIA is an appropriate starting point for royalty rate negotations byvirtue of its basis in a WACC calculation that is specific to thecompany in question. Since the CPIPIA metric is based onhypothesized behavior of CPIA, that behavior should be demonstratedempirically before any further exploration of CPIPIA is warranted.
Intellectual Asset Transactions26
99. SIC codes are promulgated by the National Technical Information Service. Seegenerally Nat'l Tech. Info. Serv., NTIS Web Site Home Page, at http://www.ntis.gov/ (lastvisited Apr. 25, 2001).
100. As shown in the Appendix, however, some of the companies in the 5122classification do engage in some level of R&D expenditure.
101. See Standard & Poor, Institutional Market Services, athttp://www.compustat.com/ (last visited Apr. 25, 2001).
102. See Primark Corp., Products, at http://www.datastream.com/product/has/index.htm (last visited Apr. 25, 2001).
103. Only companies with positive DFNI and for which revenues were greater thanDFNI were included. The resulting sample included 58 firms, which are listed in theAppendix.
The main underlying assumption in the CPIA metric is that CPIAvalues will be higher for companies with large intangible assetportfolios and lower for companies with few or no intangible assets.To verify this assumption, it is necessary to examine the relationshipamong CPIA, R&D expenditures, and manufacturer/distributorclassification in a single industry. Given that many pharmaceuticalcompanies engage in significant R&D to increase their portfolios ofintangible assets, a positive correlationbetween R&D expendituresand CPIA values should exist for companies in this industry.
H1: As a firm’s R&D expenditures increase as apercentage of sales, so will its contribution to profitof intangible assets increase as a percentage of sales.
The pharmaceutical industry is divided into two StandardIndustry Classification (“SIC”) codes.99 SIC code 2834 primarilycontains manufacturers, and SIC code 5122 primarily containsdistributors.100 Manufacturers generally engage in more R&D relativeto sales volume than do distributors. Thus, if CPIA behaves asexpected, then firms in the 5122 classification will have lower CPIAvalues than those classified in 2834.
H2: Classification as a manufacturer is associatedwith having a higher CPIA value than classificationas a distributor.
Using Compustat101 financial statement data and Datastream102
bond rate data, a value for CPIA can be calculated for eachpharmaceutical company.103 Then using Compustat R&D expendituredata, the following Ordinary Least Squares model can be evaluated:
CPIA RDSALES SIC= + × + ×β β β0 1 2
Intellectual Asset Transactions 27
104. Regressing CPIA against RDSALES alone also indicated a significant (p < .001)relationship, but with a lower r2 (.4447). Similar indications resulted from a model withonly CPIA and SIC (p < .001 and r2 = .2453).
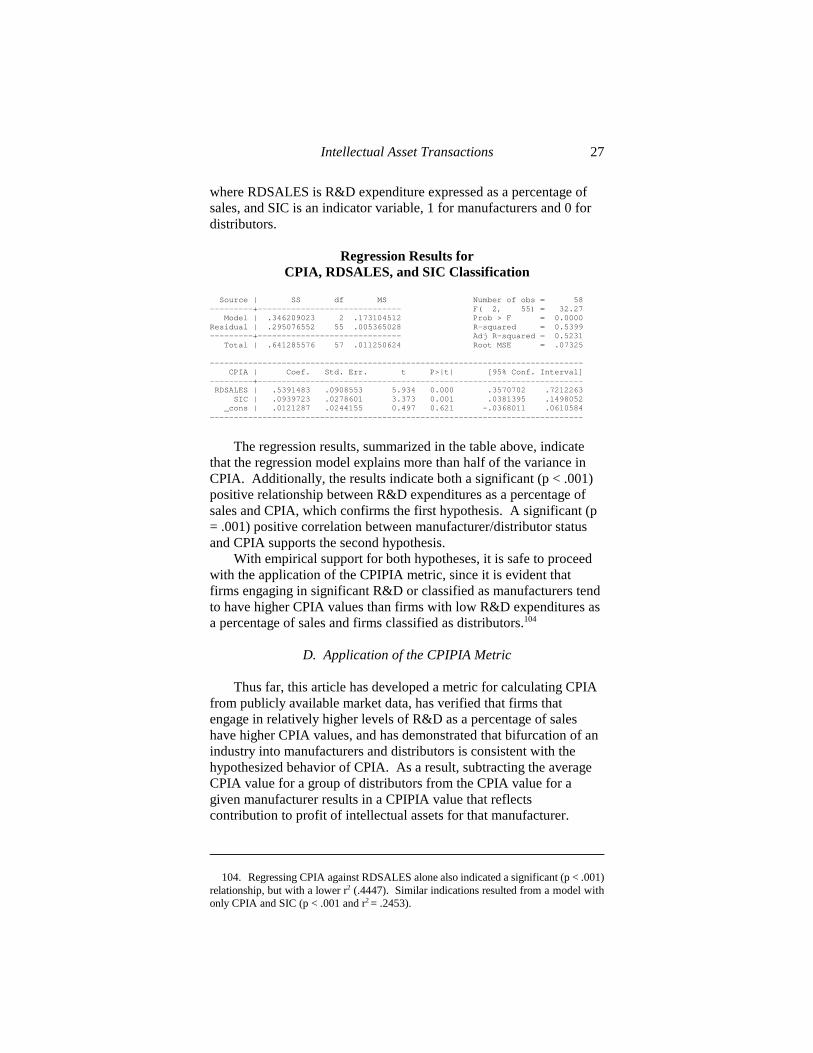
where RDSALES is R&D expenditure expressed as a percentage ofsales, and SIC is an indicator variable, 1 for manufacturers and 0 fordistributors.
Regression Results forCPIA, RDSALES, and SIC Classification
Source | SS df MS Number of obs = 58---------+------------------------------ F( 2, 55) = 32.27
Model | .346209023 2 .173104512 Prob > F = 0.0000Residual | .295076552 55 .005365028 R-squared = 0.5399---------+------------------------------ Adj R-squared = 0.5231
Total | .641285576 57 .011250624 Root MSE = .07325
------------------------------------------------------------------------------CPIA | Coef. Std. Err. t P>|t| [95% Conf. Interval]
---------+--------------------------------------------------------------------RDSALES | .5391483 .0908553 5.934 0.000 .3570702 .7212263
SIC | .0939723 .0278601 3.373 0.001 .0381395 .1498052_cons | .0121287 .0244155 0.497 0.621 -.0368011 .0610584
------------------------------------------------------------------------------
The regression results, summarized in the table above, indicatethat the regression model explains more than half of the variance inCPIA. Additionally, the results indicate both a significant (p < .001)positive relationship between R&D expenditures as a percentage ofsales and CPIA, which confirms the first hypothesis. A significant (p= .001) positive correlation between manufacturer/distributor statusand CPIA supports the second hypothesis.
With empirical support for both hypotheses, it is safe to proceedwith the application of the CPIPIA metric, since it is evident thatfirms engaging in significant R&D or classified as manufacturers tendto have higher CPIA values than firms with low R&D expenditures asa percentage of sales and firms classified as distributors.104
D. Application of the CPIPIA Metric
Thus far, this article has developed a metric for calculating CPIAfrom publicly available market data, has verified that firms thatengage in relatively higher levels of R&D as a percentage of saleshave higher CPIA values, and has demonstrated that bifurcation of anindustry into manufacturers and distributors is consistent with thehypothesized behavior of CPIA. As a result, subtracting the averageCPIA value for a group of distributors from the CPIA value for agiven manufacturer results in a CPIPIA value that reflectscontribution to profit of intellectual assets for that manufacturer.
Intellectual Asset Transactions28
105. Note that median value is more resistant to outliers than is the mean, and thusmay be a more appropriate reflection of the midpoint of the data for certain distributions.
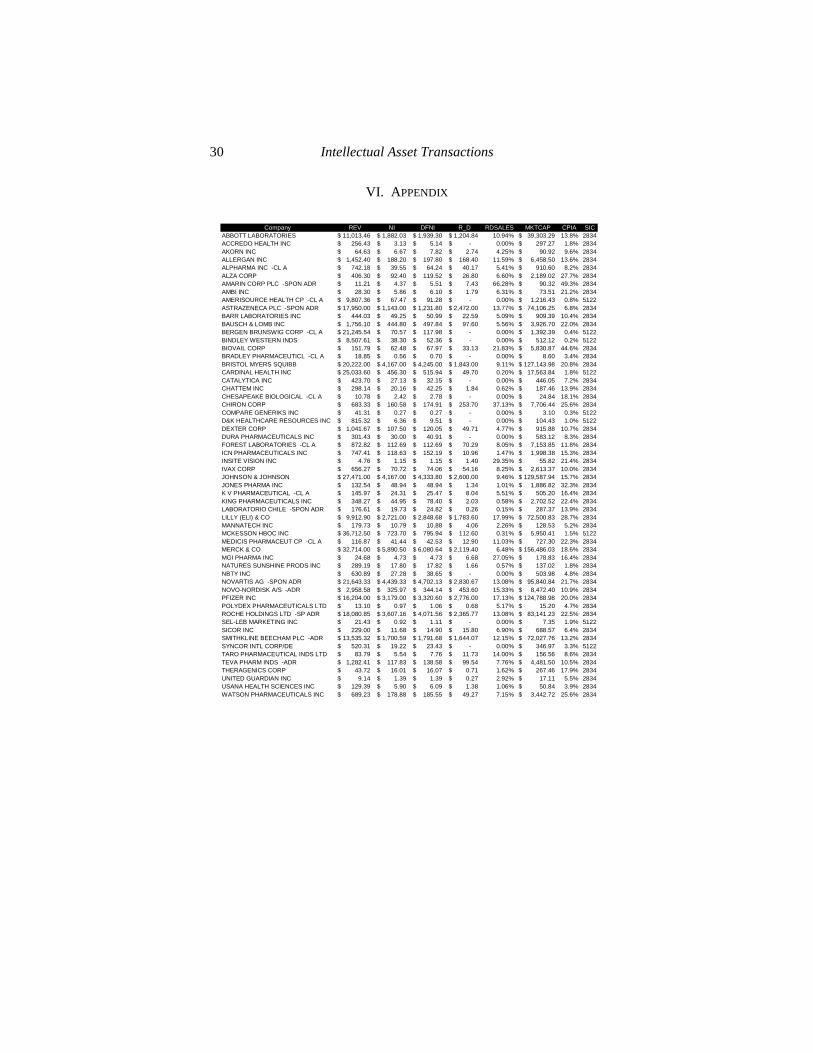
106. The resulting average CPIPIA for the sample data provided in the Appendix is14.4%.
107. For example, the resulting CPIPIA for Merck for the sample data provided in theAppendix is 17.3%.
108. The 95% confidence interval for the average CPIPIA for the sample dataprovided in the Appendix is between 11.6% and 17.2% Note that this confidence intervalincludes the 16.2% Knowledge Capital Earnings/Sales average for pharmaceuticalsgenerated by Lev. See Lev & Mintz, supra note 90.
109. Even if a royalty rate seems low relative to the industry average CPIPIA, theremay be other strategic reasons to enter into the licensing relationship when the benefitsoutweigh the economic difference between the license rate and the industry averageCPIPIA.
Subtracting the average distributor CPIA from the averagemanufacturer CPIA results in an industry CPIPIA.
How might one use this metric in an actual licensing transaction?Two particular uses seem readily apparent. The first use is as astarting point for a royalty rate negotiation. The second use is as a“reality check” to validate a royalty rate derived through otherquantitative means.
To determine CPIPIA for an average company in an industry, thestarting point would be to use a set of company data, such as thatpresented in the Appendix, to calculate CPIA for each company.Companies would then be grouped into low CPIA (distributors) andhigh CPIA (manufacturers) and the average CPIA values calculatedfor each group.105 The distributor CPIA value would be subtractedfrom the manufacturer CPIA value to yield a CPIPIA value as anindustry average.106 For a company-specific CPIPIA, the averagedistributor CPIA value would be subtracted from the CPIA value forthat company.107
To use CPIPIA to validate a royalty rate generated through othermeans, a confidence interval for CPIPIA can be calculated todetermine whether the given rate falls within that interval.108 If not, itmight be worthwhile to either reexamine the methodology used toderive the royalty rate or reevaluate the business case for granting thelicense.109
V. CONCLUSION
As the knowledge economy expands, the marketplace forintellectual asset transactions will have to mature. In order to do so,the participants in the market must have a better understanding of thevalue of the assets involved in these transactions. Much of thisauthor’s ongoing research involves locating relevant information and
Intellectual Asset Transactions 29
110. Although not covered in this article, quantitative metrics can also be quite usefulin determining the licensee’s acceptable range of royalty rates. See generally MARTHA
AMRAM & NALIN KULATILAKA, REAL OPTIONS (1999); Timothy A. Luehrman, Strategyas a Portfolio of Real Options, HARV. BUS. REV., Sept.–Oct. 1998, at 89; CLARKSON &APPLEGATE, supra note 12.
exploring robust metrics to process that information to achieve abetter understanding of the intellectual asset market. Using suchquantitative metrics, intellectual asset transactions can take place in amore informed manner. Licensors can enter negotiations knowingtheir industry’s average contribution to profit from intellectual assetsthat are exploited internally. They can use this average as a startingpoint for a royalty rate, with the range of CPIPIA across the industrydefining a reaonable range of royalty rates. Alternatively, CPIPIAcan be used as a “reality check” for license rates derived by othermeans.
On the other side of the transaction, with an appropriate set ofmetrics, the licensee could enter negotiations with a reasonableestimate of the range of appropriate royalty rates.110 The convergenceof these two ranges defines a set of win-win licensing scenarios. Ifthere are no win-win scenarios, the parties can then make an informeddecision whether to look elsewhere for licensing possibilities. Use ofmetrics by both parties increases the likelihood that assets will beused so as to maximize their value.
Intellectual Asset Transactions30
Company REV NI DFNI R_D RDSALES MKTCAP CPIA SICABBOTT LABORATORIES 11,013.46$ 1,882.03$ 1,939.30$ 1,204.84$ 10.94% 39,303.29$ 13.8% 2834ACCREDO HEALTH INC 256.43$ 3.13$ 5.14$ -$ 0.00% 297.27$ 1.8% 2834AKORN INC 64.63$ 6.67$ 7.82$ 2.74$ 4.25% 90.92$ 9.6% 2834ALLERGAN INC 1,452.40$ 188.20$ 197.80$ 168.40$ 11.59% 6,458.50$ 13.6% 2834ALPHARMA INC -CL A 742.18$ 39.55$ 64.24$ 40.17$ 5.41% 910.60$ 8.2% 2834ALZA CORP 406.30$ 92.40$ 119.52$ 26.80$ 6.60% 2,189.02$ 27.7% 2834AMARIN CORP PLC -SPON ADR 11.21$ 4.37$ 5.51$ 7.43$ 66.28% 90.32$ 49.3% 2834AMBI INC 28.30$ 5.86$ 6.10$ 1.79$ 6.31% 73.51$ 21.2% 2834AMERISOURCE HEALTH CP -CL A 9,807.36$ 67.47$ 91.28$ -$ 0.00% 1,216.43$ 0.8% 5122ASTRAZENECA PLC -SPON ADR 17,950.00$ 1,143.00$ 1,231.80$ 2,472.00$ 13.77% 74,106.25$ 6.8% 2834BARR LABORATORIES INC 444.03$ 49.25$ 50.99$ 22.59$ 5.09% 909.39$ 10.4% 2834BAUSCH & LOMB INC 1,756.10$ 444.80$ 497.84$ 97.60$ 5.56% 3,926.70$ 22.0% 2834BERGEN BRUNSWIG CORP -CL A 21,245.54$ 70.57$ 117.98$ -$ 0.00% 1,392.39$ 0.4% 5122BINDLEY WESTERN INDS 8,507.61$ 38.30$ 52.36$ -$ 0.00% 512.12$ 0.2% 5122BIOVAIL CORP 151.79$ 62.48$ 67.97$ 33.13$ 21.83% 5,830.87$ 44.6% 2834BRADLEY PHARMACEUTICL -CL A 18.85$ 0.56$ 0.70$ -$ 0.00% 8.60$ 3.4% 2834BRISTOL MYERS SQUIBB 20,222.00$ 4,167.00$ 4,245.00$ 1,843.00$ 9.11% 127,143.98$ 20.8% 2834CARDINAL HEALTH INC 25,033.60$ 456.30$ 515.94$ 49.70$ 0.20% 17,563.84$ 1.8% 5122CATALYTICA INC 423.70$ 27.13$ 32.15$ -$ 0.00% 446.05$ 7.2% 2834CHATTEM INC 298.14$ 20.16$ 42.25$ 1.84$ 0.62% 187.46$ 13.9% 2834CHESAPEAKE BIOLOGICAL -CL A 10.78$ 2.42$ 2.78$ -$ 0.00% 24.84$ 18.1% 2834CHIRON CORP 683.33$ 160.58$ 174.91$ 253.70$ 37.13% 7,706.44$ 25.6% 2834COMPARE GENERIKS INC 41.31$ 0.27$ 0.27$ -$ 0.00% 3.10$ 0.3% 5122D&K HEALTHCARE RESOURCES INC 815.32$ 6.36$ 9.51$ -$ 0.00% 104.43$ 1.0% 5122DEXTER CORP 1,041.67$ 107.50$ 120.05$ 49.71$ 4.77% 915.88$ 10.7% 2834DURA PHARMACEUTICALS INC 301.43$ 30.00$ 40.91$ -$ 0.00% 583.12$ 8.3% 2834FOREST LABORATORIES -CL A 872.82$ 112.69$ 112.69$ 70.29$ 8.05% 7,153.85$ 11.8% 2834ICN PHARMACEUTICALS INC 747.41$ 118.63$ 152.19$ 10.96$ 1.47% 1,998.38$ 15.3% 2834INSITE VISION INC 4.76$ 1.15$ 1.15$ 1.40$ 29.35% 55.82$ 21.4% 2834IVAX CORP 656.27$ 70.72$ 74.06$ 54.16$ 8.25% 2,613.37$ 10.0% 2834JOHNSON & JOHNSON 27,471.00$ 4,167.00$ 4,333.80$ 2,600.00$ 9.46% 129,587.94$ 15.7% 2834JONES PHARMA INC 132.54$ 48.94$ 48.94$ 1.34$ 1.01% 1,886.82$ 32.3% 2834K V PHARMACEUTICAL -CL A 145.97$ 24.31$ 25.47$ 8.04$ 5.51% 505.20$ 16.4% 2834KING PHARMACEUTICALS INC 348.27$ 44.95$ 78.40$ 2.03$ 0.58% 2,702.52$ 22.4% 2834LABORATORIO CHILE -SPON ADR 176.61$ 19.73$ 24.82$ 0.26$ 0.15% 287.37$ 13.9% 2834LILLY (ELI) & CO 9,912.90$ 2,721.00$ 2,848.68$ 1,783.60$ 17.99% 72,500.83$ 28.7% 2834MANNATECH INC 179.73$ 10.79$ 10.88$ 4.06$ 2.26% 128.53$ 5.2% 2834MCKESSON HBOC INC 36,712.50$ 723.70$ 795.94$ 112.60$ 0.31% 5,950.41$ 1.5% 5122MEDICIS PHARMACEUT CP -CL A 116.87$ 41.44$ 42.53$ 12.90$ 11.03% 727.30$ 22.3% 2834MERCK & CO 32,714.00$ 5,890.50$ 6,080.64$ 2,119.40$ 6.48% 156,486.03$ 18.6% 2834MGI PHARMA INC 24.68$ 4.73$ 4.73$ 6.68$ 27.05% 178.83$ 16.4% 2834NATURES SUNSHINE PRODS INC 289.19$ 17.80$ 17.82$ 1.66$ 0.57% 137.02$ 1.8% 2834NBTY INC 630.89$ 27.28$ 38.65$ -$ 0.00% 503.98$ 4.8% 2834NOVARTIS AG -SPON ADR 21,643.33$ 4,439.33$ 4,702.13$ 2,830.67$ 13.08% 95,840.84$ 21.7% 2834NOVO-NORDISK A/S -ADR 2,958.58$ 325.97$ 344.14$ 453.60$ 15.33% 8,472.40$ 10.9% 2834PFIZER INC 16,204.00$ 3,179.00$ 3,320.60$ 2,776.00$ 17.13% 124,788.98$ 20.0% 2834POLYDEX PHARMACEUTICALS LTD 13.10$ 0.97$ 1.06$ 0.68$ 5.17% 15.20$ 4.7% 2834ROCHE HOLDINGS LTD -SP ADR 18,080.85$ 3,607.16$ 4,071.56$ 2,365.77$ 13.08% 83,141.23$ 22.5% 2834SEL-LEB MARKETING INC 21.43$ 0.92$ 1.11$ -$ 0.00% 7.35$ 1.9% 5122SICOR INC 229.00$ 11.68$ 14.90$ 15.80$ 6.90% 688.57$ 6.4% 2834SMITHKLINE BEECHAM PLC -ADR 13,535.32$ 1,700.59$ 1,791.68$ 1,644.07$ 12.15% 72,027.76$ 13.2% 2834SYNCOR INTL CORP/DE 520.31$ 19.22$ 23.43$ -$ 0.00% 346.97$ 3.3% 5122TARO PHARMACEUTICAL INDS LTD 83.79$ 5.54$ 7.76$ 11.73$ 14.00% 156.56$ 8.6% 2834TEVA PHARM INDS -ADR 1,282.41$ 117.83$ 138.58$ 99.54$ 7.76% 4,481.50$ 10.5% 2834THERAGENICS CORP 43.72$ 16.01$ 16.07$ 0.71$ 1.62% 267.46$ 17.9% 2834UNITED GUARDIAN INC 9.14$ 1.39$ 1.39$ 0.27$ 2.92% 17.11$ 5.5% 2834USANA HEALTH SCIENCES INC 129.39$ 5.90$ 6.09$ 1.38$ 1.06% 50.84$ 3.9% 2834WATSON PHARMACEUTICALS INC 689.23$ 178.88$ 185.55$ 49.27$ 7.15% 3,442.72$ 25.6% 2834
VI. APPENDIX