Embed Size (px)
Citation preview
ISSN 1045-6333
HARVARD JOHN M. OLIN CENTER FOR LAW, ECONOMICS, AND BUSINESS
LEARNING AND THE DISAPPEARING ASSOCIATION BETWEEN GOVERNANCE AND RETURNS
Lucian A. Bebchuk, Alma Cohen, and Charles C. Y. Wang
Discussion Paper No. 667 04/2010, Last revised 08/2012
Forthcoming, Journal of Financial Economics
Harvard Law School
Cambridge, MA 02138
This paper can be downloaded without charge from:
The Harvard John M. Olin Discussion Paper Series: http://www.law.harvard.edu/programs/olin_center/
The Social Science Research Network Electronic Paper Collection:
http://ssrn.com/abstract=1589731
This paper is also a discussion paper of the John M. Olin Center's Program on Corporate Governance
Learning and the Disappearing
Association between Governance and Returns
Lucian A. Bebchuk,a* Alma Cohen,b and Charles C.Y. Wangc
Abstract
During the period 1991-1999, stock returns were correlated with the G-Index based on twenty-four governance provisions (Gompers, Ishii, and Metrick (2003)) and the E-Index based on the six provisions that matter most (Bebchuk, Cohen, and Ferrell (2009)). This correlation, however, did not persist during the subsequent period 2000-2008. We provide evidence that both the identified correlation and its subsequent disappearance were due to market participants’ gradually learning to appreciate the difference between firms scoring well and poorly on the governance indices. Consistent with the learning hypothesis, we find that:
(i) The disappearance of the governance-return correlation was associated with an increase in the attention to governance by a wide range of market participants;
(ii) Until the beginning of the 2000s, but not subsequently, stock market reactions to earning announcements reflected the market’s being more positively surprised by the earning announcements of good-governance firms than by those of poor-governance firms;
(iii) Stock analysts were also more positively surprised by the earning announcements of good-governance firms than by those of poor-governance firms until the beginning of the 2000s but not afterwards;
(iv) While the G-Index and E-Index could no longer generate abnormal returns in the 2000s, their negative association with Tobin’s Q and operating performance persisted; and
(v) The existence and subsequent disappearance of the governance-return correlation cannot be fully explained by additional common risk factors suggested in the literature for augmenting the Fame-French-Carhart four-factor model. Keywords: Corporate governance, governance indices, GIM, G-Index, E-Index, shareholder rights, entrenchment, market efficiency, learning, earning announcements, analyst forecasts, IRRC provisions, behavioral finance, asset pricing. JEL Classification: D03, G10, G12, G30, G34, K22
a Harvard Law School and National Bureau of Economic Research, USA b Tel-Aviv University, ISRAEL, and Harvard Law School and National Bureau of Economic Research, USA c Harvard Business School, USA
For helpful comments and reactions, we would like to thank an anonymous referee as well as Malcolm Baker, Bernie Black, Jesse Fried, Steve Kaplan, Andrew Metrick, Holger Mueller, Alan Schwartz, Guhan Subramanian, Jason Zweig, and participants in a Harvard workshop. We would like to thank the Harvard Law School for financial support. * Corresponding author. Tel.: +1 617 495 3138; fax: + 1 617 496 3119. E-mail address: [email protected] (L.A. Bebchuk).
1
1. Introduction In an influential paper, Gompers, Ishii, and Metrick (2003) (hereinafter GIM) identified a
governance-based trading strategy that would have produced abnormal profits during the period 1990–1999. This strategy was based on a G-Index that GIM constructed on the basis of 24 governance provisions that weaken shareholder rights. Bebchuk, Cohen, and Ferrell (2009) (hereinafter BCF) subsequently showed that these results were driven by 6 out of the 24 provisions and constructed an E-Index based on these 6 provisions. The intriguing correlation between governance and returns has attracted a great deal of attention ever since it was first reported, and the G-Index and E-Index have been extensively used.
In this paper, we contribute to understanding GIM’s and BCF’s results concerning the association between governance and abnormal returns. We show that the G-Index and E-Index were no longer associated with abnormal returns during the period of 2000–2008 (or any subperiods within it), and we then investigate what explains both the existence of the governance-returns correlation during the 1990s and its subsequent disappearance. We identify several systematic differences between the 1990s and subsequent years and relate them to the disappearance of the governance-returns correlation. We provide evidence that is consistent with the hypothesis that both the existence and disappearance of the correlation were due to market participants’ learning to appreciate the difference between well-governed and poorly governed firms.
GIM and BCF found that governance provisions—or the characteristics of firms’ governance and culture that they reflect—are associated with lower industry-adjusted Q. Subsequent work found additional links between the G and E indices and firm performance. For example, Masulis, Wang, and Xie (2007) find that worse G-Index and E-Index scores are correlated with worse acquisition decisions (as measured by the stock market returns accompanying acquisition announcements), and Dittmar and Mahrt-Smith (2007) find that worse scores are correlated with a less valuable use of cash holdings.
That the G-Index and E-Index are associated with lower firm value and worse firm performance, however, does not imply that these indices should be associated with abnormal stock returns, as GIM and BCF found for the period 1990–1999. To the extent that market prices already reflect fully the differences between well-governed and poorly governed firms, trading on the basis of the governance indices should not be expected to yield abnormal profits.
We conduct in this paper a series of tests for one possible explanation of the abnormal returns during the 1990s. According to this “learning” explanation, which was noted by GIM, investors in 1990 did not fully appreciate the differences between firms with good and bad governance scores. The legal developments that shaped the significance of the G-Index and E-Index provisions took place largely during the 1980s, which was also when many of these provisions were adopted. In 1990, investors might not yet have had sufficient experience to be able to forecast the expected difference in performance between well-governed and poorly governed
2
firms. Under the “learning” hypothesis, the association between governance indices and returns during the 1990s was expected to continue only up to the point at which a sufficient number of market participants would learn to appreciate fully the differences between well-governed and poorly governed firms. Noting the empirical evidence that lengthy intervals are sometimes necessary even for information that is relatively tangible to be incorporated in prices,1 GIM suggested that it was not possible at the time of their article to forecast when such a process of price adjustment would be completed.
We begin by showing that, consistent with learning, the association between the governance indices did not persist. Using the exact methods employed by GIM (and subsequently BCF) for 1990–1999, we find that this association did not exist during the subsequent period of 2000–2008. Core, Guay, and Rusticus (2006) note that the GIM strategy did not produce abnormal returns during the four-year period 2000–2003, but were naturally cautious about drawing inferences from the relatively short period they examined, and did not focus on the change or seek to explain it. Our robust findings for a period of similar length to the one studied by GIM enable concluding that the documented governance-returns association did not persist after the 1990s.
Note that, to the extent that the disappearance of abnormal returns was due to learning, such learning did not necessarily have to involve learning about the significance of the provisions in the governance indices. While some market participants might have learned to appreciate that certain governance provisions are associated with worse expected performance, other market participants might have directly identified the differences in future performance between the firms that score well and poorly on the governance indices. For our purposes, the learning hypothesis involves market participants, in the aggregate, coming to appreciate the difference between firms that score well and poorly on the governance indices regardless of whether all or some of these participants made use of all the components of the indices themselves.
To investigate further the learning hypothesis, we study how the existence of abnormal returns to governance strategies was associated with changes in the attention paid to governance by market participants. We identify proxies for the attention to governance by the media, institutional investors, and academic researchers, as well as construct an aggregate attention index. We find that the decrease in the returns to the governance strategies was associated with an increase in levels of attention to governance. Furthermore, analyzing potential structural breaking points in the pattern of returns, we find that their location corresponds to the period in which attention to governance rose sharply.
1 GIM cited in this connection the evidence that earnings surprises (Bernard and Thomas, 1989), dividend omissions (Michaely, Thaler, and Womack, 1995), and stock repurchases (Ikenberry, Lakonishok, and Vermaelen, 1995) have long-term drift following the event, and noted that all seem to be relatively simple pieces of information compared with governance structures.
3
The number of media articles about governance, and the number of resolutions about corporate governance submitted by institutional investors (many of which focused on key provisions of the governance indices), jumped sharply in the beginning of the 2000s to historically high levels and remained there. Academic research, proxied by the fraction of National Bureau of Economic Research (NBER) discussion papers related to corporate governance, also rose sharply around this point in time, with the GIM paper being issued as an NBER discussion paper in 2001. Given our findings about the relationship between attention to governance and returns to the governance strategies, we proceed to test the hypothesis that, by the end of 2001, markets had sufficiently absorbed the governance differences reflected in the G-Index and the E-Index.
In particular, we examine whether, by the end of 2001, market participants learned to appreciate the differences between well-governed firms and poorly governed firms in terms of their expected future profitability. In particular, we examine the extent to which markets were differentially surprised by earning announcements as proxied by (i) the abnormal reactions accompanying earning announcements, and (ii) analyst forecast errors. Consistent with the learning hypothesis, we find a marked difference between the 1990–2001 and 2002–2008 periods. During the 1990–2001 period, but not during the 2002–2008 period, the earning announcements of good-governance firms were more likely than the earning announcements of poor-governance firms both (i) to be accompanied with more positive abnormal stock returns, and (ii) to produce a meaningful positive surprise relative to the median analyst forecast. Our analysis here extends the studies of Core et al. (2006) and Giroud and Mueller (2011), which examine (with mixed results) whether the correlation between governance and returns was due to markets’ forecasting errors about the difference between good-governance and poor-governance firms, but which did not consider whether such forecasting errors changed over time during the 1990–2008 period.
Under the learning hypothesis, while the governance indices can be expected at some point to cease to be correlated with abnormal trading profits, as their relevance for firm value and performance becomes incorporated into market prices, the correlation of these indices with firm value and performance can be expected to persist. We find that, indeed, the relationship that the governance indices have with Tobin’s Q and various measures of operating performance remained strong during the 2000s (and, if anything, becomes more significant in the 2002–2008 period).2 Thus, while governance indices may no longer be able to provide a basis for a profitable trading strategy, they should remain valuable tools for researchers, investors, and policy-makers interested in governance and its relationship with firm performance.
2 Our results concerning the persistence of the relationship with Tobin’s Q and operating performance are consistent with those obtained for 2000–2006 by Cremers and Ferrell (2010) and Giroud and Mueller (2011), though these studies do not relate this persistence to the learning hypothesis.
4
We also explore an alternative explanation that has been suggested in the literature to the correlation between governance and returns identified for the 1990s. Under this explanation, governance is correlated with some common risk factor that is not captured by the standard four-factor model used by GIM to calculate abnormal returns (Core et al., 2006; Cremers et al., 2009). Under this explanation, governance can be expected to continue to play a role in explaining the cross-section of returns as long as the common risk factor correlated with governance continues to have such a role. To investigate this possibility, we examine the consequences of augmenting the Fama-French-Carhart four-factor model with additional common factors suggested in the literature—the liquidity factor of Pastor and Stambaugh (2003), the downside risk factor of Ang et al. (2006), and the takeover factor of Cremers et al. (2009). We find that adding these factors cannot fully explain both the existence of the governance-returns correlation and its subsequent disappearance.
Finally, we conduct three types of robustness checks for our results concerning how the periods 1990–2001 and 2002–2008 differ in terms of the association of abnormal returns with the governance indices, as well as in the ability of investors and analysts to forecast the differences in expected future earnings between good-governance and poor-governance firms. In particular, we examine whether our results are robust to excluding new economy firms (Murphy, 2003), to excluding firms in the most competitive industries (Giroud and Mueller, 2011), and to adjusting returns to take into account industry effects (Johnson, Moorman, and Sorescu, 2009; Lewellen and Metrick, 2010). We find that our findings concerning the differences between 1990–2001 and 2002–2008 are all robust to these issues.3
In addition to the literature on governance indices and governance provisions, our paper is related to the large body of asset pricing and behavioral finance literature on the persistence and disappearance of abnormal returns associated with trading strategies based on public information. Trading strategies based on known information that produce risk-adjusted abnormal returns over significant periods of time have sometimes been labeled as “anomalies” (see, e.g., Schwert, 2003). Researchers have paid close attention to the extent to which such “anomalies” have persisted after they were documented by academic research, with some suggesting that it is reasonable to expect anomalies not to persist for long after they are reported (Cochrane, 1999). While classical efficient capital market theory (Fama, 1970) questions whether public information can ever be used to produce abnormal returns, adaptive efficient capital market theory (Daniel and Titman, 1999) suggests that the ability of any trading strategy based on public information to generate risk-adjusted abnormal profits will dissipate over time.
3 While we focus on the differences between 1990–2001 and the period following it, we do not have the data to study how the 1990–2001 period differed from years preceding it. Cremers and Ferrell (2010) introduce a new data set of governance provisions from the pre-1990 period and suggest that the association between governance and returns during the pre-1990 period, when legal rules making entrenching provisions more consequential were developed, was especially strong.
5
Estimating the future effects of (publicly known) governance provisions (or governance characteristics correlated with them) is far from a straightforward matter, and requires not only knowing the public information about the provisions but also plugging it into an appropriate structural model of the firms and their environment. Our evidence is consistent with such a process being one that takes time to develop, refine, and to accurately execute. As Brav and Heaton (2002) show, such a pattern is consistent with two models (that are difficult to distinguish empirically): (i) a “rational structure uncertainty” model in which all agents were uncertain in 1990 what structural model to use to make rational predictions from available public information, but learned to do so over time; and (ii) a “behavioral” model in which some rational investors (but not others) were able to draw accurate inferences from governance provisions already in 1990, but “limits on arbitrage” (Shleifer and Vishny, 1997) prevented their information from being fully reflected in prices, and in which, over time, such rational investors grew sufficiently in number and confidence for their information to be factored into market prices.
The remainder of the paper is organized as follows. Section 2 examines the relationship between the governance indices and returns during the 1990–2008 period. Section 3, the main part of our analysis, investigates the causes of both the existence of a governance-returns association during the 1990s and its subsequent disappearance. Section 4 concludes. 2. The governance-returns association and its disappearance 2.1. The IRRC data set and summary statistics
Our data sample consists of all the companies included in the eight volumes published by the
Investor Responsibility Research Center (IRRC), where the volumes were published on the following dates: September, 1990; July, 1993; July, 1995; February, 1998; November, 1999; February, 2002; January, 2004; and January, 2006. We do not use the 2008 vintage of RiskMetrics governance data because it is not comparable with data in the earlier IRRC volumes: in 2007, RiskMetrics acquired IRRC and revamped its data collection methods; consequently, changes were made both in the set of provisions covered and in the definitions of some of the covered provisions. For example, only 18 of the 24 provisions in the G-Index are covered by the 2008 volume of the RiskMetrics governance data.
Each IRRC volume tracks corporate governance provisions for between 1,400 to 2,000 firms. In addition to all the firms belonging to the Standard & Poor’s (S&P) 500, each IRRC volume also covers other firms considered to be important by the IRRC. Following GIM (2003) and subsequent work in the literature, we exclude dual-class firms and real estate investment trusts (REITs) because of the unique governance structures and regulations prevailing for these sets of firms.

6
We construct an annual time series of the G-Index and E-Index following the forward-fill method of GIM (2003): we assume that the governance provisions remain unchanged from the current date of one volume until the current date of the next volume. Since IRRC publishes a new volume between every two to three years, we fill forward for 2.5 years the data in the last (2006) IRRC volume, until June 2008.4
We follow the construction of the G-Index (which is based on 24 IRRC provisions) defined by GIM and the construction of the E-Index (which is based on six provisions) defined by BCF. Because the provisions in these indices restrict shareholder rights, a high score is viewed as representing worse governance. Following GIM, we define Democracy (G) firms and Dictatorship (G) firms as firms that have especially good governance and especially bad governance, respectively, based on the extremes of the G-Index. In particular, Democracy (G) firms are those whose G-Index score is 5 or lower, and Dictatorship (G) firms are those whose G-Index score is 14 or higher. In an analogous fashion, we create groups of firms whose scores are the very best and the very worst using the E-Index: we define Democracy (E) firms and Dictatorship (E) firms to be those with E-Index scores of zero and E-Index scores of 5 or higher, respectively.
Table 1, Panel A reports summary statistics concerning the governance indices. Rows 1–4 report a volume-by-volume breakdown of the G-Index and E-Index, and the percentage of the firms in each volume that are Democracy or Dictatorship firms using each of the indices.
We match each firm’s monthly governance data with its monthly returns from The Center for Research in Security Prices (CRSP), and then construct both market-value-weighted and equal-weighted portfolios based on governance indices scores. Following GIM, we construct governance portfolios based on holding long Democracy firms and shorting Dictatorship firms. Portfolios are rebalanced at the beginning of each month and governance data are updated whenever information in a new IRRC volume becomes available. The trading strategy is carried out for the period from September 1990, the first publication date of IRRC volumes, until June 2008.
Table 1, Panel B reports the average raw (unadjusted for risk) monthly portfolio returns from the four governance trading strategies—value- and equal-weighted, using the G-Index and E-Index—between each pair of successive IRRC volumes. These statistics indicate that, for each of the four strategies, average monthly portfolio returns were high during the September 1990–December 1999 period examined by GIM, but dropped in the latter half of our sample period (the January 2000–June 2008 period). 2.2. Governance and abnormal returns 1990–2008
4 Filling forward for two years only or for three full years does not materially change the results in our paper.
7
The above monthly returns produced by the governance-based strategies do not account for their associations with systematic risks. To test whether the governance-based strategies yield risk-adjusted abnormal returns, we use (as done by GIM, 2003 and BCF, 2009) the standard four-factor model based on the three factors of Fama-French (1993) augmented by the momentum factor of Carhart (1997). In particular, we divide the sample period into the two periods 1990–1999 and 2000–2008, where the former matches the period studied by GIM. For each period, we run a regression of monthly portfolio returns on the four factors, and report the results in Table 2.
For the first period of 1990–1999, we find economically and statistically significant abnormal returns for all four trading strategies. The value-weighted (equal-weighted) portfolio formed on the G-Index produces average abnormal monthly returns of 69 (49) basis points, with statistical significance at the 1% (5%) level. Our results replicate those in GIM, who report the value- (equal-) weighted monthly portfolio return over the same period of 72 (45) basis points. We obtain similar, but stronger, results using E-Index-based portfolios. The value- and equal-weighted portfolios produce average abnormal monthly returns of 123 and 60 basis points, respectively, both statistically significant at the 1% level. We use White (1980) robust standard errors to alleviate concerns that the time-series residuals from the factor regressions are heteroskedastic. However, the use of standard ordinary least squares (OLS) standard errors does not change our inferences in any of the factor regressions in Table 2 or in the subsequent Tables 3, 4, and 9.
The results for the second period of 2000–2008 are strikingly different. For this period, both the value- and equal-weighted portfolios based on the G-Index or the E-Index produce average monthly abnormal returns that are statistically indistinguishable from zero. Thus, combined with our findings in the raw portfolio returns, the profitability of trading strategies based on the G-Index and the E-Index, either adjusted or unadjusted for risk factors, appears to wane in the 2000s.
Fig. 1 plots the cumulative abnormal monthly returns using three-year rolling average monthly abnormal returns. At the beginning of each month, we estimate over the next 36 months average abnormal returns, and we cumulate them over our sample period. As Fig. 1 shows, for all four governance strategies, the cumulative excess returns are monotonically increasing during the 1990s and subsequently flatten until the end of our sample period.
Last row of Table 2 reports the performance of the governance strategies for the period 1990–2008 as a whole. Consistent with the picture emerging from Fig. 1, three of the four governance strategies produce positive and significant (at the 1% confidence level) average monthly abnormal returns over the entire period. However, as was shown above, this performance of the governance strategies is generated entirely during the 1990–1999 period, and these strategies produce subsequently returns that are indistinguishable from zero.

8
3. Learning and the returns to governance indices 3.1. The learning hypothesis
What can explain the abnormal returns associated with governance strategies during the
1990s? In considering this question, it is important to note that the legal developments that shaped the significance of the governance provisions in the G-Index and the E-Index were largely in place during by the beginning of the 1990s. During the 1980s, the Delaware courts issued rulings, culminating with the Delaware Supreme Court’s 1990 decision in Paramount Communications v. Time, Inc., expanding the power of boards to use governance provisions to “just say no” to acquisition offers they view as undesirable. It is thus difficult to explain the abnormal returns associated with the G-Index and the E-Index during the 1990s as the product of legal changes increasing the significance of the provisions in these governance indices.
For this reason, GIM and subsequent work viewed the association between the G-Index and returns for the 1990s as being due to (i) learning: an inability by market participants in 1990, facing a landscape of provisions and applicable rules that had substantially evolved and changed during the 1980s, to forecast accurately the significance of governance for the expected future performance of firms; or (ii) model misspecification: an association between governance and a common risk factor that is not captured by the four-factor model.5 Our finding that the identified association between governance indices and returns did not persist after the 1990s raises the question of whether any of the two explanations offered for the existence of the associations during the 1990s could also explain the subsequent disappearance of the association.
Under the learning hypothesis (i), which is the focus of the investigations in this section, market prices in the 1990s had not yet precisely priced the expected effects of the differences between well-governed and poorly governed firms on future profitability, but over time, a sufficient number of market participants have learned to appreciate the significance of these differences, making trading on the basis of such differences no longer profitable. The learning hypothesis accepts that it might have been difficult for market participants to forecast precisely how governance provisions would affect the future performance of firms overall. This overall effect combines many effects, some of which go in opposite directions, which in turn depend on how provisions interact with each other and with legal rules. Forecasting this overall effect on a priori theoretical grounds was clearly difficult. Furthermore, even assuming that some arbitrageurs of superior ability were able to make precise predictions in this connection, their activities might not have been sufficient to get the market prices of IRRC firms to fully reflect their forecasts: the firms in the IRRC universe represent the lion’s share of the US capital
5 Explanation (i) seems to have been favored by GIM, and Explanation (ii) was favored by Core et al. (2006) and Cremers et al. (2009).

9
markets, and there are limits to the amount of capital any arbitrageur can commit to a given long-term trading strategy (Shleifer and Vishny, 1997).
While market prices in 1990 might not have reflected a precise forecast of the differences between good-governance and poor-governance firms in terms of future performance, market participants might have gained over time a better appreciation of these differences. Under the learning hypothesis, the association between the governance indices and abnormal returns ceases to exist once market participants with sufficient capital have gained sufficient appreciation of these differences for market prices to reflect such appreciation, which in turn makes it no longer possible to profit by trading on the basis of the governance indices.
In the remainder of this Section 3, we investigate the possibility that the learning hypothesis can explain both the association between governance indices and returns and its subsequent disappearance. We begin by analyzing the association between returns to governance portfolios and attention to governance among a broad range of players—the media, institutional investors, and academic researchers (Section 3.2). Subsequently, to examine whether market participants made governance-related expectational errors during the learning period but not afterwards, we examine market reactions to earning announcements (Section 3.3) as well as analyst surprises by such announcements (Section 3.4). Next, we show that, consistent with the learning hypothesis, the relationship that the governance indices have with Tobin’s Q and operating performance persist throughout 1990–2008 (Section 3.5). We then consider factors suggested in the literature for augmenting the four-factor model, and find that they cannot explain the existence of a governance-returns correlation during 1990–2001 and its subsequent disappearance (Section 3.6). Finally, we show that our results are robust to excluding new economy firms or firms from competitive industries and to industry-adjustment of returns (Section 3.7). 3.2. Returns to governance strategies and attention to governance 3.2.1. Measuring attention to governance
We begin by looking at several quantitative measures that reflect the evolution over time in
the attention paid to governance by relevant players. Below we examine, in turn, the attention paid to governance by the media, institutional investors, and academic researchers. In all cases, we find that the level of attention rose in the beginning of the 2000s to levels much higher than those of the 1990s and subsequently remained high until the end of our sample period.
(i) The media: We begin by looking at references in the media to corporate governance. Media references to and coverage of corporate governance may be relevant for two reasons: greater attention by journalists to governance issues may be a mechanism for information diffusion, influencing market participants and leading them to pay more attention to such issues; and, given that journalists talk with and write for market participants, media coverage may also partly reflect (rather than bring about) a greater interest in these issues on the part of market participants.
10
To obtain a quantitative proxy for the media interest in governance, we search through Lexis-Nexis Academic and tally, in each calendar year, the number of unique newspaper articles that reference the word “corporate governance” from four of the most widely followed newspapers, namely, USA Today, New York Times, Washington Post, and the Financial Times. We normalize the number of articles by their 1990 values and plot in Fig. 2(A) the time series. These time series exhibit a slow, gradual increase during the 1990s, then a steep jump from 2001 to 2002, with interest subsequently remaining at a level much higher than during the 1990s.
(ii) Institutional investors: We also examine the attention paid to corporate governance by institutional investors. In particular, using the annual proxy season reviews of Georgeson Shareholder, we collect the total number of corporate governance shareholder resolutions submitted by institutional investors in each proxy season since 1990, normalizing each year’s figure by the 1990 counts. We plot the time series in Fig. 2(B).
Here we see that the incidence of such shareholder proposals fluctuates between 1990 and 2002, rising steeply in the 2003 proxy season and subsequently remaining at levels that are substantially higher than those prevailing prior to the sharp rise. Because shareholder proposals need to be submitted substantially early in advance of the shareholder meeting, proposals for the proxy season of 2003 were largely submitted in 2002. Thus, Fig. 2(B) reflects a sharp rise in attention given to corporate governance already taking place in 2002, in the form of a rising tendency of institutional investors to submit corporate governance proposals.
Indeed, Georgeson (2003) lists all the corporate governance proposals submitted by institutional investors for vote during the 2003 proxy season, and a review of this list reveals that some of the most common types of proposals, and the ones attracting the most support from shareholders in shareholder votes, were ones focusing on key provisions of the E-Index and the G-Index. In particular, a substantial fraction of all the corporate governance proposals submitted by institutions and voted upon during the 2003 proxy season concerned staggered boards, poison pills, or golden parachutes—all elements of the E-Index (as well as, of course, the broader G-Index). Furthermore, each of these three types of proposals attracted, on average, a majority of the votes cast by shareholders.
(iii) Academic research: We next look at the attention paid to governance by academic researchers. Academic research can provide market participants with ideas and findings that are directly relevant to the choices they make, and it can also influence the choice of issues to which they pay attention.
Academic papers are often published a significant time after they are written and first circulated (as most academic readers of this paper probably painfully recognize). Researchers affiliated with the NBER issue and circulate completed studies in this form, often substantially before their papers are published in journals. We therefore look at the NBER working paper database and search for a number of newly issued working papers that reference the term “corporate governance.” Fig. 2(C) reports in time series the fraction of new NBER working papers that are related to corporate governance in each year. This time series reveals similar time trends as the previous figures, showing that research on corporate governance increased
11
considerably from 1998 to 2004, and that it remained subsequently at a much higher level than prior to this increase.
Overall, we see that the attention paid by academic researchers to governance has risen considerably around the 2001–2002 period in which interest from non-academics (the media and institutional investors) rose sharply. The substantial increase in the level of academic interest was spread over a somewhat longer period, starting to climb even before the jump in attention by the media and institutions, and continued climbing a bit after this jump.
The GIM study itself was issued as an NBER discussion paper in August 2001, and its findings were already noted by the media in the fall of 2001. The New York Times dedicated its trading strategies column, and the Financial Times dedicated its global investing column, to reporting about GIM’s findings concerning the abnormal returns associated with governance strategies.6
(iv) The attention index: To aggregate the different proxies for attention described above, we construct an attention index as follows: for each one of the attention measures, we estimate for each month the 12-month rolling average, normalize it by the 1990 value of this measure, and then take the arithmetic average across the three measures to get the monthly value of the attention index.7 As expected, Fig. 2(D) reveals a pattern consistent with those above: in the beginning of the 2000s there was a sharp increase in the level of the attention index, which subsequently remains at such high levels. In the following section, we revisit the learning hypothesis and attempt to make a linkage between governance-based abnormal returns and the attention index.
3.2.2. Governance alphas and the attention index
The patterns we show above beg the question of what is the relationship between governance
abnormal returns and the attention given to corporate governance. We examine this question in two ways. First, we regress the raw governance portfolios on the four factors as before, but include interactions of each of the four factors and the constant term with quintile ranks of the attention index, where the first quintile is denoted as 0 and the fifth quintile denoted as 4. In this regression, the constant term represents the average abnormal return at the lowest level (i.e., first quintile) of attention paid to corporate governance.
Results of this regression are reported in Panel A of Table 3, in which we find that the value- (equal-) weighted G-Index portfolios produce an average of 70 (51) basis points per month when attention to governance is at the first quintile, but decrease by 23 (9) basis points per month for
6 See Alison Beard, “Shareholder-friendly companies outperform,” Financial Times, November 9, 2001; Mark Hulbert, “Who best protects shareholders? The shareholders,” New York Times, November 4, 2001. 7 For shareholder proposals, we have only yearly data, and we assume that the proposals are evenly distributed among the months of the year.
12
each quintile increase in the attention index, so that when the attention index reaches the 3rd (4th) quintile, alphas are no longer positive and statistically significant at the 10% level. Moreover, the value- (equal-) weighted E-Index portfolios produce an average of 140 (52) basis points per month when attention to governance is at the first quintile, but decrease by 32 (4) basis points for each quintile increase in the attention index, so that when the attention index reaches the 4rd (5th) quintile, alphas are no longer positive and statistically significant at the 10% level.
Another method by which we explore the association between governance abnormal returns and the attention paid to governance is by explicitly estimating the evolution of these abnormal returns over time and examining their association with the attention index. In particular, we first estimate for each month in the sample, the average monthly abnormal returns over the previous 36 months; then we regress these 36-month rolling alphas on the quintile ranks of the attention index. Panel B of Table 3 reports the estimation results. Because rolling alphas are expected (by construction) to have a high degree of time-series correlation, we use Newey-West (1987) heteroskedasticity and autocorrelation robust standard errors with 36 lags.
Results from this regression show that the value- (equal-) weighted G-Index abnormal returns are, on average, 71 (36) basis points per month when attention to governance is at the first quintile, but decrease by 18 (3) basis points per month for each quintile increase in the attention index, so that when the attention index reaches the 4th (5th) quintile, rolling alphas are no longer positive and statistically significant at the 10% level. Moreover, the value- (equal-) weighted E-Index abnormal returns are, on average, 114 (59) basis points per month when attention to governance is at the first quintile, but decrease by 22 (5) basis points for each quintile increase in the attention index, so that when the attention index reaches the 5th quintile, alphas are no longer positive and statistically significant at the 10% level.
Overall, the two sets of regressions in Table 3 show consistent patterns in the association between governance abnormal returns and the attention paid to corporate governance. Alphas from governance portfolios decreased to zero as the attention paid to corporate governance heightened. 3.2.3. Structural break in returns to governance
In this subsection we take another look at the relationship between returns to governance
strategies and attention to governance. In particular, we analyze whether it is possible to locate a structural break in the pattern of returns and if so, how it relates to the period in which attention to governance rose sharply. As we have seen, the attention paid to governance by both the media and institutional investors rose sharply in 2002. By then, interest by academics had been already rising for several years, and continued rising a bit afterwards. The sharp rise in attention to governance from the media and institutional investors might have been due to the “shock” created by the governance scandals of Enron, Worldcom, and others, and to the accompanying governance reforms (the Sarbanes-Oxley Act and the new listing requirements). The preceding and accompanying rise in academic research on the subject might have further contributed to the
13
increased attention to governance. Whatever the reasons for the increased attention to governance, the patterns displayed above make it clear that among media journalists, institutional investors, and academic researchers, the levels of interest in governance from at least 2002 onward were considerably higher than those prevailing during most of the 1990s.
With any learning process, there is no reason to expect that it ever reaches a point in which all market participants recognize the significance of certain factors. What matters is when learning reaches a point in which profits from trading based on these factors are no longer possible because a sufficient number of market participants with sufficient capital have recognized the issue.
Given that we have shown that 1) governance trading strategies ceased to produce abnormal stock returns in the 2000s and 2) the level of interest in governance in several important sets of players reached historically high levels in the early 2000s, we explore below the relationship between governance alphas and the attention paid to governance, and we attempt to identify a structural break point in governance alphas. Finally, we test the hypothesis that, by the end of 2001, sufficient learning had taken place for market prices to internalize the significance of governance sufficiently for abnormal profits based on the governance indices to be no longer possible. We find below evidence that is consistent with the learning hypothesis.
As we saw from the figures about attention, there is a big jump in attention in the beginning of the 2000s, roughly when we stop finding abnormal returns when we look at four-year periods. To study the issue more carefully, we begin by examining whether one can locate a structural break in the abnormal returns. In particular, we employ the Quandt (1960) procedure for identifying a structural break with a single unknown break point: we seek to identify the point in time in our sample in which the period prior to and the period after which the abnormal returns are most “different” statistically. Specifically, we estimate the following regression (1) for a sequence of all possible break points in the data.
.3221 ttCarharttHMLtSMBtMktRftPOSTtr εββββαα +⋅+⋅+⋅+⋅+⋅∆+= (1)
For each breakpoint (year and month in the sample), we estimate (1) using POST as an
indicator variable for any point in time including and after the break point, and we compute the F-statistic on the coefficient on POST (α∆) for each regression. The estimated structural break point is the year and month which yields the largest F-statistic over all possible break points in the estimation sample. Note that in employing the procedure, we consider break points from only the middle 85% of the sample (i.e., 15% trimming) to ensure sufficient data to estimate the coefficients on the intercept α and on POST. In Table 4 Panel A we find the G-Index value- and equal-weighted, and the E-Index value- and equal-weighted portfolio returns to have break

14
points in abnormal returns occurring on May 2000, September 2001, August 2000, and December 2000, respectively. On average, the break point in abnormal governance returns suggested by the Quandt procedure occurred in November 2000.8
The above procedure provides an estimate for a discrete break, occurring fully at one point in time, in governance alphas; however, under the learning hypothesis, we would not necessarily expect any structural breaks to occur discretely when learning takes place over some time. Under this view, one might be interested in identifying a point in time (“critical learning point”) at which the market has sufficiently learned to appreciate the difference between good versus bad governance firms, and after which point there are no more abnormal returns associated with governance-based trading strategies.
While no test can allow us to identify such a point exactly, we can seek to approximate the location of this point as follows. Under gradual learning, the above Quandt procedure will identify a point in time that is likely to be in the middle of the learning process and prior to the critical learning point. As an alternative, we attempt to approximate the critical learning point by estimating, for each governance portfolio, rolling 36-month alphas (as laid out in Section 3.2.2) and identifying the first point in time (year and month) in our sample period in which all subsequent rolling alphas are no longer statistically distinguishable from zero. In Panel A of Table 4 we find that such a point occurs on March 2002, December 2002, January 2003, and July 2002 for the G-Index value- and equal-weighted, and the E-Index value- and equal-weighted portfolios, respectively. On average, across the four governance portfolios considered, after August 2002 we find no more positive and statistically significant abnormal returns associated with governance trading strategies.
By construction, we should expect the point in time identified by this procedure to occur after the critical learning point, since the rolling alphas are estimated based on trailing 36-month data. Combined, the Quandt procedure should provide a lower bound for the critical learning point while the rolling alpha procedure should provide an upper bound for the critical learning point. Indeed, in our data we find that for each of the four governance portfolios considered, the break point identified by the Quandt procedure always precedes that obtained from the rolling alpha procedure.
Using the midpoint between the two dates as an approximation for the critical learning point, we find that this point occurs on March 2001, April 2002, October 2001, and September 2001 for the G-Index value- and equal-weighted, and the E-Index value- and equal-weighted portfolios, respectively. On average, we estimate the critical learning point to have occurred on October
8 We use the asymptotic distribution developed by Andrews (1993) for the maximum F-statistic to test the null hypothesis that α∆= 0 (that is, the change in post-period abnormal returns) for each of the estimated break points, and we reject the null hypothesis at the 1% level for the value-weighted portfolios but not for the equal-weighted portfolios.

15
2001. In other words, approximately by the end of 2001, sufficient learning about the significance of governance had occurred and markets have learned to appreciate the differences between good versus bad governance firms.
In Panel B of Table 4 we examine and compare the abnormal returns to governance portfolios for the 1991–2001 period and the post-2001 period of 2002–2008 by again regressing monthly returns of each governance strategy on the four factors. This time, however, we add a post-2001 time dummy, labeled “POST,” as well as interactions between each of the four factors with POST to account for the possibility that sensitivities to the factors may have also changed after 2001. Columns 1–4 report the estimation results of the regression using monthly returns from value-weighted and equal-weighted portfolios formed by going long the Democracy portfolio and short the Dictatorship portfolio based on the G-Index and the E-Index.
We find that all four trading strategies produce an average monthly alpha that is economically and statistically significant (at the 5% level) during the period 1990–2001. For our purposes, what is of special interest is the sum of the coefficients on the Alpha and POST variables, which reflects the post-2001 average monthly alpha. In all the columns, applying an F-test to the sum of the coefficients on Alpha and POST shows that, for the period 2002–2008, none of the four portfolios produces abnormal returns that are statistically different from zero at the 5% level. Specifically, the G-Index (E-Index) value-weighted portfolio produces 57 (111) basis points in the pre-period; the difference in the post-period abnormal monthly returns is very close in magnitude and statistically significant at the 5% (1%) level at -92 (-113) basis points, resulting in a post-period abnormal monthly return that is statistically no different from zero at the 5% level. The G-Index (E-Index) equal-weighted portfolio produces abnormal monthly returns of 49 (54) basis points in the pre-period which is statistically significant at the 5% (1%) level; F-test results show again that abnormal returns in the post-2001 period are not statistically different from zero at the 5% level. 3.3. Stock market reactions to earnings announcements
Following the approach introduced by LaPorta et al. (1997), we turn to market reactions to
earnings announcements as a tool for examining the extent to which markets were able to forecast differences in future profitability among firms. To the extent that market participants did not fully appreciate differences between well-governed and poorly governed firms during the 1990–2001 period, we expect the market to be more positively surprised by the earnings announcements of good-governance firms than by those of poor-governance firms. In contrast, to the extent that market participants in the aggregate had sufficiently learned to appreciate the difference between good-governance and poor-governance firms by the end of 2001, we should see no association between governance indices and market surprises around earnings announcements during the post-2001 period.
We construct a data set of quarterly earnings announcements data for firms in the IRRC data set. Earnings announcements are obtained from The Insitutional Brokers’ Estimate System
16
(I/B/E/S), for which we require each announcement to have at least one analyst forecast 30 days prior to the announcement, to have coverage in Compustat, and have returns data in CRSP. The resulting sample includes 100,317 earnings announcements from September 1990 to June 2008. As before, we remove all dual-class firms and REITs, leaving a total of 89,339 announcements. Announcement dates are obtained by combining I/B/E/S and Compustat; following DellaVigna and Pollet (2009), in cases where I/B/E/S and Compustat announcement dates differ, we assign the announcement date to be the earlier of the two dates.9
Around these announcement dates we compute stock returns. Following prior work (see, for example, Core et al., 2006), we consider the following earnings announcement return windows: from 20, 10, 5, 3, and 1 trading days prior to the earnings announcement until one day after the announcement. In addition to raw returns, we also calculate risk-adjusted excess returns as described below.
Following Giroud and Mueller (2011), we exclude from our regressions firms that are followed by fewer than five analysts. Firms in the IRRC data set are covered, on average, by nine analysts, and the excluded firms constitute less than 4.8% of the total market capitalization of IRRC firms. Firms followed by a significant number of analysts are the ones that attract significant attention from market participants and thus those with respect to which learning is more likely to occur. Our results continue to hold, but their statistical significance weakens somewhat, if we include firms that are followed by fewer than five analysts.
We begin by regressing returns accompanying earnings announcements on a governance index, the POST variable indicating whether the observation is from the post-2001 period, and an interaction of the governance index with the POST variable.
( ) 20}.{1,3,5,10,for 1, 321 ∈ +×⋅+⋅+⋅+=+− τεβββατ ittittiti POSTIndexPOSTIndexttr (2)
Under the learning hypothesis we are testing, we expect to see i) higher returns around the announcements of good-governance firms during 1990–2001 (β1 < 0), and ii) no association between governance and announcement returns during the post-2001 period (β1 + β3 = 0).
Columns 1–5 of Table 5 Panel A (B) report pooled OLS estimation results using the G-Index (E-Index). Each column looks at returns in one of the five windows of different lengths we examine. To account for possible autocorrelation and cross-sectional correlation in quarterly
9 Searching through Lexis-Nexis for the actual announcement date in the PR newswires, DellaVigna and Pollet (2009) find that the reported announcement date often reflects the date of publication in the Wall Street Journal, which may occur later than the actual announcement. In cases of disagreement among I/B/E/S and Compustat, the earlier date tends to be the correct one, while the latter date tends to reflect the WSJ publication date.
17
earnings surprises (e.g., see Bernard and Thomas, 1989, 1990), we report two-way cluster robust standard errors, clustering by firm and by year-quarter.10
In all ten regressions, the coefficient on the governance index used is negative, with statistical significance at the 5% level in nine regressions. Thus, whether using the G- or E-Index, and whatever window around the earnings announcement is used, the evidence is consistent with the hypothesis that market participants were more positively surprised by the earnings announcements of good-governance firms than by the announcements of poor-governance firms during the period 1990–2001. While we get statistical significance using either the G- or E-Index, all of our results using the E-Index are statistically stronger than the corresponding results using the G-Index.
In addition, in all ten regressions in Panel A, the coefficient on the interaction term between the POST variable and the governance index used is positive, with statistical significance at the 5% (10%) level for eight (nine) of the ten regressions. This evidence is consistent with a post-2001 erosion in the differential between good-governance and poor-governance firms in terms of generating positive market surprises by earnings announcements.
Furthermore, in most of the ten regressions, the coefficient on the interaction term (β3) is similar in magnitude to the coefficient on the governance index used in the regressions (β1). Indeed, in all ten regressions of Panels A and B, F-test results show that the relationship between governance and earnings surprises post-2001, β1 + β3, is statistically indistinguishable from zero at the 10% level. Thus, the evidence is consistent with the hypothesis that, by the end of 2001, the market had developed sufficiently accurate expectations for how differences between good-governance and poor-governance firms can be expected to manifest themselves in earnings announcements.
As a robustness check, we rerun all of the regressions using as a dependent variable the risk-adjusted excess returns in our various announcement windows rather than the raw returns. Specifically, we estimate each firm’s loadings on the Fama-French (1993) three factors using data from 21 to 210 trading days prior to the announcement date. Using each firm’s estimated factor sensitivities, we risk-adjust returns around announcements as follows:11
( ) ( ) ( ) ( ) ( )( )20}{1,3,5,10,for
1,ˆ1,ˆ1,ˆ1,1, ,,,
∈
+−++−++− −+−=+−
τ
τβτβτβττ ttrttrttrttrttr hmlhmlismbsmbimktrfmktrfiie
i (3)
10 Recent literature (e.g., see Petersen, 2009; Gow et al., 2010) has shown that in panel data settings where cross-sectional and time-series correlations exist in the error term, standard error estimates that account for only one of the two types of correlations can be often be downward-biased. 11 Including the intercept term and compounding the returns does not alter our results.
18
where rie (t – τ,t + 1) is the excess returns for firm i from τ trading days prior to until one trading
day after the announcement date (t), and ri (t – τ,t + 1), rmktrf (t – τ,t + 1), rsmb (t – τ,t + 1), and rhml
(t – τ,t + 1) are raw returns over the same period for firm i, the market factor (Mkt-Rf) factor, “small (market capitalization) minus big” (SMB) factor, and the “high (book-to-market ratio) minus low” (HML) factor, respectively.
Columns 6–10 of Table 5 Panel A (B) report regression results using the G-Index (E-Index). Our results are largely consistent with those obtained using raw returns. In particular, the coefficient on the governance index (β1) is negative in all ten regressions and statistically significant in nine of them (at the 1% level in eight of them); moreover, the coefficient on the interaction term (β3) is positive in all ten regressions and statistically significant in nine of them (at the 5% level in eight of them). Furthermore, this coefficient is similar in magnitude to that of the governance index used, and F-tests indicate that, in all ten regressions, β1 + β3 is not statistically different from zero at the 10% level, consistent with the possibility that markets were not differentially surprised by good-governance and poor-governance firms after 2001.
For robustness, we conduct further tests focusing on differences between firms with the best and worst governance scores, that is, firms in the Democracy and Dictatorship portfolios defined earlier. Table 6 reports estimation results of regressions that are similar to those reported in Table 5 but that limit the universe of firms to Democracy and Dictatorship firms and replace the governance indices used earlier with the DEMOCRACY dummy, indicating whether the firm belongs to the Democracy portfolio (DEMOCRACY = 1) or the Dictatorship portfolio (DEMOCRACY = 0). We thus test whether β1 > 0 and β1+β3 = 0 in the following specification.
( ) 20}.{1,3,5,10,for 1, 321 ∈ +×⋅+⋅+⋅+=+− τεβββατ ittittiti POSTDEMOPOSTDEMOttr (4)
The organization of Table 6 follows the format of Table 5 and the results are similar. The
coefficient on DEMOCRACY is positive in all regressions and statistically significant in all but one regression, consistent with the market being more positively surprised by the earnings announcements of Democracy firms than by those of Dictatorship firms during 1990–2001. The coefficients on the interaction between POST and DEMOCRACY are negative in all regressions and statistically significant in all but three regressions. Finally, F-tests show that in all regression specifications, β1 + β3 is not statistically different from zero, consistent with market participants no longer being differentially surprised by those two types of firms after 2001.
Our conclusions with regards to the relation between earnings announcement returns and corporate governance in the period 1990–2001 differ from those reached by Core et al. (2006) for the period 1990–1999. These authors’ analysis is based on constructing value-weighted Democracy (G) and Dictatorship (G) quarterly earnings announcement portfolios. They find that, during the 1990–1999 period, the Democracy (G) quarterly earnings announcement portfolios, on average, produce higher returns than those of the Dictatorship (G) quarterly earnings announcement portfolios; they find such a positive difference in all of their eight specifications
19
based on four announcement windows they examined and in both raw returns as well as in excess returns. However, these authors do not find these positive differences to be statistically significant at the 5% level in any of the specifications (although in some cases these differences are significant at the 10% level), and this lack of statistical significance leads them to conclude that, during the 1990s, the market was not more positively surprised by the quarterly announcements of Democracy (G) firms relative to Dictatorship (G) firms.
Our analysis differs from that of Core et al. (2006) along several dimensions, including differences in data construction and estimation specifications. For example, unlike Core et al., we apply a data filter which excludes dual-class firms and REITs following GIM (2003) and excludes firms followed by fewer than five analysts following Giroud and Mueller (2011); and we use not only the G-Index on which Core et al. focus but also the E-Index.12 In our online appendix, we replicate the results of Core et al., and conduct an analysis of what drives the differences between our results and theirs. This analysis indicates that the reasons why Core et al. do not obtain statistical significance for the positive differences between announcement returns for Democracy and Dictatorship firms during 1990–1999 was due to these authors (i) not using the above data filter, (ii) using only the G-Index and not also the E, and (iii) value-weighting observations by using value-weighted portfolios. For example, repeating the value-weighted portfolio analysis of Core et al. using the E-Index produces positive and statistically significant differences, with the magnitude and significance of these differences further strengthened when the above data filter is applied and/or when observations are equal-weighted by using equal-weighted portfolios.
Before concluding this section’s analysis, we conduct another robustness check. In their analysis, Core et al. (2006) suggest that, in analyzing differences in abnormal returns between Democracy and Dictatorship firms during a period of X days following an earnings announcement, one should first reduce the returns of Democracy firms by the average over-performance over the period of examination for a period of X days.13 For completeness of our
12 Other ways in which our data construction and estimation specifications differ from those in Core et al. (2006) are as follows. First, our data sample for the period from September 1990 to December 1999 is somewhat larger (by about 5%) because we achieved a fuller merge between the IRRC, Compustat, and I/B/E/S. Second, we obtain announcement dates using the approach developed by Della Vigna and Pollet (2009) subsequent to the work of Core et al. (2006). Third, our overall sample contains more years, spanning from September 1990 to June 2008. Fourth, our estimation specifications use as units of observation firm-quarter earnings announcement returns; in contrast, Core et al. construct quarterly portfolios of earnings announcement returns. 13 For example, when looking at a five-day window around earnings announcements, one first computes the average per-year abnormal returns R from a trading strategy that goes long a portfolio of Democracy firms and short a portfolio of Dictatorship firms (a la GIM). Then, to obtain the average outperformance of Democracy firms over a five-day window, one computes (1+R)5/252-1.
While Core et al. (2006) make such an adjustment, other studies that examine how abnormal returns are related to governance indices [e.g., the analysis by Masulis, Wang, and Xie (2007) of how abnormal returns following acquisition announcement are governance indices in general and differences between Democracy and Dictatorship firms in particular] do not make such adjustments.
20
analysis, we check and report in our online appendix that our results are robust to making such an adjustment. In particular, we rerun all the specifications of Table 6 columns 6–10 (which focus on the differences in abnormal returns around earnings announcements between Democracy and Dictatorship firms) using such adjustments. With such adjustments, the regression coefficients decline in magnitude but they remain generally significant. 14
Thus, our findings in this section are consistent with the learning hypothesis that (i) during 1990–2001 the market did not fully absorb the significance of the provisions in the governance indices and was consequently more positively surprised by the earnings announcements of good-governance firms than by those of poor-governance firms, and (ii) after 2001, market participants sufficiently recognized the difference between good-governance and bad-governance firms so that they were not differentially surprised by the earnings announcements of these different types of firms. 3.4. Analyst forecast surprises
If the market was more likely to be positively surprised by the earnings announcements of
some firms, one might also wonder whether analysts were also more positively surprised by the announcements of such firms. Because there is evidence indicating the possibility that I/B/E/S data on analysts are not fully reliable (see, e.g., Ljungqvist et al., 2009), because stock prices are determined by market participants in the aggregate rather than analysts alone, and because the market learns a substantial amount of non-earnings-specific information around earnings announcements (see, e.g., Francis, Schipper, and Vincent, 2002; Hutton, 2005), we believe that tests based on differences between earnings announcements and analyst forecasts are likely to be less telling than tests based on market reactions reflected in stock returns. Nonetheless, we complement our analysis of such market reactions with an analysis of the relationship between analyst surprises and governance scores in different periods.
We use analyst forecasts from I/B/E/S as in the previous section, and we again exclude firms followed by fewer than five analysts. We continue to use quarterly earnings announcements, matching them with the corresponding analyst forecasts. We define “consensus forecasted
14 For example, after making such adjustments to the value-weighted portfolio approach of Core et al., we find that prior to the end of 2001, Democracy (G) [E] portfolios have statistically higher abnormal earnings announcement returns than the Dictatorship (G) [E] portfolios at the 10% level in 4 of the 5 [3 of the 5] event windows examined; however, post-2001 Democracy (G) [E] portfolios’ average abnormal earnings announcement returns are statistically no different than those of the Dictatorship (G) [E] portfolios at the 10% level in all 5 [4 of the 5] event windows examined. Similarly, by making such adjustments to an equal-weighted portfolio approach, we find that prior to the end of 2001, Democracy (G) [E] portfolios have statistically higher abnormal earnings announcement returns than the Dictatorship (G) [E] portfolios at the 10% level in 3 of the 5 [all 5] event windows examined; however, post-2001 Democracy (G) [E] portfolios’ average abnormal earnings announcement returns are statistically no different than those of the Dictatorship (G) [E] portfolios at the 10% level in 4 of the 5 [4 of the 5] event windows examined.
21
earning” as the mean analyst forecast on the closest date prior to the last day of the fiscal period, and define forecast error (FE) as equal to the actual earnings announced by a firm minus the consensus forecasted earnings. We chose quarterly earnings as the unit of analysis because such a choice is consistent with our earlier analysis on the returns around quarterly earnings announcements and because using quarterly earnings (as opposed to annual earnings) provides us with a more comprehensive sample of observations.
The literature uses different measures of analyst surprise, with none appearing to be theoretically superior. We therefore examine four empirical measures of analyst surprise commonly used in the literature: forecast error scaled by price measured at the forecast date (FE scaled by price) (e.g., Core et al., 2006; Lim, 2001); forecast error scaled by total assets per share from the previous quarter end (FE scaled by assets) (e.g., Core et al., 2006; Giroud and Mueller, 2011); forecast error scaled by the standard deviation of analyst forecasts (SUE) (e.g., Mendenhall, 2004; Jegadeesh and Livnat, 2006); and the percent forecast error (FE (%)), i.e., forecast error scaled by the absolute value of mean analyst forecast (e.g., Philbrick and Ricks, 1991; Higgins, 1996).
Since all four analyst surprise variables are highly negatively skewed, we estimate quantile (median) regressions.15 Specifically, for each of the surprise variables, we estimate pooled median regressions using as explanatory variables a governance variable (G-Index, E-Index, Democracy (G), or Democracy (E)), the POST indicator for observations after 2001, and an interaction of the governance variable and the POST indicator. Following Core et al. (2006), we control for the log market capitalization and the log book-to-market ratio, both measured at the end of the previous fiscal quarter. Again, to account for the possibility of time-series as well as cross-sectional correlation in analyst surprises, we report bootstrapped two-way cluster robust standard errors, clustering by firm and year-quarter. Results of the pooled median regression estimation are reported in Panels A and B of Table 7.
In general, our evidence on analyst surprises is consistent with the findings in Tables 5 and 6 based on surprises captured in market reactions to earnings announcements. Specifically, we find that in the pre-2001 period, better-governed firms are more likely to have good surprises, and vice versa. The coefficients of the governance variables are negative in all eight regressions in Panel A, which use the G-Index (columns 1–4) and the E-Index (columns 5–8), and statistically significant at the 5% level in four out of the eight regressions. In particular, we obtain statistical significance in all four specifications using the E-Index.
The coefficients of the governance variables are positive in five of the eight regressions in Panel B, which use the Democracy (G) (columns 1–4) and the Democracy (E) (columns 5–8), and statistically significant at the 5% level in four out of the eight regressions. Again, statistical 15 In our sample, FE scaled by price, FE scaled by assets, SUE, and FE (%) exhibit skewness coefficients of -139.68, -22.33, -11.22, -20.74, respectively. The rule of thumb is that a skewness coefficient greater than 1.0 in absolute value indicates a highly skewed distribution (Bulmer, 1979).

22
significance is obtained for those specifications that use the Democracy (E) indicator. These findings are consistent with the possibility that, during the 1990–2001 period, earnings announcements of good-governance firms were more likely to represent a meaningful positive surprise relative to analyst forecasts than the announcements of poor-governance firms.
In Panel A, we also find the coefficient on the interaction term between the governance variable and the POST indicator to be positive in five of the eight regressions, with statistical significance in three of them. Similarly, in Panel B we find the coefficient on the interaction term to be negative in five of the eight regressions, with statistical significance in three of them. Moreover, examining the sum of the coefficient of the governance variable and the variable interacting governance with POST, F-tests indicate that in 14 of the 16 regressions reported in Panels A and B of Table 7, the associations between analyst surprises and governance are statistically indistinguishable from zero in the post-2001 period. This is consistent with the possibility that, after 2001, good-governance firms were no longer more likely to generate meani ngful analyst surprises than poor-governance firms.
It is worth commenting on the relationship between our results in this section to those of Core et al. (2006) and Giroud and Mueller (2011). Unlike our results, Core et al. (2006), studying analyst surprises during the period from January 1991 to December 1999, find that firms with poor governance tend to have more positive analyst surprises, although they do not find this difference to be statistically significant. Giroud and Mueller (2011), examining the same period, find, as we do, that analyst surprises (as measured by FE scaled by total assets) are higher for Democracy (G) firms; however, they do not find such a difference to be statistically significant.16
The analyses of Core et al. (2006) and Giroud and Mueller (2011) differ from each other as well as differ from our analysis in terms of data construction and estimation specification. We have therefore conducted an analysis of what drives the differences in results between these two papers as well as between each of them and ours, and we provide the results of this reconciliation analysis in our online appendix. The analysis indicates that the key reason why both Giroud and Mueller and we get positive association between good governance and positive analyst surprises, but Core et al. get a negative association, is the use of data filters.
Unlike Core et al., both Giroud and Mueller and we exclude dual-class firms and firms followed by fewer than five analysts. The reason why the positive association between good governance and positive analyst surprises is significant in some of our specifications, but not in those of Giroud and Mueller, is that they use only the G-Index and we also use the E-Index. Recall that our results in Table 7 are statistically significant when we use the E-Index, which excludes the “noise” introduced by governance provisions that do not matter.
16 They do find this difference to be statistically significant among the firms in the least competitive industries, which are a main focus of their (but not our) paper.
23
In summary, as with market surprises around earnings announcements, the evidence discussed in this section is also consistent with the hypothesis that, by the end of 2001, market players had internalized the difference between good-governance and poor-governance firms (as those firms are defined by the governance indices). 3.5. Operating performance and Tobin’s Q
Under the learning hypothesis, good governance will continue to be associated with higher
firm value and better operating performance after the learning period. In particular, the learning hypothesis says that good governance will cease to be associated with abnormal returns after the end of the learning period simply because the improved performance associated with good governance will become factored into market prices.
We begin by looking at the relationship between the governance indices and Tobin’s Q. Tobin’s Q has long been used in the governance literature as a key measure of firm value and performance.17 GIM (2003) report a strong and negative association between the G-Index and Tobin’s Q from 1990 to 1999, and BCF (2009) find a strong and negative association between the E-Index and Tobin’s Q from 1992 to 2002. Following prior work, we use the definition of Tobin’s Q in Kaplan and Zingales (1997),18 and we use as the dependent variable the log of industry-median-adjusted Tobin’s Q, defined as the log of a firm’s Q divided by the industry’s median Q, using the Fama-French 48 industry definitions.
In row 1 of Table 8 Panel A, we report results from pooled regressions of industry-adjusted Tobin’s Q on the governance indices. As controls, we use all the variables used as controls in BCF (2009), who in turn used the same controls of GIM (2003) with a few additions:19 log of the book value of assets in the current fiscal year, log of company age measured in months as of December of each year, a dummy for incorporation in Delaware, insider ownership, square of inside ownership, ROA (the ratio of income before extraordinary items to assets at the beginning of the fiscal year) in the current fiscal year, CAPEX/assets (the ratio of capital expenditures to assets) in the current fiscal year, leverage in the current fiscal year, R&D expenditures per sales in the current fiscal year, and dummies for missing R&D expenditure data and missing inside ownership data. Data on all these standard controls are taken from Compustat. To account for both cross-sectional and time-series correlation in the data, we estimate two-way cluster robust
17 See, e.g., Demsetz and Lehn (1985), Morck et al. (1988), McConnell and Servaes (1990), Lang and Stulz (1994), and LaPorta et al. (2002). 18 Under this definition, Tobin’s Q is the market value of assets divided by the book value of assets plus the market value of common stock less the sum of book value of common stock and balance sheet deferred taxes. 19 Using only the controls employed by GIM, with no additions, yields similar results.
24
standard errors, clustering by year and by firm. We pooled two time periods in our regressions, 1990–2001 and 2002–2008.
Our results show that both the G-Index and E-Index are negatively associated with Tobin’s Q both during 1990–2001 and during 2002–2008. Both the magnitudes and the statistical significance of the coefficients on the governance indices remained stable across the two periods.
In addition to Tobin’s Q, we also examine several operating performance metrics: ROA (defined as the ratio of net income before extraordinary items to assets at the beginning of the fiscal year), five-year, three-year, and one-year sales growth (the ratio of total sales in the current fiscal year to the total sales of five, three, and one fiscal years ago, respectively), and net profit margin (the ratio of net income before extraordinary items to sales in the current fiscal year). As with Q, these dependent variables are adjusted by their industry-median values in the same fiscal year, using the Fama-French 48 industry classifications.
Rows 2–6 of Table 8 Panel A report the results of pooled regressions of industry-adjusted operating performance measures on governance indices and controls. As controls in each of these pooled regressions, we include log of the book-to-market ratio from the previous fiscal year, log of total assets, log of company age, an indicator for Delaware incorporation, inside ownership, square of inside ownership, CAPEX/assets, and R&D per sales, dummies for missing R&D expenditure data and missing inside ownership data, as well as year and industry fixed effects. We estimate two-way cluster robust standard errors, clustering by firm and year.
As with Q, we find in general the association between the governance indices and operating performance to be negative and statistically significant both in the period 1990–2001 and also 2002–2008, with the magnitude and statistical significance of the coefficient on the governance index to be stable across the two periods. For net profit margin, we find the association to strengthen in the period 2002–2008. Panel B of Table 8 uses Democracy (G) and Democracy (E) as the primary independent variables of interest, and yields qualitatively similar results to those obtained using the G-Index and E-Index.
We can thus conclude that, while the association between the governance indices and abnormal returns did not exist after the period for which it was identified, the relationship of governance indices with Tobin’s Q and firm operating performance measures found by prior work persisted throughout our sample period 1990–2008. While the difference between good-governance and bad-governance firms was no longer a surprise to market participants, it remained in place and continued to be reflected in firms’ operating performance and Tobin’s Q. This finding also indicates that, even though the G-Index and E-Index can no longer generate abnormal trading profits, they remain a valuable tool for researchers, investors, and policymakers.
Of course, the persistent relation between governance indices and the value and performance of firms raises causality questions. To what extent is the relationship due to governance provisions weakening shareholders rights being a cause of worse firm performance and to what extent are such provisions merely a signal, reflecting the tendency of firms with poor performance to have such provisions? The literature has not been able to resolve fully these

25
questions.20 Because governance provisions are publicly known, however, whether such provisions are a causal force or merely a signal, the ability to use information about such provisions to generate trading profits requires explaining. Our findings in this paper indicate that markets have learned over time to appreciate the differences between firms scoring well and poorly according to the governance indices. However, these findings do not resolve the causality questions—which the literature has generally been unable to resolve—concerning the extent to which governance provisions directly cause or merely signal the worse performance of the firms having them. 3.6. Other factor models
As discussed earlier, an alternative explanation to the learning explanation is that the four-
factor model we employ to estimate abnormal returns is misspecified. An omitted risk factor that is positively correlated with the G- and E-Index can account for the existence of abnormal returns in the four-factor model. If an alternative factor model explains asset returns, it must also explain the post-2001 disappearance in governance abnormal returns derived from the four-factor model, which can occur if the risk premium associated with the unobserved and confounding risk factors became very small or non-existent during the period 2002–2008.
To examine the possibility that an alternative pricing model explains the pattern of abnormal returns observed in the standard four-factor model, we consider four alternative factor models. In each of the four variations we include alternative factors to the regression specification of (1), but also include interaction terms with the POST 2001 dummy with each of the factors. For ease of presentation, we report in Table 9 only the coefficients on the constant term and POST 2001 indicator, as well as the p-value on F-test for the null hypothesis that the sum of the coefficients is zero. Panel A of Table 9 reports results for the G-Index trading strategy, and Panel B of Table 9 reports results for the E-Index trading strategy. Both panels follow the same structure.
In row 1 we consider a four-factor model that uses, instead of the Carhart momentum factor, the UMD momentum factor constructed by Fama and French (1996). These two measures are similar, but the construction of UMD uses an additional sort based on size. Using the UMD, our results are qualitatively similar to those obtained using the Fama-French-Carhart four-factor model, with positive average monthly abnormal returns observed until the end of 2001 and none subsequently.
In rows 2–4 we consider three five-factor models which add to the three Fama-French factors and the Carhart momentum factor an additional fifth risk factor. In row 2, we include as the fifth risk factor the liquidity factor of Pastor and Stambaugh (2003), a factor which reflects the level
20 Works seeking to shed some light on the causality question include GIM (2003), Bebchuk and Cohen (2005), and Cremers and Ferrell (2010).
26
of market-wide liquidity in a given month. 21 The results indicate that the inclusion of the liquidity factor produces results qualitatively similar to those obtained using the four-factor model.
Row 3 includes as a fifth risk factor the downside risk factor of Ang et al. (2006), a factor which reflects the downside movement of the market and which we construct following the description in Ang et al. (2006). As the results in row 3 indicate, with the inclusion of the downside risk factor, the results remain qualitatively similar to those obtained using the four-factor model.
Next, row 4 includes as the fifth risk factor the takeover factor of Cremers et al. (2009), which we obtained from these authors.22 This factor reflects the spread between firms that are most likely to be exposed to takeovers and firms that are least likely to be exposed to takeovers. Consistent with Cremers et al. (2009) and Giroud and Mueller (2011), we find that the inclusion of the takeover factor in general weakens our results using the G-Index portfolios. However, we still find that, during the “learning period” of 1990–2001, the GIM value-weighted portfolio generated positive excess returns of 47 basis points, which is statistically significant at the 10% level.
We also find that the POST coefficient is negative and statistically significant at the 10% level, and that the sum of the constant and POST results in average abnormal monthly returns for the 2002–2008 period is statistically indistinguishable from zero at the 10% level. Furthermore, the value-weighted E-Index portfolio produces the same patterns in returns as those obtained for the four-factor model, with the results retaining strong statistical significance. Although the equal-weighted G-Index and E-Index portfolios do not obtain statistical significance, the constant and POST coefficients still have the same sign and similar magnitude to those obtained using the four-factor model. Thus, the additional common risk factors thus far put forward in the literature cannot fully explain the existence of a governance-returns correlation during 1990–2001 and its subsequent disappearance.
3.7. Robustness checks
Before concluding, we conduct robustness checks with respect to our results concerning the
differences between the 1990–2001 and 2002–2008 periods in terms of (i) abnormal returns on the governance strategies based on the G-Index and E-Index, (ii) how good-governance and poor-governance firms differed in the abnormal returns accompanying earnings announcements,
21 Obtained from the Web site of Lubos Pastor: http://faculty.chicagobooth.edu/lubos.pastor/research/liq_data_1962_2008.txt. 22 We are grateful to Martin Cremers for making data available to us. The data on the takeover factor provided by the authors range from January 1991 to December of 2003; therefore, all our regressions involving the takeover factor only contain 156 months of data, with 24 months in the post 2001-period.
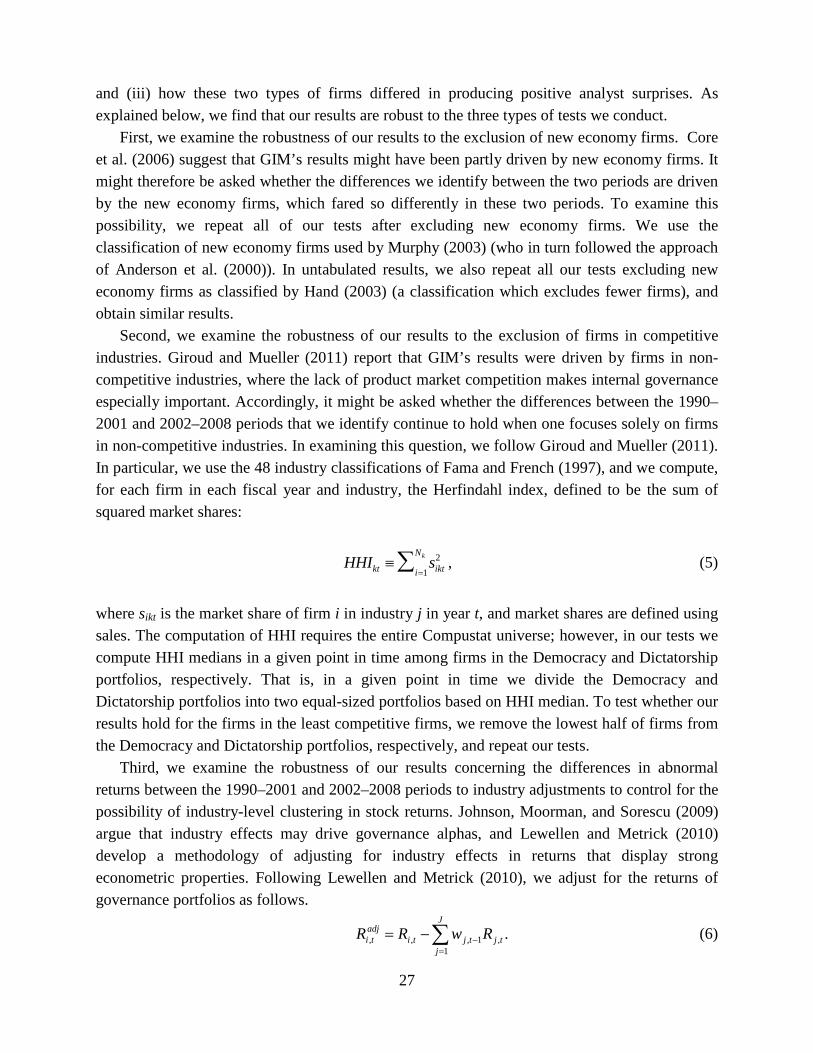
27
and (iii) how these two types of firms differed in producing positive analyst surprises. As explained below, we find that our results are robust to the three types of tests we conduct.
First, we examine the robustness of our results to the exclusion of new economy firms. Core et al. (2006) suggest that GIM’s results might have been partly driven by new economy firms. It might therefore be asked whether the differences we identify between the two periods are driven by the new economy firms, which fared so differently in these two periods. To examine this possibility, we repeat all of our tests after excluding new economy firms. We use the classification of new economy firms used by Murphy (2003) (who in turn followed the approach of Anderson et al. (2000)). In untabulated results, we also repeat all our tests excluding new economy firms as classified by Hand (2003) (a classification which excludes fewer firms), and obtain similar results.
Second, we examine the robustness of our results to the exclusion of firms in competitive industries. Giroud and Mueller (2011) report that GIM’s results were driven by firms in non-competitive industries, where the lack of product market competition makes internal governance especially important. Accordingly, it might be asked whether the differences between the 1990–2001 and 2002–2008 periods that we identify continue to hold when one focuses solely on firms in non-competitive industries. In examining this question, we follow Giroud and Mueller (2011). In particular, we use the 48 industry classifications of Fama and French (1997), and we compute, for each firm in each fiscal year and industry, the Herfindahl index, defined to be the sum of squared market shares:
HHIkt ≡ sikt2
i=1
Nk∑ , (5)
where sikt is the market share of firm i in industry j in year t, and market shares are defined using sales. The computation of HHI requires the entire Compustat universe; however, in our tests we compute HHI medians in a given point in time among firms in the Democracy and Dictatorship portfolios, respectively. That is, in a given point in time we divide the Democracy and Dictatorship portfolios into two equal-sized portfolios based on HHI median. To test whether our results hold for the firms in the least competitive firms, we remove the lowest half of firms from the Democracy and Dictatorship portfolios, respectively, and repeat our tests.
Third, we examine the robustness of our results concerning the differences in abnormal returns between the 1990–2001 and 2002–2008 periods to industry adjustments to control for the possibility of industry-level clustering in stock returns. Johnson, Moorman, and Sorescu (2009) argue that industry effects may drive governance alphas, and Lewellen and Metrick (2010) develop a methodology of adjusting for industry effects in returns that display strong econometric properties. Following Lewellen and Metrick (2010), we adjust for the returns of governance portfolios as follows.
∑=
−−=J
jtjtjti
adjti RwRR
1,1,,, . (6)

28
That is, the return for a firm i (from the Democracy or Dictatorship portfolios) from t-1 to t is adjusted by the weighted-average return from the set of all firms J from CRSP which share the same industry classification as i. We use beginning-of-month market capitalization as weights and, consistent with our earlier results, continue to use the Fama-French 48 industry classification. After adjusting for industry effects in this way, we compute the value- and equal-weighted G-Index and E-Index portfolios by using industry-adjusted returns in place of raw stock returns.
Table 10 displays the results of the three types of robustness tests that we conduct. Panel A of Table 10 reports the results of robustness tests for our results on abnormal returns to governance strategies (see Table 4). We find that, after excluding new economy firms, excluding firms in more competitive industries, and adjusting for industry effects, we still obtain consistent and persistent evidence that after 2001, there is a statistically and economically significant decline in the abnormal returns generated by trading on the governance indices. For each of the three cuts of the data—excluding new economy firms, excluding the lower half of HHI firms among the Democracy and Dictatorship portfolio firms, respectively, and adjusting for industry returns—we consider abnormal returns from going long (short) on Democracy (Dictatorship) firms, defined by E and G, both using market-value-weighted and equal-weighted portfolios. Altogether, we conduct in this way a total of 3x2x2 = 12 robustness tests. In 11 of the 12 tests of Panel A, we find statistically significant average monthly abnormal returns from 1990 to 2001. Moreover, in all the 12 tests of Panel A, F-tests indicate that after 2001, average abnormal returns are statistically indistinguishable from zero.
Panel B of Table 10 displays the results of robustness tests for our results relating earnings announcement returns to governance indices (see Table 6). While we report only results from a window of five trading days prior to until one day after the earnings announcement date, we also conduct robustness tests using all other windows considered in Tables 5 and 6 and obtain similar results. For each of the two cuts of data—excluding new economy firms, and excluding the lower half of HHI firms among the Democracy and Dictatorship portfolio firms, respectively—we conduct tests using Democracy (Dictatorship) definitions based on G and E, and we consider raw returns as well as returns in excess of the Fama-French three factors. Thus, we conduct a total of 2x2x2 = 8 robustness tests. All eight robustness tests in Panel B of Table 10 indicate that the market is more positively surprised by good-governance firms than bad-governance firms during the period 1990–2001. Moreover, in all eight tests we find that, during the 2002–2008 period, there is no statistically significant difference in the market’s reaction around earnings announcements of good-governance versus bad-governance firms.
Finally, Panel C of Table 10 conducts robustness tests for our results relating analyst surprises to governance indices (see Table 7). Here, we rerun the pooled median regressions of Table 7 for each of two cuts of the data—excluding new economy firms, and excluding the lower half of HHI firms among the Democracy and Dictatorship portfolio firms, respectively. Because we rerun the regressions using Democracy (Dictatorship) firms based on either G or E definitions, as well as use the four analyst surprise variables (FE scaled by price, FE scaled by
29
assets, SUE, and FE(%)) used in Table 7, we run a total of 2x2x4 = 16 robustness tests. In 12 of the 16 tests, we find that analysts are more likely to be positively surprised by good-governance firms during the period 1990–2001, with eight of the 16 tests showing statistical significance at the 5% level. In contrast, for the 2002–2008 period, this relationship no longer holds in 13 of the 16 robustness tests.
4. Conclusion This paper has sought to help resolve the questions arising from the well-known and
intriguing finding of an association between and abnormal returns during the 1990s and the G-Index and E-index governance indices. After showing that the association ceased to exist during the 2000s, we provided evidence that can help explain both the existence of the association during the 1990s and its subsequent disappearance. In particular, our analysis provides evidence consistent with the hypothesis that both the existence and disappearance of the governance-returns correlation were due to market participants’ learning during the 1990s to appreciate the difference between firms scoring well and poorly on the governance indices.
Consistent with the learning hypothesis, we find that (i) the disappearance of the governance-return correlation was associated with an increase in the attention to governance by a wide range of market participants; (ii) the structural break in the returns to governance strategies corresponded to the timing of the sharp rise in the attention to governance; (iii) until the beginning of the 2000s, but not subsequently, stock market reactions to earnings announcements reflected the market being more positively surprised by the earnings announcements of good-governance firms than by those of poor-governance firms; (iv) analysts were also more positively surprised by the earnings announcements of good-governance firms than by those of poor-governance firms until the beginning of the 2000s but not afterwards; (v) while the G and E indices could no longer generate abnormal returns in the 2000s, their negative association with Tobin’s Q and operating performance persisted; and (vi) the existence and subsequent disappearance of the governance-return correlation cannot be explained by any of the factors that have been suggested in the literature for augmenting the Fama-French-Carhart four-factor model. Our results are robust to excluding new economy firms, excluding firms in non-competitive industries, and adjusting for industry returns.
By explaining both the presence during the 1990s and the subsequent disappearance of a correlation between returns and the governance indices, our findings resolve a puzzle posed by the existing literature, However, by showing that the governance indices remain associated with firm value and operating performance notwithstanding the disappearance of their correlation with returns, our work indicates that these indices continue to offer a potentially effective tool for researchers and market participants. We hope that our findings will be useful to subsequent work on corporate governance and on learning in capital markets.
R-1
References Anderson, M., Banker, R., Ravindran, S., 2000. Executive compensation in the information
technology industry. Management Science 46, 530–547. Andrews, D., 1993. Tests for parameter instability and structural change with unknown change
point. Econometrica 61, 821–856. (corrigendum. Econometrica 71, 395–397.) Ang, A., Chen., J., Xing, Y., 2006. Downside Risk. Review of Financial Studies 19, 1191–1239. Bebchuk, L., Cohen, A., 2005. The costs of entrenched boards. Journal of Financial Economics
78, 409–433. Bebchuk, L., Cohen, A., Ferrell, A., 2009. What matters in corporate governance. Review of
Financial Studies 22, 783–827. Bernard, V., Thomas, J., 1989. Post-earnings announcement drift: delayed price response or risk
premium? Journal of Accounting Research 27, 1–36. Bernard, V., Thomas, J., 1990. Evidence that stock prices do not fully reflect the implications of
current earnings for future earnings. Journal of Accounting and Economics 13, 305–341. Brav, A., Heaton, J., 2002. Competing theories of financial anomalies. The Review of Financial
Studies 15, 575–606. Bulmer, M., 1979. Principles of Statistics. Dover Publications, New York. Carhart, M., 1997. On persistence in mutual fund performance. Journal of Finance 52, 57–82. Cochrane, J., 1999. New facts in finance. Economic Perspectives 23, 36–58. Core, J., Guay, W., Rusticus, T., 2006. Does weak governance cause weak stock returns? An
examination of firm operating performance and investors’ expectations. Journal of Finance 61, 655–687.
Cremers, M., Ferrell, A., 2010. Thirty years of corporate governance: firm valuation and stock
returns. Unpublished working paper. Yale University and Harvard University. Cremers, M., Nair, V., John, K., 2009. Takeovers and the cross-section of returns. Review of
Financial Studies 22, 1409–1445.
R-2
Daniel, K., Titman, S., 1999. Market efficiency in an irrational world. Financial Analysts Journal 55, 28–40.
DellaVigna, S., Pollet, J., 2009. Investor inattention and Friday earnings announcements. Journal
of Finance 64, 709–749. Demsetz, H., Lehn K., 1985. The structure of corporate ownership: causes and consequences.
Journal of Political Economy 93, 1155–1177. Dittmar, A., Mahrt-Smith, J., 2007. Corporate governance and the value of cash holdings.
Journal of Financial Economics 83, 599–634. Fama, E., 1970. Efficient capital markets: a review of theory and empirical work. Journal of
Finance 25, 383–417. Fama, E., French, K., 1993. Common risk factors in the returns on bonds and stocks. Journal of
Financial Economics 33, 3–53. Fama, E., French, K., 1996. Multifactor explanations of asset pricing anomalies. Journal of
Finance 51, 55–87. Fama, E., French, K., 1997. Industry costs of capital. Journal of Finance 47, 427–465. Francis, J., Schipper, K., Vincent, L., 2002. Expanded disclosures and the increased usefulness
of earnings announcements. Accounting Review 77, 515–546. Georgeson Shareholder, 2003. Annual Corporate Governance Review. Georgeson, Inc., New York. Giroud, X., Mueller, H., 2011. Corporate governance, product market competition, and equity
prices. Journal of Finance 46, 563–600. Gompers, P., Ishii, J., Metrick, A., 2003. Corporate governance and equity prices. Quarterly
Journal of Economics 118, 107–155. Gow, I., Ormazabal, G., Taylor, D., 2010. Correcting for cross-sectional and time-series
dependence in accounting research. Accounting Review 85, 483–512. Hand, J., 2003. Profits, losses and the nonlinear pricing of Internet stocks. In: Hand, J., Lev, B.
(Eds.), Intangible Assets: Values, Measures, and Risks. Oxford University Press, New York, pp. 248–268.
R-3
Higgins, H., 1996. Analyst forecasting performance in seven countries. Financial Analysts Journal 54, 58–62.
Hutton, A., 2005. Determinants of managerial earnings guidance prior to Regulation Fair
Disclosure and bias in analysts’ earnings forecasts. Contemporary Accounting Research 22, 867–914.
Ikenberry, D., Lakonishok, J., Vermaelen, T., 1995. Market underreaction to open market share
repurchases. Journal of Financial Economics 39, 181–208. Investor Responsibility Research Center (IRRC) 1990, 1993, 1995, 1998, 1999, 2002, 2004,
2006). Corporate Takeover Defenses. Jegadeesh, N., Livnat, J., 2006. Post-earnings-announcement drift: the role of revenue surprises.
Financial Analysts Journal 62, 22–34. Johnson, S., Moorman, T., Sorescu, S., 2009. A reexamination of corporate governance and
equity prices. Review of Financial Studies 22, 4753–4786. Kaplan, S., Zingales, L., 1997. Do investment-cash flow sensitivities provide useful measures of
financing constraints? Quarterly Journal of Economics 112, 169–216. La Porta, R., Lakonishok, J., Shleifer, A., Vishny, R., 1997. Good news for value stocks: further
evidence on market efficiency. Journal of Finance 52, 859–874. La Porta, R., Lopez-de-Silanes, F., Shleifer, A., Vishny, R., 2002. Investor protection and
corporate valuation. Journal of Finance 57, 1147–1170. Lang, L., Stulz, R., 1994. Tobin’s Q, corporate diversification, and firm performance. Journal of
Political Economy 102, 1248–1280. Lewellen, S., Metrick, A., 2010. Corporate governance and equity prices: are results robust to
industry adjustments? Unpublished working paper. Yale University. Lim, T., 2001. Rationality and analysts’ forecast bias. Journal of Finance 56, 369–385. Ljungqvist, A., Malloy, C., Marston, F., 2009. Rewriting history. Journal of Finance 64, 1935–
1960. Masulis, R., Wang, C., Xie, F., 2007. Corporate governance and acquirer returns. Journal of
Finance 39, 1851–1889.
R-4
McConnell, J., Servaes, H., 1990. Additional evidence on equity ownership and corporate value. Journal of Financial Economics 27, 595–612.
Mendenhall, R., 2004. Arbitrage risk and post-earnings-announcement drift. Journal of Business
77, 875–894. Michaely, R., Thaler, R., Womack, K., 1995. Price reactions to dividend initiations and
omissions. Journal of Finance 38, 1597–1606. Morck, R., Shleifer, A., Vishny, R., 1988. Management ownership and market valuation: an
empirical analysis. Journal of Financial Economics 20, 293–315. Murphy, K., 2003. Stock-based pay in new economy firms. Journal of Accounting and
Economics 34, 129–147. Newey, W., West, K., 1987. A simple, positive semi-definite, heteroskedasticity and
autocorrelation consistent covariance matrix. Econometrica 55, 703–708. Pastor, L., Stambaugh, R., 2003. Liquidity risk and expected stock returns. Journal of Political
Economy 111, 642–685. Petersen, M., 2009. Estimating standard errors in finance panel data sets: comparing approaches.
Review of Financial Studies 22, 435–480. Philbrick, D., Ricks, W., 1991. Using value line and IBES analyst forecasts in accounting
research. Journal of Accounting Research 29, 397–417. Quandt, R., 1960. Tests of the hypothesis that a linear regression system obeys two separate
regimes. Journal of the American Statistical Association 55, 324–330. Schwert, G., 2003. Anomalies and market efficiency. In: Constantinides, G., Harris, M., Stulz, R.
(Eds.), Handbook of the Economics of Finance, vol. 1 (chapter 15). North-Holland, Amsterdam, pp. 939–974.
Shleifer, A., Vishny, R., 1997. The limits of arbitrage. Journal of Finance 52, 35–55. White, H., 1980. A heteroskedasticity-consistent covariance matrix estimator and a direct test for
heteroskedasticity. Econometrica 48, 817–838.
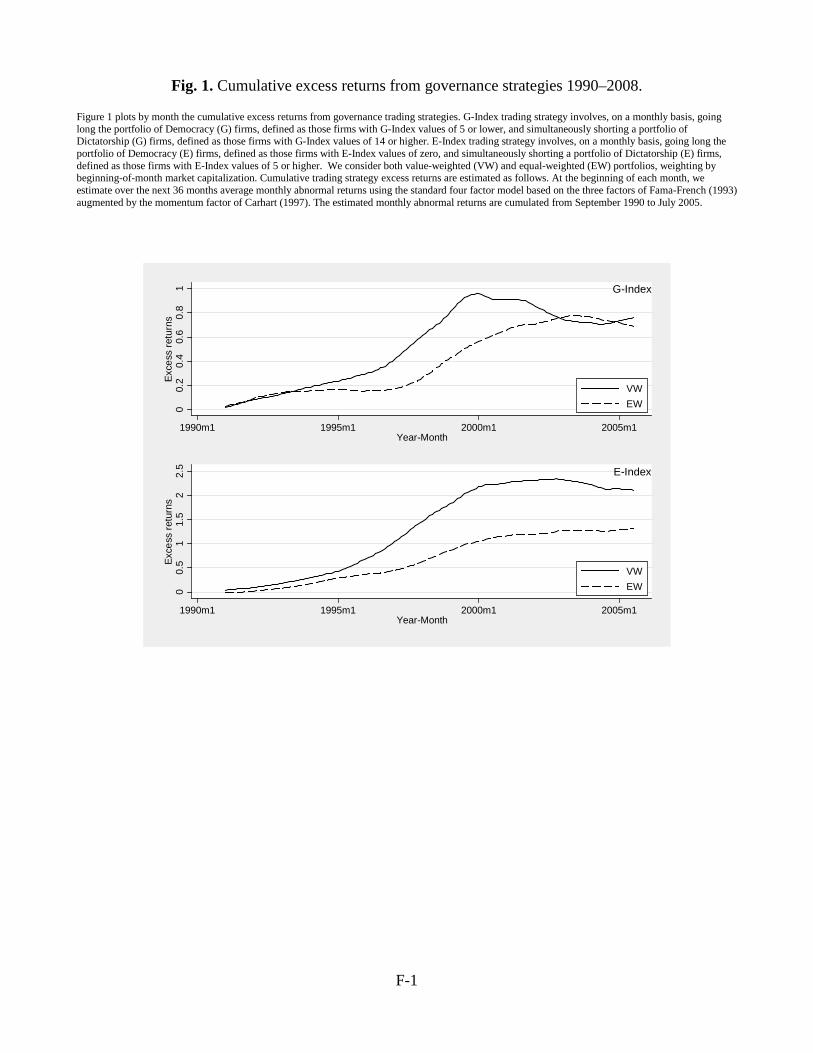
F-1
Fig. 1. Cumulative excess returns from governance strategies 1990–2008.
Figure 1 plots by month the cumulative excess returns from governance trading strategies. G-Index trading strategy involves, on a monthly basis, going long the portfolio of Democracy (G) firms, defined as those firms with G-Index values of 5 or lower, and simultaneously shorting a portfolio of Dictatorship (G) firms, defined as those firms with G-Index values of 14 or higher. E-Index trading strategy involves, on a monthly basis, going long the portfolio of Democracy (E) firms, defined as those firms with E-Index values of zero, and simultaneously shorting a portfolio of Dictatorship (E) firms, defined as those firms with E-Index values of 5 or higher. We consider both value-weighted (VW) and equal-weighted (EW) portfolios, weighting by beginning-of-month market capitalization. Cumulative trading strategy excess returns are estimated as follows. At the beginning of each month, we estimate over the next 36 months average monthly abnormal returns using the standard four factor model based on the three factors of Fama-French (1993) augmented by the momentum factor of Carhart (1997). The estimated monthly abnormal returns are cumulated from September 1990 to July 2005.
01
0.2
0.4
0.6
0.8
Exce
ss re
turn
s
1990m1 1995m1 2000m1 2005m1Year-Month
VWEW
G-Index
01
1.5
22.
50.
5Exce
ss re
turn
s
1990m1 1995m1 2000m1 2005m1Year-Month
VWEW
E-Index
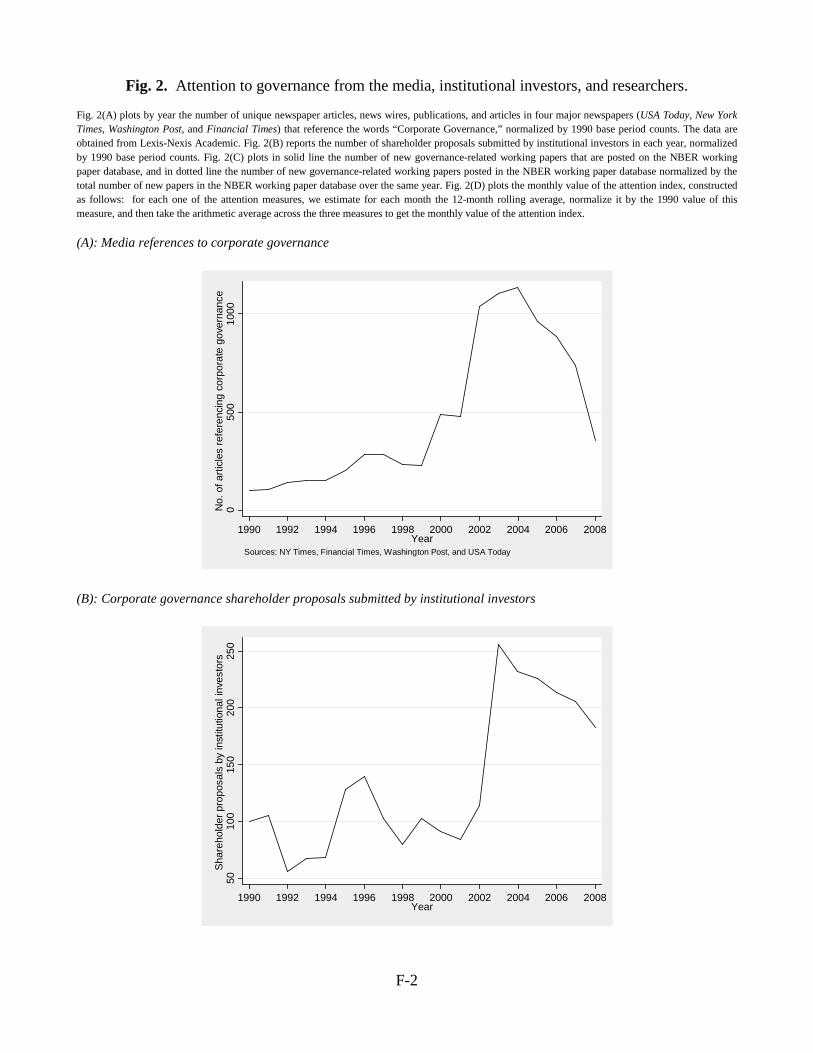
F-2
Fig. 2. Attention to governance from the media, institutional investors, and researchers. Fig. 2(A) plots by year the number of unique newspaper articles, news wires, publications, and articles in four major newspapers (USA Today, New York Times, Washington Post, and Financial Times) that reference the words “Corporate Governance,” normalized by 1990 base period counts. The data are obtained from Lexis-Nexis Academic. Fig. 2(B) reports the number of shareholder proposals submitted by institutional investors in each year, normalized by 1990 base period counts. Fig. 2(C) plots in solid line the number of new governance-related working papers that are posted on the NBER working paper database, and in dotted line the number of new governance-related working papers posted in the NBER working paper database normalized by the total number of new papers in the NBER working paper database over the same year. Fig. 2(D) plots the monthly value of the attention index, constructed as follows: for each one of the attention measures, we estimate for each month the 12-month rolling average, normalize it by the 1990 value of this measure, and then take the arithmetic average across the three measures to get the monthly value of the attention index.
(A): Media references to corporate governance 0
500
1000
No.
of a
rticl
es re
fere
ncin
g co
rpor
ate
gove
rnan
ce
1990 1992 1994 1996 1998 2000 2002 2004 2006 2008Year
Sources: NY Times, Financial Times, Washington Post, and USA Today
(B): Corporate governance shareholder proposals submitted by institutional investors
5010
015
020
025
0S
hare
hold
er p
ropo
sals
by
inst
itutio
nal i
nves
tors
1990 1992 1994 1996 1998 2000 2002 2004 2006 2008Year
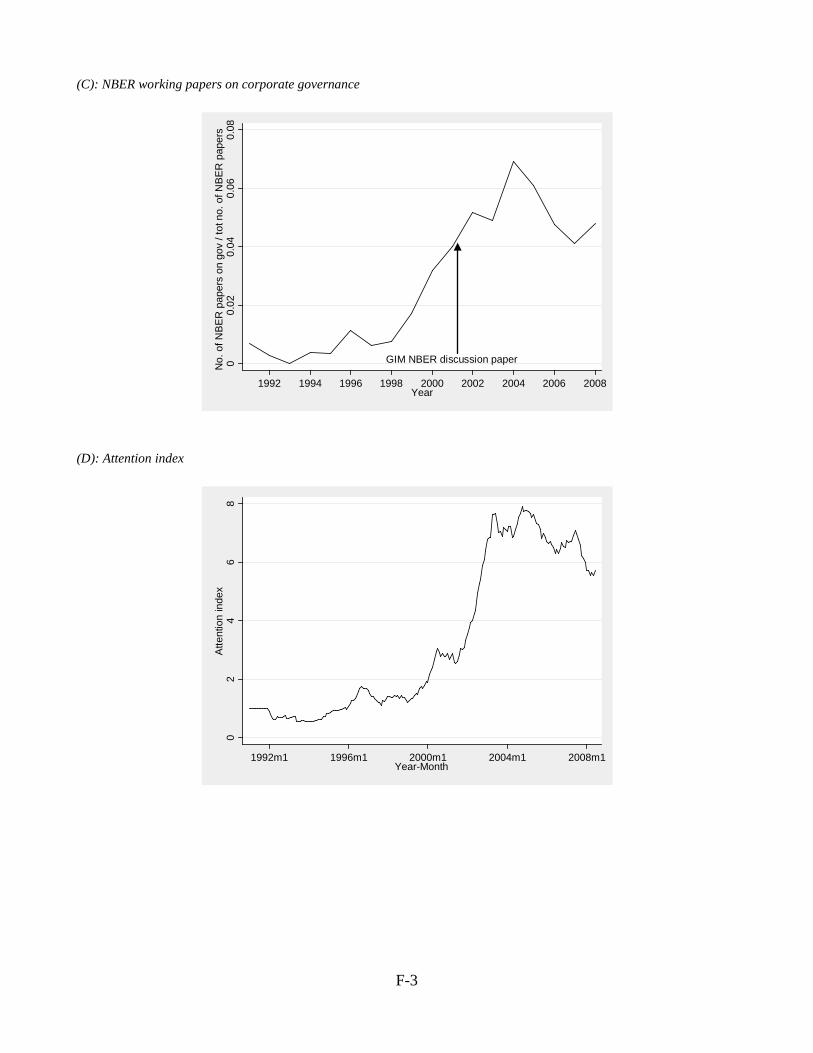
F-3
(C): NBER working papers on corporate governance
GIM NBER discussion paper00.
020.
080.
060.
04N
o. o
f NB
ER
pap
ers
on g
ov /
tot n
o. o
f NB
ER
pap
ers
1992 1994 1996 1998 2000 2002 2004 2006 2008Year
(D): Attention index
02
46
8A
ttent
ion
inde
x
1992m1 1996m1 2000m1 2004m1 2008m1Year-Month
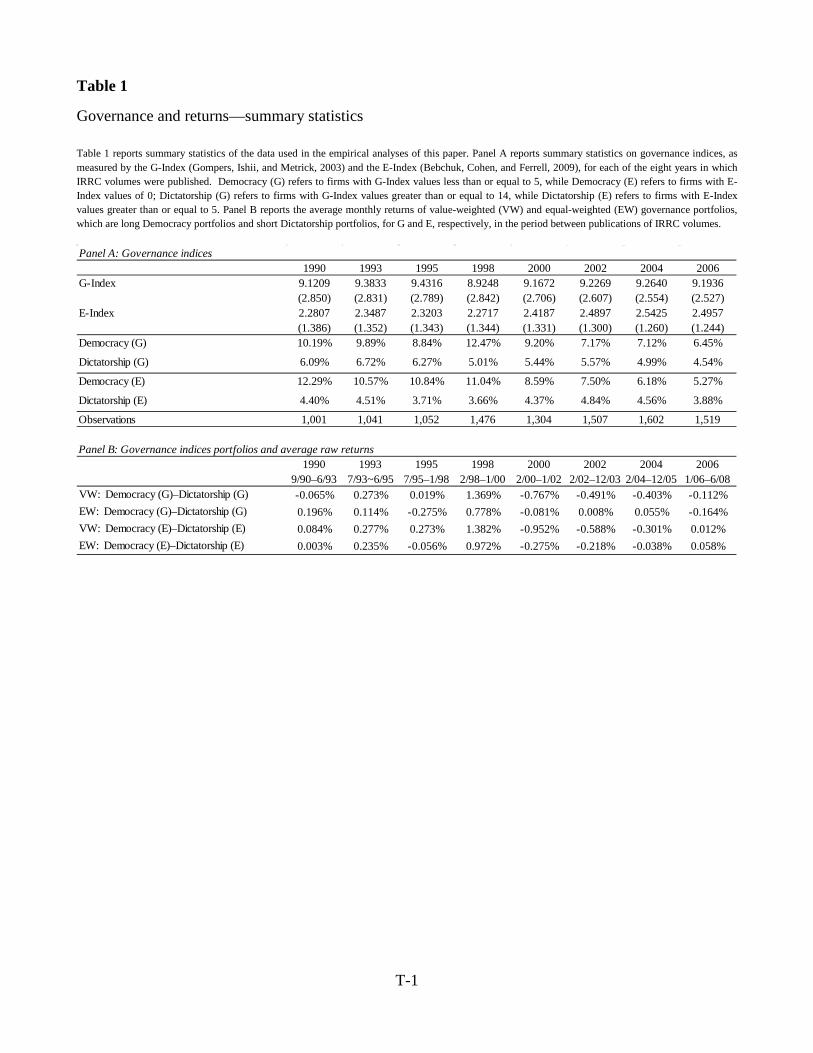
T-1
Table 1
Governance and returns—summary statistics
Table 1 reports summary statistics of the data used in the empirical analyses of this paper. Panel A reports summary statistics on governance indices, as measured by the G-Index (Gompers, Ishii, and Metrick, 2003) and the E-Index (Bebchuk, Cohen, and Ferrell, 2009), for each of the eight years in which IRRC volumes were published. Democracy (G) refers to firms with G-Index values less than or equal to 5, while Democracy (E) refers to firms with E-Index values of 0; Dictatorship (G) refers to firms with G-Index values greater than or equal to 14, while Dictatorship (E) refers to firms with E-Index values greater than or equal to 5. Panel B reports the average monthly returns of value-weighted (VW) and equal-weighted (EW) governance portfolios, which are long Democracy portfolios and short Dictatorship portfolios, for G and E, respectively, in the period between publications of IRRC volumes.
Panel A: Governance indices1990 1993 1995 1998 2000 2002 2004 2006
G-Index 9.1209 9.3833 9.4316 8.9248 9.1672 9.2269 9.2640 9.1936(2.850) (2.831) (2.789) (2.842) (2.706) (2.607) (2.554) (2.527)
E-Index 2.2807 2.3487 2.3203 2.2717 2.4187 2.4897 2.5425 2.4957(1.386) (1.352) (1.343) (1.344) (1.331) (1.300) (1.260) (1.244)
Democracy (G) 10.19% 9.89% 8.84% 12.47% 9.20% 7.17% 7.12% 6.45%
Dictatorship (G) 6.09% 6.72% 6.27% 5.01% 5.44% 5.57% 4.99% 4.54%
Democracy (E) 12.29% 10.57% 10.84% 11.04% 8.59% 7.50% 6.18% 5.27%
Dictatorship (E) 4.40% 4.51% 3.71% 3.66% 4.37% 4.84% 4.56% 3.88%
Observations 1,001 1,041 1,052 1,476 1,304 1,507 1,602 1,519
Panel B: Governance indices portfolios and average raw returns1990 1993 1995 1998 2000 2002 2004 2006
9/90–6/93 7/93~6/95 7/95–1/98 2/98–1/00 2/00–1/02 2/02–12/03 2/04–12/05 1/06–6/08VW: Democracy (G)–Dictatorship (G) -0.065% 0.273% 0.019% 1.369% -0.767% -0.491% -0.403% -0.112%EW: Democracy (G)–Dictatorship (G) 0.196% 0.114% -0.275% 0.778% -0.081% 0.008% 0.055% -0.164%VW: Democracy (E)–Dictatorship (E) 0.084% 0.277% 0.273% 1.382% -0.952% -0.588% -0.301% 0.012%EW: Democracy (E)–Dictatorship (E) 0.003% 0.235% -0.056% 0.972% -0.275% -0.218% -0.038% 0.058%
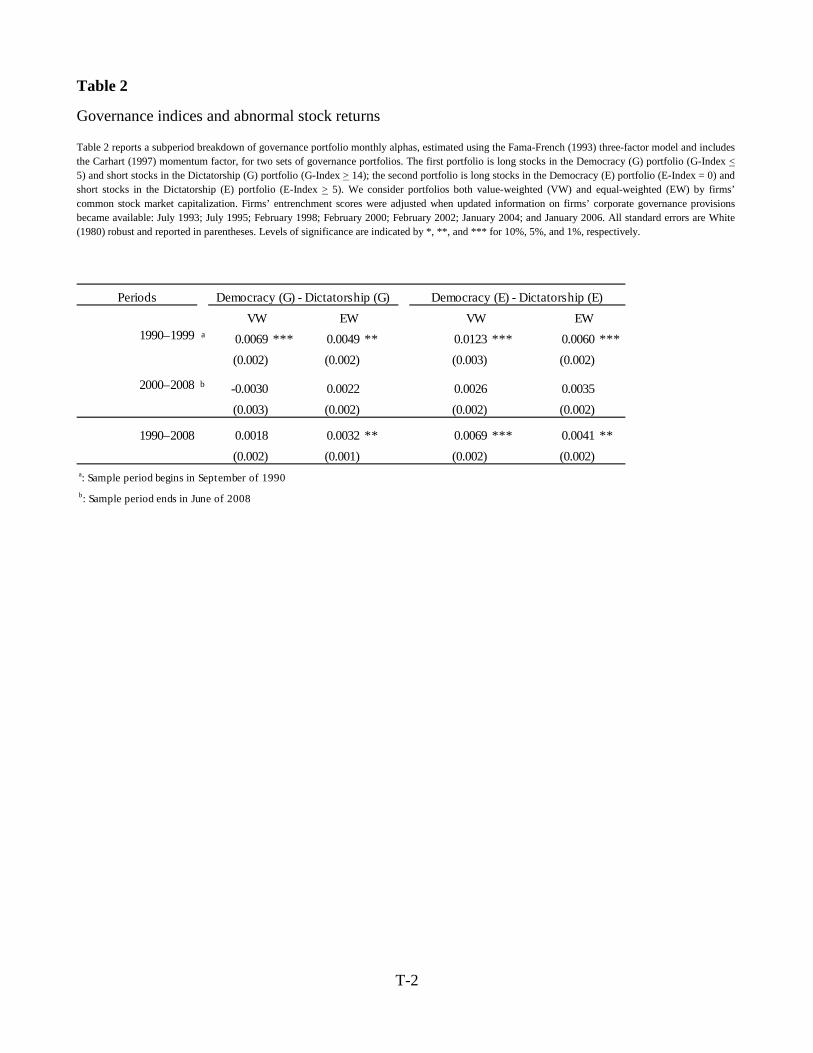
T-2
Table 2
Governance indices and abnormal stock returns
Table 2 reports a subperiod breakdown of governance portfolio monthly alphas, estimated using the Fama-French (1993) three-factor model and includes the Carhart (1997) momentum factor, for two sets of governance portfolios. The first portfolio is long stocks in the Democracy (G) portfolio (G-Index < 5) and short stocks in the Dictatorship (G) portfolio (G-Index > 14); the second portfolio is long stocks in the Democracy (E) portfolio (E-Index = 0) and short stocks in the Dictatorship (E) portfolio (E-Index > 5). We consider portfolios both value-weighted (VW) and equal-weighted (EW) by firms’ common stock market capitalization. Firms’ entrenchment scores were adjusted when updated information on firms’ corporate governance provisions became available: July 1993; July 1995; February 1998; February 2000; February 2002; January 2004; and January 2006. All standard errors are White (1980) robust and reported in parentheses. Levels of significance are indicated by *, **, and *** for 10%, 5%, and 1%, respectively.
PeriodsVW EW VW EW
a 0.0069 *** 0.0049 ** 0.0123 *** 0.0060 ***(0.002) (0.002) (0.003) (0.002)
b -0.0030 0.0022 0.0026 0.0035(0.003) (0.002) (0.002) (0.002)
1990–2008 0.0018 0.0032 ** 0.0069 *** 0.0041 **(0.002) (0.001) (0.002) (0.002)
a: Sample period begins in September of 1990b: Sample period ends in June of 2008
1990–1999
2000–2008
Democracy (E) - Dictatorship (E)
Democracy (G) - Dictatorship (G)
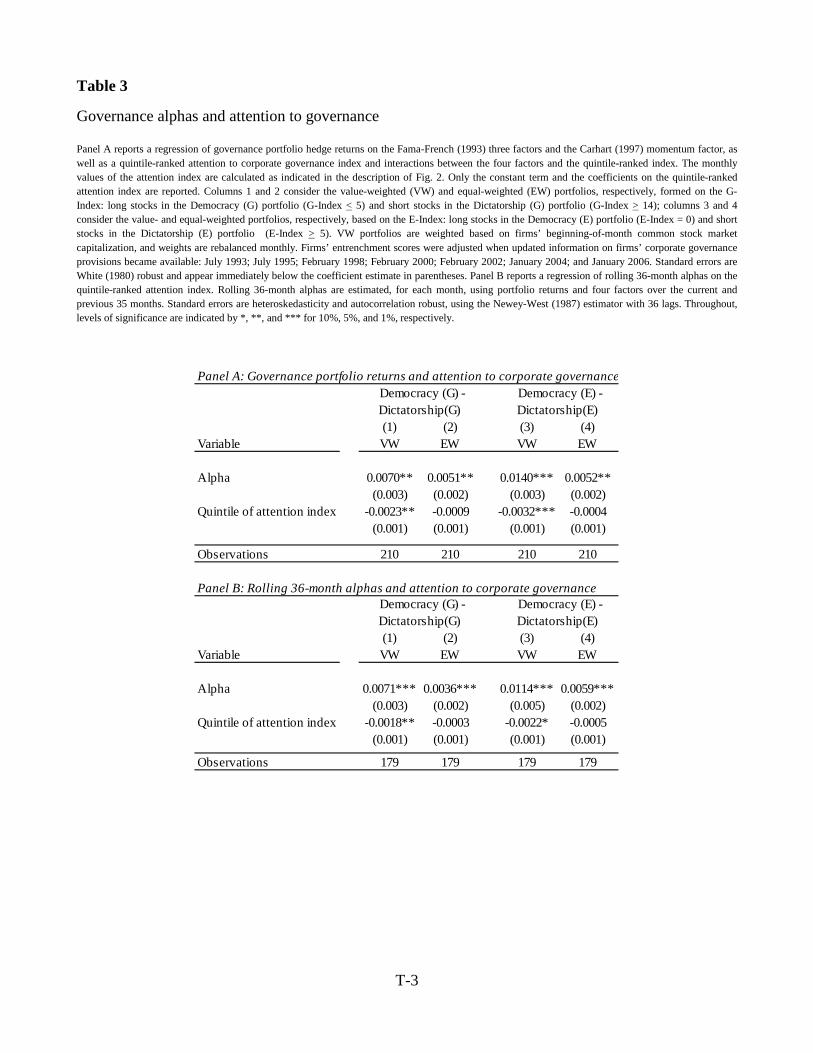
T-3
Table 3
Governance alphas and attention to governance
Panel A reports a regression of governance portfolio hedge returns on the Fama-French (1993) three factors and the Carhart (1997) momentum factor, as well as a quintile-ranked attention to corporate governance index and interactions between the four factors and the quintile-ranked index. The monthly values of the attention index are calculated as indicated in the description of Fig. 2. Only the constant term and the coefficients on the quintile-ranked attention index are reported. Columns 1 and 2 consider the value-weighted (VW) and equal-weighted (EW) portfolios, respectively, formed on the G-Index: long stocks in the Democracy (G) portfolio (G-Index < 5) and short stocks in the Dictatorship (G) portfolio (G-Index > 14); columns 3 and 4 consider the value- and equal-weighted portfolios, respectively, based on the E-Index: long stocks in the Democracy (E) portfolio (E-Index = 0) and short stocks in the Dictatorship (E) portfolio (E-Index > 5). VW portfolios are weighted based on firms’ beginning-of-month common stock market capitalization, and weights are rebalanced monthly. Firms’ entrenchment scores were adjusted when updated information on firms’ corporate governance provisions became available: July 1993; July 1995; February 1998; February 2000; February 2002; January 2004; and January 2006. Standard errors are White (1980) robust and appear immediately below the coefficient estimate in parentheses. Panel B reports a regression of rolling 36-month alphas on the quintile-ranked attention index. Rolling 36-month alphas are estimated, for each month, using portfolio returns and four factors over the current and previous 35 months. Standard errors are heteroskedasticity and autocorrelation robust, using the Newey-West (1987) estimator with 36 lags. Throughout, levels of significance are indicated by *, **, and *** for 10%, 5%, and 1%, respectively.
Panel A: Governance portfolio returns and attention to corporate governance
(1) (2) (3) (4)Variable VW EW VW EW
Alpha 0.0070** 0.0051** 0.0140*** 0.0052**(0.003) (0.002) (0.003) (0.002)
Quintile of attention index -0.0023** -0.0009 -0.0032*** -0.0004(0.001) (0.001) (0.001) (0.001)
Observations 210 210 210 210
Panel B: Rolling 36-month alphas and attention to corporate governance
(1) (2) (3) (4)Variable VW EW VW EW
Alpha 0.0071*** 0.0036*** 0.0114*** 0.0059***(0.003) (0.002) (0.005) (0.002)
Quintile of attention index -0.0018** -0.0003 -0.0022* -0.0005(0.001) (0.001) (0.001) (0.001)
Observations 179 179 179 179
Democracy (G) - Dictatorship(G)
Democracy (G) - Dictatorship(G)
Democracy (E) - Dictatorship(E)
Democracy (E) - Dictatorship(E)
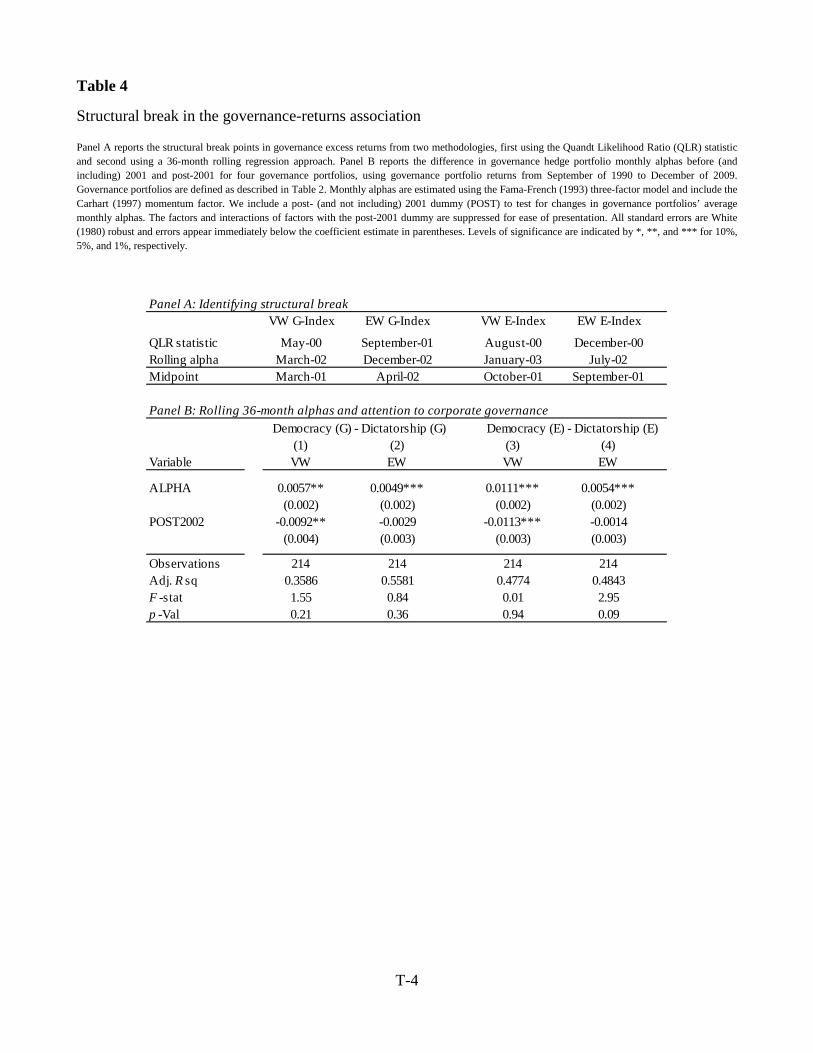
T-4
Table 4
Structural break in the governance-returns association
Panel A reports the structural break points in governance excess returns from two methodologies, first using the Quandt Likelihood Ratio (QLR) statistic and second using a 36-month rolling regression approach. Panel B reports the difference in governance hedge portfolio monthly alphas before (and including) 2001 and post-2001 for four governance portfolios, using governance portfolio returns from September of 1990 to December of 2009. Governance portfolios are defined as described in Table 2. Monthly alphas are estimated using the Fama-French (1993) three-factor model and include the Carhart (1997) momentum factor. We include a post- (and not including) 2001 dummy (POST) to test for changes in governance portfolios’ average monthly alphas. The factors and interactions of factors with the post-2001 dummy are suppressed for ease of presentation. All standard errors are White (1980) robust and errors appear immediately below the coefficient estimate in parentheses. Levels of significance are indicated by *, **, and *** for 10%, 5%, and 1%, respectively.
Panel A: Identifying structural breakVW G-Index EW G-Index VW E-Index EW E-Index
QLR statistic May-00 September-01 August-00 December-00Rolling alpha March-02 December-02 January-03 July-02Midpoint March-01 April-02 October-01 September-01
Panel B: Rolling 36-month alphas and attention to corporate governance
(1) (2) (3) (4)Variable VW EW VW EW
ALPHA 0.0057** 0.0049*** 0.0111*** 0.0054***(0.002) (0.002) (0.002) (0.002)
POST2002 -0.0092** -0.0029 -0.0113*** -0.0014(0.004) (0.003) (0.003) (0.003)
Observations 214 214 214 214Adj. R sq 0.3586 0.5581 0.4774 0.4843F -stat 1.55 0.84 0.01 2.95p -Val 0.21 0.36 0.94 0.09
Democracy (G) - Dictatorship (G) Democracy (E) - Dictatorship (E)
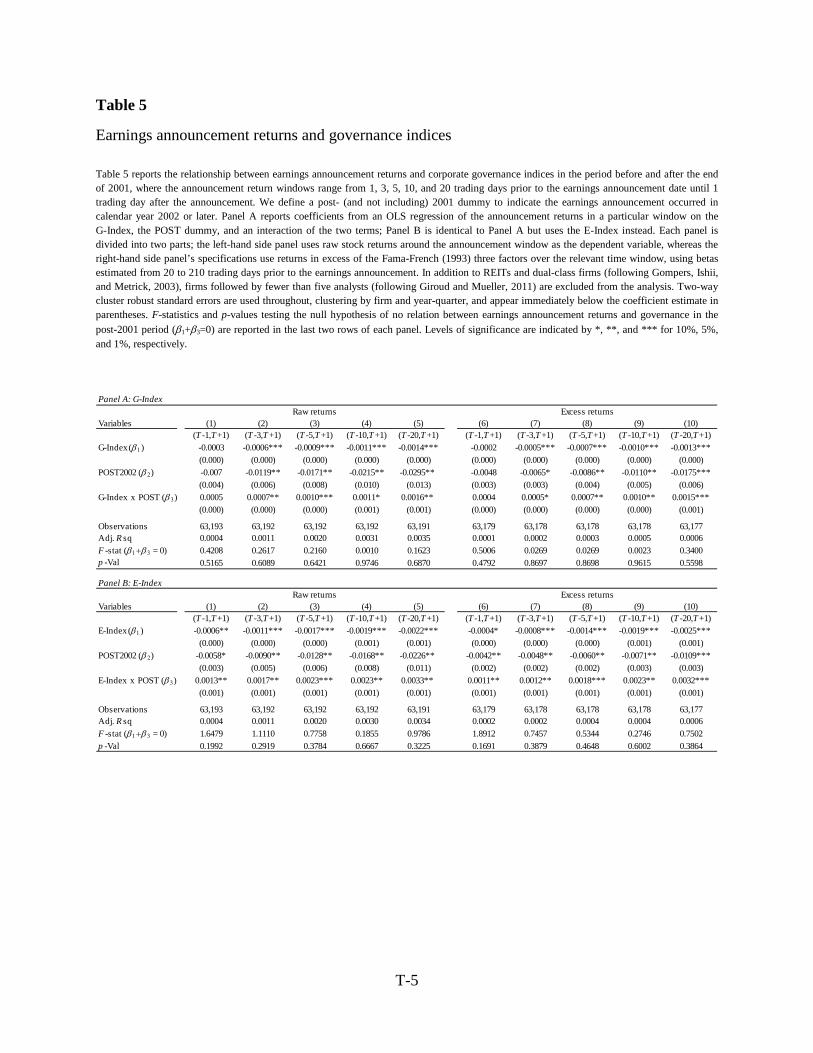
T-5
Table 5
Earnings announcement returns and governance indices
Table 5 reports the relationship between earnings announcement returns and corporate governance indices in the period before and after the end of 2001, where the announcement return windows range from 1, 3, 5, 10, and 20 trading days prior to the earnings announcement date until 1 trading day after the announcement. We define a post- (and not including) 2001 dummy to indicate the earnings announcement occurred in calendar year 2002 or later. Panel A reports coefficients from an OLS regression of the announcement returns in a particular window on the G-Index, the POST dummy, and an interaction of the two terms; Panel B is identical to Panel A but uses the E-Index instead. Each panel is divided into two parts; the left-hand side panel uses raw stock returns around the announcement window as the dependent variable, whereas the right-hand side panel’s specifications use returns in excess of the Fama-French (1993) three factors over the relevant time window, using betas estimated from 20 to 210 trading days prior to the earnings announcement. In addition to REITs and dual-class firms (following Gompers, Ishii, and Metrick, 2003), firms followed by fewer than five analysts (following Giroud and Mueller, 2011) are excluded from the analysis. Two-way cluster robust standard errors are used throughout, clustering by firm and year-quarter, and appear immediately below the coefficient estimate in parentheses. F-statistics and p-values testing the null hypothesis of no relation between earnings announcement returns and governance in the post-2001 period (β1+β3=0) are reported in the last two rows of each panel. Levels of significance are indicated by *, **, and *** for 10%, 5%, and 1%, respectively.
Panel A: G-Index
Variables (1) (2) (3) (4) (5) (6) (7) (8) (9) (10)(T -1,T +1) (T -3,T +1) (T -5,T +1) (T -10,T +1) (T -20,T +1) (T -1,T +1) (T -3,T +1) (T -5,T +1) (T -10,T +1) (T -20,T +1)
G-Index (β 1) -0.0003 -0.0006*** -0.0009*** -0.0011*** -0.0014*** -0.0002 -0.0005*** -0.0007*** -0.0010*** -0.0013***(0.000) (0.000) (0.000) (0.000) (0.000) (0.000) (0.000) (0.000) (0.000) (0.000)
POST2002 (β 2) -0.007 -0.0119** -0.0171** -0.0215** -0.0295** -0.0048 -0.0065* -0.0086** -0.0110** -0.0175***(0.004) (0.006) (0.008) (0.010) (0.013) (0.003) (0.003) (0.004) (0.005) (0.006)
G-Index x POST (β 3) 0.0005 0.0007** 0.0010*** 0.0011* 0.0016** 0.0004 0.0005* 0.0007** 0.0010** 0.0015***(0.000) (0.000) (0.000) (0.001) (0.001) (0.000) (0.000) (0.000) (0.000) (0.001)
Observations 63,193 63,192 63,192 63,192 63,191 63,179 63,178 63,178 63,178 63,177Adj. R sq 0.0004 0.0011 0.0020 0.0031 0.0035 0.0001 0.0002 0.0003 0.0005 0.0006F -stat (β 1+β 3 = 0) 0.4208 0.2617 0.2160 0.0010 0.1623 0.5006 0.0269 0.0269 0.0023 0.3400p -Val 0.5165 0.6089 0.6421 0.9746 0.6870 0.4792 0.8697 0.8698 0.9615 0.5598
Panel B: E-Index
Variables (1) (2) (3) (4) (5) (6) (7) (8) (9) (10)(T -1,T +1) (T -3,T +1) (T -5,T +1) (T -10,T +1) (T -20,T +1) (T -1,T +1) (T -3,T +1) (T -5,T +1) (T -10,T +1) (T -20,T +1)
E-Index (β 1) -0.0006** -0.0011*** -0.0017*** -0.0019*** -0.0022*** -0.0004* -0.0008*** -0.0014*** -0.0019*** -0.0025***(0.000) (0.000) (0.000) (0.001) (0.001) (0.000) (0.000) (0.000) (0.001) (0.001)
POST2002 (β 2) -0.0058* -0.0090** -0.0128** -0.0168** -0.0226** -0.0042** -0.0048** -0.0060** -0.0071** -0.0109***(0.003) (0.005) (0.006) (0.008) (0.011) (0.002) (0.002) (0.002) (0.003) (0.003)
E-Index x POST (β 3) 0.0013** 0.0017** 0.0023*** 0.0023** 0.0033** 0.0011** 0.0012** 0.0018*** 0.0023** 0.0032***(0.001) (0.001) (0.001) (0.001) (0.001) (0.001) (0.001) (0.001) (0.001) (0.001)
Observations 63,193 63,192 63,192 63,192 63,191 63,179 63,178 63,178 63,178 63,177Adj. R sq 0.0004 0.0011 0.0020 0.0030 0.0034 0.0002 0.0002 0.0004 0.0004 0.0006F -stat (β 1+β 3 = 0) 1.6479 1.1110 0.7758 0.1855 0.9786 1.8912 0.7457 0.5344 0.2746 0.7502p -Val 0.1992 0.2919 0.3784 0.6667 0.3225 0.1691 0.3879 0.4648 0.6002 0.3864
Raw returns Excess returns
Raw returns Excess returns
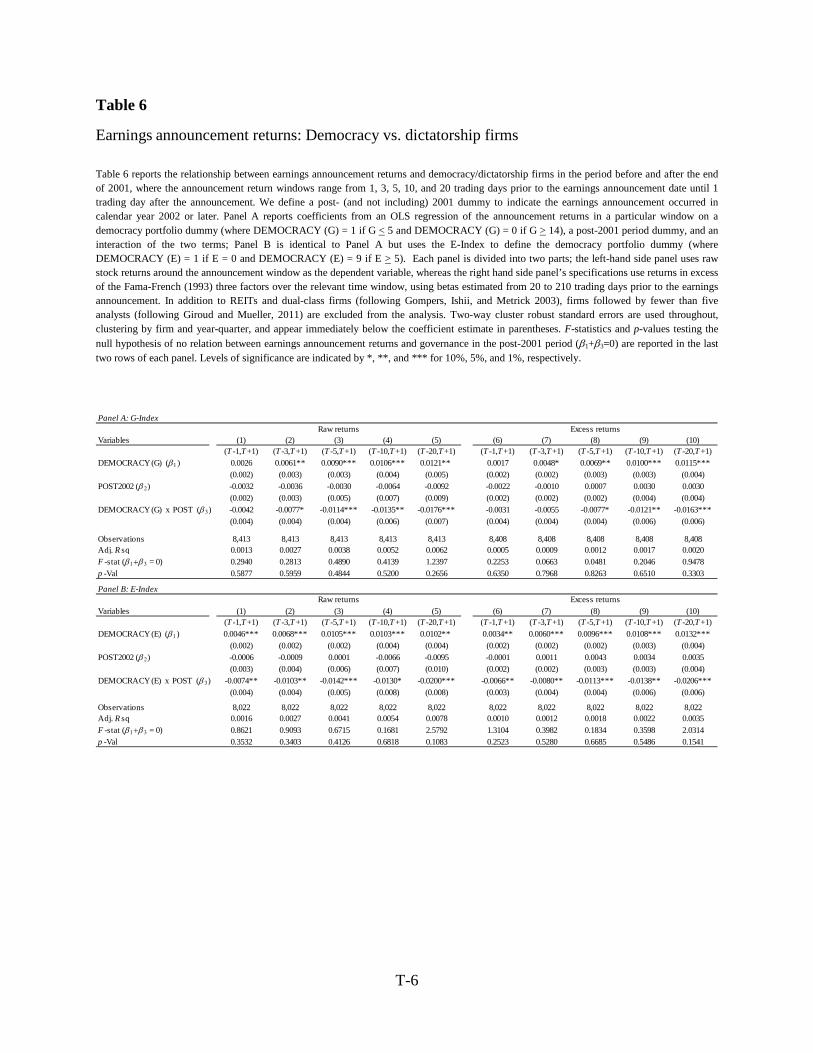
T-6
Table 6
Earnings announcement returns: Democracy vs. dictatorship firms
Table 6 reports the relationship between earnings announcement returns and democracy/dictatorship firms in the period before and after the end of 2001, where the announcement return windows range from 1, 3, 5, 10, and 20 trading days prior to the earnings announcement date until 1 trading day after the announcement. We define a post- (and not including) 2001 dummy to indicate the earnings announcement occurred in calendar year 2002 or later. Panel A reports coefficients from an OLS regression of the announcement returns in a particular window on a democracy portfolio dummy (where DEMOCRACY (G) = 1 if G < 5 and DEMOCRACY (G) = 0 if G > 14), a post-2001 period dummy, and an interaction of the two terms; Panel B is identical to Panel A but uses the E-Index to define the democracy portfolio dummy (where DEMOCRACY (E) = 1 if E = 0 and DEMOCRACY (E) = 9 if E > 5). Each panel is divided into two parts; the left-hand side panel uses raw stock returns around the announcement window as the dependent variable, whereas the right hand side panel’s specifications use returns in excess of the Fama-French (1993) three factors over the relevant time window, using betas estimated from 20 to 210 trading days prior to the earnings announcement. In addition to REITs and dual-class firms (following Gompers, Ishii, and Metrick 2003), firms followed by fewer than five analysts (following Giroud and Mueller, 2011) are excluded from the analysis. Two-way cluster robust standard errors are used throughout, clustering by firm and year-quarter, and appear immediately below the coefficient estimate in parentheses. F-statistics and p-values testing the null hypothesis of no relation between earnings announcement returns and governance in the post-2001 period (β1+β3=0) are reported in the last two rows of each panel. Levels of significance are indicated by *, **, and *** for 10%, 5%, and 1%, respectively.
Panel A: G-Index
Variables (1) (2) (3) (4) (5) (6) (7) (8) (9) (10)(T -1,T +1) (T -3,T +1) (T -5,T +1) (T -10,T +1) (T -20,T +1) (T -1,T +1) (T -3,T +1) (T -5,T +1) (T -10,T +1) (T -20,T +1)
DEMOCRACY (G) (β 1) 0.0026 0.0061** 0.0090*** 0.0106*** 0.0121** 0.0017 0.0048* 0.0069** 0.0100*** 0.0115***(0.002) (0.003) (0.003) (0.004) (0.005) (0.002) (0.002) (0.003) (0.003) (0.004)
POST2002 (β 2) -0.0032 -0.0036 -0.0030 -0.0064 -0.0092 -0.0022 -0.0010 0.0007 0.0030 0.0030(0.002) (0.003) (0.005) (0.007) (0.009) (0.002) (0.002) (0.002) (0.004) (0.004)
DEMOCRACY (G) x POST (β 3) -0.0042 -0.0077* -0.0114*** -0.0135** -0.0176*** -0.0031 -0.0055 -0.0077* -0.0121** -0.0163***(0.004) (0.004) (0.004) (0.006) (0.007) (0.004) (0.004) (0.004) (0.006) (0.006)
Observations 8,413 8,413 8,413 8,413 8,413 8,408 8,408 8,408 8,408 8,408Adj. R sq 0.0013 0.0027 0.0038 0.0052 0.0062 0.0005 0.0009 0.0012 0.0017 0.0020F -stat (β 1+β 3 = 0) 0.2940 0.2813 0.4890 0.4139 1.2397 0.2253 0.0663 0.0481 0.2046 0.9478p -Val 0.5877 0.5959 0.4844 0.5200 0.2656 0.6350 0.7968 0.8263 0.6510 0.3303
Panel B: E-Index
Variables (1) (2) (3) (4) (5) (6) (7) (8) (9) (10)(T -1,T +1) (T -3,T +1) (T -5,T +1) (T -10,T +1) (T -20,T +1) (T -1,T +1) (T -3,T +1) (T -5,T +1) (T -10,T +1) (T -20,T +1)
DEMOCRACY (E) (β 1) 0.0046*** 0.0068*** 0.0105*** 0.0103*** 0.0102** 0.0034** 0.0060*** 0.0096*** 0.0108*** 0.0132***(0.002) (0.002) (0.002) (0.004) (0.004) (0.002) (0.002) (0.002) (0.003) (0.004)
POST2002 (β 2) -0.0006 -0.0009 0.0001 -0.0066 -0.0095 -0.0001 0.0011 0.0043 0.0034 0.0035(0.003) (0.004) (0.006) (0.007) (0.010) (0.002) (0.002) (0.003) (0.003) (0.004)
DEMOCRACY (E) x POST (β 3) -0.0074** -0.0103** -0.0142*** -0.0130* -0.0200*** -0.0066** -0.0080** -0.0113*** -0.0138** -0.0206***(0.004) (0.004) (0.005) (0.008) (0.008) (0.003) (0.004) (0.004) (0.006) (0.006)
Observations 8,022 8,022 8,022 8,022 8,022 8,022 8,022 8,022 8,022 8,022Adj. R sq 0.0016 0.0027 0.0041 0.0054 0.0078 0.0010 0.0012 0.0018 0.0022 0.0035F -stat (β 1+β 3 = 0) 0.8621 0.9093 0.6715 0.1681 2.5792 1.3104 0.3982 0.1834 0.3598 2.0314p -Val 0.3532 0.3403 0.4126 0.6818 0.1083 0.2523 0.5280 0.6685 0.5486 0.1541
Raw returns Excess returns
Raw returns Excess returns
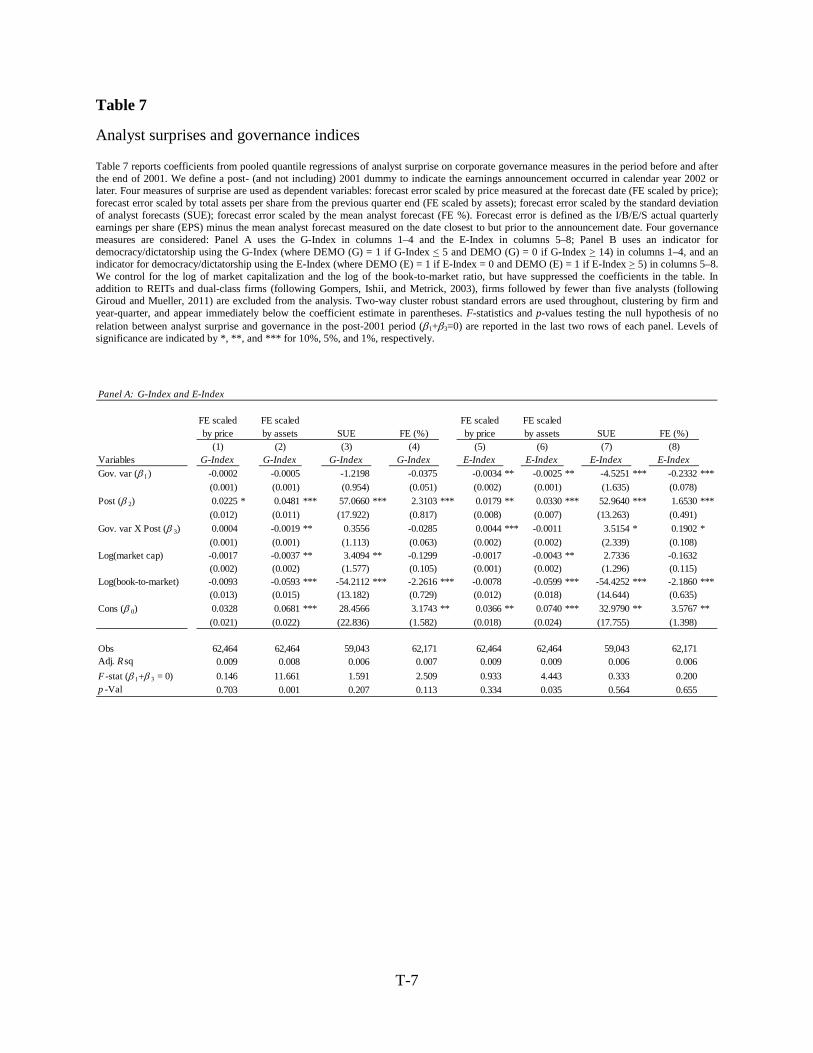
T-7
Table 7
Analyst surprises and governance indices
Table 7 reports coefficients from pooled quantile regressions of analyst surprise on corporate governance measures in the period before and after the end of 2001. We define a post- (and not including) 2001 dummy to indicate the earnings announcement occurred in calendar year 2002 or later. Four measures of surprise are used as dependent variables: forecast error scaled by price measured at the forecast date (FE scaled by price); forecast error scaled by total assets per share from the previous quarter end (FE scaled by assets); forecast error scaled by the standard deviation of analyst forecasts (SUE); forecast error scaled by the mean analyst forecast (FE %). Forecast error is defined as the I/B/E/S actual quarterly earnings per share (EPS) minus the mean analyst forecast measured on the date closest to but prior to the announcement date. Four governance measures are considered: Panel A uses the G-Index in columns 1–4 and the E-Index in columns 5–8; Panel B uses an indicator for democracy/dictatorship using the G-Index (where DEMO (G) = 1 if G-Index < 5 and DEMO (G) = 0 if G-Index > 14) in columns 1–4, and an indicator for democracy/dictatorship using the E-Index (where DEMO (E) = 1 if E-Index = 0 and DEMO (E) = 1 if E-Index > 5) in columns 5–8. We control for the log of market capitalization and the log of the book-to-market ratio, but have suppressed the coefficients in the table. In addition to REITs and dual-class firms (following Gompers, Ishii, and Metrick, 2003), firms followed by fewer than five analysts (following Giroud and Mueller, 2011) are excluded from the analysis. Two-way cluster robust standard errors are used throughout, clustering by firm and year-quarter, and appear immediately below the coefficient estimate in parentheses. F-statistics and p-values testing the null hypothesis of no relation between analyst surprise and governance in the post-2001 period (β1+β3=0) are reported in the last two rows of each panel. Levels of significance are indicated by *, **, and *** for 10%, 5%, and 1%, respectively.
Panel A: G-Index and E-Index
FE scaled by price
FE scaled by assets SUE FE (%)
FE scaledby price
FE scaled by assets SUE FE (%)
(1) (2) (3) (4) (5) (6) (7) (8)Variables G-Index G-Index G-Index G-Index E-Index E-Index E-Index E-IndexGov. var (β 1) -0.0002 -0.0005 -1.2198 -0.0375 -0.0034 ** -0.0025 ** -4.5251 *** -0.2332 ***
(0.001) (0.001) (0.954) (0.051) (0.002) (0.001) (1.635) (0.078)Post (β 2) 0.0225 * 0.0481 *** 57.0660 *** 2.3103 *** 0.0179 ** 0.0330 *** 52.9640 *** 1.6530 ***
(0.012) (0.011) (17.922) (0.817) (0.008) (0.007) (13.263) (0.491)Gov. var X Post (β 3) 0.0004 -0.0019 ** 0.3556 -0.0285 0.0044 *** -0.0011 3.5154 * 0.1902 *
(0.001) (0.001) (1.113) (0.063) (0.002) (0.002) (2.339) (0.108)Log(market cap) -0.0017 -0.0037 ** 3.4094 ** -0.1299 -0.0017 -0.0043 ** 2.7336 -0.1632
(0.002) (0.002) (1.577) (0.105) (0.001) (0.002) (1.296) (0.115)Log(book-to-market) -0.0093 -0.0593 *** -54.2112 *** -2.2616 *** -0.0078 -0.0599 *** -54.4252 *** -2.1860 ***
(0.013) (0.015) (13.182) (0.729) (0.012) (0.018) (14.644) (0.635)Cons (β 0) 0.0328 0.0681 *** 28.4566 3.1743 ** 0.0366 ** 0.0740 *** 32.9790 ** 3.5767 **
(0.021) (0.022) (22.836) (1.582) (0.018) (0.024) (17.755) (1.398)
Obs 62,464 62,464 59,043 62,171 62,464 62,464 59,043 62,171Adj. R sq 0.009 0.008 0.006 0.007 0.009 0.009 0.006 0.006F -stat (β 1+β 3 = 0) 0.146 11.661 1.591 2.509 0.933 4.443 0.333 0.200p -Val 0.703 0.001 0.207 0.113 0.334 0.035 0.564 0.655
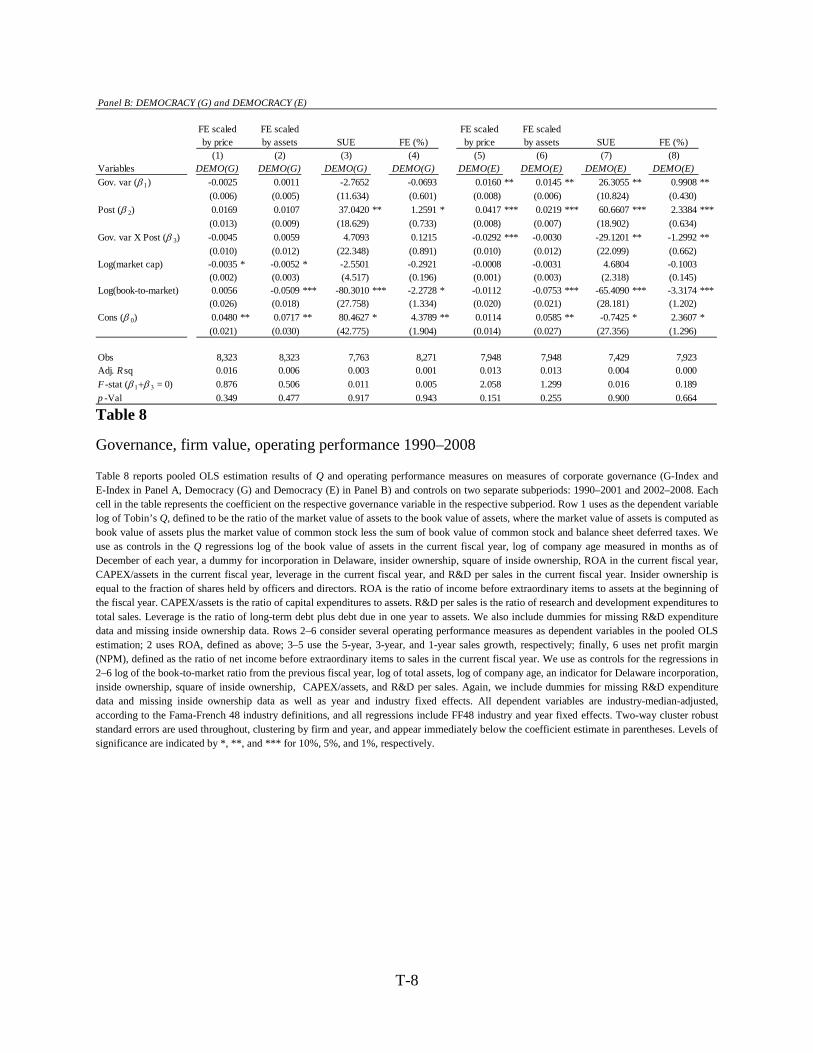
T-8
Panel B: DEMOCRACY (G) and DEMOCRACY (E)
FE scaled by price
FE scaled by assets SUE FE (%)
FE scaledby price
FE scaled by assets SUE FE (%)
(1) (2) (3) (4) (5) (6) (7) (8)Variables DEMO(G) DEMO(G) DEMO(G) DEMO(G) DEMO(E) DEMO(E) DEMO(E) DEMO(E)Gov. var (β 1) -0.0025 0.0011 -2.7652 -0.0693 0.0160 ** 0.0145 ** 26.3055 ** 0.9908 **
(0.006) (0.005) (11.634) (0.601) (0.008) (0.006) (10.824) (0.430)Post (β 2) 0.0169 0.0107 37.0420 ** 1.2591 * 0.0417 *** 0.0219 *** 60.6607 *** 2.3384 ***
(0.013) (0.009) (18.629) (0.733) (0.008) (0.007) (18.902) (0.634)Gov. var X Post (β 3) -0.0045 0.0059 4.7093 0.1215 -0.0292 *** -0.0030 -29.1201 ** -1.2992 **
(0.010) (0.012) (22.348) (0.891) (0.010) (0.012) (22.099) (0.662)Log(market cap) -0.0035 * -0.0052 * -2.5501 -0.2921 -0.0008 -0.0031 4.6804 -0.1003
(0.002) (0.003) (4.517) (0.196) (0.001) (0.003) (2.318) (0.145)Log(book-to-market) 0.0056 -0.0509 *** -80.3010 *** -2.2728 * -0.0112 -0.0753 *** -65.4090 *** -3.3174 ***
(0.026) (0.018) (27.758) (1.334) (0.020) (0.021) (28.181) (1.202)Cons (β 0) 0.0480 ** 0.0717 ** 80.4627 * 4.3789 ** 0.0114 0.0585 ** -0.7425 * 2.3607 *
(0.021) (0.030) (42.775) (1.904) (0.014) (0.027) (27.356) (1.296)
Obs 8,323 8,323 7,763 8,271 7,948 7,948 7,429 7,923Adj. R sq 0.016 0.006 0.003 0.001 0.013 0.013 0.004 0.000F -stat (β 1+β 3 = 0) 0.876 0.506 0.011 0.005 2.058 1.299 0.016 0.189p -Val 0.349 0.477 0.917 0.943 0.151 0.255 0.900 0.664
Table 8
Governance, firm value, operating performance 1990–2008
Table 8 reports pooled OLS estimation results of Q and operating performance measures on measures of corporate governance (G-Index and E-Index in Panel A, Democracy (G) and Democracy (E) in Panel B) and controls on two separate subperiods: 1990–2001 and 2002–2008. Each cell in the table represents the coefficient on the respective governance variable in the respective subperiod. Row 1 uses as the dependent variable log of Tobin’s Q, defined to be the ratio of the market value of assets to the book value of assets, where the market value of assets is computed as book value of assets plus the market value of common stock less the sum of book value of common stock and balance sheet deferred taxes. We use as controls in the Q regressions log of the book value of assets in the current fiscal year, log of company age measured in months as of December of each year, a dummy for incorporation in Delaware, insider ownership, square of inside ownership, ROA in the current fiscal year, CAPEX/assets in the current fiscal year, leverage in the current fiscal year, and R&D per sales in the current fiscal year. Insider ownership is equal to the fraction of shares held by officers and directors. ROA is the ratio of income before extraordinary items to assets at the beginning of the fiscal year. CAPEX/assets is the ratio of capital expenditures to assets. R&D per sales is the ratio of research and development expenditures to total sales. Leverage is the ratio of long-term debt plus debt due in one year to assets. We also include dummies for missing R&D expenditure data and missing inside ownership data. Rows 2–6 consider several operating performance measures as dependent variables in the pooled OLS estimation; 2 uses ROA, defined as above; 3–5 use the 5-year, 3-year, and 1-year sales growth, respectively; finally, 6 uses net profit margin (NPM), defined as the ratio of net income before extraordinary items to sales in the current fiscal year. We use as controls for the regressions in 2–6 log of the book-to-market ratio from the previous fiscal year, log of total assets, log of company age, an indicator for Delaware incorporation, inside ownership, square of inside ownership, CAPEX/assets, and R&D per sales. Again, we include dummies for missing R&D expenditure data and missing inside ownership data as well as year and industry fixed effects. All dependent variables are industry-median-adjusted, according to the Fama-French 48 industry definitions, and all regressions include FF48 industry and year fixed effects. Two-way cluster robust standard errors are used throughout, clustering by firm and year, and appear immediately below the coefficient estimate in parentheses. Levels of significance are indicated by *, **, and *** for 10%, 5%, and 1%, respectively.
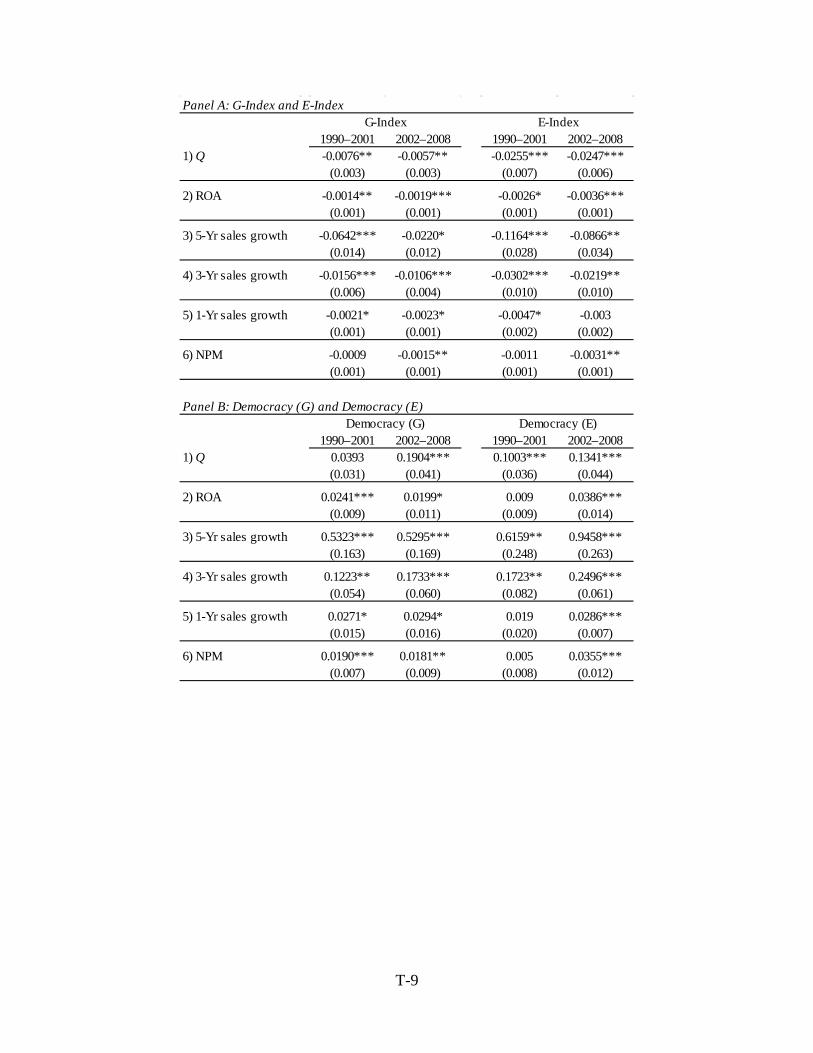
T-9
Panel A: G-Index and E-Index
1990–2001 2002–2008 1990–2001 2002–20081) Q -0.0076** -0.0057** -0.0255*** -0.0247***
(0.003) (0.003) (0.007) (0.006)
2) ROA -0.0014** -0.0019*** -0.0026* -0.0036***(0.001) (0.001) (0.001) (0.001)
3) 5-Yr sales growth -0.0642*** -0.0220* -0.1164*** -0.0866**(0.014) (0.012) (0.028) (0.034)
4) 3-Yr sales growth -0.0156*** -0.0106*** -0.0302*** -0.0219**(0.006) (0.004) (0.010) (0.010)
5) 1-Yr sales growth -0.0021* -0.0023* -0.0047* -0.003(0.001) (0.001) (0.002) (0.002)
6) NPM -0.0009 -0.0015** -0.0011 -0.0031**(0.001) (0.001) (0.001) (0.001)
G-Index E-Index
Panel B: Democracy (G) and Democracy (E)
1990–2001 2002–2008 1990–2001 2002–20081) Q 0.0393 0.1904*** 0.1003*** 0.1341***
(0.031) (0.041) (0.036) (0.044)
2) ROA 0.0241*** 0.0199* 0.009 0.0386***(0.009) (0.011) (0.009) (0.014)
3) 5-Yr sales growth 0.5323*** 0.5295*** 0.6159** 0.9458***(0.163) (0.169) (0.248) (0.263)
4) 3-Yr sales growth 0.1223** 0.1733*** 0.1723** 0.2496***(0.054) (0.060) (0.082) (0.061)
5) 1-Yr sales growth 0.0271* 0.0294* 0.019 0.0286***(0.015) (0.016) (0.020) (0.007)
6) NPM 0.0190*** 0.0181** 0.005 0.0355***(0.007) (0.009) (0.008) (0.012)
Democracy (G) Democracy (E)
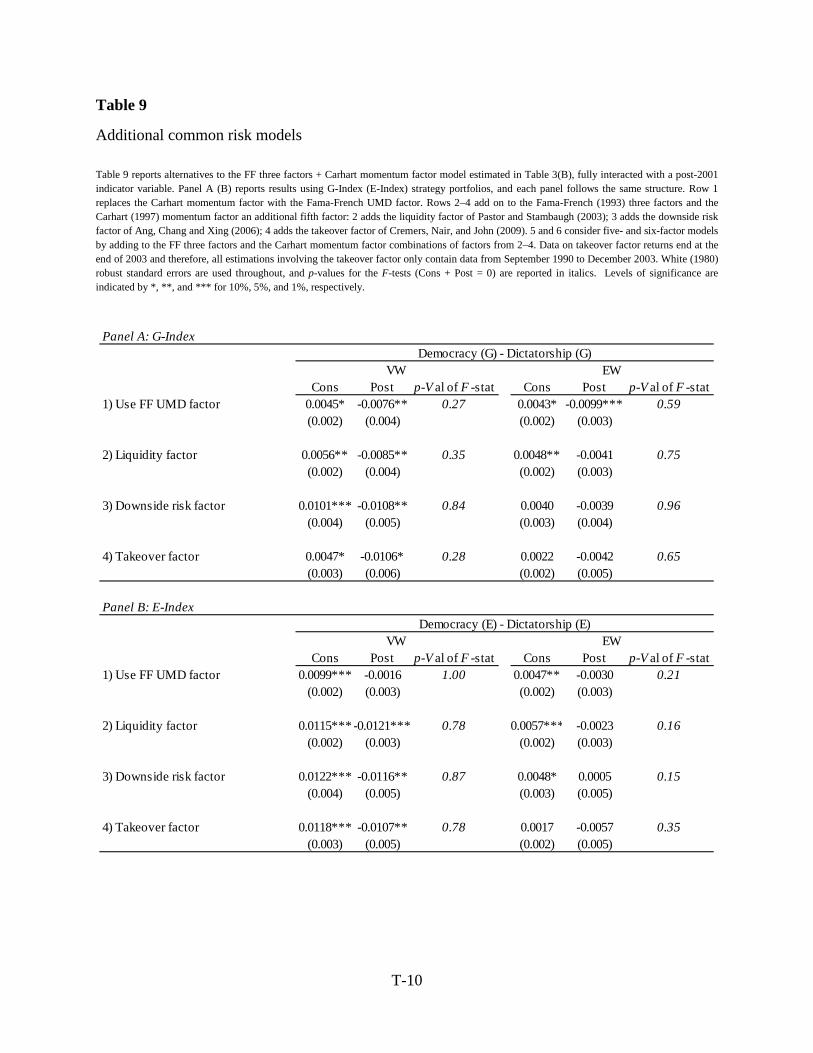
T-10
Table 9
Additional common risk models
Table 9 reports alternatives to the FF three factors + Carhart momentum factor model estimated in Table 3(B), fully interacted with a post-2001 indicator variable. Panel A (B) reports results using G-Index (E-Index) strategy portfolios, and each panel follows the same structure. Row 1 replaces the Carhart momentum factor with the Fama-French UMD factor. Rows 2–4 add on to the Fama-French (1993) three factors and the Carhart (1997) momentum factor an additional fifth factor: 2 adds the liquidity factor of Pastor and Stambaugh (2003); 3 adds the downside risk factor of Ang, Chang and Xing (2006); 4 adds the takeover factor of Cremers, Nair, and John (2009). 5 and 6 consider five- and six-factor models by adding to the FF three factors and the Carhart momentum factor combinations of factors from 2–4. Data on takeover factor returns end at the end of 2003 and therefore, all estimations involving the takeover factor only contain data from September 1990 to December 2003. White (1980) robust standard errors are used throughout, and p-values for the F-tests (Cons + Post = 0) are reported in italics. Levels of significance are indicated by *, **, and *** for 10%, 5%, and 1%, respectively.
Panel A: G-Index
Cons Post p-V al of F -stat Cons Post p-V al of F -stat1) Use FF UMD factor 0.0045* -0.0076** 0.27 0.0043* -0.0099*** 0.59
(0.002) (0.004) (0.002) (0.003)
2) Liquidity factor 0.0056** -0.0085** 0.35 0.0048** -0.0041 0.75(0.002) (0.004) (0.002) (0.003)
3) Downside risk factor 0.0101*** -0.0108** 0.84 0.0040 -0.0039 0.96(0.004) (0.005) (0.003) (0.004)
4) Takeover factor 0.0047* -0.0106* 0.28 0.0022 -0.0042 0.65(0.003) (0.006) (0.002) (0.005)
Panel B: E-Index
Cons Post p-V al of F -stat Cons Post p-V al of F -stat1) Use FF UMD factor 0.0099*** -0.0016 1.00 0.0047** -0.0030 0.21
(0.002) (0.003) (0.002) (0.003)
2) Liquidity factor 0.0115***-0.0121*** 0.78 0.0057*** -0.0023 0.16(0.002) (0.003) (0.002) (0.003)
3) Downside risk factor 0.0122*** -0.0116** 0.87 0.0048* 0.0005 0.15(0.004) (0.005) (0.003) (0.005)
4) Takeover factor 0.0118*** -0.0107** 0.78 0.0017 -0.0057 0.35(0.003) (0.005) (0.002) (0.005)
Democracy (G) - Dictatorship (G)
Democracy (E) - Dictatorship (E)
VW EW
VW EW
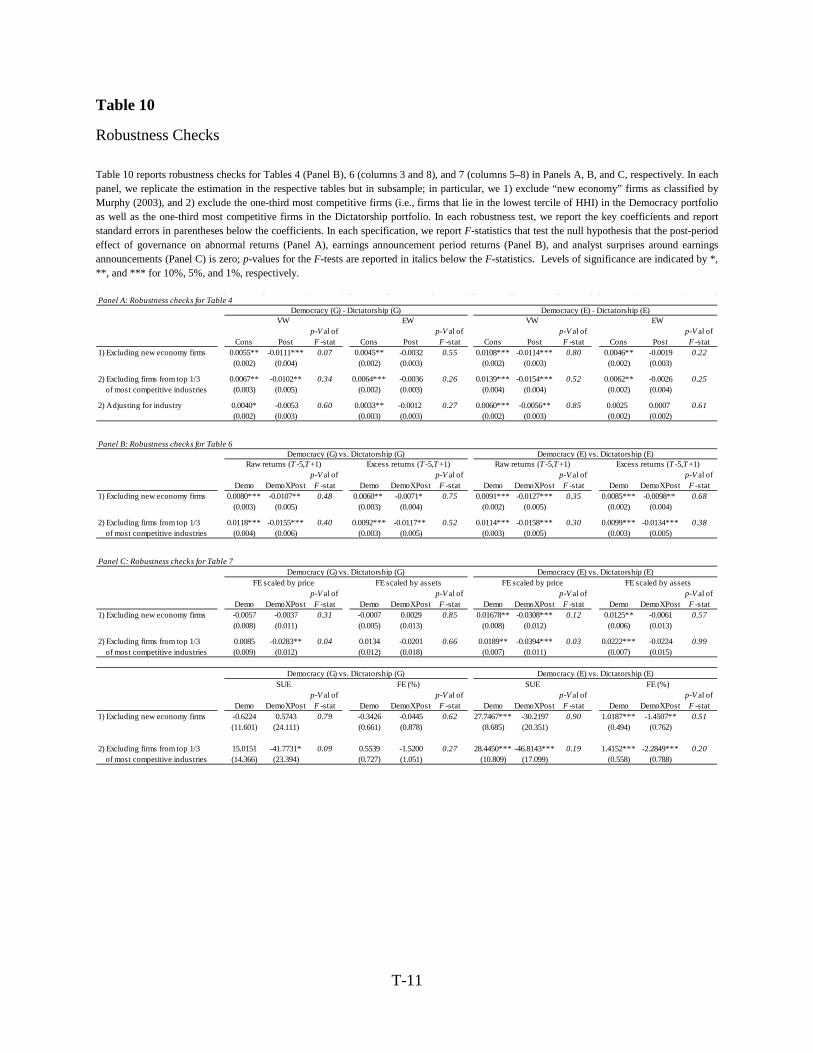
T-11
Table 10
Robustness Checks
Table 10 reports robustness checks for Tables 4 (Panel B), 6 (columns 3 and 8), and 7 (columns 5–8) in Panels A, B, and C, respectively. In each panel, we replicate the estimation in the respective tables but in subsample; in particular, we 1) exclude “new economy” firms as classified by Murphy (2003), and 2) exclude the one-third most competitive firms (i.e., firms that lie in the lowest tercile of HHI) in the Democracy portfolio as well as the one-third most competitive firms in the Dictatorship portfolio. In each robustness test, we report the key coefficients and report standard errors in parentheses below the coefficients. In each specification, we report F-statistics that test the null hypothesis that the post-period effect of governance on abnormal returns (Panel A), earnings announcement period returns (Panel B), and analyst surprises around earnings announcements (Panel C) is zero; p-values for the F-tests are reported in italics below the F-statistics. Levels of significance are indicated by *, **, and *** for 10%, 5%, and 1%, respectively.
Panel A: Robustness checks for Table 4
Cons Postp-V al of F -stat Cons Post
p-V al of F -stat Cons Post
p-V al of F -stat Cons Post
p-V al of F -stat
1) Excluding new economy firms 0.0055** -0.0111*** 0.07 0.0045** -0.0032 0.55 0.0108*** -0.0114*** 0.80 0.0046** -0.0019 0.22(0.002) (0.004) (0.002) (0.003) (0.002) (0.003) (0.002) (0.003)
2) Excluding firms from top 1/3 0.0067** -0.0102** 0.34 0.0064*** -0.0036 0.26 0.0139*** -0.0154*** 0.52 0.0062** -0.0026 0.25 of most competitive industries (0.003) (0.005) (0.002) (0.003) (0.004) (0.004) (0.002) (0.004)
2) Adjusting for industry 0.0040* -0.0053 0.60 0.0033** -0.0012 0.27 0.0060*** -0.0056** 0.85 0.0025 0.0007 0.61(0.002) (0.003) (0.003) (0.003) (0.002) (0.003) (0.002) (0.002)
EWDemocracy (E) - Dictatorship (E)Democracy (G) - Dictatorship (G)
VW EW VW
Panel B: Robustness checks for Table 6
Demo DemoXPostp-V al of F -stat Demo DemoXPost
p-V al of F -stat Demo DemoXPost
p-V al of F -stat Demo DemoXPost
p-V al of F -stat
1) Excluding new economy firms 0.0080*** -0.0107** 0.48 0.0060** -0.0071* 0.75 0.0091*** -0.0127*** 0.35 0.0085*** -0.0098** 0.68(0.003) (0.005) (0.003) (0.004) (0.002) (0.005) (0.002) (0.004)
2) Excluding firms from top 1/3 0.0118*** -0.0155*** 0.40 0.0092*** -0.0117** 0.52 0.0114*** -0.0158*** 0.30 0.0099*** -0.0134*** 0.38 of most competitive industries (0.004) (0.006) (0.003) (0.005) (0.003) (0.005) (0.003) (0.005)
Democracy (G) vs. Dictatorship (G) Democracy (E) vs. Dictatorship (E)Excess returns (T -5,T +1)Raw returns (T -5,T +1)Excess returns (T -5,T +1)Raw returns (T -5,T +1)
Panel C: Robustness checks for Table 7
Demo DemoXPostp-V al of F -stat Demo DemoXPost
p-V al of F -stat Demo DemoXPost
p-V al of F -stat Demo DemoXPost
p-V al of F -stat
1) Excluding new economy firms -0.0057 -0.0037 0.31 -0.0007 0.0029 0.85 0.01678** -0.0308*** 0.12 0.0125** -0.0061 0.57(0.008) (0.011) (0.005) (0.013) (0.008) (0.012) (0.006) (0.013)
2) Excluding firms from top 1/3 0.0085 -0.0283** 0.04 0.0134 -0.0201 0.66 0.0189** -0.0394*** 0.03 0.0222*** -0.0224 0.99 of most competitive industries (0.009) (0.012) (0.012) (0.018) (0.007) (0.011) (0.007) (0.015)
Demo DemoXPostp-V al of F -stat Demo DemoXPost
p-V al of F -stat Demo DemoXPost
p-V al of F -stat Demo DemoXPost
p-V al of F -stat
1) Excluding new economy firms -0.6224 0.5743 0.79 -0.3426 -0.0445 0.62 27.7467*** -30.2197 0.90 1.0187*** -1.4507** 0.51(11.601) (24.111) (0.661) (0.878) (8.685) (20.351) (0.494) (0.762)
2) Excluding firms from top 1/3 15.0151 -41.7731* 0.09 0.5539 -1.5200 0.27 28.4450*** -46.8143*** 0.19 1.4152*** -2.2849*** 0.20 of most competitive industries (14.366) (23.394) (0.727) (1.051) (10.809) (17.099) (0.558) (0.788)
Democracy (G) vs. Dictatorship (G) Democracy (E) vs. Dictatorship (E)SUE FE (%) SUE FE (%)
FE scaled by price FE scaled by assets FE scaled by price FE scaled by assetsDemocracy (G) vs. Dictatorship (G) Democracy (E) vs. Dictatorship (E)