Embed Size (px)
Citation preview
Iowa’s MCH Data Capacity
Assessment
Breana Lipscomb
Lucia Dhooge
Debbie Kane
Session Objectives
• To describe:– The history & context of the MCH Data
Capacity Assessment– The survey development– How to conduct an assessment – The results and how to use the results
This Presentation
• We’ll be conversational
• You can ask questions at any time
• You’ll learn about our results and insights
• You’ll learn how to do the assessment in your state
Evolution of Iowa’s MCH Data Capacity Assessment
• How it beganHow it began
• How it evolvedHow it evolved
• Current statusurrent status
Key Question to be Answered
• What is “capacity” of data systems?
• Our Question: Do Iowa’s data systems furnish state and local MCH entities with needed data?
The Connection with Iowa SSDI
• SSDI Objectives
• Data Integration Steering Committee (DISC)
• MCH Data Integration Team
Iowa’s Results
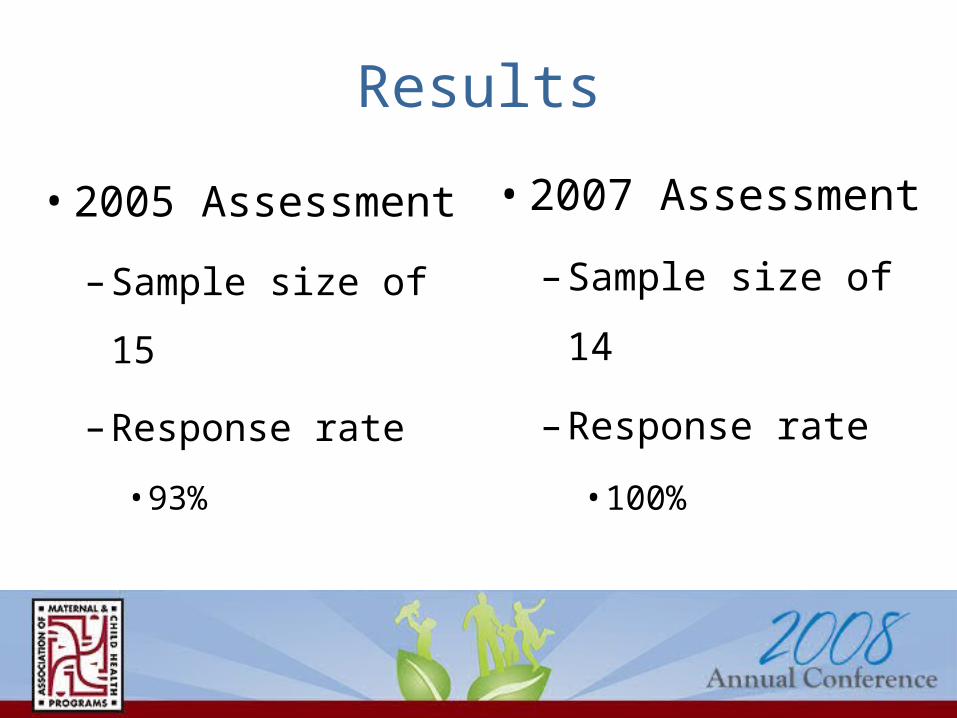
Results
• 2005 Assessment
– Sample size of 15
– Response rate
• 93%
• 2007 Assessment
– Sample size of 14
– Response rate
• 100%
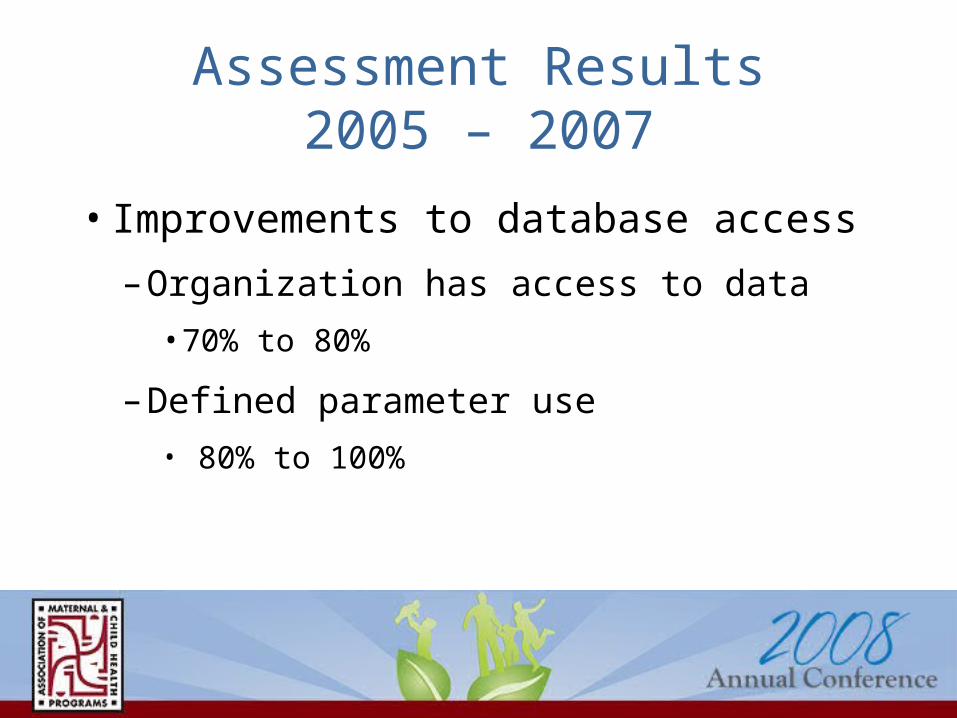
Assessment Results2005 – 2007
• Improvements to database access
– Organization has access to data
• 70% to 80%
– Defined parameter use
• 80% to 100%
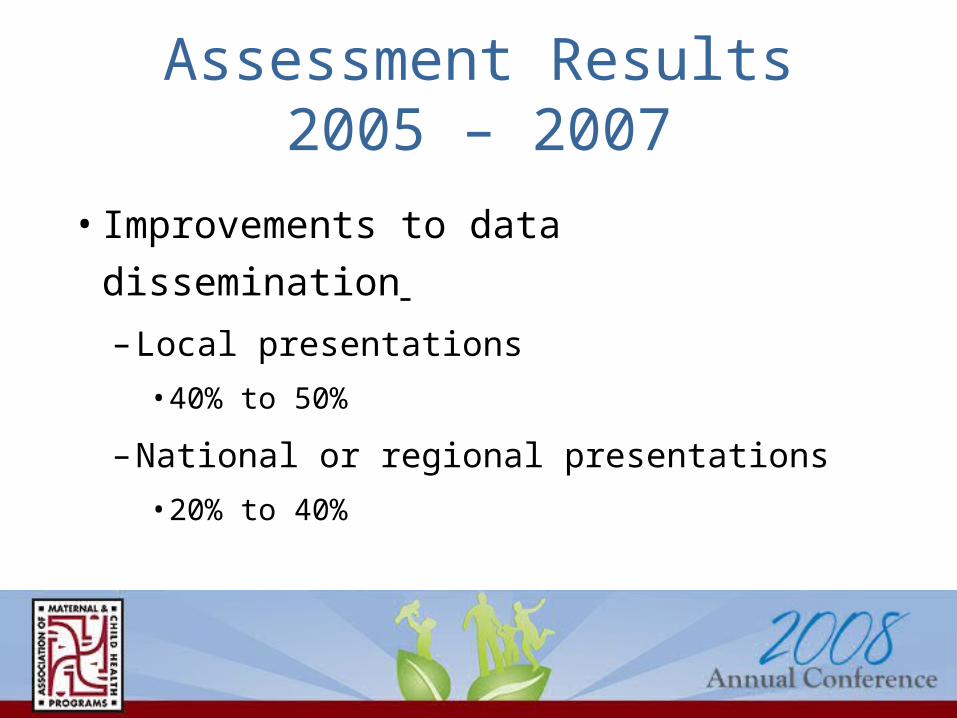
Assessment Results2005 – 2007
• Improvements to data dissemination
– Local presentations
• 40% to 50%
– National or regional presentations
• 20% to 40%
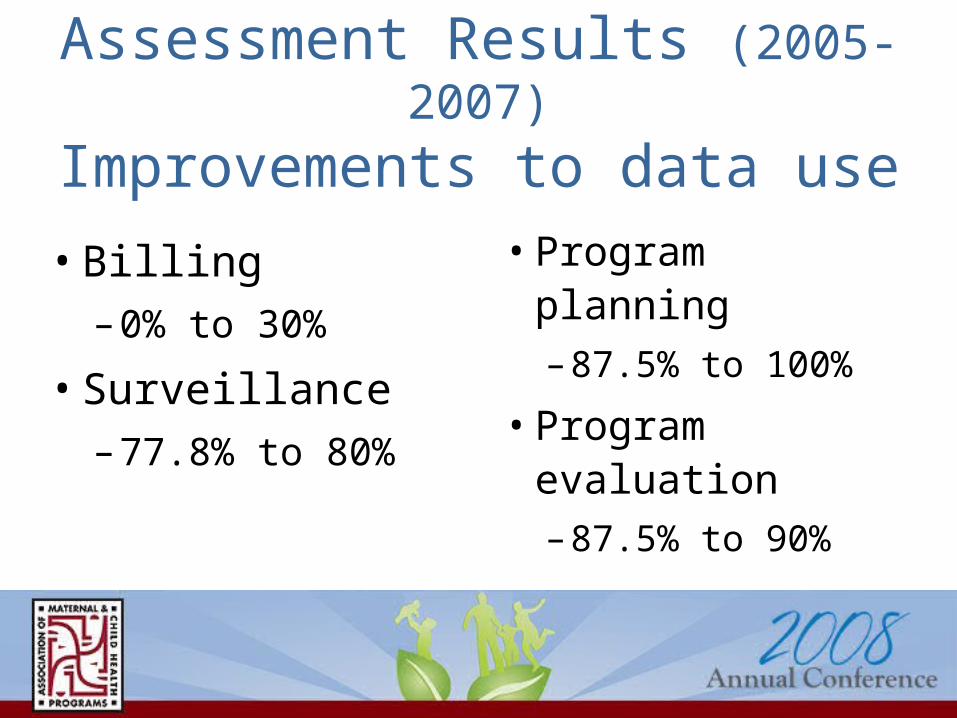
Assessment Results (2005-2007)
Improvements to data use
• Billing– 0% to 30%
• Surveillance– 77.8% to 80%
• Program planning– 87.5% to 100%
• Program evaluation– 87.5% to 90%
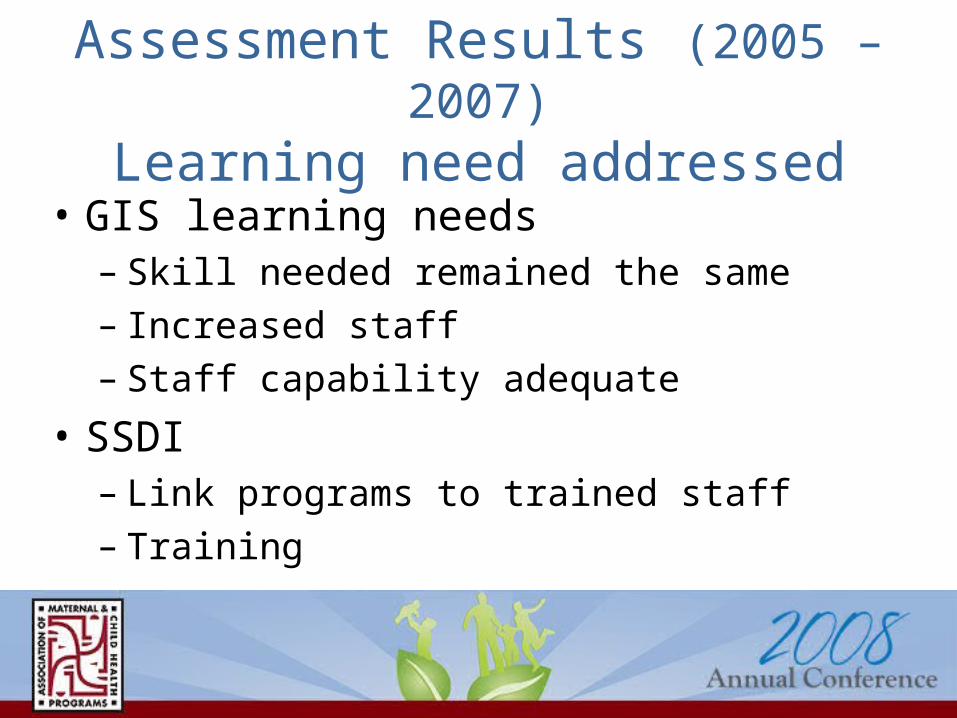
Assessment Results (2005 – 2007)Learning need addressed
• GIS learning needs– Skill needed remained the same– Increased staff– Staff capability adequate
• SSDI – Link programs to trained staff– Training
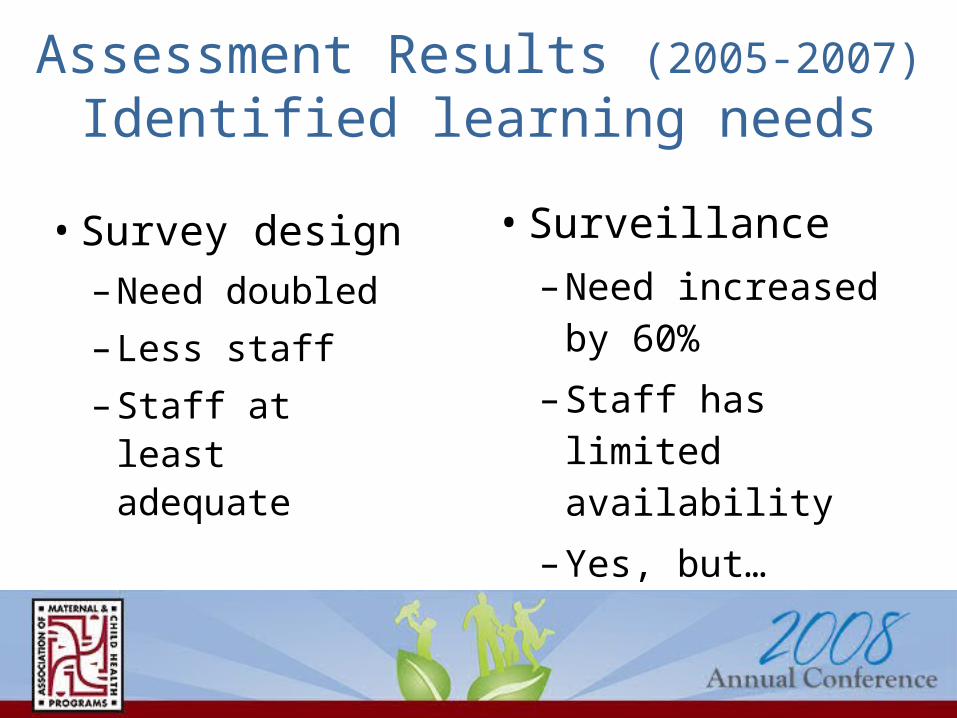
Assessment Results (2005-2007)
Identified learning needs
• Survey design– Need doubled
– Less staff
– Staff at least adequate
• Surveillance
– Need increased by 60%
– Staff has limited availability
– Yes, but…
Assessment Results (2005-2007)
Identified learning needs
• Linking data– Increased need
– Staff has limited availability
– Staff at least adequate
Results (2007)
Data Linkage• How many
• 8 of 14 data sets linked• Link with 1-3 new data sets
– What comprised the linkages?• Medicaid claims data• Vital records
Results (2007)
Data Linkage• Linkage trigger
– Majority are routine
• Linkage frequency– Wide variation
• Method– Deterministic
Results (2007)
Data Linkage
• Linkage process– Wide variation
• Elements gained by linkage– Demographics– Maternal behaviors during pregnancy– Infant outcomes

Here’s How You Can Do It!
Step One: Develop Survey Tool
• MCH EPI Team adapted the CSTE Assessment and Monitoring Tool for MCH Epidemiology and Data Capacity
• 2005 - Iowa “personalized” MCH EPI tool
• 2007 – Iowa revised tool based on 2005 lessons learned
Survey development
• Expanded Data Linkage section– Frequency– Method– Data Gained– Overall Benefit
Survey development
• Removed Staff Retention section
• Removed Population section
• Added Potential Use section
Survey development
• Separated Program and Policy Use sections
• Clarified Key Terms and Concepts– Linkage– Deterministic/Probabilistic
Step Two: Select Databases
• Which databases are relevant to MCH?
• Which databases do you want information about?
• Which persons are most knowledgeable about the databases?
Step Three: Determine Data Collection Method
• Interview or Written Response
• Points to Consider– Number of databases– Time to collect data– Relationship building– Learning aspect
Step Four: Request Interviews
• Release preliminary announcement
• Schedule interview
• Prepare assessment tool
Step Five: Conduct Interviews
• Explain purpose of the assessment
• Allow adequate time
• Probe for more detail
• Permit interviewee to speak freely
Step Six: Review Responses
• Transcribed interview into electronic format– Each interview was saved as separate file
• Follow up on any discrepancies or missing information
Step Seven: Crunch the Numbers
• Determine best method for counting responses– Tallying– Using a statistical program– Using Excel
Crunch the Numbers
• Statistical Software: SPSS– Create code book
• Provides special abbreviated name for each question in the tool
• Enter codes/abbreviations into SPSS
– Enter quantitative interview responses– Run frequency tests
Step Eight: So What?
• Strengthen areas of weakness
• Build capacity of all participants
Strengthen Areas of Weakness
1. Look at number crunches
2. Decide on area(s) of focus
3. Make a plan/timeline
4. Follow through
Building Participant Capacity
• They learn as they ask/answer questions
• They learn as they receive feedback
• They learn as they plan follow-through
• They learn!

You Can Do It!

Questions?

…and we are making a difference.