Embed Size (px)
Citation preview

New Directors Workshop
David Lipscomb UniversityJanuary 15, 2014
Understanding the BEP
3
BEP History and Explanation
4
History of the BEP
1977 – Enactment of the Tennessee Foundation Program, a funding formula that increased state contribution and used local property values to determine a county’s ability to pay
Late 1980’s – study of Tennessee Foundation Program State Board of Education began working with various
groups to reform education funding TFP appropriations were approximately $900 million Weaknesses in the TFP
• Inadequate• No adjustment for inflation• Targeted “formula” – inflexible funding• Insignificant amount of funding resulting from consideration of
local ability to pay
5
History of the BEP
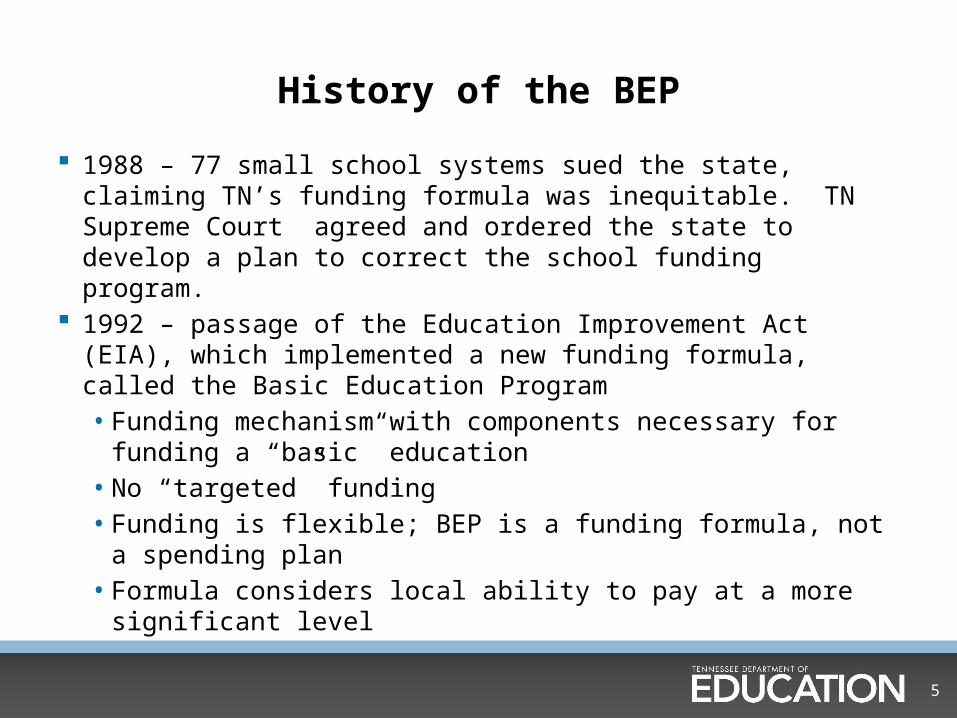
1988 – 77 small school systems sued the state, claiming TN’s funding formula was inequitable. TN Supreme Court agreed and ordered the state to develop a plan to correct the school funding program.
1992 – passage of the Education Improvement Act (EIA), which implemented a new funding formula, called the Basic Education Program• Funding mechanism with components necessary for funding a
“basic” education• No “targeted” funding• Funding is flexible; BEP is a funding formula, not a spending plan• Formula considers local ability to pay at a more significant level
6
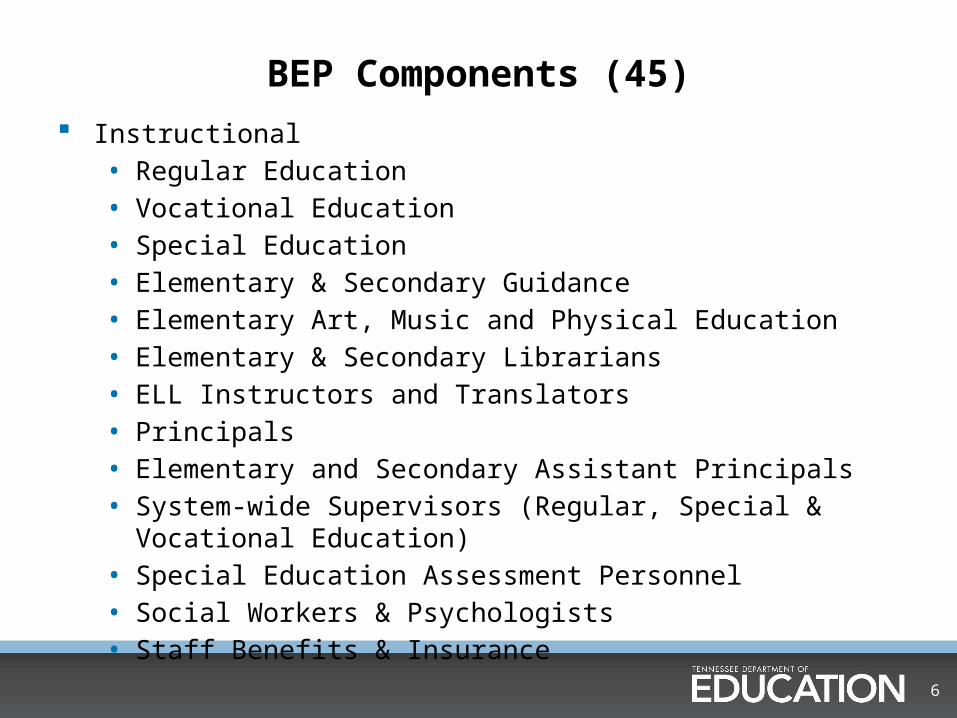
BEP Components (45) Instructional
• Regular Education• Vocational Education• Special Education• Elementary & Secondary Guidance• Elementary Art, Music and Physical Education• Elementary & Secondary Librarians• ELL Instructors and Translators• Principals• Elementary and Secondary Assistant Principals• System-wide Supervisors (Regular, Special & Vocational Education)• Special Education Assessment Personnel• Social Workers & Psychologists• Staff Benefits & Insurance
7
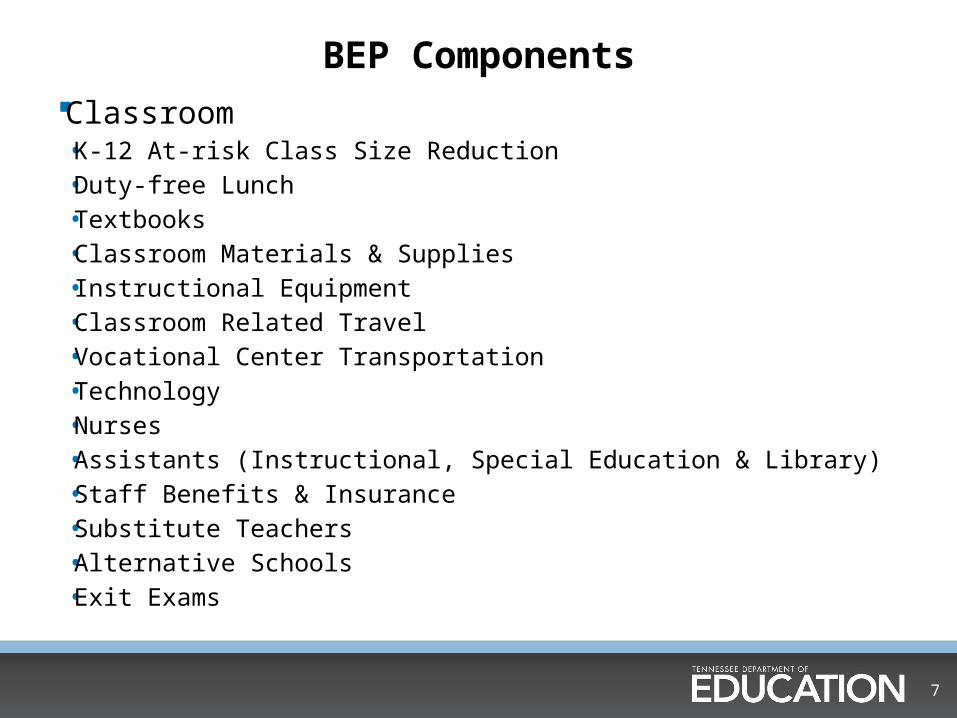
BEP Components Classroom
• K-12 At-risk Class Size Reduction• Duty-free Lunch• Textbooks• Classroom Materials & Supplies• Instructional Equipment• Classroom Related Travel• Vocational Center Transportation• Technology• Nurses• Assistants (Instructional, Special Education & Library)• Staff Benefits & Insurance• Substitute Teachers• Alternative Schools• Exit Exams
8
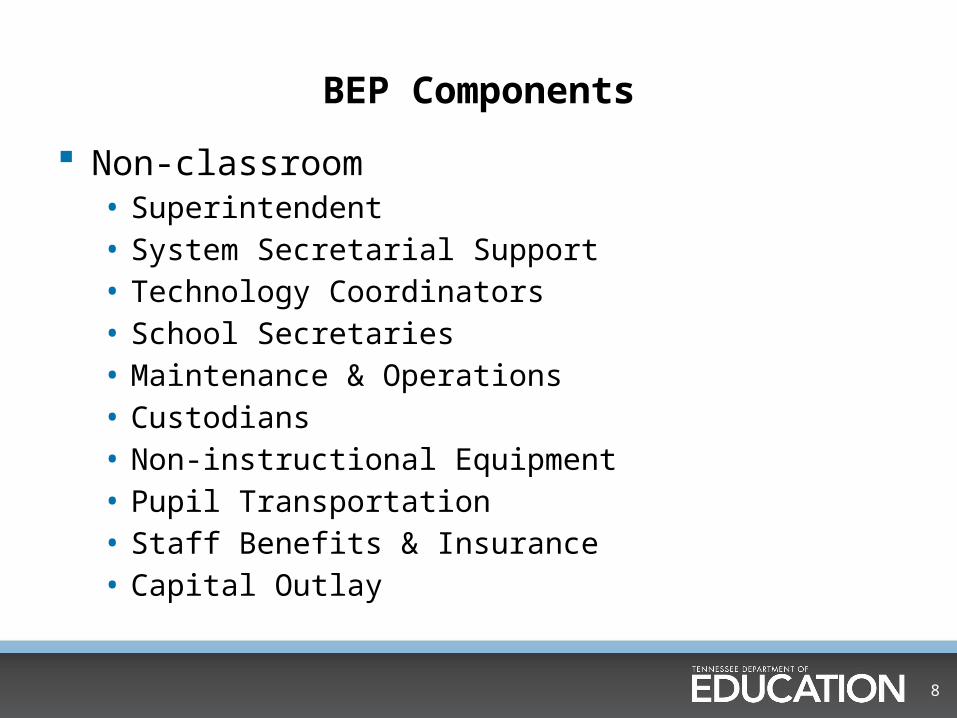
BEP Components
Non-classroom• Superintendent• System Secretarial Support• Technology Coordinators• School Secretaries• Maintenance & Operations• Custodians• Non-instructional Equipment• Pupil Transportation• Staff Benefits & Insurance• Capital Outlay
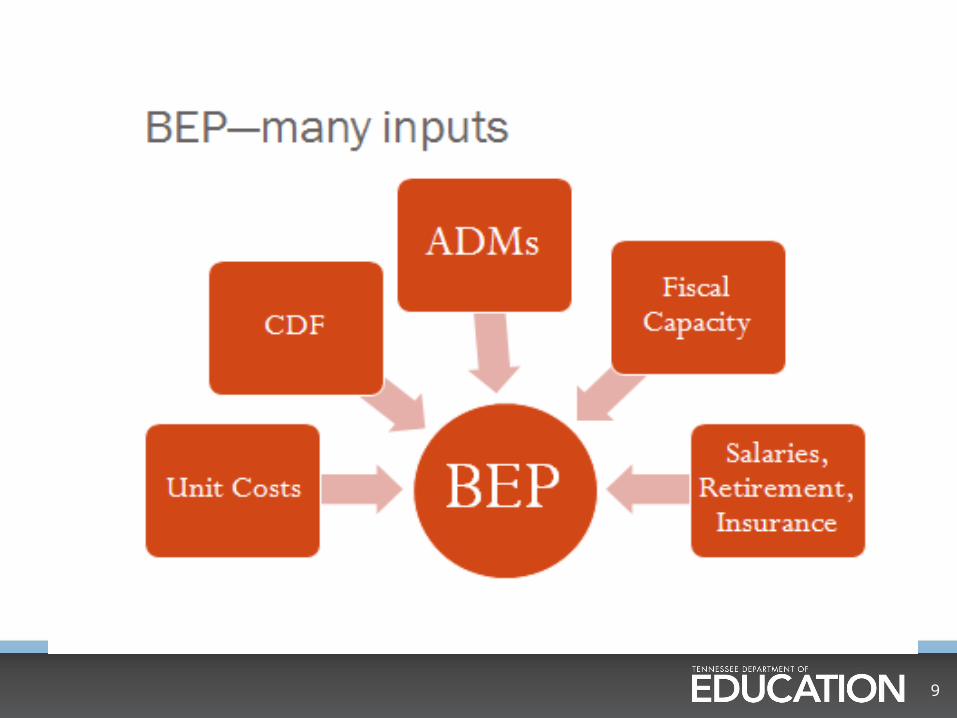
9
10
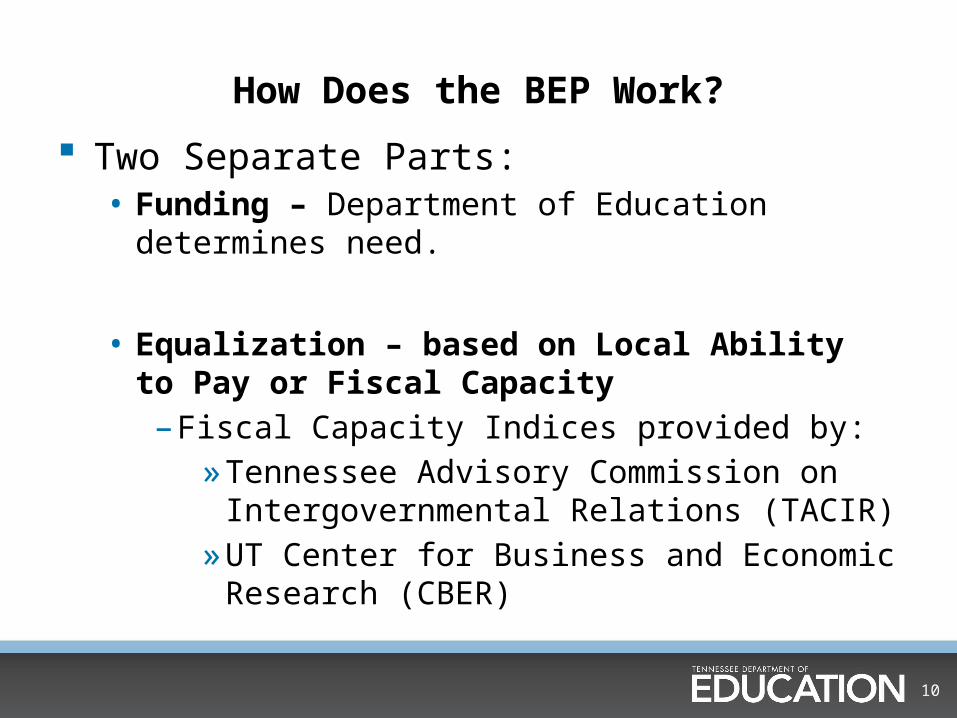
How Does the BEP Work?
Two Separate Parts:• Funding – Department of Education determines need.
• Equalization – based on Local Ability to Pay or Fiscal Capacity– Fiscal Capacity Indices provided by:»Tennessee Advisory Commission on
Intergovernmental Relations (TACIR)»UT Center for Business and Economic Research
(CBER)
11
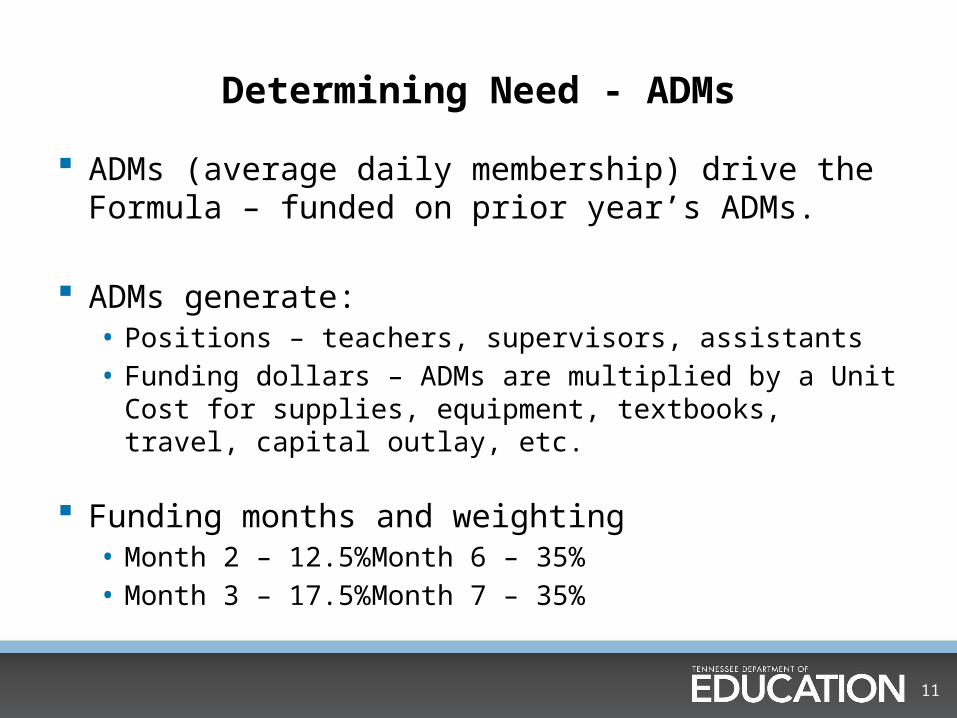
Determining Need - ADMs
ADMs (average daily membership) drive the Formula – funded on prior year’s ADMs.
ADMs generate:• Positions – teachers, supervisors, assistants• Funding dollars – ADMs are multiplied by a Unit Cost for
supplies, equipment, textbooks, travel, capital outlay, etc.
Funding months and weighting• Month 2 – 12.5% Month 6 – 35%• Month 3 – 17.5% Month 7 – 35%
12
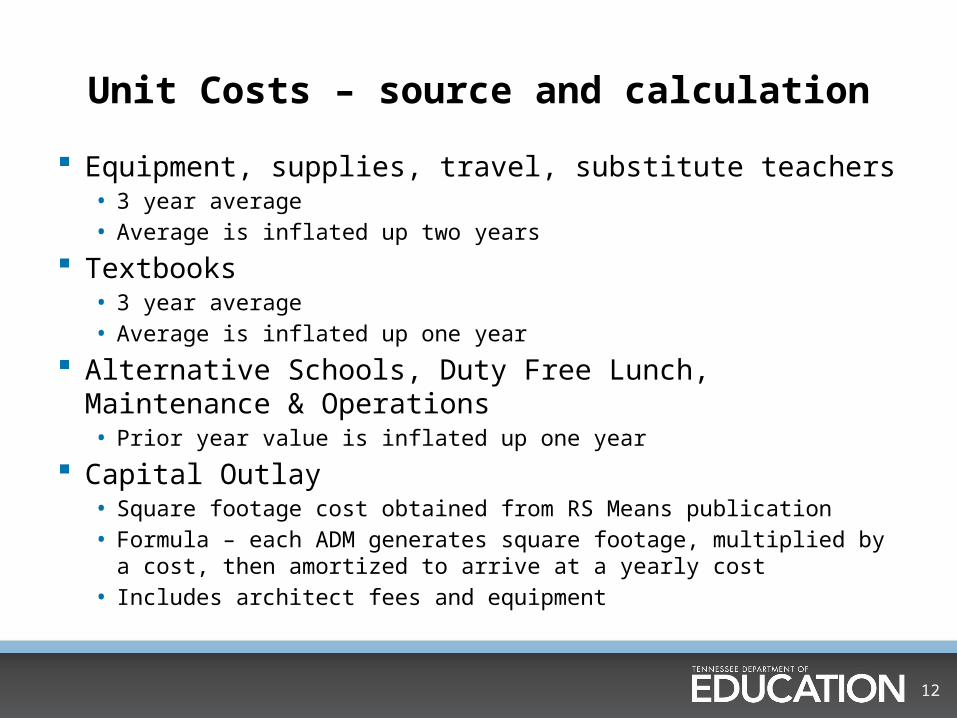
Unit Costs – source and calculation
Equipment, supplies, travel, substitute teachers • 3 year average• Average is inflated up two years
Textbooks• 3 year average• Average is inflated up one year
Alternative Schools, Duty Free Lunch, Maintenance & Operations• Prior year value is inflated up one year
Capital Outlay• Square footage cost obtained from RS Means publication• Formula – each ADM generates square footage, multiplied by a cost, then
amortized to arrive at a yearly cost• Includes architect fees and equipment
13
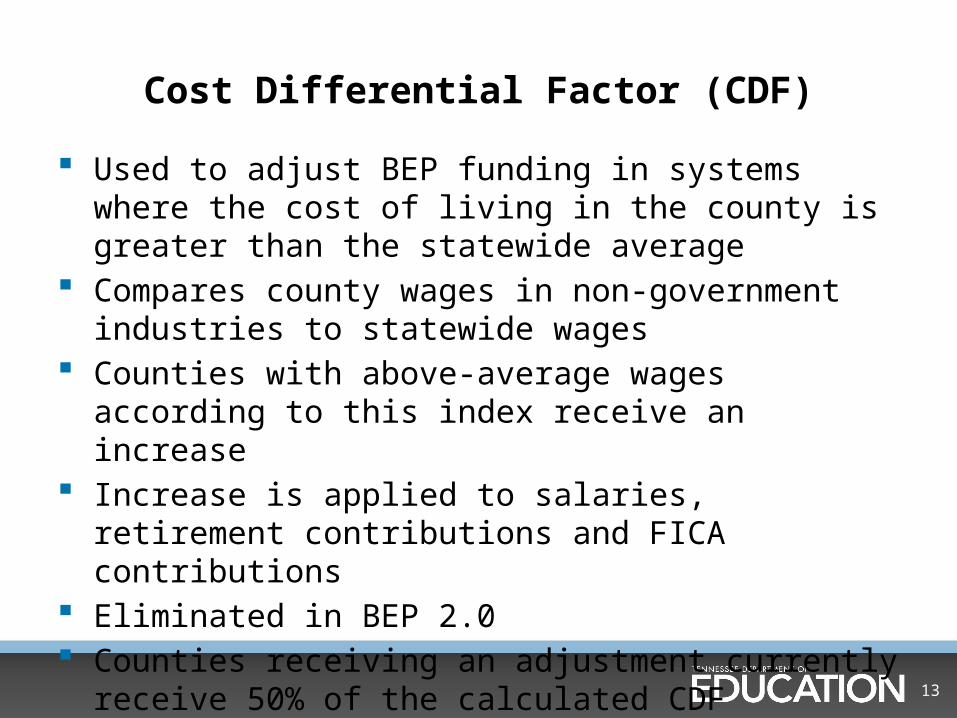
Cost Differential Factor (CDF)
Used to adjust BEP funding in systems where the cost of living in the county is greater than the statewide average
Compares county wages in non-government industries to statewide wages
Counties with above-average wages according to this index receive an increase
Increase is applied to salaries, retirement contributions and FICA contributions
Eliminated in BEP 2.0 Counties receiving an adjustment currently receive 50% of the
calculated CDF
14
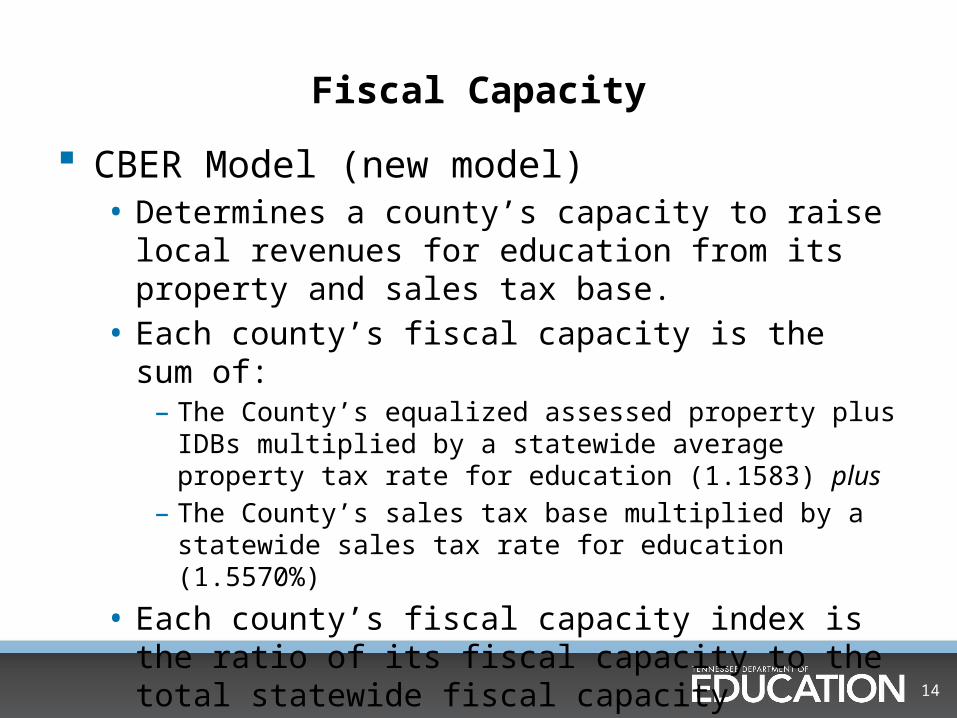
Fiscal Capacity
CBER Model (new model)• Determines a county’s capacity to raise local revenues for
education from its property and sales tax base.• Each county’s fiscal capacity is the sum of:
– The County’s equalized assessed property plus IDBs multiplied by a statewide average property tax rate for education (1.1583) plus
– The County’s sales tax base multiplied by a statewide sales tax rate for education (1.5570%)
• Each county’s fiscal capacity index is the ratio of its fiscal capacity to the total statewide fiscal capacity
15
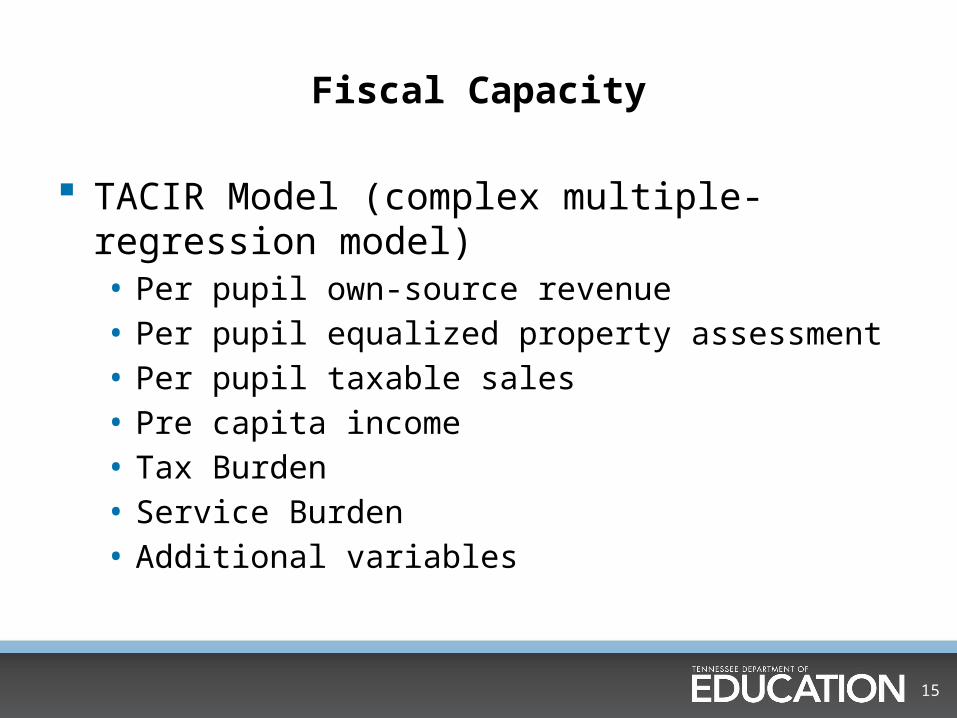
Fiscal Capacity
TACIR Model (complex multiple-regression model)• Per pupil own-source revenue• Per pupil equalized property assessment• Per pupil taxable sales• Pre capita income• Tax Burden• Service Burden• Additional variables
16
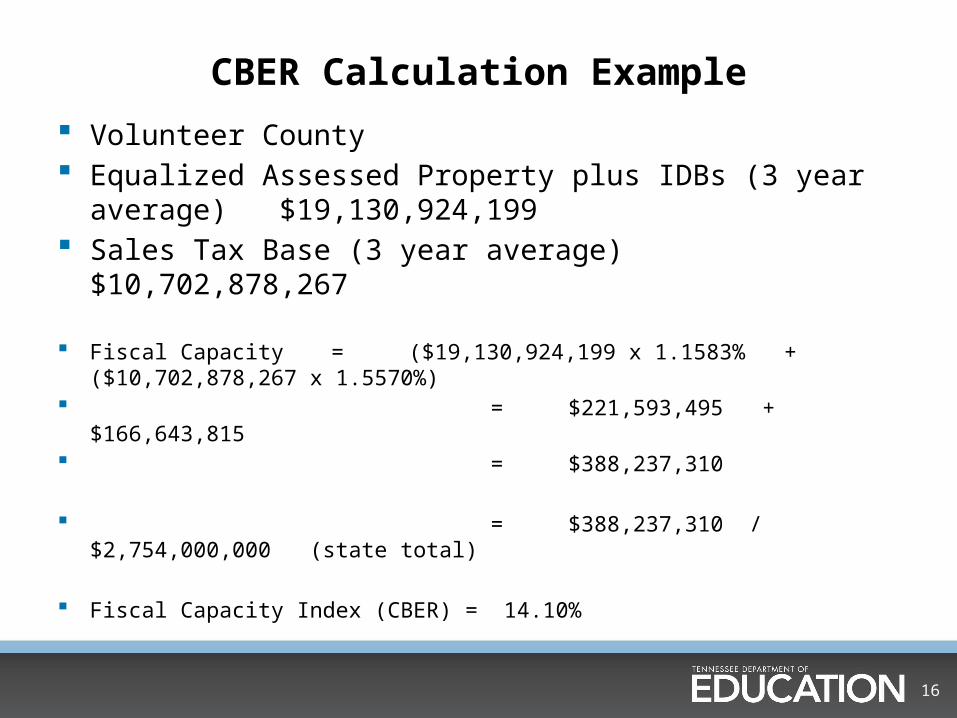
CBER Calculation Example
Volunteer County Equalized Assessed Property plus IDBs (3 year average)
$19,130,924,199 Sales Tax Base (3 year average)
$10,702,878,267
Fiscal Capacity = ($19,130,924,199 x 1.1583% + ($10,702,878,267 x 1.5570%)
= $221,593,495 + $166,643,815 = $388,237,310
= $388,237,310 / $2,754,000,000 (state total)
Fiscal Capacity Index (CBER) = 14.10%
17
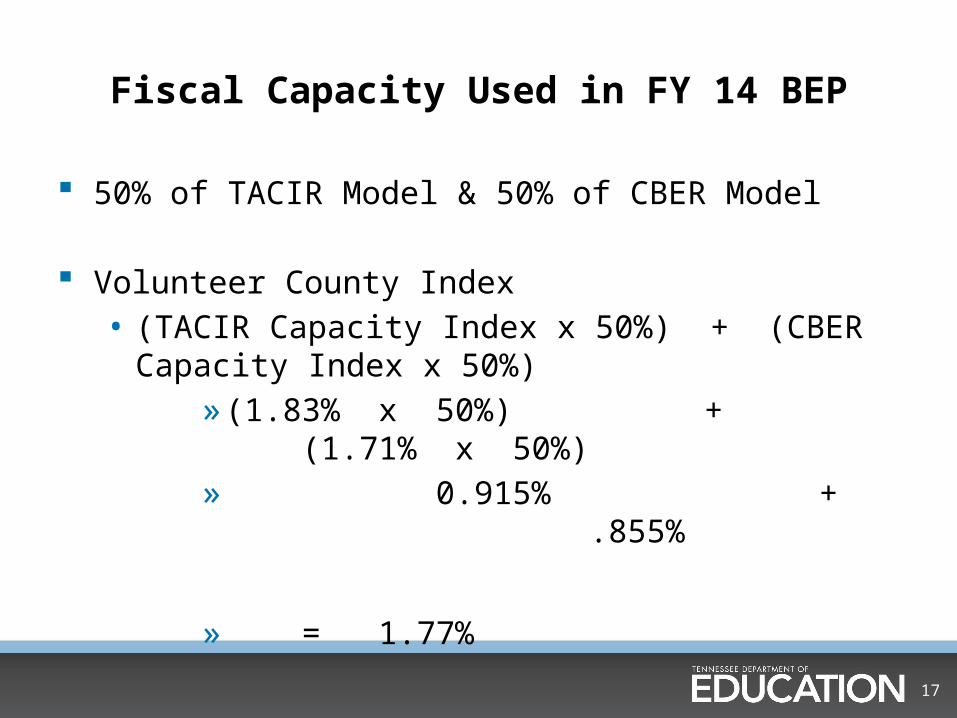
Fiscal Capacity Used in FY 14 BEP
50% of TACIR Model & 50% of CBER Model
Volunteer County Index• (TACIR Capacity Index x 50%) + (CBER Capacity Index x
50%)» (1.83% x 50%) + (1.71% x 50%)» 0.915% + .855%
» = 1.77%
18
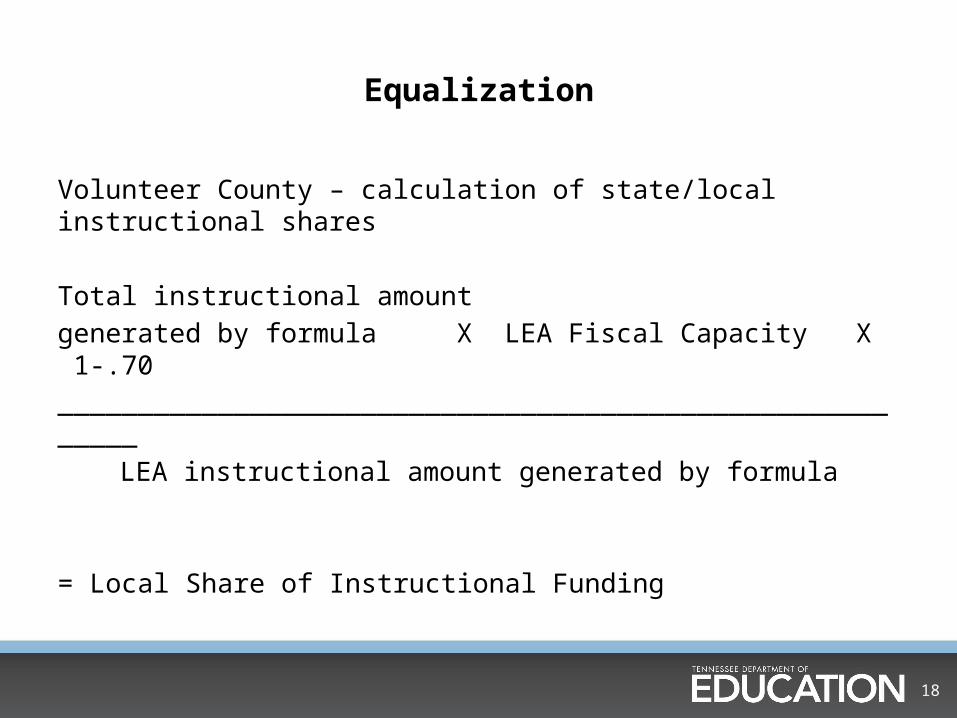
Equalization
Volunteer County – calculation of state/local instructional shares
Total instructional amount generated by formula X LEA Fiscal Capacity X 1-.70_________________________________________________________
LEA instructional amount generated by formula
= Local Share of Instructional Funding
19
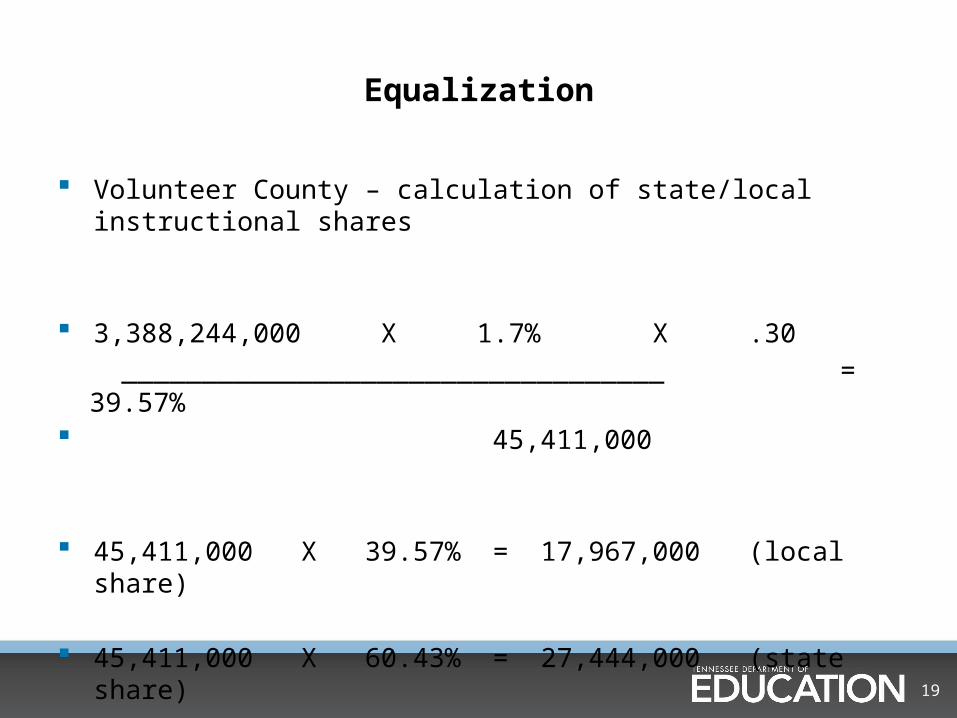
Equalization
Volunteer County – calculation of state/local instructional shares
3,388,244,000 X 1.7% X .30 __________________________________ = 39.57% 45,411,000
45,411,000 X 39.57% = 17,967,000 (local share)
45,411,000 X 60.43% = 27,444,000 (state share)
20
Maintenance of Effort
Supplanting test used to insure maintenance of local effort
Governed by TCA 49-2-203 and TCA 49-3-314
Budgeted local revenue must be equal to or greater than the previous year’s budgeted amount, unless ADMs have decreased
21
3% Fund Balance Test
If budgeted expenditures exceed revenues, LEA must have 3% of operating expenditures in fund balance before budget will be approved by the State.
22
Uses of Fund Balance
Governed by TCA 49-3-352(c) Provisions applicable after operating budget is
adopted• . . . Shall be available to offset shortfalls of budgeted
revenues . . .• . . . Shall be available to meet unforeseen increases in
operating expenses
23
Uses of Fund Balance
The accumulated fund balance in excess of three percent (3%) of the budgeted annual operating expenses for the current fiscal year may be budgeted and expended for any education purposes but must be recommended by the board of education prior to appropriation by the local legislative body.
24
Uses of Fund Balance
In other words, there is no requirement to have 3% of operating expenditures in fund balance – BUT LEAs cannot use fund balance unless the fund balance exceeds 3% of operating expenditures.
If fund balance is in excess of 3% of operating expenditures, then the excess can be used for any education purpose, as long as the use is first approved by the board of education.
25
Stability Provision
An LEA is on stability if the total state BEP funds it generates in the current year are less than the total state BEP funds generated the previous year.
Occurs most often due to declining ADMs. Provides a one-year grace period before funding is reduced.
26
Mandatory Increase
Allows systems on stability to receive additional funds for state-mandated increases in salary, TCRS contributions or insurance.
Receives mandatory increase amount for each BEP generated position.
Received in addition to stability amount
27
For further information . . .
Tennessee Basic Education Program: An Analysis• http://www.comptroller1.state.tn.us/orea/• See legislative brief
State Board of Education• http://www.tn.gov/sbe/bep.html• BEP Blue Book – up to date data on BEP components• Recommendations of BEP Review Committee
28
QUESTIONS?
29
FRAUD, WASTE or ABUSE
Citizens and agencies are encouraged to report fraud, waste or abuse in State and Local government.
NOTICE: This agency is a recipient of taxpayer funding. If you observe an agency director or employee engaging in any activity which you consider to be illegal, improper or wasteful, please call the state Comptroller’s toll-free
Hotline:
1-800-232-5454
Notifications can also be submitted electronically at:
http://www.comptroller.tn.gov/hotline