Embed Size (px)
Citation preview

Informes Técnicos Ciemat 1146Mayo, 2008
Departamento de Medio Ambiente
Effect of Heating/Hydration onCompacted Bentonite:Tests in 60-cm Long Cells
Mª. Victoria VillarA. Mª. FernándezP. L. MartínJ. M. BarcalaR. Gómez-EspinaP. Rivas

Toda correspondencia en relación con este trabajo debe dirigirse al Servicio de In-formación y Documentación, Centro de Investigaciones Energéticas, Medioambientales y Tecnológicas, Ciudad Universitaria, 28040-MADRID, ESPAÑA.
Las solicitudes de ejemplares deben dirigirse a este mismo Servicio.
Los descriptores se han seleccionado del Thesauro del DOE para describir las ma-terias que contiene este informe con vistas a su recuperación. La catalogación se ha hecho utilizando el documento DOE/TIC-4602 (Rev. 1) Descriptive Cataloguing On-Line, y la cla-sificación de acuerdo con el documento DOE/TIC.4584-R7 Subject Categories and Scope publicados por el Office of Scientific and Technical Information del Departamento de Energía de los Estados Unidos.
Se autoriza la reproducción de los resúmenes analíticos que aparecen en esta pu-blicación.
Editorial CIEMAT
Catálogo general de publicaciones oficialeshttp://www.060.es
Depósito Legal: M -14226-1995ISSN: 1135 - 9420NIPO: 471-08-027-1

CLASIFICACIÓN DOE Y DESCRIPTORES
S12
BENTONITE; TESTING; TEMPERATURE MEASUREMENT, HEATING; HIGH-LEVEL RADIOACTIVE WASTES

Effect of Heating/Hydratation on Compacted Bentonite:Tests in 60-cm Long Cells
Villar, M. V.; Fernández, A. M.; Martín, P. L.; Barcala, J. M.; Gómez-Espina, R.; Rivas, P.
72 pp. 64 figs. 50 refs.
Abstract:
The conditions of the bentonite in an engineered barrier for high-level radioactive waste disposal have been simulated in a series of tests. Cylindrical cells with an inner length of 60 cm and a diameter of 7 cm were constructed. Inside the cells, blocks of compacted FEBEX bentonite were put one on top of the other. The bottom surface of the material was heated at 100°C and the top surface was injected with granitic water. The duration of the tests was 0.5, 1, 2 and 7.6 years. The temperatures and water intake were measured during the tests and, at the end, the cells were dismounted and the dry density, water content, mineralogy, geoche-mistry and some hydro-mechanical properties of the clay (permeability, swelling) were measured at different positions. The values obtained are compared among them and to those of the untreated FEBEX bentonite. The study has run over for 10 years in the context of the projects FEBEX I and II and NF-PRO.
Efectos del Calentamiento y la Hidratación en Bentonita Compactada:Ensayos en Celdas de 60 cm
Villar, M. V.; Fernández, A. M.; Martín, P. L.; Barcala, J. M.; Gómez-Espina, R.; Rivas, P.
72 pp. 64 figs. 50 refs.
Resumen:
Mediante una serie de ensayos se han reproducido las condiciones a las que estará sometida la bentonita en la barrera de un almacenamiento de residuos radiactivos de alta actividad. Los ensayos se realizaron en celdas cilindricas de diámetro interno 7 cm y altura 60 cm en cuyo interior se apilaron bloques de bentonita FEBEX compactada. La base de las columnas de bentonita se calentó a 100°C, mientras que por su parte superior se inyectó agua granítica. Los ensayos tuvieron una duración de 0,5, 1, 2 y 7,6 años. Durante los ensayos se midió la temperatura de la bentonita y la entrada de agua. Al acabar los ensayos se muestreó la bentonita para determinar en numerosas posiciones su densidad seca, humedad, mineralogía, geoquímica y propiedades hidro-mecánicas (permeabilidad, hinchamiento). Los valores obtenidos para los diferentes ensayos se comparan entre sí y con la bentonita de referencia. El estudio se ha prolongado durante más de diez años en el contexto de los proyectos FEBEX I y II y NF-PRO.


TABLE OF CONTENTS
1 INTRODUCTION ............................................................................................................ 1 2 MATERIAL: THE FEBEX BENTONITE .................................................................... 2 3 METHODOLOGY........................................................................................................... 6
3.1 Thermo-hydraulic tests............................................................................................... 6 3.2 Postmortem analysis................................................................................................. 10
3.2.1 Basic properties: water content and dry density............................................... 11 3.2.2 Basal spacing by X-ray diffraction in unaltered samples................................. 11 3.2.3 External surface area ........................................................................................ 12 3.2.4 Mineralogy and microstructure: XRD, FTIR and SEM................................... 12 3.2.5 Pore water chemistry........................................................................................ 13 3.2.6 Cationic exchange capacity and exchangeable cations .................................... 15 3.2.7 Hydraulic conductivity..................................................................................... 15 3.2.8 Swelling capacity ............................................................................................. 16 3.2.9 Swelling pressure ............................................................................................. 18
4 RESULTS........................................................................................................................ 19 4.1 Thermo-hydraulic tests............................................................................................. 19 4.2 Postmortem analysis................................................................................................. 23
4.2.1 Water content and dry density.......................................................................... 26 4.2.2 Basal spacing by X-ray diffraction in unaltered samples................................. 29 4.2.3 External surface area ........................................................................................ 30 4.2.4 Mineralogy and microstructure ........................................................................ 31 4.2.5 Pore water chemistry........................................................................................ 37 4.2.6 Exchangeable cations ....................................................................................... 46 4.2.7 Hydraulic conductivity..................................................................................... 49 4.2.8 Swelling capacity ............................................................................................. 51 4.2.9 Swelling pressure ............................................................................................. 56
4.3 Geochemical modelling and analysis of test CG3 ................................................... 59 5 DISCUSSION ON MINERALOGICAL AND GEOCHEMICAL RESULTS......... 62 6 SUMMARY AND CONCLUSIONS ............................................................................ 65 7 ACKNOWLEDGEMENTS........................................................................................... 68 8 REFERENCES ............................................................................................................... 69 ANNEX

Effect of heating/hydration on compacted bentonite: tests in 60-cm long cells 1
EFFECT OF HEATING/HYDRATION ON BENTONITE: TESTS
IN 60-cm LONG CELLS
1 INTRODUCTION
The design of high-level radioactive waste (HLW) repositories in deep geological media includes the construction of a barrier around the waste containers constituted by a sealing material. Bentonite has been chosen as sealing material in most disposal concepts because of its low permeability, swelling capacity and retention properties, among other features. The behaviour of a HLW repository is determined, to a large extent, by the characteristics of the design and construction of the engineered barriers and especially by the changes that may occur in their mechanical, hydraulic, and geochemical properties as a result of the combined effects of the heat generated by the radioactive decay and of the water and solutes supplied by the surrounding rock. Therefore, it is considered of fundamental importance for the evaluation of the long-term behaviour of the repository that the processes taking place in the near-field be understood and quantified.
Much attention has been paid since the 1980s to the performance of tests at different scales, in both the laboratory and the field, in order to observe the thermo-hydro-mechanical and chemical (THM-C) processes taking place in the engineered barriers and the geological medium. The purpose of these experiments has been the direct observation of the phenomena occurring in the barrier and of the behaviour of the system, this providing the information required for the verification and validation of the mathematical models of the coupled processes and their numerical implementation.
The performance of large-scale in situ tests is complicated and time-consuming and the boundary conditions in them are not always well controlled and known. For this reason, laboratory tests at different scales in which the conditions of the bentonite in an engineered barrier for HLW disposal are simulated are very useful to identify and quantify processes (Villar et al. 1996, Cuevas et al. 1997, 2002).
The work presented here started in the framework of FEBEX, which was a project for the study of the near field for a HLW repository in crystalline rock according to the Spanish reference concept (ENRESA 1995, 2000, 2006a). The experimental work of the FEBEX Project consisted of three main parts: an in situ test, under natural conditions and at full scale (Grimsel, Switzerland); a mock-up test, at almost full scale (CIEMAT, Madrid); and a series of laboratory tests to complement the information from the two large-scale tests. Among the laboratory tests started in the framework of the FEBEX Project and continued in the NF-PRO Project were those performed in cells in which the compacted bentonite is subjected simultaneously to heating and hydration, in opposite directions, in order to simulate the conditions of the clay barrier in the repository and better understand the hydration/heating processes and their consequences on bentonite performance. In particular, a series of infiltration tests performed under thermal gradient were dismantled after 0.5, 1, 2 and 7.6 years (Villar 2001, Villar et al. 2005, 2006, 2007). These laboratory tests reproduced the conditions of the barrier in the two large-scale tests of the FEBEX Project (in situ and mock-up), which in turn were set according to the Spanish HLW disposal concept for granite (ENRESA 1995). Thus, the bentonite was compacted with its hygroscopic water content to a
INTRODUCTION
2 Villar, Fernández, Martín, Barcala, Gómez-Espina, Rivas
dry density of 1.65 g/cm3, the temperature of the heater was set at 100°C and the hydration water was granitic. Also, the length of the bentonite columns was very close to the thickness of the barrier in the mock-up test (62 cm) and in the in situ test, which is the same than that of the Spanish concept (65 cm).
The measurements performed during the operation of the TH tests and the results obtained in the postmortem characterisation of the bentonite are presented and analysed in this report. The final analysis of the bentonite included mineralogical, geochemical, microstructural, hydro-mechanical and hydro-chemical studies. A complete set of the results obtained is given in the Annex. The comparison of the results obtained in the different tests allows to get a temporal evolution of some of the bentonite properties.
Apart from this investigation, the other information available concerning the state of the FEBEX bentonite after long-term TH treatment under representative conditions is that obtained upon partial dismantling of the FEBEX in situ test. After five years of operation, heater 1 of the FEBEX experiment at the Grimsel Test Site was switched off in February 2002. After cooling of the system for four months, the bentonite barrier was dismantled and the heater extracted. During dismantling many bentonite samples were taken. Several determinations were carried out in these samples, and the results obtained are reported in Villar et al. (2004, 2005b) and ENRESA (2006b).
2 MATERIAL: THE FEBEX BENTONITE
The tests were performed with a bentonite coming from the Cortijo de Archidona deposit (Almería, Spain) which was selected by ENRESA as suitable material for the backfilling and sealing of HLW repositories. It is the same clay material used in the FEBEX Project to manufacture the blocks of the large-scale tests. The processing at the factory consisted on disaggregation and gently grinding, drying at 60°C and sieving by 5 mm.
The physico-chemical properties of the FEBEX bentonite, as well as its most relevant thermo-hydro-mechanical and geochemical characteristics obtained during FEBEX I are summarised in the final reports of the project (ENRESA 2000, 2006a) and are shown in detail in ENRESA (1998), Villar (2000, 2002), Lloret et al. (2002, 2004), Fernández (2004), Fernández et al. (2004) and Missana et al. (2004). Several laboratories participated in these characterisation tasks. A summary of the results obtained is given below.
The mineralogical composition of the FEBEX bentonite was analysed by X-ray diffraction. The montmorillonite content is higher than 90 percent (92±3 %). The smectitic phases are actually made up of a smectite-illite mixed layer, with 10-15 percent of illite layers. Besides, the bentonite contains variable quantities of quartz (2±1 %), plagioclase (2±1 %), K-felspar, calcite and opal-CT (cristobalite-trydimite, 2±1 %). By weight from dense concentrates and SEM observation, the following minerals have been identified: mica (biotite, sericite, muscovite), chlorite, non-differentiated silicates (Al, K, Fe, Mg, Mn), augite-diopside, hypersthene, hornblende, oxides (ilmenite, rutile, magnetite, Fe-oxides), phosphates (apatite, xenotime, monacite) and other non differentiated minerals of titanium and rare earth. Their contribution to bentonite composition is around 0.8 percent.
The mineralogical composition was also observed and quantified by optical microscopy study of thin sections. The textural heterogeneity itself is the main feature that can be described in the sample. The FEBEX bentonite is mainly composed of clay aggregates. The remaining

MATERIAL: THE FEBEX BENTONITE
Effect of heating/hydration on compacted bentonite: tests in 60-cm long cells 3
elements of the texture are glassy materials, volcanic rock fragments and individual accessory minerals (quartz and felspars). Calcite is usually present as sparitic crystals replacing felspars, but it has been observed also as isolated micritic cements.
The chemical composition of an aqueous extract of bentonite:water ratio of 1:4 is presented in Table I and the major components of the pore water extracted by squeezing from the bentonite with an initial water content of 23.8% are shown in Table II. In both cases the pH, ionic strength (IS) and electric conductivity of the solutions (EC) are also given. The content of chlorides and sulphates is worthy of mention.
Table III shows the average content values of the exchangeable cations along with the cation exchange capacity (CEC), as determined by different methods.
Table I: Solubilised elements in the 1:4 bentonite:water aqueous extract, in mmol/100 g of dried clay (first line) and in mg/L (second line) (Fernández 2004, ENRESA 2000)
pH IS
(M) EC25°C
(µS/cm) Cl- SO4
2- HCO3- Na+ K+ Mg2+ Ca2+ Sr2+ Fe3+ SiO2
8.73 0.01 1135 1.979 0.979 1.184 5.017 0.073 0.055 0.050 0.0004 0.0017 0.145 150 201 154 246 6.1 2.9 4.3 0.1 0.2 19
Table II: Chemical composition (major components) of the pore water obtained by squeezing at 64 MPa from the FEBEX bentonite at 23.8% water content, in mg/L (Fernández 2004)
pH IS (M) EC25°C (µS/cm) Cl- SO42- HCO3
- Na+ K+ Mg2+ Ca2+
7.38 0.19 13230 4000 1260 133 2100 15 390 510
Table III: Average values of exchangeable cations and cation exchange complex (CEC) as determined by different methods (meq/100g)
CIEMATa CIEMATb
Ca2+ 42 ± 3 35 ± 2
Mg2+ 32 ± 2 31 ± 3
Na+ 25 ± 2 27 ± 0
K+ 2.5 ± 0.3 2.6 ± 0.4
Sum of exchangeable cations 96 ± 0
CECc 102 ± 4 aDetermined by displacement by 1M NH4AcO at pH 7 after washing of soluble salts (ENRESA 2000), the values are recalculated to give a sum of cations equal to CEC; bDetermined by displacement by 0.5M CsNO3 at pH 7 (Fernández 2004); cDetermined by NaAcO/NH4AcO pH=8.2 (ENRESA 2000)

MATERIAL: THE FEBEX BENTONITE
4 Villar, Fernández, Martín, Barcala, Gómez-Espina, Rivas
The liquid limit of the bentonite is 102±4 percent, the specific gravity 2.70±0.04, and 67±3 percent of particles are smaller than 2 µm. The hygroscopic water content in equilibrium with the laboratory atmosphere (relative humidity 50±10 %, temperature 21±3 °C, total suction about 100 MPa) is 13.7±1.3 percent. The value obtained for the external specific surface area using the nitrogen adsorption technique is 32±3 m2/g if the single point BET method is used, and 56±3 m2/g when the complete isotherm is considered. The total specific surface area obtained using the Keeling hygroscopicity method is about 725 m2/g. The analysis of the mercury intrusion data reveals that the intra-aggregate pores (smaller than 0.006 µm) represent the 73-78 percent of total pore volume when the bentonite is compacted at a dry density of 1.7 g/cm3.
The saturated permeability to deionised water (kw, m/s) of samples of untreated FEBEX bentonite compacted at different dry densities is exponentially related to dry density (ρd, g/cm3). A distinction may be made between two different empirical fittings depending on the density interval:
for dry densities of less than 1.47 g/cm3:
log kw = -6.00 ρd – 4.09 (r2 = 0.97, 8 points) [1]
for dry densities in excess of 1.47 g/cm3:
log kw = -2.96 ρd – 8.57 (r2 = 0.70, 26 points) [2]
The determinations were done at room temperature. The variation in the experimental values with respect to these fittings is smaller for low densities than it is for higher values, with an average –in absolute values– of 30 percent. It was checked that the permeability of the FEBEX bentonite to granitic water is analogous to that obtained for deionised water (Villar 2002)
The swelling pressure (Ps, MPa) of FEBEX samples compacted with their hygroscopic water content and flooded with deionised water up to saturation at room temperature can be related to dry density (ρd, g/cm3) through the following equation:
ln Ps = 6.77 ρd – 9.07 (r2 = 0.88, 52 measurements) [3]
In this case, the difference between experimental values and this fitting is, on average, 25 percent. This dispersion, which is wider for higher dry densities, is due both to the natural inhomogeneity of bentonite and to the measurement method used, which does not allow high degrees of accuracy. The values obtained when the sample is flooded with granitic water are similar to those obtained with deionised water for the same dry densities (Villar 2002). Also, it has been checked that the influence of the initial water content of the bentonite on its swelling pressure is negligible (Villar & Lloret 2008).
The retention curve of the bentonite was determined in samples compacted to different dry densities under different temperatures (Lloret et al. 2004, Villar & Lloret 2004). The volume of the samples remained constant during the determinations, since they were confined in constant volume cells. To impose the different relative humidities the cells were placed in desiccators with sulphuric acid solutions of various concentrations. Following an approach similar to that presented by Sánchez (2004) to fit the data from these laboratory determinations, the empirical Equation 4 can be obtained:
MATERIAL: THE FEBEX BENTONITE
Effect of heating/hydration on compacted bentonite: tests in 60-cm long cells 5
( ) ( ) ( )0 0
11
0
1 n n T T
sw a b nP e e
λ
λ
η α
−
−
− − − −
⎡ ⎤⎛ ⎞⎢ ⎥⎜ ⎟= + +⎢ ⎥⎜ ⎟⎝ ⎠⎢ ⎥⎣ ⎦
[4]
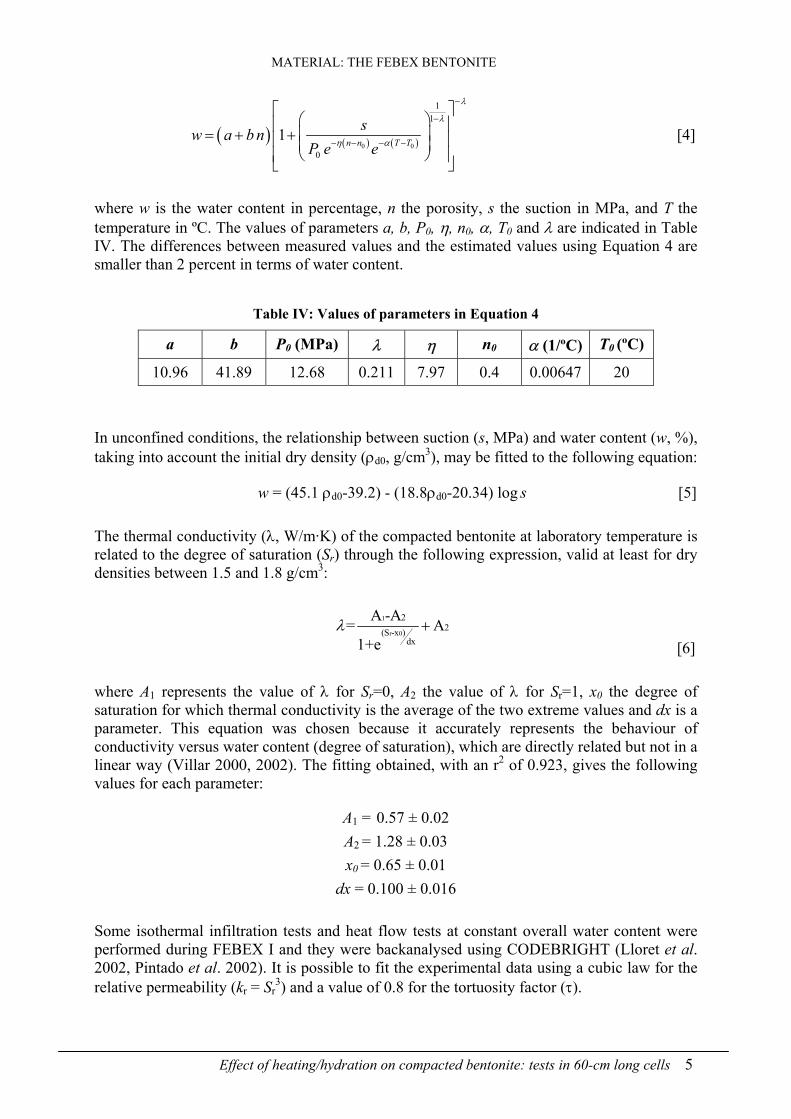
where w is the water content in percentage, n the porosity, s the suction in MPa, and T the temperature in ºC. The values of parameters a, b, P0, η, n0, α, T0 and λ are indicated in Table IV. The differences between measured values and the estimated values using Equation 4 are smaller than 2 percent in terms of water content.
Table IV: Values of parameters in Equation 4
a b P0 (MPa) λ η n0 α (1/ºC) T0 (ºC)
10.96 41.89 12.68 0.211 7.97 0.4 0.00647 20
In unconfined conditions, the relationship between suction (s, MPa) and water content (w, %), taking into account the initial dry density (ρd0, g/cm3), may be fitted to the following equation:
w = (45.1 ρd0-39.2) - (18.8ρd0-20.34) log s [5]
The thermal conductivity (λ, W/m·K) of the compacted bentonite at laboratory temperature is related to the degree of saturation (Sr) through the following expression, valid at least for dry densities between 1.5 and 1.8 g/cm3:
1
r 0
22(S -x )
dx
A -A= A1+e
λ + [6]
where A1 represents the value of λ for Sr=0, A2 the value of λ for Sr=1, x0 the degree of saturation for which thermal conductivity is the average of the two extreme values and dx is a parameter. This equation was chosen because it accurately represents the behaviour of conductivity versus water content (degree of saturation), which are directly related but not in a linear way (Villar 2000, 2002). The fitting obtained, with an r2 of 0.923, gives the following values for each parameter:
A1 = 0.57 ± 0.02 A2 = 1.28 ± 0.03 x0 = 0.65 ± 0.01
dx = 0.100 ± 0.016
Some isothermal infiltration tests and heat flow tests at constant overall water content were performed during FEBEX I and they were backanalysed using CODEBRIGHT (Lloret et al. 2002, Pintado et al. 2002). It is possible to fit the experimental data using a cubic law for the relative permeability (kr = Sr
3) and a value of 0.8 for the tortuosity factor (τ).

METHODOLOGY
6 Villar, Fernández, Martín, Barcala, Gómez-Espina, Rivas
3 METHODOLOGY
3.1 Thermo-hydraulic tests
A series of infiltration tests in large-scale cells –internal diameter of 7 cm and inner length of 60 cm– was set during FEBEX I (Villar 2001, Villar et al. 2005a) and was running for different periods of time from 0.5 to 7.6 years. The cells were made of Teflon to prevent as much as possible lateral heat conduction, and externally covered with steel semi-cylindrical pieces to avoid the deformation of the cell by bentonite swelling. Six 10-cm long and 7-cm diameter blocks of FEBEX clay compacted with its hygroscopic water content at an initial nominal dry density of 1.65 g/cm3 were put inside each cell.
The bottom part of the cells was a flat stainless steel heater set during the test at a temperature of 100ºC, which is the temperature expected on the surface of the waste container in the Spanish reference concept (ENRESA 1995). Over the upper lid of the cells there was a deposit in which water circulated at room temperature (20-30°C). In this way, a constant gradient (of 1.3-1.2°C/cm, supposing it to be linear) between top and bottom of the sample was imposed.
Hydration with granitic water took place through the upper surface under an injection pressure of 1.2 MPa. The chemical composition of the granitic water, whose salinity is 0.2 ‰, is indicated in Table V. This simulates the water that saturates the barrier in a repository excavated in granitic rock, and it is the same employed to saturate the mock-up test of the FEBEX Project (ENRESA 2000). The water intake was measured as a function of time. To do this measurement, an electronic equipment was placed at the entrance of the cell. It has an LVDT displacement transducer that allows measuring changes of volume with an accuracy of 0.001 cm3.
In addition, the cells were instrumented with thermocouples which were inserted in the bentonite through the cell wall at different levels along the column. The number of thermocouples in each cell was 2, 3 or 5. Only the 7.6-year duration test was not instrumented with thermocouples.
The thermocouples, as well as the volume change apparatuses were connected to a data acquisition system (DAS) in turn connected to a computer (PC). A schematic diagram of the setup is shown in Figure 1.
The body of the cells was constituted by three 200-mm length cylindrical pieces (Figure 2, item 4) and a base (Figure 2, item 1). In order to avoid the heat dissipation as much as possible, all of them were made of Teflon PTFE, whose thermal conductivity is 0.25 W/m·K. The thickness of the cell wall was 15 mm, and the pieces were assembled into each other. The watertightness of the contacts between different pieces was guaranteed by means of Viton® o-rings capable of withstanding temperatures of up to 180°C. In order to mechanically reinforce the walls of the cell, that were to support the swelling pressure of the clay, they were externally surrounded by three pairs of 4-mm thick 316L stainless steel shells (Figure 2, item 5), joined by steel braces (Figure 2, item 16). The vertical separation between pairs of shells was made by means of Teflon PTFE rings, to break longitudinal heat transmission (Figure 2, item 6).

METHODOLOGY
Effect of heating/hydration on compacted bentonite: tests in 60-cm long cells 7
The upper closing of the cell was made by means of a set made of 316L stainless steel (Figure 2, item 7), consisting of a plug with lateral o-rings to close the cell which included a chamber for the cooling system (Figure 2, item 8). A central perforation allowed the passage of the hydration water through the chamber screwed cap (Figure 2, item 14) and through the plug (Figure 2, item 13). The upper steel plug had concentric grooves machined on its bottom.
The tightening of all the pieces was made by means of six external steel threaded bars and plates on top and bottom (Figure 2, items 11, 9 and 10). These bars served as well as support of the cell (Figure 2, item 17).
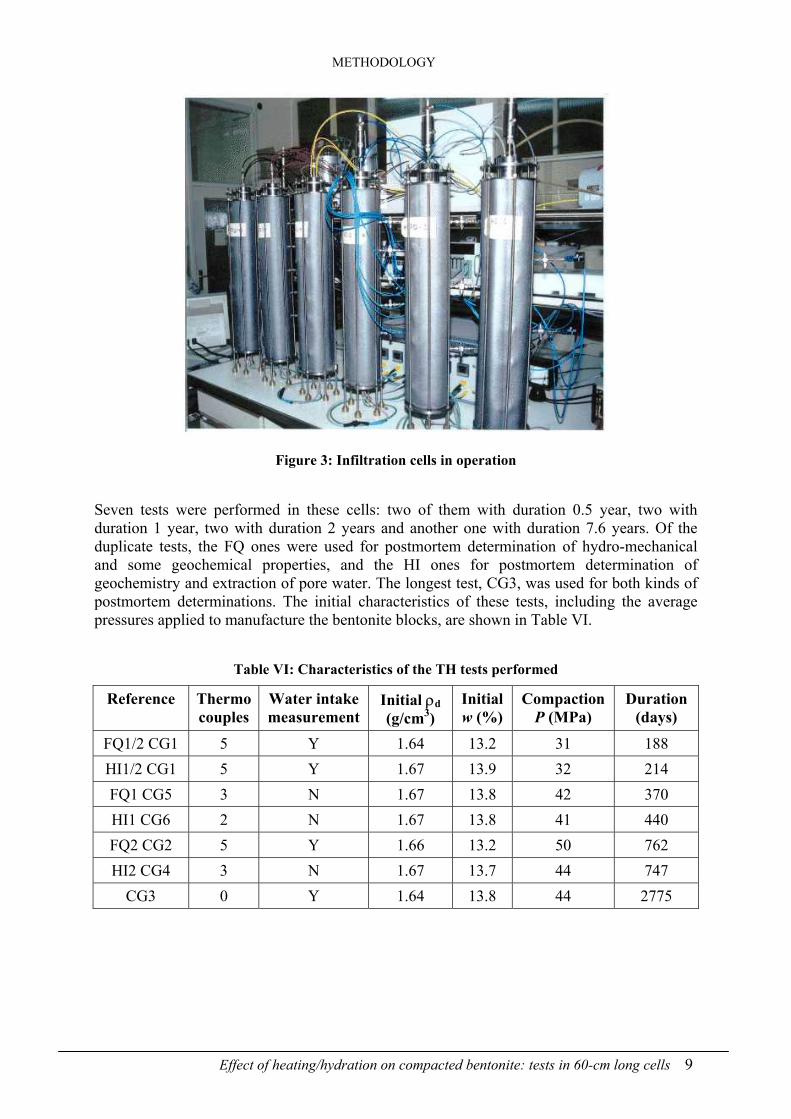
The appearance of the mounted cells is shown in Figure 3. The cells were laterally surrounded by a 15-mm thick dense foam material whose thermal conductivity is 0.04 W/m·K.
Table V: Chemical composition of the water used in the tests (mmol/L)
pH Cl- SO42- HCO3
- Mg2+ Ca2+ Na+ K+
8.3 0.37 0.15 2.36 0.39 1.12 0.48 0.026
11 bar
PISTON PUMP: GRANITIC WATER
MEASUREMENT OFVOLUME CHANGE
TEMPERATURE CONTROL
COOLING SYSTEM
Control thermocouple
Electric supply
DATA ACQUISITION PC
Thermocouples
Heater7 cm
60 cm
Bentonite Hydrationcircuit Cooling Teflon Steel
Figure 1: Experimental setup for the infiltration tests

METHODOLOGY
8 Villar, Fernández, Martín, Barcala, Gómez-Espina, Rivas
Figure 2: Cross section of the cell with its different components
METHODOLOGY
Effect of heating/hydration on compacted bentonite: tests in 60-cm long cells 9
Figure 3: Infiltration cells in operation
Seven tests were performed in these cells: two of them with duration 0.5 year, two with duration 1 year, two with duration 2 years and another one with duration 7.6 years. Of the duplicate tests, the FQ ones were used for postmortem determination of hydro-mechanical and some geochemical properties, and the HI ones for postmortem determination of geochemistry and extraction of pore water. The longest test, CG3, was used for both kinds of postmortem determinations. The initial characteristics of these tests, including the average pressures applied to manufacture the bentonite blocks, are shown in Table VI.
Table VI: Characteristics of the TH tests performed
Reference Thermocouples
Water intake measurement
Initial ρd (g/cm3)
Initial w (%)
Compaction P (MPa)
Duration (days)
FQ1/2 CG1 5 Y 1.64 13.2 31 188 HI1/2 CG1 5 Y 1.67 13.9 32 214 FQ1 CG5 3 N 1.67 13.8 42 370 HI1 CG6 2 N 1.67 13.8 41 440 FQ2 CG2 5 Y 1.66 13.2 50 762 HI2 CG4 3 N 1.67 13.7 44 747
CG3 0 Y 1.64 13.8 44 2775

METHODOLOGY
10 Villar, Fernández, Martín, Barcala, Gómez-Espina, Rivas
3.2 Postmortem analysis
At the end of the thermo-hydraulic treatment, the cells were dismounted and the clay blocks extracted. Special care was taken to avoid any disturbance in the conditions of the clay, particularly its dry density and water content. Once the bentonite columns were extracted, they were sawed in 24 cylindrical sections of 2.5 cm in thickness (Figure 4). The sections were numbered from 1, near the hydration surface, to 24, close to the heater (Figure 5). In the case of the FQ tests they were used for the following determinations: dry density, water content, swelling capacity, swelling pressure, permeability, porosity and geochemistry; and in the case of the HI tests the samples were used for the determination of dry density, water content, mineralogy, geochemistry (soluble salts, exchangeable cations, extraction of interstitial water) and scanning microscopy analysis. The samples from test CG3 were used for the determination of dry density, water content, swelling capacity, specific surface area, mineralogy and geochemistry. The methodologies described below were applied to determine different properties of the material. There are certain variations in the methods applied for the analyses of samples from different TH tests, since this investigation was carried out in a time span of ten years, and some procedures were modified and improved in its course.
Figure 4: Establishment of sections along the bentonite and separation by sawing (test CG3)

METHODOLOGY
Effect of heating/hydration on compacted bentonite: tests in 60-cm long cells 11
0
10
20
30
40
50
60
-3.5 -2.5 -1.5 -0.5 0.5 1.5 2.5 3.5
Distance to the column axis (cm)
Dis
tanc
e to
the
hea
ter
(cm
)
Heater
Hydration
23
9876
12
543
151413121110
2019181716
2221
24
Figure 5: Distribution of sampling sections after the TH tests
3.2.1 Basic properties: water content and dry density
The gravimetric water content (w) is defined as the ratio between the weight of water and the weight of dry solid expressed as a percentage. The weight of water was determined as the difference between the weight of the sample and its weight after oven drying at 110°C for 24 hours (weight of solid). Dry density (ρd) is defined as the ratio between the weight of the dry sample and the volume occupied by it prior to drying. The volume of the specimens was determined by immersing them in a recipient containing mercury and by weighing the mercury displaced, as established in UNE Standard 7045 “Determination of soil porosity”.
3.2.2 Basal spacing by X-ray diffraction in unaltered samples
These studies were undertaken only in test CG3 to determine the basal spacing of the smectite, i.e. the d(001) distance, which informs us about the number of layers of water in the interlamellar region and thus, about the state of hydration of the smectite. The subsamples taken from each section were preserved in paraffined foil immediately after trimming, and later, a sufficiently flat surface of them was X-rayed at laboratory temperature without any further treatment. An anticatode CuKα was used with a Phillips model X’Pert-MPD diffractometer. XRD patterns were obtained with a 0.1000 mm entrance slit and a scanning rate of 0.02 °2θ/s. Data were collected either from 0.2 to 10 °2θ or from 0.2 to 30 °2θ, which is enough to obtain the main peak of the smectite, which may fall between 5 and 9 °2θ (depending on the degree of hydration), corresponding to basal spacings between 18 and 10 Å.

METHODOLOGY
12 Villar, Fernández, Martín, Barcala, Gómez-Espina, Rivas
3.2.3 External surface area
The BET surface area (as) of the samples from test CG3 was measured by nitrogen gas adsorption using a volumetric vacuum apparatus (Micromeritics Gemini V). Approximately 0.2 g of sample were ground in an agate mortar for the measurements. The samples were dried at 90°C during at least 24 h before the tests. Prior to the nitrogen adsorption, the samples were outgassed at 90°C for 1 hour using a mixture of helium and nitrogen. The tests were performed at the boiling point of liquid nitrogen (77 K). Surface areas were calculated with the BET method, using a series of nine data points over the P/P0 range of 0.05 to 0.25 on the nitrogen adsorption isotherm and considering a molecular cross section area of 0.162 nm2 for the nitrogen molecule. The determination was accomplished on two or three aliquots of each subsample, the values given being the average of these.
3.2.4 Mineralogy and microstructure: XRD, FTIR and SEM
X-ray diffraction
In order to identify the mineralogical species in the bentonite samples, X-ray diffraction (XRD) patterns were obtained in random powders and in oriented aggregates.
The powders were obtained by grinding the samples in an agate mortar to a size of less than 53-60 µm after having dried them at 60-65°C for 24 h. The fractions of less than 2 µm (and also between 20 and 2 µm, in the case of the samples from test CG3) were obtained by suspension and sedimentation in deionised water. After drying these fractions they were ground again and mixed with deionised water, ultrasounded and poured out onto glass slides. Prior to XRD, some of these mounts were dried at 300 or 500-550°C, others saturated with ethylene glycol and others simply air-dried.
Both the powders of the bulk sample and the oriented aggregates of the less than 2 µm fractions (except for the samples of test CG3) were analysed with a Philips X’Pert–MPD diffractometer, using an anticatode Cu-Kα at 45 kV and 50 mA. A scan rate of 2 º2θ/min was used for the powder samples over the range 2 to 70 °2θ and of 1 º2θ/min for the oriented aggregates.
Random-oriented powders of the samples from test CG3 were examined on a Siemens Kristalloflex 810 diffractometer, using an anticatode Cu-Kα at 30 kV and 40 mA, a step size of 0.03 (º2θ), and time per step of 1 s (scan rate of 1.8 º2θ/min). For the oriented aggregates a slower scan rate (1.2 º2θ/min) was used between 2 and 13 º2θ in order to get better defined peaks.
The semiquantification was performed by measuring in the diffractograms the area of the diagnostic peak of each mineral and correcting it by taking into account the reflecting factors given in Schultz (1964) and Barahona (1974).
Fourier transform infrared spectroscopy
Fourier Transform InfraRed (FTIR) spectra serve as a fingerprint for mineral identification, and give information about mineral structure, degree of regularity within the structure, nature of isomorphic constituents (e.g. the nature of the octahedral cations in clay minerals), distinction of molecular water from constitutional hydroxyl, and presence of both crystalline
METHODOLOGY
Effect of heating/hydration on compacted bentonite: tests in 60-cm long cells 13
and non crystalline impurities (Kloprogge 2005). Spectra of samples from test CG3 were obtained in the middle-IR region (4000-400 cm-1) using a Nicolet 6700 with a DTGS KBr detector (resolution 4 cm-1, 32 scans) on KBr-pressed discs in transmission technique at room conditions. The spectra were examined in the OH stretching region (3400-3800 cm-1) and the region below 1200 cm-1, where intense Si-O absorptions and OH bending bands are present.
Scanning electronic microscopy
To define the microstructural morphology of the clay minerals, the possible alteration products and the accessory minerals, scanning electronic microscopes (SEM) JEOL JSM 6000 and JEOL JSM 6400 were used. The latter includes a coupled dispersive X-ray energy spectrometer, X LINK LZ_5, which allows for the qualitative analysis of light elements from boron. Most of the clay samples were dried overnight at 60ºC, and then subjected to vacuum gold metallisation to obtain good conduction and better images. The equipment used for this is a BALZERS SCD 004 metaliser that ionises the metal at a vacuum of 5·10-2 Torr, depositing a layer of 300 to 400 Å on the sample. Other samples did not undergo any type of drying or treatment prior to their metallisation.
3.2.5 Pore water chemistry
The pore water of the bentonite was obtained by two different techniques, squeezing and aqueous extracts. The methods applied to analyse the water obtained were the same in both cases.
Aqueous extracts
The soluble elements were analysed in aqueous extract solutions. The subsamples were crushed without previous drying, and placed in contact with deionised and degassed water at a solid to liquid ratio of 1:4 (10 g of clay in 40 mL of water), shaken end-over-end and allowed to react for two days under atmospheric conditions. After phase separation by centrifugation (30 minutes at 12500 rpm) and filtering by a 0.45-µm pore size filter, the supernatant solutions were analysed following the procedures and methods described below.
Extraction of pore water by squeezing
The bentonite from the most hydrated sections of tests HI1/2, HI1 and HI2 was squeezed to obtain the pore water. The squeezing process involves the expulsion of interstitial fluid from the saturated argillaceous material being compressed (Entwisle & Reeder 1993, Pearson et al. 2003). In squeezing experiments, the volume of water extracted depends basically on the water content of the sample –which usually must be higher than 18 percent–, its properties (e.g. dry density, the relative contents of easily-squeezed clays and of stiffer materials like quartz and calcite), the squeezing pressure applied, the squeezing time and the size of the squeezing apparatus (volume and diameter).
The squeezing rig at CIEMAT is similar to that developed by Peters et al. (1992) and Entwisle and Reeder (1993). The squeezer has been designed to allow uniaxial compression of the sample (Cuevas et al. 1997, Fernández et al. 2001, 2003) by means of an automatic hydraulic ram operating downwards, the squeezed water being expelled through a system of stainless steel filters of pore size 0.5 and 10 µm into vacuumed polypropylene vials at top and bottom of the cell (Figure 6). The compaction chamber, with an internal diameter of 70 mm

METHODOLOGY
14 Villar, Fernández, Martín, Barcala, Gómez-Espina, Rivas
and a height of 250 mm, is made of AISI 329 stainless steel, and it can stand pressures of up to 150 MPa.
Figure 6: Water extraction apparatus used at CIEMAT
The samples for squeezing were fragmented to small pieces of about 25-200 grams. The cell with the sample inside was flushed with nitrogen before squeezing, to remove all the air and avoid any possible oxidation of the sample during the test. The applied stress was increased progressively up to the selected pressure. As low as possible squeezing pressures were used to avoid ultrafiltration and ionic fractionation phenomena. A pressure of 64 MPa was considered a limit value to avoid the yielding of solvated water of exchangeable cations and the selective retention of the solution ions (Peters et al. 1992).
Once the extraction of water was completed, the water sample was collected avoiding any contact with the atmosphere (5-10 mL), weighed, filtered and stored in a refrigerator at 4°C until it was analysed as described below.
Chemical analyses of pore water
Firstly the pH of the water samples, both from the aqueous extracts and the squeezing tests, was measured by means of an ORION 720A pH-meter and the electrical conductivity (EC) was measured by means of an ORION 115 conductimeter that adjusted the measurements to a temperature of 25ºC. The water samples were then filtered through 0.45 µm syringe filters before performing the chemical analyses with the following techniques:
− The major and trace cations were analysed by Inductively Coupled Plasma-Atomic Emission Spectrometry (ICP-AES) either in a Perkin-Elmer Elan 5000 or in a Jobin Yvon JY48+JY38 spectrometer after acidification of the samples to pH<2 with HNO3
- (8 mL/L). Ultratrace elements were determined by ICP-MS (Finningan Mat SOLA).

METHODOLOGY
Effect of heating/hydration on compacted bentonite: tests in 60-cm long cells 15
− Sodium and potassium were determined by Flame Atomic Emission Spectrometry in a Perkin Elmer 2280 spectrometer after acidification of the samples to pH<2 with HNO3
- (8 mL/L).
− Anions were analysed by ion chromatography (Dionex DX-4500i). An ORION 901 microprocessor ion-analyzer, equipped with ion selective electrodes, was employed for F- and I- determination.
− Soluble silica was determined by UV-Vis spectrophotometry using the reduced molibdosilicic acid (EPA 370.1 Method).
− The Fe2+/Fe3+ ratio was determined by UV-Vis spectrophotometry with the ferrozine method after acidification of the samples to pH<1 with HNO3
- (8 mL/L).
− The total alkalinity of the samples (expressed as HCO3- concentration) was determined
by potentiometric titration using either a Metrohm 682 or a Metrohm 785 titrator with a specific Dynamic Equivalence Point.
It is estimated that the maximum analytical errors for the major ions were ±10%.
3.2.6 Cationic exchange capacity and exchangeable cations
Once the soluble salts were washed, the exchangeable cations of the clay were extracted by successive displacements with a buffered solution of ammonium acetate 1 M at pH 7 (Chapman’s method, Thomas 1982). To determine the exchangeable cations of the samples from test CG3, the soluble salts were not previously washed, and a CsNO3 solution was used to displace the exchangeable cations (Sawhney 1970). Cesium acts as a high selective cation to displace all exchangeable cations from the montmorillonite if its concentration is sufficiently high. Bentonite samples were equilibrated with CsNO3 0.5 M at pH 8.2 at a solid to liquid ratio of 1:8 in a glove box.
In both cases, after phase separation by centrifugation, the supernatant solutions were filtered by 0.45 µm and the concentration of the major cations was analysed by Inductively Coupled Plasma-Atomic Emission Spectrometry either in a Perkin-Elmer Elan 5000 or in a Jobin Yvon JY48+JY38 spectrometer, and sodium and potassium by flame atomic emission spectrometry (AAS-Flame) in a Perkin Elmer 2280 spectrometer.
To determine the total cation exchange capacity (CEC), the exchange sites of the sample were saturated with sodium by means of successive washing with sodium acetate 1 M at pH=8.2. The adsorbed sodium was then displaced by successive extractions with CsNO3 0.5 M at pH 7.0.
3.2.7 Hydraulic conductivity
The method for the determination of the saturated hydraulic conductivity consists on the measurement, as a function of time, of the water volume that traverses the saturated specimen, while a constant hydraulic gradient is imposed between top and bottom (Figure 7). The specimen is confined in a cylindrical rigid cell that prevents any change of the clay volume. For that, the specimen is trimmed with a cylindrical cutter to fit the ring of the permeability cell, trying to preserve its dry density and water content as they were when the TH treatment finished. The cell is made of stainless steel and has an inner section of 19.63 cm2 and a height

METHODOLOGY
16 Villar, Fernández, Martín, Barcala, Gómez-Espina, Rivas
of 2.5 cm. Porous stones are placed on top and bottom of the specimen, which is saturated by injecting water through the porous stones at a pressure of 0.6 MPa. Upon saturation, the swelling of the saturated clay against the cell wall guarantees a perfect contact between clay and cell, avoiding a preferential pathway. Once the sample is saturated, the injection pressure in the lower part of the cell is increased, and the water outflow through the upper outlet of the cell is measured with an automatic volume change apparatus. The permeability coefficient is calculated applying Darcy’s law.
Hydraulic gradients between 1100 and 10500 were applied during the determinations, depending on the dry density of the clay, and it has been demonstrated that, for this range of hydraulic gradients, the hydraulic conductivity value obtained is independent of the hydraulic gradient applied (Villar 2002). The determinations were done at laboratory temperature and using granitic water both in the saturation and in the permeability measurement phases. No permeability tests were performed with the samples from test CG3.
23 bar
PISTON PUMP
VOLUME CHANGEAPPARATUS
PERMEABILITYCELL
DATA ACQUISITIONSYSTEM
MERCURY PRESSURESYSTEM
Sample Hydrationcircuit
Porousstone
Figure 7: Schematic representation of the setup to measure hydraulic conductivity
3.2.8 Swelling capacity
The saturation under load test (also called swelling deformation test) makes it possible to determine the strain capacity of the soil when it saturates under a given vertical pressure. The tests were performed in standard oedometers (Figure 8). The specimen (height 1.20 cm, diameter 3.81 cm), contained in the oedometer ring, was confined between two porous stones located at the lower and upper parts. Once in the oedometer, a vertical pressure of 0.5 MPa was applied to the samples. Immediately afterwards, the samples were flooded with water at atmospheric pressure from the bottom porous plate. The swelling strain experienced by the specimens upon saturation was recorded as a function of time until stabilisation. The relation between the increase in final length undergone by the sample in equilibrium with the load applied and its initial length gives the strain experienced by the material on saturating, the negative values indicating swelling strains. The final result is, therefore, the percentage of vertical strain of a sample of a given initial dry density and water content on saturating under

METHODOLOGY
Effect of heating/hydration on compacted bentonite: tests in 60-cm long cells 17
a fixed vertical pressure. On completion of the tests, the water content of the specimens was determined by oven drying at 110°C for 24 hours. The tests were performed at room temperature.
Both intact and remoulded samples were used to perform this determination. In the first case, the specimens were just trimmed to fit the ring of the oedometer cell, their dry density and water content being preserved as they were when the TH treatment finished. For this purpose cylindrical cutters were used, and the samples obtained were placed in the oedometer ring. In this way, the specimens from different positions have different density and water content at the beginning of the swelling test, what highly influences the results obtained. To complement these results, the material from some sections of the columns was stabilised at laboratory conditions (relative humidity and temperature) in order to get uniform hygroscopic water content in all the samples. Afterwards, they were gently disaggregated to a grain size less than 5 mm. With the sample thus prepared –remoulded– specimens were compacted to a dry density of 1.60 g/cm3 inside the oedometer ring. In this way, samples from different sections in the thermo-hydraulic tests, had the same dry density and water content at the beginning of the swelling tests.
Clay Water Steel Ring Porous stone
Loading ram
Dial gauge
PistonFlange
Clay Water Steel Ring Porous stoneClay Water Steel Ring Porous stone
Loading ram
Dial gauge
PistonFlange
Figure 8: Schematic cross section of an oedometric cell
Similar tests were performed with samples of untreated FEBEX bentonite compacted at various dry densities with different water contents (Villar & Lloret 2008). From the results obtained, an empirical relation was found between swelling strain (ε, %), initial dry density (ρd, g/cm3) and initial water content (w, %) when saturation takes place with deionised water under a vertical stress of 0.5 MPa:
ε = (37.48 ρd – 50.43) ln w + (-154.88 ρd + 204.24) [7]
The difference between the experimental values and this fitting is on average 9 percent.

METHODOLOGY
18 Villar, Fernández, Martín, Barcala, Gómez-Espina, Rivas
When saturation of samples compacted to different dry density with hygroscopic water content takes place with granitic water under vertical stress of 0.5 MPa, the final vertical strain can be predicted with the following equation:
ε = -39.10 ρd + 46.68 [8]
In particular, for dry density 1.60 g/cm3 and hygroscopic initial water content, which are the initial conditions of the bentonite in the tests with remoulded sample, the expected final strain upon saturation with granitic water under vertical stress of 0.5 MPa would be around 14-16 percent. It has been verified that the final strain does not depend much on the kind of water used to saturate (deionised or granitic), but on the actual initial dry density.
The characteristics of the swelling under load tests performed are shown in Table VII. No swelling under load tests were performed with samples from TH test FQ2.
Table VII: Characteristics of the swelling under load tests performed after TH treatment (vertical stress 0.5 MPa)
Remouldeda Trimmed TH test
Deionised Granitic Deionised Granitic FQ1/2 x x FQ1 x CG3 x
aCompacted to ρd=1.60 g/cm3 with hygroscopic water content
3.2.9 Swelling pressure
For determination of the swelling pressure of the compacted bentonite, oedometer frames and conventional oedometric cells were used (Figure 8). The sample is confined in a ring preventing it from deforming laterally, and between two porous stones at its upper and lower surfaces. The piston of the cell, which is adjoined to the upper porous stone, is in contact with the loading ram, whose displacement may be accurately measured by means of a dial gauge. The sample can be loaded via the ram by means of the system of levers of the oedometric frame on which the cell is located. To determine the swelling pressure, the specimen is saturated with water from the lower porous stone and vertical loads are applied to prevent deformation. With this system the pressure exercised by the sample is determined indirectly from the load that has to be applied in order for the volume of the sample to be kept constant during saturation. The swelling pressure is the vertical pressure needed to hinder any deformation in the saturated sample.
As in the case of the swelling capacity tests, the specimens for the swelling pressure tests have been obtained either by trimming or by remoulding. Also, granitic or deionised water have been used to saturate the specimens. A summary of the characteristics of the tests performed is given in Table VIII. No swelling pressure tests were performed with samples from test CG3.

METHODOLOGY
Effect of heating/hydration on compacted bentonite: tests in 60-cm long cells 19
Table VIII: Characteristics of the swelling pressure tests performed after TH treatment
Remouldeda Trimmed TH test
Deionised Granitic Deionised Granitic FQ1/2 x FQ1 x x FQ2 x x
aCompacted to ρd=1.60 g/cm3 with hygroscopic water content
4 RESULTS
4.1 Thermo-hydraulic tests
The initiation of the thermo-hydraulic tests in long cells followed this procedure: first the upper temperature was set to 30°C, after 24-48 hours the temperature of the bottom heater was set to 100°C and hydration started almost simultaneously, except in tests FQ1/2, HI1/2 and FQ2, in which hydration started 24 h afterwards. During the hydration/heating tests two types of measurements were performed: temperatures along the columns and water intake.
The temperatures were measured at different positions along the columns depending on the particular test. In test CG3 no thermocouples were inserted. The temperatures quickly stabilised (in less than 200 hours) and afterwards, they were mainly affected by the room temperature, reflecting the daily and seasonal changes, especially in the zones further from the heater (Figure 9). The average temperatures recorded by each thermocouple for the period between 700 h after the beginning of the tests and the end of tests are shown in Table IX. There is a good agreement between the average temperatures measured in the duplicate tests of the same duration, except in the case of the shortest tests (FQ1/2 and HI1/2), that were operating in different periods of the year (spring/summer and autumn/winter, respectively) and recorded accordingly different temperatures. An average of the results obtained in both tests is plotted in Figure 10, together with the steady results for the other tests. There is a sharp temperature gradient in the vicinity of the heater, the temperature decreasing from 100°C in the heater surface to 50°C at 10 cm from it inside the clay. In addition, a decrease in temperature with saturation (longest tests) is observed, especially in the wettest zones, i.e. within the closest 40 cm to the hydration surface. This is due to the higher heat dissipation of the wet clay.
The longest test, test CG3, had not thermocouples inserted in the clay, but before switching off the heater, the temperatures on the Teflon surface of the cell were measured with a hand-held thermistor thermometer. The values recorded are shown in Figure 11. Although these temperatures are lower than those inside the bentonite, the Figure clearly shows the higher thermal gradient in the proximity of the heater, and the soft decrease in the farthest area, where the temperature is very close to the room temperature at the moment of dismantling (22°C).

RESULTS
20 Villar, Fernández, Martín, Barcala, Gómez-Espina, Rivas
15
20
25
30
35
40
45
50
55
0 5000 10000 15000 20000
Time (hours)
Tem
pera
ture
(°C
)
T1 T2 T3 T4 T5
T5
T1
T3
T4
Figure 9: Temperatures recorded by thermocouples in test HI2 (from T1 to T5, placed at 50, 40, 30, 20 and 10 cm from the heater; T2 failed before the end of the test)
Table IX: Average temperatures inside the bentonite during the TH tests
Thermocouple T1 T2 T3 T4 T5 Distance to the heater (cm) 10 20 30 40 50
FQ1/2 51.6±1.6 37.1±2.0 30.8±2.1 28.3±2.1 27.0±2.0 HI1/2 49.2±2.2 35.2±2.7 28.8±2.9 25.5±3.2 23.2±3.3 FQ1 47.8±2.2 – 29.6±2.9 – 24.8±3.3 HI1 – 36.9±2.8 – 27.0±3.4 – FQ2 48.8±2.3 34.7±2.9 28.1±3.3 25.3±3.5 24.0±3.6 HI2 49.6±2.2 34.9±2.8 28.0±3.0 25.3±3.2 23.4±3.4

RESULTS
Effect of heating/hydration on compacted bentonite: tests in 60-cm long cells 21
20
25
30
35
40
45
50
55
0 20 40 60
Distance from the heater (cm)
Tem
pera
ture
(°C
)
6 months
12 months
24 months
Figure 10: Average steady temperatures at three different positions inside the clay for tests of different duration
22.8
23.2
25.0
30.3
32.8
21.2
22.8
23.2
25.0
30.3
32.8
21.2
20
22
24
26
28
30
32
34
0 10 20 30 40 50 60
Distance to the heater (cm)
Tem
pera
ture
(°C
)
Figure 11: Temperatures measured on the Teflon surface of the cell just before dismantling test CG3
Immediately after setting the heater temperature or after 24 h, depending on the particular test, hydration started. In some of the tests (FQ1/2, HI1/2, FQ2 and CG3) the water intake was also measured online. The water intake curves, as measured by volume change apparatuses, are shown in Figure 12. They show disparity at the beginning of the tests, but tend to coincide as hydration progresses. The initial discrepancy is particularly clear for the two shortest tests,

RESULTS
22 Villar, Fernández, Martín, Barcala, Gómez-Espina, Rivas
and can be mostly attributed to the different room temperature during the operation of both tests: test FQ1/2 operated in spring/summer and test HI1/2 in autumn/winter, for which reason the water intake was higher in the first test, since temperature increases permeability.
The total water intake during the tests according to these measurements is shown in Table X. Despite several problems, due to various failures of the equipments, the final water contents thus calculated agree quite well with the water contents calculated at the end of the tests by the difference between the final and initial clay weights, as explained below.
The evolution of water content over time is exponential (Figure 13). The extrapolation of these values towards longer times is not straightforward, since in these tests there is a change in time of the dry density of the bentonite –due to its swelling and the deformability of Teflon (see next section)–, and the changes in total porosity affect the water intake. Nevertheless, the fitting drawn in Figure 13, points to a final water content of about 28 percent, much higher than needed to reach full saturation if we consider the expected dry densities (see next section) and a value of water density of 1 g/cm3. The latter assumption is probably not valid for compacted bentonite (Villar 2002, Villar & Lloret 2008).
0
50
100
150
200
250
300
350
400
450
500
0.01 1 100 10000 1000000
Time (hours)
Wat
er in
take
(cm
3 )
FQ1/2HI1/2FQ2CG3
Figure 12: Water intake during tests of different duration
Table X: Online measurements of water intake
Reference Duration (days) Water intake (cm3) Corresponding final w (%) FQ1/2 188 171 17.7 HI1/2 214 128 17.3 FQ2 762 280 20.6 CG3 2775 461 25.9

RESULTS
Effect of heating/hydration on compacted bentonite: tests in 60-cm long cells 23
0.1 1 10 100 1000 1000010
15
20
25
30
Wat
er c
onte
nt (%
)
Time (days)
Figure 13: Water content at the end of the TH tests according to the online volume change measurements and exponential fitting
4.2 Postmortem analysis
After switching off the heater and stopping the water injection, the cells were disassembled and the bentonite extracted. No joint was sealed in test FQ1/2 whereas the upper joint was sealed in test HI1/2 (Figure 14). Only the two upper blocks were sealed in tests FQ1 and FQ2, i.e. the joint placed at 10 cm from the hydration surface, whereas in tests HI1 and HI2 the three upper blocks were sealed, i.e. the joints placed at 10 and 20 cm from the hydration surface. In the longest test, CG3, the six bentonite blocks were sealed among them, although upon desiccation the two lower blocks could be detached. Figure 15 shows the sealed contact between blocks 4 and 5 (considering block 1 the upper one) at the end of test CG3. Shrinkage cracks near the heater were not observed in any of the tests, although in some tests the bentonite in contact with the heater showed a dark coloration (Figure 16).
As it has been explained above, the bentonite columns were sliced in 24 sections, 4 sections per each of the six blocks (Figure 5). The appearance of two of the bentonite columns before slicing is shown in Figure 17 and Figure 18.

RESULTS
24 Villar, Fernández, Martín, Barcala, Gómez-Espina, Rivas
a
b
c
Figure 14: Final appearance of parts of the bentonite columns in tests HI1/2 (a), HI1 (b) and HI2 (c)
Figure 15: Appearance of the contact between blocks 4 and 5 (sections 16 and 17) at the end of test CG3

RESULTS
Effect of heating/hydration on compacted bentonite: tests in 60-cm long cells 25
a b
Figure 16: Appearance of the bentonite in contact with the heater in test HI1 (a) and FQ2 (b)
Figure 17: Appearance of a fragment of the bentonite column of test FQ2 upon extraction and establishment of sampling sections
Figure 18: Appearance of the bentonite column of test CG3 upon extraction. The limits between the initial blocks are located between sections 4 and 5, 8 and 9, 12 and 13, 16 and 17 and 20 and
21
Table XI shows the data obtained after dismantling of each cell. The final weight allows to compute the final water content by taking into account the initial weight and water content (Table VI). The final degrees of saturation have also been computed considering that the

RESULTS
26 Villar, Fernández, Martín, Barcala, Gómez-Espina, Rivas
initial dry density has been kept constant during the tests. However, this assumption is not probably accurate, since the swelling of the hydrated bentonite might have deformed the Teflon walls of the cell, what would be confirmed by the higher difficulty of extracting from the cells the upper, most hydrated blocks. In fact, the diameter of the bentonite column at the end of test CG3 was not constant along it, and it overall had increased with respect to the initial diameter of 7.03 cm. The inner diameter of the Teflon cell measured after disassembling and cooling ranged from 7.28 cm near the hydration surface to 7.05 cm near the heater, with an average value of 7.18 cm. This increase is due to the deformation of the Teflon walls caused by the swelling of the bentonite upon saturation, which also implied an overall decrease in the dry density of the bentonite during the test to a value of 1.57 g/cm3, according to these diameter measurements.
The coincidence between the water intakes measured by the volume change apparatuses (Table X) and those measured at the end of the tests by final and initial weight differences (Table XI), allows to state that the cells remained watertight during operation.
Table XI: Final overall measurements and computed values
Reference Initial mass (g)
Final mass (g)
Water intake (g) Final w (%) Final Sr
(%) FQ1/2 CG1 4296
HI1/2 CG1 4316 4432 116 17.0 74a
FQ1 CG5 4313 4478 165 18.2 79a
HI1 CG6 4329
FQ2 CG2 4286 4521 235 19.4 84a
HI2 CG4 4314 4536 222 19.5 85a
CG3 4332 4748 396 24.7 92b
aComputed considering that the initial dry density has not changed during the test (might not be so) bComputed considering the bentonite volume change during the test by deformation of Teflon
4.2.1 Water content and dry density
In the FQ tests water content and dry density were determined in two or three subsamples per section, except in those sections used for permeability tests, in which only the measurements resulting from this determination were got. In the HI tests only one determination of water content and dry density was performed in each section. In the odd sections of test CG3, water content and dry density were determined in three subsamples (Figure 19), whereas in the even sections they were determined in two subsamples, because the middle part of the section was used for the swelling capacity determinations. The average values measured in all the subsamples for each test are shown in Table XII.

RESULTS
Effect of heating/hydration on compacted bentonite: tests in 60-cm long cells 27
Figure 19: Cutting of three subsamples from a section of the column
The water content, determined as described in section 3.2.1, of the samples taken along the bentonite column in the seven TH tests is shown in Figure 20, where an important gradient can be observed even in the longest test. The water content increased within the closest 20 cm from the hydration surface in the 6-month test, and within 40 cm in the 12 and 24-month tests. In the 7.6-year test the increase in water content took place all over the column except in the 10 cm closest to the heater. The water content reduction by the temperature effect is similar for the three shorter durations, which means that desiccation took place rather quickly and affected only the closest 18 cm to the heater, where the water contents are lower than the initial ones, which were around 14 percent. After six months of TH treatment, the closest 18 cm to the heater experienced a desiccation that is not recovered after 24 months, hence the water content remained in this zone below the initial value, being close to 6 percent in the vicinity of the heater. After 7.6 years of testing, the water content of the bentonite is lower than the initial one only in the 5 cm closest to the heater.
Figure 21 shows the dry densities measured as described in 3.2.1 in the samples taken along the bentonite column at the end of the tests. In all of them, there is a dry density gradient caused by the different swelling of the bentonite, since the more hydrated sections swelled more. The dry density decreased from the heater towards the hydration surface following an approximately linear trend. In the zones affected by hydration, the densities decreased below the initial value (nominal 1.65 g/cm3) due to the expansion caused by saturation. On the contrary, near the heater, the dry density increased, due to the shrinkage caused by desiccation. There is also a variation of dry density inside each of the six blocks forming the bentonite columns, since they were obtained by uniaxial compaction, which gives place to higher densities in the upper part of the blocks. This fact is clearer in shorter, less hydrated tests. Despite the dispersion of the data –caused by the initial inhomogeneities and by the determination method–, it can be observed that the densities reached near the hydration surface were lower as the duration of the test was longer (values as low as 1.41 g/cm3 in test CG3), due to the fact that their saturation and, consequently, their swelling, is higher. Due to this density decrease, the degrees of saturation are lower than what could be expected by the high water content. In fact, degrees of saturation higher than 90 percent are only reached in the 3 cm closest to the hydration surface after 6 months of TH treatment, in 8 cm after 12 months, in 10 cm after 24 months and in 25 cm in the 7.6-year test. Taking a value of 1 g/cm3 for the density of the adsorbed water, the 10 cm of bentonite closest to the hydration surface

RESULTS
28 Villar, Fernández, Martín, Barcala, Gómez-Espina, Rivas
in test CG3 would be fully saturated. On the other hand, within 18 cm from the heater the densities remain the same from 6 to 24 months, and the degrees of saturation decrease from the initial 55-60 percent to values around 25 percent in the vicinity of the heater.
There is also an overall decrease in the average density of the bentonite, which is much more significant in the 7.6-year test (Table XII). This is attributed to the deformation of the Teflon walls of the cell caused by the swelling of the bentonite, which increases over time, and also to the further expansion of the bentonite on dismantling of the cells and to the trimming of subsamples, which may cause their density to decrease. Thus, in test CG3, the average value of all the determinations performed in the subsamples is 1.50 g/cm3, which is lower than the final value deduced taking into account the deformation of the Teflon cell caused by the swelling of the bentonite (1.57 g/cm3).
Table XII: Average values of water content and dry density obtained from subsamples at the end of the tests
Reference FQ1/2 CG1
HI1/2 CG1
FQ1 CG5
HI1a CG6
FQ2(1) CG2
HI2 CG4 CG3
Final w (%) 17.6 17.8 18.5 18.2 20.2 19.9 25.0 Final ρd (g/cm3) 1.58 1.58 1.57 1.58 1.56 1.54 1.50 Final Sr (%) 65 66 67 67 71 69 86 aThe samples were dried only for 18 h, the water contents computed may be lower and the dry densities higher than the actual values
5
10
15
20
25
30
35
40
0 10 20 30 40 50 60
Distance from the heater (cm)
Wat
er c
onte
nt (
%)
6 months
12 months24 months
92 months
Initial
Filled symbols: tests HIOpen symbols: tests FQ
Figure 20: Final water contents along the bentonite columns of the different tests

RESULTS
Effect of heating/hydration on compacted bentonite: tests in 60-cm long cells 29
1.35
1.40
1.45
1.50
1.55
1.60
1.65
1.70
1.75
1.80
0 10 20 30 40 50 60
Distance from the heater (cm)
Dry
den
sity
(g/
cm3 )
6 months12 months24 months92 months
Filled symbols: tests FQOpen symbols: tests HI
Figure 21: Final dry densities along the bentonite columns of the different tests
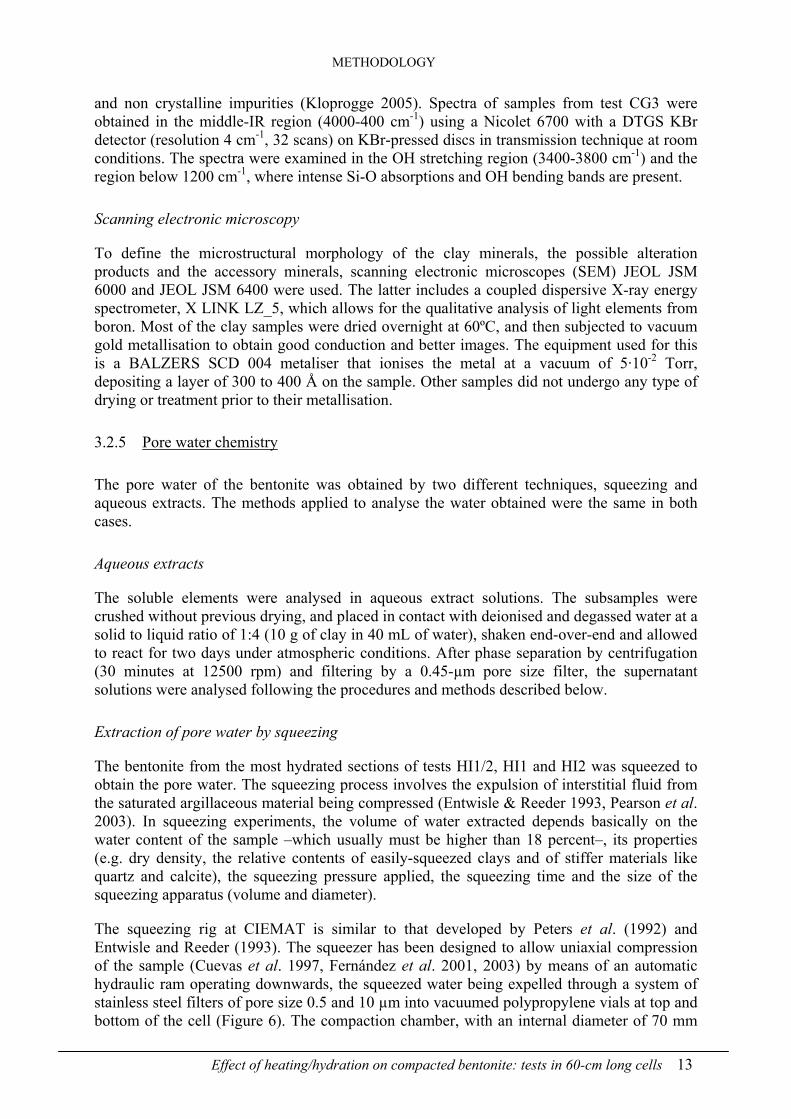
4.2.2 Basal spacing by X-ray diffraction in unaltered samples
The basal spacing of unaltered subsamples of each section of test CG3 was measured by X-ray diffraction (XRD). The results obtained are shown in Figure 22. The gradual change of water content along the bentonite column observed in Figure 20 is also reflected in the c-spacing. The d(001) reflection changes from 18.5 Å near the hydration surface to 14.5 Å near the heater, reflecting an evolution of the interlayer hydration state from the 3- to the 2-layer hydrate, the latter corresponding to the conditions of the initial bentonite. This change seems to take place by steps, as suggested by the horizontal lines drawn in Figure 22. The water contents measured in the samples after the XRD tests are also plotted in the Figure. Since several days passed between the sampling of the bentonite column and the XRD tests, and although the subsamples were kept in paraffined foil, their water contents had slightly decreased. Further drying was caused by the X-raying process itself. The water contents at the end of the XRD tests are, on average, 15 percent lower than at the end of the infiltration test, the difference being more important for the 40 cm closest to the hydration surface.
The intensity of the main diffraction peak of the smectite is low for all the samples, since they were not artificially oriented before the X-raying and the expected texture is isotropic. No trend of variation of this parameter along the column has been observed.
RESULTS
30 Villar, Fernández, Martín, Barcala, Gómez-Espina, Rivas
14
15
16
17
18
19
0 10 20 30 40 50 60
Distance from the heater (cm)
Basa
l spa
cing
(Å)
8
13
18
23
28
33
Wat
er c
onte
nt a
fter
XR
D (
%)basal spacing
water content
Figure 22: Basal spacings measured by XRD in unaltered samples of test CG3 and water content after diffraction
4.2.3 External surface area
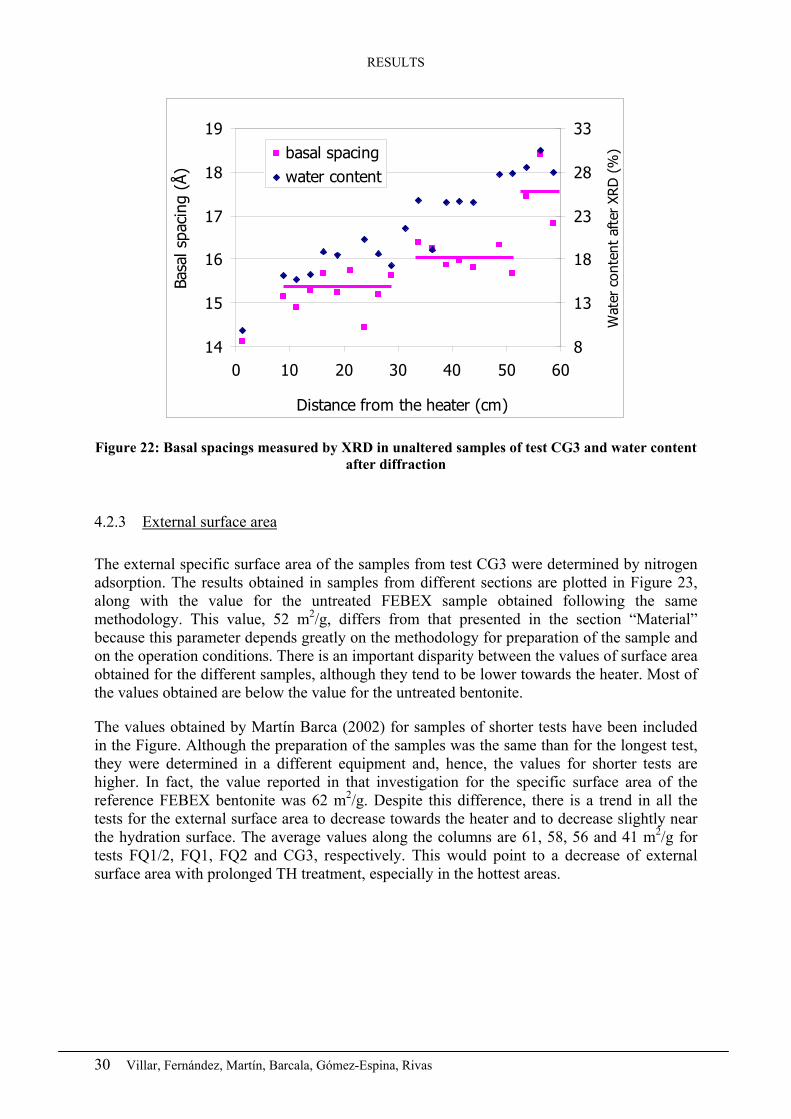
The external specific surface area of the samples from test CG3 were determined by nitrogen adsorption. The results obtained in samples from different sections are plotted in Figure 23, along with the value for the untreated FEBEX sample obtained following the same methodology. This value, 52 m2/g, differs from that presented in the section “Material” because this parameter depends greatly on the methodology for preparation of the sample and on the operation conditions. There is an important disparity between the values of surface area obtained for the different samples, although they tend to be lower towards the heater. Most of the values obtained are below the value for the untreated bentonite.
The values obtained by Martín Barca (2002) for samples of shorter tests have been included in the Figure. Although the preparation of the samples was the same than for the longest test, they were determined in a different equipment and, hence, the values for shorter tests are higher. In fact, the value reported in that investigation for the specific surface area of the reference FEBEX bentonite was 62 m2/g. Despite this difference, there is a trend in all the tests for the external surface area to decrease towards the heater and to decrease slightly near the hydration surface. The average values along the columns are 61, 58, 56 and 41 m2/g for tests FQ1/2, FQ1, FQ2 and CG3, respectively. This would point to a decrease of external surface area with prolonged TH treatment, especially in the hottest areas.

RESULTS
Effect of heating/hydration on compacted bentonite: tests in 60-cm long cells 31
20
30
40
50
60
70
0 10 20 30 40 50 60
Distance from the heater (cm)
Surf
ace
area
(m
2 /g)
FQ1/2 FQ1
FQ2 CG3
Figure 23: BET surface area of samples from the bentonite column of test CG3 and from shorter tests (Martín Barca 2002). The thick line indicates the value for the FEBEX bentonite obtained
following the two methodologies
4.2.4 Mineralogy and microstructure
X-ray diffraction
XRD patterns have been obtained in random powder samples and in oriented aggregates prepared from subsamples of each section of the columns and from the untreated FEBEX bentonite.
In the three shortest tests (HI1/2, HI1 and HI2), no clear qualitative or quantitative mineralogical changes were found (Figure 24 to Figure 26). In the samples in contact with the heater (section 24), an increase in the intensity of an anorthite-type mineral phase was detected in the 0.5, 1 and 2-year tests. Neoformed minerals, such as feldspars (sanidine), Na-K-Cl salts and dolomite/ankerite were also observed in the 1-year test.
Concerning the 7.6-year tests (CG3), both in the random powder and in the oriented aggregates neither clear qualitative nor quantitative changes were observed with respect to the original material and among the samples of the column. Just a slight decrease in the calcite content of the treated samples with respect to the original FEBEX bentonite was detected in all the powder samples. Figure 27 shows the diffractograms obtained for the original material and for samples taken at different positions along the column (S1 corresponds to the contact with the hydration surface and S24 to the contact with the heater).

RESULTS
32 Villar, Fernández, Martín, Barcala, Gómez-Espina, Rivas
5 10 15 20 25 30 35 40 45 50 55 60 65 700
200
400
600
800
1000
1200
1400
1600
Ano
rtite
, Na
Pla
gioc
lase
sC
alci
te
Sm
Tota
l Phy
Ano
rtite
,Na
Qz
Sm
Illite
HI-0.5 yearsIn
tens
ity (c
ount
s/s)
2θ CuKα
S24
Figure 24: XRD-patterns of a random powder sample taken at the heater contact from the
column of test HI1/2 (Sm: smectite, Qz: quartz, Phy: phyllosilicates)
5 10 15 20 25 30 35 40 45 50 55 60 65 70
0200400600800
1000120014001600180020002200240026002800300032003400
S1
Sani
dine
Dol
/Ank
Sm
Sani
dine
Qz
HI-1 year
S24
S24
S24
Sect. 3-4
S1Sect. 1-2
KN
aCl,
Silv
ite
An,N
aC
c
FEBEX
Inte
nsity
(cou
nts/
s)
2θ CuKα
Figure 25: XRD-patterns of random powder samples from the column of test HI1 and of the original FEBEX bentonite (Sm: smectites, Qz: quartz, An: anortite, Cc: calcite, Dol/Ank:
dolomite-ankerite)

RESULTS
Effect of heating/hydration on compacted bentonite: tests in 60-cm long cells 33
5 10 15 20 25 30 35 40 45 50 55 60 65 700
200
400
600
800
1000
1200
Sm Sm
Qz
Cal
cite
HI-2 years
S24
S1
S 8-9
Anor
tite,
Na
San
idin
e
Tota
l Phy
ll
S24
Inte
nsity
(cou
nts/
s)
2θ CuKα
Figure 26: XRD patter of random powder of bentonite samples at different position after the 2-year test HI2 (Sm: smectite, Qz: quartz, Phyll: phyllosilicates)
10 20 30 40 50 60 700
250
500
750
1000
1250
1500
SmSmFd
, Alb
ite
Cc
Qz
Fd, A
lbite
Cr
Qz
Sm
S24
S22
S17
S3
S7
S1
Inte
nsity
(cou
nts/
s)
2ºθ CuKα
FEBEX
Sm
Figure 27: XRD-patterns of random powder samples from the column of the 7.6-year test and of
the original FEBEX bentonite (Sm: smectites, Qz: quartz, Cc: calcite, Fd: feldspars)

RESULTS
34 Villar, Fernández, Martín, Barcala, Gómez-Espina, Rivas
The basal spacings measured in the oriented aggregates of the less than 2 µm and between 2 and 20 µm fractions of test CG3 are plotted in Figure 28. The basal spacings of the less than 2 µm fraction are lower and show higher dispersion than those of the 2-20 µm fraction. In both cases the basal spacings display an overall trend to decrease towards the hydration surface.
11.011.512.012.513.013.514.014.515.015.5
0 10 20 30 40 50 60
Distance from the heater (cm)
Basa
l spa
cing
(Å)
<2 µm2-20 µm
Figure 28: Basal spacings measured by X-ray diffraction in the oriented aggregates of the
fractions less than 2 µm and between 2 and 20 µm of samples from test CG3
Fourier Transform Infrared Spectroscopy
Figure 29 shows the mid/FTIR spectra of some of the samples of test CG3 compared with the reference FEBEX sample. The spectra show a band at 3620 cm-1 which corresponds to the typical OH stretching region of structural hydroxyl groups for dioctahedral smectites with Al-rich octahedral sheets. These are inner hydroxyl groups lying between the tetrahedral and octahedral sheets. The broad band near 3430 cm-1 is due to stretching H-O-H vibrations of adsorbed water, whereas the band at 1642 cm-1 corresponds to the OH bending of adsorbed water. If the Si-O absorptions and OH bending bands in the 1300-400 cm-1 range are examined, only one broad, complex Si-O stretching vibration band at around 1030 cm-1 is seen, which is typical of a dioctahedral montmorillonite. The occupancy of the octahedral sheet strongly influences the position of the OH bending bands, which arise from vibrations of the inner and surface OH groups. In these samples, the presence of a peak at 915 cm-1 (δAlAlOH) and at 840 cm-1 (δAlMgOH), indicates a partial substitution of octahedral Al by Mg, typical of dioctahedral smectites. The bands at 524 cm-1 and 466 cm-1 correspond to Si-O-Al (octahedral Al) and Si-O-Si bending vibrations, respectively. The weak band at 790 cm-
1 is caused by the Si-O stretching of quartz-CT. All these bands are similar to those found in the reference FEBEX sample.
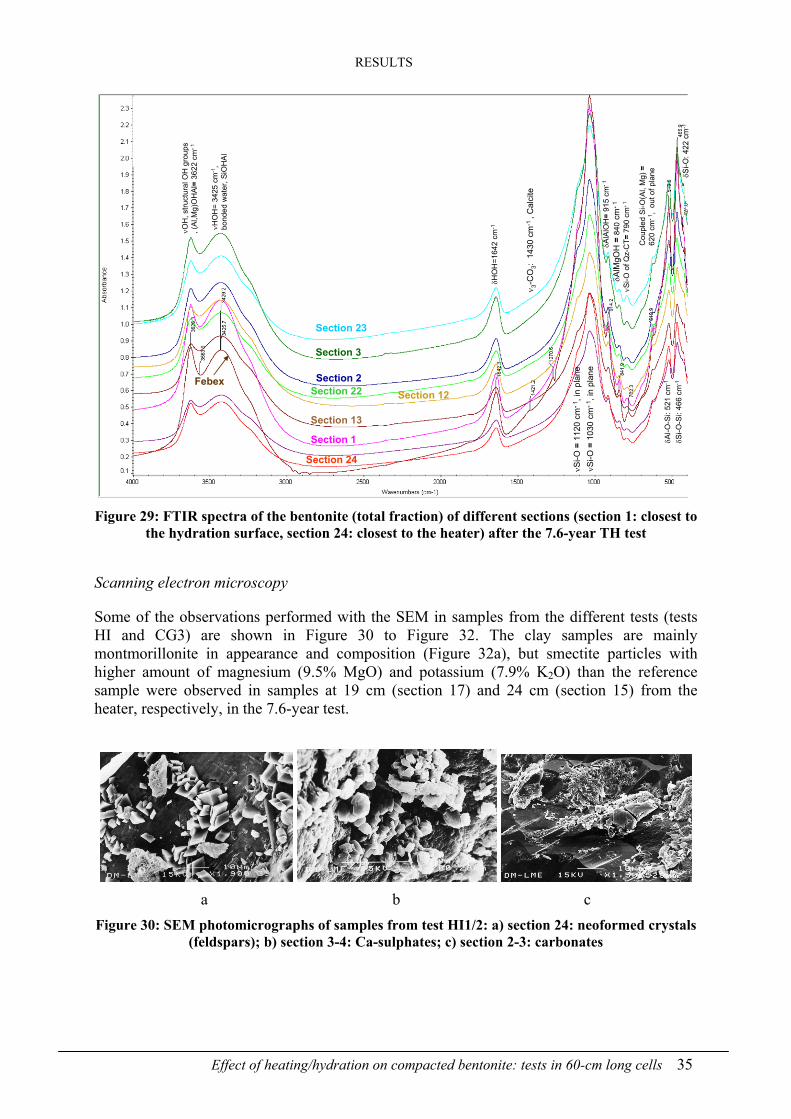
RESULTS
Effect of heating/hydration on compacted bentonite: tests in 60-cm long cells 35
δAlA
lOH
=91
5 cm
-1
δAlM
gOH
=84
0cm
-1
δHO
H=1
642
cm-1
νSi-O
=11
20 c
m-1
, in
plan
eνS
i-O =
1030
cm
-1, i
n pl
ane
Cou
pled
Si-O
(Al,
Mg)
=62
0 cm
-1,
out o
fpla
ne
δSi-O
-Si:
466
cm-1
δSi-O
: 422
cm
-1
νSi-O
ofQ
z-C
T=79
0 cm
-1
νOH
, stru
ctur
alO
H g
roup
s, (
Al,M
g)O
HAl
=36
22 c
m-1
νHO
H=
3425
cm
-1,
bond
edw
ater
, SiO
HA
l
ν 3-C
O3:
1430
cm
-1 ,
Cal
cite
Section 23
Febex Section 2
Section 24
Section 3
Section 13
Section 12Section 22
Section 1 δAl-O
-Si:
521
cm-1
Figure 29: FTIR spectra of the bentonite (total fraction) of different sections (section 1: closest to
the hydration surface, section 24: closest to the heater) after the 7.6-year TH test
Scanning electron microscopy
Some of the observations performed with the SEM in samples from the different tests (tests HI and CG3) are shown in Figure 30 to Figure 32. The clay samples are mainly montmorillonite in appearance and composition (Figure 32a), but smectite particles with higher amount of magnesium (9.5% MgO) and potassium (7.9% K2O) than the reference sample were observed in samples at 19 cm (section 17) and 24 cm (section 15) from the heater, respectively, in the 7.6-year test.
a b c
Figure 30: SEM photomicrographs of samples from test HI1/2: a) section 24: neoformed crystals (feldspars); b) section 3-4: Ca-sulphates; c) section 2-3: carbonates

RESULTS
36 Villar, Fernández, Martín, Barcala, Gómez-Espina, Rivas
a b c
Figure 31: SEM photomicrographs of samples from test HI1: a) section 9: band of silica gel with Cl impregnations; b) section 9: Cl crystal with K, Na and Ca; c) section 7: Ca-Fe carbonates
a b c
d e f
g h Figure 32: SEM photomicrographs of samples from test CG3: a) seccion 24: unaltered smectite lamellae; b) section 24: plagioclases and K-feldspars; c) section 21: bands of silica; d) section 22: botroidal quartz; e) section 24: smectite with Cl impregnations; f) section 7: Ca-sulphates and
plagioclases; g) section 17: Ca-sulphates; h) section 15: Ca-carbonates
However, different accessory minerals (chlorides, sulphates and carbonates) seem to have neoformed at different positions along the bentonite columns depending on the duration of the tests and the extension of the hydration front. For example, in the shortest test, impregnations of chloride were found at 51 cm from the heater, and gypsum crystals at 54 cm from the heater (Figure 30b), whereas in the 1-year test, gypsum and other sulphates were found at

RESULTS
Effect of heating/hydration on compacted bentonite: tests in 60-cm long cells 37
distances from the heater between 31 and 41 cm, and K-rich crystals were found at 29 cm from the heater. Besides, bands of silica gel were found at 39 cm from the heater in the 1-year test (Figure 31a) and at only 7 cm from the heater in the 7.6-year test (Figure 32c). Neoformed feldspars as well as dissolution marks in crystals were found at the heater contact in the shortest test (Figure 30a). Other mineral phases observed were quartz, Opal-CT, plagioclases and K-feldspars, all of them equally found in the untreated bentonite.
4.2.5 Pore water chemistry
The pore water was obtained by two different techniques, squeezing and aqueous extracts. The chemical composition of the aqueous extracts reflects the bentonite-pore water interactions and the resulting chemical reactions but, it must be taken into account that the pore water chemistry of compacted bentonite cannot be obtained directly from aqueous extraction experiments. They are carried out at low solid to liquid ratios and the unconstrained dissolution of highly soluble salts and sparingly soluble minerals, together with cation exchange reactions on the montmorillonite, leads to water compositions and cation occupancies which are very dependent on the experimental conditions (Bradbury & Baeyens 1998, Fernández et al. 2001). On the other hand, the squeezed pore waters reflect the composition of the bentonite pore water, although it can be slightly diluted with respect to the actual one, because in the course of squeezing, part of the interlayer water can be extracted together with the pore water (Fernández 2004).
Aqueous extracts
The concentration of soluble ions was measured in aqueous extracts obtained by mixing soil and deionised water in a ratio 1 to 4. In all the TH tests there are changes of concentration of the pore water along the bentonite columns, as it is reflected in the electric conductivity of the aqueous extracts, that clearly increases near the heater and decreases near the hydration surface (Figure 33). For the three shortest tests the increase above the reference value is observed in the 6 cm closest to the heater, whereas in the longest test, this increase is observed in the 20 cm closest to the heater. In the shortest tests there are also intermediate increases in the electric conductivity of the aqueous extracts at other positions along the bentonite columns.
The concentration values obtained for different ionic species are shown in Figure 34 to Figure 37 and summarised in Table XIII. The reference values given are those shown in Table I. The maximum content of chloride along the bentonite column varied as a function of the duration of the test, and hence, it is located approximately at 49, 44, 36 and 1 cm from the heater in the 0.5, 1, 2 and 7.6-year tests, respectively (Figure 34). The main counterion that followed the chloride movement in all the tests is sodium, decreasing close to the hydration source and increasing towards hotter zones, especially in the longest test (Figure 35). Sulphate is leached at the hydration source and moves slowly, and thus the peaks of concentration remain closer to the hydration surface than in the case of chloride, approximately at 56, 54, 51 and 45 cm from the heater in the 0.5, 1, 2 and 7.6-year tests, respectively (Figure 36). Bicarbonate concentrations show a different behaviour in the wet and hot zones (Figure 37). Close to the hydration surface there is a clear increase in bicarbonate in all the tests, correlated with an increase in the pH of the aqueous extracts (Figure 38). In the rest of the bentonite column, the concentration of bicarbonate is more or less constant, except at the heater contact. There is an increase in the soluble magnesium, potassium and calcium concentrations close to the heater, and potassium also increases near the hydration source (Figure 39 to Figure 41).

RESULTS
38 Villar, Fernández, Martín, Barcala, Gómez-Espina, Rivas
400
600
800
1000
1200
1400
1600
1800
2000
0 10 20 30 40 50 60
Distance from the heater (cm)
Elec
tric
con
duct
ivity
(µS
/cm
)0.5 year1 year2 year7.6 year
Figure 33: Electric conductivity (at 25°C) of the 1:4 aqueous extracts of samples taken at
different positions along the columns of tests of different duration (thick line: reference value; open symbols and filled symbols: data from FQ and HI tests, respectively)
0.0
1.0
2.0
3.0
4.0
5.0
6.0
7.0
0 10 20 30 40 50 60
Distance from the heater (cm)
Chl
orid
e co
ncen
trat
ion
(mm
ol/1
00g)
0.5 years1 year2 year7.6 years
Figure 34: Concentration of chloride obtained in 1:4 aqueous extracts from samples taken at
different positions along the columns of tests of different duration (thick line: reference value; open symbols and filled symbols: data from FQ and HI tests, respectively)

RESULTS
Effect of heating/hydration on compacted bentonite: tests in 60-cm long cells 39
2.0
3.0
4.0
5.0
6.0
7.0
8.0
0 10 20 30 40 50 60
Distance from the heater (cm)
Sodi
um c
once
ntra
tion
(mm
ol/1
00g)
0.5 years1 year2 year7.6 years
Figure 35: Concentration of sodium obtained in 1:4 aqueous extracts from samples taken at
different positions along the columns of tests of different duration (thick line: reference value; open symbols and filled symbols: data from FQ and HI tests, respectively)
0.0
0.5
1.0
1.5
2.0
2.5
3.0
3.5
0 10 20 30 40 50 60
Distance from the heater (cm)
Sulp
hate
con
cent
ratio
n (m
mol
/100
g) 0.5 years1 year2 year7.6 years
Figure 36: Concentration of sulphate obtained in 1:4 aqueous extracts from samples taken at different positions along the columns of tests of different duration (thick line: reference value;
open symbols and filled symbols: data from FQ and HI tests, respectively)

RESULTS
40 Villar, Fernández, Martín, Barcala, Gómez-Espina, Rivas
0.0
0.5
1.0
1.5
2.0
2.5
0 10 20 30 40 50 60Distance from the heater (cm)
Bica
rbon
ate
conc
. (m
mol
/100
g)0.5 years1 year2 year7.6 years
Figure 37: Concentration of bicarbonate obtained in 1:4 aqueous extracts from samples taken at
different positions along the columns of tests of different duration (thick line: reference value; open symbols and filled symbols: data from FQ and HI tests, respectively)
7.0
7.2
7.4
7.6
7.8
8.0
8.2
8.4
8.6
8.8
9.0
0 10 20 30 40 50 60
Distance from the heater (cm)
pH
0.5 years1 year2 year7.6 years
Figure 38: pH of 1:4 aqueous extracts from samples taken at different positions along the columns of tests of different duration (thick line: reference value; open symbols and filled
symbols: data from FQ and HI tests, respectively)

RESULTS
Effect of heating/hydration on compacted bentonite: tests in 60-cm long cells 41
0.00
0.05
0.10
0.15
0.20
0.25
0.30
0.35
0.40
0.45
0 10 20 30 40 50 60
Distance from the heater (cm)
Mag
nesi
um c
onc.
(m
mol
/100
g)0.5 years1 year2 year7.6 years
Figure 39: Concentration of magnesium obtained in 1:4 aqueous extracts from samples taken at different positions along the columns of tests of different duration (thick line: reference value;
open symbols and filled symbols: data from FQ and HI tests, respectively)
0.00
0.05
0.10
0.15
0.20
0.25
0.30
0.35
0 10 20 30 40 50 60
Distance from the heater (cm)
Pota
ssiu
m c
onc.
(m
mol
/100
g)
0.5 years1 year2 year7.6 years
Figure 40: Concentration of potassium obtained in 1:4 aqueous extracts from samples taken at different positions along the columns of tests of different duration (thick line: reference value;
open symbols and filled symbols: data from FQ and HI tests, respectively)
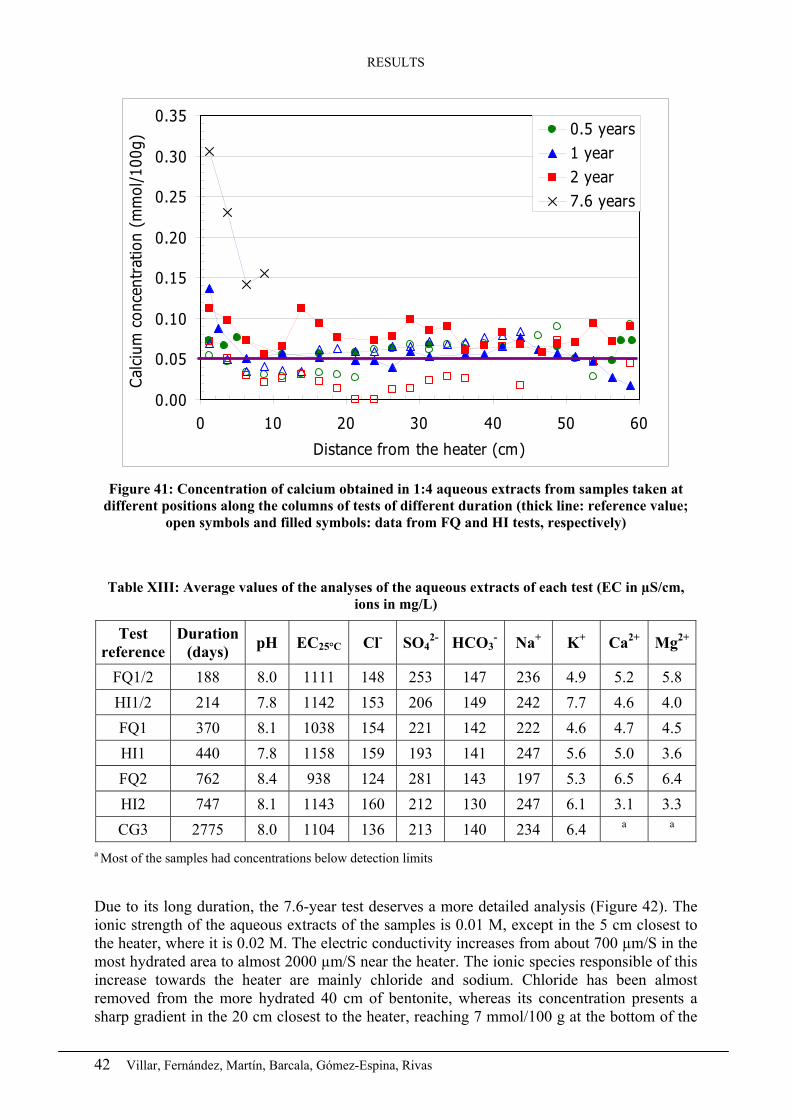
RESULTS
42 Villar, Fernández, Martín, Barcala, Gómez-Espina, Rivas
0.00
0.05
0.10
0.15
0.20
0.25
0.30
0.35
0 10 20 30 40 50 60
Distance from the heater (cm)
Cal
cium
con
cent
ratio
n (m
mol
/100
g)0.5 years1 year2 year7.6 years
Figure 41: Concentration of calcium obtained in 1:4 aqueous extracts from samples taken at
different positions along the columns of tests of different duration (thick line: reference value; open symbols and filled symbols: data from FQ and HI tests, respectively)
Table XIII: Average values of the analyses of the aqueous extracts of each test (EC in µS/cm, ions in mg/L)
Test reference
Duration (days) pH EC25°C Cl- SO4
2- HCO3- Na+ K+ Ca2+ Mg2+
FQ1/2 188 8.0 1111 148 253 147 236 4.9 5.2 5.8 HI1/2 214 7.8 1142 153 206 149 242 7.7 4.6 4.0 FQ1 370 8.1 1038 154 221 142 222 4.6 4.7 4.5 HI1 440 7.8 1158 159 193 141 247 5.6 5.0 3.6 FQ2 762 8.4 938 124 281 143 197 5.3 6.5 6.4 HI2 747 8.1 1143 160 212 130 247 6.1 3.1 3.3 CG3 2775 8.0 1104 136 213 140 234 6.4 a a
a Most of the samples had concentrations below detection limits
Due to its long duration, the 7.6-year test deserves a more detailed analysis (Figure 42). The ionic strength of the aqueous extracts of the samples is 0.01 M, except in the 5 cm closest to the heater, where it is 0.02 M. The electric conductivity increases from about 700 µm/S in the most hydrated area to almost 2000 µm/S near the heater. The ionic species responsible of this increase towards the heater are mainly chloride and sodium. Chloride has been almost removed from the more hydrated 40 cm of bentonite, whereas its concentration presents a sharp gradient in the 20 cm closest to the heater, reaching 7 mmol/100 g at the bottom of the

RESULTS
Effect of heating/hydration on compacted bentonite: tests in 60-cm long cells 43
cell, the initial content of soluble chloride in this bentonite being 2 mmol/100 g. Soluble sodium follows a similar trend. The concentration of soluble potassium, magnesium and calcium also increases towards the heater, the concentration of the two latter being below the detection limit in most of the column. Sulphate has been washed from the 12 cm of more hydrated bentonite, and it has concentrated along the central part of the column. Besides, the content of bicarbonate increases close to the hydration source and tends to decrease towards the heater. The pH of the aqueous extracts follows the same pattern than bicarbonates.
However, the average concentration of ions along the column remains similar to that of the original, untreated FEBEX bentonite (Table I), which means that there has not been backward diffusion of ions out of the cell.
0
1
2
3
4
5
6
7
8
9
10
0 10 20 30 40 50 60
Distance from the heater (cm)
Cl,
SO4,
Na
(mm
ol/1
00g)
& p
H
0.0
0.2
0.4
0.6
0.8
1.0
1.2
1.4
1.6
1.8
2.0
K, Mg, C
a; HC
O3 (m
mol/100 g)
Cl SO4 Na pHMg Ca K HCO3
Figure 42: Distribution of soluble salts along the column of test CG3 as measured in 1:4
solid:liquid aqueous extracts
Squeezing
The pore water was extracted from the bentonite by squeezing at a pressure of 64 MPa only from those sections with water content higher than 20 percent in the HI1/2, HI1 and HI2 tests. The chemical composition of the pore waters obtained is shown in Table XIV and Figure 43. The total amount of water extracted at a pressure of 64 MPa ranged from 28 to 2 mL, with an efficiency between 34 and 4 percent, i.e. most of the water remained in the bentonite sample inside the interlayer space. The squeezing tests took from 15 to 31 days.
The pore waters are Cl-Na type and more diluted in the more hydrated zones, hence the lowest ionic strengths, 0.03 M, are found in the 5 cm closest to the hydration surface for the three tests analysed. Although only a small portion of the columns has been analysed with this

RESULTS
44 Villar, Fernández, Martín, Barcala, Gómez-Espina, Rivas
method, it has been observed that the highest salinity of the pore water is found farther from the hydration surface as the duration of the test is longer. Thus, in the 0.5-year test, the water extracted at 5-10 cm from the hydration surface has ionic strength of 0.3 M, whereas for the 2-year test a similar salinity is found at 15-20 cm from the hydration surface. In these zones the water type changes to Na-Mg-Cl type. The pHs are neutral with values around 7.5.
The saturation indexes of different minerals for the squeezed waters are shown in Table XV. In the hydrated zones, the waters are subsaturated with respect to all minerals. Towards drier zones the waters are saturated with respect to dolomite and calcite; in the 2-year test these waters are also close to saturation with respect to gypsum.
Table XIV: Chemical composition of the bentonite pore water obtained by squeezing of samples taken at different positions along the columns after 0.5, 1 and 2 years of thermo-hydraulic
treatment, in mg/L
Test HI1/2 HI1 HI2
Distance from the heater (cm) 57.5 52.5 57.5 52.5 47.5 57.5 52.5 47.5 40.0
Ca2+ 72 1500 55 740 220 48 195 373 1700K+ 7.2 32 3.5 14 8.4 4.9 8.0 14 29 Na+ 725 4000 655 2800 1500 763 1400 1800 3000
Mg2+ 72 1400 56 875 235 59 200 385 1400Sr2+ 1.3 28 0.9 12 3.6 0.7 2.8 5.5 30 Cl- 854 11400 970 6700 2100 1000 2000 3700 10600
SO42- 625 3400 475 1500 1400 522 1500 1400 2200
HCO3 - 113 -- 136 167 121 83 102 108 --
pH 7.0 -- -- 7.6 7.6 7.5 7.6 7.5 -- Ionic Strength (M) 0.03 0.32 0.03 0.19 0.08 0.04 0.07 0.11 0.28
EC25°C (µS/cm) 4137 36644 3634 23161 9605 4060 8735 12915 33284
S:L ratio 3.53 4.68 3.21 3.83 4.12 3.22 3.49 3.88 4.39

RESULTS
Effect of heating/hydration on compacted bentonite: tests in 60-cm long cells 45
0
50
100
150
200
250
300
350
58.8cm
53.8cm
58.8cm
53.8cm
48.8cm
58.8cm
53.8cm
48.8cm
41.3cm
HI-0.5 years HI-1 year HI-2 years Ref.
Con
cent
ratio
n (m
eq/L
) Cl- SO4 Ca Mg Na
Figure 43: Chemical composition of the pore water extracted by squeezing from different
positions along the bentonite columns (indicated as distance from the heater) at the end of the TH tests and of the untreated bentonite (Ref.)
Table XV: Saturation index of different minerals in the bentonite pore water obtained by squeezing of samples taken at different positions along the columns after 0.5, 1 and 2 years of
thermo-hydraulic treatment
Test HI 0.5 year HI 1 year HI 2 years
Distance from the heater (cm) 57.5 52.5 57.5 52.5 47.5 57.5 52.5 47.5 40.0
T (ºC) during TH test 32 25 44 30 24 36 26 23 24 Calcite -0.74 0.0a -0.60 0.70 0.11 -0.49 0.01 0.13 0.0a
Dolomite -1.08 0.34 -0.72 1.89 0.59 -0.45 0.39 0.61 0.28 Celestite -1.21 0.06 -1.43 -0.49 -0.71 -1.53 -0.77 -0.64 -0.09 Gypsum -1.20 0.06 -1.40 -0.43 -0.64 -1.43 -0.65 -0.52 -0.05
Anhydrite -1.39 -0.15 -1.51 -0.63 -0.86 -1.60 -0.87 -0.75 -0.27 Strontianite -2.06 -1.28 -2.00 -0.66 -1.22 -1.92 -1.38 -1.23 -1.30
CO2 -1.96 -5.52 -1.79 -2.56 -2.63 -2.57 -2.69 -2.62 -5.57 a Calcite equilibrium assumed

RESULTS
46 Villar, Fernández, Martín, Barcala, Gómez-Espina, Rivas
4.2.6 Exchangeable cations
The Ca, Mg, Na and K concentrations in the exchange positions of the smectite (CaX2 MgX2, NaX and KX) for the HI and CG3 tests are shown in Figure 44 to Figure 47. Due to the fact that the determination methods employed were not the same for all the tests, the values given must be taken as relative and analysed looking into trends and not into absolute values. The values obtained for the reference sample and the 7.6-years test are more accurate because they were determined with a method that prevents dissolution of carbonates and sulphates during extraction and consequently does not overestimate the population of cations at interlayers. Therefore, higher values of Ca and Mg with respect to the reference values are obtained in the 0.5, 1 and 2-year tests. The values shown in the Figures have been normalised to the CEC value shown in Table III, 102 meq/100g, in order to be able to compare the results from different tests.
The exchangeable calcium increases in the vicinity of the hydration surface in the 2 and 7-year tests and decreases clearly close to the heater zone in the 7.6-year test (Figure 44). The exchangeable magnesium decreases close to the hydration source in all the tests and keeps more or less constant along the rest of the column, except in the longest test, in which its contribution to the exchange complex increases significantly in the 15 cm closest to the heater (Figure 45). The exchangeable sodium increases close to the hydration surface in the 0.5-year test (while MgX2 and CaX2 decrease), and it keeps more or less constant along the rest of the column in all the tests, with a slight trend to decrease towards the heater, which is very clear in the 20 cm closest to the heater in the 7.6-year test (Figure 46). The exchangeable potassium increases in all the tests towards the hydration surface, and in the 2 and 7-year tests it also increases clearly towards the heater, the spatial extent of this increase being larger in the longest test (Figure 47).
In the samples of the 7.6-year test, the sum of exchangeable cations (ΣEC) experienced an increase all over the column with respect to the same parameter in the untreated FEBEX bentonite, except in the 20 cm closest to the heater. The ΣEC in the original FEBEX was 96 meq/100g (Table III) and the average value for the 24 samples from the column CG3 is 106 meq/100g, the highest values being found in the most hydrated samples. In this test, the distribution of cation population at clay interlayers remains approximately constant along the column, except in the 20 cm closest to the heater and in the 12 cm closest to the hydration surface (Figure 48). The content of exchangeable sodium and calcium decreases near the heater, while the content of exchangeable magnesium and potassium increases. Close to the hydration surface the exchangeable calcium and sodium contents increase and decrease, respectively. A generalised increase in exchangeable potassium is observed in all the samples, more evident with time and stressed at both ends of the columns.

RESULTS
Effect of heating/hydration on compacted bentonite: tests in 60-cm long cells 47
20
25
30
35
40
45
50
0 10 20 30 40 50 60
Distance from the heater (cm)
Ca
exch
ange
able
(m
eq/1
00g)
0.5 years1 year2 years7.6 years
Figure 44: Distribution of exchangeable calcium along the bentonite columns at different times (tests HI and CG3). All the values were normalized with respect to the total CEC of the FEBEX
bentonite
20
25
30
35
40
45
50
0 10 20 30 40 50 60
Distance from the heater (cm)
Mg
exch
ange
able
(m
eq/1
00g)
0.5 years1 year2 years7.6 years
Figure 45: Distribution of exchangeable magnesium along the bentonite columns at different times (tests HI and CG3). All the values were normalized with respect to the total CEC of the
FEBEX bentonite
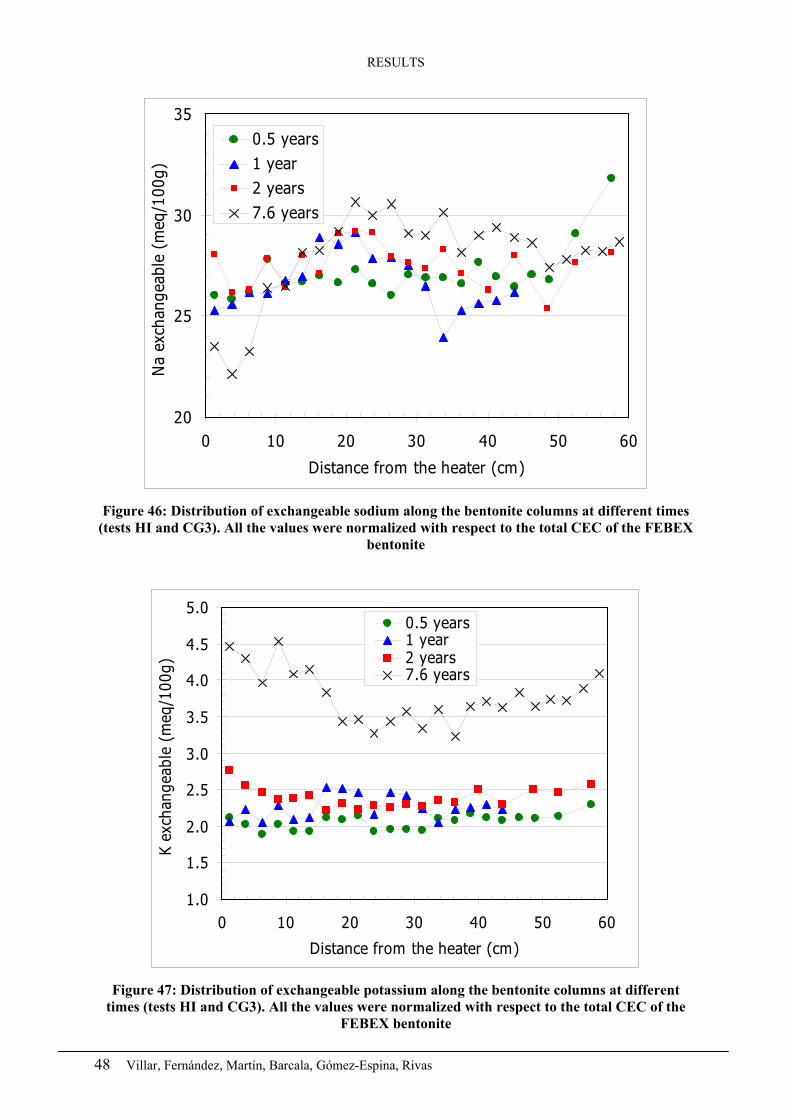
RESULTS
48 Villar, Fernández, Martín, Barcala, Gómez-Espina, Rivas
20
25
30
35
0 10 20 30 40 50 60
Distance from the heater (cm)
Na
exch
ange
able
(m
eq/1
00g)
0.5 years1 year2 years7.6 years
Figure 46: Distribution of exchangeable sodium along the bentonite columns at different times
(tests HI and CG3). All the values were normalized with respect to the total CEC of the FEBEX bentonite
1.0
1.5
2.0
2.5
3.0
3.5
4.0
4.5
5.0
0 10 20 30 40 50 60
Distance from the heater (cm)
K ex
chan
geab
le (
meq
/100
g)
0.5 years1 year2 years7.6 years
Figure 47: Distribution of exchangeable potassium along the bentonite columns at different
times (tests HI and CG3). All the values were normalized with respect to the total CEC of the FEBEX bentonite

RESULTS
Effect of heating/hydration on compacted bentonite: tests in 60-cm long cells 49
18
23
28
33
38
43
48
0 10 20 30 40 50 60
Distance from the heater (cm)
Exch
ange
able
cat
ion
(meq
/100
g)
3.0
3.5
4.0
4.5
5.0
Exch
ange
able
K (
meq
/100
g)
Na Mg
Ca K
Na+
Mg2+
Ca2+
Figure 48: Distribution of exchangeable cations along the column of test CG3 (7.6 years). The values for the original FEBEX (Table III) are indicated with straight lines
4.2.7 Hydraulic conductivity
The hydraulic conductivity has been determined following the procedure described in section 3.2.7 in trimmed samples from tests FQ1/2, FQ1 and FQ2 saturated in the permeability cell with granitic water. The specimens were trimmed to fit the ring of the permeability cell, its dry density and water content being preserved as much as possible as they were when the TH treatment finished. In this way, the specimens from different positions had different density and water content at the beginning of the permeability determination, what highly influences the results obtained. The values obtained are shown in Figure 49 as a function of the distance to the heater. The permeability shows a trend to be lower towards the heater, because the dry density in this zone is higher as a consequence of the shrinkage caused by evaporation.
The values obtained are compared in Figure 50 to those expected for specimens of untreated FEBEX clay compacted to the same dry density, i.e. calculated from Equations 1 and 2. The values after thermo-hydraulic treatment are in general higher than the theoretical ones, regardless the position of the clay with respect to the heater –i.e., of the clay having been previously desiccated or not– or the duration of treatment.

RESULTS
50 Villar, Fernández, Martín, Barcala, Gómez-Espina, Rivas
1.0E-14
1.0E-13
1.0E-12
0 10 20 30 40 50 60
Distance from the heater (cm)
Hyd
raul
ic c
ondu
ctiv
ity (
m/s
)
FQ1/2: 6 months
FQ1: 12 months
FQ2: 24 months
1.70
1.61
1.40
1.681.63
1.67
1.70
1.76
1.401.471.59
1.66
1.46
1.43
1.41
1.42
Figure 49: Permeability values obtained after TH treatment during different periods of time as a
function of the distance from the heater (the dry density of each specimen is shown in g/cm3) (Villar et al. 2005)
1E-14
1E-13
1E-12
1E-14 1E-13 1E-12
Measured permeability (m/s)
Cal
cula
ted
perm
eabi
lity
(m/s
)
FQ1/2: 6 months
FQ1: 12 months
FQ2: 24 months
Figure 50: Final hydraulic conductivities of samples from three TH tests compared with the
values obtained with Equations 1 and 2

RESULTS
Effect of heating/hydration on compacted bentonite: tests in 60-cm long cells 51
4.2.8 Swelling capacity
For the determination of the swelling capactiy after thermo-hydraulic treatment, two different kinds of specimens have been used, as explained in section 3.2.8:
− Remoulded specimens, that were stabilised at laboratory conditions (relative humidity and temperature) in order to get uniform hygroscopic water content in all the samples (samples from tests FQ1/2 and FQ1). Afterwards, they were gently disaggregated to a grain size less than 5 mm. With the sample thus prepared, specimens were compacted to dry density of 1.60 g/cm3 inside the oedometer ring. In this way, samples from different sections in the thermo-hydraulic tests, had the same dry density and water content at the beginning of the swelling tests.
− Intact specimens, trimmed to fit the ring of the oedometer cell, their dry density and water content being preserved as they were when the TH treatment ended (samples from TH tests FQ1/2 and CG3). In this way, the specimens from different positions had different densities and water contents at the beginning of the determination, what highly influences the results obtained (Villar & Lloret 2008).
Remoulded samples from tests FQ1/2 and FQ1 were obtained from approximately half the sections of the columns of both tests. They were compacted to nominal dry density 1.60 g/cm3 after stabilisation of their water content and saturated with granitic water under vertical load of 0.5 MPa. The expected final strain at these conditions, calculated from Equation 8, is between -14 and -17 percent, depending on the actual dry density. The values obtained are plotted in Figure 51 as a function of the distance from the heater. On average, the absolute values obtained are higher than the calculated ones, 8 and 13 percent higher for the samples from tests FQ1/2 and FQ1, respectively, what indicates a higher swelling. However, this increase is not related to the position inside the TH cell, i.e. the temperature of treatment. It is considered to be just a consequence of the remoulding process.
Some of the samples from test FQ1/2 were tested intact, i.e., just trimmed to fit the oedometer ring. In this way, the samples from different sections had different initial dry density and water content. The evolution of vertical strain during these tests is plotted in Figure 52 and the final strains reached upon saturation with granitic water are plotted in Figure 53. The latter are related to the initial dry density and water content and, consequently, they are higher for the samples closer to the heater, which had higher dry density and lower water content. The tests lasted on average 13 days, and at the end of the tests, all the specimens were verified to be completely saturated.

RESULTS
52 Villar, Fernández, Martín, Barcala, Gómez-Espina, Rivas
-22
-21
-20
-19
-18
-17
-16
-15
-140 10 20 30 40 50 60
Distance from the heater (cm)
Fina
l ver
tical
str
ain
(%)
FQ1/2 FQ1
Figure 51: Final strain of remoulded samples of tests FQ1/2 and FQ1 tests compacted to nominal dry density 1.60 g/cm3 and saturated with granitic water under vertical stress 0.5 MPa. The
horizontal band indicates the range of values expected from Equation 8
-25
-20
-15
-10
-5
0
50.0001 0.001 0.01 0.1 1 10 100
Time (days)
Ver
tical
str
ain
(%)
2: 56 cm5: 49 cm9: 39 cm17: 19 cm10: 36 cm13: 29 cm24: 1 cm
Section, distance from heater
1.49
1.63
1.63
1.69
1.62
Figure 52: Evolution of vertical strain during saturation with granitic water under vertical pressure 0.5 MPa for samples trimmed from sections of test FQ1/2 (the initial dry density of the
samples is indicated in g/cm3)

RESULTS
Effect of heating/hydration on compacted bentonite: tests in 60-cm long cells 53
-22
-20
-18
-16
-14
-12
-10
-80 10 20 30 40 50 60
Distance from the heater (cm)
Fina
l ver
tical
str
ain
(%)
ρd=1.49, w =27.1
ρd=1.69, w =6.2
ρd=1.62, w =15.6
ρd=1.63, w =16.1
ρd=1.63, w =21.5
ρd=1.60, w =16.7
Figure 53: Final vertical strains in swelling tests with granitic water under vertical load 0.5 MPa for samples from test FQ1/2 (initial dry densities expressed in g/cm3 and water contents in %)
(Villar et al. 2005)
The values of final vertical strain obtained can be compared either with those calculated with Equation 7, i.e. the expected values for untreated samples of the same initial dry density and water content but saturated with deionised water; or with those calculated from Equation 8, i.e. the expected values for untreated samples of the same dry density but initial hygroscopic water content saturated with granitic water. These comparisons have been done in Figure 54, where the deviation is computed as
((εm-εc) / εc) x 100 [9]
where εm is the measured strain and εc the strain calculated with Equation 7 or Equation 8, both in absolute values.
It is foreseen that the values calculated with Equation 7, which was obtained from swelling tests performed with deionised water, are overall slightly higher (11%) than the values obtained for samples of the same initial conditions saturated with granitic water (Lloret et al. 2004). Figure 54 shows that the measured final strains are actually lower than those expected from the calculations with Equation 7 for samples of the same initial dry density and water content saturated with deionised water, 13 percent lower on average, although with a trend for the deviation to be higher for the samples towards the heater. This would suggest that the swelling capacity has decreased by the effect of heating.
If the measured values are compared to the final strains expected for an untreated sample of the same dry density but of initial hygroscopic water content saturated with granitic water (values calculated with Equation 8), the trend would be to find lower measured strains towards the hydration surface, due to the higher initial water content of the samples located in

RESULTS
54 Villar, Fernández, Martín, Barcala, Gómez-Espina, Rivas
this zone, and higher measured strains towards the heater, due to the lower water content of these samples, since the swelling capacity of the bentonite for a given dry density decreases with the increase in water content (Villar & Lloret 2008). This is in fact what can be observed in Figure 54. In the intermediate locations of the column, where the initial water content of the samples is slightly higher than hygroscopic, the measured swelling strain should be somewhat lower than calculated with Equation 8. However, there is not a clear trend in the results to draw further conclusions.
-40
-30
-20
-10
0
10
20
0 20 40 60
Distance from the heater (cm)
Dev
iatio
n fr
om c
alcu
late
d va
lues
(%
)
Equation 7Equation 8
Figure 54: Deviation (according to Equation 9) of the final strains reached in the swelling tests performed with granitic water with trimmed samples from test FQ1/2 with respect to the values
calculated with Equation 7 and Equation 8
In the case of test CG3, half of the samples taken (the ones with even references) were trimmed to the dimensions of the oedometer ring. The samples were saturated with deionised water under a vertical pressure of 0.5 MPa. Figure 55 shows the evolution of strain over time in these tests. Since the samples were preserved after disassembling the thermo-hydraulic cell trying not to cause variations in their water content or dry density, the samples closer to the hydration surface had higher initial water content and lower initial dry density. The swelling capacity is related to both, increasing with initial dry density and decreasing with initial water content (Villar & Lloret 2008). For this reason, the final strain of the samples closer to the heater is higher, as can be clearly seen in Figure 56. Figure 55 also illustrates how swelling develops more rapidly in the samples of higher initial dry density (and lower initial water content), which correspond to samples closer to the heater. Their higher suction may be the explanation of this behaviour.
The tests lasted an average of 18 days. At the end of the tests, all the specimens were verified to be completely saturated.

RESULTS
Effect of heating/hydration on compacted bentonite: tests in 60-cm long cells 55
-18
-16
-14
-12
-10
-8
-6
-4
-2
0
20.0001 0.01 1 100
Time (days)
Vert
ical
str
ain
(%)
2: 56 cm 4: 51 cm6: 46 cm 8: 41 cm10: 36 cm 12: 31 cm14: 26 16: 21 cm18: 16 cm 20: 11 cm22: 6 cm 24: 1 cm
1.44
1.61
1.551.56
Section, distance from heater
1.47
1.531.49
1.62
Figure 55: Evolution of vertical strain during saturation with deionised water under vertical
pressure 0.5 MPa for samples trimmed from sections of test CG3 (the initial dry density of the samples is indicated in g/cm3)
-18
-16
-14
-12
-10
-8
-6
-4
-2
00 10 20 30 40 50 60
Distance from the heater (cm)
Fina
l ver
tical
str
ain
(%)
1.44, 30.4
1.47, 30.4
1.49, 30.0
1.53, 27.1
1.51, 27.5
1.56, 25.9
1.59, 25.4
1.53, 20.7
1.58, 20.7
1.55, 16.7
1.62, 12.9
1.61, 12.2
Figure 56: Vertical strain after saturation with deionised water under vertical pressure 0.5 MPa
for samples trimmed from the CG3 column sections (the initial dry density of the samples is indicated in g/cm3 and the water content in %)

RESULTS
56 Villar, Fernández, Martín, Barcala, Gómez-Espina, Rivas
In Figure 57 the final vertical strains actually developed by the samples are confronted with the values obtained with Equation 7 for samples of non-treated FEBEX bentonite with the same initial dry density and water content. It can be observed that the final swelling strain of the samples from the column are slightly lower in absolute values (18 percent on average) than those expected for the untreated FEBEX bentonite compacted at the same initial dry density with the same water content. They tend to be even lower towards both ends of the column.
-25
-20
-15
-10
-5
0-25-20-15-10-50
Measured vertical strain (%)
Cal
cula
ted
vert
ical
str
ain
(%)
Figure 57: Final strains reached in swelling tests (deionised water and vertical pressure of 0.5 MPa) performed with samples of test CG3 compared with the values calculated with Equation 7
4.2.9 Swelling pressure
As in the case of the swelling capacity tests, both intact and remoulded samples were used to determine the swelling pressure after TH treatment of samples from different sections along the bentonite columns. The swelling pressure was determined in standard oedometers and at laboratory temperature as explained in section 3.2.9.
The swelling pressure was measured in samples from TH tests FQ1/2, FQ1 and FQ2, stabilised and remoulded after the TH treatment and saturated with deionised water. The initial hygroscopic water content of all the samples was thus around 14 percent and they were compacted to nominal dry density 1.60 g/cm3. The swelling pressure expected under these conditions for an untreated sample of FEBEX clay is 5.8±1.5 MPa, calculated with Equation 3 (Psc). The deviation of the values measured in treated samples (Psm) with respect to this average value (Psc) are calculated as
((Psm–Psc) / Psc) x 100 [10]
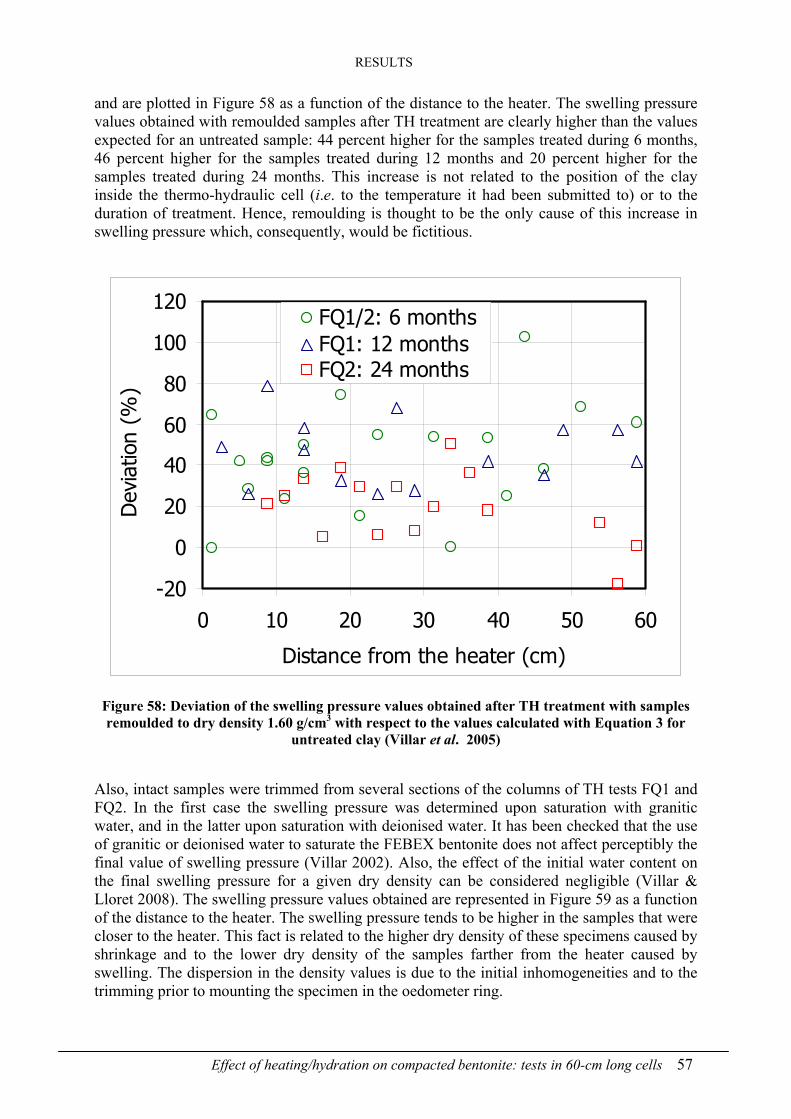
RESULTS
Effect of heating/hydration on compacted bentonite: tests in 60-cm long cells 57
and are plotted in Figure 58 as a function of the distance to the heater. The swelling pressure values obtained with remoulded samples after TH treatment are clearly higher than the values expected for an untreated sample: 44 percent higher for the samples treated during 6 months, 46 percent higher for the samples treated during 12 months and 20 percent higher for the samples treated during 24 months. This increase is not related to the position of the clay inside the thermo-hydraulic cell (i.e. to the temperature it had been submitted to) or to the duration of treatment. Hence, remoulding is thought to be the only cause of this increase in swelling pressure which, consequently, would be fictitious.
-20
0
20
40
60
80
100
120
0 10 20 30 40 50 60
Distance from the heater (cm)
Dev
iatio
n (%
)
FQ1/2: 6 monthsFQ1: 12 monthsFQ2: 24 months
Figure 58: Deviation of the swelling pressure values obtained after TH treatment with samples remoulded to dry density 1.60 g/cm3 with respect to the values calculated with Equation 3 for
untreated clay (Villar et al. 2005)
Also, intact samples were trimmed from several sections of the columns of TH tests FQ1 and FQ2. In the first case the swelling pressure was determined upon saturation with granitic water, and in the latter upon saturation with deionised water. It has been checked that the use of granitic or deionised water to saturate the FEBEX bentonite does not affect perceptibly the final value of swelling pressure (Villar 2002). Also, the effect of the initial water content on the final swelling pressure for a given dry density can be considered negligible (Villar & Lloret 2008). The swelling pressure values obtained are represented in Figure 59 as a function of the distance to the heater. The swelling pressure tends to be higher in the samples that were closer to the heater. This fact is related to the higher dry density of these specimens caused by shrinkage and to the lower dry density of the samples farther from the heater caused by swelling. The dispersion in the density values is due to the initial inhomogeneities and to the trimming prior to mounting the specimen in the oedometer ring.

RESULTS
58 Villar, Fernández, Martín, Barcala, Gómez-Espina, Rivas
0
1
2
3
4
5
6
7
8
9
10
0 10 20 30 40 50 60
Distance from the heater (cm)
Swel
ling
pres
sure
(M
Pa)
FQ1: 12 months
FQ2: 24 months 1.45
1.57
1.58
1.67
1.641.59
1.55
1.49
1.47
1.71
1.671.56
Figure 59: Swelling pressure of samples from tests FQ1 and FQ2 as a function of the distance to the heater (the dry density of each specimen is shown in g/cm3). Samples from test FQ1 were
saturated with granitic water and samples from TH test FQ2 with deionised water
The deviation with respect to the values expected for an untreated sample of the same dry density (Psm, Equation 3) has been calculated with Equation 10, and plotted as a function of the distance from the heater in Figure 60. It reveals that the disparity between the calculated and the observed values is not related to the distance to the heater or the duration of treatment, and also, that most of the values lay in the error band of Equation 3 (25%). This Equation was obtained from measurements on samples that initially had hygroscopic water content, whereas the samples subjected to TH treatment had different initial water contents, from 6 percent in samples that were closer to the heater, to 30 percent in samples closer to the hydration surface. However, the influence of the initial water content on swelling pressure is commonly considered to be negligible (Brackley 1973, Sridharan et al. 1986, Komine & Ogata 1994), and it has been proved to be actually so for the FEBEX clay in the range of water contents from 9 to 28 percent (Villar & Lloret 2008), what will justify the comparison of the values obtained in treated samples with the empirical fitting of Equation 3.
Summarising, the trend in the swelling pressure shown in Figure 59 must be associated only to the differences in the initial dry density and water content of the clay.

RESULTS
Effect of heating/hydration on compacted bentonite: tests in 60-cm long cells 59
-40
-20
0
20
40
60
80
0 10 20 30 40 50 60
Distance from the heater (cm)
Dev
iatio
n (%
)FQ1: 12 months
FQ2: 24 months
Figure 60: Deviation calculated with Equation 10 of the swelling pressure values obtained after TH treatment with respect to the values calculated with Equation 3 (Villar et al. 2005)
4.3 Geochemical modelling and analysis of test CG3
Due to its long duration, the 7.6-year test (CG3) has been the object of a detailed geochemical analysis (Fernández & Villar, unpub.).
In Figure 61 the ion concentrations measured in the aqueous extracts of the 7.6-year test have been normalised with respect to the concentration of chloride, which is a conservative ion. This normalization allows to distinguish from solute transport reactions and reactive/geochemical transport. It can be observed that there is not a 1:1 sodium:chloride concentration relationship in any position along the column, what indicates that the sodium concentration is not only controlled by advective transport, but also by the cation exchange reactions in the smectite.

RESULTS
60 Villar, Fernández, Martín, Barcala, Gómez-Espina, Rivas
0
10
20
30
40
50
60
0 1 2 3 4 5 6 7 8
moles X/moles Cl
Dis
tanc
e fr
om t
he h
eate
r (c
m)
SO4/ClHCO3/ClNa/ClK/Cl x 50Ca/Cl x 50Mg/Cl x 10
Figure 61: Distribution of the ionic concentrations normalised to Cl content along the bentonite
column for the 7.6-year test (vertical lines: reference values)
Also, a mass balance calculation of the main chemical elements has been made for test CG3 in order to check the ionic distribution in the bentonite (Figure 62). It was performed taking into account the solubilised salts of the reference sample, the cation exchange population and the inlet water concentrations. No significant changes in the mass balance for chloride have been detected at the end of the 7.6-year test, what shows that no backward diffusion of this ion out of the cell has taken place. There is an increase in potassium around 37 percent, which probably reflects the increase of this element at interlayers favoured by the dissolution of primary silicates or smectite-illite mixed layers. However, this potassium is completely exchangeable and does not collapse the smectite structure. An overall decrease in soluble sodium from 1234 to 1207 mmol (2%) is observed. However, calcium decreases around 9 percent which could imply that both sodium and calcium are related to carbonates precipitation/dissolution processes and exchange processes at interlayers. Dissolution of calcite in the hydrated areas would favour the exchange of sodium by calcium at exchange sites. The increase of sodium in the pore water would affect in turn the exchange population in less wetted areas, magnesium being replaced by sodium. The magnesium liberated can move from the hydration zone towards the heater, affecting again the exchange population in this zone. An increase in magnesium is observed in the mass balance calculations, in which an increase of about 10 percent is obtained with respect to the reference sample.

RESULTS
Effect of heating/hydration on compacted bentonite: tests in 60-cm long cells 61
0
200
400
600
800
1000
1200
1400
1600
Cl SO4 HCO3 Na K Ca Mg
Con
tent
(m
mol
es)
-20
-10
0
10
20
30
40C
hange with respect to initial content (%
)Initial + Injected
Final
% Initial
Figure 62: Mass balance calculations of main elements for the 7.6-year test (CG3)
The changes of salinity over time due to the TH processes were observed both in the aqueous extracts of all the TH tests and in the squeezed pore water of the 0.5 to 2-year tests. However, no pore water was obtained by squeezing in the 7.6-year test. For this reason, the pore water chemistry of the compacted bentonite at the end of the 7.6-year test was obtained by geochemical modelling. For the calculations, the same approach used in Fernández et al. (2004) based on that of Bradbury & Baeyens (2003) was applied.
A mass balance approach was adopted, which takes into account the buffering effects of the exchangeable cations and the amphoteric ≡SOH sites. The pH of the pore water is buffered by the surface hydroxyl sites. The main input data used for modelling have been the chloride inventory and the cation exchange population obtained in each section. The solubility limiting phases (calcite, gypsum and chalcedony) and the selectivity coefficients for exchange reactions were taken to be the same as those used in Fernández et al. (2004) and Fernández & Rivas (2005b). In this approach, the chloride concentration in the interparticle pores was calculated taking into account the total water content of each section (Figure 20), what may not be true if the anion exclusion effect in clays is considered. The results of the modelling are shown in Figure 63. The chlorides are concentrated close to the heater, increasing the ionic strength of the pore water from 0.17 M (close to hydration source) to 0.9 M. Indeed, these calculations were performed considering the total amount of water that the total porosity can theoretically fit. However, if only the effective porosity were taken into account, i.e. if the amount of water solvating cations in the interlayers were not considered and the free water were considered equivalent to the external porosity (Fernández & Rivas 2005a, b), a higher concentration of the pore water would be found close to the heater contact. Besides, it is interesting to note the change in the chemical composition of the pore water in the whole bentonite column from the top to the bottom and its comparison with the reference pore water composition of the compacted FEBEX bentonite at saturated conditions, which is Na-Cl type 0.19 M (Table II). In the TH test, the pore water changes from a Na-SO4
2- water type close to the hydration surface to a Na-Mg-Cl water type at the heater contact.

RESULTS
62 Villar, Fernández, Martín, Barcala, Gómez-Espina, Rivas
0E+00
1E-01
2E-01
3E-01
4E-01
5E-01
6E-01
7E-01
8E-01
0 10 20 30 40 50 60
Distance from the heater (cm)
Ion
conc
entr
atio
n (M
)
0.0
0.1
0.2
0.3
0.4
0.5
0.6
0.7
0.8
0.9
1.0Ionic Strength (M
)C Ca Cl KMg Na S I(M)
Figure 63: Composition of the pore water chemistry at the end of the 7.6-year test (CG3) obtained by geochemical modelling
5 DISCUSSION ON MINERALOGICAL AND GEOCHEMICAL RESULTS
Although no significant differences were found in the XRD analyses of the bentonite samples, some modifications could be detected in the SEM analyses. The higher amount of magnesium and potassium in the bentonite measured by SEM in some samples of test CG3 is in agreement with the higher magnesium and potassium contents measured in the exchange sites (Figure 48). This could indicate that, apart from the increase in magnesium at interlayers, there could be an increase in octahedral magnesium in the smectite layers over time. However, the XRD patterns do not show any evidence of the montmorillonite transforming to a trioctahedral smectite, because the d(060) basal spacing is kept at 1.50 Å (61.86 2°θ), typical of dioctahedral smectites, and the peak of trioctahedral smectites at around 1.52 Å (60.96 2°θ) does not appear (Figure 27).
Regarding the accessory minerals, bands of silica gel and silica were found close to the hydration front at 39 cm from the heater together with chlorides in the 1-year test; and at 9 cm from the heater in the 7.6 year-test (Figure 31a, Figure 32c). The origin of silica could be the dissolution of primary silicate minerals (quartz, feldspars…) in the hot zone that are transported towards cooler zones, or the dissolution of primary silicates due to the hydration process. The fact that it has been found farther from the hydration surface as the test takes longer could indicate that it has been dissolved in the wet zones and transported with the water front.

DISCUSSION ON MINERALOGICAL AND GEOCHEMICAL RESULTS
Effect of heating/hydration on compacted bentonite: tests in 60-cm long cells 63
The hydration of the bentonite produces the dissolution and dilution of the more soluble accessory minerals in the bentonite (sulphates, carbonates and chlorides). Leaching of salts, as hydration proceeds from the top of the cell, results in a decrease in ion concentration in wet areas, since they move towards lower sections. As a result, saline fronts generate due to the different mobility of the dissolved ions. The distribution pattern of these ions points to advection as the predominant process for ion movement in the bentonite due to its initial unsaturated state. In addition, in the 5 cm closest to the heater, there is also an increase in the concentration of some species (in particular chloride and sodium) irrespective of the duration of the test. This concentration is caused by the convection cells that form near the heater: vapour moves towards cooler bentonite, where it condenses and dissolves the species that in turn are carried with the liquid water in its way back towards the heater. In the longest test, this process is overcome by the advection caused by hydration.
Chloride moved with water by advection, as a conservative anion. For this reason, the maximum concentration of chloride along the bentonite column varied as a function of the duration of the test. Chloride salts have been observed by SEM at different distances from the hydration front: amorphous mineral phases with chloride impregnations at 51 cm from the heater in the 0.5-year test, Cl-K-Na-Ca crystals at 39 cm from the heater in the 1-year test, and chlorides in the sample located close to the heater (1 cm) in the 7.6-year test (Figure 32e). The main counterion that followed chloride in all the tests is sodium, decreasing close to the hydration source and increasing towards hotter zones. However, as it has been explained above, the sodium concentration is not only controlled by advective transport, but also by the cation exchange reactions in the smectite (Figure 61).
Sulphate is washed at the hydration source and moves with the hydration front. Since this ion is affected by dissolution/precipitation processes the maximum concentrations are found much closer to the hydration surface than in the case of chlorides. In the 7.6-year test, a new peak of concentration appears at 19 cm from the heater, indicating some precipitation of sulphates. Sulphates were observed by SEM concentrated at upper locations than chlorides, e.g. at 52 cm in the 0.5-year test (Figure 30b) and at 41 cm in the 1-year test. In the 7.6-year test, sulphates were found at 44 cm and 19 cm (Figure 32f,g), what is in agreement with the two peaks of sulphate measured in the aqueous extracts. According to Figure 61, it is expected that a mixture of Na and K sulphate mineral phases had also precipitated near the heater.
Close to the hydration surface there is a clear increase in bicarbonate in all the tests, correlated with an increase in pH, indicating the dissolution of carbonates (calcite). In the samples from the FEBEX in situ test the bicarbonate content was higher in the external part of the barrier, i.e. where the bentonite was more hydrated. This was explained as due to the dissolution of calcite and dolomite (Villar et al. 2004, Samper et al. 2005, 2008). The slight increase in CaX2 in the wettest bentonite can be explained by the dissolution of calcite in the hydrated zones (Figure 42 and Figure 61), since the calcium released could enter the exchange sites and even substitute the NaX, as it seems to have happened in test CG3. Also, a slight overall decrease in calcite content, more noticeable in the wettest (12 cm closest to the hydration surface) and driest (7 cm closest to the heater) bentonite, was observed by XRD in the samples from test CG3, what agrees with the increase in bicarbonate found in the aqueous extracts. In the rest of the bentonite columns, the concentration of bicarbonate is more or less constant, except at the heater contact (Figure 37). This can be associated to the precipitation of calcite at the heater contact due to water evaporation in the shortest experiments (0.5 and 1 year), and to the dissolution of carbonates in the longest experiment. Furthermore, close to the heater, the high temperature provokes CO2 degassing from liquid water, which is transported in the gas phase to colder zones where it dissolves again in the liquid water. The CO2

DISCUSSION ON MINERALOGICAL AND GEOCHEMICAL RESULTS
64 Villar, Fernández, Martín, Barcala, Gómez-Espina, Rivas
degassing and dissolution processes are very important for the bicarbonate and pH behaviour, and in turn affect the carbonate dissolution-precipitation patterns. Carbonates have been observed by SEM at 55 cm from the heater in the 0.5-year test, at 59 and 44 cm from the heater in the 1-year test; and at 44 and 24 cm from the heater in the 7.6-year test (Figure 30c, Figure 31c, Figure 32h).
The behaviour of magnesium, sodium and calcium is affected both by exchange reactions and dissolution/precipitation processes, which depend also on the duration of the tests. The increments of magnesium in the heater zone are very significant and have been observed in the aqueous extracts of all the tests (Figure 39) and in the cation exchange population of test CG3 (Figure 48). This is also reflected in the mass balance calculations performed for the longest test (Figure 61), in which an increase of about 10 percent is obtained with respect to the reference sample. The increase in magnesium in the system may be a consequence of different processes, such as: 1) precipitation of calcite close to the hottest zones –due to the decrease of its solubility with temperature–, which favours the decrease in CaX2 and the increase in MgX2; 2) dolomite dissolution enhanced by the dissolution of sulphates (Appelo and Postma 2005) and by temperature, since magnesium complexes seem more stable with temperature, both in free water and at exchange sites, what would favour their transport and exchange in hot areas; and 3) release of magnesium from interlayers to pore water in the coolest zone and transport to the hottest zone (Fernández & Villar, unpub.). The increase in MgX2 in the 20 cm closest to the heater observed in the longest test (and much faintly in the 2-year test) is related to lower contents of CaX2 and NaX. The magnesium entering the clay interlayers may come from the top part of the cell and have been transported with the water front. In thermo-hydraulic experiments performed in laboratory-scale cells up to full saturation with bentonite from the same deposit than the FEBEX bentonite (the S-2 bentonite), a decrease in sodium in the exchange complex towards the hottest areas was observed, as well as an increase in magnesium (Cuevas et al. 1997, Villar et al. 1997).
An increase in potassium in the aqueous phase has been observed at the heater contact, especially in the longest test (Figure 40, Figure 61). The high temperature seems to provoke the dissolution of primary silicate minerals (e.g. feldspars, augites, etc.). This can explain the neoformation of secondary minerals observed at the heater contact, like microcrystalline quartz (Martín Barca 2002) and feldspars (sanidine, anortite). Neoformed feldspars were observed in samples close to the heater (section 24) in the 0.5-year test (Figure 30a). Besides it is worthy to note that the smectitic phases of this bentonite are made up of a smectite-illite mixed layer (∼11% of illite layers), and some potassium can be also released from these layers. In the hydration zone, an increase in potassium is also observed in most of the tests. The increase in KX near the hydration and heating surfaces –which is more stressed over time– may be thus related to the dissolution of primary silicates (quartz, feldspars, etc.) or to the release of potassium from the illite layers in the smectitic phases of the FEBEX bentonite. Furthermore, the increase in KX in the interlayers seems to be also thermodynamically favoured by temperature.
The overall increase in the sum of exchangeable cations experienced by the more hydrated samples of test CG3 with respect to the same parameter in the untreated FEBEX bentonite was also observed after the five-year treatment of the FEBEX in situ test, where the sum of exchangeable cations increased from the 96 meq/100g of the original sample to values systematically higher than 100 meq/100g, frequently around 105 meq/100g (ENRESA 2006b).
Summarising, the hydration of the bentonite produces the dissolution and dilution of the more soluble accessory minerals in the bentonite (sulphates, carbonates and chlorides). Leaching of
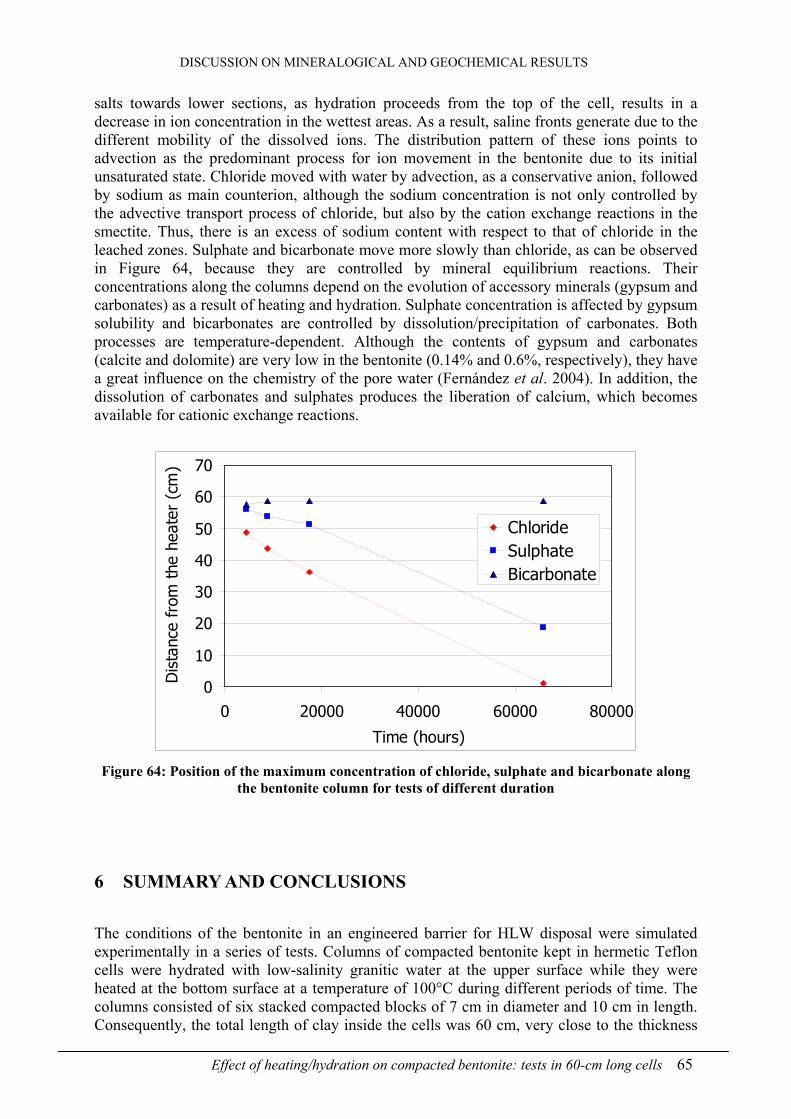
DISCUSSION ON MINERALOGICAL AND GEOCHEMICAL RESULTS
Effect of heating/hydration on compacted bentonite: tests in 60-cm long cells 65
salts towards lower sections, as hydration proceeds from the top of the cell, results in a decrease in ion concentration in the wettest areas. As a result, saline fronts generate due to the different mobility of the dissolved ions. The distribution pattern of these ions points to advection as the predominant process for ion movement in the bentonite due to its initial unsaturated state. Chloride moved with water by advection, as a conservative anion, followed by sodium as main counterion, although the sodium concentration is not only controlled by the advective transport process of chloride, but also by the cation exchange reactions in the smectite. Thus, there is an excess of sodium content with respect to that of chloride in the leached zones. Sulphate and bicarbonate move more slowly than chloride, as can be observed in Figure 64, because they are controlled by mineral equilibrium reactions. Their concentrations along the columns depend on the evolution of accessory minerals (gypsum and carbonates) as a result of heating and hydration. Sulphate concentration is affected by gypsum solubility and bicarbonates are controlled by dissolution/precipitation of carbonates. Both processes are temperature-dependent. Although the contents of gypsum and carbonates (calcite and dolomite) are very low in the bentonite (0.14% and 0.6%, respectively), they have a great influence on the chemistry of the pore water (Fernández et al. 2004). In addition, the dissolution of carbonates and sulphates produces the liberation of calcium, which becomes available for cationic exchange reactions.
0
10
20
30
40
50
60
70
0 20000 40000 60000 80000
Time (hours)
Dis
tanc
e fr
om t
he h
eate
r (c
m)
ChlorideSulphateBicarbonate
Figure 64: Position of the maximum concentration of chloride, sulphate and bicarbonate along
the bentonite column for tests of different duration
6 SUMMARY AND CONCLUSIONS
The conditions of the bentonite in an engineered barrier for HLW disposal were simulated experimentally in a series of tests. Columns of compacted bentonite kept in hermetic Teflon cells were hydrated with low-salinity granitic water at the upper surface while they were heated at the bottom surface at a temperature of 100°C during different periods of time. The columns consisted of six stacked compacted blocks of 7 cm in diameter and 10 cm in length. Consequently, the total length of clay inside the cells was 60 cm, very close to the thickness

SUMMARY AND CONCLUSIONS
66 Villar, Fernández, Martín, Barcala, Gómez-Espina, Rivas
of the bentonite barrier (65 cm) in the Spanish disposal concept for granite (ENRESA 1995). The initial average dry density of the bentonite in these tests was 1.66 g/cm3 and the water content 13.6 percent. The duration of the tests –performed in duplicate, except for the longest one– was 6, 12, 24 and 92 months. The temperatures inside the clay and the water intake were satisfactorily measured during the tests and, at the end, the cells were dismantled and the dry density and water content were determined in different positions along the blocks. Also, a complete postmortem characterisation of the bentonite –including mineralogical, geochemical and hydro-mechanical analyses– took place. The online measurements and the results of the postmortem tests performed in the bentonite after dismantling have been reported and analysed.
With respect to the online measurements and to the physical state of the bentonite at the end of the tests, the following conclusions can be drawn:
- There was a sharp temperature gradient in the vicinity of the heater. The temperatures inside the clay during the TH treatment were slightly lower as the duration of the test was longer, what is due to the increase in thermal conductivity of the clay with water content and the higher heat dissipation of the clay as it becomes wetter.
- At the end of all the tests there were important water content and dry density gradients along the bentonite columns. The increase in water content caused by hydration was linked to a reduction in dry density as a consequence of swelling, whereas the decrease of water content caused by evaporation near the heater was linked to an increase of dry density as a consequence of shrinkage.
- After six months of TH treatment, the closest 18 cm to the heater experience a desiccation that was not recovered after 24 months, hence the water content remained in this zone below the initial value, being close to 6 percent in the vicinity of the heater. After 7.6 years of testing the water content of the bentonite was lower than the initial one only in the 5 cm closest to the heater. To the naked eye no shrinkage cracks were observed in any tests, as the desiccation implied an overall increase in dry density in the zones near the heater. However, the observations at the optical microscope have shown a higher density of cracks in drier samples (Gómez-Espina 2008).
- The final average degree of saturation in the longest test (7.6 years), considering a water density of 1 g/cm3, is 92 percent, what highlights the slowness of the hydration process of compacted bentonite.
- The joints between blocks became sealed much before the water content was close to saturation.
As a consequence of heating and of the hydration profile, which evolve over time, two types of geochemical processes occurred along the bentonite columns, one of them related to hydration and the other one to heating:
- Hydration caused dilution and advective transport of chlorides and sodium, transport of sulphates controlled by gypsum solubility and dissolution of calcite. As a consequence, in the hydrated areas the exchange reactions increased first the exchangeable sodium and potassium contents at the expense of calcium and magnesium, and later increased the exchangeable calcium and potassium at the expense of magnesium and sodium. This liberated magnesium seems to have been transported towards lower (drier) parts of the bentonite.
SUMMARY AND CONCLUSIONS
Effect of heating/hydration on compacted bentonite: tests in 60-cm long cells 67
- On the other hand, the processes triggered by heating and consequently taking place in the hot areas were: anhydrite formation, water vapour and CO2 transport, local increases in salt content, dissolution of dolomite, precipitation of calcite, dissolution of silicate minerals and neoformation of others, and exchange reactions increasing the exchangeable magnesium content at the expense of sodium and calcium.
Therefore, the most significant bentonite-water interaction processes controlling the chemistry of the system are the dilution of chlorides, dissolution/precipitation of carbonates and sulphates and the cation exchange reactions in the smectite. Apart from the transport of soluble salts along the bentonite columns during the saturation of the bentonite, a modification of the average cation exchange population in the smectite has been observed, increasing the MgX2 and KX contents.
However, after 7.6-years, no significant mineralogical alteration was produced, either concerning the minerals present or the smectite characteristics. The mineralogical and geochemical characterisation of samples from the FEBEX in situ test suggested that no great modifications occurred in the bentonite during the five-year experiment (ENRESA 2006b).
For the determination of hydro-mechanical (HM) properties after thermo-hydraulic treatment, the bentonite specimens had to be trimmed to fit the ring of the permeability or oedometer cell, its dry density and water content being preserved as they were when the TH treatment ended. In this way, the specimens from different positions had different densities and water contents at the beginning of the HM determinations, what highly influences the results obtained (Villar 2001, Villar et al. 2005a). Thus, the analysis of the hydro-mechanical properties of the clay after TH treatment is technologically complicated and difficult to interpret. On the one hand, once the sample is extracted from the TH cell, it looses its stress conditions. On the other, the hydro-mechanical properties of the clay are modified by the dry density and water content, and these are different according to the position of the sample inside the cell. Hence, it is difficult to decipher if the modifications observed are caused by the TH treatment –and their related geochemical variations– or just by the changes in dry density and water content, which are merely transient. Consequently, to evaluate the variation of hydro-mechanical properties after TH treatment, it is necessary to have a complete database on the influence of density and water content on the properties to be tested. Another approach taken to evaluate the modification of HM properties by TH treatment was to remould the treated samples to standard conditions before the performance of the HM tests. However, it was shown that remoulding increases the swelling capacity and swelling pressure of the specimens (Villar 2001), and this has to be taken into account when analysing the results obtained in remoulded specimens. Nevertheless, the following conclusions concerning the evolution of HM properties have been drawn:
- The density and water content gradients condition the hydro-mechanical properties of the bentonite that are dependent on both (permeability, swelling). Hence, since the water content and density gradients evolve over time, it is expected a temporary evolution of these properties along the barrier.
- The measurements of saturated hydraulic conductivity performed after 0.5, 1 and 2 years of TH treatment revealed an increase of saturated permeability with respect to the untreated sample (but still remaining very low) and a strong dependence on dry density.
- The swelling capacity under low pressure of the treated clay is influenced by its dry density and water content, and after two and eight years of TH treatment it slightly reduced, especially in the desiccated samples. This reduction did not hinder an overall

SUMMARY AND CONCLUSIONS
68 Villar, Fernández, Martín, Barcala, Gómez-Espina, Rivas
swelling of the bentonite and the development of swelling pressures high enough to deform the Teflon walls of the cell. However, the swelling capacity of the bentonite taken upon dismantling of the FEBEX in situ test did not change irreversibly after five years of being subjected to repository conditions (ENRESA 2006b).
- The swelling pressure of the treated clay is influenced by its dry density, and after two years of TH treatment stayed in values similar to those of the untreated clay.
- The external specific surface area decreased over time, especially towards the heater. An overall decrease of external specific surface area –particularly clear towards the heater– was also observed in the samples from the FEBEX in situ test, dismantled after five years of operation (Villar et al. 2004, ENRESA 2006b). In an investigation carried out in thermo-hydraulic cells with a bentonite from the same deposit than the FEBEX bentonite (the S-2 bentonite), the reduction of external specific surface area towards hotter areas was attributed to the clustering of montmorillonite particles (Villar et al. 1997). This clustering could be caused by the displacement of interlayer water towards macropores that has been claimed to be triggered by temperature (e.g. Villar & Lloret 2004).
Finally, it could be said that the modifications observed in the chemical and mineralogical compositions of the bentonite cannot be clearly correlated with any important variation on the macroscopic thermo-hydro-mechanical properties. A similar conclusion was drawn from the analyses performed with samples of the FEBEX in situ test (ENRESA 2006b). The fact that the swelling capacity decreased slightly towards the heater could be attributed to the increase in salinity in the longest test (CG3), in which the highest salinity was found near the heater, but not in the other tests.
Tests like those presented in this work, in which the expansive clay and the THM conditions are very similar to the ones in large-scale tests, are very useful for a better understanding of the behaviour of expansive clays under controlled thermal and hydraulic gradients similar to those expected in a HLW repository. This kind of experiments is also very useful for the validation of mathematical formulation and computer codes.
7 ACKNOWLEDGEMENTS
The tests presented started and were carried out in the framework of the FEBEX Project, financed by ENRESA (Spanish National Agency for Waste Management) and the European Commission (EC Contracts FI4W-CT95-006 and FIKW-CT-2000-00016). Test CG3 was finished and analysed in the framework of the NF-PRO Project, financed by ENRESA and the European Commission (EC Contract FI6W-CT-2003-02389). J. Cuevas supported the design and interpretation of the thermo-hydraulic tests. R. Campos, A. Pelayo, J. Almendrote, A. Melón, A.E. González and J. Aroz have performed the laboratory work. The XRD measurements were performed at CIEMAT, except those of test CG3, that were performed at the Department of Crystallography and Mineralogy of the Universidad Complutense de Madrid with the support of F.J. Luque and J.F. Barrenechea. The XRD tests on unaltered samples were performed at CIEMAT by L. Gutiérrez. M. Marsal and J. M. Manero, from the Laboratory of Electronic Microscopy of the UPC (Barcelona, Spain), assisted in the SEM analysis of the samples. David Arcos and Cristina Domènech from AMPHOS XXI Consulting S.L. (formerly ENVIROS, Barcelona, Spain) are thanked for their useful comments on the interpretation of the geochemical results of test CG3.

REFERENCES
Effect of heating/hydration on compacted bentonite: tests in 60-cm long cells 69
8 REFERENCES
Appelo, C.A.J., Posma, D. 2005. Geochemistry, groundwater and pollution. A.A. Balkema. Netherlands. 649 pp. 2nd edition.
Barahona, E. 1974. Arcillas de ladrillería de la provincia de Granada. Evolución de algunos ensayos de materias primas. Ph. D. Thesis. Universidad de Granada.
Brackley, I.J.A. 1973. Swell pressure and free swell in a compacted clay. Proc. 3rd Int. Conf. Expansive Soils, Haifa. Vol. 1, 169-176.
Bradbury, M.H., Baeyens, B. 1998. A physico-chemical characterisation and geochemical modelling approach for determining porewater chemistries in argillaceous rocks. Geochim. Cosmochim. Acta 62, 783-795
Bradbury, M.H., Baeyens, B. 2003. Porewater chemistry in compacted resaturated MX-80 bentonite. J. Contam. Hydrol. 61, 329-338.
Cuevas, J., Villar, M.V., Fernández, A.M., Gómez, P., Martín, P.L. 1997. Pore waters extracted from compacted bentonite subjected to simultaneous heating and hydration. Appl. Geochem. 12, 473-481.
Cuevas, J.; Villar, M.V.; Martín,M.; Cobeña, J.C., Leguey, S. 2002. Thermo-hydraulic gradients on bentonite: distribution of soluble salts, microstructure and modification of the hydraulic and mechanical behaviour. Appl. Clay Sci. 22 (1-2), 25-38.
ENRESA 1995. Almacenamiento geológico profundo de residuos radiactivos de alta actividad (AGP). Diseños conceptuales genéricos. Publicación Técnica ENRESA 11/95. 105 pp. Madrid.
ENRESA 1998. FEBEX. Bentonite: origin, properties and fabrication of blocks. Publicación Técnica ENRESA 4/98. 146 pp. Madrid.
ENRESA 2000. FEBEX Project. Full-scale engineered barriers experiment for a deep geological repository for high level radioactive waste in crystalline host rock. Final Report. Publicación Técnica ENRESA 1/2000. 354 pp. Madrid.
ENRESA 2006a. Full-scale Engineered Barriers Experiment. Updated Final Report 1994-2004. Publicación Técnica ENRESA 05-0/2006. 590 pp. Madrid.
ENRESA, 2006b. FEBEX Project Final report. Post-mortem bentonite analysis. Publicación Técnica ENRESA 05-1/2006. 183 pp. Madrid.
Entwisle, D.C., Reeder, S. 1993. New apparatus for pore fluid extraction from mudrocks for geochemical analysis. In: Manning, D.A.C.; Hall, P.L. & Hughes, C.R. (Eds.): Geochemistry of clay-pore fluid interactions. pp 365-388. Chapman & Hall.
Fernández, A.M. 2004. Caracterización y modelización del agua intersticial en materiales arcillosos. Estudio de la bentonita de Cortijo de Archidona. Colección Documentos Ciemat. Editorial CIEMAT. 505 pp. Madrid.

REFERENCES
70 Villar, Fernández, Martín, Barcala, Gómez-Espina, Rivas
Fernández, A. Mª, Rivas, P. 2005a. Analysis and distribution of waters in the compacted FEBEX bentonite: Pore water chemistry and adsorbed water properties. In: Alonso, E.E., Ledesma, A. (Eds.), Advances in understanding Engineered Clay Barriers. A.A. Balkema Publishers, Leiden, pp. 257-275.
Fernández, A. Mª, Rivas, P. 2005b. Pore water chemistry of saturated febex bentonite compacted at different densities. In: Alonso, E.E., Ledesma, A. (Eds.), Advances in understanding Engineered Clay Barriers. A.A. Balkema Publishers, Leiden, pp. 505-514.
Fernández, A.Mª, Villar, M.V. unpub. Geochemical behaviour of a bentonite barrier: results up to 8 years of thermo-hydraulic treatment in the laboratory. Submitted to Applied Geochemistry.
Fernández, A.M., Cuevas, J., Rivas, P. 2001. Pore water chemistry of the FEBEX bentonite. Mat. Res. Soc. Symp. Proc. 663, 573-588.
Fernández, A.Mª., Bath, A., Waber, H.N., Oyama, T., 2003. Annex 2: Water Sampling by Squeezing Drillcores. In: Pearson F.J., Arcos, D., Bath, A., Boisson, J. Y., Fernández, A.Mª, Gäbler, H-E, Gaucher, E., Gautschi, A., Griffault, L., Hernán, P., Waber, H.N., (Eds.), Geochemistry of Water in the Opalinus Clay Formation at the Mont Terri Rock Laboratory. FOWG Nº 5, 171-199.
Fernández, A.M.; Baeyens, B.; Bradbury, M., Rivas, P. 2004. Analysis of the pore water chemical composition of a Spanish compacted bentonite used in an engineered barrier. Physics and Chemistry of the Earth 29(1), 105-118.
Gómez Espina, R. 2008. Caracterización de bentonitas utilizadas en ensayos para almacén de materiales radiactivos. Diploma de Estudios Avanzados. Universidad Complutense de Madrid.
Kloprogge, J.T. 2005. The application of vibrational spectroscopy to clay minerals and layered double hydroxides. CMS Workshop Lectures 13. The Clay Minerals Society. 285 pp.
Komine, H., Ogata, N. 1994. Experimental study on swelling characteristics of compacted bentonite. Can. Geotech. J. 31, 478-490.
Lloret, A.; Villar M.V., Pintado X. 2002. Ensayos THM: Informe de síntesis. Internal Report CIEMAT/DIAE/54520/1/02. FEBEX Report 70-UPC-M-0-04. 98 pp. Barcelona.
Lloret, A.; Romero, E., Villar, M.V. 2004. FEBEX II Project Final report on thermo-hydro-mechanical laboratory tests. Publicación Técnica ENRESA 10/04. 180 pp. Madrid.
Martín Barca, M. 2002. Procesos geoquímicos y modificaciones texturales en bentonita FEBEX compactada sometida a un gradiente termohidráulico. Ph.D. Thesis. Universidad Autónoma de Madrid. 293 pp.
Missana T., Fernández, A.M., García-Gutiérrez, M., Mingarro, M., Rivas, P., Caballero, E., Huertas, F.J., García-Palma, S., Jiménez De Cisneros, C., Linares, J., Rozalén, M.L., Baeyens, B., Bradbury, M.H., Muurinen, A., Cormenzana, J.L. 2004. FEBEX II Project: THG Laboratory experiments. Publicación Técnica ENRESA 09/2004. 137 pp. Madrid.

REFERENCES
Effect of heating/hydration on compacted bentonite: tests in 60-cm long cells 71
Peters, C., Yang, Y.C., Higgins, J.D., Burger, P.A. 1992. A preliminary study of the chemistry of pore water extracted from tuff by one-dimensional compression. In: Hharaka, Y.K., Maest, A.S. (Eds.), Water-Rock Interaction, Balkema Publishers, pp. 741-745.
Pearson, F.-J., Arcos, D., Bath, A, Boisson, J.-Y., Fernández, A.M., Gäbler, H.-E., Gaucher, E., Gautschi, A., Griffault, L., Hernán, P., Waber, H.-N. 2003. Geochemistry of water in the Opalinus Clay Formation of the Mont Terri Rock Laboratory. Swiss Federal Office for Water and Geology Series 5. 319 pp.
Pintado X.; Ledesma, A., Lloret, A. 2002. Backanalysis of thermohydraulic bentonite properties from laboratory tests. Eng. Geol. 64, 91-115.
Samper, J., Zhen, L., Montenegro, L., Vazquez, A., Fernández, A.M., Rivas, P. 2005. Testing coupled thermo-hydro-geochemical models with geochemical data from FEBEX in situ test. In: Alonso & Ledesma (Eds.) Advances in Understanding Engineered Clay Barriers. Taylor & Francis Group. 565-576.
Samper J., Zheng, L., Montenegro, L., Fernández, A.M., Rivas, P. 2008. Coupled thermo-hydro-chemical models of compacted bentonite after FEBEX in situ test. Appl. Geochem. 23(5), 1186-1201.
Sánchez, M. 2004. Thermo-hydro-mechanical coupled analysis in low permeability media. PhD Thesis. Universitat Politècnica de Catalunya (UPC). 281 pp. Barcelona.
Sawhney, B. L. 1970. Potassium and cesium ion selectivity in relation to clay mineral microstructure. Clays & Clay Minerals 18, 47-52.
Sridharan, A., Rao, A.S., Sivapullaiah, P.V. 1986. Swelling pressure of clays. Geotech. Test. J. 9, 24-33.
Schultz, L.G. 1964. Quantitative interpretation of mineralogical composition from X-ray and chemical data for the Pierre Shale. Geological Survey of U.S.A. Professional Paper 591-C. C1-C31.
Thomas, G.W. 1962. Exchange cations. In: Methods of Soil Análisis, Part 2. Chemical and Microbiological Properties. Agronomy Monograph 9 (2nd edition). ASA-SSSA, 677. Madison, pp. 159-165.
UNE 7045(1952): Determinación de la porosidad de un terreno.
Villar, M.V. 2000. Caracterización termo-hidro-mecánica de una bentonita de Cabo de Gata. Ph.D. Thesis. Universidad Complutense de Madrid. 396 pp. Madrid.
Villar, M.V. 2001. Ensayos termohidráulicos en celdas grandes: Propiedades hidro-mecánicas. Informe FEBEX 70-IMA-L-0-76 rev. 0. Marzo 2001. 65 pp.
Villar, M.V. 2002. Thermo-hydro-mechanical characterisation of a bentonite from Cabo de Gata. A study applied to the use of bentonite as sealing material in high level radioactive waste repositories. Publicación Técnica ENRESA 01/2002. 258 pp. Madrid.
Villar, M.V., Lloret, A. 2004. Influence of temperature on the hydro-mechanical behaviour of a compacted bentonite. Appl.Clay Sci. 26, 337-350.

REFERENCES
72 Villar, Fernández, Martín, Barcala, Gómez-Espina, Rivas
Villar, M.V., Lloret, A. 2008. Influence of dry density and water content on the swelling of a compacted bentonite. Appl. Clay Sci. 39, 38-49.
Villar, M.V.; Cuevas, J., Martin, P.L. 1996. Effects of heat/water flow interaction on compacted bentonite. Preliminary results. Eng. Geol. 41, 257-267.
Villar, M.V., Cuevas, J., Fernández, A.M. 1997. Caracterización geoquímica de bentonita compactada: efectos producidos por flujo termohidráulico. Internal Report FEBEX 70-IMA-M-0-2. CIEMAT/IMA/54A15/6/97. Madrid. 51 pp.
Villar, M.V., Fernández, A.M., Rivas, P., Lloret, A., Daucausse, D., Montarges-Pelletier, E., Devineau, K. , Villieras, F. , Hynková, E. , Cechova, Z. , Montenegro, L. , Samper, J. , Zheng, L., Robinet, J.-C., Muurinen, A., Weber, H.P., Börgesson, L., Sandén, T. 2004. Task 141: Postmortem bentonite analysis. EC Contract FIKW-CT-2000-00016, Deliverable D11. FEBEX Technical Report 70-IMA-M-6-7 v0. CIEMAT. 159 pp. Madrid.
Villar, M.V., Martín, P.L. & Barcala, J.M. 2005a. Modification of physical, mechanical and hydraulic properties of bentonite by thermo-hydraulic gradients. Eng. Geol. 81, 284-297.
Villar, M.V., García-Siñeriz, J.L., Bárcena, I., Lloret, A. 2005b. State of the bentonite barrier after five years operation of an in situ test simulating a high level radioactive waste repository. Eng. Geol. 80 (3-4),175-198.
Villar, M.V., Fernández, A.M., Gómez-Espina, R. 2006. NF-PRO Project Deliverable 2.2.7-3.2.10. Internal Report CIEMAT/DMA/M2143/6/06. Madrid, 42 pp.
Villar, M.V., Fernández, A.M., Gómez, R., Barrenechea, J.F., Luque, F.J., Martín, P.L., Barcala, J.M. 2007. State of a bentonite barrier after 8 years of heating and hydration in the laboratory. In: D.S. Dunn, C. Poinssot, B. Begg (eds.): Scientific Basis for Nuclear Waste Management XXX. Mater. Res. Soc. Symp. Proc. 985, 0985-NN11-19. Materials Research Society, Warrendale, PA.

Effect of heating/hydration on compacted bentonite: tests in 60-cm long cells
ANNEX:
TABLES OF DATA


ANNEX
Effect of heating/hydration on compacted bentonite: tests in 60-cm long cells A.1
Table A. I: Water content (w), dry density (ρd) and degree of saturation (Sr) for each sample of the column of test FQ1/2
Section Test a y b (cm) x c (cm) w (%) ρd (g/cm3) Sr (%) w d (%)
1 58.8 1.2 32.2 1.42 96 15.2 2 56.3 1.2 27.6 1.47 89 16.9 2 h 56.3 27.1 1.49 90 3 53.8 1.2 24.8 1.48 81 4 51.3 1.2 22.2 1.49 74 15.5 4 51.3 3.5 21.7 1.52 75 4 51.3 5.8 21.9 1.48 72 5 48.8 1.2 20.9 1.55 76 5 48.8 3.5 20.9 1.53 74 5 48.8 5.8 20.9 1.55 76 5 h 48.8 21.5 1.63 88 6 p 46.3 22.8 1.43 69 17.5 7 43.8 3.5 18.5 1.56 68 17.6 8 41.3 1.2 18.0 1.52 63 16.2 8 41.3 3.5 17.8 1.53 63 8 41.3 5.8 18.0 1.52 63 9 38.8 1.2 16.6 1.57 62 15.9 9 h 38.8 16.7 1.60 66 10 36.3 3.5 16.1 1.60 63 15.2 10 h 36.3 15.6 1.76 79 11 p 33.8 17.1 1.61 68 14.2 12 31.3 1.2 19.0 1.56 70 16.0 12 31.3 3.5 15.9 1.59 61 12 31.3 5.8 16.1 1.56 59 13 28.8 1.2 16.0 1.61 64 14.8 13 h 28.8 16.1 1.63 66 14 26.3 1.2 16.3 1.59 63 15.5 14 26.3 3.5 16.7 1.57 63 14 26.3 5.8 16.3 1.59 63 15 p 23.8 15.6 1.68 69 16.8 16 21.3 1.2 16.5 1.52 57 16.3 16 21.3 3.5 15.6 1.56 58

ANNEX
A.2 Villar, Fernández, Martín, Barcala, Gómez-Espina, Rivas
Section Test a y b (cm) x c (cm) w (%) ρd (g/cm3) Sr (%) w d (%)
16 21.3 5.8 16.5 1.52 57 17 18.8 3.5 15.2 1.63 63 14.7 17 h 18.8 15.6 1.62 63 18 16.3 3.5 14.9 1.62 60 15.6 19 p 13.8 15.0 1.63 62 14.8 20 11.3 1.2 13.4 1.59 52 14.7 20 11.3 3.5 13.0 1.60 51 20 11.3 5.8 13.4 1.59 52 21 p 8.8 12.1 1.67 53 14.9
22-23 5.0 3.5 10.4 1.65 44 14.4 24 1.3 3.5 5.7 13.0 24 h 1.3 6.2 1.69 28
a Samples “h” correspond to samples used for swelling tests and samples “p” to samples used for permeability tests after the TH treatment; b Distance to the heater; c Distance to the bentonite column axis; d Water content after stabilisation at laboratory conditions, it does not correspond to a particular x coordinate
Table A. II: Water content (w), dry density (ρd) and degree of saturation (Sr) for each sample of the column of test HI1/2
Section y a (cm) w (%) ρd (g/cm3) Sr (%)
1-2 57.5 30.6 1.46 97 3-4 52.5 25.3 1.52 88 5 48.8 21.7 1.53 77 6 46.3 20.2 1.55 74 7 43.8 20.4 1.55 74 8 41.3 19.3 1.53 68 9 38.9 17.6 1.60 69 10 36.3 16.8 1.59 65 11 33.8 16.4 1.59 63 12 31.3 17.6 1.54 63 13 28.8 16.2 1.62 66 14 26.3 16.4 1.61 65 15 23.8 15.9 1.59 61 16 21.3 16.2 1.57 61 18 16.3 15.1 1.62 61 19 13.8 13.9 1.61 55 20 11.3 13.7 1.60 54

ANNEX
Effect of heating/hydration on compacted bentonite: tests in 60-cm long cells A.3
Section y a (cm) w (%) ρd (g/cm3) Sr (%)
21 8.8 12.7 1.65 54 22 6.3 11.8 1.64 49 23 3.8 9.9 1.64 41 24 1.3 6.7 1.67 29
a Distance to the heater
Table A. III: Water content (w), dry density (ρd) and degree of saturation (Sr) for each sample of the column of test FQ1
Section Test a y b (cm) x c (cm) w (%) ρd (g/cm3) Sr (%) w d (%)
1 p 58.8 33.0 1.40 96 13.3 2 56.3 1.2 29.9 1.48 98 15.1 3 53.8 1.2 28.5 1.49 95 13.9 3 53.8 3.5 27.8 1.51 95 3 53.8 5.8 27.5 1.49 91 4 51.3 1.2 25.5 1.52 89 4 51.3 3.5 25.8 1.50 87 4 51.3 5.8 26.0 5 48.8 1.2 23.4 1.52 81 16.0 5 h 48.8 20.7 1.50 70 6 46.3 1.2 22.9 13.1 6 p 46.3 23.4 1.47 76 7 43.8 1.2 21.1 1.49 70 7 43.8 3.5 21.1 1.54 76 8 41.3 1.2 20.9 1.49 69 13.6 8 41.3 3.5 20.2 1.52 70 8 41.3 5.8 21.3 1.49 71 9 p 38.8 1.66 15.5 10 36.3 1.2 21.7 1.54 78 10 36.3 3.5 19.2 1.55 70 11 33.8 3.5 12 31.3 1.2 18.1 1.53 64 12 31.3 3.5 16.1 1.70 74 13 28.8 1.2 17.8 1.59 69 12.2 13 28.8 3.5 17.5 1.57 66 13 28.8 5.8 17.9 1.57 67

ANNEX
A.4 Villar, Fernández, Martín, Barcala, Gómez-Espina, Rivas
Section Test a y b (cm) x c (cm) w (%) ρd (g/cm3) Sr (%) w d (%)
14 p 26.3 1.40 14.4 15 23.8 1.2 17.2 1.53 61 12.4 16 21.3 1.2 17.6 1.56 65 16 21.3 3.5 15.7 1.59 61 16 21.3 5.8 16.2 1.55 59 17 18.8 3.5 15.5 1.65 66 12.6 17 h 18.8 16.0 1.58 61 18 16.3 1.2 15.0 1.64 63 18 16.3 3.5 14.8 1.61 59 18 16.3 5.8 14.7 1.62 60 19 p 13.8 12.4 1.70 57 13.9 20 11.3 1.2 14.3 1.60 56 20 11.3 3.5 12.9 1.61 51 21 8.8 1.2 12.2 1.67 53 14.7 21 p 8.8 12.0 1.76 61 22 6.3 3.5 10.8 1.66 47 13.4 22 h 6.3 10.0 1.69 45 23 3.8 3.5 8.1 1.66 35
23-24 p 2.5 8.0 1.71 37 12.7 a Samples “h” correspond to samples used for swelling tests and samples “p” to samples used for permeability tests after the TH treatment; b Distance to the heater; c Distance to the bentonite column axis; d Water content after stabilisation at laboratory conditions, it does not correspond to a particular x coordinate
Table A. IV: Water content (w), dry density (ρd) and degree of saturation (Sr) for each sample of the column of test HI1a
Section y b (cm) w (%) ρd (g/cm3) Sr (%)
1 58.8 33.0 1.40 96 2 56.3 29.9 1.48 98 3 53.8 28.0 1.50 95 4 51.3 25.5 1.51 87 5 48.8 23.4 1.52 81 6 46.3 22.9 1.47 74 7 43.8 21.6 1.55 79 8 41.3 20.7 1.53 73 9 38.8 20.4 1.56 75 10 36.3 19.4 1.58 74

ANNEX
Effect of heating/hydration on compacted bentonite: tests in 60-cm long cells A.5
Section y b (cm) w (%) ρd (g/cm3) Sr (%)
11 33.8 18.8 1.54 67 12 31.3 18.0 1.56 67 13 28.8 17.5 1.59 68 14 26.3 17.2 1.59 67 15 23.8 16.1 1.60 63 16 21.3 16.6 1.58 63 17 18.8 14.9 1.64 62 18 16.3 13.3 1.63 55 19 13.8 12.7 1.63 52 20 11.3 12.2 1.63 50 21 8.8 11.1 1.72 53 22 6.3 10.2 1.68 45 23 3.8 8.4 1.69 38 24 1.3 4.3 1.72 20
a The samples were dried only for 18 h, thus the water contents computed may be lower than actual and the dry densities higher; b Distance to the heater
Table A. V: Water content (w), dry density (ρd) and degree of saturation (Sr) for each sample of the column of test FQ2
Section Test a y b (cm) x c (cm) w (%) ρd (g/cm3) Sr (%) w d (%) 1 58.8 1.2 33.2 1.42 99 16.3 1 p 58.8 33.0 1.41 97 2 56.3 1.2 30.4 1.46 97 12.3 2 56.3 3.5 31.1 1.46 99 2 h 56.3 29.7 1.46 94 3 53.8 1.2 30.4 1.47 98 14.8 3 h 53.8 27.2 1.51 93 4 51.3 1.2 29.4 1.46 93 16.7 4 51.3 3.5 28.9 1.46 92 4 51.3 5.8 28.2 1.48 92 5 49.8 1.2 26.7 1.49 89 5 49.8 3.5 25.8 1.50 87 5 h 49.8 24.0 1.56 89 6 46.3 1.2 25.4 1.50 86 16.7 6 p 46.3 26.5 1.46 84 7 43.8 1.2 24.5 1.50 83

ANNEX
A.6 Villar, Fernández, Martín, Barcala, Gómez-Espina, Rivas
Section Test a y b (cm) x c (cm) w (%) ρd (g/cm3) Sr (%) w d (%) 7 43.8 3.5 23.7 1.52 82 7 43.8 5.8 23.9 1.51 82 8 41.3 1.2 22.9 1.47 74 8 41.3 3.5 22.8 1.51 78 8 41.3 5.8 22.5 1.47 73 9 38.8 1.2 21.7 1.54 78 15.7 9 38.8 3.5 21.6 1.50 73 10 36.3 1.2 20.2 1.53 71 15.3 10 p 36.3 22.7 1.59 88 11 33.8 1.2 19.3 1.51 66 16.6 11 h 33.8 18.6 1.60 73 12 31.3 1.2 19.6 1.52 68 16.2 12 31.3 3.5 19.6 1.51 67 12 31.3 5.8 19.1 1.50 64 13 28.8 1.2 18.9 1.56 70 15.6 13 h 28.8 17.0 1.66 73 14 26.3 1.2 17.5 1.57 66 16.1 14 26.3 3.5 18.1 1.57 68 15 23.8 1.2 16.9 1.55 62 15.6 15 h 23.8 17.6 1.57 66 16 h 21.3 21.5 1.58 82 11.6 17 18.8 1.2 15.9 1.62 64 15.2 17 18.8 3.5 14.4 1.64 60 18 16.3 1.2 13.7 1.65 58 14.0 18 h 16.3 12.5 1.60 49 19 13.8 1.2 14.1 1.65 60 15.6 19 13.8 3.5 13.6 1.64 57 20 11.3 1.2 12.5 1.66 54 16.0 20 11.3 3.5 12.6 1.65 53 21 8.8 1.2 11.9 1.69 54 14.9 21 8.8 3.5 12.2 1.66 53 22 6.3 1.2 11.1 1.64 46 24 1.3 1.2 5.8 1.67 25 10.6
a Samples “h” correspond to samples used for swelling tests and samples “p” to samples used for permeability tests after the TH treatment; b Distance to the heater; c Distance to the bentonite column axis; d Water content after stabilisation at laboratory conditions, it does not correspond to a particular x coordinate

ANNEX
Effect of heating/hydration on compacted bentonite: tests in 60-cm long cells A.7
Table A. VI: Water content (w), dry density (ρd) and degree of saturation (Sr) for each sample of the column of test HI2
Section y a (cm) w (%) ρd (g/cm3) Sr (%)
1-2 57.5 31.8 1.44 98 3-4 52.5 29.9 1.47 96 5-6 48.5 26.1 1.5 88 7 43.8 24.1 1.49 80
8-9 40.0 22.3 1.51 76 10 36.3 21.4 1.53 76 11 33.8 20.3 1.52 71 12 31.3 20.3 1.48 66 13 28.8 20.2 1.54 72 14 26.3 19.4 1.51 66 15 23.8 18.1 1.52 63 16 21.3 17.4 1.53 61 17 18.8 16.3 1.62 66 18 16.3 15.3 1.61 61 19 13.8 14.1 1.59 55 20 11.3 12.1 1.59 47 21 8.8 12.1 1.67 53 22 6.3 10.9 1.63 45 23 3.8 9.1 1.64 38 24 1.3 5.3 1.64 22
a Distance to the heater
Table A. VII: Average values of water content (w), dry density (ρd) and degree of saturation (Sr) for each section of the column of test CG3
Section Position a (cm) ρd (g/cm3) w (%) Sr (%) 1 58.8 1.41 34.6 102 2 56.3 1.42 33.7 100 3 53.8 1.45 32.5 101 4 51.3 1.42 32.9 98 5 48.8 1.45 31.5 99 6 46.3 1.42 32.0 96 7 43.8 1.46 30.6 97 8 41.3 1.44 31.0 95 9 38.8 1.48 28.9 95

ANNEX
A.8 Villar, Fernández, Martín, Barcala, Gómez-Espina, Rivas
Section Position a (cm) ρd (g/cm3) w (%) Sr (%) 10 36.3 1.47 28.8 93 11 33.8 1.49 27.3 90 12 31.3 1.46 27.6 88 13 28.8 1.51 26.0 89 14 26.3 1.52 25.1 87 15 23.8 1.51 24.2 84 16 21.3 1.50 23.7 79 17 18.8 1.55 21.6 78 18 16.3 1.58 20.3 77 19 13.8 1.55 19.0 69 20 11.3 1.54 17.3 62 21 8.8 1.61 16.1 65 22 6.3 1.61 14.1 56 23 3.8 12.6 24 1.3 1.60 9.3
Average 1.5 25.0 86 a Distance from the heater
Table A. VIII: Results of XRD on unaltered samples of test CG3
Section Position a (cm) d(001) (Å) FWHM b (°2θ)
Intensity (cps) w c (%)
1 58.8 16.83 1.32 320 28.0 2 56.3 18.41 1.40 1946 30.5 3 53.8 17.45 1.07 114 28.5 4 51.3 15.67 1.32 143 27.9 5 48.8 16.34 1.44 56 27.8 6 46.3 7 43.8 15.80 0.86 177 24.6 8 41.3 15.99 0.88 35 24.7 9 38.8 15.87 1.14 191 24.5
10 36.3 16.26 1.21 63 19.1 11 33.8 16.39 1.31 762 24.8 12 31.3 21.6 13 28.8 15.61 1.08 75 17.2 14 26.3 15.19 0.85 193 18.6

ANNEX
Effect of heating/hydration on compacted bentonite: tests in 60-cm long cells A.9
Section Position a (cm) d(001) (Å) FWHM b (°2θ)
Intensity (cps) w c (%)
15 23.8 14.42 1.21 61 20.3 16 21.3 15.73 1.45 258 17 18.8 15.23 1.21 205 18.5 18 16.3 15.66 1.23 234 18.8 19 13.8 15.29 1.00 27 16.2 20 11.3 14.88 1.26 66 15.7 21 8.8 15.14 68.38 34 16.1 22 6.3 23 3.8 24 1.3 14.11 2.25 90 9.8
a Distance from heater; b Full width at half maximum; c After XRD
Table A. IX: BET surface area of samples from test CG3
Section Position a (cm) Surface area b (m2/g)FEBEX 52
1 58.8 42 2 56.3 3 53.8 47 4 51.3 5 48.8 43 6 46.3 7 43.8 51 8 41.3 52 9 38.8 40 10 36.3 11 33.8 33 12 31.3 50 13 28.8 35 14 26.3 52 15 23.8 16 21.3 17 18.8 29 18 16.3 19 13.8 39 20 11.3 37

ANNEX
A.10 Villar, Fernández, Martín, Barcala, Gómez-Espina, Rivas
Section Position a (cm) Surface area b (m2/g)21 8.8 22 6.3 28 23 3.8 24 1.3
a Distance from heater; b Average of 2 or 3 determinations
Table A. X: Mineralogical analysis of the powder samples from tests HI obtained by XRD
Test Section Position a (cm) Smectite Quartz Calcite Plagioclase K-feldspar
HI1/2 b 24 0.0 91 1 4 2 2 HI1 b,c 1 60.0 93 1 3 1 HI1 b 1 60.0 94 1 3 2 HI1 b 1-2 57.5 93 1 4 1 1 HI1 b 3-4 52.5 91 2 5 2 HI1 b,d 24 0.0 89 2 6 1 HI1 b,c 24 0.0 89 1 5 2 2 HI1 b,d 24 0.0 94 2 2 1 HI2 b 1 60.0 93 2 3 2 HI2 b 8-9 40.0 90 2 6 2 HI2 b 24 0.0 95 2 1 2 HI2 b 24 0.0 94 2 1 3
a Distance from heater; b Traces of cristobalite; c Dolomite (1-2%); d NaClK (1-2%)
Table A. XI: Mineralogical analysis of the powder samples from test CG3 obtained by XRD
Section Position a (cm) Smectite Quartz Calcite Feldspars FEBEX 95 1.3 2.0 1.8
1 58.8 97 0.7 0.6 1.4 2 56.3 97 1.1 0.8 1.1 3 53.8 97 1.0 0.7 1.3 4 51.3 97 1.1 0.7 1.4 5 48.8 97 1.0 0.5 1.3 6 46.3 97 0.6 0.6 1.7 7 43.8 97 1.1 0.7 1.4 8 41.3 96 1.0 1.0 1.5 9 38.8 95 1.4 1.3 1.9 10 36.3 97 0.9 0.5 1.9

ANNEX
Effect of heating/hydration on compacted bentonite: tests in 60-cm long cells A.11
Section Position a (cm) Smectite Quartz Calcite Feldspars 11 33.8 95 1.5 1.0 2.5 12 31.3 97 0.9 0.8 1.7 13 28.8 96 1.0 1.5 1.8 14 26.3 96 1.0 1.0 1.8 15 23.8 96 1.1 0.8 1.6 16 21.3 94 1.7 1.4 3.0 17 18.8 97 0.8 0.9 1.3 18 16.3 97 1.1 0.9 1.3 19 13.8 97 1.0 0.7 1.5 20 11.3 98 0.6 0.4 1.4 21 8.8 93 1.8 1.3 3.5 22 6.3 96 1.0 0.7 1.9 23 3.8 97 1.0 0.7 1.3 24 1.3 97 0.9 0.6 1.2
Heater contact 0 97 1.1 0.8 1.5 a Distance from heater
Table A. XII: Analysis of the 1:4 solid/water aqueous extracts of the samples from test FQ1/2. The concentration of ions is given in mg/L
Section Position a (cm) pH EC25°C
(µS/cm)Cl- SO4
2- HCO3- Na+ K+ Ca2+ Mg2
1 59.0 7.7 615 46 48 183 122 5.1 5.2 5.6 1-2 57.5 7.9 642 43 86 201 129 4.7 5.2 5.3 2 56.3 7.9 972 64 307 110 209 3.1 3.6 4.4 4 51.3 8.0 1124 184 221 134 239 3.9 4.0 6.6 5 48.8 8.0 1350 284 192 128 292 3.9 5.2 5.3 8 41.3 8.1 1204 156 288 140 257 4.7 5.2 5.6 10 36.3 8.1 1169 142 288 153 248 4.3 5.2 6.3 12 31.3 8.1 1125 149 326 153 239 5.9 5.6 5.1 14 26.3 7.9 1181 163 326 153 251 6.6 5.2 5.8 16 21.3 8.0 1144 138 250 153 246 3.9 4.8 4.9 18 16.3 8.1 1292 156 298 146 278 4.7 4.8 5.6
21-22 11.3 7.8 1192 181 307 134 255 4.7 4.8 5.6 22-23 5.0 8.0 1321 191 298 146 278 5.9 6.8 7.5 23-24 3.3 8.1 1260 174 317 146 267 5.5 6.0 6.8

ANNEX
A.12 Villar, Fernández, Martín, Barcala, Gómez-Espina, Rivas
Section Position a (cm) pH EC25°C
(µS/cm)Cl- SO4
2- HCO3- Na+ K+ Ca2+ Mg2
24 1.3 7.9 1078 149 250 122 225 6.3 6.8 5.8 a Distance from heater
Table A. XIII: Analysis of the 1:4 solid/water aqueous extracts of the samples from test FQ1. The concentration of ions is given in mg/L
Section Position a (cm) pH EC25°C
(µS/cm)Cl- SO4
2- HCO3- Na+ K+ Ca2+ Mg2
1 58.8 8.0 439 43 67 177 92 2.7 1.2 3.2 2 56.3 8.1 577 46 154 171 124 2.7 2.0 2.4 3 53.8 8.1 900 67 346 128 193 3.9 3.6 3.9 4 51.3 8.2 914 96 259 140 195 3.9 4.0 4.1 5 48.8 8.0 998 142 240 128 214 3.9 4.4 4.4 6 46.3 8.1 1029 191 211 128 221 4.3 4.8 4.1 7 43.8 8.3 1152 227 250 116 246 4.7 6.0 4.9 8 41.3 8.1 1078 199 240 122 230 5.5 5.2 4.6 9 38.8 8.2 956 195 173 134 200 4.7 4.4 6.3 10 36.3 8.0 1054 184 240 134 225 4.7 4.4 4.9 12 31.3 8.1 1011 163 221 134 216 4.3 4.4 4.6 13 28.8 8.1 1010 167 221 134 214 4.7 4.8 5.3 14 26.3 8.1 1034 163 144 134 225 3.9 3.2 3.4 15 23.8 8.1 1024 149 230 134 221 3.9 4.0 4.1 16 21.3 8.2 978 142 221 140 212 3.9 4.0 3.4 18 16.3 8.1 1477 181 230 134 324 4.3 4.4 4.1 20 11.3 8.1 1225 160 221 134 264 5.1 4.8 4.6 22 6.3 8.2 1007 145 211 165 214 5.1 4.4 5.1 23 2.5 8.3 1294 220 269 183 274 7.8 8.0 5.3 24 1.3 8.5 1607 209 278 177 336 8.2 12.4 7.8
a Distance from heater

ANNEX
Effect of heating/hydration on compacted bentonite: tests in 60-cm long cells A.13
Table A. XIV: Analysis of the 1:4 solid/water aqueous extracts of the samples from test FQ2. The concentration of ions is given in mg/L
Section Position a (cm) pH EC25°C
(µS/cm)Cl- SO4
2- HCO3- Na+ K+ Ca2+ Mg2
1 58.8 8.7 593 32 58 220 110 8.2 6.4 7.3 2 56.3 8.9 569 28 96 207 113 4.3 5.2 5.1 3 53.8 8.9 746 35 182 153 152 3.1 6.8 5.3 4 51.3 8.3 892 50 528 128 189 3.9 5.2 4.4 5 48.8 8.3 844 64 355 128 177 3.9 5.2 4.6 6 46.8 8.2 895 89 298 128 175 3.5 4.4 12.67 43.8 8.4 997 110 278 165 189 5.1 5.2 16.88 41.3 8.3 988 152 326 153 209 4.7 6.4 4.1 9 38.8 8.3 907 156 230 122 193 4.3 5.2 3.6 10 36.3 8.5 1149 199 230 116 230 4.3 4.8 13.911 33.8 8.7 1123 191 355 134 237 5.1 7.2 5.3 12 31.3 8.7 1058 163 240 140 223 4.7 6.8 5.1 13 28.8 8.5 989 131 221 146 209 4.3 8.0 3.4 14 26.3 8.5 992 142 250 165 209 4.7 6.4 4.6 15 23.8 8.1 1032 131 250 177 209 5.5 6.0 9.5 17 18.8 8.0 958 135 278 134 200 5.5 6.4 5.1 18 16.3 8.3 1013 149 298 122 209 8.2 8.0 5.1 19 13.8 8.2 1020 142 490 128 214 7.8 9.6 2.7 20 11.3 8.3 935 142 288 134 195 4.3 5.6 5.6 21 8.8 8.2 945 124 384 134 200 4.3 4.8 4.9 22 6.3 8.4 915 99 211 153 191 9.0 6.4 3.6 23 3.8 8.2 1079 152 307 134 225 6.6 8.8 4.6 24 1.3 8.2 227 307 67 278 7.0 10.4 10.2
a Distance from heater

ANNEX
A.14 Villar, Fernández, Martín, Barcala, Gómez-Espina, Rivas
Table A. XV: Analysis of the 1:4 solid/water aqueous extracts of the samples from test HI1/2. The concentration of ions is given in mg/L
Section Position a (cm) pH EC25°C (µS/cm) Cl- SO42- NO3
- HCO3- SiO2 Na+ K+ Ca2+ Mg2 Sr2 Al3+ Fe3+
1-2 57.5 8.2 972 22 154 1.5 187 20.2 165 8.9 7.7 21 0.14 70 16 3-4 52.5 8.2 1090 138 220 3.1 127 19.3 230 13.0 2.4 1.8 0.06 0.17 0.04 5 48.8 7.8 1319 232 245 5.9 102 16.0 280 7.1 7.3 4.2 0.12 0.92 0.24 6 46.3 7.9 1233 215 228 6.2 115 15.9 260 10.0 6.4 3.9 0.10 1.00 0.25 7 43.8 7.7 1157 178 196 5.2 120 16.4 245 5.8 5.9 3.5 0.09 1.40 0.38 8 41.3 7.9 1112 172 187 4.8 128 16.8 235 5.1 5.5 3.4 0.07 1.70 0.50 9 38.8 7.9 1110 154 213 4.3 128 16.9 235 4.9 5.8 3.5 0.09 1.40 0.36 10 36.3 7.9 1160 159 213 5.3 134 17.0 245 6.3 5.7 3.7 0.08 1.50 0.39 11 33.8 7.9 1132 160 220 4.5 141 17.1 240 5.5 5.7 3.5 0.08 1.30 0.34 12 31.3 7.9 1052 147 172 4.2 133 16.3 220 4.5 5.2 3.6 0.07 2.20 0.58 13 28.8 7.9 1147 157 206 4.8 138 17.3 240 6.8 5.7 3.7 0.08 2.10 0.57 14 26.3 7.9 1065 145 189 4.5 145 16.7 225 5.1 5.3 3.2 0.07 1.60 0.44 15 23.8 7.9 1088 141 205 4.2 144 17.0 230 6.0 5.3 3.2 0.07 1.50 0.40 16 21.3 7.8 1106 134 211 4.0 166 17.8 240 11.0 2.3 2.3 0.06 0.28 0.08 17 18.8 7.5 1145 133 229 <1.0 252 17.5 250 6.2 2.6 2.8 0.08 0.42 0.08 18 16.3 7.6 1119 139 214 4.2 145 17.4 245 6.1 2.8 2.6 0.07 0.21 0.05 19 13.8 7.2 1116 142 210 5.7 153 17.3 245 5.8 2.7 2.6 0.07 0.07 <0.0320 11.3 7.5 1089 138 207 3.7 145 -- 240 4.9 2.5 2.3 0.06 0.07 <0.0321 8.8 7.6 1170 172 214 4.7 154 18.0 245 27.0 2.7 2.5 0.07 0.13 <0.0322 6.3 7.7 1123 133 211 4.1 159 18.0 245 6.0 2.9 2.8 0.07 0.33 0.06 23 3.8 7.7 1262 162 226 5.5 155 3.7 275 6.2 4.1 3.5 0.10 <0.05 <0.0324 1.3 7.8 1361 202 165 9.0 204 -- 295 6.7 4.9 4.1 0.10 0.16 0.16 aDistance from heater
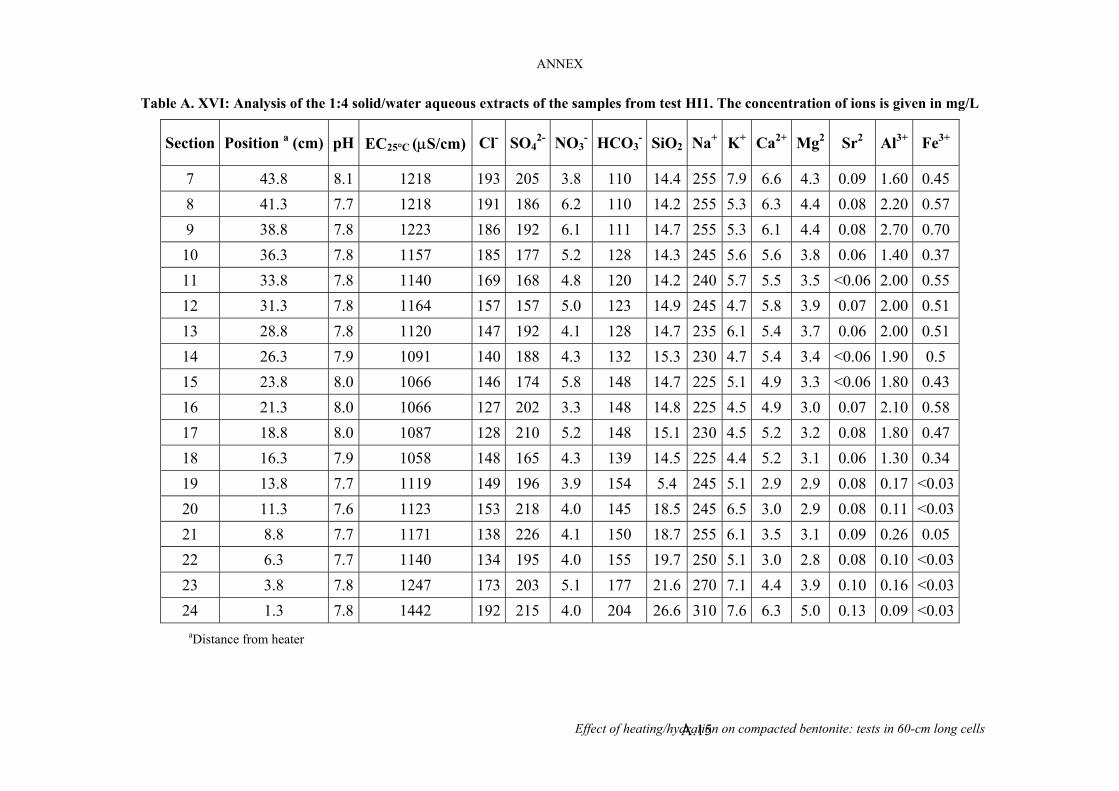
ANNEX
Effect of heating/hydration on compacted bentonite: tests in 60-cm long cells A.15
Table A. XVI: Analysis of the 1:4 solid/water aqueous extracts of the samples from test HI1. The concentration of ions is given in mg/L
Section Position a (cm) pH EC25°C (µS/cm) Cl- SO42- NO3
- HCO3- SiO2 Na+ K+ Ca2+ Mg2 Sr2 Al3+ Fe3+
7 43.8 8.1 1218 193 205 3.8 110 14.4 255 7.9 6.6 4.3 0.09 1.60 0.45 8 41.3 7.7 1218 191 186 6.2 110 14.2 255 5.3 6.3 4.4 0.08 2.20 0.57 9 38.8 7.8 1223 186 192 6.1 111 14.7 255 5.3 6.1 4.4 0.08 2.70 0.70 10 36.3 7.8 1157 185 177 5.2 128 14.3 245 5.6 5.6 3.8 0.06 1.40 0.37 11 33.8 7.8 1140 169 168 4.8 120 14.2 240 5.7 5.5 3.5 <0.06 2.00 0.55 12 31.3 7.8 1164 157 157 5.0 123 14.9 245 4.7 5.8 3.9 0.07 2.00 0.51 13 28.8 7.8 1120 147 192 4.1 128 14.7 235 6.1 5.4 3.7 0.06 2.00 0.51 14 26.3 7.9 1091 140 188 4.3 132 15.3 230 4.7 5.4 3.4 <0.06 1.90 0.5 15 23.8 8.0 1066 146 174 5.8 148 14.7 225 5.1 4.9 3.3 <0.06 1.80 0.43 16 21.3 8.0 1066 127 202 3.3 148 14.8 225 4.5 4.9 3.0 0.07 2.10 0.58 17 18.8 8.0 1087 128 210 5.2 148 15.1 230 4.5 5.2 3.2 0.08 1.80 0.47 18 16.3 7.9 1058 148 165 4.3 139 14.5 225 4.4 5.2 3.1 0.06 1.30 0.34 19 13.8 7.7 1119 149 196 3.9 154 5.4 245 5.1 2.9 2.9 0.08 0.17 <0.0320 11.3 7.6 1123 153 218 4.0 145 18.5 245 6.5 3.0 2.9 0.08 0.11 <0.0321 8.8 7.7 1171 138 226 4.1 150 18.7 255 6.1 3.5 3.1 0.09 0.26 0.05 22 6.3 7.7 1140 134 195 4.0 155 19.7 250 5.1 3.0 2.8 0.08 0.10 <0.0323 3.8 7.8 1247 173 203 5.1 177 21.6 270 7.1 4.4 3.9 0.10 0.16 <0.0324 1.3 7.8 1442 192 215 4.0 204 26.6 310 7.6 6.3 5.0 0.13 0.09 <0.03
aDistance from heater

ANNEX
A.16 Villar, Fernández, Martín, Barcala, Gómez-Espina, Rivas
Table A. XVII: Analysis of the 1:4 solid/water aqueous extracts of the samples from test HI2. The concentration of ions is given in mg/L
Section Position a (cm) pH EC25°C (µS/cm) Cl- SO42- NO3
- HCO3- SiO2 Na+ K+ Ca2+ Mg2 Sr2 Al3+ Fe3+
1-2 57.5 8.3 986 70 83 1.7 165 22.8 180 17.0 4.4 4.0 <0.10 8.30 2.30 3-4 52.5 7.8 1206 84 298 1.1 137 22.8 255 8.3 4.6 3.5 0.05 1.90 0.47 5-6 48.5 8.0 1419 135 288 2.8 113 21.3 300 12.0 7.3 4.0 <0.10 1.10 0.32 7 43.8 7.9 1004 142 210 3.4 108 18.2 220 4.9 1.3 2.7 0.09 0.47 0.08
8-9 40.0 7.8 1416 210 247 5.6 129 22.5 300 12.0 6.6 4.6 0.07 0.78 0.19 10 36.3 8.3 1137 193 200 4.1 102 18.0 250 4.3 2.1 2.9 0.11 0.30 0.04 11 33.8 7.9 1145 198 206 4.6 101 17.5 250 5.1 2.3 3.5 0.12 0.33 0.04 12 31.3 8.2 1091 188 189 4.3 110 17.7 240 4.0 1.9 2.8 0.1 0.33 0.05 13 28.8 7.9 1063 166 192 4.2 113 18.4 235 3.8 1.1 2.6 0.09 0.35 0.04 14 26.3 8.0 1020 147 193 3.7 122 18.2 225 3.5 1.0 2.9 0.09 0.33 <0.0315 23.8 8.2 1017 128 197 3.1 126 18.8 225 3.5 <1 2.6 0.08 0.61 0.1 16 21.3 8.2 1009 122 206 3.3 128 18.8 220 4.0 <1 2.5 0.08 1.70 0.4 17 18.8 8.0 1013 129 229 2.8 133 19.1 225 3.8 1.1 2.2 0.09 0.10 <0.0318 16.3 8.0 1068 154 206 3.8 128 19.1 235 4.1 1.9 2.7 0.1 0.27 <0.0319 13.8 8.1 1124 163 222 4.2 128 19.9 245 4.7 2.6 3.6 0.12 0.31 0.03 20 11.3 8.1 1073 160 200 3.8 132 19.2 235 4.3 2.2 3.2 0.1 0.18 <0.0321 8.8 8.0 1075 158 205 3.1 140 19.4 235 4.3 1.8 3.0 0.09 0.74 0.23 22 6.3 8.4 1166 174 213 3.7 145 21.6 255 4.8 2.5 3.5 0.12 0.27 <0.0323 3.8 8.0 1293 230 208 4.3 146 23.7 280 5.9 4.4 4.6 0.15 0.13 <0.0324 1.3 8.2 1533 241 240 <1 197 29.9 330 6.8 6.6 5.5 0.19 0.11 <0.03aDistance from heater

ANNEX
Effect of heating/hydration on compacted bentonite: tests in 60-cm long cells A.17
Table A. XVIII: Analysis of the 1:4 solid/water aqueous extracts of the samples from test CG3. The concentration of ions is given in mg/L
Section Position a (cm) pH EC
(µS/cm) Ionic strength
(M) Cl- SO42- HCO3
- Na+ K+ Ca2+ Mg2+
1 58.8 8.3 1035 0.006 43 64 186 130 7.0 <10 12.0 2 56.3 8.4 695 0.006 46 72 171 128 5.7 <10 4.3 3 53.8 8.3 750 0.006 50 93 164 138 4.1 <10 4.4 4 51.3 8.1 669 0.006 60 112 165 148 2.9 <10 <4.0 5 48.8 8.6 725 0.006 63 137 153 160 5.1 <10 <4.0 6 46.3 8.3 963 0.008 59 293 128 218 5.8 <10 <4.0 7 43.8 7.8 970 0.008 60 293 119 220 5.0 <10 <4.0 8 41.3 8.1 853 0.007 69 204 146 193 4.5 <10 <4.0 9 38.8 7.8 994 0.009 77 288 126 225 5.9 <10 <4.0 10 36.3 7.8 893 0.008 75 234 136 203 4.1 <10 <4.0 11 33.8 7.6 928 0.008 81 246 126 210 5.6 <10 <4.0 12 31.3 8.0 940 0.008 85 237 141 213 4.4 <10 <4.0 13 28.8 7.9 962 0.008 84 247 144 218 4.3 <10 <4.0 14 26.3 7.8 838 0.008 86 161 161 190 4.4 <10 <4.0 15 23.8 7.9 994 0.009 88 256 140 223 9.4 <10 <4.0 16 21.3 8.2 896 0.008 89 172 156 203 5.0 <10 <4.0 17 18.8 7.8 1357 0.011 100 405 114 300 5.8 <10 4.1 18 16.3 7.4 1367 0.012 171 293 118 300 7.4 <10 5.2 19 13.8 7.6 1363 0.012 189 252 114 300 7.2 <10 4.8 20 11.3 7.6 1370 0.012 226 204 122 300 6.8 <10 5.8

ANNEX
A.18 Villar, Fernández, Martín, Barcala, Gómez-Espina, Rivas
Section Position a (cm) pH EC
(µS/cm) Ionic strength
(M) Cl- SO42- HCO3
- Na+ K+ Ca2+ Mg2+
21 8.8 7.7 1558 0.013 249 253 111 325 7.4 13 7.4 22 6.3 8.0 1560 0.013 281 190 124 325 9.8 12 7.5 23 3.8 7.9 1863 0.016 399 205 113 375 9.9 20 13.0 24 1.3 7.9 1960 0.019 539 194 181 375 16.0 28 18.0
a Distance from heater

ANNEX
Effect of heating/hydration on compacted bentonite: tests in 60-cm long cells A.19
Table A. XIX: Chemical composition of pore water obtained by squeezing from different sections of HI tests (mg/L)
Test HI 1/2 HI 1 HI 2 Section 1-2 2-3 1-2 3-4 5-6 1-2 3-4 5-6 8-9
Position a 58.1 54.4 57.5 52.5 48.5 57.5 52.5 48.5 40.0 Al3+ <0.08 <2.0 0.70 0.81 0.63 <0.25 <0.1 0.55 5.5 Ca2+ 72 1500 55 740 220 48 195 373 1700 K+ 7.2 32 3.5 14 8.4 4.9 8.0 14 29 Na+ 725 4000 655 2800 1500 763 1400 1800 3000
Mg2+ 72 1400 56 875 235 59 200 385 1400 Sr2+ 1.3 28 0.92 12 3.6 0.71 2.8 5.5 30 B 0.37 3.4 0.97 0.51 0.44
Zn2+ 0.49 <2.0 0.81 1.7 0.47 0.51 <0.1 0.75 18 Ni <0.03 <1.0 0.17 < 0.15 < 0.15 0.41 <0.06 0.34 8.1 Fe <0.03 <1.0 0.11 0.38 < 0.15 0.16 <0.06 0.16 <3.2 Ti 0.37 < 0.25 < 0.25 Br- 1.6 1.0 12 4 2.5 4.0 6.1 23 Cl- 854 11400 970 6700 2100 1000 2000 3700 10600
SO42- 625 3400 475 1500 1400 522 1500 1400 2200
HCO3 - 113 -- 136 167 121 83 102 108
NO3- 7.6 277 2.1 4.2 < 1 2.3 12 53 232
SiO2 15.5 23.2 pH 7.0 7.6 7.6 7.5 7.6 7.5
a Distance from heater

ANNEX
A.20 Villar, Fernández, Martín, Barcala, Gómez-Espina, Rivas
Table A. XX: Exchangeable cations along the column of test HI1/2 (meq/100g)
Section Position a (cm) Ca2+ Mg2+ Na+ K+ ΣEC b
1-2 57.5 28 25 25 1.8 79 3-4 52.5 34 30 26 1.9 93 5 48.8 31 33 23 1.8 89 6 46.3 29 33 23 1.8 87 7 43.8 30 33 23 1.8 88 8 41.3 30 31 23 1.8 86 9 38.8 28 31 23 1.8 84 10 36.3 30 32 22 1.8 86 11 33.8 31 29 22 1.8 85 12 31.3 35 32 24 1.8 93 13 28.8 35 31 24 1.8 92 14 26.3 34 29 22 1.8 88 15 23.8 36 30 24 1.7 93 16 21.3 34 31 25 1.8 92 17 18.8 36 31 24 1.9 93 18 16.3 36 29 24 1.9 92 19 13.8 36 31 24 1.9 93 20 11.3 34 31 24 1.8 92 21 8.8 35 31 26 1.7 95 22 6.3 36 31 24 1.9 94 23 3.8 35 32 24 1.7 93 24 1.3 36 29 23 1.9 90
a Distance from heater; b Sum of exchangeable cations
Table A. XXI: Exchangeable cations along the column of test HI1 (meq/100g)
Section Position a (cm) Ca2+ Mg2+ Na+ K+ ΣEC b
7 43.8 36 31 24 2.0 88 8 41.3 32 29 21 1.9 93 9 38.8 36 32 24 2.1 85 10 36.3 36 33 23 2.1 94 11 33.8 37 31 21 1.8 95 12 31.3 33 32 23 2.0 91 13 28.8 30 30 23 2.0 89 14 26.3 30 29 23 2.0 85 15 23.8 20 18 15 1.1 84

ANNEX
Effect of heating/hydration on compacted bentonite: tests in 60-cm long cells A.21
Section Position a (cm) Ca2+ Mg2+ Na+ K+ ΣEC b
16 21.3 30 30 25 2.1 53 17 18.8 29 28 23 2.0 86 18 16.3 30 30 24 2.1 81 19 13.8 34 32 24 1.9 87 20 11.3 34 32 24 1.9 92 21 8.8 34 32 24 2.1 92 22 6.3 34 32 24 1.9 93 23 3.8 36 32 23 2.1 93 24 1.3 35 32 23 1.9 93
a Distance from heater; b Sum of exchangeable cations
Table A. XXII: Exchangeable cations along the column of test HI2 (meq/100g)
Section Position a (cm) Ca2+ Mg2+ Na+ K+ ΣEC b
1-2 57.5 31 24 22 2.0 79 3-4 52.5 30 28 22 2.0 82 5-6 48.5 32 27 20 2.0 81 7 43.8 28 28 22 1.8 80
8-9 40.0 35 36 26 2.4 99 10 36.3 28 30 22 1.9 81 11 33.8 27 29 22 1.8 80 12 31.3 28 30 22 1.8 82 13 28.8 27 30 22 1.8 81 14 26.3 27 30 22 1.8 82 15 23.8 27 29 23 1.8 81 16 21.3 27 30 24 1.8 83 17 18.8 26 30 23 1.9 82 18 16.3 27 33 23 1.9 85 19 13.8 26 28 21 1.8 77 20 11.3 28 31 21 1.9 81 21 8.8 27 30 22 1.9 81 22 6.3 27 31 21 2.0 81 23 3.8 27 32 21 2.1 82 24 1.3 26 28 22 2.1 78
a Distance from heater; b Sum of exchangeable cations
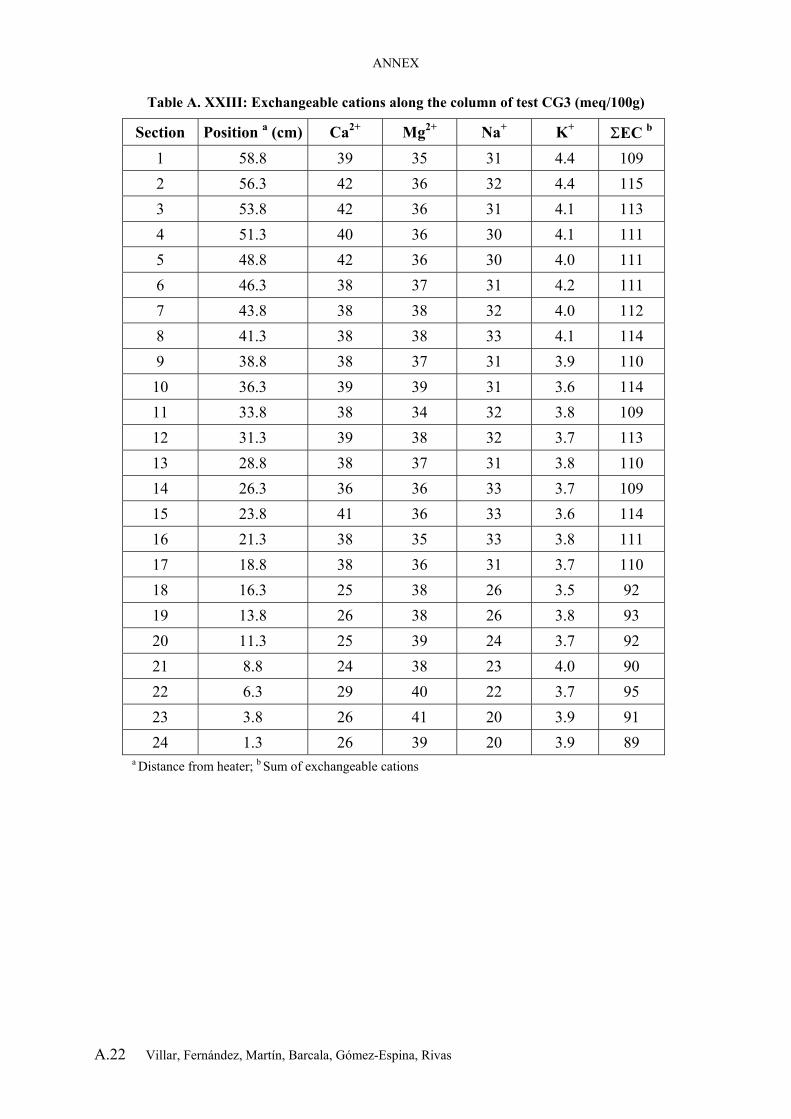
ANNEX
A.22 Villar, Fernández, Martín, Barcala, Gómez-Espina, Rivas
Table A. XXIII: Exchangeable cations along the column of test CG3 (meq/100g)
Section Position a (cm) Ca2+ Mg2+ Na+ K+ ΣEC b
1 58.8 39 35 31 4.4 109 2 56.3 42 36 32 4.4 115 3 53.8 42 36 31 4.1 113 4 51.3 40 36 30 4.1 111 5 48.8 42 36 30 4.0 111 6 46.3 38 37 31 4.2 111 7 43.8 38 38 32 4.0 112 8 41.3 38 38 33 4.1 114 9 38.8 38 37 31 3.9 110 10 36.3 39 39 31 3.6 114 11 33.8 38 34 32 3.8 109 12 31.3 39 38 32 3.7 113 13 28.8 38 37 31 3.8 110 14 26.3 36 36 33 3.7 109 15 23.8 41 36 33 3.6 114 16 21.3 38 35 33 3.8 111 17 18.8 38 36 31 3.7 110 18 16.3 25 38 26 3.5 92 19 13.8 26 38 26 3.8 93 20 11.3 25 39 24 3.7 92 21 8.8 24 38 23 4.0 90 22 6.3 29 40 22 3.7 95 23 3.8 26 41 20 3.9 91 24 1.3 26 39 20 3.9 89
a Distance from heater; b Sum of exchangeable cations

ANNEX
Effect of heating/hydration on compacted bentonite: tests in 60-cm long cells A.23
Table A. XXIV: Results of the permeability tests performed with trimmed samples from test FQ1/2 saturated with granitic water
Section Position a
(cm) ρd i
(g/cm3)
w i (%)
Permeability (m/s)
w f (%)
ρd f (g/cm3)
Calculated b kw (m/s)
Deviation c
(%)
1 58.8 1.42 5.1·10-13 1.42 1.67·10-13 204 6 46.3 1.43 22.8 4.3·10-13 35.0 1.43 1.58·10-13 172 11 33.8 1.61 17.1 1.2·10-13 28.3 1.61 4.70·10-14 165 15 23.8 1.68 15.6 1.3·10-13 28.7 1.61 2.82·10-14 362 19 13.8 1.63 15.0 1.4·10-13 29.2 1.57 3.90·10-14 262 21 8.8 1.67 12.1 7.2·10-14 25.0 1.67 2.97·10-14 142
a Distance to the heater; b With Equations 1 and 2; c ((Permeability measured – Calculated permeability)/ Calculated permeability) x 100
Table A. XXV: Results of the permeability tests performed with trimmed samples from test FQ1 saturated with granitic water
Section Position a
(cm) ρd i
(g/cm3) w i (%)
Permeability (m/s)
w f (%)
ρd f (g/cm3)
Calculated b kw (m/s)
Deviation c
(%)
1 58.8 1.40 33.0 3.2·10-13 33.8 1.37 2.3·10-13 38 6 46.3 1.47 23.4 2.5·10-13 32.2 1.47 1.2·10-13 113 9 38.8 1.66 1.2·10-13 31.5 1.46 1.3·10-13 -5 14 26.3 1.40 4.8·10-13 34.9 1.40 1.9·10-13 150 19 13.8 1.70 12.4 3.0·10-14 24.8 1.59 5.2·10-14 -42 21 8.8 1.76 12.0 3.0·10-14 23.4 1.67 3.0·10-14 -1
23-24 2.5 1.71 8.0 1.5·10-13 27.5 1.57 5.8·10-14 161 a Distance to the heater; b With Equations 1 and 2; c ((Permeability measured – Calculated permeability)/ Calculated permeability) x 100
Table A. XXVI: Results of the permeability tests performed with trimmed samples from test FQ2 saturated with granitic water
Section Position a
(cm) ρd i
(g/cm3) w i (%)
Permeability (m/s)
w f (%)
ρd f (g/cm3)
Calculated b kw (m/s)
Deviation c
(%)
1 58.8 1.41 33.0 8.7·10-13 37.5 1.34 2.8·10-13 207 6 46.3 1.46 26.5 4.2·10-13 32.0 1.48 1.1·10-13 290 10 36.3 1.59 22.7 1.4·10-13 27.2 1.59 5.3·10-14 162
a Distance to the heater; b With Equations 1 and 2; c ((Permeability measured – Calculated permeability)/ Calculated permeability) x 100

ANNEX
A.24 Villar, Fernández, Martín, Barcala, Gómez-Espina, Rivas
Table A. XXVII: Results of the swelling under vertical pressure (0.5 MPa) tests performed with samples trimmed from the column of test FQ1/2 saturated with granitic
water
Section Position a
(cm) ρd i
(g/cm3) w i (%)
Final strain(%)
Duration(days)
w f (%)
ρd f (g/cm3)
Calculated strain b
(%)
Deviation c
(%)
2 56.3 1.49 27.1 -8.2 9 39.5 1.38 -8.7 -5 5 48.8 1.63 21.5 -16.7 13 34.0 1.40 -15.6 8 9 38.8 1.60 16.7 -14.4 9 40.6 1.40 -16.5 -13 10 36.3 1.76 15.6 -19.7 13 37.6 1.47 -25.6 -23 13 28.8 1.63 16.1 -19.5 13 35.1 1.37 -18.8 4 17 18.8 1.62 15.6 -14.0 13 38.1 1.42 -18.4 -24 24 1.3 1.69 6.2 -21.8 21 35.9 1.39 -33.8 -36
a Distance from heater; b With Equation 7; c ((Measured strain – Calculated strain) / Calculated strain) x 100
Table A. XXVIII: Results of the swelling under vertical pressure (0.5 MPa) tests performed with remoulded samples from the column of test FQ1/2 compacted to
nominal dry density 1.60 g/cm3 and saturated with granitic water
Section Position a
(cm) ρd i
(g/cm3) w i (%)
Final strain(%)
Duration(days)
w f (%)
ρd f (g/cm3)
Deviation b
(%)
2 56.3 1.61 16.6 -17.9 26 35.7 1.36 11 2 56.3 1.60 16.7 -15.7 12 37.3 1.39 -2 7 43.8 1.63 15.8 -17.3 17 34.2 1.39 3 8 41.3 1.67 11.2 -20.2 17 34.7 1.39 9 38.8 1.59 16.8 -17.3 13 39.9 1.35 12 11 33.8 1.60 14.5 -16.8 15 40.0 1.37 7 12 31.3 1.60 15.8 -17.3 15 39.1 1.37 8 14 26.3 1.60 15.1 -16.4 25 41.1 1.38 2 17 18.8 1.60 14.8 -16.0 13 39.1 1.38 1 18 16.3 1.60 15.4 -21.8 18 40.0 1.32 37 19 13.8 1.59 15.2 -15.3 12 38.7 1.38 -2 21 8.8 1.61 14.3 -17.4 13 40.6 1.37 8 24 1.3 1.59 13.4 -16.7 13 40.7 1.37 7
a Distance to the heater; b With respect to the value calculated with Equation 8

ANNEX
Effect of heating/hydration on compacted bentonite: tests in 60-cm long cells A.25
Table A. XXIX: Results of the swelling under vertical pressure (0.5 MPa) tests performed with remoulded samples from the column of test FQ1 compacted to nominal
dry density 1.60 g/cm3 and saturated with granitic water
Section Position a
(cm) ρd i
(g/cm3)
w i (%)
Final strain(%)
Duration(days)
w f (%)
ρd f (g/cm3)
Deviation b
(%)
3 53.8 1.59 12.3 -16.8 15 34.2 1.36 8 4 51.3 1.61 11.7 -17.6 19 37.1 1.37 9 5 48.8 1.56 14.6 -16.8 16 36.0 1.34 17 6 46.3 1.59 12.7 -17.6 22 36.4 1.35 14 8 41.3 1.58 13.2 -17.5 22 40.2 1.35 16 10 36.3 1.56 13.8 -17.0 27 40.2 1.34 18 12 31.3 1.58 11.8 -17.1 14 38.7 1.35 13 13 28.8 1.61 12.5 -19.7 16 39.1 1.34 22 14 26.3 1.59 14.1 -16.4 16 37.5 1.37 6 16 21.3 1.59 11.4 -17.2 15 39.6 1.36 11 18 16.3 1.61 11.7 -18.2 14 37.3 1.36 12 20 11.3 1.63 10.4 -18.5 6 36.4 1.38 8 22 6.3 1.60 12.1 -17.7 15 37.4 1.36 12
23-24 2.5 1.58 11.5 -17.0 15 35.8 1.35 12 a Distance to the heater; b With respect to the value calculated with Equation 8
Table A. XXX: Results of the swelling under vertical pressure (0.5 MPa) tests performed with samples trimmed from the column of test CG3 saturated with deionised water
Section Position a (cm)
Initial ρd (g/cm3)
Initial w (%)
Final strain (%)
Duration (days)
Final w (%)
Final ρd (g/cm3)
2 56.3 1.44 30.4 -2.5 9 36.3 1.40 4 51.3 1.47 30.4 -4.4 9 35.1 1.41 6 46.3 1.49 30.0 -8.1 22 38.2 1.38 8 41.3 1.53 27.1 -9.1 22 37.9 1.40 10 36.3 1.51 27.5 -8.1 22 35.8 1.40 12 31.3 1.56 25.9 -10.4 20 36.2 1.41 14 26.3 1.59 25.4 -10.0 14 35.3 1.44 16 21.3 1.53 20.7 -10.7 22 38.5 1.38 18 16.3 1.58 20.7 -13.6 17 37.9 1.39 20 11.3 1.55 16.7 -12.9 20 36.7 1.37 22 6.3 1.62 12.9 -15.3 14 35.0 1.41 24 1.3 1.61 12.2 -14.6 18 38.6 1.41
a Distance from heater

ANNEX
A.26 Villar, Fernández, Martín, Barcala, Gómez-Espina, Rivas
Table A. XXXI: Results of the swelling pressure tests performed with remoulded samples from the column of test FQ1/2 compacted to nominal dry density 1.60 g/cm3 and saturated with
deionised water
Section Position a
(cm) ρd i
(g/cm3)
w i (%)
Ps (MPa)
Duration(days)
w f (%)
ρd f (g/cm3)
Deviation b
(%)
1 58.8 1.60 15.2 8.7 8 29.8 1.59 61 4 51.3 1.60 15.2 9.7 7 25.9 1.60 69 6 46.3 1.61 16.5 7.0 6 30.7 1.58 38 7 43.8 1.60 17.4 11.7 9 25.5 1.60 103 8 41.3 1.60 16.0 6.3 7 29.6 1.58 25 9 38.8 1.59 16.6 7.0 6 30.7 1.56 53 11 33.8 1.61 13.6 5.0 7 31.1 1.58 0 12 31.3 1.60 16.1 8.0 7 26.4 1.58 54 15 23.8 1.63 14.1 9.5 10 25.7 1.61 55 16 21.3 1.62 14.7 7.0 7 29.9 1.61 15 17 18.8 1.58 16.0 8.3 8 26.8 1.57 75 19 13.8 1.58 16.0 6.6 9 30.8 1.57 36 19 13.8 1.59 15.5 7.0 6 30.2 1.57 50 20 11.3 1.59 15.4 5.7 9 31.3 1.57 23 21 8.8 1.61 14.2 8.2 10 26.4 1.60 43 21 8.8 1.61 13.8 7.5 6 29.2 1.58 42
21-22-23 6.3 1.60 13.8 6.6 5 26.2 1.58 29 22-23 5.0 1.61 13.3 7.0 7 29.1 1.58 42
24 1.3 1.60 12.7 5.3 12 28.7 1.59 -1 24 1.3 1.61 12.6 8.8 6 25.3 1.59 65
a Distance to the heater; b With respect to the value calculated with Equation 3
Table A. XXXII: Results of the swelling pressure tests performed with trimmed samples from the column of test FQ1 saturated with granitic water
Section Position a
(cm) ρd i
(g/cm3) w i (%)
Ps (MPa)
Duration (days)
w f (%)
ρd f (g/cm3)
Calculated Ps b (MPa)
Deviation c
(%)
5 48.8 1.50 20.7 2.7 8 34.1 1.47 2.4 12 17 18.8 1.66 14.2 8.8 8 26.5 1.67 9.1 -3 22 6.3 1.69 10.0 6.6 3 30.5 1.67 9.5 -31
a Distance to the heater; b With Equation 3; c ((Measured Ps – Calculated Ps) / Calculated Ps) x 100

ANNEX
Effect of heating/hydration on compacted bentonite: tests in 60-cm long cells A.27
Table A. XXXIII: Results of the swelling pressure tests performed with remoulded samples from the column of test FQ1 compacted to nominal dry density 1.60 g/cm3 and saturated with
deionised water
Section Position a
(cm) ρd i
(g/cm3) w i (%)
Ps (MPa)
Duration (days)
w f (%)
ρd f (g/cm3)
Deviation b (%)
1 58.8 1.63 11.2 9.5 9 25.6 1.62 42 2 56.3 1.59 15.5 7.1 11 29.9 1.56 57 5 48.8 1.62 14.4 8.7 10 26.6 1.61 57 6 46.3 1.62 11.7 8.5 6 25.3 1.61 35 9 38.8 1.61 14.5 8.6 7 26.5 1.61 42 13 28.8 1.62 11.1 7.3 7 26.7 1.60 28 14 26.3 1.60 14.2 9.8 6 25.1 1.60 68 15 23.8 1.61 11.5 7.1 8 26.8 1.60 26 17 18.8 1.61 11.6 7.9 6 25.3 1.60 33 19 13.8 1.61 13.1 9.5 7 25.7 1.60 58 19 13.8 1.61 13.1 8.8 11 26.8 1.60 47 21 8.8 1.61 14.2 8.6 11 29.4 1.57 79 22 6.3 1.62 12.0 8.0 8 26.0 1.61 26
23-24 2.5 1.62 11.0 9.4 9 25.5 1.61 49 a Distance to the heater; b With respect to the value calculated with Equation 3
Table A. XXXIV: Results of the swelling pressure tests performed with trimmed samples from the column of test FQ2 saturated with deionised water
Section Position a
(cm) ρd i
(g/cm3) w i (%)
Ps (MPa)
Duration (days)
w f (%)
ρd f (g/cm3)
Calculated Ps
b (MPa) Deviation c
(%)
2 56.3 1.46 29.7 1.4 7 34.1 1.45 2.1 -34 3 53.8 1.51 27.2 4.9 4 27.5 1.49 2.8 72 5 48.8 1.56 24.0 3.7 8 29.6 1.55 4.0 -9 11 33.8 1.60 18.6 6.0 7 26.8 1.59 5.3 14 13 28.8 1.66 17.0 6.3 8 26.6 1.64 7.9 -20 15 23.8 1.57 17.6 5.9 7 26.9 1.56 4.5 32 16 21.3 1.58 21.5 6.8 8 27.1 1.57 4.8 41 18 16.3 1.60 12.5 4.4 7 27.8 1.58 5.1 -13 24 1.3 1.71 6.1 7.4 8 25.2 1.71 12.0 -38
a Distance to the heater; b With Equation 3; c ((Measured Ps – Calculated Ps) / Calculated Ps) x 100

ANNEX
A.28 Villar, Fernández, Martín, Barcala, Gómez-Espina, Rivas
Table A. XXXV: Results of the swelling pressure tests performed with remoulded samples from the column of test FQ2 compacted to nominal dry density 1.60 g/cm3 and saturated with
deionised water
Section Position a
(cm) ρd i
(g/cm3) w i (%)
Ps (MPa)
Duration (days)
w f (%)
ρd f (g/cm3)
Deviation b (%)
1 58.8 1.64 13.2 7.0 4 25.5 1.63 1 2 56.3 1.65 9.0 6.2 8 26.1 1.64 -18 3 53.8 1.64 12.3 7.3 7 27.4 1.62 12 4 51.3 1.67 11.8 9.8 7 24.7 1.65 20 6 46.3 1.67 12.0 7.8 7 25.9 1.67 -15 9 38.8 1.64 12.9 8.6 8 25.2 1.63 18 10 36.3 1.63 13.1 8.4 7 28.3 1.61 36 11 33.8 1.63 14.4 10.0 6 23.7 1.62 51 12 31.3 1.61 15.2 6.6 6 28.1 1.59 20 13 28.8 1.60 15.3 5.9 6 26.3 1.59 8 14 26.3 1.62 14.7 7.1 7 29.7 1.59 30 15 23.8 1.62 13.9 7.1 8 25.9 1.62 6 16 21.3 1.59 12.0 6.4 8 29.6 1.58 30 17 18.8 1.61 14.7 7.9 6 28.8 1.60 39 18 16.3 1.64 11.4 6.7 8 28.5 1.61 5 19 13.8 1.62 14.5 7.6 6 28.8 1.60 33 20 11.3 1.62 14.3 7.1 7 28.5 1.60 25 21 8.8 1.61 14.0 7.1 8 25.9 1.60 21
a Distance to the heater; b With respect to the value calculated with Equation 3


![DADOS TÉCNICOS VIRIATO.COM.PT [01.08] TECHNICAL SPEC ... · divisora divider diviseuse divisora teigteilmaschine dados tÉcnicos technical spec. datos tÉcnicos donnÉes techniques](https://img.pdfslide.us/doc/110x75/5e2491ac7c73ba749723b3f8/dados-tcnicos-0108-technical-spec-divisora-divider-diviseuse-divisora-teigteilmaschine.jpg)