Embed Size (px)
Citation preview
Infant Mortality in Indiana: Current Data and MCH
InitiativesDivision of Maternal and Child Health
Kendra Ham, MPHInfant Mortality Epidemiologist
Carolyn Runge, MPH, IBCLCMaternal Health Administrator

Learning Objectives– This presentation will detail the latest infant
mortality data in Indiana
– This presentation will highlight current strategies at ISDH to address infant mortality
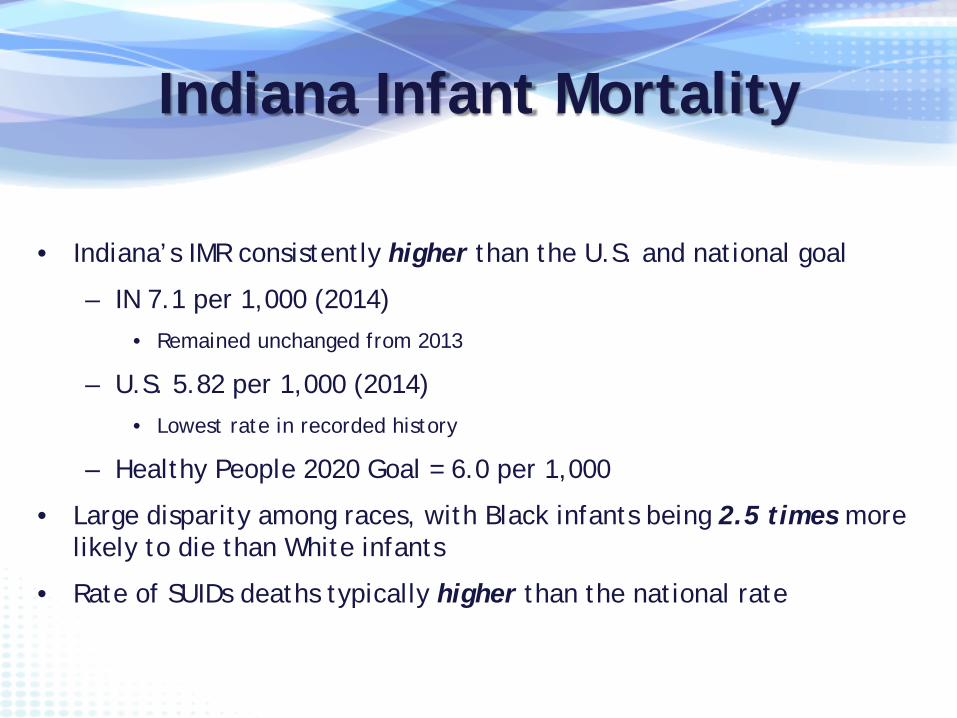
Indiana Infant Mortality
• Indiana’s IMR consistently higher than the U.S. and national goal
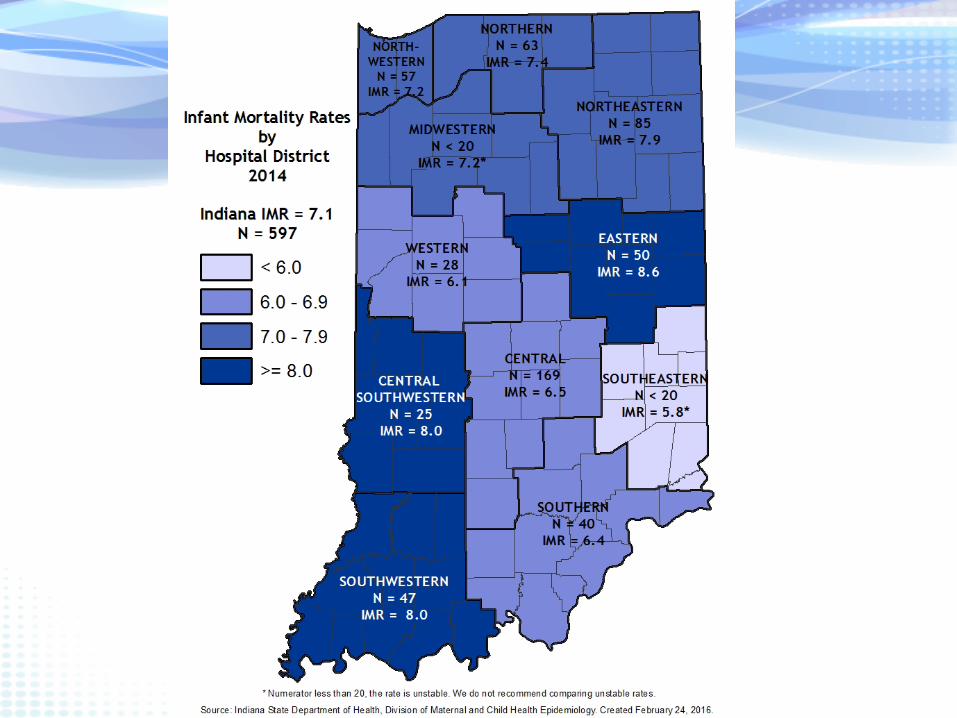
– IN 7.1 per 1,000 (2014) • Remained unchanged from 2013
– U.S. 5.82 per 1,000 (2014)• Lowest rate in recorded history
– Healthy People 2020 Goal = 6.0 per 1,000
• Large disparity among races, with Black infants being 2.5 times more likely to die than White infants
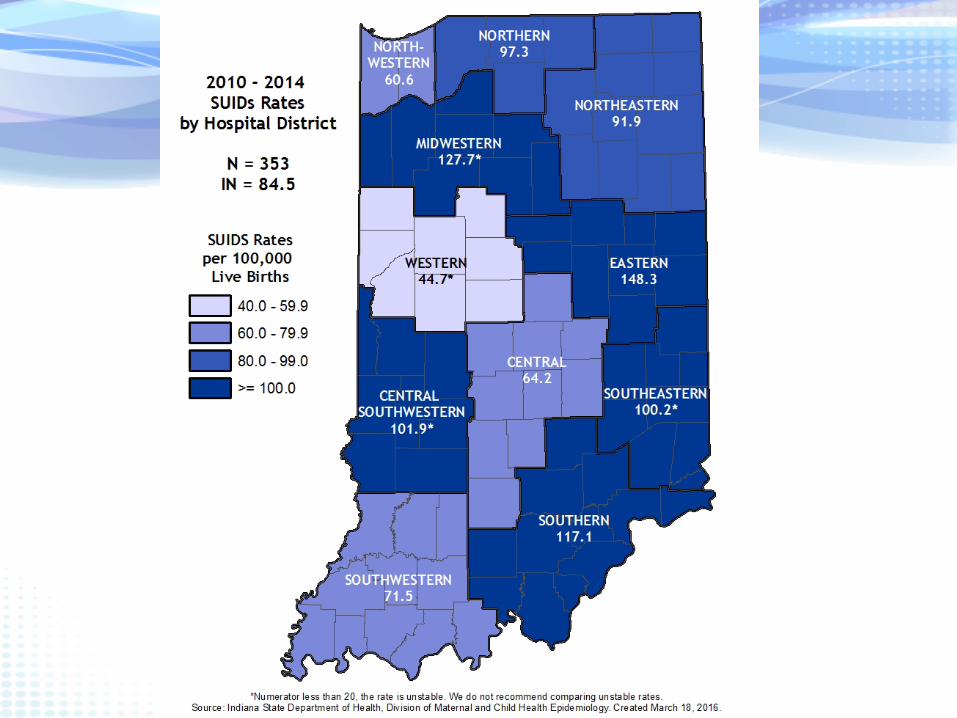
• Rate of SUIDs deaths typically higher than the national rate

Infant Mortality RatesIndiana, U.S. and Healthy People 2020 Goal
2007 - 2014
2007 2008 2009 2010 2011 2012 2013 2014Indiana 7.5 6.9 7.8 7.5 7.7 6.7 7.1 7.1U.S. 6.8 6.6 6.4 6.1 6.1 6.0 6.0 5.8HP 2020 Goal 6.0 6.0 6.0 6.0 6.0 6.0 6.0 6.0
0.0
2.0
4.0
6.0
8.0
10.0
Rate
per
1,0
00 li
ve b
irth
s
Source: Indiana State Department of Health, Maternal & Child Health Epidemiology Division [February 23, 2016]United States Original: Centers for Disease Control and Prevention National Center for Health StatisticsIndiana Original Source: Indiana State Department of Health, PHPC, ERC, Data Analysis Team

Infant Mortality Rates by RaceIndiana
2005 - 2014
8.0 7.97.5 6.9
7.87.5 7.7
6.7 7.1 7.1
6.9 6.4 6.55.5
6.4 6.06.9
5.5 5.8 5.9
16.918.1
15.714.9
16.114.7
12.3
14.515.3
14.7
0.0
2.0
4.0
6.0
8.0
10.0
12.0
14.0
16.0
18.0
20.0
2005 2006 2007 2008 2009 2010 2011 2012 2013 2014
Rate
per
1,0
00 li
ve b
irth
s
Indiana Whites Blacks
Source: Indiana State Department of Health, Maternal & Child Health Epidemiology Division [February 23, 2016]Indiana Original Source: Indiana State Department of Health, PHPC, ERC, Data Analysis Team
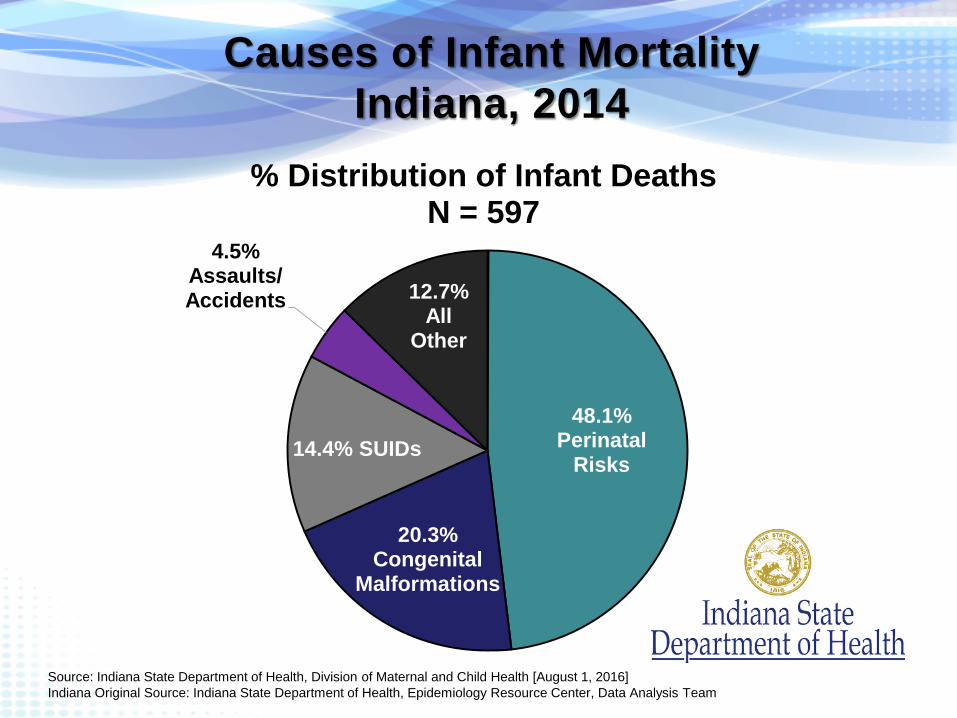
Causes of Infant MortalityIndiana, 2014
48.1%Perinatal
Risks
20.3%Congenital
Malformations
14.4% SUIDs
4.5% Assaults/Accidents 12.7%
AllOther
% Distribution of Infant DeathsN = 597
Source: Indiana State Department of Health, Division of Maternal and Child Health [August 1, 2016]Indiana Original Source: Indiana State Department of Health, Epidemiology Resource Center, Data Analysis Team
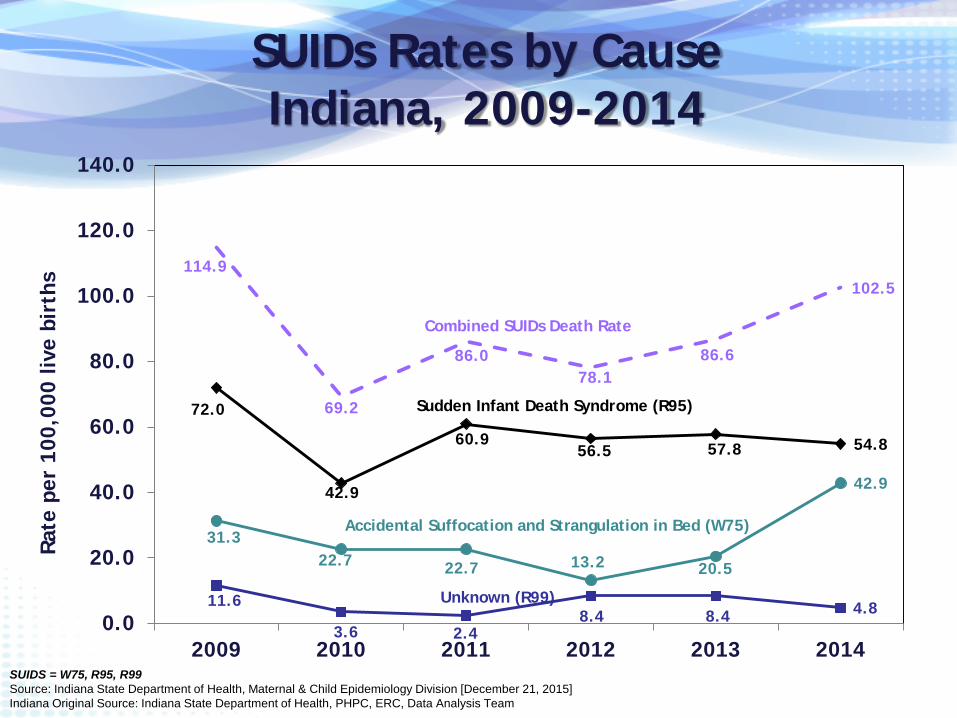
SUIDs Rates by Cause Indiana, 2009-2014
72.0
42.9
60.956.5 57.8 54.8
11.6
3.6 2.48.4 8.4 4.8
31.322.7 22.7 13.2 20.5
42.9
114.9
69.2
86.078.1
86.6
102.5
0.0
20.0
40.0
60.0
80.0
100.0
120.0
140.0
2009 2010 2011 2012 2013 2014
Rate
per
100
,000
live
bir
ths
Combined SUIDs Death Rate
Sudden Infant Death Syndrome (R95)
Accidental Suffocation and Strangulation in Bed (W75)
Unknown (R99)
SUIDS = W75, R95, R99Source: Indiana State Department of Health, Maternal & Child Epidemiology Division [December 21, 2015]Indiana Original Source: Indiana State Department of Health, PHPC, ERC, Data Analysis Team
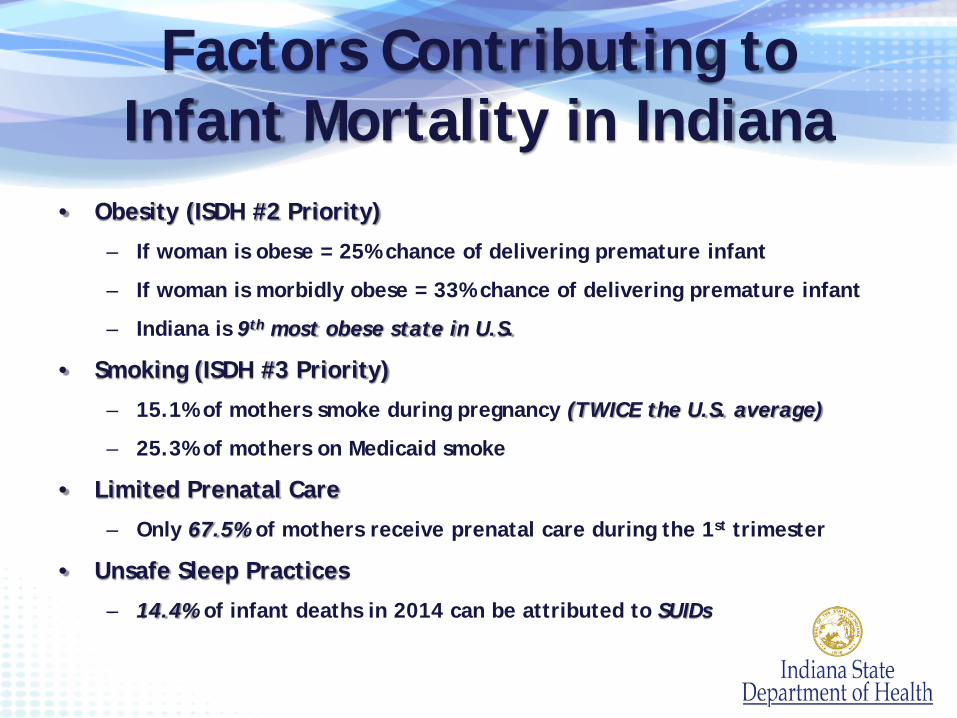
Factors Contributing to Infant Mortality in Indiana
• Obesity (ISDH #2 Priority)
– If woman is obese = 25% chance of delivering premature infant
– If woman is morbidly obese = 33% chance of delivering premature infant
– Indiana is 9th most obese state in U.S.
• Smoking (ISDH #3 Priority)
– 15.1% of mothers smoke during pregnancy (TWICE the U.S. average)
– 25.3% of mothers on Medicaid smoke
• Limited Prenatal Care
– Only 67.5% of mothers receive prenatal care during the 1st trimester
• Unsafe Sleep Practices
– 14.4% of infant deaths in 2014 can be attributed to SUIDs
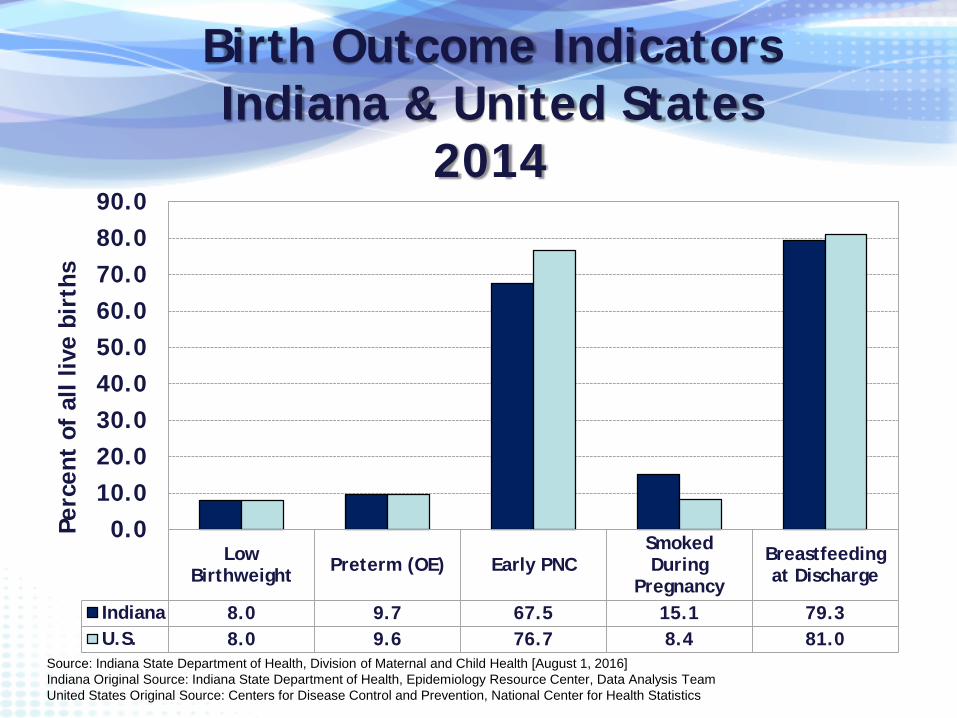
Birth Outcome IndicatorsIndiana & United States
2014
LowBirthweight Preterm (OE) Early PNC
SmokedDuring
Pregnancy
Breastfeedingat Discharge
Indiana 8.0 9.7 67.5 15.1 79.3U.S. 8.0 9.6 76.7 8.4 81.0
0.010.020.030.040.050.060.070.080.090.0
Perc
ent
of a
ll liv
e bi
rths
Source: Indiana State Department of Health, Division of Maternal and Child Health [August 1, 2016]Indiana Original Source: Indiana State Department of Health, Epidemiology Resource Center, Data Analysis TeamUnited States Original Source: Centers for Disease Control and Prevention, National Center for Health Statistics
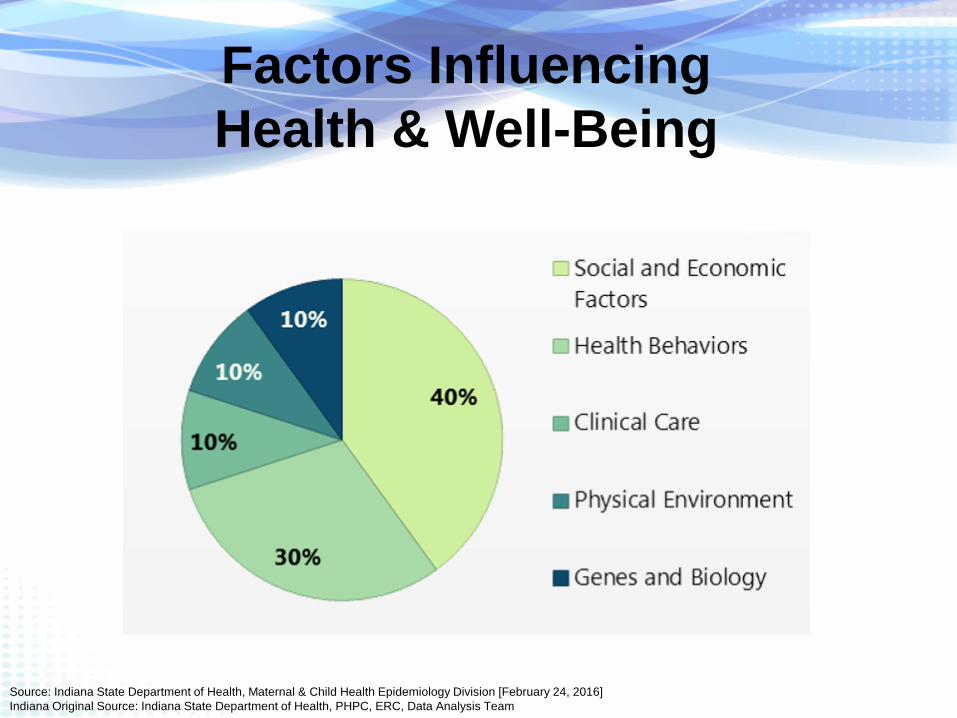
Factors Influencing Health & Well-Being
Source: Indiana State Department of Health, Maternal & Child Health Epidemiology Division [February 24, 2016]Indiana Original Source: Indiana State Department of Health, PHPC, ERC, Data Analysis Team
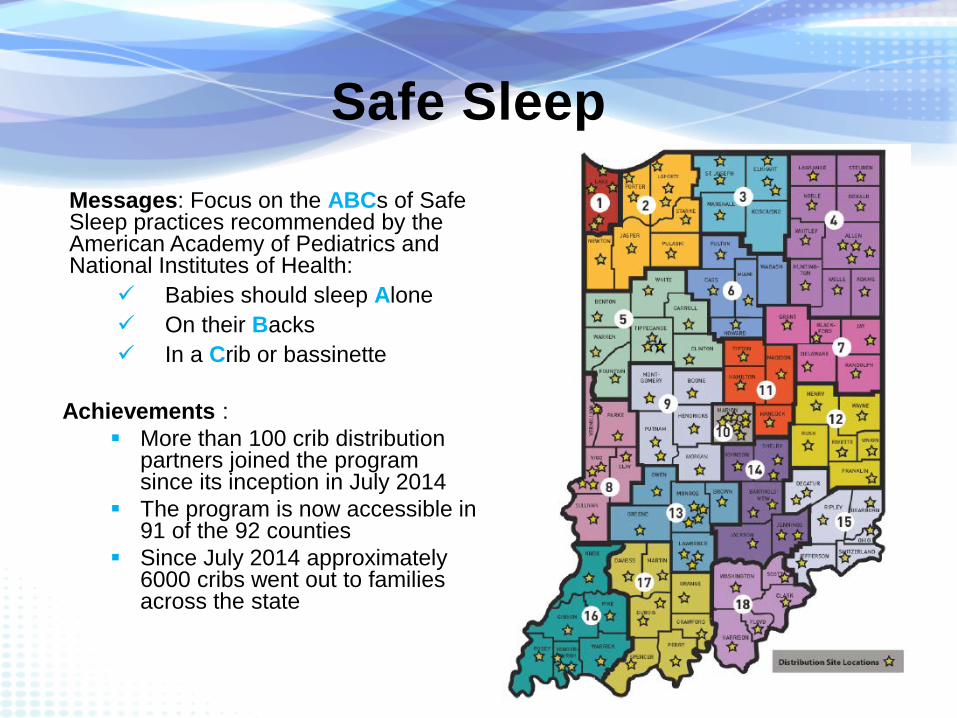
Safe SleepMessages: Focus on the ABCs of Safe Sleep practices recommended by the American Academy of Pediatrics and National Institutes of Health:
Babies should sleep Alone On their Backs In a Crib or bassinette
Achievements : More than 100 crib distribution
partners joined the program since its inception in July 2014
The program is now accessible in 91 of the 92 counties
Since July 2014 approximately 6000 cribs went out to families across the state

Baby and Me, Tobacco Free™
Baby and Me, Tobacco Free™ (BMTF) is an evidenced-based smoking cessation program for pregnant women, through her child’s first birthday
Program Components Individualized education from BMTF certified facilitator 4 sessions prior to baby’s birth Monthly postpartum visits until baby turns 1 Biochemical testing at every visit Provides up to 12 $25 diaper vouchers
Laurie Adams, CEO/Executive Director Baby and Me Tobacco Free Program, Oct 16, 2013 Researched from 2006 – 2009, NY State Department of Health, Bassett Research Institute
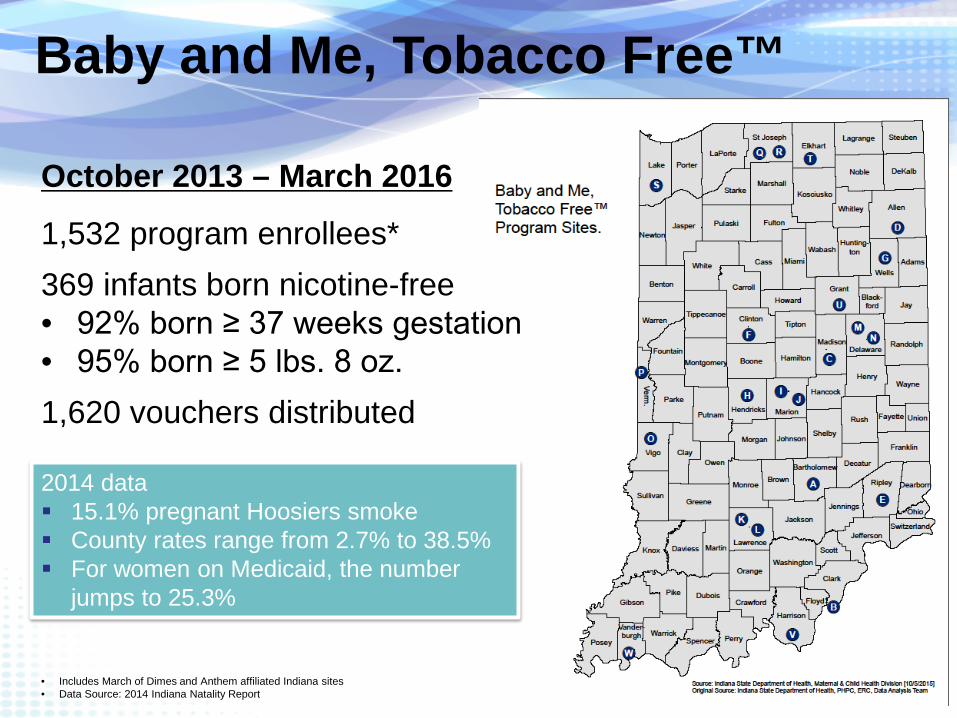
Baby and Me, Tobacco Free™
October 2013 – March 2016
1,532 program enrollees*369 infants born nicotine-free• 92% born ≥ 37 weeks gestation• 95% born ≥ 5 lbs. 8 oz.1,620 vouchers distributed
• Includes March of Dimes and Anthem affiliated Indiana sites• Data Source: 2014 Indiana Natality Report
2014 data 15.1% pregnant Hoosiers smoke County rates range from 2.7% to 38.5% For women on Medicaid, the number
jumps to 25.3%
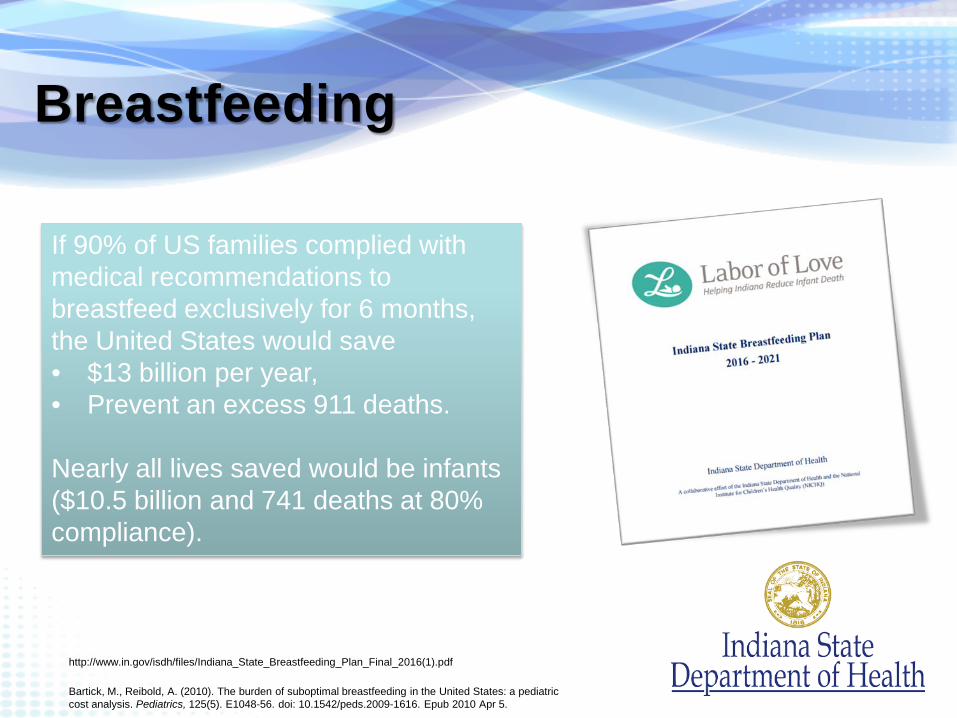
Breastfeeding
If 90% of US families complied with medical recommendations to breastfeed exclusively for 6 months, the United States would save • $13 billion per year, • Prevent an excess 911 deaths.
Nearly all lives saved would be infants ($10.5 billion and 741 deaths at 80% compliance).
Bartick, M., Reibold, A. (2010). The burden of suboptimal breastfeeding in the United States: a pediatric cost analysis. Pediatrics, 125(5). E1048-56. doi: 10.1542/peds.2009-1616. Epub 2010 Apr 5.
http://www.in.gov/isdh/files/Indiana_State_Breastfeeding_Plan_Final_2016(1).pdf
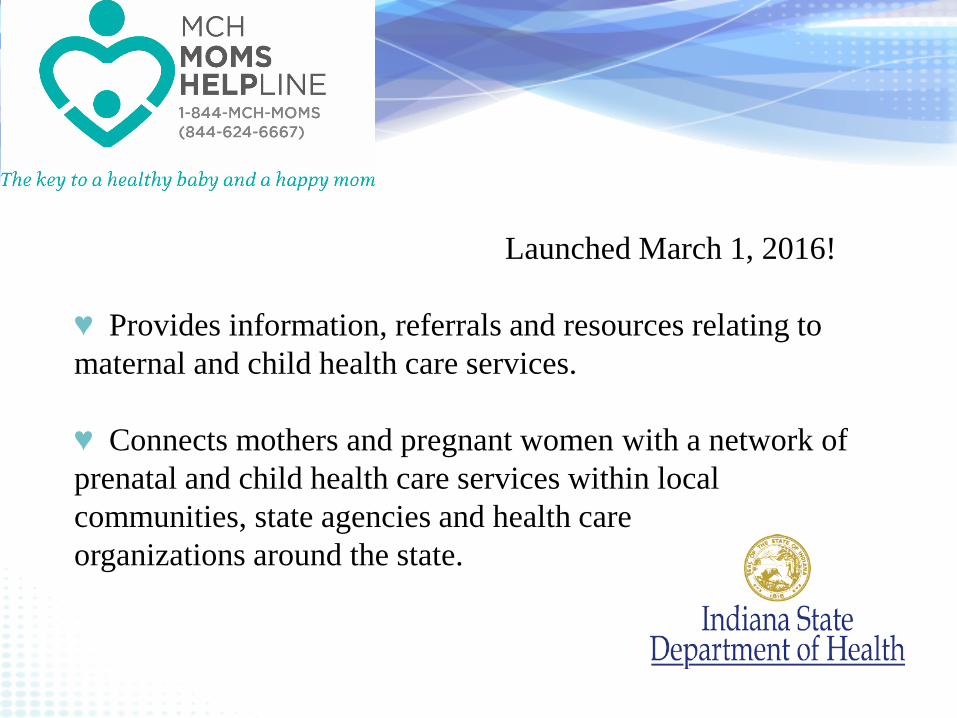
Launched March 1, 2016!
♥ Provides information, referrals and resources relating to maternal and child health care services.
♥ Connects mothers and pregnant women with a network of prenatal and child health care services within local communities, state agencies and health care organizations around the state.
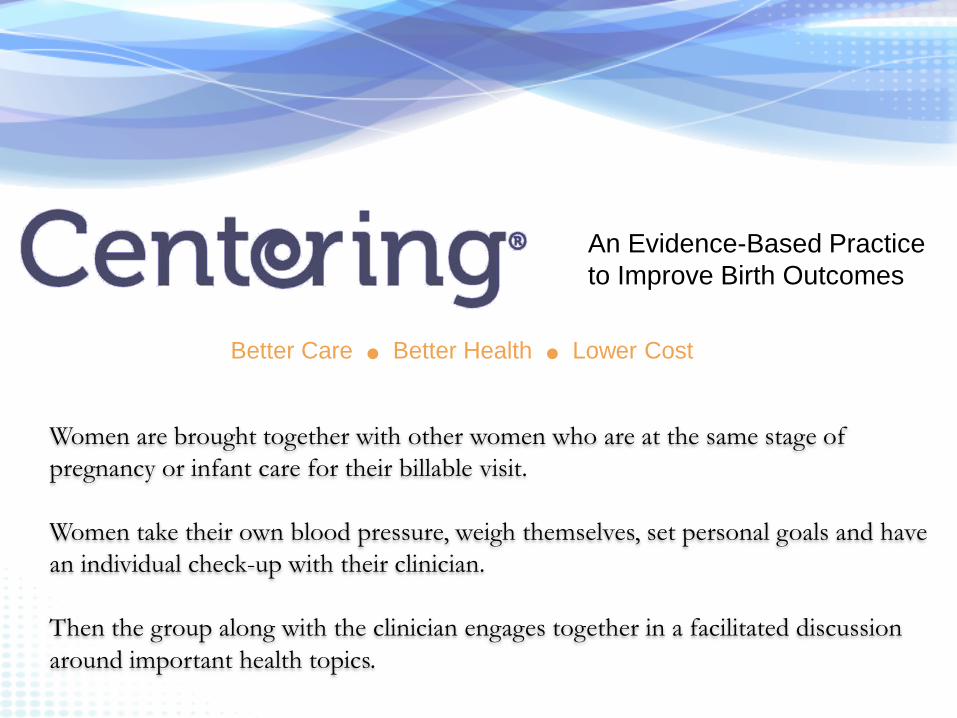
An Evidence-Based Practice to Improve Birth Outcomes
Women are brought together with other women who are at the same stage of pregnancy or infant care for their billable visit.
Women take their own blood pressure, weigh themselves, set personal goals and have an individual check-up with their clinician.
Then the group along with the clinician engages together in a facilitated discussion around important health topics.
Better Care ● Better Health ● Lower Cost

Source: goodwillindy.orgPicture: http://www.nursefamilypartnership.org/First-Time-Moms/Stories-from-moms/Crystal-s-story* Tippecanoe and White Counties funded by IU Health
93% of children age 24 months were fully
immunized
90% of babies were born full term
90% were born at a healthy weight
(≥ 5.5 lbs.)
85% of mothers initiated
breastfeeding
33% of NFP households
had an increase in income and
benefits
Provided in Indiana by Goodwill Industries, NFP began in Marion County in November 2011 and today serves more than 500 families.
The program has expanded to Lake, Delaware, Madison, Tippecanoe, and White Counties*, with a capacity to serve more than 1,000 families.

Pregnancy Risk Assessment Monitoring System (PRAMS)
Awarded to Indiana in May 2016:
PRAMS supplements vital records data by providing data on maternal behaviors and experiences.
PRAMS can be used to plan and assess perinatal health programs, thereby reducing infant mortality and morbidity by guiding policies and programming.
PRAMS is the only surveillance system that provides this type of data about pregnancy and the first few months after birth.
Source: http://www.cdc.gov/prams/aboutprams.htm
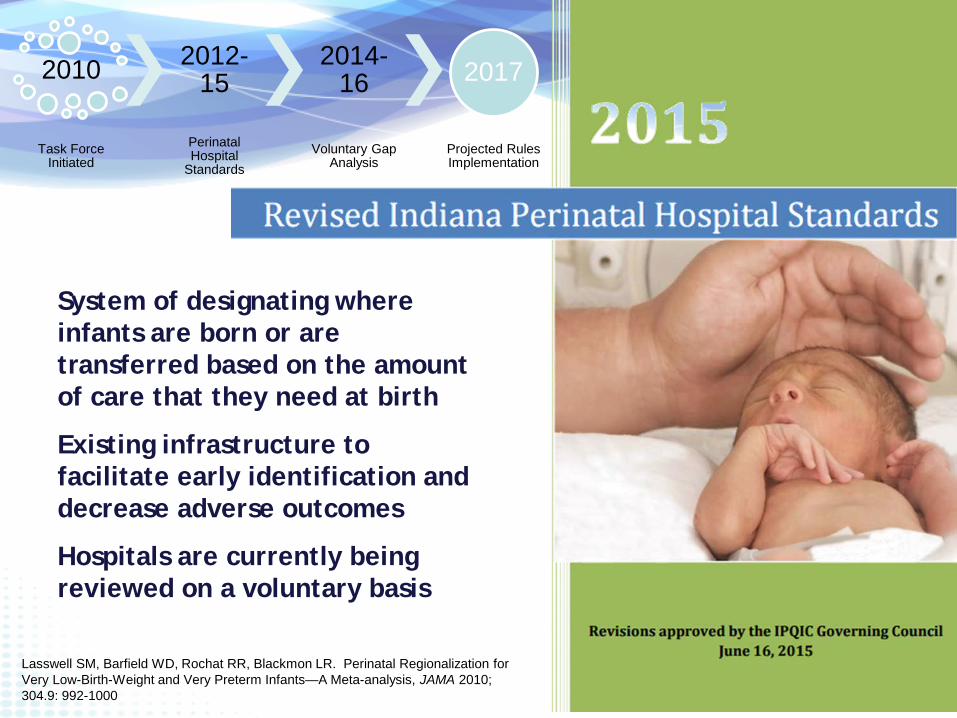
System of designating where infants are born or are transferred based on the amount of care that they need at birth
Existing infrastructure to facilitate early identification and decrease adverse outcomes
Hospitals are currently being reviewed on a voluntary basis
2010
Task Force Initiated
2012-15
Perinatal Hospital
Standards
2014-16
Voluntary Gap Analysis
2017
Projected Rules Implementation
Lasswell SM, Barfield WD, Rochat RR, Blackmon LR. Perinatal Regionalization for Very Low-Birth-Weight and Very Preterm Infants—A Meta-analysis, JAMA 2010; 304.9: 992-1000
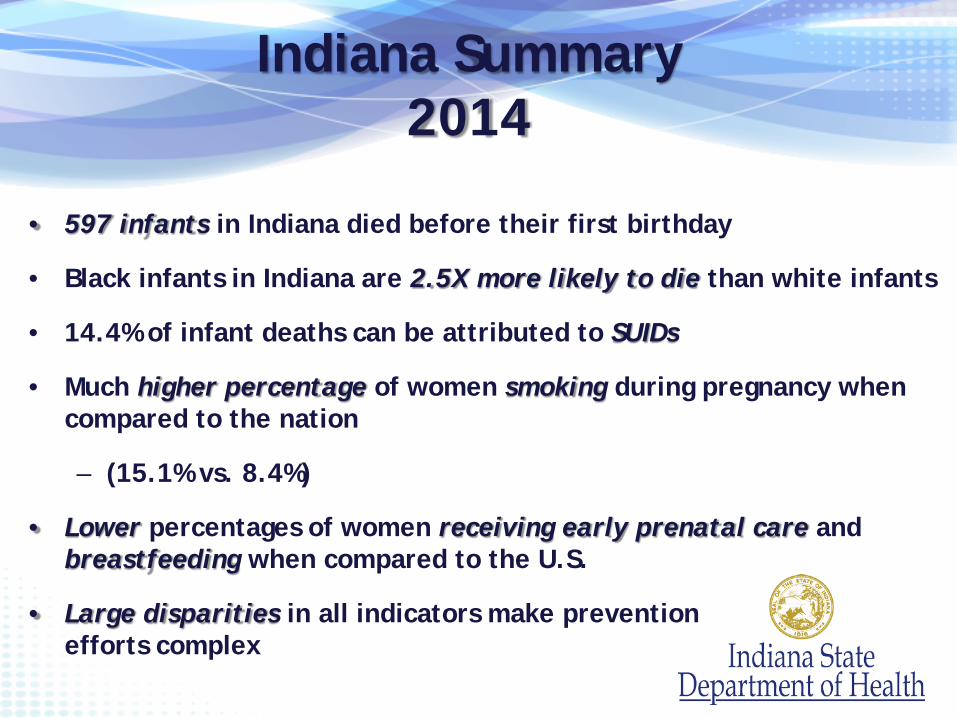
Indiana Summary2014
• 597 infants in Indiana died before their first birthday
• Black infants in Indiana are 2.5X more likely to die than white infants
• 14.4% of infant deaths can be attributed to SUIDs
• Much higher percentage of women smoking during pregnancy when compared to the nation
– (15.1% vs. 8.4%)
• Lower percentages of women receiving early prenatal care and breastfeeding when compared to the U.S.
• Large disparities in all indicators make prevention efforts complex
Questions?• Maternal Health Administrator
– Carolyn Runge
• Infant Mortality Epidemiologist
– Kendra Ham
• Director of Maternal and Child Health
– Martha Allen