Embed Size (px)
Citation preview
Please refer to the important disclosures and analyst certification on inside back cover of this document, or on our website www.macquarie.com.au/disclosures.
INDIA
Inside Solid but slow 3
Demanding valuation: stock selection is key 11
Long-term fundamentals strong 14
What’s ailing rural income growth? 17
Passenger Vehicles: MSIL to lead growth 20
Two-wheelers: cyclical slowdown in demand25
2–wheelers: Changing dynamics 31
CV – too early to play demand recovery 38
Tractors sales – cyclical slowdown in growth44
Growth driver of tractor industry intact 48
Margin outlook – mix & competition to drive 53
Appendices 56
Maruti Suzuki India 60
Tata Motors 72
Mahindra & Mahindra 77
Hero MotoCorp 87
Bajaj Auto 104
Ashok Leyland 121 Analyst(s) Amit Mishra, CFA +91 22 6720 4084 [email protected] Priya Ranjan +91 22 6720 4082 [email protected]
20 April 2012 Macquarie Capital Securities India (Pvt) Ltd
India auto sector Solid but slow Time to recalibrate – Maruti top buy, Bajaj top sell idea While we remain positive on the long-term fundamentals of the Indian auto market, we believe there are significant headwinds to growth and profitability in the near-term. We expect sales growth to slow further in FY13E due to rise in ownership cost, weak sentiment and slower income growth. As stock valuations are not reflecting the near-term challenges; risk-return seems unfavourable. We recommend OP on MSIL and TTMT and a contrarian UP on BJAUT and HMCL.
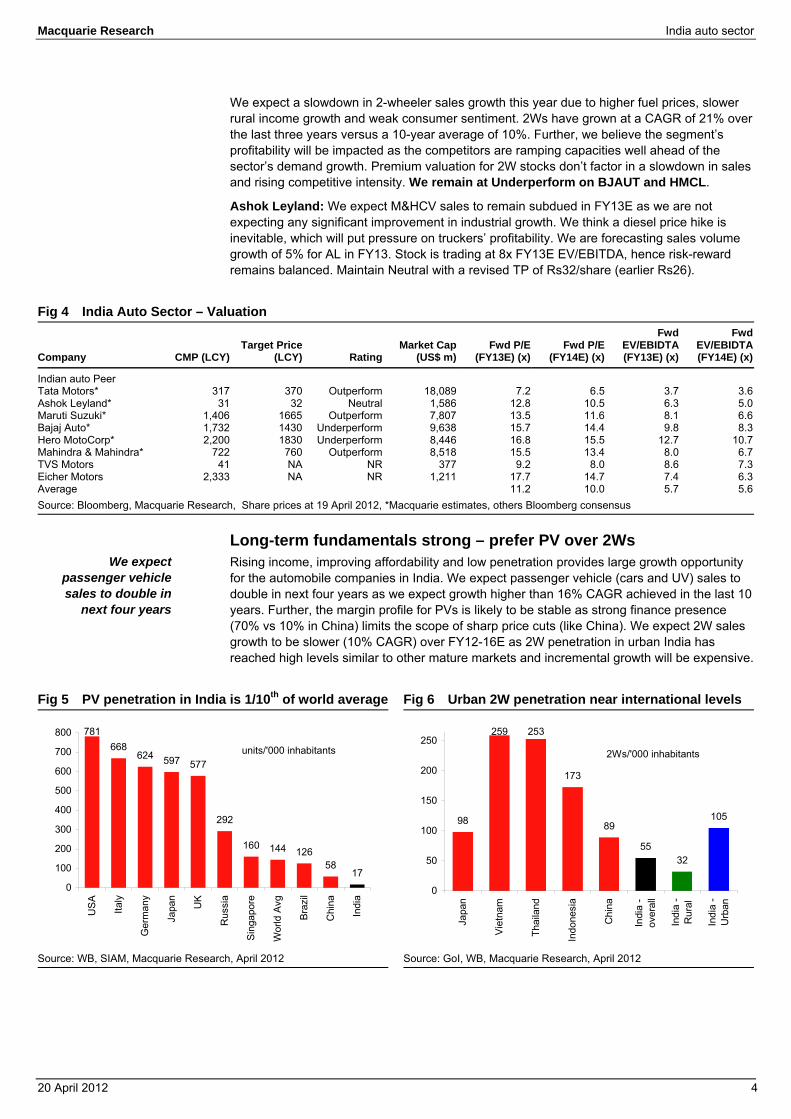
Long-term fundamentals strong – prefer PV over 2Ws Rising income, improving affordability and low penetration provides large growth opportunity for the automobile companies in India. We expect passenger vehicle (cars and UV) sales to double in next four years as we expect growth higher than 16% CAGR achieved in the last 10 years. Further, the margin profile for PVs is likely to be stable as strong finance presence (70% vs 10% in China) limits the scope of sharp price cuts (like China). We expect 2W sales growth to be slower (10% CAGR) over FY12-16E as 2W penetration in urban India has reached high levels similar to other mature markets and incremental growth will be expensive
The year ahead – where is the growth? After two years of 26% growth, auto volume growth slowed to 12% in FY12. We expect a further decline in growth to 10% in FY13E due to slower rural income growth, weak consumer sentiment and high ownership cost (2-7% tax hike, high fuel price). Our analysis of farm income across key states indicates that rural consumption will likely remain subdued in the near-term. We think 5-10% hike in fuel prices is inevitable, which will further delay the pick-up in growth. We don’t expect large interest rate cuts in CY12 that would be enough to boost sentiment.
Competitive intensity to rise in 2Ws – how will Bajaj react? Given the attractive growth opportunity, we are not surprised by the number of new players that are entering the Indian auto market. In the medium-term, we expect competitive intensity to rise most in 2Ws as Honda (3rd largest player) plans to raise production capacity by 60% in the next 12 months and expand sales reach to non-urban markets. Honda will aggressively price its new bike, Dream Yuga, which they claim, offers best fuel-efficiency and power in the segment. Bajaj is vulnerable to competition due to what we believe is a weaker sub-brand in the executive segment (Discover) vs Hero’s (Splendor/ Passion). Further, Hero has a wider distribution reach, while Honda’s reach is similar to Bajaj’s. Segment profitability will depend on how Bajaj responds to the potential market share loss.
Premium valuations not factoring in cyclical slowdown Auto stocks are trading near all-time high multiples and valuation premium to the broader-market. As in the previous cycles, we believe valuation multiples should reflect the volume and margin outlook. We expect multiple de-rating for Bajaj & Hero as volume growth slows, competition intensifies and margin contracts.
MSIL is our top-pick in the sector. We expect earning upgrades to continue as new models (and upgrades) drive growth and favourable mix boost margins. We like TTMT for JLR business, where strong volume momentum is likely to sustain. (Please refer Figure 2 for changes to EPS, TP and recommendations).
Macquarie Research India auto sector
20 April 2012 2
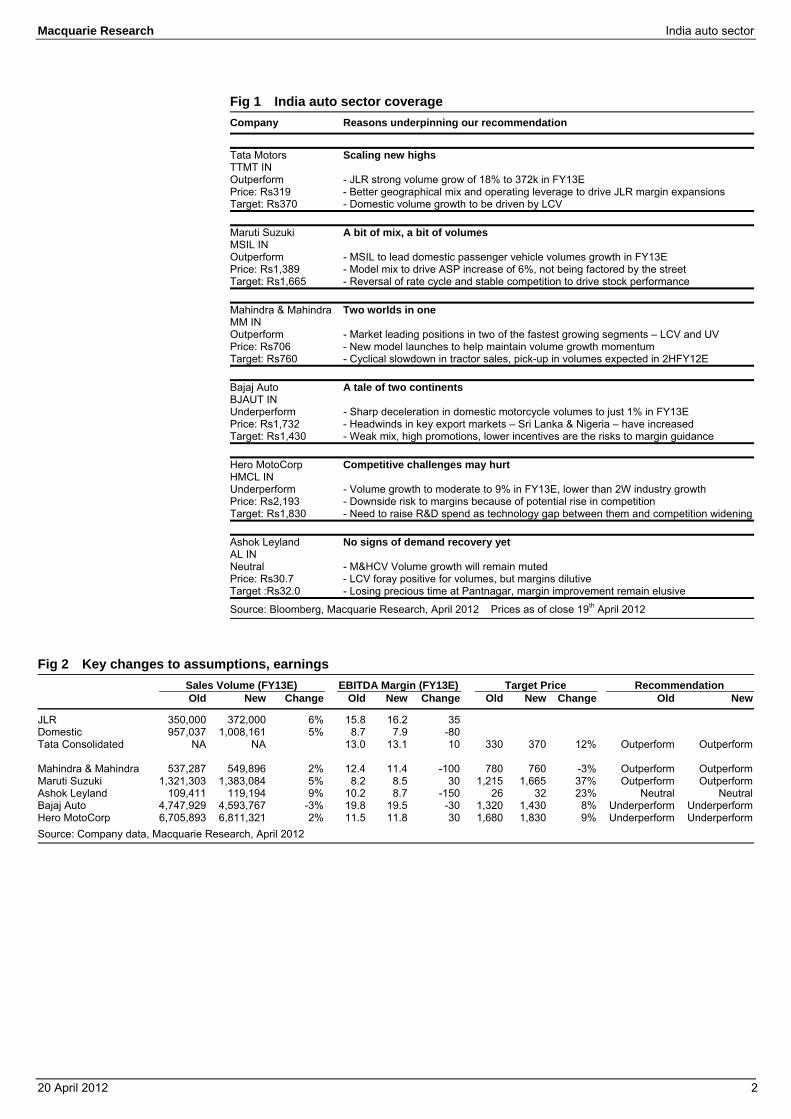
Fig 1 India auto sector coverage Company Reasons underpinning our recommendation Tata Motors Scaling new highs TTMT IN Outperform - JLR strong volume grow of 18% to 372k in FY13E Price: Rs319 - Better geographical mix and operating leverage to drive JLR margin expansions Target: Rs370 - Domestic volume growth to be driven by LCV Maruti Suzuki A bit of mix, a bit of volumes MSIL IN Outperform - MSIL to lead domestic passenger vehicle volumes growth in FY13E Price: Rs1,389 - Model mix to drive ASP increase of 6%, not being factored by the street Target: Rs1,665 - Reversal of rate cycle and stable competition to drive stock performance Mahindra & Mahindra Two worlds in one MM IN Outperform - Market leading positions in two of the fastest growing segments – LCV and UV Price: Rs706 - New model launches to help maintain volume growth momentum Target: Rs760 - Cyclical slowdown in tractor sales, pick-up in volumes expected in 2HFY12E Bajaj Auto A tale of two continents BJAUT IN Underperform - Sharp deceleration in domestic motorcycle volumes to just 1% in FY13E Price: Rs1,732 - Headwinds in key export markets – Sri Lanka & Nigeria – have increased Target: Rs1,430 - Weak mix, high promotions, lower incentives are the risks to margin guidance Hero MotoCorp Competitive challenges may hurt HMCL IN Underperform - Volume growth to moderate to 9% in FY13E, lower than 2W industry growth Price: Rs2,193 - Downside risk to margins because of potential rise in competition Target: Rs1,830 - Need to raise R&D spend as technology gap between them and competition widening Ashok Leyland No signs of demand recovery yet AL IN Neutral - M&HCV Volume growth will remain muted Price: Rs30.7 - LCV foray positive for volumes, but margins dilutive Target :Rs32.0 - Losing precious time at Pantnagar, margin improvement remain elusive
Source: Bloomberg, Macquarie Research, April 2012 Prices as of close 19th April 2012
Fig 2 Key changes to assumptions, earnings Sales Volume (FY13E) EBITDA Margin (FY13E) Target Price Recommendation
Old New Change Old New Change Old New Change Old New
JLR 350,000 372,000 6% 15.8 16.2 35 Domestic 957,037 1,008,161 5% 8.7 7.9 -80 Tata Consolidated NA NA 13.0 13.1 10 330 370 12% Outperform Outperform Mahindra & Mahindra 537,287 549,896 2% 12.4 11.4 -100 780 760 -3% Outperform OutperformMaruti Suzuki 1,321,303 1,383,084 5% 8.2 8.5 30 1,215 1,665 37% Outperform OutperformAshok Leyland 109,411 119,194 9% 10.2 8.7 -150 26 32 23% Neutral NeutralBajaj Auto 4,747,929 4,593,767 -3% 19.8 19.5 -30 1,320 1,430 8% Underperform UnderperformHero MotoCorp 6,705,893 6,811,321 2% 11.5 11.8 30 1,680 1,830 9% Underperform UnderperformSource: Company data, Macquarie Research, April 2012
Macquarie Research India auto sector
20 April 2012 3
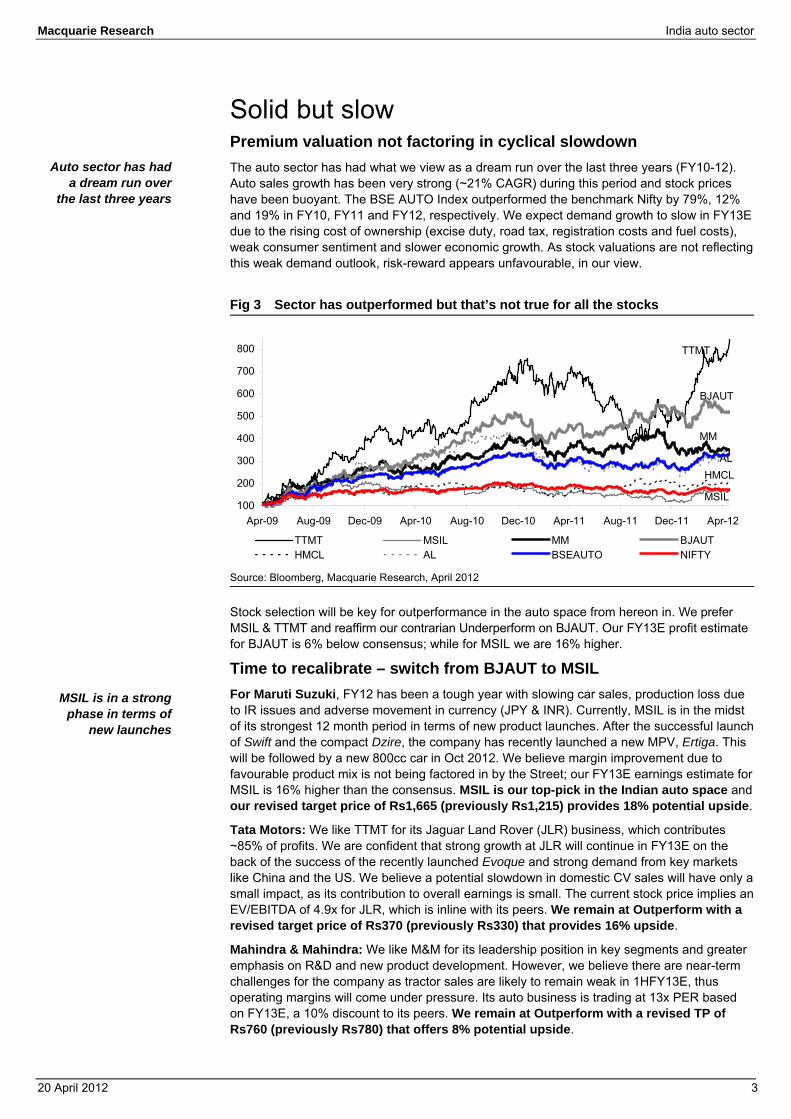
Solid but slow Premium valuation not factoring in cyclical slowdown The auto sector has had what we view as a dream run over the last three years (FY10-12). Auto sales growth has been very strong (~21% CAGR) during this period and stock prices have been buoyant. The BSE AUTO Index outperformed the benchmark Nifty by 79%, 12% and 19% in FY10, FY11 and FY12, respectively. We expect demand growth to slow in FY13E due to the rising cost of ownership (excise duty, road tax, registration costs and fuel costs), weak consumer sentiment and slower economic growth. As stock valuations are not reflecting this weak demand outlook, risk-reward appears unfavourable, in our view.
Fig 3 Sector has outperformed but that’s not true for all the stocks
Source: Bloomberg, Macquarie Research, April 2012
Stock selection will be key for outperformance in the auto space from hereon in. We prefer MSIL & TTMT and reaffirm our contrarian Underperform on BJAUT. Our FY13E profit estimate for BJAUT is 6% below consensus; while for MSIL we are 16% higher.
Time to recalibrate – switch from BJAUT to MSIL For Maruti Suzuki, FY12 has been a tough year with slowing car sales, production loss due to IR issues and adverse movement in currency (JPY & INR). Currently, MSIL is in the midst of its strongest 12 month period in terms of new product launches. After the successful launch of Swift and the compact Dzire, the company has recently launched a new MPV, Ertiga. This will be followed by a new 800cc car in Oct 2012. We believe margin improvement due to favourable product mix is not being factored in by the Street; our FY13E earnings estimate for MSIL is 16% higher than the consensus. MSIL is our top-pick in the Indian auto space and our revised target price of Rs1,665 (previously Rs1,215) provides 18% potential upside.
Tata Motors: We like TTMT for its Jaguar Land Rover (JLR) business, which contributes ~85% of profits. We are confident that strong growth at JLR will continue in FY13E on the back of the success of the recently launched Evoque and strong demand from key markets like China and the US. We believe a potential slowdown in domestic CV sales will have only a small impact, as its contribution to overall earnings is small. The current stock price implies an EV/EBITDA of 4.9x for JLR, which is inline with its peers. We remain at Outperform with a revised target price of Rs370 (previously Rs330) that provides 16% upside.
Mahindra & Mahindra: We like M&M for its leadership position in key segments and greater emphasis on R&D and new product development. However, we believe there are near-term challenges for the company as tractor sales are likely to remain weak in 1HFY13E, thus operating margins will come under pressure. Its auto business is trading at 13x PER based on FY13E, a 10% discount to its peers. We remain at Outperform with a revised TP of Rs760 (previously Rs780) that offers 8% potential upside.
100
200
300
400
500
600
700
800
Apr-09 Aug-09 Dec-09 Apr-10 Aug-10 Dec-10 Apr-11 Aug-11 Dec-11 Apr-12
TTMT MSIL MM BJAUTHMCL AL BSEAUTO NIFTY
TTMT
BJAUT
MM
ALHMCL
MSIL
Auto sector has had a dream run over
the last three years
MSIL is in a strong phase in terms of
new launches
Macquarie Research India auto sector
20 April 2012 4
We expect a slowdown in 2-wheeler sales growth this year due to higher fuel prices, slower rural income growth and weak consumer sentiment. 2Ws have grown at a CAGR of 21% over the last three years versus a 10-year average of 10%. Further, we believe the segment’s profitability will be impacted as the competitors are ramping capacities well ahead of the sector’s demand growth. Premium valuation for 2W stocks don’t factor in a slowdown in sales and rising competitive intensity. We remain at Underperform on BJAUT and HMCL.
Ashok Leyland: We expect M&HCV sales to remain subdued in FY13E as we are not expecting any significant improvement in industrial growth. We think a diesel price hike is inevitable, which will put pressure on truckers’ profitability. We are forecasting sales volume growth of 5% for AL in FY13. Stock is trading at 8x FY13E EV/EBITDA, hence risk-reward remains balanced. Maintain Neutral with a revised TP of Rs32/share (earlier Rs26).
Fig 4 India Auto Sector – Valuation
Company CMP (LCY) Target Price
(LCY) RatingMarket Cap
(US$ m)Fwd P/E
(FY13E) (x)Fwd P/E
(FY14E) (x)
FwdEV/EBIDTA(FY13E) (x)
FwdEV/EBIDTA(FY14E) (x)
Indian auto Peer Tata Motors* 317 370 Outperform 18,089 7.2 6.5 3.7 3.6Ashok Leyland* 31 32 Neutral 1,586 12.8 10.5 6.3 5.0Maruti Suzuki* 1,406 1665 Outperform 7,807 13.5 11.6 8.1 6.6Bajaj Auto* 1,732 1430 Underperform 9,638 15.7 14.4 9.8 8.3Hero MotoCorp* 2,200 1830 Underperform 8,446 16.8 15.5 12.7 10.7Mahindra & Mahindra* 722 760 Outperform 8,518 15.5 13.4 8.0 6.7TVS Motors 41 NA NR 377 9.2 8.0 8.6 7.3Eicher Motors 2,333 NA NR 1,211 17.7 14.7 7.4 6.3Average 11.2 10.0 5.7 5.6Source: Bloomberg, Macquarie Research, Share prices at 19 April 2012, *Macquarie estimates, others Bloomberg consensus
Long-term fundamentals strong – prefer PV over 2Ws Rising income, improving affordability and low penetration provides large growth opportunity for the automobile companies in India. We expect passenger vehicle (cars and UV) sales to double in next four years as we expect growth higher than 16% CAGR achieved in the last 10 years. Further, the margin profile for PVs is likely to be stable as strong finance presence (70% vs 10% in China) limits the scope of sharp price cuts (like China). We expect 2W sales growth to be slower (10% CAGR) over FY12-16E as 2W penetration in urban India has reached high levels similar to other mature markets and incremental growth will be expensive.
Fig 5 PV penetration in India is 1/10th of world average Fig 6 Urban 2W penetration near international levels
Source: WB, SIAM, Macquarie Research, April 2012 Source: GoI, WB, Macquarie Research, April 2012
781668
624 597 577
292
160 144 12658
170
100
200
300
400
500
600
700
800
US
A
Italy
Ger
man
y
Japa
n
UK
Rus
sia
Sin
gapo
re
Wor
ld A
vg
Bra
zil
Chi
na
Indi
a
units/'000 inhabitants
98
259 253
173
89
5532
105
0
50
100
150
200
250
Japa
n
Vie
tnam
Thai
land
Indo
nesi
a
Chi
na
Indi
a -
over
all
Indi
a -
Rur
al
Indi
a -
Urb
an
2Ws/'000 inhabitants
We expect passenger vehicle sales to double in
next four years
Macquarie Research India auto sector
20 April 2012 5
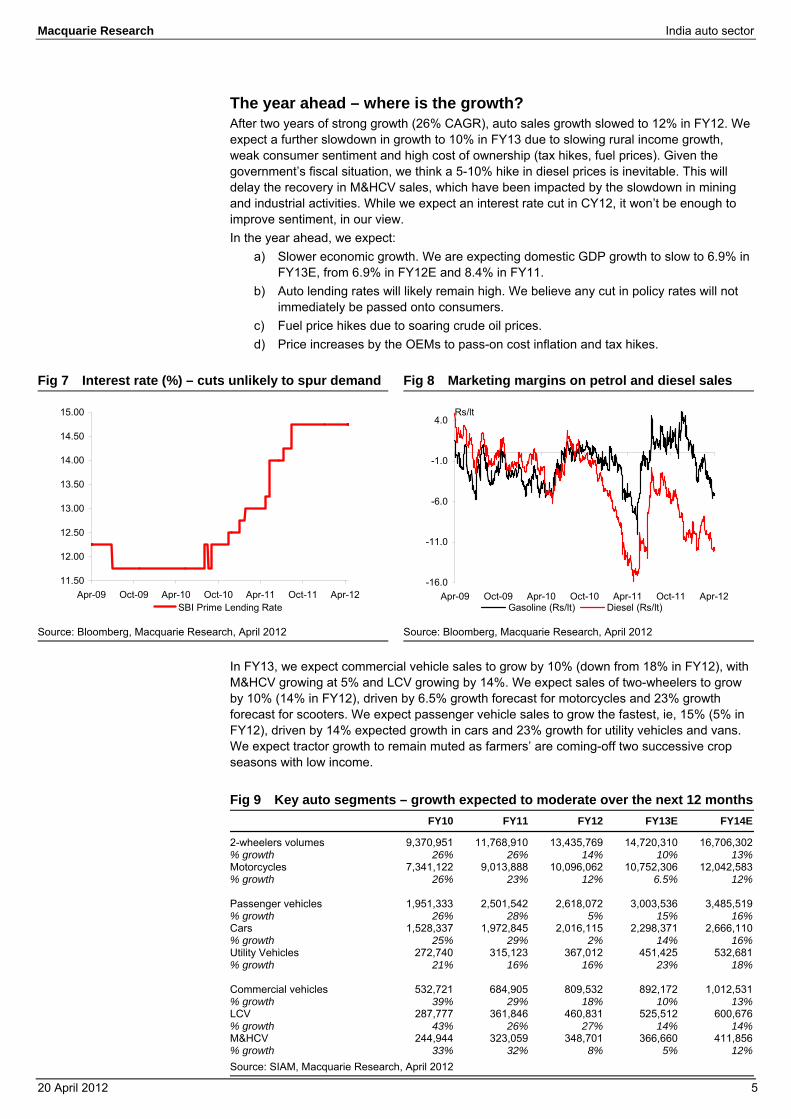
The year ahead – where is the growth? After two years of strong growth (26% CAGR), auto sales growth slowed to 12% in FY12. We expect a further slowdown in growth to 10% in FY13 due to slowing rural income growth, weak consumer sentiment and high cost of ownership (tax hikes, fuel prices). Given the government’s fiscal situation, we think a 5-10% hike in diesel prices is inevitable. This will delay the recovery in M&HCV sales, which have been impacted by the slowdown in mining and industrial activities. While we expect an interest rate cut in CY12, it won’t be enough to improve sentiment, in our view. In the year ahead, we expect:
a) Slower economic growth. We are expecting domestic GDP growth to slow to 6.9% in FY13E, from 6.9% in FY12E and 8.4% in FY11.
b) Auto lending rates will likely remain high. We believe any cut in policy rates will not immediately be passed onto consumers.
c) Fuel price hikes due to soaring crude oil prices. d) Price increases by the OEMs to pass-on cost inflation and tax hikes.
Fig 7 Interest rate (%) – cuts unlikely to spur demand Fig 8 Marketing margins on petrol and diesel sales
Source: Bloomberg, Macquarie Research, April 2012 Source: Bloomberg, Macquarie Research, April 2012
In FY13, we expect commercial vehicle sales to grow by 10% (down from 18% in FY12), with M&HCV growing at 5% and LCV growing by 14%. We expect sales of two-wheelers to grow by 10% (14% in FY12), driven by 6.5% growth forecast for motorcycles and 23% growth forecast for scooters. We expect passenger vehicle sales to grow the fastest, ie, 15% (5% in FY12), driven by 14% expected growth in cars and 23% growth for utility vehicles and vans. We expect tractor growth to remain muted as farmers’ are coming-off two successive crop seasons with low income.
Fig 9 Key auto segments – growth expected to moderate over the next 12 months FY10 FY11 FY12 FY13E FY14E
2-wheelers volumes 9,370,951 11,768,910 13,435,769 14,720,310 16,706,302% growth 26% 26% 14% 10% 13%Motorcycles 7,341,122 9,013,888 10,096,062 10,752,306 12,042,583% growth 26% 23% 12% 6.5% 12% Passenger vehicles 1,951,333 2,501,542 2,618,072 3,003,536 3,485,519% growth 26% 28% 5% 15% 16%Cars 1,528,337 1,972,845 2,016,115 2,298,371 2,666,110% growth 25% 29% 2% 14% 16%Utility Vehicles 272,740 315,123 367,012 451,425 532,681% growth 21% 16% 16% 23% 18% Commercial vehicles 532,721 684,905 809,532 892,172 1,012,531% growth 39% 29% 18% 10% 13%LCV 287,777 361,846 460,831 525,512 600,676% growth 43% 26% 27% 14% 14%M&HCV 244,944 323,059 348,701 366,660 411,856% growth 33% 32% 8% 5% 12%Source: SIAM, Macquarie Research, April 2012
11.50
12.00
12.50
13.00
13.50
14.00
14.50
15.00
Apr-09 Oct-09 Apr-10 Oct-10 Apr-11 Oct-11 Apr-12SBI Prime Lending Rate
-16.0
-11.0
-6.0
-1.0
4.0
Apr-09 Oct-09 Apr-10 Oct-10 Apr-11 Oct-11 Apr-12
Rs/lt
Gasoline (Rs/lt) Diesel (Rs/lt)
Macquarie Research India auto sector
20 April 2012 6
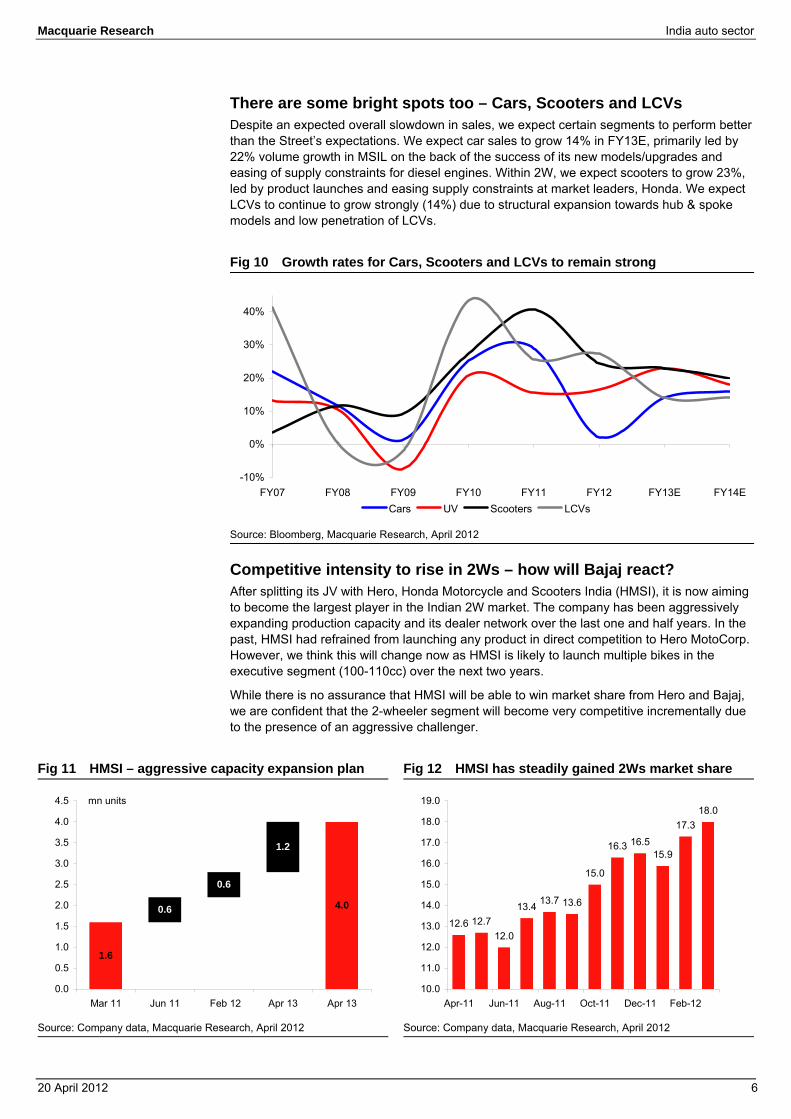
There are some bright spots too – Cars, Scooters and LCVs Despite an expected overall slowdown in sales, we expect certain segments to perform better than the Street’s expectations. We expect car sales to grow 14% in FY13E, primarily led by 22% volume growth in MSIL on the back of the success of its new models/upgrades and easing of supply constraints for diesel engines. Within 2W, we expect scooters to grow 23%, led by product launches and easing supply constraints at market leaders, Honda. We expect LCVs to continue to grow strongly (14%) due to structural expansion towards hub & spoke models and low penetration of LCVs.
Fig 10 Growth rates for Cars, Scooters and LCVs to remain strong
Source: Bloomberg, Macquarie Research, April 2012
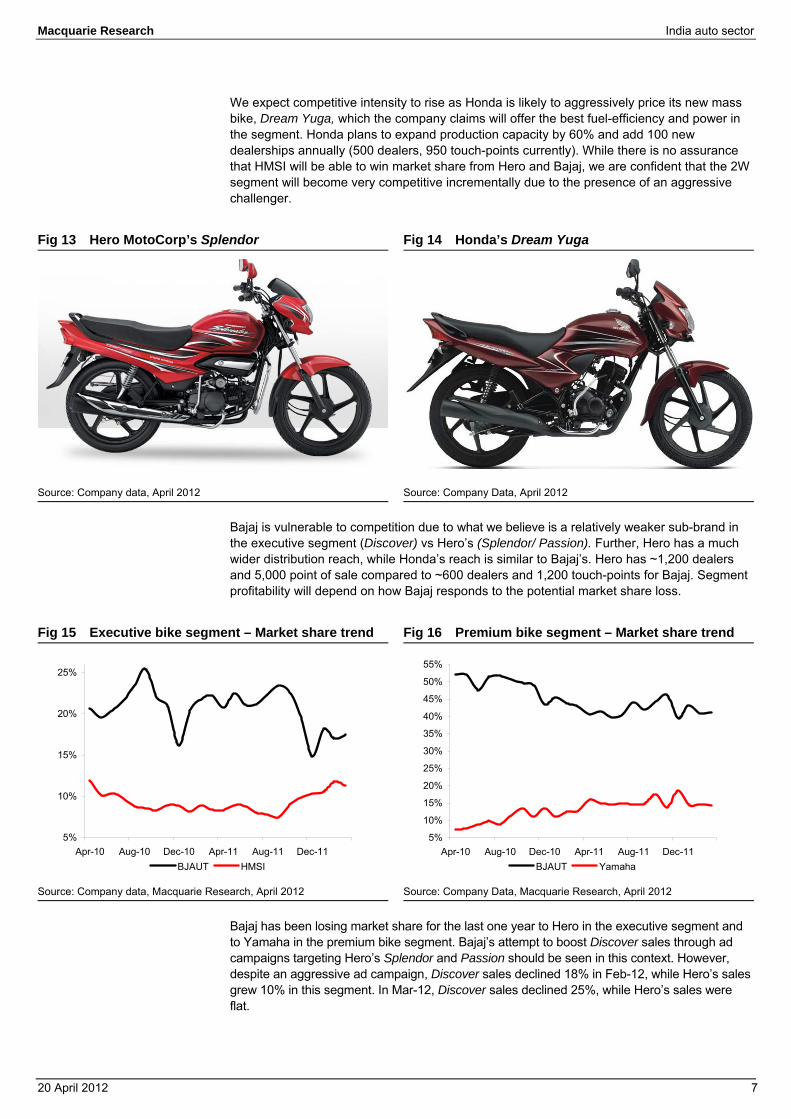
Competitive intensity to rise in 2Ws – how will Bajaj react? After splitting its JV with Hero, Honda Motorcycle and Scooters India (HMSI), it is now aiming to become the largest player in the Indian 2W market. The company has been aggressively expanding production capacity and its dealer network over the last one and half years. In the past, HMSI had refrained from launching any product in direct competition to Hero MotoCorp. However, we think this will change now as HMSI is likely to launch multiple bikes in the executive segment (100-110cc) over the next two years.
While there is no assurance that HMSI will be able to win market share from Hero and Bajaj, we are confident that the 2-wheeler segment will become very competitive incrementally due to the presence of an aggressive challenger.
Fig 11 HMSI – aggressive capacity expansion plan Fig 12 HMSI has steadily gained 2Ws market share
Source: Company data, Macquarie Research, April 2012 Source: Company data, Macquarie Research, April 2012
-10%
0%
10%
20%
30%
40%
FY07 FY08 FY09 FY10 FY11 FY12 FY13E FY14ECars UV Scooters LCVs
1.6
4.00.6
0.6
1.2
0.0
0.5
1.0
1.5
2.0
2.5
3.0
3.5
4.0
4.5
Mar 11 Jun 11 Feb 12 Apr 13 Apr 13
mn units
12.6 12.712.0
13.4 13.7 13.6
15.0
16.3 16.515.9
17.318.0
10.0
11.0
12.0
13.0
14.0
15.0
16.0
17.0
18.0
19.0
Apr-11 Jun-11 Aug-11 Oct-11 Dec-11 Feb-12
Macquarie Research India auto sector
20 April 2012 7
We expect competitive intensity to rise as Honda is likely to aggressively price its new mass bike, Dream Yuga, which the company claims will offer the best fuel-efficiency and power in the segment. Honda plans to expand production capacity by 60% and add 100 new dealerships annually (500 dealers, 950 touch-points currently). While there is no assurance that HMSI will be able to win market share from Hero and Bajaj, we are confident that the 2W segment will become very competitive incrementally due to the presence of an aggressive challenger.
Fig 13 Hero MotoCorp’s Splendor Fig 14 Honda’s Dream Yuga
Source: Company data, April 2012 Source: Company Data, April 2012
Bajaj is vulnerable to competition due to what we believe is a relatively weaker sub-brand in the executive segment (Discover) vs Hero’s (Splendor/ Passion). Further, Hero has a much wider distribution reach, while Honda’s reach is similar to Bajaj’s. Hero has ~1,200 dealers and 5,000 point of sale compared to ~600 dealers and 1,200 touch-points for Bajaj. Segment profitability will depend on how Bajaj responds to the potential market share loss.
Fig 15 Executive bike segment – Market share trend Fig 16 Premium bike segment – Market share trend
Source: Company data, Macquarie Research, April 2012 Source: Company Data, Macquarie Research, April 2012
Bajaj has been losing market share for the last one year to Hero in the executive segment and to Yamaha in the premium bike segment. Bajaj’s attempt to boost Discover sales through ad campaigns targeting Hero’s Splendor and Passion should be seen in this context. However, despite an aggressive ad campaign, Discover sales declined 18% in Feb-12, while Hero’s sales grew 10% in this segment. In Mar-12, Discover sales declined 25%, while Hero’s sales were flat.
5%
10%
15%
20%
25%
Apr-10 Aug-10 Dec-10 Apr-11 Aug-11 Dec-11BJAUT HMSI
5%
10%
15%
20%
25%
30%
35%
40%
45%
50%
55%
Apr-10 Aug-10 Dec-10 Apr-11 Aug-11 Dec-11BJAUT Yamaha
Macquarie Research India auto sector
20 April 2012 8
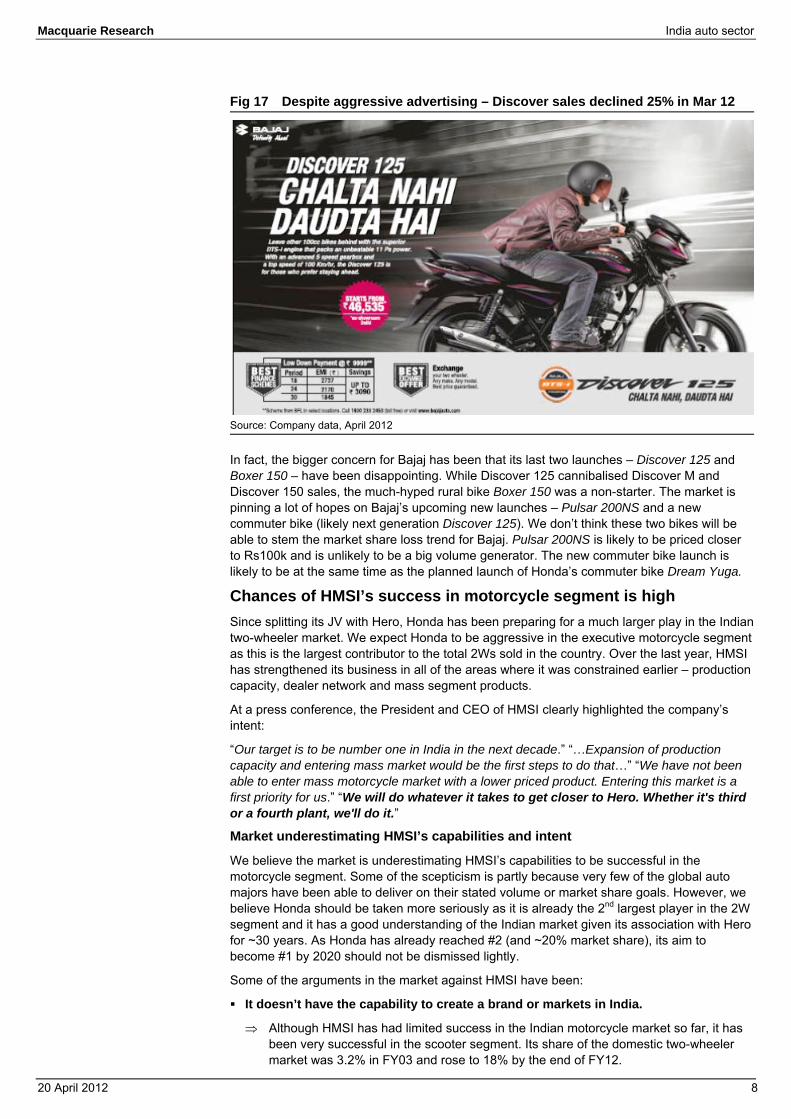
Fig 17 Despite aggressive advertising – Discover sales declined 25% in Mar 12
Source: Company data, April 2012
In fact, the bigger concern for Bajaj has been that its last two launches – Discover 125 and Boxer 150 – have been disappointing. While Discover 125 cannibalised Discover M and Discover 150 sales, the much-hyped rural bike Boxer 150 was a non-starter. The market is pinning a lot of hopes on Bajaj’s upcoming new launches – Pulsar 200NS and a new commuter bike (likely next generation Discover 125). We don’t think these two bikes will be able to stem the market share loss trend for Bajaj. Pulsar 200NS is likely to be priced closer to Rs100k and is unlikely to be a big volume generator. The new commuter bike launch is likely to be at the same time as the planned launch of Honda’s commuter bike Dream Yuga.
Chances of HMSI’s success in motorcycle segment is high Since splitting its JV with Hero, Honda has been preparing for a much larger play in the Indian two-wheeler market. We expect Honda to be aggressive in the executive motorcycle segment as this is the largest contributor to the total 2Ws sold in the country. Over the last year, HMSI has strengthened its business in all of the areas where it was constrained earlier – production capacity, dealer network and mass segment products.
At a press conference, the President and CEO of HMSI clearly highlighted the company’s intent:
“Our target is to be number one in India in the next decade.” “…Expansion of production capacity and entering mass market would be the first steps to do that…” “We have not been able to enter mass motorcycle market with a lower priced product. Entering this market is a first priority for us.” “We will do whatever it takes to get closer to Hero. Whether it's third or a fourth plant, we'll do it.”
Market underestimating HMSI’s capabilities and intent
We believe the market is underestimating HMSI’s capabilities to be successful in the motorcycle segment. Some of the scepticism is partly because very few of the global auto majors have been able to deliver on their stated volume or market share goals. However, we believe Honda should be taken more seriously as it is already the 2nd largest player in the 2W segment and it has a good understanding of the Indian market given its association with Hero for ~30 years. As Honda has already reached #2 (and ~20% market share), its aim to become #1 by 2020 should not be dismissed lightly.
Some of the arguments in the market against HMSI have been:
It doesn’t have the capability to create a brand or markets in India.
⇒ Although HMSI has had limited success in the Indian motorcycle market so far, it has been very successful in the scooter segment. Its share of the domestic two-wheeler market was 3.2% in FY03 and rose to 18% by the end of FY12.
Macquarie Research India auto sector
20 April 2012 9
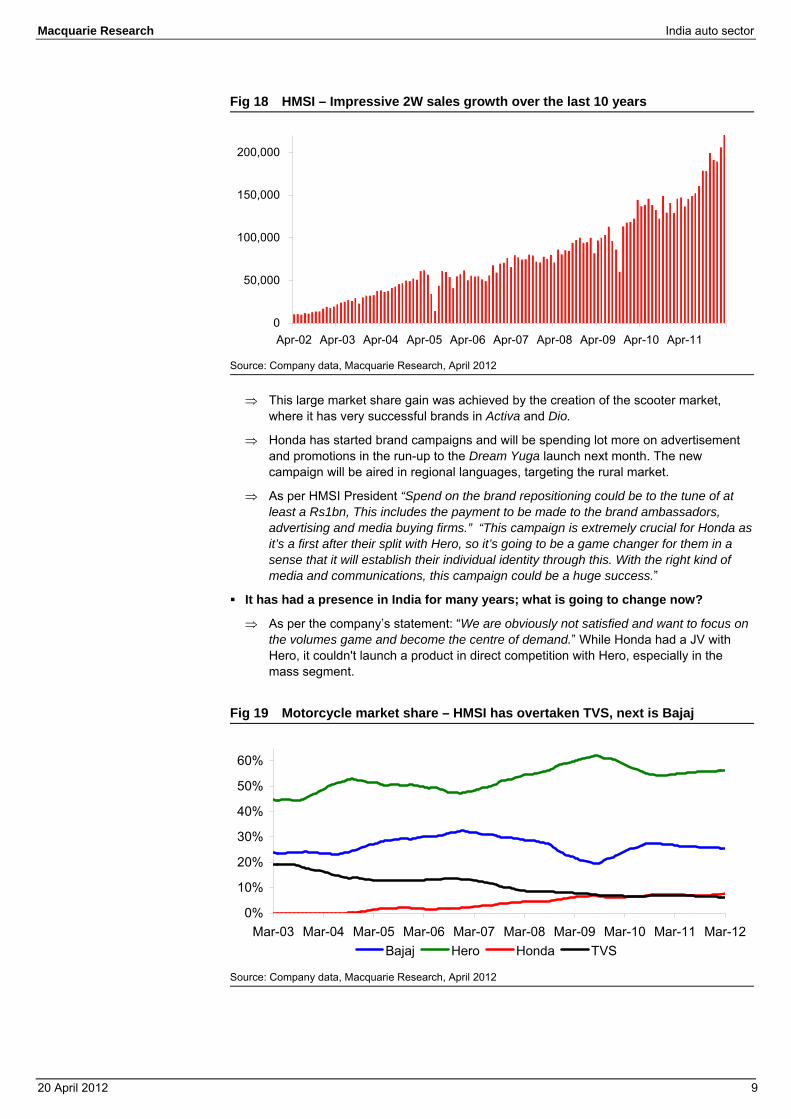
Fig 18 HMSI – Impressive 2W sales growth over the last 10 years
Source: Company data, Macquarie Research, April 2012
⇒ This large market share gain was achieved by the creation of the scooter market, where it has very successful brands in Activa and Dio.
⇒ Honda has started brand campaigns and will be spending lot more on advertisement and promotions in the run-up to the Dream Yuga launch next month. The new campaign will be aired in regional languages, targeting the rural market.
⇒ As per HMSI President “Spend on the brand repositioning could be to the tune of at least a Rs1bn, This includes the payment to be made to the brand ambassadors, advertising and media buying firms.” “This campaign is extremely crucial for Honda as it’s a first after their split with Hero, so it’s going to be a game changer for them in a sense that it will establish their individual identity through this. With the right kind of media and communications, this campaign could be a huge success.”
It has had a presence in India for many years; what is going to change now?
⇒ As per the company’s statement: “We are obviously not satisfied and want to focus on the volumes game and become the centre of demand.” While Honda had a JV with Hero, it couldn't launch a product in direct competition with Hero, especially in the mass segment.
Fig 19 Motorcycle market share – HMSI has overtaken TVS, next is Bajaj
Source: Company data, Macquarie Research, April 2012
0
50,000
100,000
150,000
200,000
Apr-02 Apr-03 Apr-04 Apr-05 Apr-06 Apr-07 Apr-08 Apr-09 Apr-10 Apr-11
0%
10%
20%
30%
40%
50%
60%
Mar-03 Mar-04 Mar-05 Mar-06 Mar-07 Mar-08 Mar-09 Mar-10 Mar-11 Mar-12Bajaj Hero Honda TVS
Macquarie Research India auto sector
20 April 2012 10
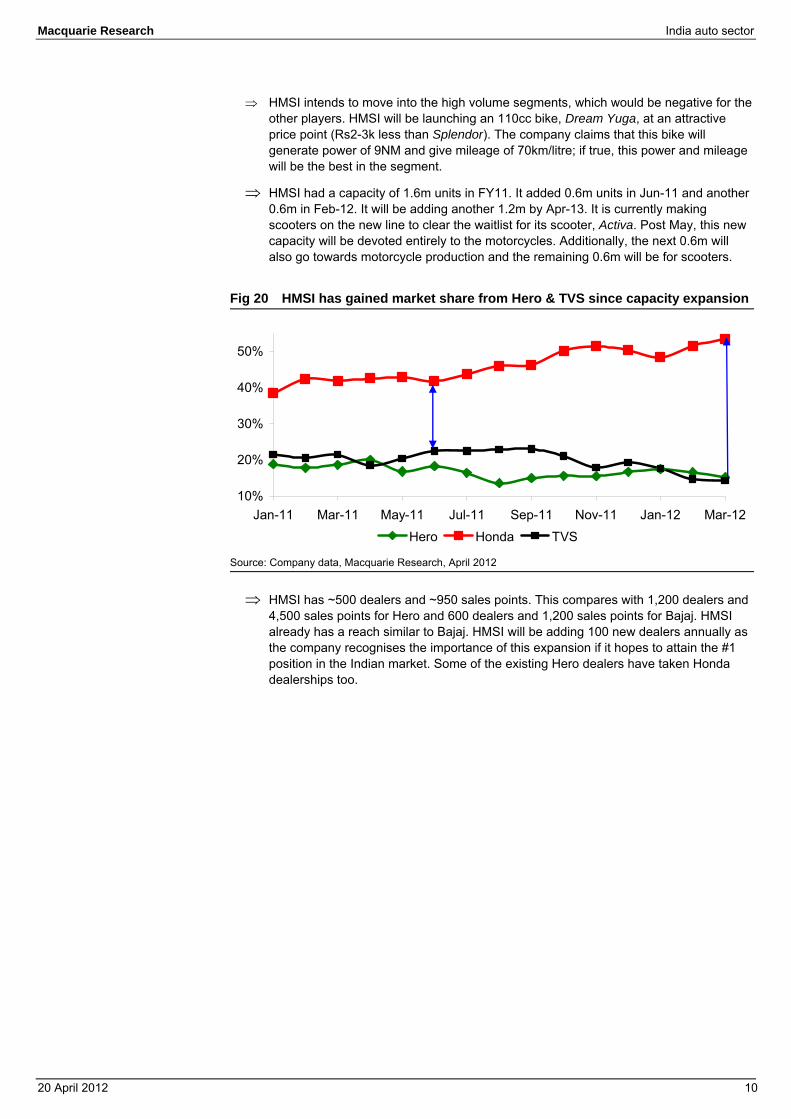
⇒ HMSI intends to move into the high volume segments, which would be negative for the other players. HMSI will be launching an 110cc bike, Dream Yuga, at an attractive price point (Rs2-3k less than Splendor). The company claims that this bike will generate power of 9NM and give mileage of 70km/litre; if true, this power and mileage will be the best in the segment.
⇒ HMSI had a capacity of 1.6m units in FY11. It added 0.6m units in Jun-11 and another 0.6m in Feb-12. It will be adding another 1.2m by Apr-13. It is currently making scooters on the new line to clear the waitlist for its scooter, Activa. Post May, this new capacity will be devoted entirely to the motorcycles. Additionally, the next 0.6m will also go towards motorcycle production and the remaining 0.6m will be for scooters.
Fig 20 HMSI has gained market share from Hero & TVS since capacity expansion
Source: Company data, Macquarie Research, April 2012
⇒ HMSI has ~500 dealers and ~950 sales points. This compares with 1,200 dealers and 4,500 sales points for Hero and 600 dealers and 1,200 sales points for Bajaj. HMSI already has a reach similar to Bajaj. HMSI will be adding 100 new dealers annually as the company recognises the importance of this expansion if it hopes to attain the #1 position in the Indian market. Some of the existing Hero dealers have taken Honda dealerships too.
10%
20%
30%
40%
50%
Jan-11 Mar-11 May-11 Jul-11 Sep-11 Nov-11 Jan-12 Mar-12
Hero Honda TVS
Macquarie Research India auto sector
20 April 2012 11
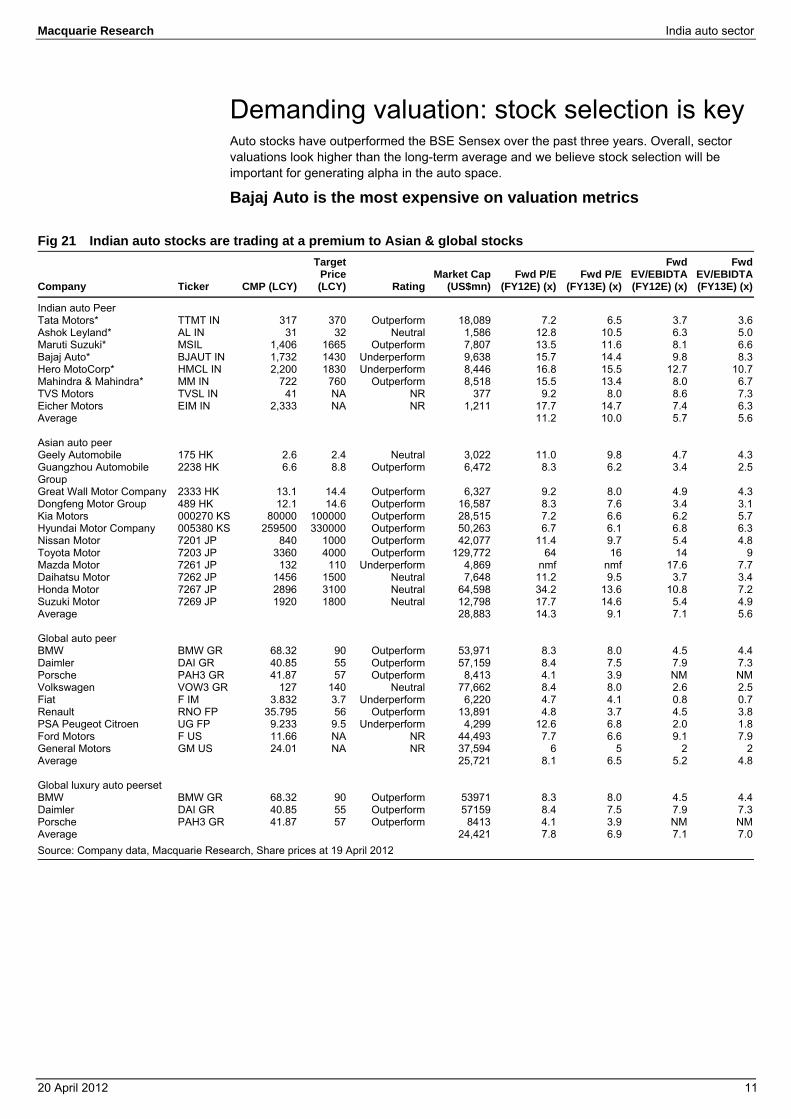
Demanding valuation: stock selection is key Auto stocks have outperformed the BSE Sensex over the past three years. Overall, sector valuations look higher than the long-term average and we believe stock selection will be important for generating alpha in the auto space.
Bajaj Auto is the most expensive on valuation metrics
Fig 21 Indian auto stocks are trading at a premium to Asian & global stocks
Company Ticker CMP (LCY)
Target Price (LCY) Rating
Market Cap (US$mn)
Fwd P/E (FY12E) (x)
Fwd P/E (FY13E) (x)
Fwd EV/EBIDTA (FY12E) (x)
Fwd EV/EBIDTA (FY13E) (x)
Indian auto Peer Tata Motors* TTMT IN 317 370 Outperform 18,089 7.2 6.5 3.7 3.6Ashok Leyland* AL IN 31 32 Neutral 1,586 12.8 10.5 6.3 5.0Maruti Suzuki* MSIL 1,406 1665 Outperform 7,807 13.5 11.6 8.1 6.6Bajaj Auto* BJAUT IN 1,732 1430 Underperform 9,638 15.7 14.4 9.8 8.3Hero MotoCorp* HMCL IN 2,200 1830 Underperform 8,446 16.8 15.5 12.7 10.7Mahindra & Mahindra* MM IN 722 760 Outperform 8,518 15.5 13.4 8.0 6.7TVS Motors TVSL IN 41 NA NR 377 9.2 8.0 8.6 7.3Eicher Motors EIM IN 2,333 NA NR 1,211 17.7 14.7 7.4 6.3Average 11.2 10.0 5.7 5.6 Asian auto peer Geely Automobile 175 HK 2.6 2.4 Neutral 3,022 11.0 9.8 4.7 4.3Guangzhou Automobile Group
2238 HK 6.6 8.8 Outperform 6,472 8.3 6.2 3.4 2.5
Great Wall Motor Company 2333 HK 13.1 14.4 Outperform 6,327 9.2 8.0 4.9 4.3Dongfeng Motor Group 489 HK 12.1 14.6 Outperform 16,587 8.3 7.6 3.4 3.1Kia Motors 000270 KS 80000 100000 Outperform 28,515 7.2 6.6 6.2 5.7Hyundai Motor Company 005380 KS 259500 330000 Outperform 50,263 6.7 6.1 6.8 6.3Nissan Motor 7201 JP 840 1000 Outperform 42,077 11.4 9.7 5.4 4.8Toyota Motor 7203 JP 3360 4000 Outperform 129,772 64 16 14 9Mazda Motor 7261 JP 132 110 Underperform 4,869 nmf nmf 17.6 7.7Daihatsu Motor 7262 JP 1456 1500 Neutral 7,648 11.2 9.5 3.7 3.4Honda Motor 7267 JP 2896 3100 Neutral 64,598 34.2 13.6 10.8 7.2Suzuki Motor 7269 JP 1920 1800 Neutral 12,798 17.7 14.6 5.4 4.9Average 28,883 14.3 9.1 7.1 5.6 Global auto peer BMW BMW GR 68.32 90 Outperform 53,971 8.3 8.0 4.5 4.4Daimler DAI GR 40.85 55 Outperform 57,159 8.4 7.5 7.9 7.3Porsche PAH3 GR 41.87 57 Outperform 8,413 4.1 3.9 NM NMVolkswagen VOW3 GR 127 140 Neutral 77,662 8.4 8.0 2.6 2.5Fiat F IM 3.832 3.7 Underperform 6,220 4.7 4.1 0.8 0.7Renault RNO FP 35.795 56 Outperform 13,891 4.8 3.7 4.5 3.8PSA Peugeot Citroen UG FP 9.233 9.5 Underperform 4,299 12.6 6.8 2.0 1.8Ford Motors F US 11.66 NA NR 44,493 7.7 6.6 9.1 7.9General Motors GM US 24.01 NA NR 37,594 6 5 2 2Average 25,721 8.1 6.5 5.2 4.8 Global luxury auto peerset BMW BMW GR 68.32 90 Outperform 53971 8.3 8.0 4.5 4.4Daimler DAI GR 40.85 55 Outperform 57159 8.4 7.5 7.9 7.3Porsche PAH3 GR 41.87 57 Outperform 8413 4.1 3.9 NM NMAverage 24,421 7.8 6.9 7.1 7.0Source: Company data, Macquarie Research, Share prices at 19 April 2012
Macquarie Research India auto sector
20 April 2012 12
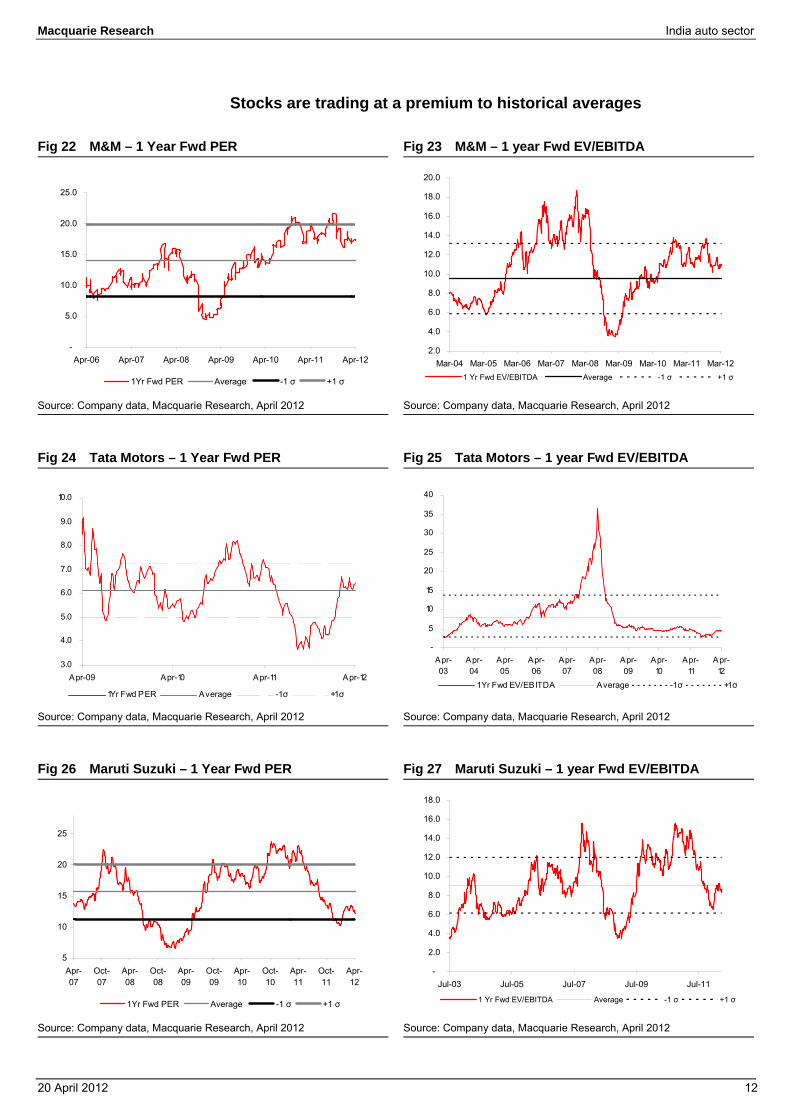
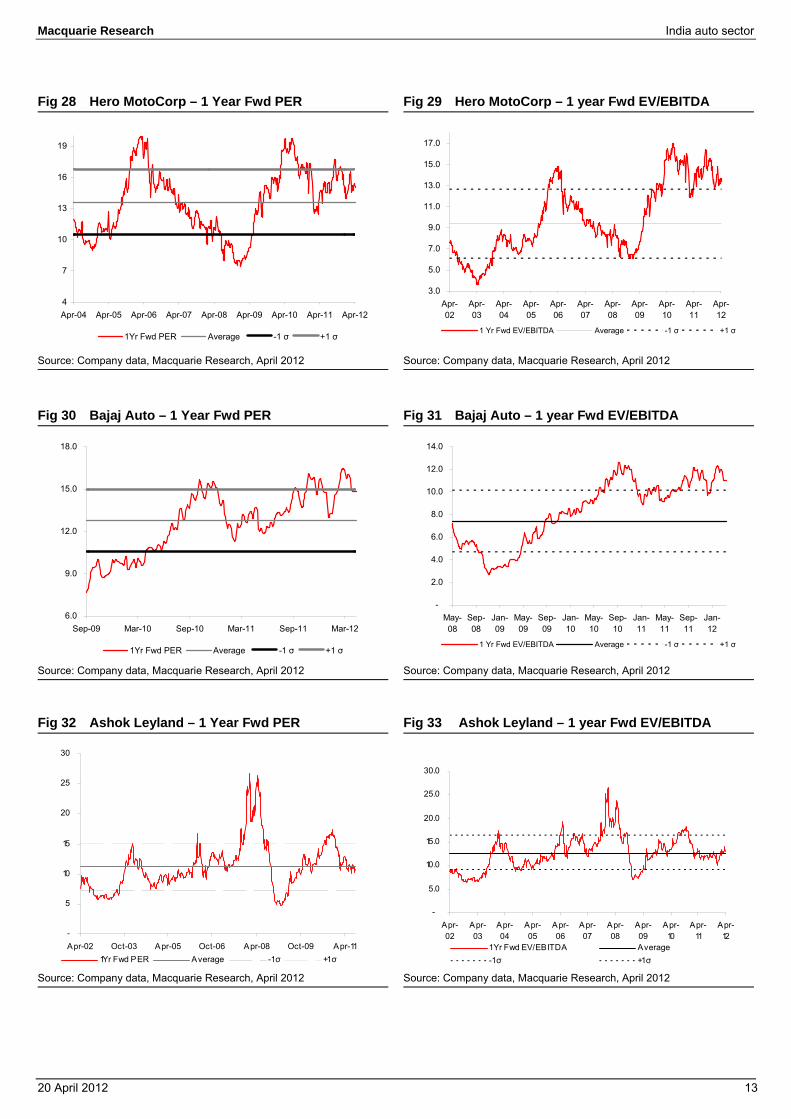
Stocks are trading at a premium to historical averages
Fig 22 M&M – 1 Year Fwd PER Fig 23 M&M – 1 year Fwd EV/EBITDA
Source: Company data, Macquarie Research, April 2012 Source: Company data, Macquarie Research, April 2012
Fig 24 Tata Motors – 1 Year Fwd PER Fig 25 Tata Motors – 1 year Fwd EV/EBITDA
Source: Company data, Macquarie Research, April 2012 Source: Company data, Macquarie Research, April 2012
Fig 26 Maruti Suzuki – 1 Year Fwd PER Fig 27 Maruti Suzuki – 1 year Fwd EV/EBITDA
Source: Company data, Macquarie Research, April 2012 Source: Company data, Macquarie Research, April 2012
-
5.0
10.0
15.0
20.0
25.0
Apr-06 Apr-07 Apr-08 Apr-09 Apr-10 Apr-11 Apr-12
1Yr Fwd PER Average -1 σ +1 σ
2.0
4.0
6.0
8.0
10.0
12.0
14.0
16.0
18.0
20.0
Mar-04 Mar-05 Mar-06 Mar-07 Mar-08 Mar-09 Mar-10 Mar-11 Mar-121 Yr Fwd EV/EBITDA Average -1 σ +1 σ
3.0
4.0
5.0
6.0
7.0
8.0
9.0
10.0
Apr-09 Apr-10 Apr-11 Apr-12
1Yr Fwd PER Average -1 σ +1 σ
-
5
10
15
20
25
30
35
40
Apr-03
Apr-04
Apr-05
Apr-06
Apr-07
Apr-08
Apr-09
Apr-10
Apr-11
Apr-12
1 Yr Fwd EV/EBITDA Average -1 σ +1 σ
5
10
15
20
25
Apr-07
Oct-07
Apr-08
Oct-08
Apr-09
Oct-09
Apr-10
Oct-10
Apr-11
Oct-11
Apr-12
1Yr Fwd PER Average -1 σ +1 σ
-
2.0
4.0
6.0
8.0
10.0
12.0
14.0
16.0
18.0
Jul-03 Jul-05 Jul-07 Jul-09 Jul-11
1 Yr Fwd EV/EBITDA Average -1 σ +1 σ
Macquarie Research India auto sector
20 April 2012 13
Fig 28 Hero MotoCorp – 1 Year Fwd PER Fig 29 Hero MotoCorp – 1 year Fwd EV/EBITDA
Source: Company data, Macquarie Research, April 2012 Source: Company data, Macquarie Research, April 2012
Fig 30 Bajaj Auto – 1 Year Fwd PER Fig 31 Bajaj Auto – 1 year Fwd EV/EBITDA
Source: Company data, Macquarie Research, April 2012 Source: Company data, Macquarie Research, April 2012
Fig 32 Ashok Leyland – 1 Year Fwd PER Fig 33 Ashok Leyland – 1 year Fwd EV/EBITDA
Source: Company data, Macquarie Research, April 2012 Source: Company data, Macquarie Research, April 2012
4
7
10
13
16
19
Apr-04 Apr-05 Apr-06 Apr-07 Apr-08 Apr-09 Apr-10 Apr-11 Apr-12
1Yr Fwd PER Average -1 σ +1 σ
3.0
5.0
7.0
9.0
11.0
13.0
15.0
17.0
Apr-02
Apr-03
Apr-04
Apr-05
Apr-06
Apr-07
Apr-08
Apr-09
Apr-10
Apr-11
Apr-12
1 Yr Fwd EV/EBITDA Average -1 σ +1 σ
6.0
9.0
12.0
15.0
18.0
Sep-09 Mar-10 Sep-10 Mar-11 Sep-11 Mar-12
1Yr Fwd PER Average -1 σ +1 σ
-
2.0
4.0
6.0
8.0
10.0
12.0
14.0
May-08
Sep-08
Jan-09
May-09
Sep-09
Jan-10
May-10
Sep-10
Jan-11
May-11
Sep-11
Jan-12
1 Yr Fwd EV/EBITDA Average -1 σ +1 σ
-
5
10
15
20
25
30
Apr-02 Oct-03 Apr-05 Oct-06 Apr-08 Oct-09 Apr-111Yr Fwd PER Average -1 σ +1 σ
-
5.0
10.0
15.0
20.0
25.0
30.0
Apr-02
Apr-03
Apr-04
Apr-05
Apr-06
Apr-07
Apr-08
Apr-09
Apr-10
Apr-11
Apr-12
1 Yr Fwd EV/EBITDA Average-1 σ +1 σ
Macquarie Research India auto sector
20 April 2012 14
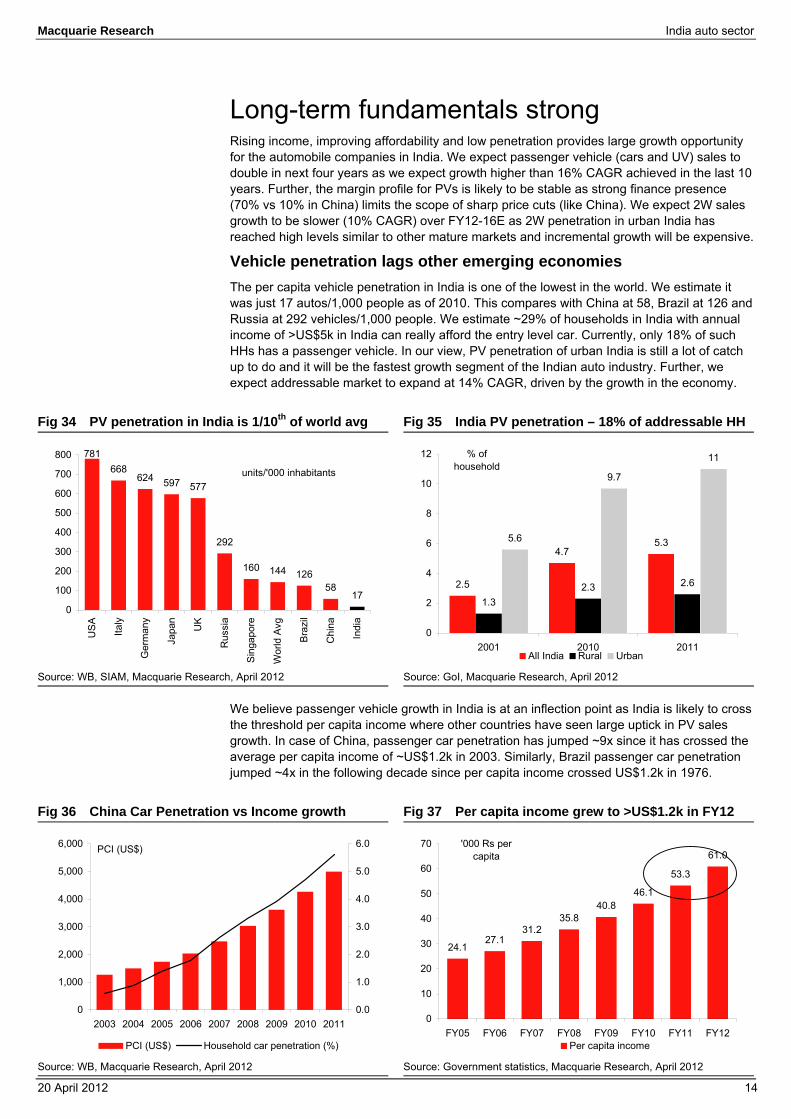
Long-term fundamentals strong Rising income, improving affordability and low penetration provides large growth opportunity for the automobile companies in India. We expect passenger vehicle (cars and UV) sales to double in next four years as we expect growth higher than 16% CAGR achieved in the last 10 years. Further, the margin profile for PVs is likely to be stable as strong finance presence (70% vs 10% in China) limits the scope of sharp price cuts (like China). We expect 2W sales growth to be slower (10% CAGR) over FY12-16E as 2W penetration in urban India has reached high levels similar to other mature markets and incremental growth will be expensive.
Vehicle penetration lags other emerging economies The per capita vehicle penetration in India is one of the lowest in the world. We estimate it was just 17 autos/1,000 people as of 2010. This compares with China at 58, Brazil at 126 and Russia at 292 vehicles/1,000 people. We estimate ~29% of households in India with annual income of >US$5k in India can really afford the entry level car. Currently, only 18% of such HHs has a passenger vehicle. In our view, PV penetration of urban India is still a lot of catch up to do and it will be the fastest growth segment of the Indian auto industry. Further, we expect addressable market to expand at 14% CAGR, driven by the growth in the economy.
Fig 34 PV penetration in India is 1/10th of world avg Fig 35 India PV penetration – 18% of addressable HH
Source: WB, SIAM, Macquarie Research, April 2012 Source: GoI, Macquarie Research, April 2012
We believe passenger vehicle growth in India is at an inflection point as India is likely to cross the threshold per capita income where other countries have seen large uptick in PV sales growth. In case of China, passenger car penetration has jumped ~9x since it has crossed the average per capita income of ~US$1.2k in 2003. Similarly, Brazil passenger car penetration jumped ~4x in the following decade since per capita income crossed US$1.2k in 1976.
Fig 36 China Car Penetration vs Income growth Fig 37 Per capita income grew to >US$1.2k in FY12
Source: WB, Macquarie Research, April 2012 Source: Government statistics, Macquarie Research, April 2012
781668
624 597 577
292
160 144 12658
170
100
200
300
400
500
600
700
800
US
A
Italy
Ger
man
y
Japa
n
UK
Rus
sia
Sin
gapo
re
Wor
ld A
vg
Bra
zil
Chi
na
Indi
a
units/'000 inhabitants
2.5
4.75.3
1.32.3 2.6
5.6
9.7
11
0
2
4
6
8
10
12
2001 2010 2011
% of household
All India Rural Urban
0
1,000
2,000
3,000
4,000
5,000
6,000
2003 2004 2005 2006 2007 2008 2009 2010 2011
PCI (US$)
0.0
1.0
2.0
3.0
4.0
5.0
6.0
PCI (US$) Household car penetration (%)
24.127.1
31.235.8
40.846.1
53.3
61.0
0
10
20
30
40
50
60
70
FY05 FY06 FY07 FY08 FY09 FY10 FY11 FY12
'000 Rs per capita
Per capita income
Macquarie Research India auto sector
20 April 2012 15
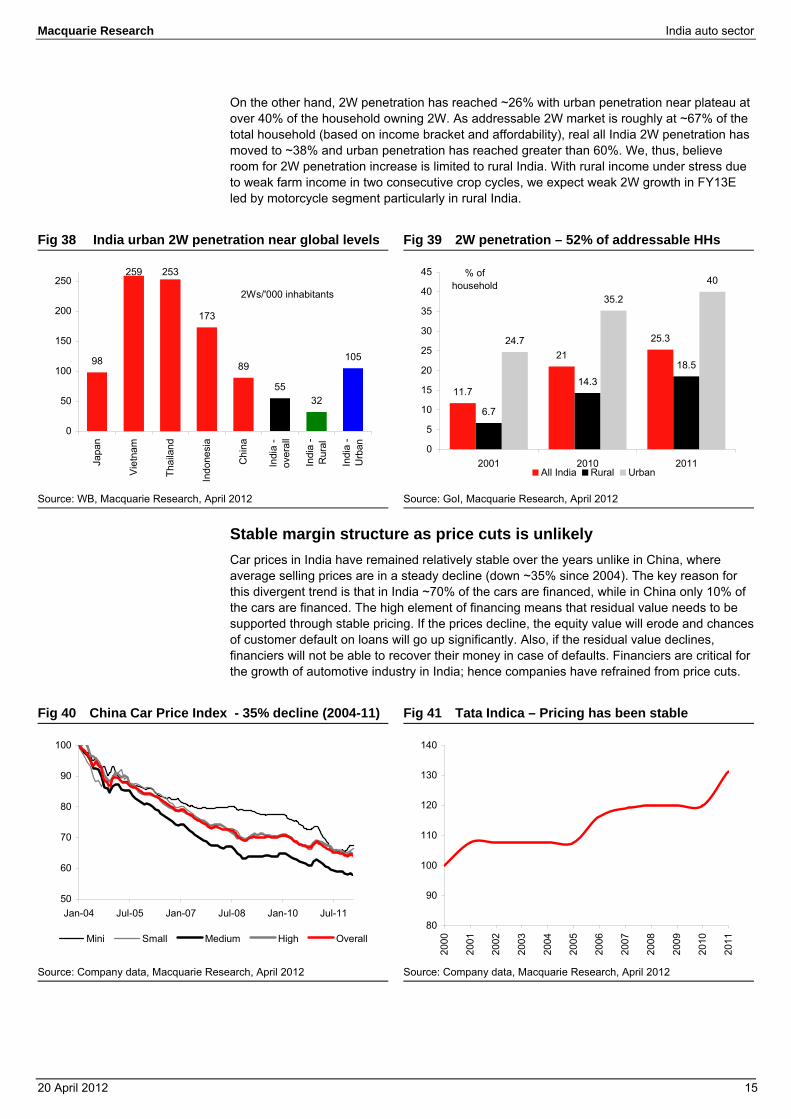
On the other hand, 2W penetration has reached ~26% with urban penetration near plateau at over 40% of the household owning 2W. As addressable 2W market is roughly at ~67% of the total household (based on income bracket and affordability), real all India 2W penetration has moved to ~38% and urban penetration has reached greater than 60%. We, thus, believe room for 2W penetration increase is limited to rural India. With rural income under stress due to weak farm income in two consecutive crop cycles, we expect weak 2W growth in FY13E led by motorcycle segment particularly in rural India.
Fig 38 India urban 2W penetration near global levels Fig 39 2W penetration – 52% of addressable HHs
Source: WB, Macquarie Research, April 2012 Source: GoI, Macquarie Research, April 2012
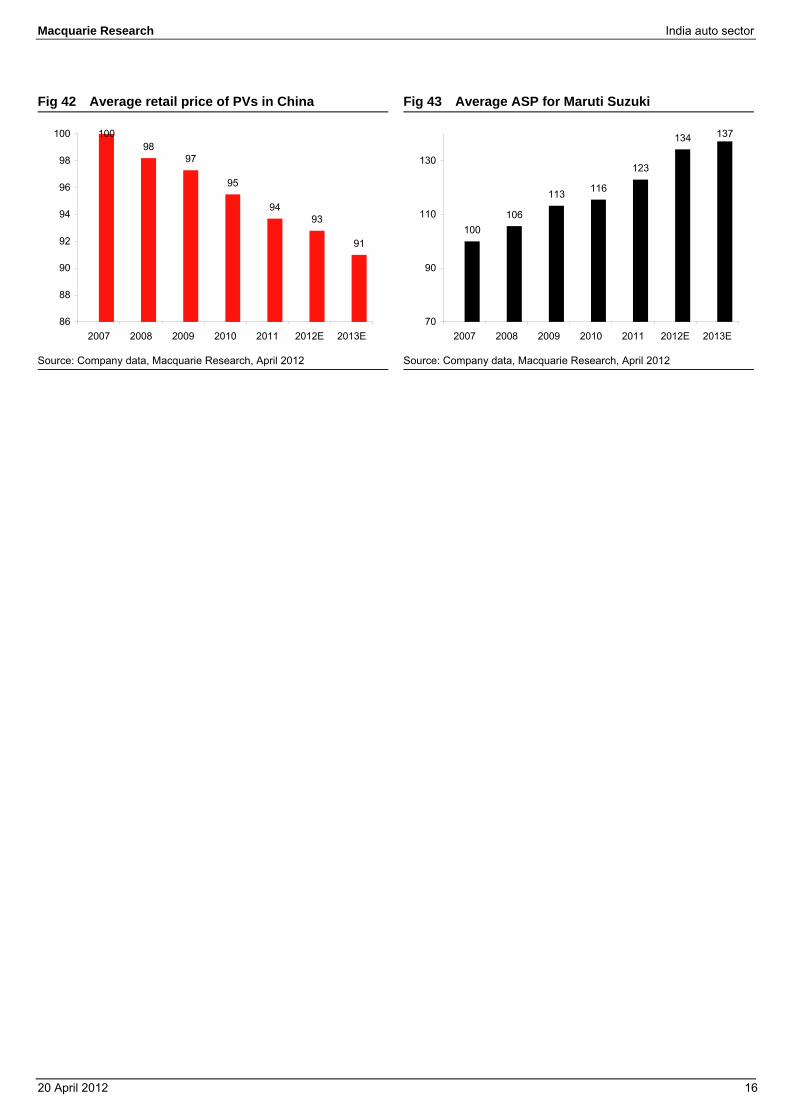
Stable margin structure as price cuts is unlikely Car prices in India have remained relatively stable over the years unlike in China, where average selling prices are in a steady decline (down ~35% since 2004). The key reason for this divergent trend is that in India ~70% of the cars are financed, while in China only 10% of the cars are financed. The high element of financing means that residual value needs to be supported through stable pricing. If the prices decline, the equity value will erode and chances of customer default on loans will go up significantly. Also, if the residual value declines, financiers will not be able to recover their money in case of defaults. Financiers are critical for the growth of automotive industry in India; hence companies have refrained from price cuts.
Fig 40 China Car Price Index - 35% decline (2004-11) Fig 41 Tata Indica – Pricing has been stable
Source: Company data, Macquarie Research, April 2012 Source: Company data, Macquarie Research, April 2012
98
259 253
173
89
5532
105
0
50
100
150
200
250
Japa
n
Vie
tnam
Thai
land
Indo
nesi
a
Chi
na
Indi
a -
over
all
Indi
a -
Rur
al
Indi
a -
Urb
an
2Ws/'000 inhabitants
11.7
21
25.3
6.7
14.3
18.5
24.7
35.2
40
0
5
10
15
20
25
30
35
40
45
2001 2010 2011
% of household
All India Rural Urban
50
60
70
80
90
100
Jan-04 Jul-05 Jan-07 Jul-08 Jan-10 Jul-11
Mini Small Medium High Overall80
90
100
110
120
130
140
2000
2001
2002
2003
2004
2005
2006
2007
2008
2009
2010
2011
Macquarie Research India auto sector
20 April 2012 16
Fig 42 Average retail price of PVs in China Fig 43 Average ASP for Maruti Suzuki
Source: Company data, Macquarie Research, April 2012 Source: Company data, Macquarie Research, April 2012
10098
97
95
9493
91
86
88
90
92
94
96
98
100
2007 2008 2009 2010 2011 2012E 2013E
100106
113 116
123
134 137
70
90
110
130
2007 2008 2009 2010 2011 2012E 2013E
Macquarie Research India auto sector
20 April 2012 17
What’s ailing rural income growth? Rural markets have become very important for Indian auto sales growth over the last few years. Even when urban consumers’ sentiment was weak, rural consumers helped drive the growth for the sector. We think ~30% of passenger vehicles are sold in the rural markets. In two-wheelers, the rural market has become even more important with urban penetration at a very high level. The rural market has become important for LCV sales as these vehicles are increasingly being used as people carriers. Farm income growth is key for tractors as well as M&HCV growth.
Over the last few months, we have seen a slowdown in sales of two-wheelers and tractors and one of the reasons being attributed is weak rural income growth. Therefore, we have attempted to analyse the reasons for the current weakness in rural income growth.
Rural consumption getting incrementally affected We believe the key factors contributing to the slowdown in rural demand are a slowing of the government’s cash transfers including MGNREGA (Mahatma Gandhi National Rural Employment Guarantee), limited increase in minimum support prices and a higher cost of production due to wage inflation and rising energy costs resulting in shrinking margins and worsening terms of trade for farmers.
Farmers’ profitability has improved for Rabi crops to be marketed in the FY13E season due to higher increases in minimum support price (MSP) compared with production cost increases. Therefore, we believe rural demand growth is expected to be back in 2HFY13E. However, the monsoon season will be a key event to watch as a weak monsoon season can prolong any weakness in farm income.
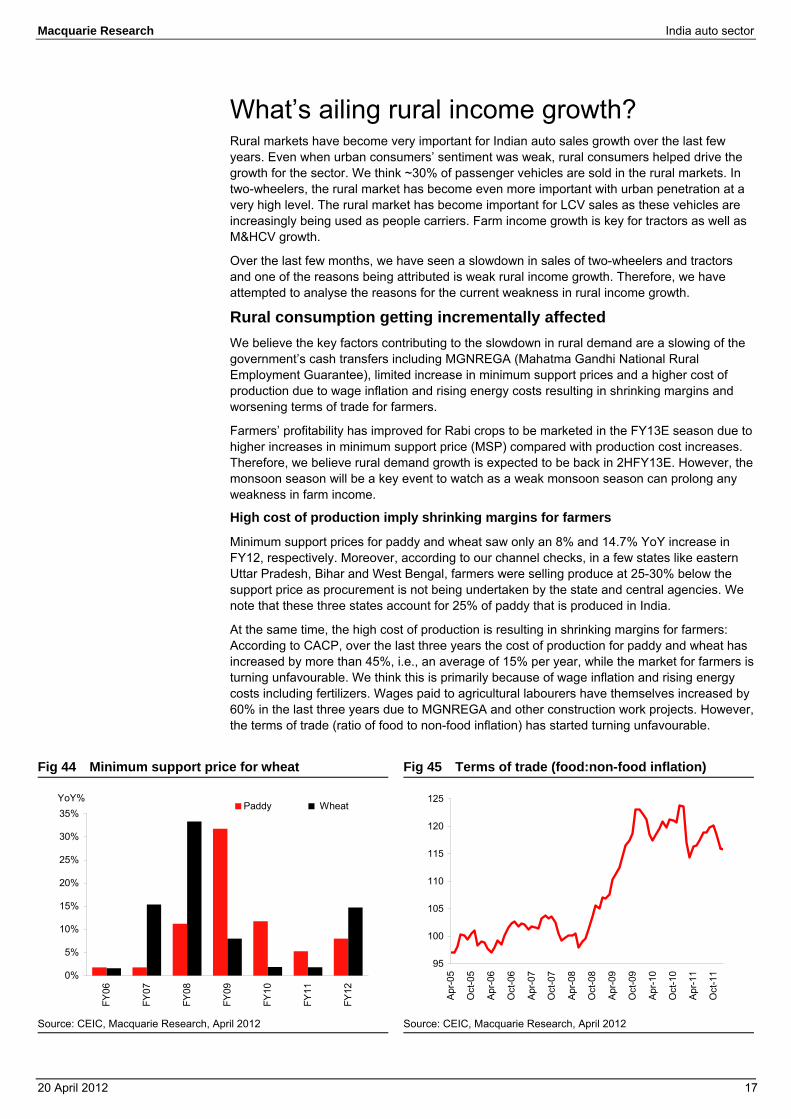
High cost of production imply shrinking margins for farmers
Minimum support prices for paddy and wheat saw only an 8% and 14.7% YoY increase in FY12, respectively. Moreover, according to our channel checks, in a few states like eastern Uttar Pradesh, Bihar and West Bengal, farmers were selling produce at 25-30% below the support price as procurement is not being undertaken by the state and central agencies. We note that these three states account for 25% of paddy that is produced in India.
At the same time, the high cost of production is resulting in shrinking margins for farmers: According to CACP, over the last three years the cost of production for paddy and wheat has increased by more than 45%, i.e., an average of 15% per year, while the market for farmers is turning unfavourable. We think this is primarily because of wage inflation and rising energy costs including fertilizers. Wages paid to agricultural labourers have themselves increased by 60% in the last three years due to MGNREGA and other construction work projects. However, the terms of trade (ratio of food to non-food inflation) has started turning unfavourable.
Fig 44 Minimum support price for wheat Fig 45 Terms of trade (food:non-food inflation)
Source: CEIC, Macquarie Research, April 2012 Source: CEIC, Macquarie Research, April 2012
0%
5%
10%
15%
20%
25%
30%
35%
FY06
FY07
FY08
FY09
FY10
FY11
FY12
Paddy WheatYoY%
95
100
105
110
115
120
125
Apr
-05
Oct
-05
Apr
-06
Oct
-06
Apr
-07
Oct
-07
Apr
-08
Oct
-08
Apr
-09
Oct
-09
Apr
-10
Oct
-10
Apr
-11
Oct
-11
Macquarie Research India auto sector
20 April 2012 18
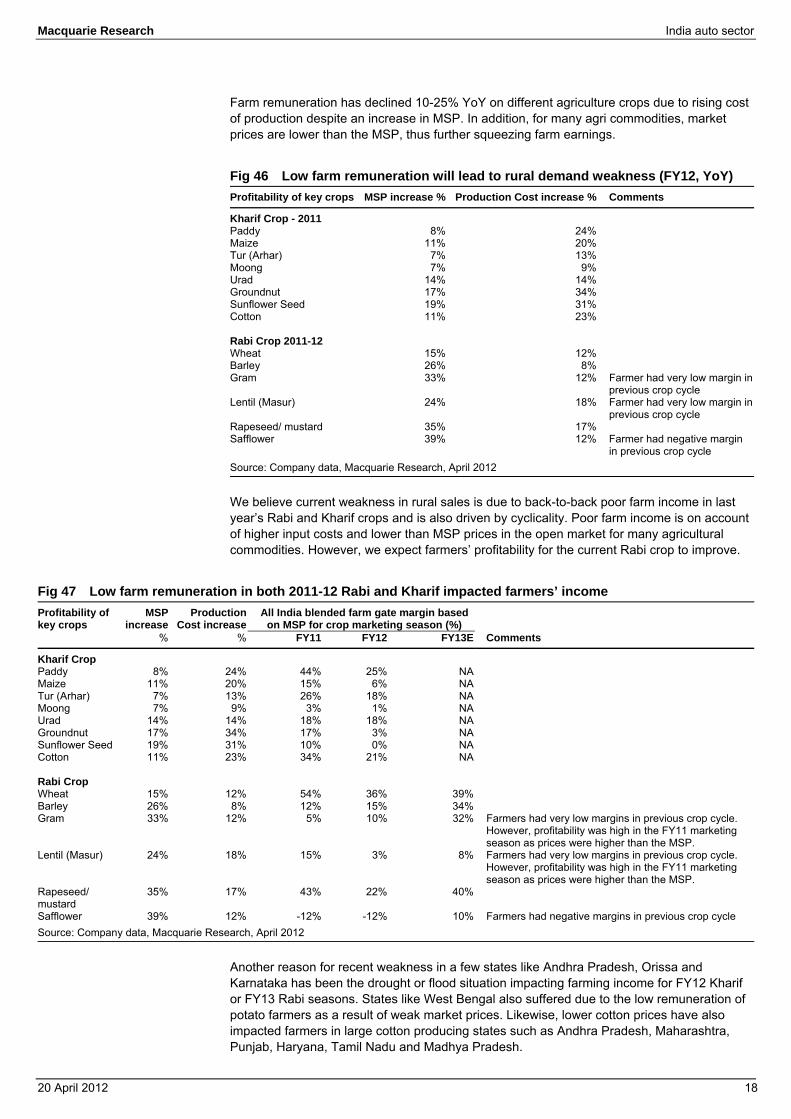
Farm remuneration has declined 10-25% YoY on different agriculture crops due to rising cost of production despite an increase in MSP. In addition, for many agri commodities, market prices are lower than the MSP, thus further squeezing farm earnings.
Fig 46 Low farm remuneration will lead to rural demand weakness (FY12, YoY) Profitability of key crops MSP increase % Production Cost increase % Comments
Kharif Crop - 2011 Paddy 8% 24% Maize 11% 20% Tur (Arhar) 7% 13% Moong 7% 9% Urad 14% 14% Groundnut 17% 34% Sunflower Seed 19% 31% Cotton 11% 23% Rabi Crop 2011-12 Wheat 15% 12% Barley 26% 8% Gram 33% 12% Farmer had very low margin in
previous crop cycle Lentil (Masur) 24% 18% Farmer had very low margin in
previous crop cycle Rapeseed/ mustard 35% 17% Safflower 39% 12% Farmer had negative margin
in previous crop cycle Source: Company data, Macquarie Research, April 2012
We believe current weakness in rural sales is due to back-to-back poor farm income in last year’s Rabi and Kharif crops and is also driven by cyclicality. Poor farm income is on account of higher input costs and lower than MSP prices in the open market for many agricultural commodities. However, we expect farmers’ profitability for the current Rabi crop to improve.
Fig 47 Low farm remuneration in both 2011-12 Rabi and Kharif impacted farmers’ income Profitability of key crops
MSP increase
Production Cost increase
All India blended farm gate margin based on MSP for crop marketing season (%)
% % FY11 FY12 FY13E Comments
Kharif Crop Paddy 8% 24% 44% 25% NA Maize 11% 20% 15% 6% NA Tur (Arhar) 7% 13% 26% 18% NA Moong 7% 9% 3% 1% NA Urad 14% 14% 18% 18% NA Groundnut 17% 34% 17% 3% NA Sunflower Seed 19% 31% 10% 0% NA Cotton 11% 23% 34% 21% NA Rabi Crop Wheat 15% 12% 54% 36% 39% Barley 26% 8% 12% 15% 34% Gram 33% 12% 5% 10% 32% Farmers had very low margins in previous crop cycle.
However, profitability was high in the FY11 marketing season as prices were higher than the MSP.
Lentil (Masur) 24% 18% 15% 3% 8% Farmers had very low margins in previous crop cycle. However, profitability was high in the FY11 marketing season as prices were higher than the MSP.
Rapeseed/ mustard
35% 17% 43% 22% 40%
Safflower 39% 12% -12% -12% 10% Farmers had negative margins in previous crop cycle Source: Company data, Macquarie Research, April 2012
Another reason for recent weakness in a few states like Andhra Pradesh, Orissa and Karnataka has been the drought or flood situation impacting farming income for FY12 Kharif or FY13 Rabi seasons. States like West Bengal also suffered due to the low remuneration of potato farmers as a result of weak market prices. Likewise, lower cotton prices have also impacted farmers in large cotton producing states such as Andhra Pradesh, Maharashtra, Punjab, Haryana, Tamil Nadu and Madhya Pradesh.

Macquarie Research India auto sector
20 April 2012 19
Rural income growth has been buoyant for the last 4 years
Rural wages have increased manifold over the last few years: Following higher wages to farmers under the government’s socialist programmes like MGNREGA, the average daily wage rate for various agricultural occupations including ploughing, sowing, harvesting, picking, etc. has increased by an average of 15% YoY in the last four years (FY08-FY11) compared to an average increase of 4.3% YoY in the previous five years (FY04-FY07). The farming-related activities wage inflation in real terms (adjusted using CPI-agricultural labourers) increased to 10.3% YoY in FY11 from 3.7% YoY in FY10, thus boosting rural income levels.
Fig 48 Average daily wage rate for agricultural occupations
Fig 49 CPI – agricultural labourers vs nominal and real farming related wage inflation
Source: Labour bureau, Macquarie Research, April 2012 Source: Labour bureau, Macquarie Research, April 2012
However, rural spending by the government has started slowing
The Mahatma Gandhi National Rural Employment Guarantee Act (MGNREGA) is the flagship programme of the UPA government, guaranteeing 100 days of wage-employment in a financial year to a rural household whose adult members volunteer to do unskilled manual work. Since its launch, spending under NREGA has increased threefold from US$2.6bn in FY06 to US$8.8bn (revised estimates) in FY11. Even for FY12, the government budgeted spending at US$8.2bn.
However, according to our economist, Tanvee Gupta Jain, the actual utilisation rate under this scheme in FY12 is significantly below the budgeted amount. As of 1st Feb 2012, only 54% of the US$8bn of funds allocated under this scheme had actually been utilised. The slowdown in social sector spending will result in a slowdown in income levels for the rural segment.
Fig 50 Rural spending by the government
Source: Government of India, Macquarie Research, April 2012
20.5%
17.6%
13.7%
8.7%
6.9%2.2%
2.4%
6.2%
1.8%
0
20
40
60
80
100
120
FY03
FY04
FY05
FY06
FY07
FY08
FY09
FY10
FY11
-3%
2%
7%
12%
17%
22%Rs YoY%
0%
5%
10%
15%
20%
FY03
FY04
FY05
FY06
FY07
FY08
FY09
FY10
FY11
-4%-2%0%2%4%6%8%10%12%
CPI agricultural laborers, LSFarming related activites wage inflation (Nominal terms, LS)Farming related activites wage inflation (Real terms, RS)
YoY% YoY%
30%
54%
86%
70%
37%
0
2
4
6
8
10
FY06 FY07 FY08 FY09 FY10 FY11 FY12E0%
20%
40%
60%
80%
100%
Budget allocaton Actual utilisation Utilsation rate (RS)
US$ bn
Macquarie Research India auto sector
20 April 2012 20
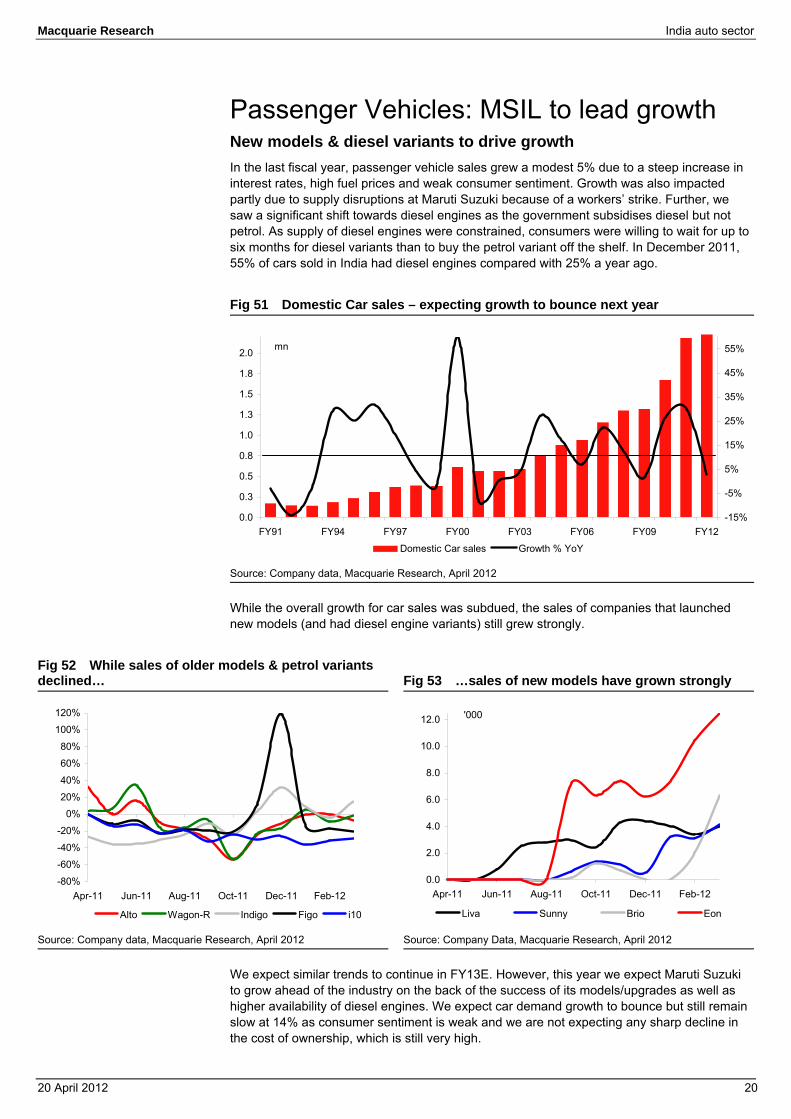
Passenger Vehicles: MSIL to lead growth New models & diesel variants to drive growth In the last fiscal year, passenger vehicle sales grew a modest 5% due to a steep increase in interest rates, high fuel prices and weak consumer sentiment. Growth was also impacted partly due to supply disruptions at Maruti Suzuki because of a workers’ strike. Further, we saw a significant shift towards diesel engines as the government subsidises diesel but not petrol. As supply of diesel engines were constrained, consumers were willing to wait for up to six months for diesel variants than to buy the petrol variant off the shelf. In December 2011, 55% of cars sold in India had diesel engines compared with 25% a year ago.
Fig 51 Domestic Car sales – expecting growth to bounce next year
Source: Company data, Macquarie Research, April 2012
While the overall growth for car sales was subdued, the sales of companies that launched new models (and had diesel engine variants) still grew strongly.
Fig 52 While sales of older models & petrol variants declined…
Fig 53 …sales of new models have grown strongly
Source: Company data, Macquarie Research, April 2012 Source: Company Data, Macquarie Research, April 2012
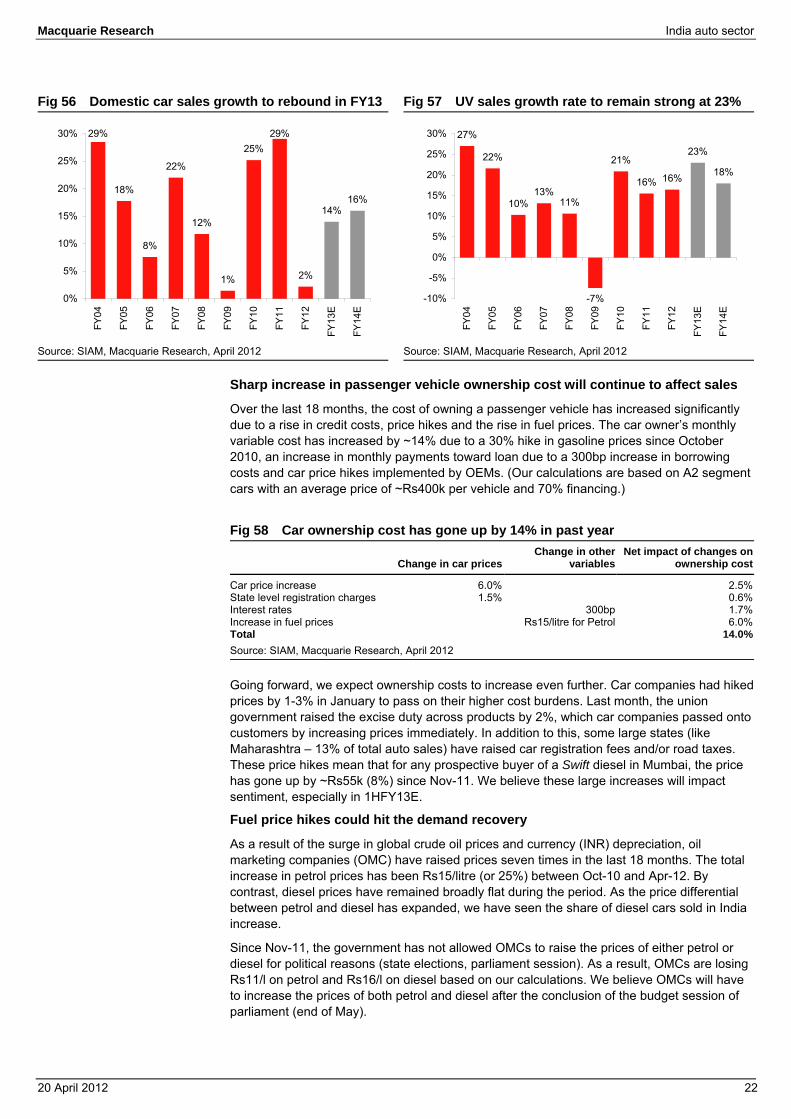
We expect similar trends to continue in FY13E. However, this year we expect Maruti Suzuki to grow ahead of the industry on the back of the success of its models/upgrades as well as higher availability of diesel engines. We expect car demand growth to bounce but still remain slow at 14% as consumer sentiment is weak and we are not expecting any sharp decline in the cost of ownership, which is still very high.
0.0
0.3
0.5
0.8
1.0
1.3
1.5
1.8
2.0
FY91 FY94 FY97 FY00 FY03 FY06 FY09 FY12-15%
-5%
5%
15%
25%
35%
45%
55%
Domestic Car sales Growth % YoY
mn
-80%
-60%
-40%
-20%
0%
20%
40%
60%
80%
100%
120%
Apr-11 Jun-11 Aug-11 Oct-11 Dec-11 Feb-12
Alto Wagon-R Indigo Figo i10
0.0
2.0
4.0
6.0
8.0
10.0
12.0
Apr-11 Jun-11 Aug-11 Oct-11 Dec-11 Feb-12
Liva Sunny Brio Eon
'000
Macquarie Research India auto sector
20 April 2012 21
In the medium term, we expect car sales to rebound driven by growth in consumers’ income levels, an increase in finance penetration and new model launches at attractive price points. We expect growth to rebound to 16% in FY14E.
Fig 54 Passenger vehicle sales expected to grow by 13% in FY13E FY10 FY11 FY12 FY13E FY14E
Passenger vehicles 1,951,333 2,501,542 2,618,072 3,003,536 3,485,519% growth 26% 28% 5% 15% 16%Cars 1,528,337 1,972,845 2,016,115 2,298,371 2,666,110% growth 25% 29% 2% 14% 16%Utility Vehicles 272,740 315,123 367,012 451,425 532,681% growth 21% 16% 16% 23% 18%MPV 150,256 213,574 234,945 253,741 286,727% growth 41% 42% 10% 8% 13%Source: SIAM, Macquarie Research, April 2012
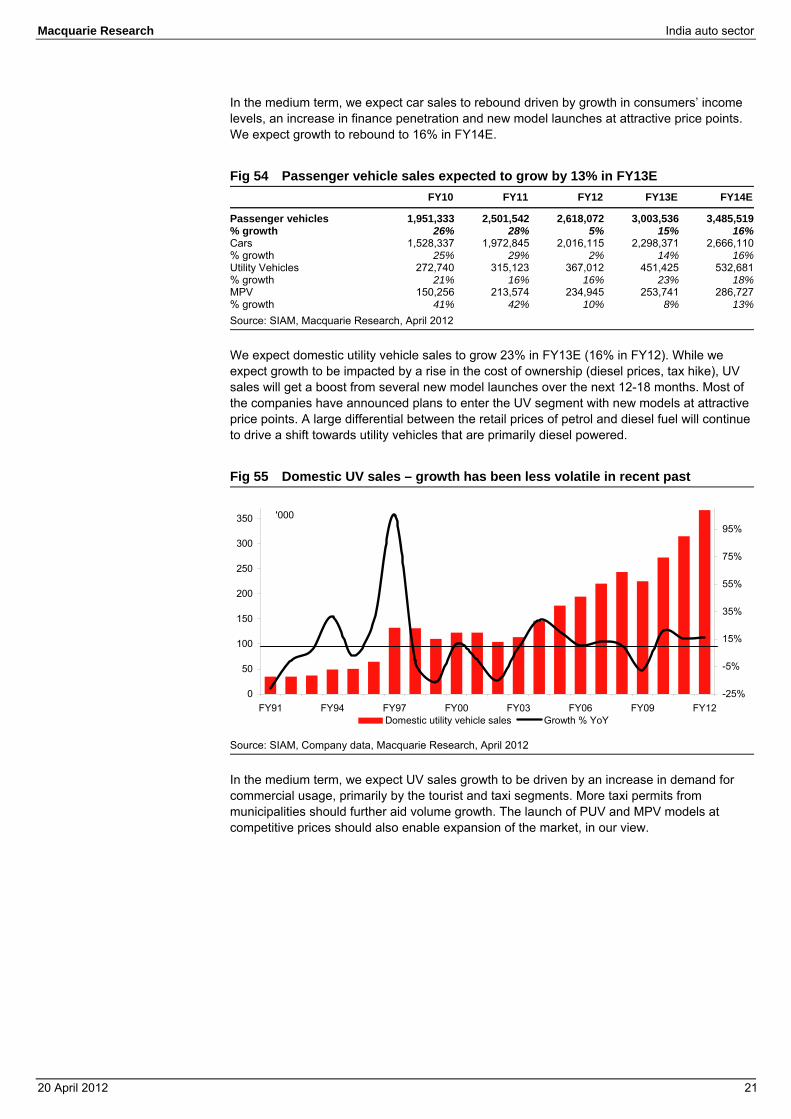
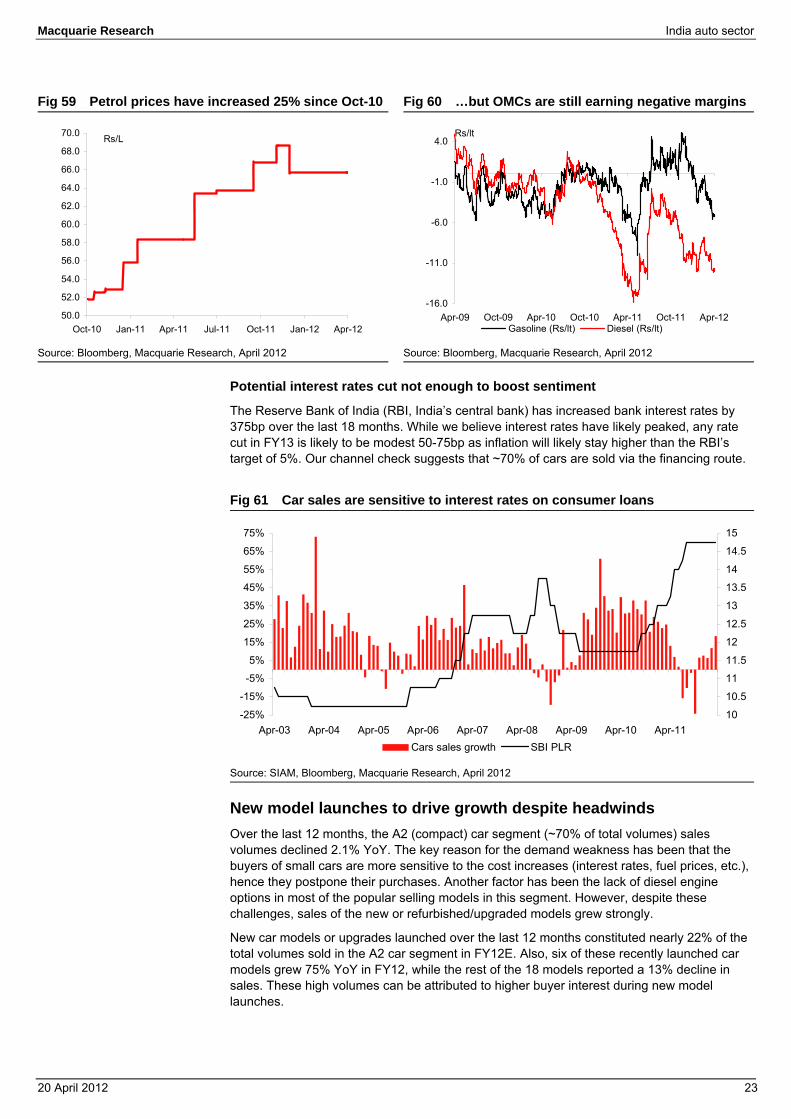
We expect domestic utility vehicle sales to grow 23% in FY13E (16% in FY12). While we expect growth to be impacted by a rise in the cost of ownership (diesel prices, tax hike), UV sales will get a boost from several new model launches over the next 12-18 months. Most of the companies have announced plans to enter the UV segment with new models at attractive price points. A large differential between the retail prices of petrol and diesel fuel will continue to drive a shift towards utility vehicles that are primarily diesel powered.
Fig 55 Domestic UV sales – growth has been less volatile in recent past
Source: SIAM, Company data, Macquarie Research, April 2012
In the medium term, we expect UV sales growth to be driven by an increase in demand for commercial usage, primarily by the tourist and taxi segments. More taxi permits from municipalities should further aid volume growth. The launch of PUV and MPV models at competitive prices should also enable expansion of the market, in our view.
0
50
100
150
200
250
300
350
FY91 FY94 FY97 FY00 FY03 FY06 FY09 FY12-25%
-5%
15%
35%
55%
75%
95%
Domestic utility vehicle sales Growth % YoY
'000
Macquarie Research India auto sector
20 April 2012 22
Fig 56 Domestic car sales growth to rebound in FY13 Fig 57 UV sales growth rate to remain strong at 23%
Source: SIAM, Macquarie Research, April 2012 Source: SIAM, Macquarie Research, April 2012
Sharp increase in passenger vehicle ownership cost will continue to affect sales
Over the last 18 months, the cost of owning a passenger vehicle has increased significantly due to a rise in credit costs, price hikes and the rise in fuel prices. The car owner’s monthly variable cost has increased by ~14% due to a 30% hike in gasoline prices since October 2010, an increase in monthly payments toward loan due to a 300bp increase in borrowing costs and car price hikes implemented by OEMs. (Our calculations are based on A2 segment cars with an average price of ~Rs400k per vehicle and 70% financing.)
Fig 58 Car ownership cost has gone up by 14% in past year
Change in car pricesChange in other
variables Net impact of changes on
ownership cost
Car price increase 6.0% 2.5%State level registration charges 1.5% 0.6%Interest rates 300bp 1.7%Increase in fuel prices Rs15/litre for Petrol 6.0%Total 14.0%Source: SIAM, Macquarie Research, April 2012
Going forward, we expect ownership costs to increase even further. Car companies had hiked prices by 1-3% in January to pass on their higher cost burdens. Last month, the union government raised the excise duty across products by 2%, which car companies passed onto customers by increasing prices immediately. In addition to this, some large states (like Maharashtra – 13% of total auto sales) have raised car registration fees and/or road taxes. These price hikes mean that for any prospective buyer of a Swift diesel in Mumbai, the price has gone up by ~Rs55k (8%) since Nov-11. We believe these large increases will impact sentiment, especially in 1HFY13E.
Fuel price hikes could hit the demand recovery
As a result of the surge in global crude oil prices and currency (INR) depreciation, oil marketing companies (OMC) have raised prices seven times in the last 18 months. The total increase in petrol prices has been Rs15/litre (or 25%) between Oct-10 and Apr-12. By contrast, diesel prices have remained broadly flat during the period. As the price differential between petrol and diesel has expanded, we have seen the share of diesel cars sold in India increase.
Since Nov-11, the government has not allowed OMCs to raise the prices of either petrol or diesel for political reasons (state elections, parliament session). As a result, OMCs are losing Rs11/l on petrol and Rs16/l on diesel based on our calculations. We believe OMCs will have to increase the prices of both petrol and diesel after the conclusion of the budget session of parliament (end of May).
29%
18%
8%
22%
12%
1%
25%29%
2%
14%16%
0%
5%
10%
15%
20%
25%
30%
FY04
FY05
FY06
FY07
FY08
FY09
FY10
FY11
FY12
FY13
E
FY14
E
27%
22%
10%13%
11%
-7%
21%
16% 16%
23%
18%
-10%
-5%
0%
5%
10%
15%
20%
25%
30%
FY04
FY05
FY06
FY07
FY08
FY09
FY10
FY11
FY12
FY13
E
FY14
E
Macquarie Research India auto sector
20 April 2012 23
Fig 59 Petrol prices have increased 25% since Oct-10 Fig 60 …but OMCs are still earning negative margins
Source: Bloomberg, Macquarie Research, April 2012 Source: Bloomberg, Macquarie Research, April 2012
Potential interest rates cut not enough to boost sentiment
The Reserve Bank of India (RBI, India’s central bank) has increased bank interest rates by 375bp over the last 18 months. While we believe interest rates have likely peaked, any rate cut in FY13 is likely to be modest 50-75bp as inflation will likely stay higher than the RBI’s target of 5%. Our channel check suggests that ~70% of cars are sold via the financing route.
Fig 61 Car sales are sensitive to interest rates on consumer loans
Source: SIAM, Bloomberg, Macquarie Research, April 2012
New model launches to drive growth despite headwinds Over the last 12 months, the A2 (compact) car segment (~70% of total volumes) sales volumes declined 2.1% YoY. The key reason for the demand weakness has been that the buyers of small cars are more sensitive to the cost increases (interest rates, fuel prices, etc.), hence they postpone their purchases. Another factor has been the lack of diesel engine options in most of the popular selling models in this segment. However, despite these challenges, sales of the new or refurbished/upgraded models grew strongly.
New car models or upgrades launched over the last 12 months constituted nearly 22% of the total volumes sold in the A2 car segment in FY12E. Also, six of these recently launched car models grew 75% YoY in FY12, while the rest of the 18 models reported a 13% decline in sales. These high volumes can be attributed to higher buyer interest during new model launches.
50.0
52.0
54.0
56.0
58.0
60.0
62.0
64.0
66.0
68.0
70.0
Oct-10 Jan-11 Apr-11 Jul-11 Oct-11 Jan-12 Apr-12
Rs/L
-16.0
-11.0
-6.0
-1.0
4.0
Apr-09 Oct-09 Apr-10 Oct-10 Apr-11 Oct-11 Apr-12
Rs/lt
Gasoline (Rs/lt) Diesel (Rs/lt)
-25%
-15%
-5%
5%
15%
25%
35%
45%
55%
65%
75%
Apr-03 Apr-04 Apr-05 Apr-06 Apr-07 Apr-08 Apr-09 Apr-10 Apr-1110
10.5
11
11.5
12
12.5
13
13.5
14
14.5
15
Cars sales growth SBI PLR
Macquarie Research India auto sector
20 April 2012 24
Fig 62 Six of the newly launched (or upgraded) compact car models had grew 75% in FY12
Models Segment Launch DateContribution to segment
during FY12 Contribution to incremental
volumes in cars FY12/11
Chevrolet Beat A2 Jul-11 3.6% 16,736Honda Brio A2 Sep-11 0.7% 10,489Hyundai EON A2 Sep-11 4.1% 57,468Maruti Swift A2 Aug-11 10.9% 12,667Renault Pulse A2 Feb-12 0.1% 1,247Toyota Liva A2 Jun-11 2.2% 31,761Total 21.6% 130,368Source: Company data, Macquarie Research, April 2012
Model launch focus has shifted from small cars to SUVs
We are expecting very few new car model launches in FY13E. While there are no launches likely in the hatchback segment from the competitors, we are expecting Maruti to launch a new 800cc car and upgrade the Ritz model. Lack of new models in the compact segment will put pressure on overall car market (ex-Maruti) growth.
On the other hand, there are several new launches likely in the MPV and SUV segments. The key launches are Maruti’s Ertiga, Nissan’s Evalia, Ford’s Eco Sport and the Renault Duster. Given the significant number of model launches planned for FY13E, we believe the growth in UV sales will continue to remain strong. However, this space is likely to become a lot more competitive. We believe M&M will continue to receive strong demand for XUV500. It has launched an upgraded Xylo recently and has plans to launch the compact Xylo later in the year.
Fig 63 MSIL enters MPV segment with Ertiga Fig 64 Ford Eco Sport – Eco boost engine advantage
Source: Company data, April 2012 Source: Company Data, April 2012
Fig 65 Nissan Evalia likely to be launched in Q2FY13 Fig 66 Renault Duster – launch likely in FY13E
Source: Company data, April 2012 Source: Company Data, April 2012
Macquarie Research India auto sector
20 April 2012 25
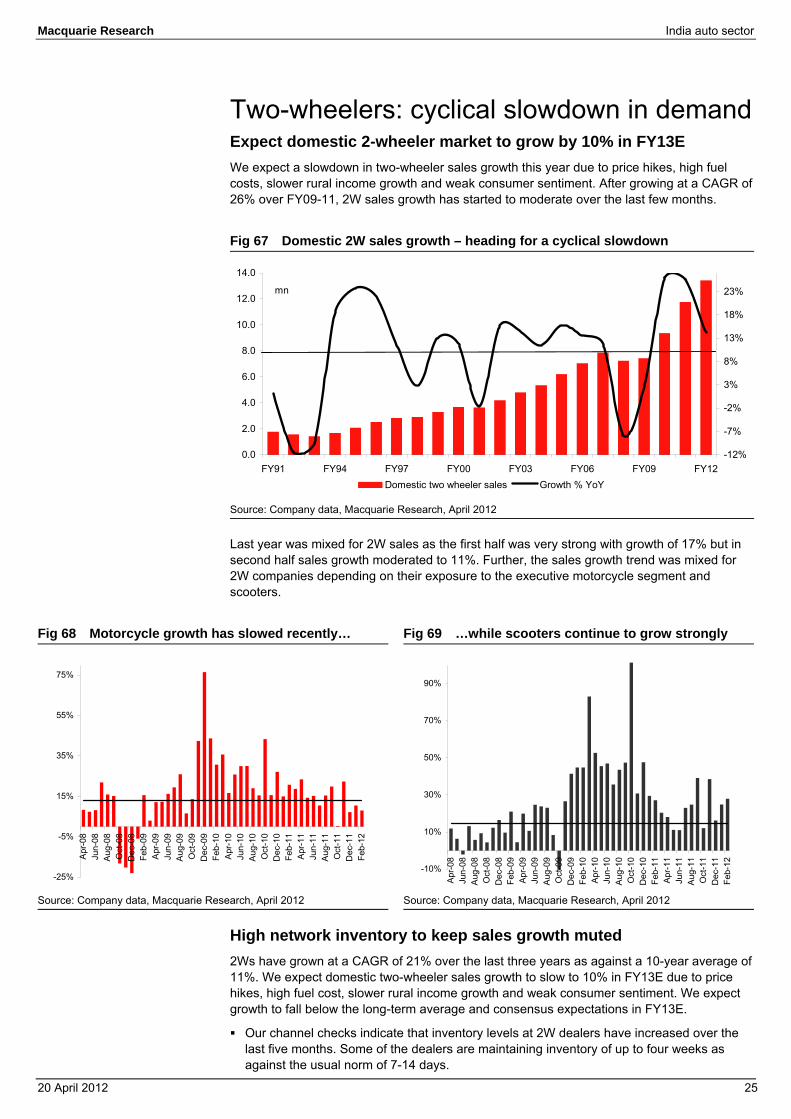
Two-wheelers: cyclical slowdown in demand Expect domestic 2-wheeler market to grow by 10% in FY13E We expect a slowdown in two-wheeler sales growth this year due to price hikes, high fuel costs, slower rural income growth and weak consumer sentiment. After growing at a CAGR of 26% over FY09-11, 2W sales growth has started to moderate over the last few months.
Fig 67 Domestic 2W sales growth – heading for a cyclical slowdown
Source: Company data, Macquarie Research, April 2012
Last year was mixed for 2W sales as the first half was very strong with growth of 17% but in second half sales growth moderated to 11%. Further, the sales growth trend was mixed for 2W companies depending on their exposure to the executive motorcycle segment and scooters.
Fig 68 Motorcycle growth has slowed recently… Fig 69 …while scooters continue to grow strongly
Source: Company data, Macquarie Research, April 2012 Source: Company data, Macquarie Research, April 2012
High network inventory to keep sales growth muted 2Ws have grown at a CAGR of 21% over the last three years as against a 10-year average of 11%. We expect domestic two-wheeler sales growth to slow to 10% in FY13E due to price hikes, high fuel cost, slower rural income growth and weak consumer sentiment. We expect growth to fall below the long-term average and consensus expectations in FY13E.
Our channel checks indicate that inventory levels at 2W dealers have increased over the last five months. Some of the dealers are maintaining inventory of up to four weeks as against the usual norm of 7-14 days.
0.0
2.0
4.0
6.0
8.0
10.0
12.0
14.0
FY91 FY94 FY97 FY00 FY03 FY06 FY09 FY12-12%
-7%
-2%
3%
8%
13%
18%
23%
Domestic two wheeler sales Growth % YoY
mn
-25%
-5%
15%
35%
55%
75%
Apr
-08
Jun-
08A
ug-0
8O
ct-0
8D
ec-0
8Fe
b-09
Apr
-09
Jun-
09A
ug-0
9O
ct-0
9D
ec-0
9Fe
b-10
Apr
-10
Jun-
10A
ug-1
0O
ct-1
0D
ec-1
0Fe
b-11
Apr
-11
Jun-
11A
ug-1
1O
ct-1
1D
ec-1
1Fe
b-12
-10%
10%
30%
50%
70%
90%
Apr-0
8Ju
n-08
Aug
-08
Oct
-08
Dec
-08
Feb-
09Ap
r-09
Jun-
09A
ug-0
9O
ct-0
9D
ec-0
9Fe
b-10
Apr-1
0Ju
n-10
Aug
-10
Oct
-10
Dec
-10
Feb-
11Ap
r-11
Jun-
11A
ug-1
1O
ct-1
1D
ec-1
1Fe
b-12
Macquarie Research India auto sector
20 April 2012 26
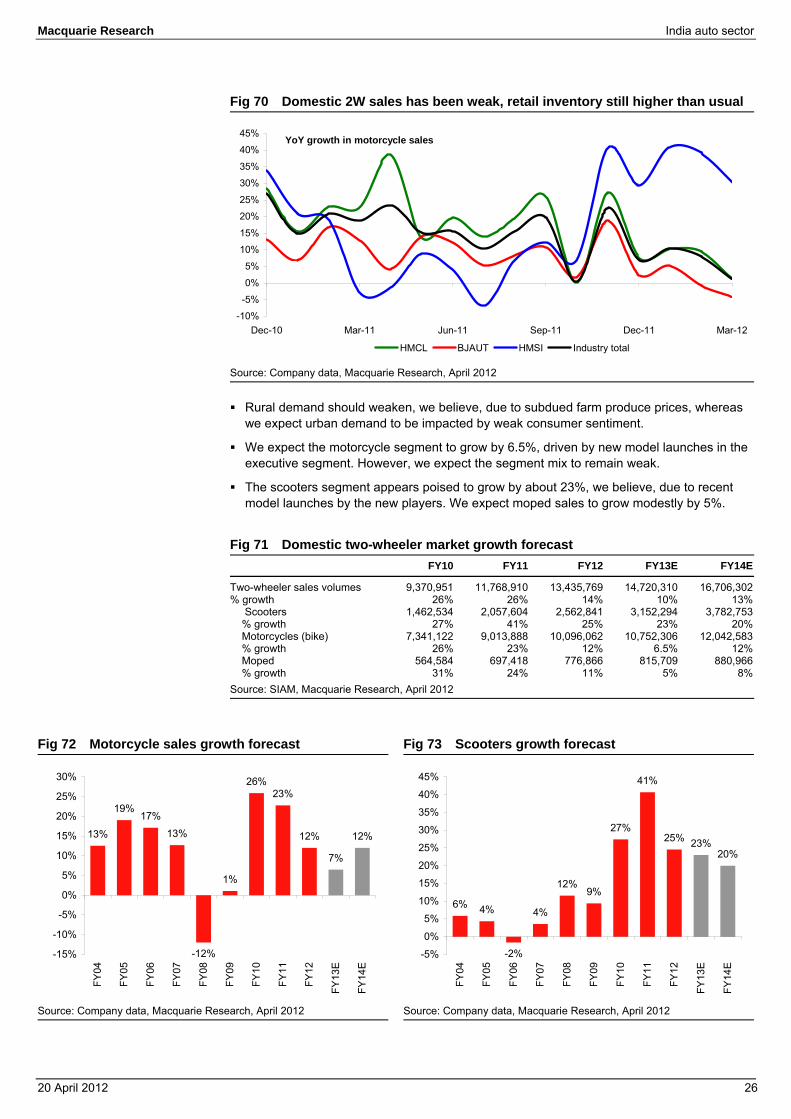
Fig 70 Domestic 2W sales has been weak, retail inventory still higher than usual
Source: Company data, Macquarie Research, April 2012
Rural demand should weaken, we believe, due to subdued farm produce prices, whereas we expect urban demand to be impacted by weak consumer sentiment.
We expect the motorcycle segment to grow by 6.5%, driven by new model launches in the executive segment. However, we expect the segment mix to remain weak.
The scooters segment appears poised to grow by about 23%, we believe, due to recent model launches by the new players. We expect moped sales to grow modestly by 5%.
Fig 71 Domestic two-wheeler market growth forecast FY10 FY11 FY12 FY13E FY14E
Two-wheeler sales volumes 9,370,951 11,768,910 13,435,769 14,720,310 16,706,302% growth 26% 26% 14% 10% 13% Scooters 1,462,534 2,057,604 2,562,841 3,152,294 3,782,753 % growth 27% 41% 25% 23% 20% Motorcycles (bike) 7,341,122 9,013,888 10,096,062 10,752,306 12,042,583 % growth 26% 23% 12% 6.5% 12% Moped 564,584 697,418 776,866 815,709 880,966 % growth 31% 24% 11% 5% 8%Source: SIAM, Macquarie Research, April 2012
Fig 72 Motorcycle sales growth forecast Fig 73 Scooters growth forecast
Source: Company data, Macquarie Research, April 2012 Source: Company data, Macquarie Research, April 2012
-10%
-5%
0%
5%
10%
15%
20%
25%
30%
35%
40%
45%
Dec-10 Mar-11 Jun-11 Sep-11 Dec-11 Mar-12
HMCL BJAUT HMSI Industry total
YoY growth in motorcycle sales
13%
19%17%
13%
-12%
1%
26%23%
12%
7%
12%
-15%
-10%
-5%
0%
5%
10%
15%
20%
25%
30%
FY04
FY05
FY06
FY07
FY08
FY09
FY10
FY11
FY12
FY13
E
FY14
E
6% 4%
-2%
4%
12%9%
27%
41%
25% 23%20%
-5%
0%
5%
10%
15%
20%
25%
30%
35%
40%
45%
FY04
FY05
FY06
FY07
FY08
FY09
FY10
FY11
FY12
FY13
E
FY14
E
Macquarie Research India auto sector
20 April 2012 27
Rising fuel cost to impact growth In the initial phase, 2W sales were positively impacted by high fuel prices given their superior fuel economy compared to entry level cars. However, if fuel prices sustain at high levels, 2W sales growth will be impacted negatively. OMCs are currently losing Rs7.0/l on petrol and Rs11/l on diesel retailing. We believe a petrol price increase is inevitable given the government’s fiscal situation, which is likely to hurt 2W demand.
We believe two-wheeler volume growth isn’t directly impacted by rising interest rates, however slower economic growth does impact growth. Our analysis shows that a percentage increase in interest rates may result in an EMI (monthly instalment) increase of only Rs15-16 for consumers. Our channel check suggests that about two-thirds of new motorcycle sales are accomplished through financing and ~50% of this via Non Banking Finance Companies (NBFC). Since NBFCs charge ~24-26% interest with a high margin (800bp), they usually avoid raising interest rates proportionately to the cost of funds.
Fig 74 Interest rate changes and 2W volume growth Fig 75 Fuel price changes and 2W volume growth
Source: SIAM, Bloomberg, Macquarie Research, April 2012 Source: Bloomberg, Macquarie Research, April 2012
New model launches will likely support growth in FY13E
Most of the new product launches planned for FY13E are in the high volume executive motorcycles segment. Customer preferences turn towards the new models if they are priced competitively for a comparable set of features vis-à-vis the existing models. The share of new models in total motorcycle sales therefore increased to 20% in FY11 from only 7% in FY10.
HMSI and Suzuki will be launching their India-oriented bikes in the high volume executive segment. Bajaj is likely to launch the next generation Pulsar 200NS and a new bike in the executive segment (Discover 125). In the scooters segment, Honda, Hero, Suzuki, Yamaha and Piaggio are likely to launch new models during the year.
Fig 76 New model launches in the volume segments and scooters will likely support growth rate in FY13E Expected
launch
Manufacturer Segment Model Remarks / Features HMSI Motorcycle Dream Yuga Q1 FY13 Honda is banking on this for volumes in non-metro markets Motorcycle CBR150R Q4 FY12 Liquid cooled,4 stroke, DOHC single cylinder 250 cc engine Hero MotoCorp Motorcycle Passion xPro Q1FY13 New engine, refreshed looks Motorcycle Ignitor Q4FY12 New launch in premium 125cc segment Scooter Maestro Q4FY12 Automatic transmission, Maintenance free battery Bajaj-KTM Motorcycle Pulsar 200NS Q1FY13 Next generation Pulsar Motorcycle New Discover Q2FY13 New bike, likely replacement for Discover Suzuki Motorcycle Motorcycle Hayate Q1FY13 110 cc engine Scooter Swish 125 Q4FY12 1Targeted at female consumer Yamaha Motor India Scooter Ray H1 FY13 Gearless scooter in the 125cc segment Piaggio Vehicles Scooter Vespa LX 125 Q1 FY13 125 cc engine, premium features and pricing Source: Industry data, Company data, Macquarie Research, April 2012
-15%
-5%
5%
15%
25%
35%
45%
55%
65%
Apr-03 Jul-04 Oct-05 Jan-07 Apr-08 Jul-09 Oct-10 Jan-1210.0
10.5
11.0
11.5
12.0
12.5
13.0
13.5
14.0
14.5
15.0
2W sales growth SBI PLR
-15%
-5%
5%
15%
25%
35%
45%
55%
65%
Apr-03 Jul-04 Oct-05 Jan-07 Apr-08 Jul-09 Oct-10 Jan-1230.0
35.0
40.0
45.0
50.0
55.0
60.0
65.0
70.0
2W sales growth SBI PLR
Macquarie Research India auto sector
20 April 2012 28
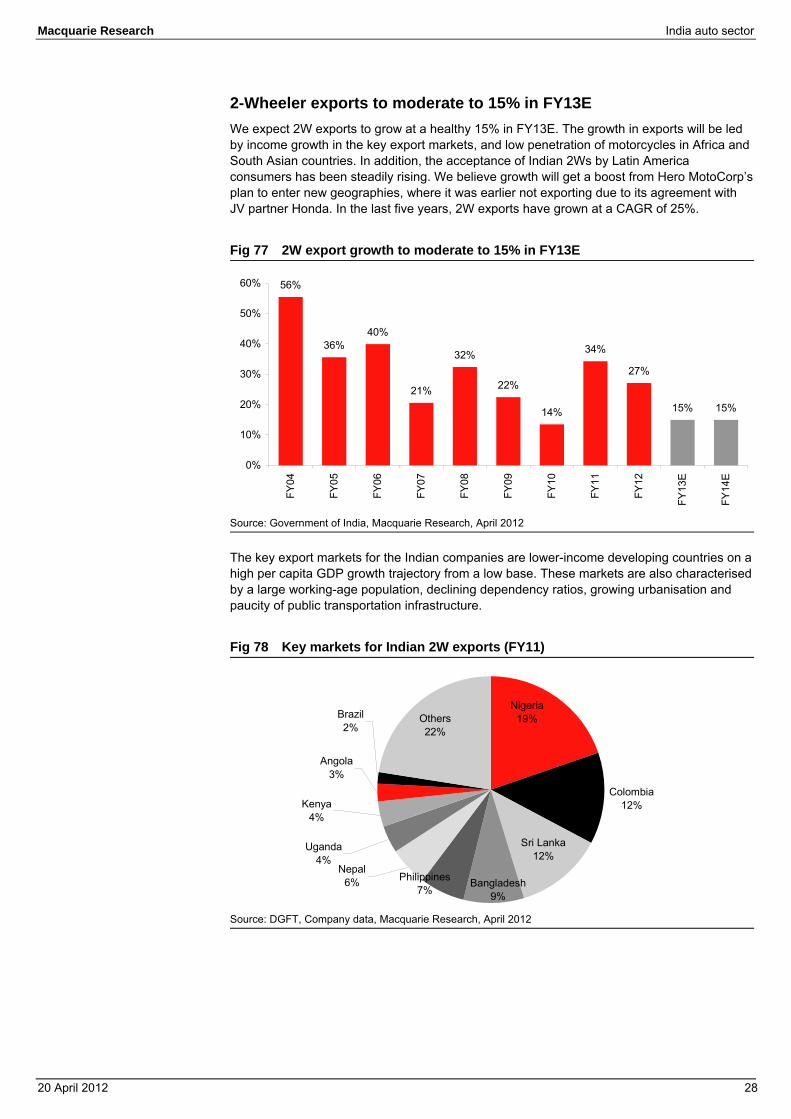
2-Wheeler exports to moderate to 15% in FY13E We expect 2W exports to grow at a healthy 15% in FY13E. The growth in exports will be led by income growth in the key export markets, and low penetration of motorcycles in Africa and South Asian countries. In addition, the acceptance of Indian 2Ws by Latin America consumers has been steadily rising. We believe growth will get a boost from Hero MotoCorp’s plan to enter new geographies, where it was earlier not exporting due to its agreement with JV partner Honda. In the last five years, 2W exports have grown at a CAGR of 25%.
Fig 77 2W export growth to moderate to 15% in FY13E
Source: Government of India, Macquarie Research, April 2012
The key export markets for the Indian companies are lower-income developing countries on a high per capita GDP growth trajectory from a low base. These markets are also characterised by a large working-age population, declining dependency ratios, growing urbanisation and paucity of public transportation infrastructure.
Fig 78 Key markets for Indian 2W exports (FY11)
Source: DGFT, Company data, Macquarie Research, April 2012
56%
36%40%
21%
32%
22%
14%
34%
27%
15% 15%
0%
10%
20%
30%
40%
50%
60%FY
04
FY05
FY06
FY07
FY08
FY09
FY10
FY11
FY12
FY13
E
FY14
E
Colombia12%
Bangladesh9%
Philippines7%
Nepal6%
Uganda4%
Kenya4%
Angola3%
Brazil2%
Sri Lanka12%
Others22%
Nigeria19%
Macquarie Research India auto sector
20 April 2012 29
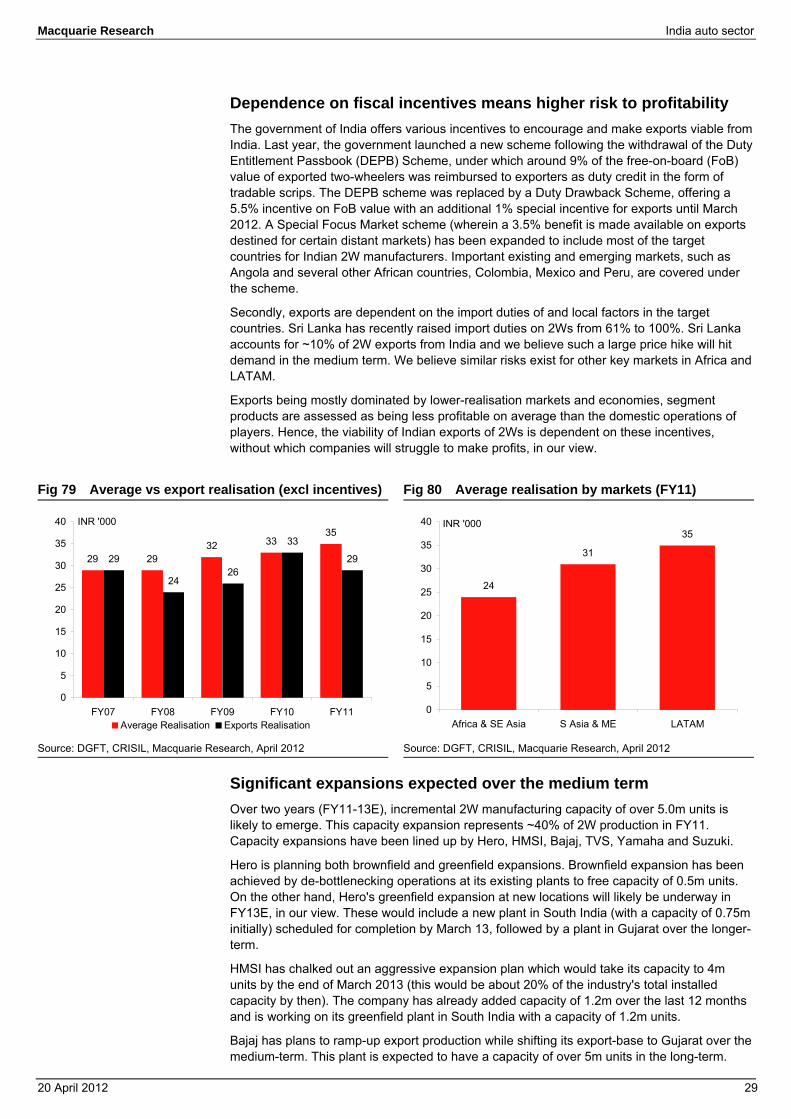
Dependence on fiscal incentives means higher risk to profitability The government of India offers various incentives to encourage and make exports viable from India. Last year, the government launched a new scheme following the withdrawal of the Duty Entitlement Passbook (DEPB) Scheme, under which around 9% of the free-on-board (FoB) value of exported two-wheelers was reimbursed to exporters as duty credit in the form of tradable scrips. The DEPB scheme was replaced by a Duty Drawback Scheme, offering a 5.5% incentive on FoB value with an additional 1% special incentive for exports until March 2012. A Special Focus Market scheme (wherein a 3.5% benefit is made available on exports destined for certain distant markets) has been expanded to include most of the target countries for Indian 2W manufacturers. Important existing and emerging markets, such as Angola and several other African countries, Colombia, Mexico and Peru, are covered under the scheme.
Secondly, exports are dependent on the import duties of and local factors in the target countries. Sri Lanka has recently raised import duties on 2Ws from 61% to 100%. Sri Lanka accounts for ~10% of 2W exports from India and we believe such a large price hike will hit demand in the medium term. We believe similar risks exist for other key markets in Africa and LATAM.
Exports being mostly dominated by lower-realisation markets and economies, segment products are assessed as being less profitable on average than the domestic operations of players. Hence, the viability of Indian exports of 2Ws is dependent on these incentives, without which companies will struggle to make profits, in our view.
Fig 79 Average vs export realisation (excl incentives) Fig 80 Average realisation by markets (FY11)
Source: DGFT, CRISIL, Macquarie Research, April 2012 Source: DGFT, CRISIL, Macquarie Research, April 2012
Significant expansions expected over the medium term Over two years (FY11-13E), incremental 2W manufacturing capacity of over 5.0m units is likely to emerge. This capacity expansion represents ~40% of 2W production in FY11. Capacity expansions have been lined up by Hero, HMSI, Bajaj, TVS, Yamaha and Suzuki.
Hero is planning both brownfield and greenfield expansions. Brownfield expansion has been achieved by de-bottlenecking operations at its existing plants to free capacity of 0.5m units. On the other hand, Hero's greenfield expansion at new locations will likely be underway in FY13E, in our view. These would include a new plant in South India (with a capacity of 0.75m initially) scheduled for completion by March 13, followed by a plant in Gujarat over the longer-term.
HMSI has chalked out an aggressive expansion plan which would take its capacity to 4m units by the end of March 2013 (this would be about 20% of the industry's total installed capacity by then). The company has already added capacity of 1.2m over the last 12 months and is working on its greenfield plant in South India with a capacity of 1.2m units.
Bajaj has plans to ramp-up export production while shifting its export-base to Gujarat over the medium-term. This plant is expected to have a capacity of over 5m units in the long-term.
29 2932 33
35
29
2426
33
29
0
5
10
15
20
25
30
35
40
FY07 FY08 FY09 FY10 FY11
INR '000
Average Realisation Exports Realisation
24
31
35
0
5
10
15
20
25
30
35
40
Africa & SE Asia S Asia & ME LATAM
INR '000

Macquarie Research India auto sector
20 April 2012 30
Fig 81 Existing capacity and future capacity addition plans Installed capacity (Mar-11) Capacity expansion (FY12) Capacity expansion (FY13)
Hero MotoCorp 6.20 0.40 0.75Bajaj Auto 4.50 0.30 0.00TVS Motors 2.55 0.39 0.16HMSI 1.60 1.20 1.20Royal Enfield 0.07 0.03 0.06Suzuki Motorcycles 0.25 0.15 0.00M&M 0.60 0.00 0.00India Yamaha 0.60 0.20 0.20Source: Company data, Macquarie Research, April 2012
Macquarie Research India auto sector
20 April 2012 31
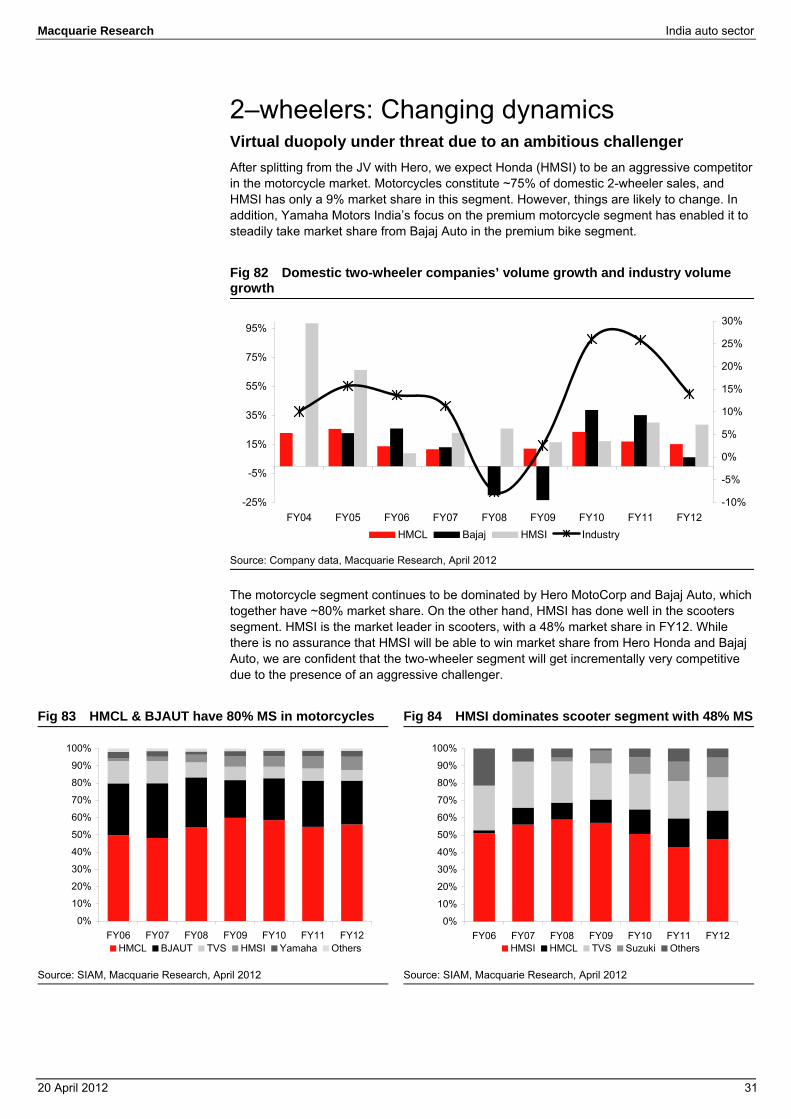
2–wheelers: Changing dynamics Virtual duopoly under threat due to an ambitious challenger After splitting from the JV with Hero, we expect Honda (HMSI) to be an aggressive competitor in the motorcycle market. Motorcycles constitute ~75% of domestic 2-wheeler sales, and HMSI has only a 9% market share in this segment. However, things are likely to change. In addition, Yamaha Motors India’s focus on the premium motorcycle segment has enabled it to steadily take market share from Bajaj Auto in the premium bike segment.
Fig 82 Domestic two-wheeler companies’ volume growth and industry volume growth
Source: Company data, Macquarie Research, April 2012
The motorcycle segment continues to be dominated by Hero MotoCorp and Bajaj Auto, which together have ~80% market share. On the other hand, HMSI has done well in the scooters segment. HMSI is the market leader in scooters, with a 48% market share in FY12. While there is no assurance that HMSI will be able to win market share from Hero Honda and Bajaj Auto, we are confident that the two-wheeler segment will get incrementally very competitive due to the presence of an aggressive challenger.
Fig 83 HMCL & BJAUT have 80% MS in motorcycles Fig 84 HMSI dominates scooter segment with 48% MS
Source: SIAM, Macquarie Research, April 2012 Source: SIAM, Macquarie Research, April 2012
-25%
-5%
15%
35%
55%
75%
95%
FY04 FY05 FY06 FY07 FY08 FY09 FY10 FY11 FY12-10%
-5%
0%
5%
10%
15%
20%
25%
30%
HMCL Bajaj HMSI Industry
0%
10%
20%
30%
40%
50%
60%
70%
80%
90%
100%
FY06 FY07 FY08 FY09 FY10 FY11 FY12HMCL BJAUT TVS HMSI Yamaha Others
0%
10%
20%
30%
40%
50%
60%
70%
80%
90%
100%
FY06 FY07 FY08 FY09 FY10 FY11 FY12HMSI HMCL TVS Suzuki Others
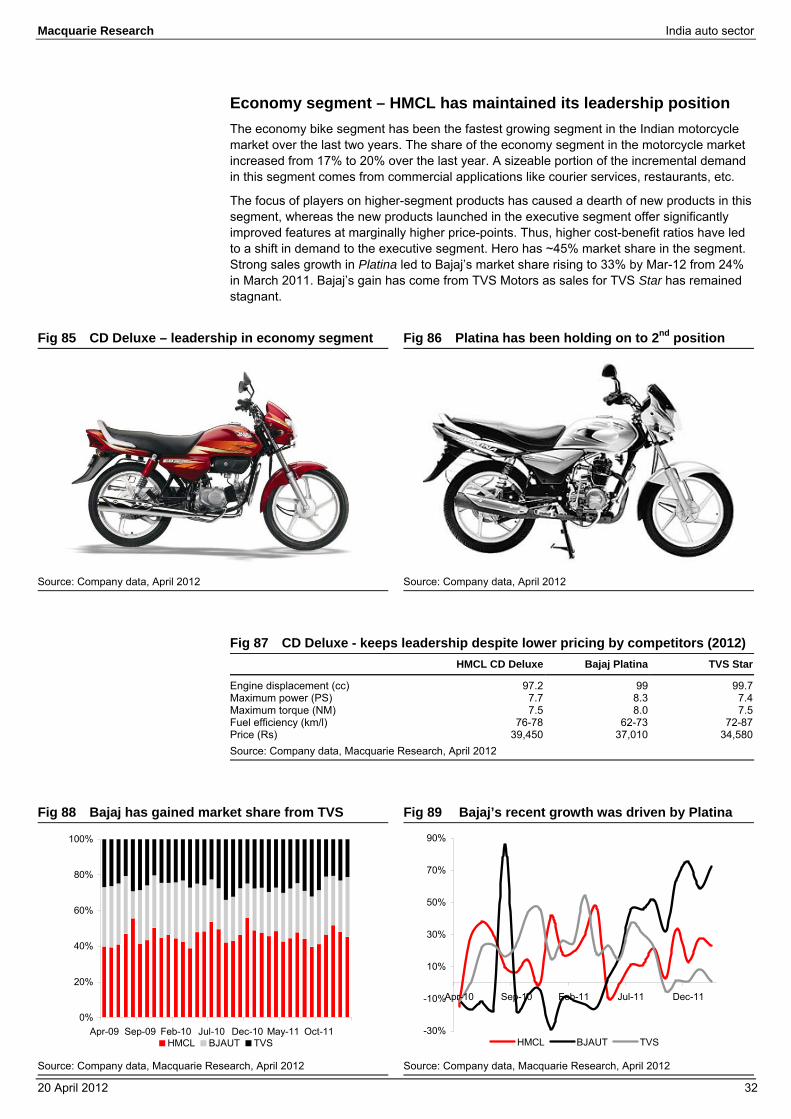
Macquarie Research India auto sector
20 April 2012 32
Economy segment – HMCL has maintained its leadership position The economy bike segment has been the fastest growing segment in the Indian motorcycle market over the last two years. The share of the economy segment in the motorcycle market increased from 17% to 20% over the last year. A sizeable portion of the incremental demand in this segment comes from commercial applications like courier services, restaurants, etc.
The focus of players on higher-segment products has caused a dearth of new products in this segment, whereas the new products launched in the executive segment offer significantly improved features at marginally higher price-points. Thus, higher cost-benefit ratios have led to a shift in demand to the executive segment. Hero has ~45% market share in the segment. Strong sales growth in Platina led to Bajaj’s market share rising to 33% by Mar-12 from 24% in March 2011. Bajaj’s gain has come from TVS Motors as sales for TVS Star has remained stagnant.
Fig 85 CD Deluxe – leadership in economy segment Fig 86 Platina has been holding on to 2nd position
Source: Company data, April 2012 Source: Company data, April 2012
Fig 87 CD Deluxe - keeps leadership despite lower pricing by competitors (2012) HMCL CD Deluxe Bajaj Platina TVS Star
Engine displacement (cc) 97.2 99 99.7Maximum power (PS) 7.7 8.3 7.4Maximum torque (NM) 7.5 8.0 7.5Fuel efficiency (km/l) 76-78 62-73 72-87Price (Rs) 39,450 37,010 34,580Source: Company data, Macquarie Research, April 2012
Fig 88 Bajaj has gained market share from TVS Fig 89 Bajaj’s recent growth was driven by Platina
Source: Company data, Macquarie Research, April 2012 Source: Company data, Macquarie Research, April 2012
0%
20%
40%
60%
80%
100%
Apr-09 Sep-09 Feb-10 Jul-10 Dec-10 May-11 Oct-11HMCL BJAUT TVS
-30%
-10%
10%
30%
50%
70%
90%
Apr-10 Sep-10 Feb-11 Jul-11 Dec-11
HMCL BJAUT TVS
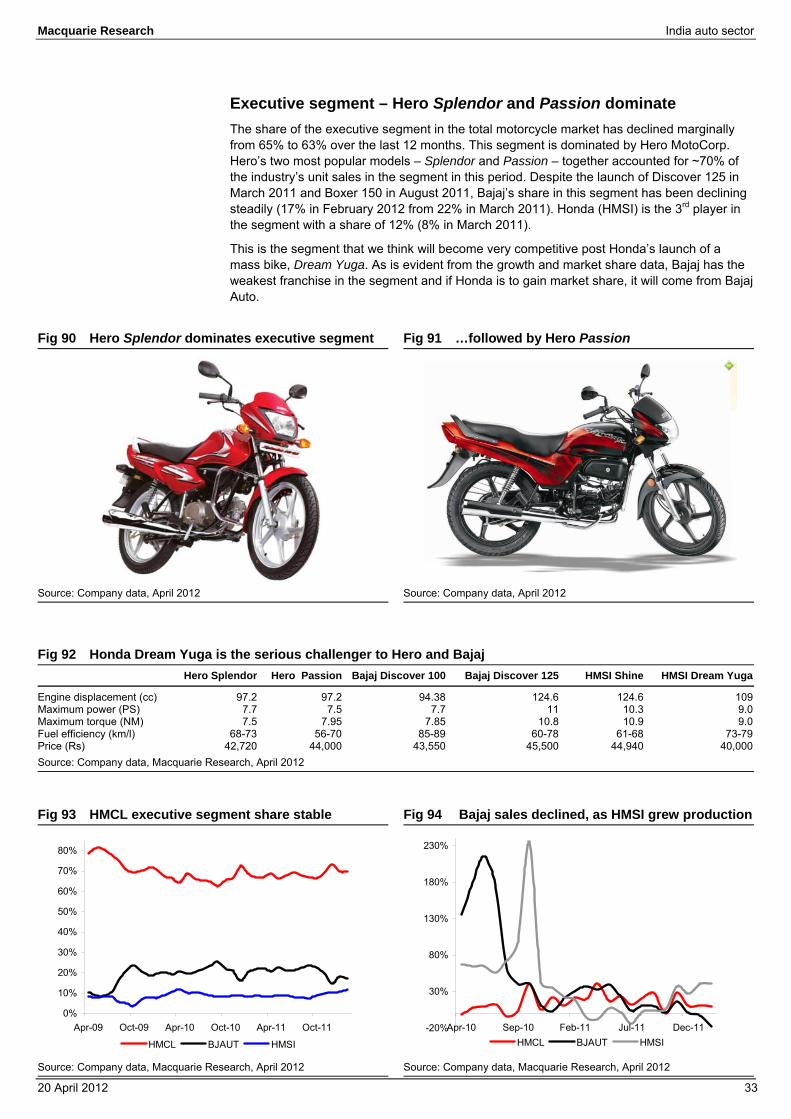
Macquarie Research India auto sector
20 April 2012 33
Executive segment – Hero Splendor and Passion dominate The share of the executive segment in the total motorcycle market has declined marginally from 65% to 63% over the last 12 months. This segment is dominated by Hero MotoCorp. Hero’s two most popular models – Splendor and Passion – together accounted for ~70% of the industry’s unit sales in the segment in this period. Despite the launch of Discover 125 in March 2011 and Boxer 150 in August 2011, Bajaj’s share in this segment has been declining steadily (17% in February 2012 from 22% in March 2011). Honda (HMSI) is the 3rd player in the segment with a share of 12% (8% in March 2011).
This is the segment that we think will become very competitive post Honda’s launch of a mass bike, Dream Yuga. As is evident from the growth and market share data, Bajaj has the weakest franchise in the segment and if Honda is to gain market share, it will come from Bajaj Auto.
Fig 90 Hero Splendor dominates executive segment Fig 91 …followed by Hero Passion
Source: Company data, April 2012 Source: Company data, April 2012
Fig 92 Honda Dream Yuga is the serious challenger to Hero and Bajaj Hero Splendor Hero Passion Bajaj Discover 100 Bajaj Discover 125 HMSI Shine HMSI Dream Yuga
Engine displacement (cc) 97.2 97.2 94.38 124.6 124.6 109Maximum power (PS) 7.7 7.5 7.7 11 10.3 9.0Maximum torque (NM) 7.5 7.95 7.85 10.8 10.9 9.0Fuel efficiency (km/l) 68-73 56-70 85-89 60-78 61-68 73-79Price (Rs) 42,720 44,000 43,550 45,500 44,940 40,000Source: Company data, Macquarie Research, April 2012
Fig 93 HMCL executive segment share stable Fig 94 Bajaj sales declined, as HMSI grew production
Source: Company data, Macquarie Research, April 2012 Source: Company data, Macquarie Research, April 2012
0%
10%
20%
30%
40%
50%
60%
70%
80%
Apr-09 Oct-09 Apr-10 Oct-10 Apr-11 Oct-11
HMCL BJAUT HMSI
-20%
30%
80%
130%
180%
230%
Apr-10 Sep-10 Feb-11 Jul-11 Dec-11HMCL BJAUT HMSI
Macquarie Research India auto sector
20 April 2012 34
Premium segment – Bajaj Auto losing share to Yamaha The share of the premium segment in the total motorcycle market has remained stable ~17% over the last 12 months. This segment is dominated by Bajaj Auto. Bajaj’s most popular model, Pulsar, accounts for ~42% share of this segment. Hero has a market share of 20% in the segment as of end-March 2012 (down from 23% in March 2011). Yamaha is the third player in this segment. The company has been focusing on this segment and has a market share of 15%. We expect Yamaha and Honda to challenge Bajaj in this segment as technology becomes increasingly more important.
Fig 95 IYM SZ has gained 5% share since Sep 10 Fig 96 Bajaj’s Pulsar has lost 10% share since Sep 10
Source: Company data, April 2012 Source: Company data, April 2012
Fig 97 Yamaha SZ stands out because of aggressive pricing (2012) Yamaha SZ Yamaha FZ16 Yamaha Fazer Bajaj Pulsar 150 HMCL CBZ 150 Honda Unicorn
Engine displacement (cc) 153 153 153 149 149.2 149.1Maximum power (PS/RPM) 12.1/7,500 14.0/7,500 14.0/7,500 15.06/9,000 14.4/8,500 13.5/8,000Maximum torque (NM) 12.8/4,500 13.6/6,000 13.6/6,000 12.76/6,500 12.80/6,500 12.75/5,500Fuel efficiency (km/l) 52.9-61.2 46.4-53.2 46.4-53.2 56.5-65.0 56.0-61.2 57.0-68.0Price (Rs) 49,550 65,230 72,560 63,630 62,220 60,810Source: Company data, Macquarie Research, April 2012
Fig 98 Bajaj’s premium segment share on a decline Fig 99 Volume growth in premium segment
Source: Company data, Macquarie Research, April 2012 Source: Company data, Macquarie Research, April 2012
30%
35%
40%
45%
50%
55%
Apr-09 Oct-09 Apr-10 Oct-10 Apr-11 Oct-11
-25%
25%
75%
125%
175%
225%
Apr-10 Aug-10 Dec-10 Apr-11 Aug-11 Dec-11Bajaj Yamaha
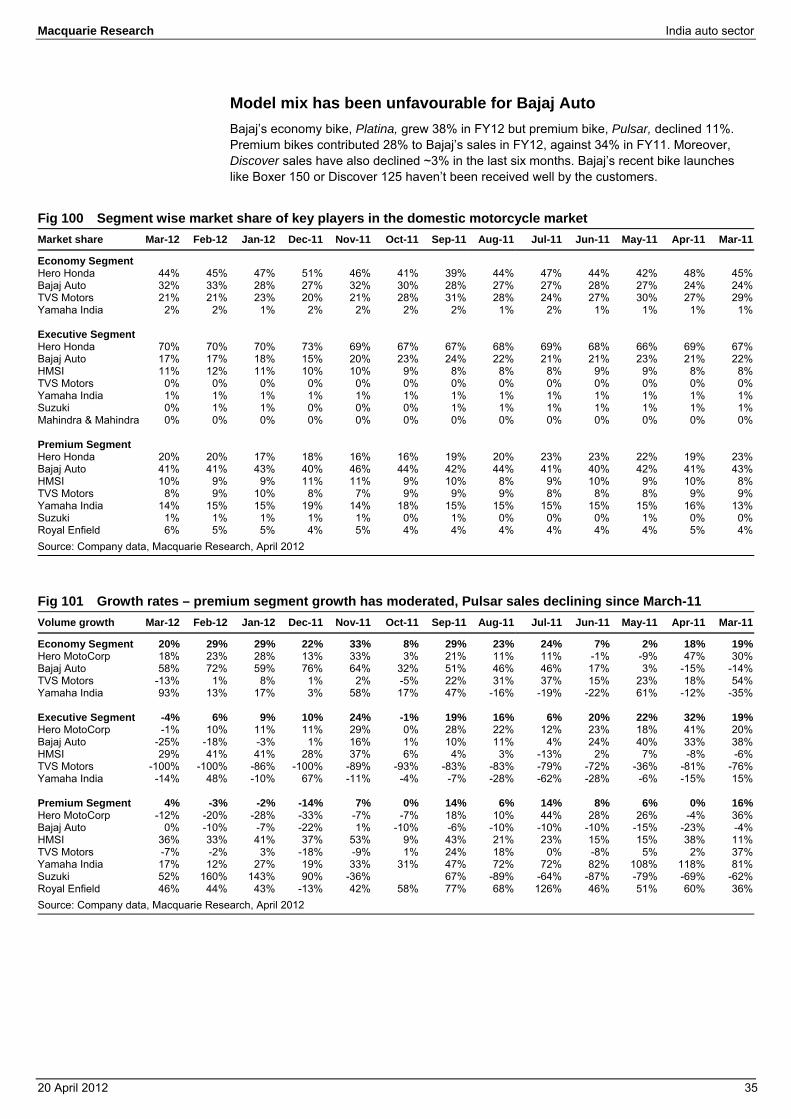
Macquarie Research India auto sector
20 April 2012 35
Model mix has been unfavourable for Bajaj Auto Bajaj’s economy bike, Platina, grew 38% in FY12 but premium bike, Pulsar, declined 11%. Premium bikes contributed 28% to Bajaj’s sales in FY12, against 34% in FY11. Moreover, Discover sales have also declined ~3% in the last six months. Bajaj’s recent bike launches like Boxer 150 or Discover 125 haven’t been received well by the customers.
Fig 100 Segment wise market share of key players in the domestic motorcycle market Market share Mar-12 Feb-12 Jan-12 Dec-11 Nov-11 Oct-11 Sep-11 Aug-11 Jul-11 Jun-11 May-11 Apr-11 Mar-11
Economy Segment Hero Honda 44% 45% 47% 51% 46% 41% 39% 44% 47% 44% 42% 48% 45%Bajaj Auto 32% 33% 28% 27% 32% 30% 28% 27% 27% 28% 27% 24% 24%TVS Motors 21% 21% 23% 20% 21% 28% 31% 28% 24% 27% 30% 27% 29%Yamaha India 2% 2% 1% 2% 2% 2% 2% 1% 2% 1% 1% 1% 1% Executive Segment Hero Honda 70% 70% 70% 73% 69% 67% 67% 68% 69% 68% 66% 69% 67%Bajaj Auto 17% 17% 18% 15% 20% 23% 24% 22% 21% 21% 23% 21% 22%HMSI 11% 12% 11% 10% 10% 9% 8% 8% 8% 9% 9% 8% 8%TVS Motors 0% 0% 0% 0% 0% 0% 0% 0% 0% 0% 0% 0% 0%Yamaha India 1% 1% 1% 1% 1% 1% 1% 1% 1% 1% 1% 1% 1%Suzuki 0% 1% 1% 0% 0% 0% 1% 1% 1% 1% 1% 1% 1%Mahindra & Mahindra 0% 0% 0% 0% 0% 0% 0% 0% 0% 0% 0% 0% 0% Premium Segment Hero Honda 20% 20% 17% 18% 16% 16% 19% 20% 23% 23% 22% 19% 23%Bajaj Auto 41% 41% 43% 40% 46% 44% 42% 44% 41% 40% 42% 41% 43%HMSI 10% 9% 9% 11% 11% 9% 10% 8% 9% 10% 9% 10% 8%TVS Motors 8% 9% 10% 8% 7% 9% 9% 9% 8% 8% 8% 9% 9%Yamaha India 14% 15% 15% 19% 14% 18% 15% 15% 15% 15% 15% 16% 13%Suzuki 1% 1% 1% 1% 1% 0% 1% 0% 0% 0% 1% 0% 0%Royal Enfield 6% 5% 5% 4% 5% 4% 4% 4% 4% 4% 4% 5% 4%Source: Company data, Macquarie Research, April 2012
Fig 101 Growth rates – premium segment growth has moderated, Pulsar sales declining since March-11 Volume growth Mar-12 Feb-12 Jan-12 Dec-11 Nov-11 Oct-11 Sep-11 Aug-11 Jul-11 Jun-11 May-11 Apr-11 Mar-11
Economy Segment 20% 29% 29% 22% 33% 8% 29% 23% 24% 7% 2% 18% 19%Hero MotoCorp 18% 23% 28% 13% 33% 3% 21% 11% 11% -1% -9% 47% 30%Bajaj Auto 58% 72% 59% 76% 64% 32% 51% 46% 46% 17% 3% -15% -14%TVS Motors -13% 1% 8% 1% 2% -5% 22% 31% 37% 15% 23% 18% 54%Yamaha India 93% 13% 17% 3% 58% 17% 47% -16% -19% -22% 61% -12% -35% Executive Segment -4% 6% 9% 10% 24% -1% 19% 16% 6% 20% 22% 32% 19%Hero MotoCorp -1% 10% 11% 11% 29% 0% 28% 22% 12% 23% 18% 41% 20%Bajaj Auto -25% -18% -3% 1% 16% 1% 10% 11% 4% 24% 40% 33% 38%HMSI 29% 41% 41% 28% 37% 6% 4% 3% -13% 2% 7% -8% -6%TVS Motors -100% -100% -86% -100% -89% -93% -83% -83% -79% -72% -36% -81% -76%Yamaha India -14% 48% -10% 67% -11% -4% -7% -28% -62% -28% -6% -15% 15% Premium Segment 4% -3% -2% -14% 7% 0% 14% 6% 14% 8% 6% 0% 16%Hero MotoCorp -12% -20% -28% -33% -7% -7% 18% 10% 44% 28% 26% -4% 36%Bajaj Auto 0% -10% -7% -22% 1% -10% -6% -10% -10% -10% -15% -23% -4%HMSI 36% 33% 41% 37% 53% 9% 43% 21% 23% 15% 15% 38% 11%TVS Motors -7% -2% 3% -18% -9% 1% 24% 18% 0% -8% 5% 2% 37%Yamaha India 17% 12% 27% 19% 33% 31% 47% 72% 72% 82% 108% 118% 81%Suzuki 52% 160% 143% 90% -36% 67% -89% -64% -87% -79% -69% -62%Royal Enfield 46% 44% 43% -13% 42% 58% 77% 68% 126% 46% 51% 60% 36%Source: Company data, Macquarie Research, April 2012
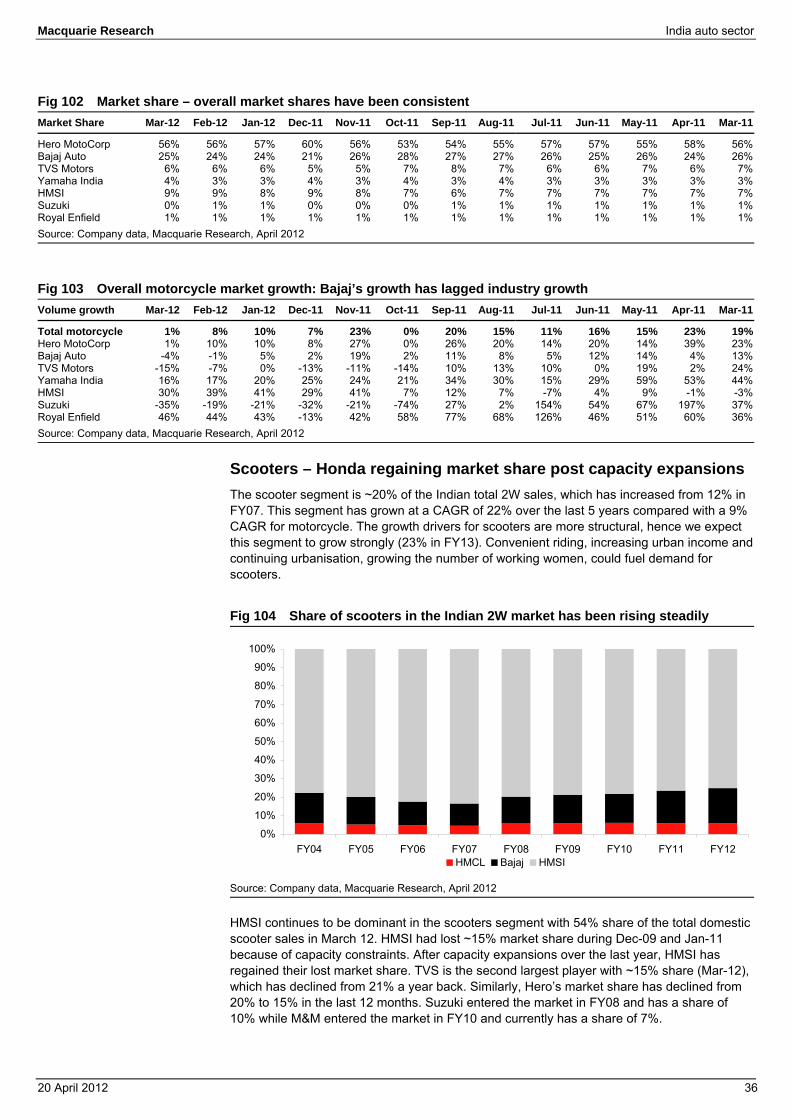
Macquarie Research India auto sector
20 April 2012 36
Fig 102 Market share – overall market shares have been consistent Market Share Mar-12 Feb-12 Jan-12 Dec-11 Nov-11 Oct-11 Sep-11 Aug-11 Jul-11 Jun-11 May-11 Apr-11 Mar-11
Hero MotoCorp 56% 56% 57% 60% 56% 53% 54% 55% 57% 57% 55% 58% 56%Bajaj Auto 25% 24% 24% 21% 26% 28% 27% 27% 26% 25% 26% 24% 26%TVS Motors 6% 6% 6% 5% 5% 7% 8% 7% 6% 6% 7% 6% 7%Yamaha India 4% 3% 3% 4% 3% 4% 3% 4% 3% 3% 3% 3% 3%HMSI 9% 9% 8% 9% 8% 7% 6% 7% 7% 7% 7% 7% 7%Suzuki 0% 1% 1% 0% 0% 0% 1% 1% 1% 1% 1% 1% 1%Royal Enfield 1% 1% 1% 1% 1% 1% 1% 1% 1% 1% 1% 1% 1%Source: Company data, Macquarie Research, April 2012
Fig 103 Overall motorcycle market growth: Bajaj’s growth has lagged industry growth Volume growth Mar-12 Feb-12 Jan-12 Dec-11 Nov-11 Oct-11 Sep-11 Aug-11 Jul-11 Jun-11 May-11 Apr-11 Mar-11
Total motorcycle 1% 8% 10% 7% 23% 0% 20% 15% 11% 16% 15% 23% 19%Hero MotoCorp 1% 10% 10% 8% 27% 0% 26% 20% 14% 20% 14% 39% 23%Bajaj Auto -4% -1% 5% 2% 19% 2% 11% 8% 5% 12% 14% 4% 13%TVS Motors -15% -7% 0% -13% -11% -14% 10% 13% 10% 0% 19% 2% 24%Yamaha India 16% 17% 20% 25% 24% 21% 34% 30% 15% 29% 59% 53% 44%HMSI 30% 39% 41% 29% 41% 7% 12% 7% -7% 4% 9% -1% -3%Suzuki -35% -19% -21% -32% -21% -74% 27% 2% 154% 54% 67% 197% 37%Royal Enfield 46% 44% 43% -13% 42% 58% 77% 68% 126% 46% 51% 60% 36%Source: Company data, Macquarie Research, April 2012
Scooters – Honda regaining market share post capacity expansions The scooter segment is ~20% of the Indian total 2W sales, which has increased from 12% in FY07. This segment has grown at a CAGR of 22% over the last 5 years compared with a 9% CAGR for motorcycle. The growth drivers for scooters are more structural, hence we expect this segment to grow strongly (23% in FY13). Convenient riding, increasing urban income and continuing urbanisation, growing the number of working women, could fuel demand for scooters.
Fig 104 Share of scooters in the Indian 2W market has been rising steadily
Source: Company data, Macquarie Research, April 2012
HMSI continues to be dominant in the scooters segment with 54% share of the total domestic scooter sales in March 12. HMSI had lost ~15% market share during Dec-09 and Jan-11 because of capacity constraints. After capacity expansions over the last year, HMSI has regained their lost market share. TVS is the second largest player with ~15% share (Mar-12), which has declined from 21% a year back. Similarly, Hero’s market share has declined from 20% to 15% in the last 12 months. Suzuki entered the market in FY08 and has a share of 10% while M&M entered the market in FY10 and currently has a share of 7%.
0%
10%
20%
30%
40%
50%
60%
70%
80%
90%
100%
FY04 FY05 FY06 FY07 FY08 FY09 FY10 FY11 FY12HMCL Bajaj HMSI
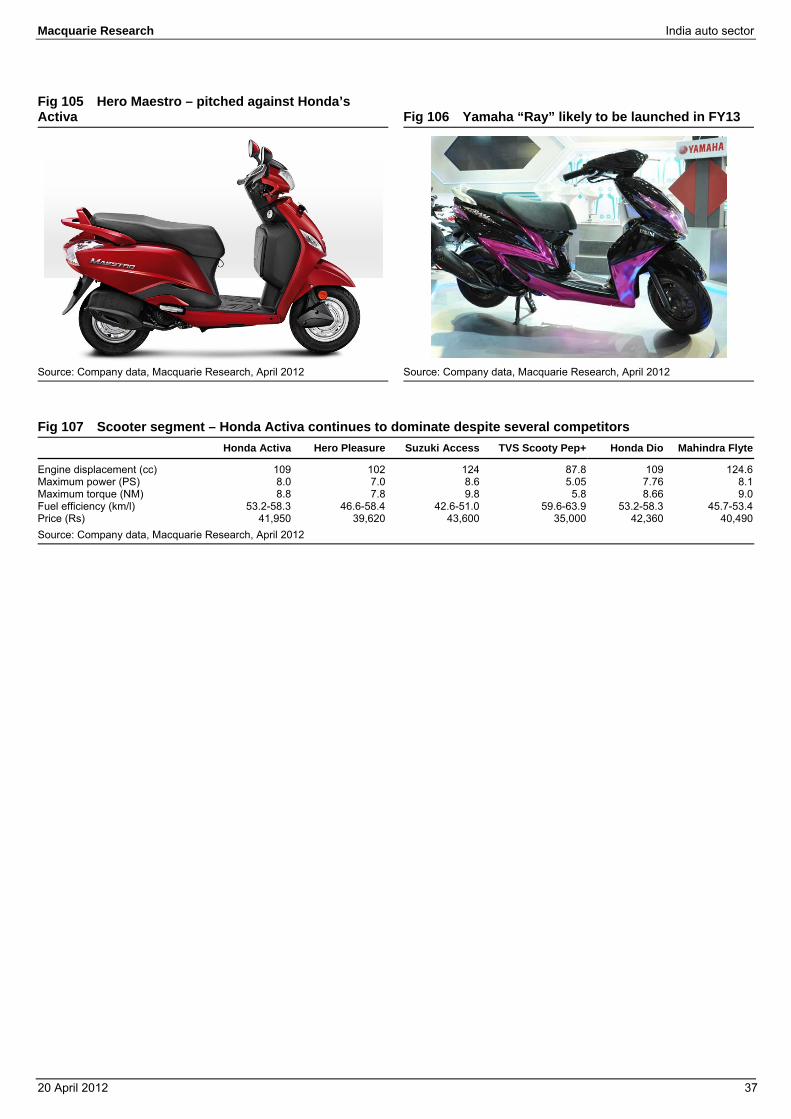
Macquarie Research India auto sector
20 April 2012 37
Fig 105 Hero Maestro – pitched against Honda’s Activa
Fig 106 Yamaha “Ray” likely to be launched in FY13
Source: Company data, Macquarie Research, April 2012 Source: Company data, Macquarie Research, April 2012
Fig 107 Scooter segment – Honda Activa continues to dominate despite several competitors Honda Activa Hero Pleasure Suzuki Access TVS Scooty Pep+ Honda Dio Mahindra Flyte
Engine displacement (cc) 109 102 124 87.8 109 124.6Maximum power (PS) 8.0 7.0 8.6 5.05 7.76 8.1Maximum torque (NM) 8.8 7.8 9.8 5.8 8.66 9.0Fuel efficiency (km/l) 53.2-58.3 46.6-58.4 42.6-51.0 59.6-63.9 53.2-58.3 45.7-53.4Price (Rs) 41,950 39,620 43,600 35,000 42,360 40,490Source: Company data, Macquarie Research, April 2012
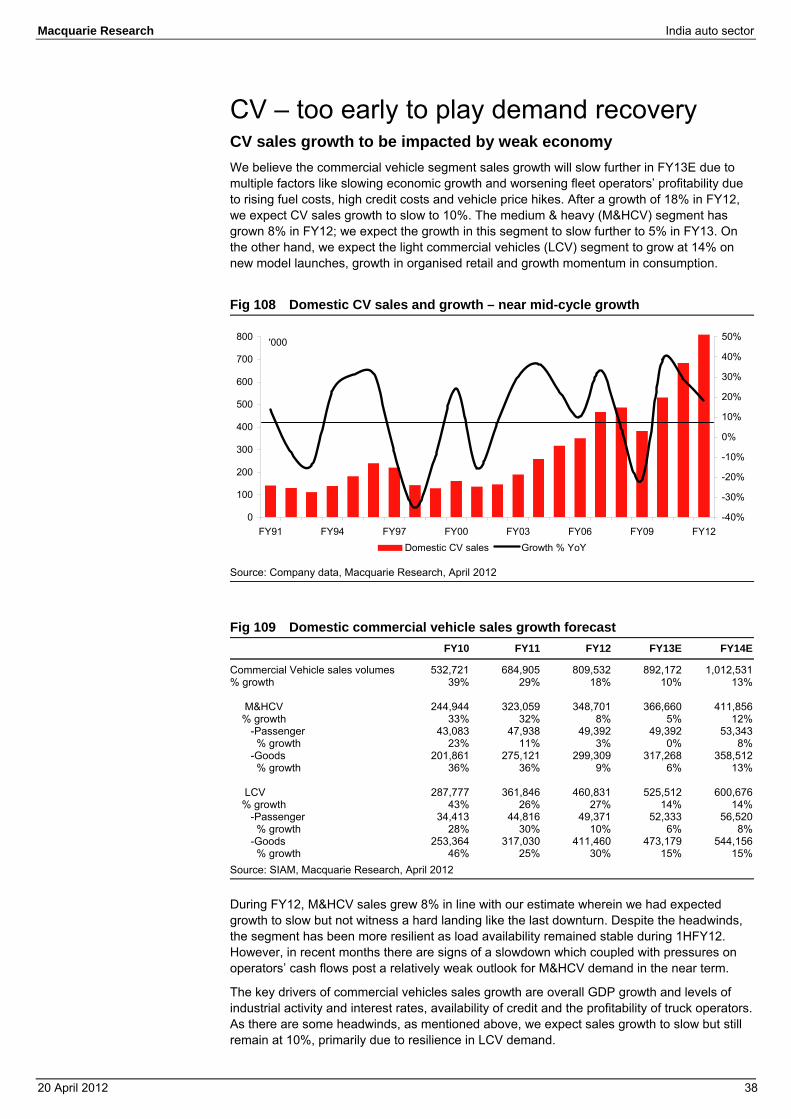
Macquarie Research India auto sector
20 April 2012 38
CV – too early to play demand recovery CV sales growth to be impacted by weak economy We believe the commercial vehicle segment sales growth will slow further in FY13E due to multiple factors like slowing economic growth and worsening fleet operators’ profitability due to rising fuel costs, high credit costs and vehicle price hikes. After a growth of 18% in FY12, we expect CV sales growth to slow to 10%. The medium & heavy (M&HCV) segment has grown 8% in FY12; we expect the growth in this segment to slow further to 5% in FY13. On the other hand, we expect the light commercial vehicles (LCV) segment to grow at 14% on new model launches, growth in organised retail and growth momentum in consumption.
Fig 108 Domestic CV sales and growth – near mid-cycle growth
Source: Company data, Macquarie Research, April 2012
Fig 109 Domestic commercial vehicle sales growth forecast FY10 FY11 FY12 FY13E FY14E
Commercial Vehicle sales volumes 532,721 684,905 809,532 892,172 1,012,531% growth 39% 29% 18% 10% 13% M&HCV 244,944 323,059 348,701 366,660 411,856 % growth 33% 32% 8% 5% 12% -Passenger 43,083 47,938 49,392 49,392 53,343 % growth 23% 11% 3% 0% 8% -Goods 201,861 275,121 299,309 317,268 358,512 % growth 36% 36% 9% 6% 13% LCV 287,777 361,846 460,831 525,512 600,676 % growth 43% 26% 27% 14% 14% -Passenger 34,413 44,816 49,371 52,333 56,520 % growth 28% 30% 10% 6% 8% -Goods 253,364 317,030 411,460 473,179 544,156 % growth 46% 25% 30% 15% 15%Source: SIAM, Macquarie Research, April 2012
During FY12, M&HCV sales grew 8% in line with our estimate wherein we had expected growth to slow but not witness a hard landing like the last downturn. Despite the headwinds, the segment has been more resilient as load availability remained stable during 1HFY12. However, in recent months there are signs of a slowdown which coupled with pressures on operators’ cash flows post a relatively weak outlook for M&HCV demand in the near term.
The key drivers of commercial vehicles sales growth are overall GDP growth and levels of industrial activity and interest rates, availability of credit and the profitability of truck operators. As there are some headwinds, as mentioned above, we expect sales growth to slow but still remain at 10%, primarily due to resilience in LCV demand.
0
100
200
300
400
500
600
700
800
FY91 FY94 FY97 FY00 FY03 FY06 FY09 FY12-40%
-30%
-20%
-10%
0%
10%
20%
30%
40%
50%
Domestic CV sales Growth % YoY
'000
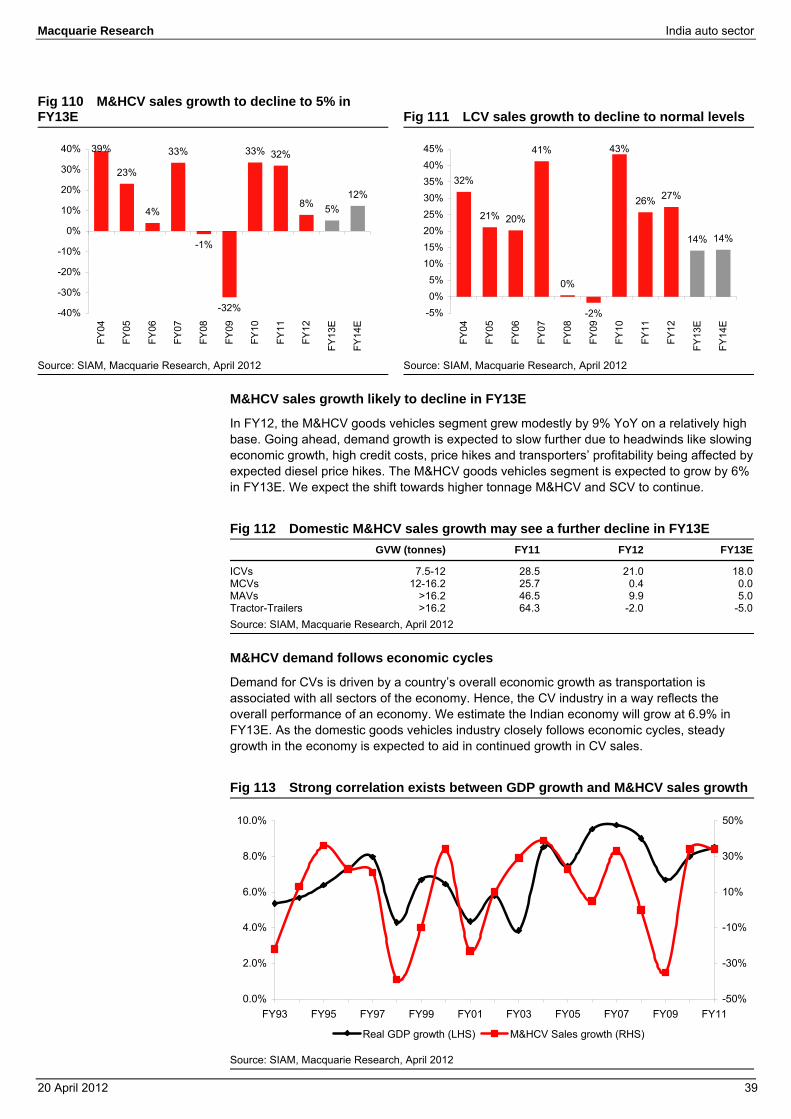
Macquarie Research India auto sector
20 April 2012 39
Fig 110 M&HCV sales growth to decline to 5% in FY13E
Fig 111 LCV sales growth to decline to normal levels
Source: SIAM, Macquarie Research, April 2012 Source: SIAM, Macquarie Research, April 2012
M&HCV sales growth likely to decline in FY13E
In FY12, the M&HCV goods vehicles segment grew modestly by 9% YoY on a relatively high base. Going ahead, demand growth is expected to slow further due to headwinds like slowing economic growth, high credit costs, price hikes and transporters’ profitability being affected by expected diesel price hikes. The M&HCV goods vehicles segment is expected to grow by 6% in FY13E. We expect the shift towards higher tonnage M&HCV and SCV to continue.
Fig 112 Domestic M&HCV sales growth may see a further decline in FY13E GVW (tonnes) FY11 FY12 FY13E
ICVs 7.5-12 28.5 21.0 18.0MCVs 12-16.2 25.7 0.4 0.0MAVs >16.2 46.5 9.9 5.0Tractor-Trailers >16.2 64.3 -2.0 -5.0Source: SIAM, Macquarie Research, April 2012
M&HCV demand follows economic cycles
Demand for CVs is driven by a country’s overall economic growth as transportation is associated with all sectors of the economy. Hence, the CV industry in a way reflects the overall performance of an economy. We estimate the Indian economy will grow at 6.9% in FY13E. As the domestic goods vehicles industry closely follows economic cycles, steady growth in the economy is expected to aid in continued growth in CV sales.
Fig 113 Strong correlation exists between GDP growth and M&HCV sales growth
Source: SIAM, Macquarie Research, April 2012
39%
23%
4%
33%
-1%
-32%
33% 32%
8% 5%12%
-40%
-30%
-20%
-10%
0%
10%
20%
30%
40%
FY04
FY05
FY06
FY07
FY08
FY09
FY10
FY11
FY12
FY13
E
FY14
E
32%
21% 20%
41%
0%
-2%
43%
26% 27%
14% 14%
-5%0%5%
10%15%20%25%30%35%40%45%
FY04
FY05
FY06
FY07
FY08
FY09
FY10
FY11
FY12
FY13
E
FY14
E
0.0%
2.0%
4.0%
6.0%
8.0%
10.0%
FY93 FY95 FY97 FY99 FY01 FY03 FY05 FY07 FY09 FY11-50%
-30%
-10%
10%
30%
50%
Real GDP growth (LHS) M&HCV Sales growth (RHS)

Macquarie Research India auto sector
20 April 2012 40
The CV industry is cyclical in nature as demand is driven by various factors such as growth in industrial and agricultural production, freight movement, the share of roadways in freight movement, changes in freight rates and fuel prices, profitability of truck operators and STUs, and government policies.
In FY09, the M&HCV industry had one of its worst years in the last 15 years, as shown in Figure 114. This ended one of the longest cycles of growth in M&HCV sales, which started in FY03. Since then, M&HCV sales have recovered strongly, registering a 34% CAGR over the two years FY09-11. However, due to the slowdown in economic growth the M&HCV sales growth slowed to 9% in FY12. While we are not expecting the M&HCV sales to de-grow in FY13E, we expect the growth to be slower compared to the last year.
Fig 114 Long-term trend for domestic M&HCV sales
Source: CMIE, Macquarie Research, April 2012
GDP growth to remain weak at sub-7% in FY13E
We expect FY13 GDP growth at 6.9% YoY. We believe the growth outlook is impaired by a slowdown in investment in view of deteriorating private corporate sentiment and the lack of policy reforms in the context of weak global economic environment. To revive India’s growth, we think there is a need for the government to concentrate on structural reforms and measures to instil confidence amongst private investors to revive the capex cycle.
Investments have slowed over the past few months owing to:
⇒ weak investor confidence on governance issues,
⇒ higher interest rates and higher inflationary pressures,
⇒ hindrances to project execution,
⇒ uncertainty about the global economy and
⇒ weak global capital markets increasing funding risks.
Our channel checks indicate that companies have not shelved plans of increasing capex but are delaying or postponing it in view of policy uncertainty and slowing demand. Considering that investment projects normally have a long gestation period, even if we see some recovery in private corporate sentiment in the second half of FY13, we expect it will be visible in growth numbers by FY14 only.
-22%
13%
36%
23% 21%
-39%
-10%
34%
-23%
10%
29%
39%
23%
5%
33%
0%
-35%
34% 34%
9%
-40%
-30%
-20%
-10%
0%
10%
20%
30%
40%
FY93
FY94
FY95
FY96
FY97
FY98
FY99
FY00
FY01
FY02
FY03
FY04
FY05
FY06
FY07
FY08
FY09
FY10
FY11
FY12
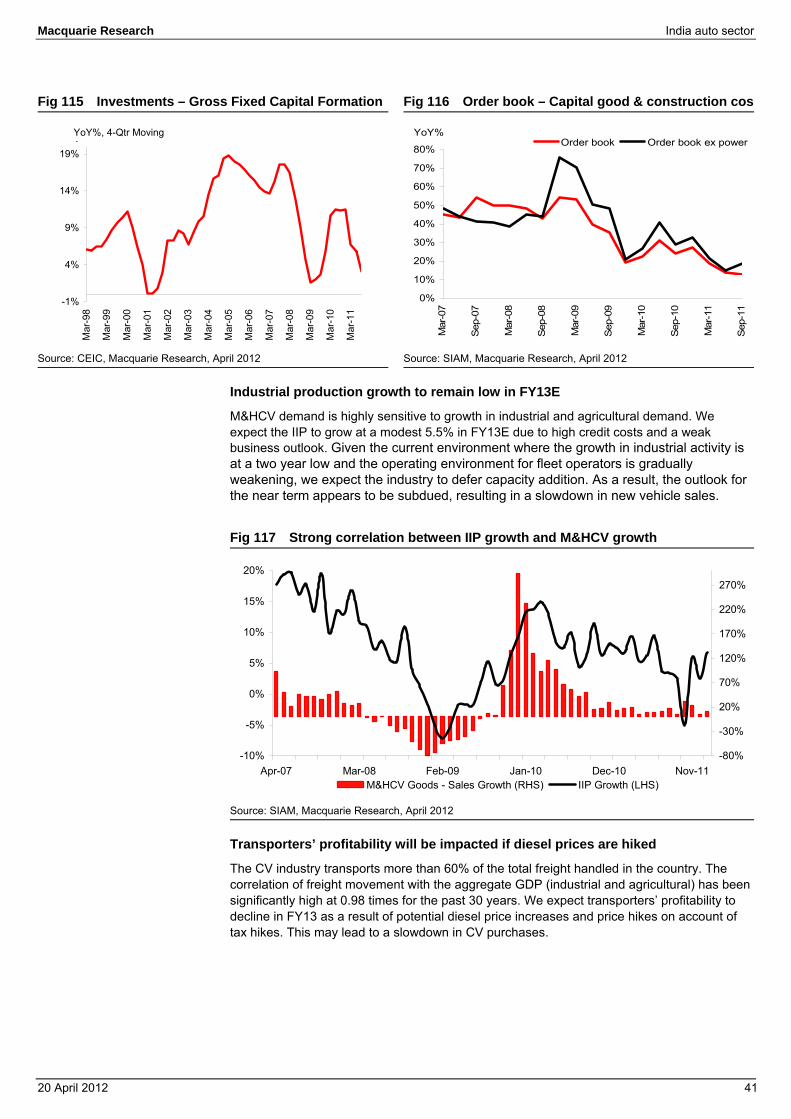
Macquarie Research India auto sector
20 April 2012 41
Fig 115 Investments – Gross Fixed Capital Formation Fig 116 Order book – Capital good & construction cos
Source: CEIC, Macquarie Research, April 2012 Source: SIAM, Macquarie Research, April 2012
Industrial production growth to remain low in FY13E
M&HCV demand is highly sensitive to growth in industrial and agricultural demand. We expect the IIP to grow at a modest 5.5% in FY13E due to high credit costs and a weak business outlook. Given the current environment where the growth in industrial activity is at a two year low and the operating environment for fleet operators is gradually weakening, we expect the industry to defer capacity addition. As a result, the outlook for the near term appears to be subdued, resulting in a slowdown in new vehicle sales.
Fig 117 Strong correlation between IIP growth and M&HCV growth
Source: SIAM, Macquarie Research, April 2012
Transporters’ profitability will be impacted if diesel prices are hiked
The CV industry transports more than 60% of the total freight handled in the country. The correlation of freight movement with the aggregate GDP (industrial and agricultural) has been significantly high at 0.98 times for the past 30 years. We expect transporters’ profitability to decline in FY13 as a result of potential diesel price increases and price hikes on account of tax hikes. This may lead to a slowdown in CV purchases.
-1%
4%
9%
14%
19%
Mar
-98
Mar
-99
Mar
-00
Mar
-01
Mar
-02
Mar
-03
Mar
-04
Mar
-05
Mar
-06
Mar
-07
Mar
-08
Mar
-09
Mar
-10
Mar
-11
YoY%, 4-Qtr Moving A
0%
10%
20%
30%
40%
50%
60%
70%
80%
Mar
-07
Sep
-07
Mar
-08
Sep
-08
Mar
-09
Sep
-09
Mar
-10
Sep
-10
Mar
-11
Sep
-11
Order book Order book ex powerYoY%
-10%
-5%
0%
5%
10%
15%
20%
Apr-07 Mar-08 Feb-09 Jan-10 Dec-10 Nov-11-80%
-30%
20%
70%
120%
170%
220%
270%
M&HCV Goods - Sales Growth (RHS) IIP Growth (LHS)
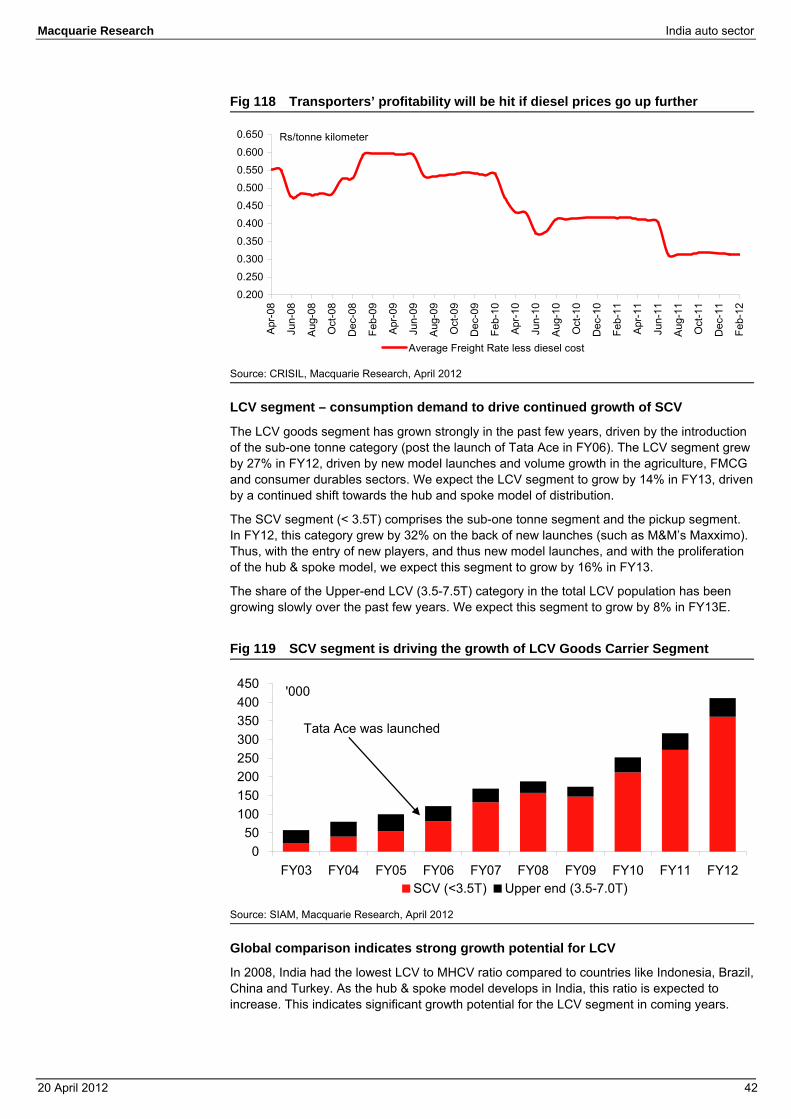
Macquarie Research India auto sector
20 April 2012 42
Fig 118 Transporters’ profitability will be hit if diesel prices go up further
Source: CRISIL, Macquarie Research, April 2012
LCV segment – consumption demand to drive continued growth of SCV
The LCV goods segment has grown strongly in the past few years, driven by the introduction of the sub-one tonne category (post the launch of Tata Ace in FY06). The LCV segment grew by 27% in FY12, driven by new model launches and volume growth in the agriculture, FMCG and consumer durables sectors. We expect the LCV segment to grow by 14% in FY13, driven by a continued shift towards the hub and spoke model of distribution.
The SCV segment (< 3.5T) comprises the sub-one tonne segment and the pickup segment. In FY12, this category grew by 32% on the back of new launches (such as M&M’s Maxximo). Thus, with the entry of new players, and thus new model launches, and with the proliferation of the hub & spoke model, we expect this segment to grow by 16% in FY13.
The share of the Upper-end LCV (3.5-7.5T) category in the total LCV population has been growing slowly over the past few years. We expect this segment to grow by 8% in FY13E.
Fig 119 SCV segment is driving the growth of LCV Goods Carrier Segment
Source: SIAM, Macquarie Research, April 2012
Global comparison indicates strong growth potential for LCV
In 2008, India had the lowest LCV to MHCV ratio compared to countries like Indonesia, Brazil, China and Turkey. As the hub & spoke model develops in India, this ratio is expected to increase. This indicates significant growth potential for the LCV segment in coming years.
0.200
0.250
0.300
0.350
0.400
0.450
0.500
0.550
0.600
0.650
Apr
-08
Jun-
08
Aug
-08
Oct
-08
Dec
-08
Feb-
09
Apr
-09
Jun-
09
Aug
-09
Oct
-09
Dec
-09
Feb-
10
Apr
-10
Jun-
10
Aug
-10
Oct
-10
Dec
-10
Feb-
11
Apr
-11
Jun-
11
Aug
-11
Oct
-11
Dec
-11
Feb-
12
Rs/tonne kilometer
Average Freight Rate less diesel cost
050
100150200250300350400450
FY03 FY04 FY05 FY06 FY07 FY08 FY09 FY10 FY11 FY12SCV (<3.5T) Upper end (3.5-7.0T)
'000
Tata Ace was launched
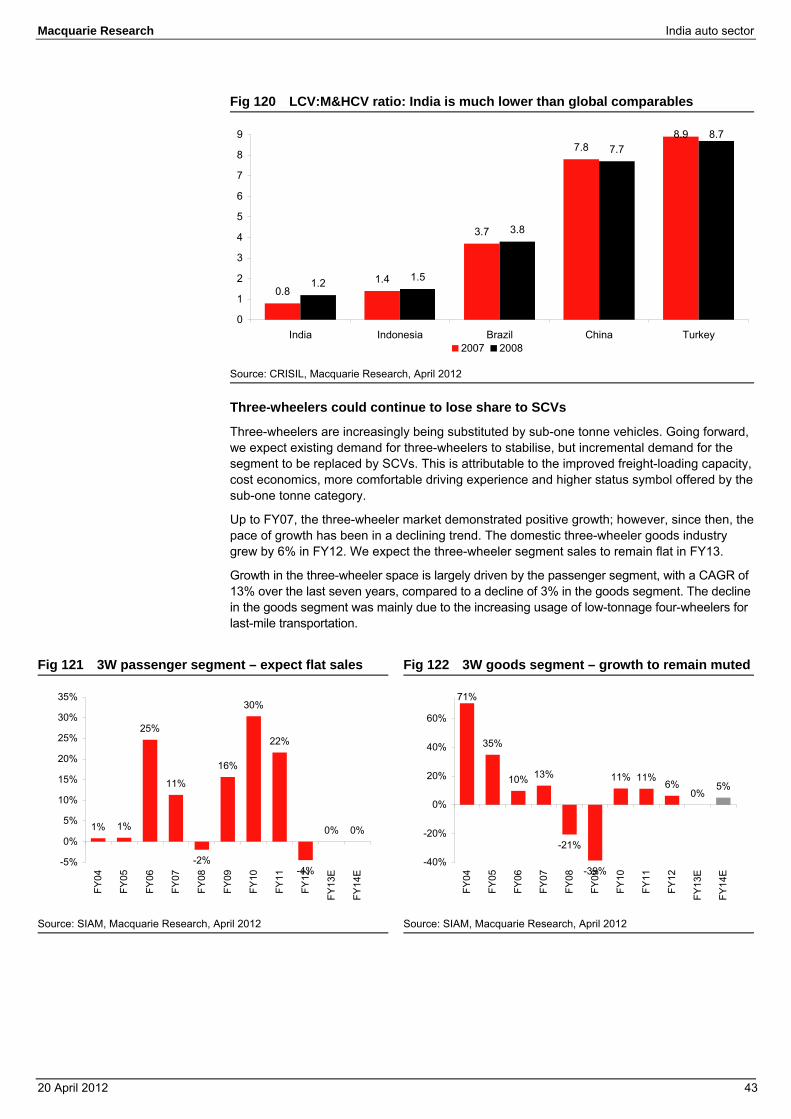
Macquarie Research India auto sector
20 April 2012 43
Fig 120 LCV:M&HCV ratio: India is much lower than global comparables
Source: CRISIL, Macquarie Research, April 2012
Three-wheelers could continue to lose share to SCVs
Three-wheelers are increasingly being substituted by sub-one tonne vehicles. Going forward, we expect existing demand for three-wheelers to stabilise, but incremental demand for the segment to be replaced by SCVs. This is attributable to the improved freight-loading capacity, cost economics, more comfortable driving experience and higher status symbol offered by the sub-one tonne category.
Up to FY07, the three-wheeler market demonstrated positive growth; however, since then, the pace of growth has been in a declining trend. The domestic three-wheeler goods industry grew by 6% in FY12. We expect the three-wheeler segment sales to remain flat in FY13.
Growth in the three-wheeler space is largely driven by the passenger segment, with a CAGR of 13% over the last seven years, compared to a decline of 3% in the goods segment. The decline in the goods segment was mainly due to the increasing usage of low-tonnage four-wheelers for last-mile transportation.
Fig 121 3W passenger segment – expect flat sales Fig 122 3W goods segment – growth to remain muted
Source: SIAM, Macquarie Research, April 2012 Source: SIAM, Macquarie Research, April 2012
0.81.4
3.7
7.88.9
1.2 1.5
3.8
7.78.7
0
1
2
3
4
5
6
7
8
9
India Indonesia Brazil China Turkey2007 2008
1% 1%
25%
11%
-2%
16%
30%
22%
-4%
0% 0%
-5%
0%
5%
10%
15%
20%
25%
30%
35%
FY04
FY05
FY06
FY07
FY08
FY09
FY10
FY11
FY12
FY13
E
FY14
E
71%
35%
10% 13%
-21%
-39%
11% 11%6%
0%5%
-40%
-20%
0%
20%
40%
60%
FY04
FY05
FY06
FY07
FY08
FY09
FY10
FY11
FY12
FY13
E
FY14
E
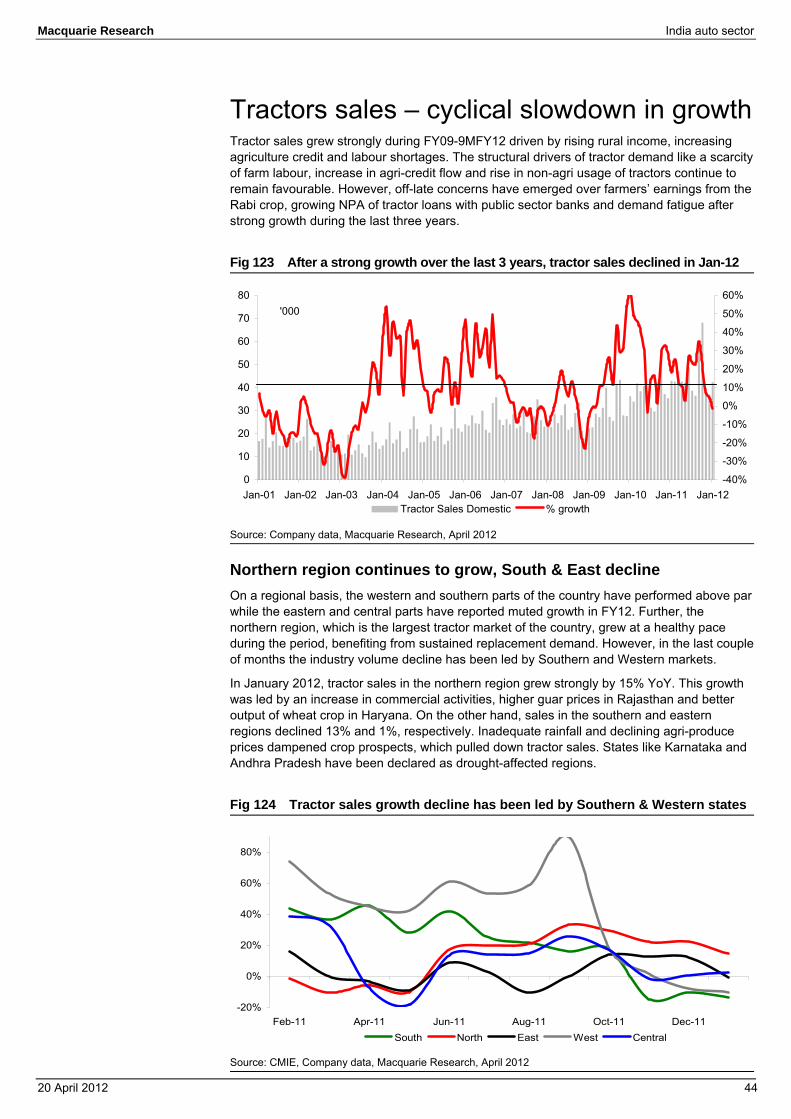
Macquarie Research India auto sector
20 April 2012 44
Tractors sales – cyclical slowdown in growth Tractor sales grew strongly during FY09-9MFY12 driven by rising rural income, increasing agriculture credit and labour shortages. The structural drivers of tractor demand like a scarcity of farm labour, increase in agri-credit flow and rise in non-agri usage of tractors continue to remain favourable. However, off-late concerns have emerged over farmers’ earnings from the Rabi crop, growing NPA of tractor loans with public sector banks and demand fatigue after strong growth during the last three years.
Fig 123 After a strong growth over the last 3 years, tractor sales declined in Jan-12
Source: Company data, Macquarie Research, April 2012
Northern region continues to grow, South & East decline On a regional basis, the western and southern parts of the country have performed above par while the eastern and central parts have reported muted growth in FY12. Further, the northern region, which is the largest tractor market of the country, grew at a healthy pace during the period, benefiting from sustained replacement demand. However, in the last couple of months the industry volume decline has been led by Southern and Western markets.
In January 2012, tractor sales in the northern region grew strongly by 15% YoY. This growth was led by an increase in commercial activities, higher guar prices in Rajasthan and better output of wheat crop in Haryana. On the other hand, sales in the southern and eastern regions declined 13% and 1%, respectively. Inadequate rainfall and declining agri-produce prices dampened crop prospects, which pulled down tractor sales. States like Karnataka and Andhra Pradesh have been declared as drought-affected regions.
Fig 124 Tractor sales growth decline has been led by Southern & Western states
Source: CMIE, Company data, Macquarie Research, April 2012
0
10
20
30
40
50
60
70
80
Jan-01 Jan-02 Jan-03 Jan-04 Jan-05 Jan-06 Jan-07 Jan-08 Jan-09 Jan-10 Jan-11 Jan-12-40%
-30%
-20%
-10%
0%
10%
20%
30%
40%
50%
60%
Tractor Sales Domestic % growth
'000
-20%
0%
20%
40%
60%
80%
Feb-11 Apr-11 Jun-11 Aug-11 Oct-11 Dec-11South North East West Central
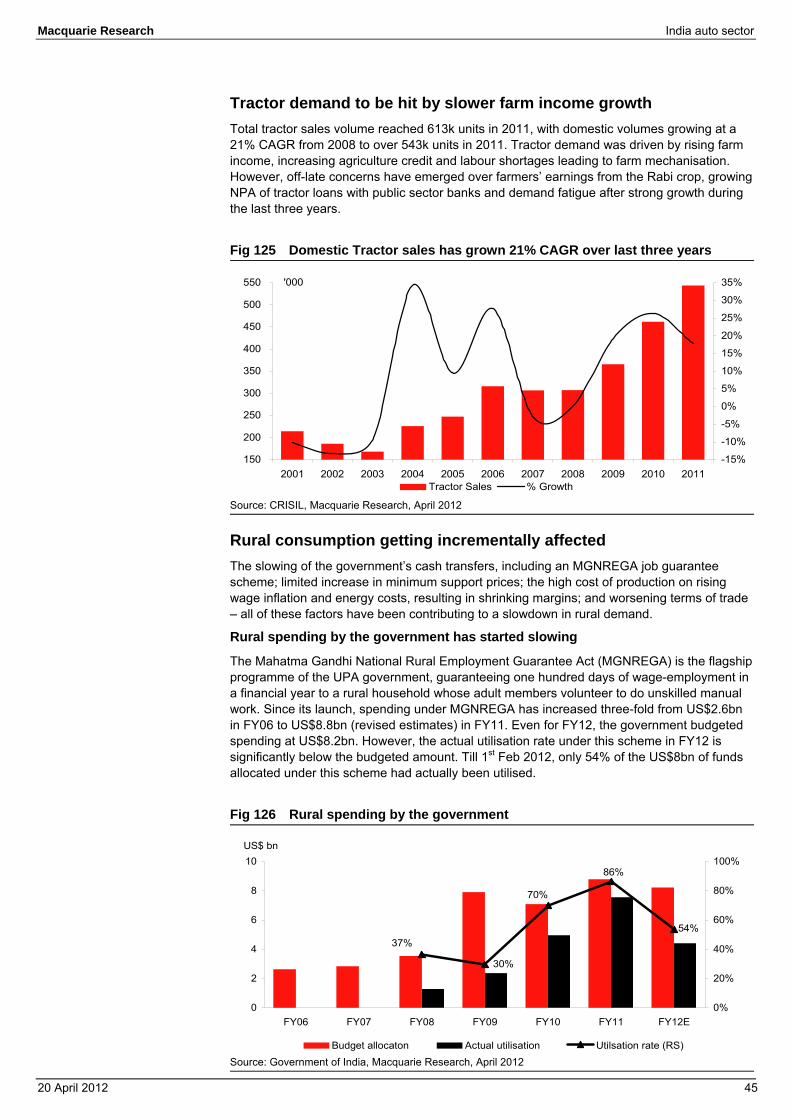
Macquarie Research India auto sector
20 April 2012 45
Tractor demand to be hit by slower farm income growth Total tractor sales volume reached 613k units in 2011, with domestic volumes growing at a 21% CAGR from 2008 to over 543k units in 2011. Tractor demand was driven by rising farm income, increasing agriculture credit and labour shortages leading to farm mechanisation. However, off-late concerns have emerged over farmers’ earnings from the Rabi crop, growing NPA of tractor loans with public sector banks and demand fatigue after strong growth during the last three years.
Fig 125 Domestic Tractor sales has grown 21% CAGR over last three years
Source: CRISIL, Macquarie Research, April 2012
Rural consumption getting incrementally affected The slowing of the government’s cash transfers, including an MGNREGA job guarantee scheme; limited increase in minimum support prices; the high cost of production on rising wage inflation and energy costs, resulting in shrinking margins; and worsening terms of trade – all of these factors have been contributing to a slowdown in rural demand.
Rural spending by the government has started slowing
The Mahatma Gandhi National Rural Employment Guarantee Act (MGNREGA) is the flagship programme of the UPA government, guaranteeing one hundred days of wage-employment in a financial year to a rural household whose adult members volunteer to do unskilled manual work. Since its launch, spending under MGNREGA has increased three-fold from US$2.6bn in FY06 to US$8.8bn (revised estimates) in FY11. Even for FY12, the government budgeted spending at US$8.2bn. However, the actual utilisation rate under this scheme in FY12 is significantly below the budgeted amount. Till 1st Feb 2012, only 54% of the US$8bn of funds allocated under this scheme had actually been utilised.
Fig 126 Rural spending by the government
Source: Government of India, Macquarie Research, April 2012
150
200
250
300
350
400
450
500
550
2001 2002 2003 2004 2005 2006 2007 2008 2009 2010 2011-15%
-10%
-5%
0%
5%
10%
15%
20%
25%
30%
35%
Tractor Sales % Growth
'000
30%
54%
86%
70%
37%
0
2
4
6
8
10
FY06 FY07 FY08 FY09 FY10 FY11 FY12E0%
20%
40%
60%
80%
100%
Budget allocaton Actual utilisation Utilsation rate (RS)
US$ bn
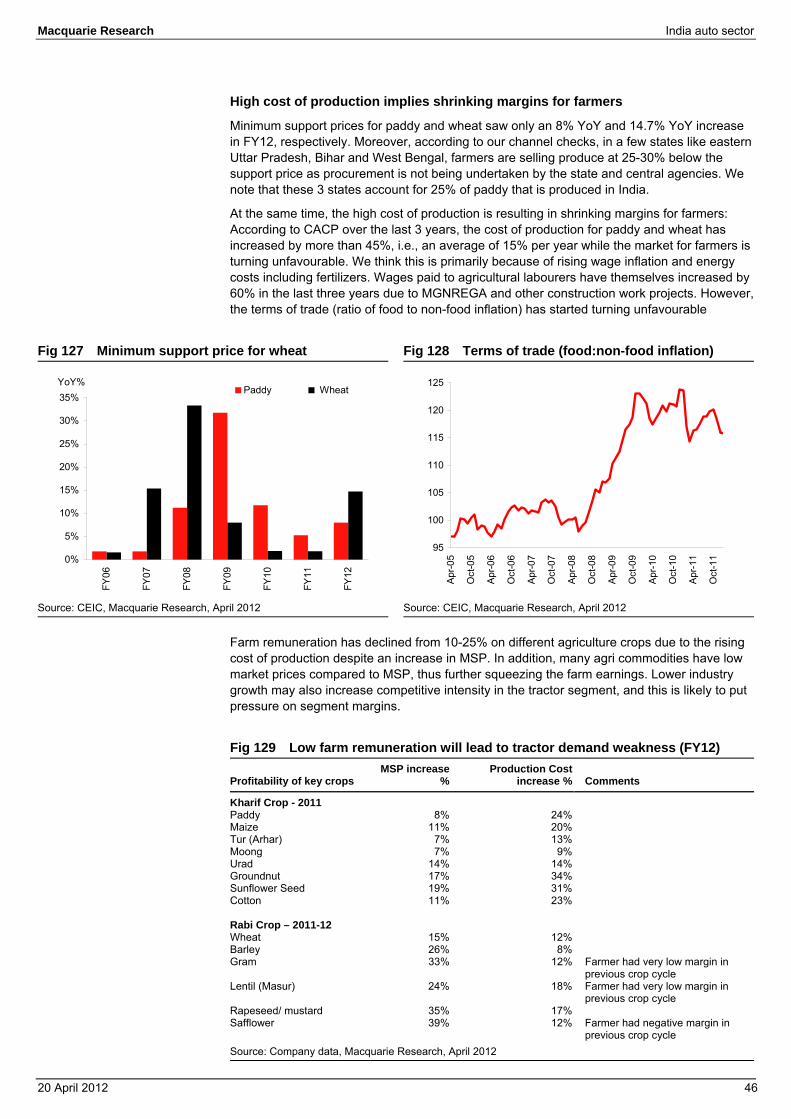
Macquarie Research India auto sector
20 April 2012 46
High cost of production implies shrinking margins for farmers
Minimum support prices for paddy and wheat saw only an 8% YoY and 14.7% YoY increase in FY12, respectively. Moreover, according to our channel checks, in a few states like eastern Uttar Pradesh, Bihar and West Bengal, farmers are selling produce at 25-30% below the support price as procurement is not being undertaken by the state and central agencies. We note that these 3 states account for 25% of paddy that is produced in India.
At the same time, the high cost of production is resulting in shrinking margins for farmers: According to CACP over the last 3 years, the cost of production for paddy and wheat has increased by more than 45%, i.e., an average of 15% per year while the market for farmers is turning unfavourable. We think this is primarily because of rising wage inflation and energy costs including fertilizers. Wages paid to agricultural labourers have themselves increased by 60% in the last three years due to MGNREGA and other construction work projects. However, the terms of trade (ratio of food to non-food inflation) has started turning unfavourable
Fig 127 Minimum support price for wheat Fig 128 Terms of trade (food:non-food inflation)
Source: CEIC, Macquarie Research, April 2012 Source: CEIC, Macquarie Research, April 2012
Farm remuneration has declined from 10-25% on different agriculture crops due to the rising cost of production despite an increase in MSP. In addition, many agri commodities have low market prices compared to MSP, thus further squeezing the farm earnings. Lower industry growth may also increase competitive intensity in the tractor segment, and this is likely to put pressure on segment margins.
Fig 129 Low farm remuneration will lead to tractor demand weakness (FY12)
Profitability of key crops MSP increase
%Production Cost
increase % Comments
Kharif Crop - 2011 Paddy 8% 24% Maize 11% 20% Tur (Arhar) 7% 13% Moong 7% 9% Urad 14% 14% Groundnut 17% 34% Sunflower Seed 19% 31% Cotton 11% 23% Rabi Crop – 2011-12 Wheat 15% 12% Barley 26% 8% Gram 33% 12% Farmer had very low margin in
previous crop cycle Lentil (Masur) 24% 18% Farmer had very low margin in
previous crop cycle Rapeseed/ mustard 35% 17% Safflower 39% 12% Farmer had negative margin in
previous crop cycle Source: Company data, Macquarie Research, April 2012
0%
5%
10%
15%
20%
25%
30%
35%
FY06
FY07
FY08
FY09
FY10
FY11
FY12
Paddy WheatYoY%
95
100
105
110
115
120
125
Apr
-05
Oct
-05
Apr
-06
Oct
-06
Apr
-07
Oct
-07
Apr
-08
Oct
-08
Apr
-09
Oct
-09
Apr
-10
Oct
-10
Apr
-11
Oct
-11
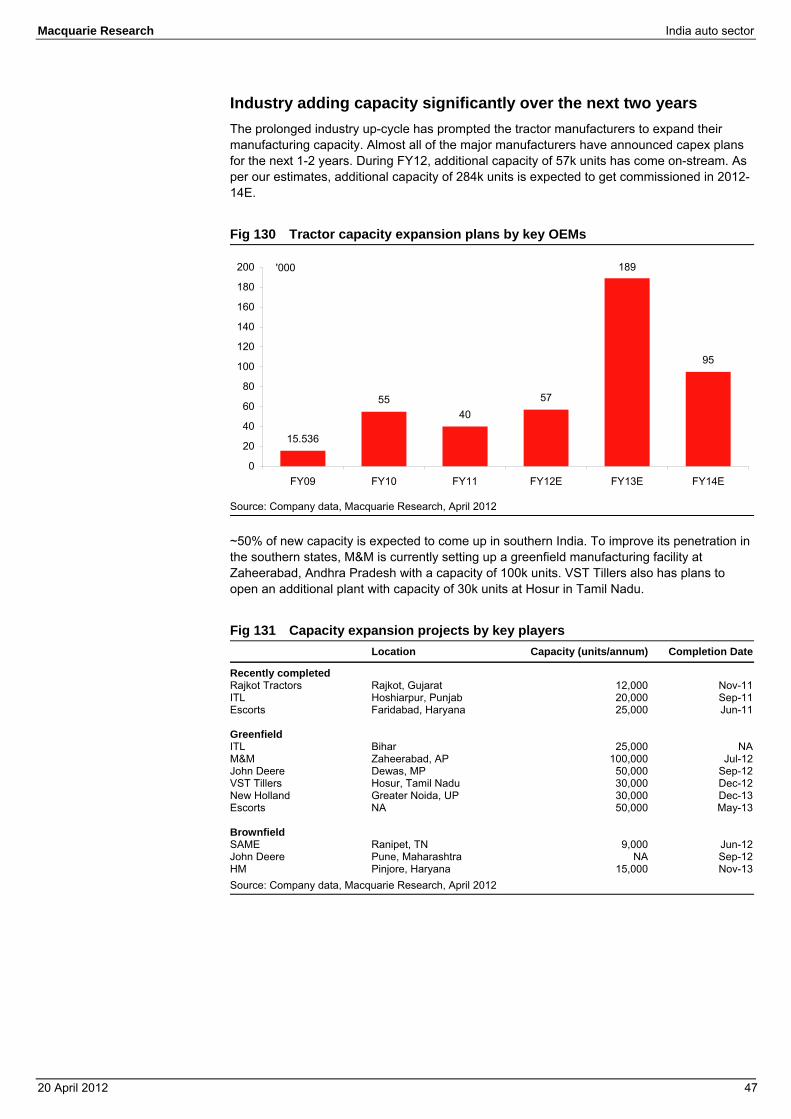
Macquarie Research India auto sector
20 April 2012 47
Industry adding capacity significantly over the next two years The prolonged industry up-cycle has prompted the tractor manufacturers to expand their manufacturing capacity. Almost all of the major manufacturers have announced capex plans for the next 1-2 years. During FY12, additional capacity of 57k units has come on-stream. As per our estimates, additional capacity of 284k units is expected to get commissioned in 2012-14E.
Fig 130 Tractor capacity expansion plans by key OEMs
Source: Company data, Macquarie Research, April 2012
~50% of new capacity is expected to come up in southern India. To improve its penetration in the southern states, M&M is currently setting up a greenfield manufacturing facility at Zaheerabad, Andhra Pradesh with a capacity of 100k units. VST Tillers also has plans to open an additional plant with capacity of 30k units at Hosur in Tamil Nadu.
Fig 131 Capacity expansion projects by key players Location Capacity (units/annum) Completion Date
Recently completed Rajkot Tractors Rajkot, Gujarat 12,000 Nov-11ITL Hoshiarpur, Punjab 20,000 Sep-11Escorts Faridabad, Haryana 25,000 Jun-11 Greenfield ITL Bihar 25,000 NAM&M Zaheerabad, AP 100,000 Jul-12John Deere Dewas, MP 50,000 Sep-12VST Tillers Hosur, Tamil Nadu 30,000 Dec-12New Holland Greater Noida, UP 30,000 Dec-13Escorts NA 50,000 May-13 Brownfield SAME Ranipet, TN 9,000 Jun-12John Deere Pune, Maharashtra NA Sep-12HM Pinjore, Haryana 15,000 Nov-13Source: Company data, Macquarie Research, April 2012
15.536
5540
57
189
95
0
20
40
60
80
100
120
140
160
180
200
FY09 FY10 FY11 FY12E FY13E FY14E
'000
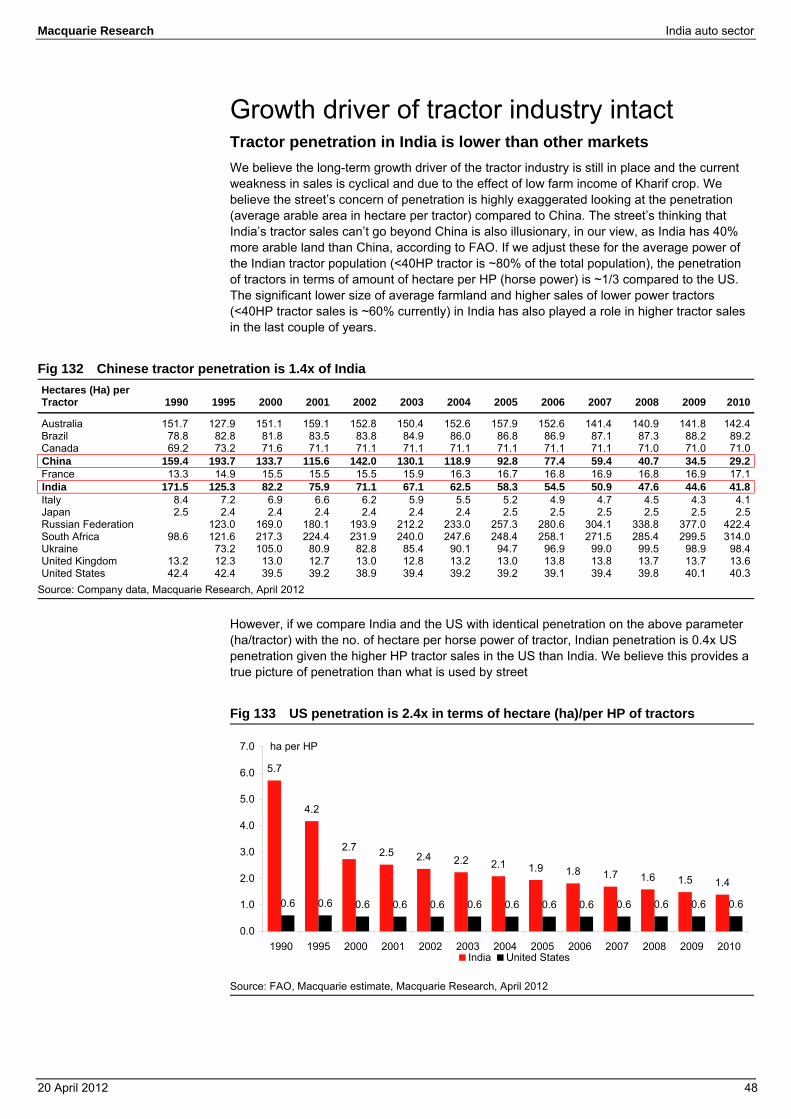
Macquarie Research India auto sector
20 April 2012 48
Growth driver of tractor industry intact Tractor penetration in India is lower than other markets We believe the long-term growth driver of the tractor industry is still in place and the current weakness in sales is cyclical and due to the effect of low farm income of Kharif crop. We believe the street’s concern of penetration is highly exaggerated looking at the penetration (average arable area in hectare per tractor) compared to China. The street’s thinking that India’s tractor sales can’t go beyond China is also illusionary, in our view, as India has 40% more arable land than China, according to FAO. If we adjust these for the average power of the Indian tractor population (<40HP tractor is ~80% of the total population), the penetration of tractors in terms of amount of hectare per HP (horse power) is ~1/3 compared to the US. The significant lower size of average farmland and higher sales of lower power tractors (<40HP tractor sales is ~60% currently) in India has also played a role in higher tractor sales in the last couple of years.
Fig 132 Chinese tractor penetration is 1.4x of India Hectares (Ha) per Tractor 1990 1995 2000 2001 2002 2003 2004 2005 2006 2007 2008 2009 2010
Australia 151.7 127.9 151.1 159.1 152.8 150.4 152.6 157.9 152.6 141.4 140.9 141.8 142.4Brazil 78.8 82.8 81.8 83.5 83.8 84.9 86.0 86.8 86.9 87.1 87.3 88.2 89.2Canada 69.2 73.2 71.6 71.1 71.1 71.1 71.1 71.1 71.1 71.1 71.0 71.0 71.0China 159.4 193.7 133.7 115.6 142.0 130.1 118.9 92.8 77.4 59.4 40.7 34.5 29.2France 13.3 14.9 15.5 15.5 15.5 15.9 16.3 16.7 16.8 16.9 16.8 16.9 17.1India 171.5 125.3 82.2 75.9 71.1 67.1 62.5 58.3 54.5 50.9 47.6 44.6 41.8Italy 8.4 7.2 6.9 6.6 6.2 5.9 5.5 5.2 4.9 4.7 4.5 4.3 4.1Japan 2.5 2.4 2.4 2.4 2.4 2.4 2.4 2.5 2.5 2.5 2.5 2.5 2.5Russian Federation 123.0 169.0 180.1 193.9 212.2 233.0 257.3 280.6 304.1 338.8 377.0 422.4South Africa 98.6 121.6 217.3 224.4 231.9 240.0 247.6 248.4 258.1 271.5 285.4 299.5 314.0Ukraine 73.2 105.0 80.9 82.8 85.4 90.1 94.7 96.9 99.0 99.5 98.9 98.4United Kingdom 13.2 12.3 13.0 12.7 13.0 12.8 13.2 13.0 13.8 13.8 13.7 13.7 13.6United States 42.4 42.4 39.5 39.2 38.9 39.4 39.2 39.2 39.1 39.4 39.8 40.1 40.3
Source: Company data, Macquarie Research, April 2012
However, if we compare India and the US with identical penetration on the above parameter (ha/tractor) with the no. of hectare per horse power of tractor, Indian penetration is 0.4x US penetration given the higher HP tractor sales in the US than India. We believe this provides a true picture of penetration than what is used by street
Fig 133 US penetration is 2.4x in terms of hectare (ha)/per HP of tractors
Source: FAO, Macquarie estimate, Macquarie Research, April 2012
5.7
4.2
2.7 2.5 2.4 2.2 2.1 1.9 1.8 1.7 1.6 1.5 1.4
0.6 0.6 0.6 0.6 0.6 0.6 0.6 0.6 0.6 0.6 0.6 0.6 0.6
0.0
1.0
2.0
3.0
4.0
5.0
6.0
7.0
1990 1995 2000 2001 2002 2003 2004 2005 2006 2007 2008 2009 2010
ha per HP
India United States
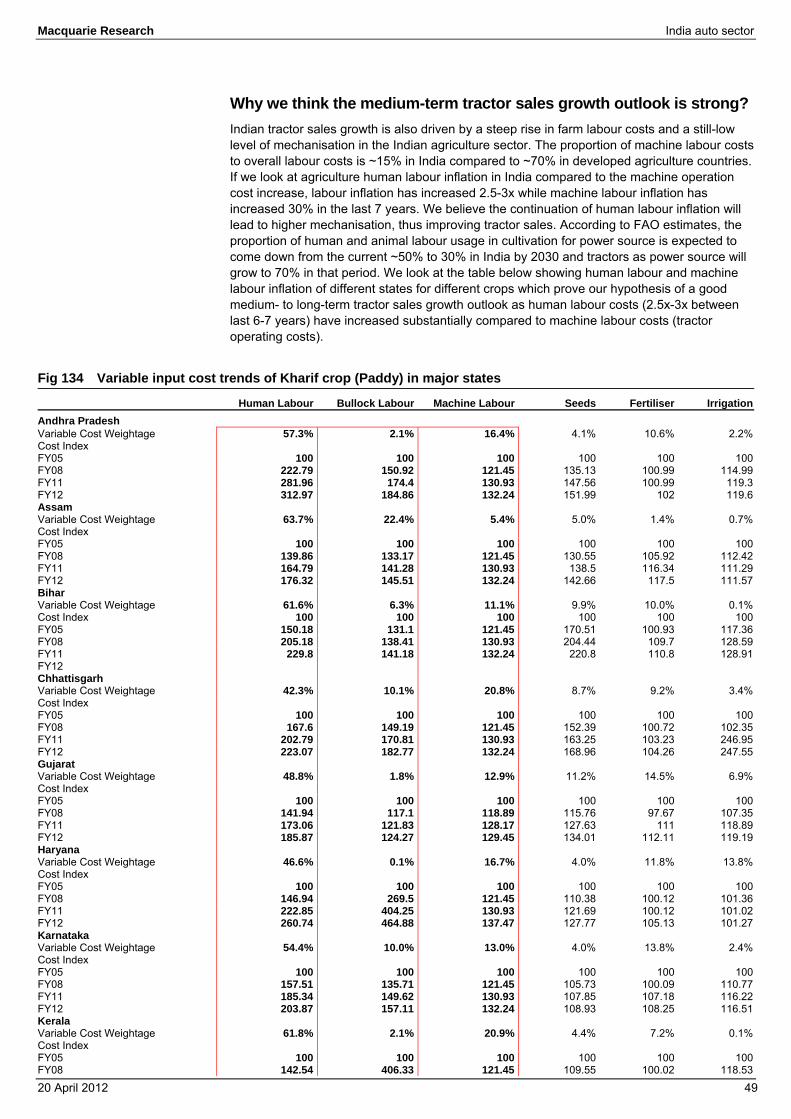
Macquarie Research India auto sector
20 April 2012 49
Why we think the medium-term tractor sales growth outlook is strong? Indian tractor sales growth is also driven by a steep rise in farm labour costs and a still-low level of mechanisation in the Indian agriculture sector. The proportion of machine labour costs to overall labour costs is ~15% in India compared to ~70% in developed agriculture countries. If we look at agriculture human labour inflation in India compared to the machine operation cost increase, labour inflation has increased 2.5-3x while machine labour inflation has increased 30% in the last 7 years. We believe the continuation of human labour inflation will lead to higher mechanisation, thus improving tractor sales. According to FAO estimates, the proportion of human and animal labour usage in cultivation for power source is expected to come down from the current ~50% to 30% in India by 2030 and tractors as power source will grow to 70% in that period. We look at the table below showing human labour and machine labour inflation of different states for different crops which prove our hypothesis of a good medium- to long-term tractor sales growth outlook as human labour costs (2.5x-3x between last 6-7 years) have increased substantially compared to machine labour costs (tractor operating costs).
Fig 134 Variable input cost trends of Kharif crop (Paddy) in major states Human Labour Bullock Labour Machine Labour Seeds Fertiliser IrrigationAndhra Pradesh Variable Cost Weightage 57.3% 2.1% 16.4% 4.1% 10.6% 2.2%Cost Index FY05 100 100 100 100 100 100FY08 222.79 150.92 121.45 135.13 100.99 114.99FY11 281.96 174.4 130.93 147.56 100.99 119.3FY12 312.97 184.86 132.24 151.99 102 119.6Assam Variable Cost Weightage 63.7% 22.4% 5.4% 5.0% 1.4% 0.7%Cost Index FY05 100 100 100 100 100 100FY08 139.86 133.17 121.45 130.55 105.92 112.42FY11 164.79 141.28 130.93 138.5 116.34 111.29FY12 176.32 145.51 132.24 142.66 117.5 111.57Bihar Variable Cost Weightage 61.6% 6.3% 11.1% 9.9% 10.0% 0.1%Cost Index 100 100 100 100 100 100FY05 150.18 131.1 121.45 170.51 100.93 117.36FY08 205.18 138.41 130.93 204.44 109.7 128.59FY11 229.8 141.18 132.24 220.8 110.8 128.91FY12 Chhattisgarh Variable Cost Weightage 42.3% 10.1% 20.8% 8.7% 9.2% 3.4%Cost Index FY05 100 100 100 100 100 100FY08 167.6 149.19 121.45 152.39 100.72 102.35FY11 202.79 170.81 130.93 163.25 103.23 246.95FY12 223.07 182.77 132.24 168.96 104.26 247.55Gujarat Variable Cost Weightage 48.8% 1.8% 12.9% 11.2% 14.5% 6.9%Cost Index FY05 100 100 100 100 100 100FY08 141.94 117.1 118.89 115.76 97.67 107.35FY11 173.06 121.83 128.17 127.63 111 118.89FY12 185.87 124.27 129.45 134.01 112.11 119.19Haryana Variable Cost Weightage 46.6% 0.1% 16.7% 4.0% 11.8% 13.8%Cost Index FY05 100 100 100 100 100 100FY08 146.94 269.5 121.45 110.38 100.12 101.36FY11 222.85 404.25 130.93 121.69 100.12 101.02FY12 260.74 464.88 137.47 127.77 105.13 101.27Karnataka Variable Cost Weightage 54.4% 10.0% 13.0% 4.0% 13.8% 2.4%Cost Index FY05 100 100 100 100 100 100FY08 157.51 135.71 121.45 105.73 100.09 110.77FY11 185.34 149.62 130.93 107.85 107.18 116.22FY12 203.87 157.11 132.24 108.93 108.25 116.51Kerala Variable Cost Weightage 61.8% 2.1% 20.9% 4.4% 7.2% 0.1%Cost Index FY05 100 100 100 100 100 100FY08 142.54 406.33 121.45 109.55 100.02 118.53
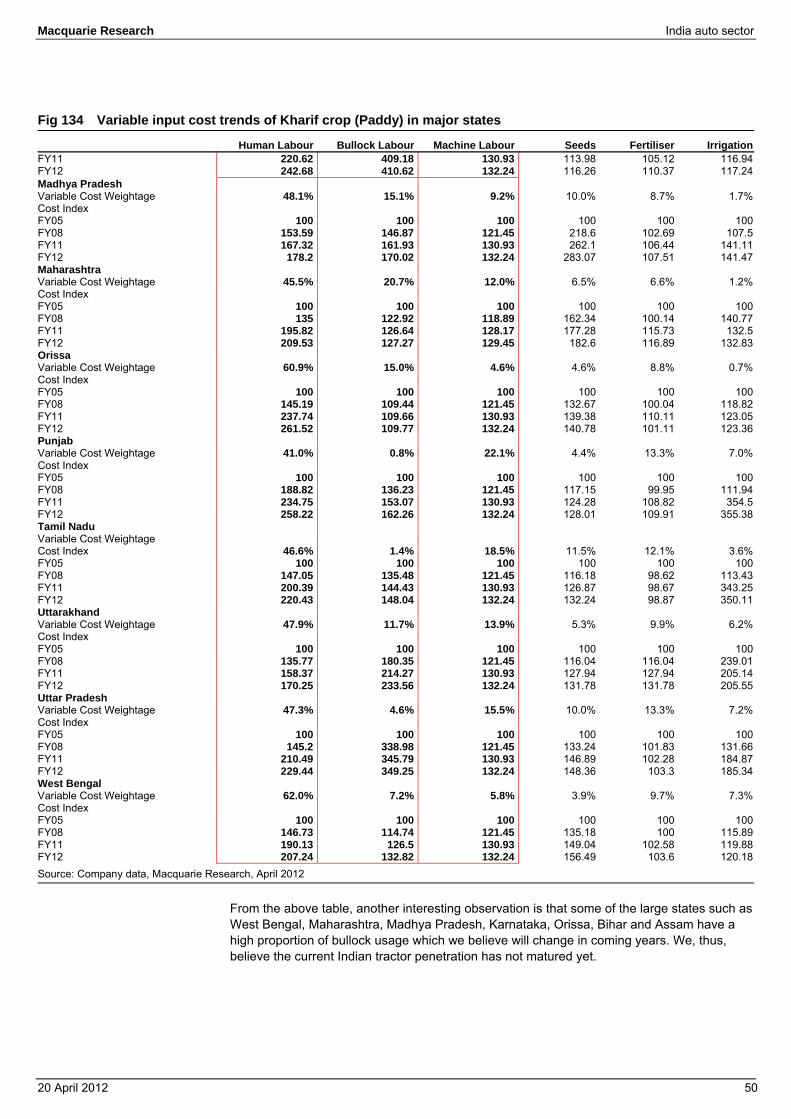
Macquarie Research India auto sector
20 April 2012 50
Fig 134 Variable input cost trends of Kharif crop (Paddy) in major states Human Labour Bullock Labour Machine Labour Seeds Fertiliser IrrigationFY11 220.62 409.18 130.93 113.98 105.12 116.94FY12 242.68 410.62 132.24 116.26 110.37 117.24Madhya Pradesh Variable Cost Weightage 48.1% 15.1% 9.2% 10.0% 8.7% 1.7%Cost Index FY05 100 100 100 100 100 100FY08 153.59 146.87 121.45 218.6 102.69 107.5FY11 167.32 161.93 130.93 262.1 106.44 141.11FY12 178.2 170.02 132.24 283.07 107.51 141.47Maharashtra Variable Cost Weightage 45.5% 20.7% 12.0% 6.5% 6.6% 1.2%Cost Index FY05 100 100 100 100 100 100FY08 135 122.92 118.89 162.34 100.14 140.77FY11 195.82 126.64 128.17 177.28 115.73 132.5FY12 209.53 127.27 129.45 182.6 116.89 132.83Orissa Variable Cost Weightage 60.9% 15.0% 4.6% 4.6% 8.8% 0.7%Cost Index FY05 100 100 100 100 100 100FY08 145.19 109.44 121.45 132.67 100.04 118.82FY11 237.74 109.66 130.93 139.38 110.11 123.05FY12 261.52 109.77 132.24 140.78 101.11 123.36Punjab Variable Cost Weightage 41.0% 0.8% 22.1% 4.4% 13.3% 7.0%Cost Index FY05 100 100 100 100 100 100FY08 188.82 136.23 121.45 117.15 99.95 111.94FY11 234.75 153.07 130.93 124.28 108.82 354.5FY12 258.22 162.26 132.24 128.01 109.91 355.38Tamil Nadu Variable Cost Weightage Cost Index 46.6% 1.4% 18.5% 11.5% 12.1% 3.6%FY05 100 100 100 100 100 100FY08 147.05 135.48 121.45 116.18 98.62 113.43FY11 200.39 144.43 130.93 126.87 98.67 343.25FY12 220.43 148.04 132.24 132.24 98.87 350.11Uttarakhand Variable Cost Weightage 47.9% 11.7% 13.9% 5.3% 9.9% 6.2%Cost Index FY05 100 100 100 100 100 100FY08 135.77 180.35 121.45 116.04 116.04 239.01FY11 158.37 214.27 130.93 127.94 127.94 205.14FY12 170.25 233.56 132.24 131.78 131.78 205.55Uttar Pradesh Variable Cost Weightage 47.3% 4.6% 15.5% 10.0% 13.3% 7.2%Cost Index FY05 100 100 100 100 100 100FY08 145.2 338.98 121.45 133.24 101.83 131.66FY11 210.49 345.79 130.93 146.89 102.28 184.87FY12 229.44 349.25 132.24 148.36 103.3 185.34West Bengal Variable Cost Weightage 62.0% 7.2% 5.8% 3.9% 9.7% 7.3%Cost Index FY05 100 100 100 100 100 100FY08 146.73 114.74 121.45 135.18 100 115.89FY11 190.13 126.5 130.93 149.04 102.58 119.88FY12 207.24 132.82 132.24 156.49 103.6 120.18Source: Company data, Macquarie Research, April 2012
From the above table, another interesting observation is that some of the large states such as West Bengal, Maharashtra, Madhya Pradesh, Karnataka, Orissa, Bihar and Assam have a high proportion of bullock usage which we believe will change in coming years. We, thus, believe the current Indian tractor penetration has not matured yet.
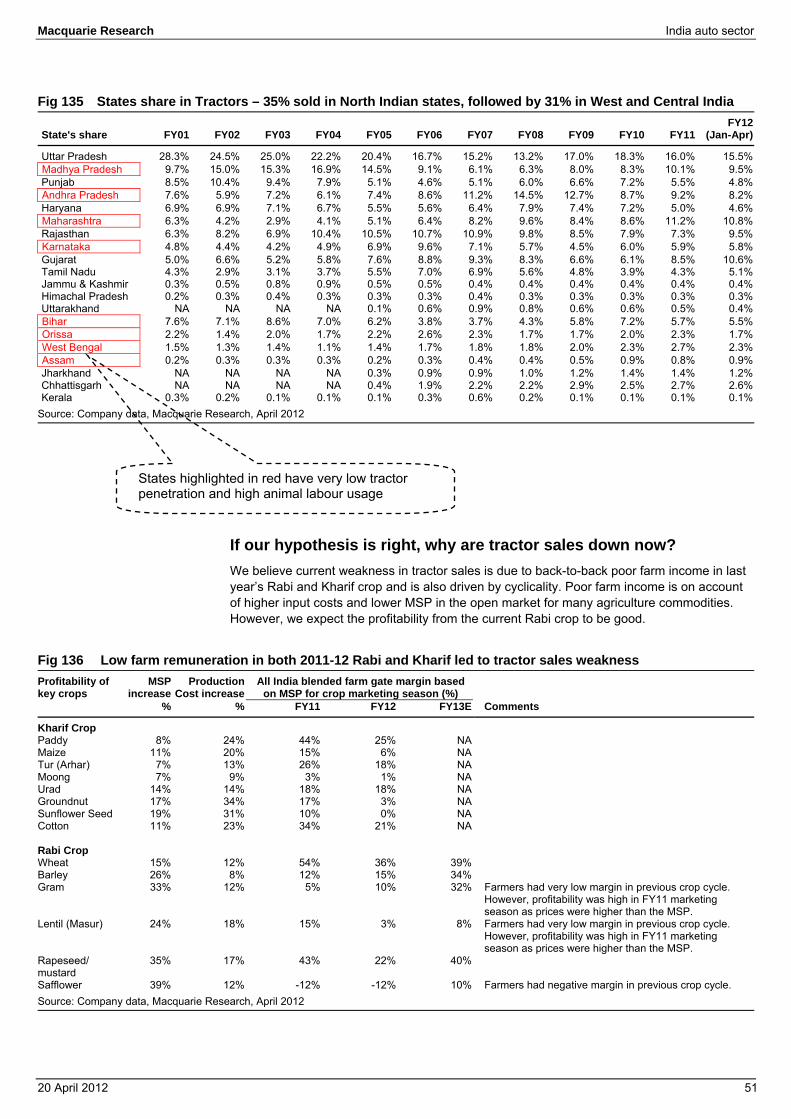
Macquarie Research India auto sector
20 April 2012 51
Fig 135 States share in Tractors – 35% sold in North Indian states, followed by 31% in West and Central India
State's share FY01 FY02 FY03 FY04 FY05 FY06 FY07 FY08 FY09 FY10 FY11FY12
(Jan-Apr)
Uttar Pradesh 28.3% 24.5% 25.0% 22.2% 20.4% 16.7% 15.2% 13.2% 17.0% 18.3% 16.0% 15.5%Madhya Pradesh 9.7% 15.0% 15.3% 16.9% 14.5% 9.1% 6.1% 6.3% 8.0% 8.3% 10.1% 9.5%Punjab 8.5% 10.4% 9.4% 7.9% 5.1% 4.6% 5.1% 6.0% 6.6% 7.2% 5.5% 4.8%Andhra Pradesh 7.6% 5.9% 7.2% 6.1% 7.4% 8.6% 11.2% 14.5% 12.7% 8.7% 9.2% 8.2%Haryana 6.9% 6.9% 7.1% 6.7% 5.5% 5.6% 6.4% 7.9% 7.4% 7.2% 5.0% 4.6%Maharashtra 6.3% 4.2% 2.9% 4.1% 5.1% 6.4% 8.2% 9.6% 8.4% 8.6% 11.2% 10.8%Rajasthan 6.3% 8.2% 6.9% 10.4% 10.5% 10.7% 10.9% 9.8% 8.5% 7.9% 7.3% 9.5%Karnataka 4.8% 4.4% 4.2% 4.9% 6.9% 9.6% 7.1% 5.7% 4.5% 6.0% 5.9% 5.8%Gujarat 5.0% 6.6% 5.2% 5.8% 7.6% 8.8% 9.3% 8.3% 6.6% 6.1% 8.5% 10.6%Tamil Nadu 4.3% 2.9% 3.1% 3.7% 5.5% 7.0% 6.9% 5.6% 4.8% 3.9% 4.3% 5.1%Jammu & Kashmir 0.3% 0.5% 0.8% 0.9% 0.5% 0.5% 0.4% 0.4% 0.4% 0.4% 0.4% 0.4%Himachal Pradesh 0.2% 0.3% 0.4% 0.3% 0.3% 0.3% 0.4% 0.3% 0.3% 0.3% 0.3% 0.3%Uttarakhand NA NA NA NA 0.1% 0.6% 0.9% 0.8% 0.6% 0.6% 0.5% 0.4%Bihar 7.6% 7.1% 8.6% 7.0% 6.2% 3.8% 3.7% 4.3% 5.8% 7.2% 5.7% 5.5%Orissa 2.2% 1.4% 2.0% 1.7% 2.2% 2.6% 2.3% 1.7% 1.7% 2.0% 2.3% 1.7%West Bengal 1.5% 1.3% 1.4% 1.1% 1.4% 1.7% 1.8% 1.8% 2.0% 2.3% 2.7% 2.3%Assam 0.2% 0.3% 0.3% 0.3% 0.2% 0.3% 0.4% 0.4% 0.5% 0.9% 0.8% 0.9%Jharkhand NA NA NA NA 0.3% 0.9% 0.9% 1.0% 1.2% 1.4% 1.4% 1.2%Chhattisgarh NA NA NA NA 0.4% 1.9% 2.2% 2.2% 2.9% 2.5% 2.7% 2.6%Kerala 0.3% 0.2% 0.1% 0.1% 0.1% 0.3% 0.6% 0.2% 0.1% 0.1% 0.1% 0.1%
Source: Company data, Macquarie Research, April 2012
If our hypothesis is right, why are tractor sales down now? We believe current weakness in tractor sales is due to back-to-back poor farm income in last year’s Rabi and Kharif crop and is also driven by cyclicality. Poor farm income is on account of higher input costs and lower MSP in the open market for many agriculture commodities. However, we expect the profitability from the current Rabi crop to be good.
Fig 136 Low farm remuneration in both 2011-12 Rabi and Kharif led to tractor sales weakness Profitability of key crops
MSP increase
ProductionCost increase
All India blended farm gate margin based on MSP for crop marketing season (%)
% % FY11 FY12 FY13E Comments
Kharif Crop Paddy 8% 24% 44% 25% NA Maize 11% 20% 15% 6% NA Tur (Arhar) 7% 13% 26% 18% NA Moong 7% 9% 3% 1% NA Urad 14% 14% 18% 18% NA Groundnut 17% 34% 17% 3% NA Sunflower Seed 19% 31% 10% 0% NA Cotton 11% 23% 34% 21% NA Rabi Crop Wheat 15% 12% 54% 36% 39% Barley 26% 8% 12% 15% 34% Gram 33% 12% 5% 10% 32% Farmers had very low margin in previous crop cycle.
However, profitability was high in FY11 marketing season as prices were higher than the MSP.
Lentil (Masur) 24% 18% 15% 3% 8% Farmers had very low margin in previous crop cycle. However, profitability was high in FY11 marketing season as prices were higher than the MSP.
Rapeseed/ mustard
35% 17% 43% 22% 40%
Safflower 39% 12% -12% -12% 10% Farmers had negative margin in previous crop cycle. Source: Company data, Macquarie Research, April 2012
States highlighted in red have very low tractor penetration and high animal labour usage
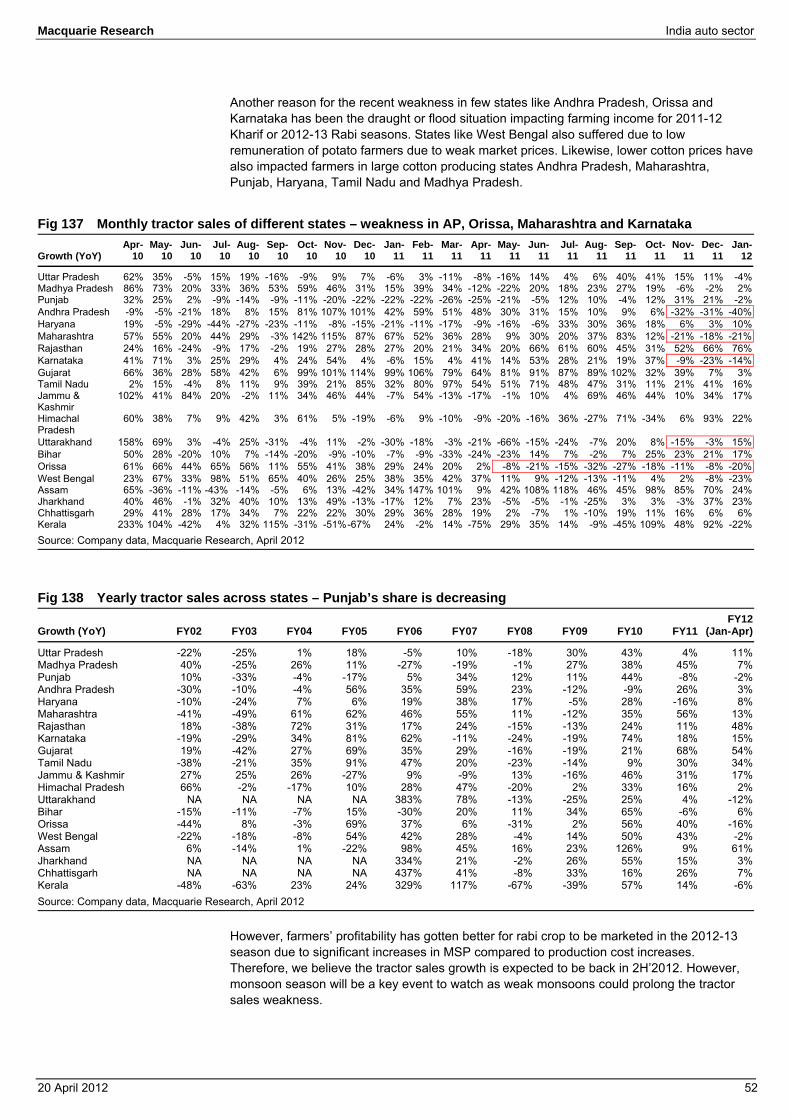
Macquarie Research India auto sector
20 April 2012 52
Another reason for the recent weakness in few states like Andhra Pradesh, Orissa and Karnataka has been the draught or flood situation impacting farming income for 2011-12 Kharif or 2012-13 Rabi seasons. States like West Bengal also suffered due to low remuneration of potato farmers due to weak market prices. Likewise, lower cotton prices have also impacted farmers in large cotton producing states Andhra Pradesh, Maharashtra, Punjab, Haryana, Tamil Nadu and Madhya Pradesh.
Fig 137 Monthly tractor sales of different states – weakness in AP, Orissa, Maharashtra and Karnataka
Growth (YoY) Apr-
10 May-
10 Jun-
10 Jul-
10 Aug-
10 Sep-
10 Oct-
10 Nov-
10Dec-
10Jan-
11Feb-
11Mar-
11Apr-
11May-
11Jun-
11Jul-
11 Aug-
11 Sep-
11 Oct-
11Nov-
11Dec-
11Jan-
12
Uttar Pradesh 62% 35% -5% 15% 19% -16% -9% 9% 7% -6% 3% -11% -8% -16% 14% 4% 6% 40% 41% 15% 11% -4%Madhya Pradesh 86% 73% 20% 33% 36% 53% 59% 46% 31% 15% 39% 34% -12% -22% 20% 18% 23% 27% 19% -6% -2% 2%Punjab 32% 25% 2% -9% -14% -9% -11% -20% -22% -22% -22% -26% -25% -21% -5% 12% 10% -4% 12% 31% 21% -2%Andhra Pradesh -9% -5% -21% 18% 8% 15% 81% 107% 101% 42% 59% 51% 48% 30% 31% 15% 10% 9% 6% -32% -31% -40%Haryana 19% -5% -29% -44% -27% -23% -11% -8% -15% -21% -11% -17% -9% -16% -6% 33% 30% 36% 18% 6% 3% 10%Maharashtra 57% 55% 20% 44% 29% -3% 142% 115% 87% 67% 52% 36% 28% 9% 30% 20% 37% 83% 12% -21% -18% -21%Rajasthan 24% 16% -24% -9% 17% -2% 19% 27% 28% 27% 20% 21% 34% 20% 66% 61% 60% 45% 31% 52% 66% 76%Karnataka 41% 71% 3% 25% 29% 4% 24% 54% 4% -6% 15% 4% 41% 14% 53% 28% 21% 19% 37% -9% -23% -14%Gujarat 66% 36% 28% 58% 42% 6% 99% 101% 114% 99% 106% 79% 64% 81% 91% 87% 89% 102% 32% 39% 7% 3%Tamil Nadu 2% 15% -4% 8% 11% 9% 39% 21% 85% 32% 80% 97% 54% 51% 71% 48% 47% 31% 11% 21% 41% 16%Jammu & Kashmir
102% 41% 84% 20% -2% 11% 34% 46% 44% -7% 54% -13% -17% -1% 10% 4% 69% 46% 44% 10% 34% 17%
Himachal Pradesh
60% 38% 7% 9% 42% 3% 61% 5% -19% -6% 9% -10% -9% -20% -16% 36% -27% 71% -34% 6% 93% 22%
Uttarakhand 158% 69% 3% -4% 25% -31% -4% 11% -2% -30% -18% -3% -21% -66% -15% -24% -7% 20% 8% -15% -3% 15%Bihar 50% 28% -20% 10% 7% -14% -20% -9% -10% -7% -9% -33% -24% -23% 14% 7% -2% 7% 25% 23% 21% 17%Orissa 61% 66% 44% 65% 56% 11% 55% 41% 38% 29% 24% 20% 2% -8% -21% -15% -32% -27% -18% -11% -8% -20%West Bengal 23% 67% 33% 98% 51% 65% 40% 26% 25% 38% 35% 42% 37% 11% 9% -12% -13% -11% 4% 2% -8% -23%Assam 65% -36% -11% -43% -14% -5% 6% 13% -42% 34% 147% 101% 9% 42% 108% 118% 46% 45% 98% 85% 70% 24%Jharkhand 40% 46% -1% 32% 40% 10% 13% 49% -13% -17% 12% 7% 23% -5% -5% -1% -25% 3% 3% -3% 37% 23%Chhattisgarh 29% 41% 28% 17% 34% 7% 22% 22% 30% 29% 36% 28% 19% 2% -7% 1% -10% 19% 11% 16% 6% 6%Kerala 233% 104% -42% 4% 32% 115% -31% -51%-67% 24% -2% 14% -75% 29% 35% 14% -9% -45% 109% 48% 92% -22%Source: Company data, Macquarie Research, April 2012
Fig 138 Yearly tractor sales across states – Punjab’s share is decreasing
Growth (YoY) FY02 FY03 FY04 FY05 FY06 FY07 FY08 FY09 FY10 FY11FY12
(Jan-Apr)
Uttar Pradesh -22% -25% 1% 18% -5% 10% -18% 30% 43% 4% 11%Madhya Pradesh 40% -25% 26% 11% -27% -19% -1% 27% 38% 45% 7%Punjab 10% -33% -4% -17% 5% 34% 12% 11% 44% -8% -2%Andhra Pradesh -30% -10% -4% 56% 35% 59% 23% -12% -9% 26% 3%Haryana -10% -24% 7% 6% 19% 38% 17% -5% 28% -16% 8%Maharashtra -41% -49% 61% 62% 46% 55% 11% -12% 35% 56% 13%Rajasthan 18% -38% 72% 31% 17% 24% -15% -13% 24% 11% 48%Karnataka -19% -29% 34% 81% 62% -11% -24% -19% 74% 18% 15%Gujarat 19% -42% 27% 69% 35% 29% -16% -19% 21% 68% 54%Tamil Nadu -38% -21% 35% 91% 47% 20% -23% -14% 9% 30% 34%Jammu & Kashmir 27% 25% 26% -27% 9% -9% 13% -16% 46% 31% 17%Himachal Pradesh 66% -2% -17% 10% 28% 47% -20% 2% 33% 16% 2%Uttarakhand NA NA NA NA 383% 78% -13% -25% 25% 4% -12%Bihar -15% -11% -7% 15% -30% 20% 11% 34% 65% -6% 6%Orissa -44% 8% -3% 69% 37% 6% -31% 2% 56% 40% -16%West Bengal -22% -18% -8% 54% 42% 28% -4% 14% 50% 43% -2%Assam 6% -14% 1% -22% 98% 45% 16% 23% 126% 9% 61%Jharkhand NA NA NA NA 334% 21% -2% 26% 55% 15% 3%Chhattisgarh NA NA NA NA 437% 41% -8% 33% 16% 26% 7%Kerala -48% -63% 23% 24% 329% 117% -67% -39% 57% 14% -6%Source: Company data, Macquarie Research, April 2012
However, farmers’ profitability has gotten better for rabi crop to be marketed in the 2012-13 season due to significant increases in MSP compared to production cost increases. Therefore, we believe the tractor sales growth is expected to be back in 2H’2012. However, monsoon season will be a key event to watch as weak monsoons could prolong the tractor sales weakness.

Macquarie Research India auto sector
20 April 2012 53
Margin outlook – mix & competition to drive Auto companies have witnessed a decline in operating margins in the domestic business over the last four quarters primarily due to higher raw material costs. In the coming quarters, we believe model/segment mix, competitive pressure and a slowdown in growth will be the key determinants of margins, unlike in FY12 when the ability to manage commodity price inflation was the key. While material costs will remain on our radar, we believe prices of key commodities will remain stable or lower over the next few quarters.
Fig 139 We expect operating margins to improve for MSIL, TTMT & HMCL
Source: Company data, Macquarie Research, April 2012
Maruti’s margin to expand on model mix and operating leverage A superior model mix (higher Swift and Dzire volumes as well as the new Ertiga) will have a positive impact on Maruti’s average realization and thus on margins. Even within the same model, the higher priced diesel variants are outselling petrol variants. Additionally, lower excise duty on new compact Dzire, recent price hikes as well as a decline in the average discounts will add up to the higher realizations. In Feb-12, Swift and Dzire became the 2nd and 3rd largest selling model in the Indian car market (largest selling is also Maruti Alto).
We expect Maruti’s margins to improve significantly (~240bpYoY) in FY13E. Key margin drivers will be favourable model mix, improving realizations, benign raw material costs and benefiting from operating leverage as production ramps up at Manesar. Yen depreciation, if continued (~10% since last 2-months), can provide even further upside to our margin estimates. Given the slowdown in sales growth last year, Maruti embarked on various cost reduction projects, which we expect will yield benefits in the medium term.
-550
-350
-150
50
250
450
650
850
BJAUT HMCL MSIL TTMT MM AL
FY10 FY11 FY12E FY13E FY14E
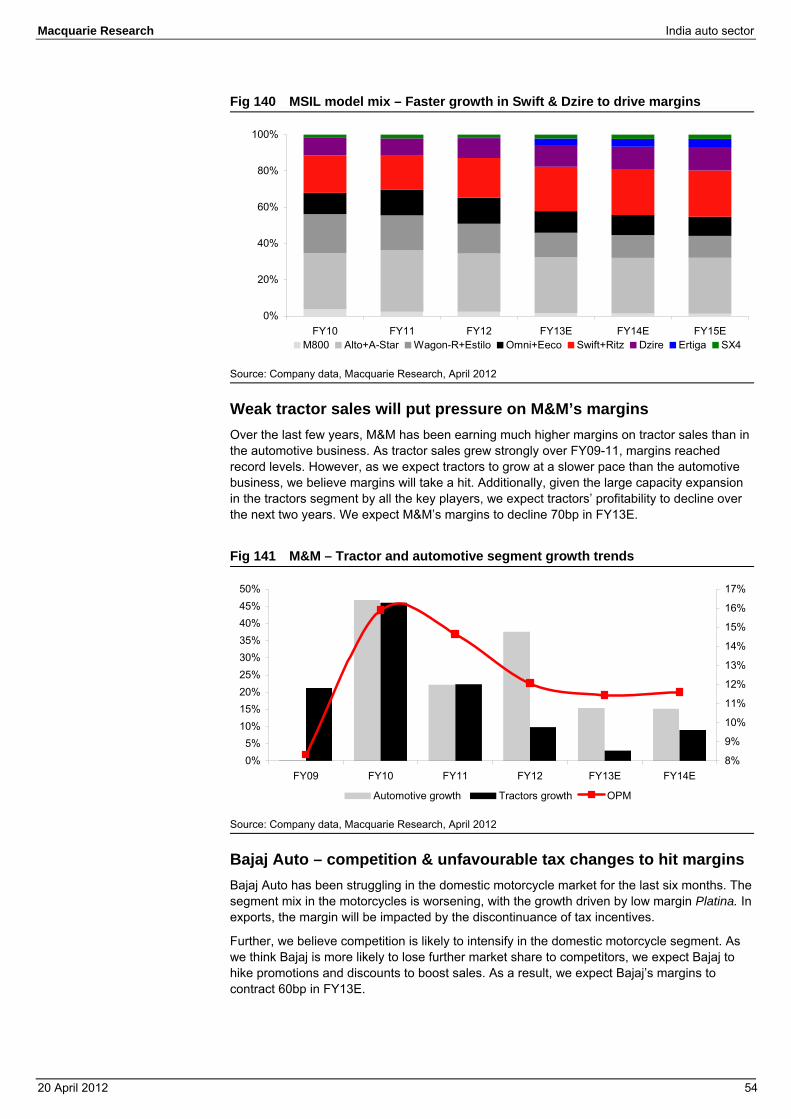
Macquarie Research India auto sector
20 April 2012 54
Fig 140 MSIL model mix – Faster growth in Swift & Dzire to drive margins
Source: Company data, Macquarie Research, April 2012
Weak tractor sales will put pressure on M&M’s margins Over the last few years, M&M has been earning much higher margins on tractor sales than in the automotive business. As tractor sales grew strongly over FY09-11, margins reached record levels. However, as we expect tractors to grow at a slower pace than the automotive business, we believe margins will take a hit. Additionally, given the large capacity expansion in the tractors segment by all the key players, we expect tractors’ profitability to decline over the next two years. We expect M&M’s margins to decline 70bp in FY13E.
Fig 141 M&M – Tractor and automotive segment growth trends
Source: Company data, Macquarie Research, April 2012
Bajaj Auto – competition & unfavourable tax changes to hit margins Bajaj Auto has been struggling in the domestic motorcycle market for the last six months. The segment mix in the motorcycles is worsening, with the growth driven by low margin Platina. In exports, the margin will be impacted by the discontinuance of tax incentives.
Further, we believe competition is likely to intensify in the domestic motorcycle segment. As we think Bajaj is more likely to lose further market share to competitors, we expect Bajaj to hike promotions and discounts to boost sales. As a result, we expect Bajaj’s margins to contract 60bp in FY13E.
0%
20%
40%
60%
80%
100%
FY10 FY11 FY12 FY13E FY14E FY15EM800 Alto+A-Star Wagon-R+Estilo Omni+Eeco Swift+Ritz Dzire Ertiga SX4
0%5%
10%15%20%25%30%35%40%45%50%
FY09 FY10 FY11 FY12 FY13E FY14E8%
9%
10%
11%
12%
13%
14%
15%
16%
17%
Automotive growth Tractors growth OPM
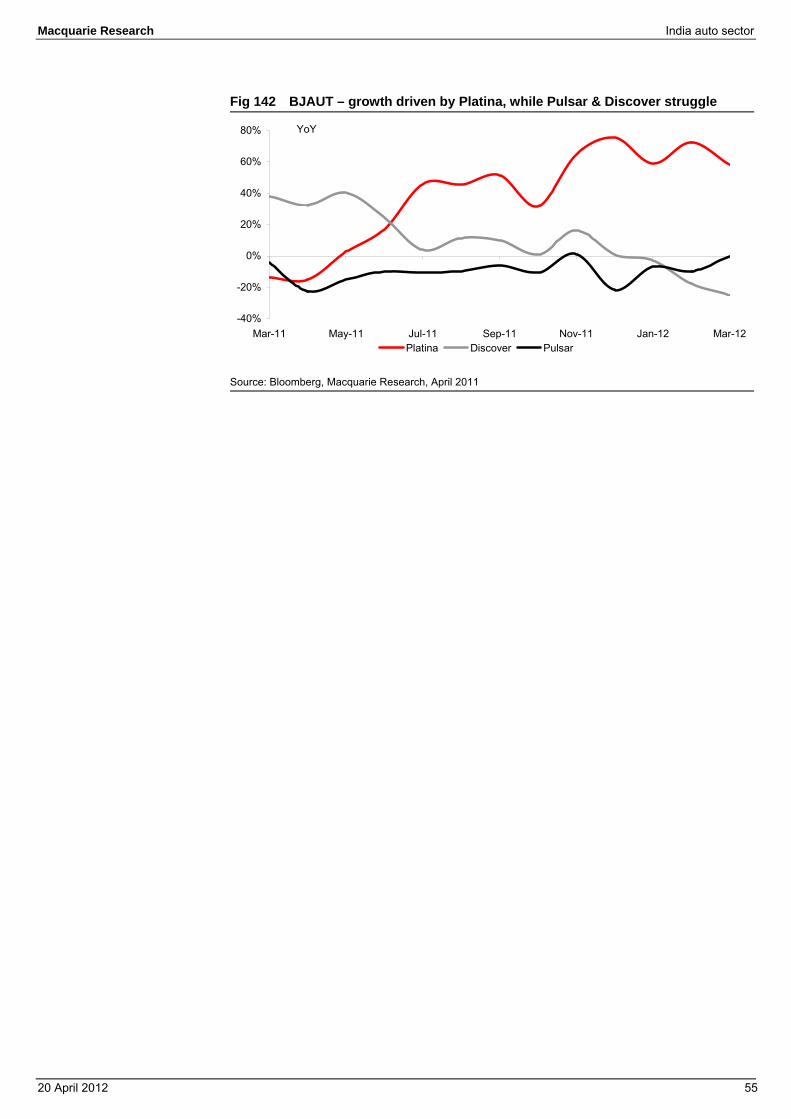
Macquarie Research India auto sector
20 April 2012 55
Fig 142 BJAUT – growth driven by Platina, while Pulsar & Discover struggle
Source: Bloomberg, Macquarie Research, April 2011
-40%
-20%
0%
20%
40%
60%
80%
Mar-11 May-11 Jul-11 Sep-11 Nov-11 Jan-12 Mar-12Platina Discover Pulsar
YoY
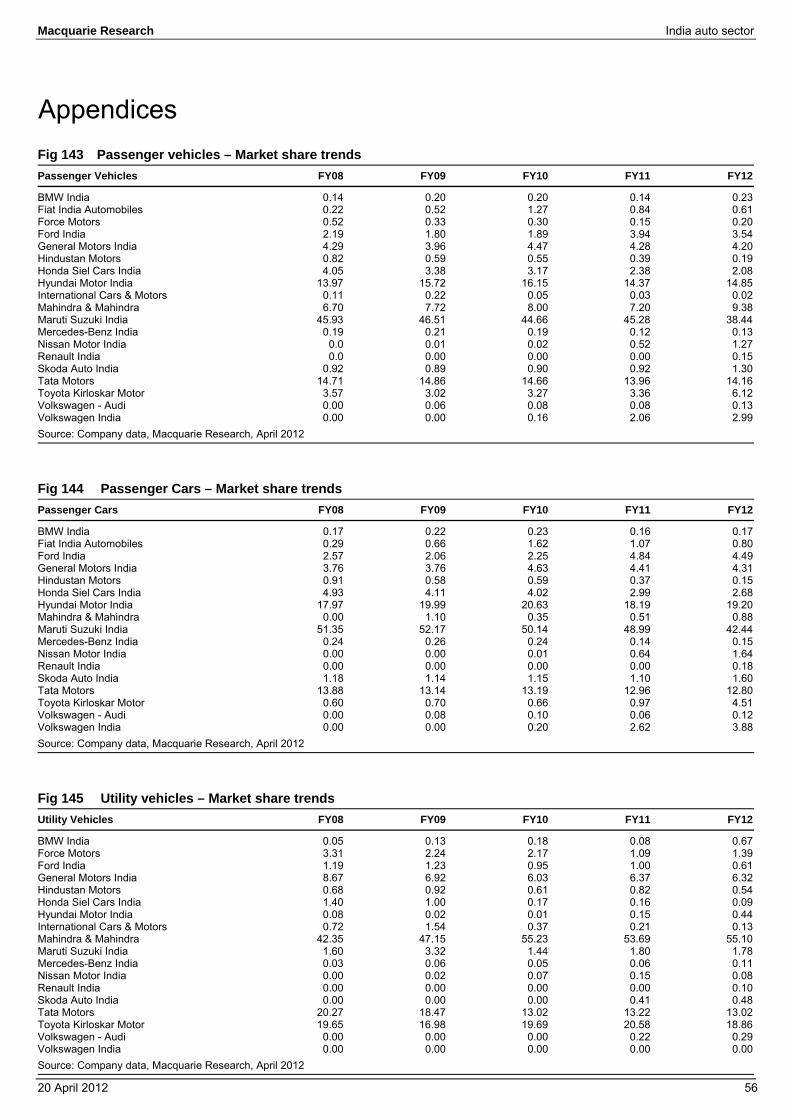
Macquarie Research India auto sector
20 April 2012 56
Appendices Fig 143 Passenger vehicles – Market share trends Passenger Vehicles FY08 FY09 FY10 FY11 FY12
BMW India 0.14 0.20 0.20 0.14 0.23Fiat India Automobiles 0.22 0.52 1.27 0.84 0.61Force Motors 0.52 0.33 0.30 0.15 0.20Ford India 2.19 1.80 1.89 3.94 3.54General Motors India 4.29 3.96 4.47 4.28 4.20Hindustan Motors 0.82 0.59 0.55 0.39 0.19Honda Siel Cars India 4.05 3.38 3.17 2.38 2.08Hyundai Motor India 13.97 15.72 16.15 14.37 14.85International Cars & Motors 0.11 0.22 0.05 0.03 0.02Mahindra & Mahindra 6.70 7.72 8.00 7.20 9.38Maruti Suzuki India 45.93 46.51 44.66 45.28 38.44Mercedes-Benz India 0.19 0.21 0.19 0.12 0.13Nissan Motor India 0.0 0.01 0.02 0.52 1.27Renault India 0.0 0.00 0.00 0.00 0.15Skoda Auto India 0.92 0.89 0.90 0.92 1.30Tata Motors 14.71 14.86 14.66 13.96 14.16Toyota Kirloskar Motor 3.57 3.02 3.27 3.36 6.12Volkswagen - Audi 0.00 0.06 0.08 0.08 0.13Volkswagen India 0.00 0.00 0.16 2.06 2.99Source: Company data, Macquarie Research, April 2012
Fig 144 Passenger Cars – Market share trends Passenger Cars FY08 FY09 FY10 FY11 FY12
BMW India 0.17 0.22 0.23 0.16 0.17Fiat India Automobiles 0.29 0.66 1.62 1.07 0.80Ford India 2.57 2.06 2.25 4.84 4.49General Motors India 3.76 3.76 4.63 4.41 4.31Hindustan Motors 0.91 0.58 0.59 0.37 0.15Honda Siel Cars India 4.93 4.11 4.02 2.99 2.68Hyundai Motor India 17.97 19.99 20.63 18.19 19.20Mahindra & Mahindra 0.00 1.10 0.35 0.51 0.88Maruti Suzuki India 51.35 52.17 50.14 48.99 42.44Mercedes-Benz India 0.24 0.26 0.24 0.14 0.15Nissan Motor India 0.00 0.00 0.01 0.64 1.64Renault India 0.00 0.00 0.00 0.00 0.18Skoda Auto India 1.18 1.14 1.15 1.10 1.60Tata Motors 13.88 13.14 13.19 12.96 12.80Toyota Kirloskar Motor 0.60 0.70 0.66 0.97 4.51Volkswagen - Audi 0.00 0.08 0.10 0.06 0.12Volkswagen India 0.00 0.00 0.20 2.62 3.88Source: Company data, Macquarie Research, April 2012
Fig 145 Utility vehicles – Market share trends Utility Vehicles FY08 FY09 FY10 FY11 FY12
BMW India 0.05 0.13 0.18 0.08 0.67Force Motors 3.31 2.24 2.17 1.09 1.39Ford India 1.19 1.23 0.95 1.00 0.61General Motors India 8.67 6.92 6.03 6.37 6.32Hindustan Motors 0.68 0.92 0.61 0.82 0.54Honda Siel Cars India 1.40 1.00 0.17 0.16 0.09Hyundai Motor India 0.08 0.02 0.01 0.15 0.44International Cars & Motors 0.72 1.54 0.37 0.21 0.13Mahindra & Mahindra 42.35 47.15 55.23 53.69 55.10Maruti Suzuki India 1.60 3.32 1.44 1.80 1.78Mercedes-Benz India 0.03 0.06 0.05 0.06 0.11Nissan Motor India 0.00 0.02 0.07 0.15 0.08Renault India 0.00 0.00 0.00 0.00 0.10Skoda Auto India 0.00 0.00 0.00 0.41 0.48Tata Motors 20.27 18.47 13.02 13.22 13.02Toyota Kirloskar Motor 19.65 16.98 19.69 20.58 18.86Volkswagen - Audi 0.00 0.00 0.00 0.22 0.29Volkswagen India 0.00 0.00 0.00 0.00 0.00Source: Company data, Macquarie Research, April 2012
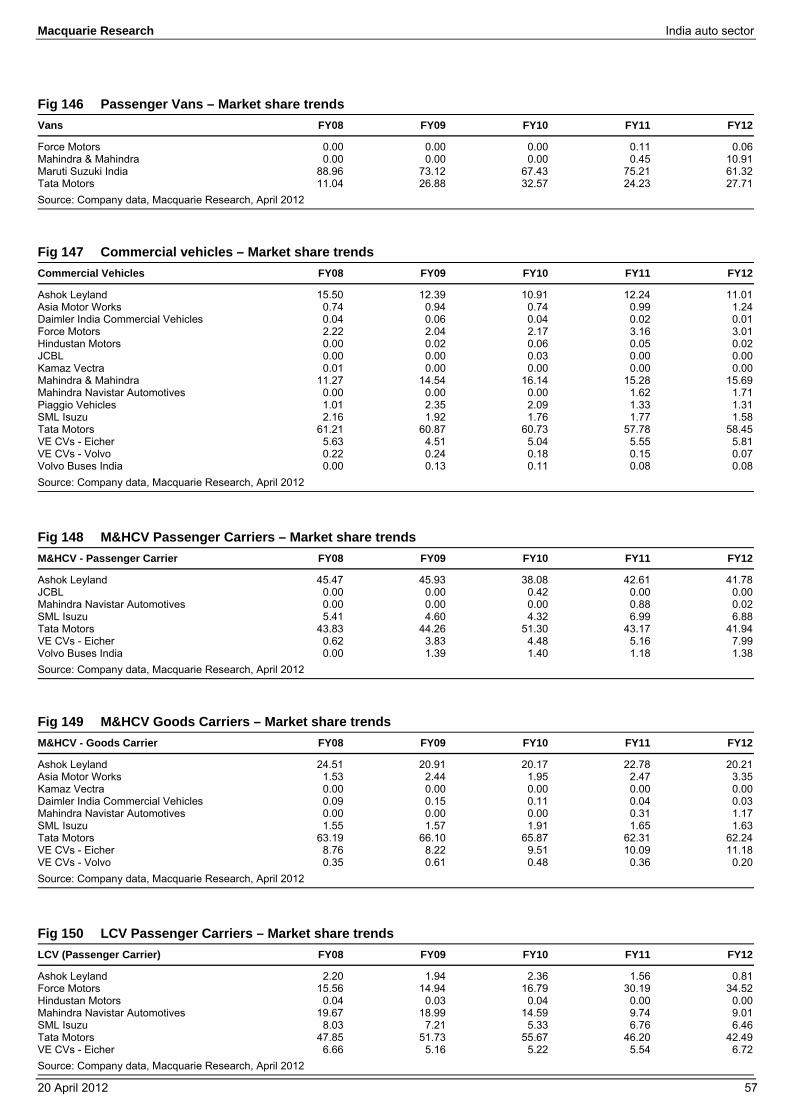
Macquarie Research India auto sector
20 April 2012 57
Fig 146 Passenger Vans – Market share trends Vans FY08 FY09 FY10 FY11 FY12
Force Motors 0.00 0.00 0.00 0.11 0.06Mahindra & Mahindra 0.00 0.00 0.00 0.45 10.91Maruti Suzuki India 88.96 73.12 67.43 75.21 61.32Tata Motors 11.04 26.88 32.57 24.23 27.71Source: Company data, Macquarie Research, April 2012
Fig 147 Commercial vehicles – Market share trends Commercial Vehicles FY08 FY09 FY10 FY11 FY12
Ashok Leyland 15.50 12.39 10.91 12.24 11.01Asia Motor Works 0.74 0.94 0.74 0.99 1.24Daimler India Commercial Vehicles 0.04 0.06 0.04 0.02 0.01Force Motors 2.22 2.04 2.17 3.16 3.01Hindustan Motors 0.00 0.02 0.06 0.05 0.02JCBL 0.00 0.00 0.03 0.00 0.00Kamaz Vectra 0.01 0.00 0.00 0.00 0.00Mahindra & Mahindra 11.27 14.54 16.14 15.28 15.69Mahindra Navistar Automotives 0.00 0.00 0.00 1.62 1.71Piaggio Vehicles 1.01 2.35 2.09 1.33 1.31SML Isuzu 2.16 1.92 1.76 1.77 1.58Tata Motors 61.21 60.87 60.73 57.78 58.45VE CVs - Eicher 5.63 4.51 5.04 5.55 5.81VE CVs - Volvo 0.22 0.24 0.18 0.15 0.07Volvo Buses India 0.00 0.13 0.11 0.08 0.08Source: Company data, Macquarie Research, April 2012
Fig 148 M&HCV Passenger Carriers – Market share trends M&HCV - Passenger Carrier FY08 FY09 FY10 FY11 FY12
Ashok Leyland 45.47 45.93 38.08 42.61 41.78JCBL 0.00 0.00 0.42 0.00 0.00Mahindra Navistar Automotives 0.00 0.00 0.00 0.88 0.02SML Isuzu 5.41 4.60 4.32 6.99 6.88Tata Motors 43.83 44.26 51.30 43.17 41.94VE CVs - Eicher 0.62 3.83 4.48 5.16 7.99Volvo Buses India 0.00 1.39 1.40 1.18 1.38Source: Company data, Macquarie Research, April 2012
Fig 149 M&HCV Goods Carriers – Market share trends M&HCV - Goods Carrier FY08 FY09 FY10 FY11 FY12
Ashok Leyland 24.51 20.91 20.17 22.78 20.21Asia Motor Works 1.53 2.44 1.95 2.47 3.35Kamaz Vectra 0.00 0.00 0.00 0.00 0.00Daimler India Commercial Vehicles 0.09 0.15 0.11 0.04 0.03Mahindra Navistar Automotives 0.00 0.00 0.00 0.31 1.17SML Isuzu 1.55 1.57 1.91 1.65 1.63Tata Motors 63.19 66.10 65.87 62.31 62.24VE CVs - Eicher 8.76 8.22 9.51 10.09 11.18VE CVs - Volvo 0.35 0.61 0.48 0.36 0.20Source: Company data, Macquarie Research, April 2012
Fig 150 LCV Passenger Carriers – Market share trends LCV (Passenger Carrier) FY08 FY09 FY10 FY11 FY12
Ashok Leyland 2.20 1.94 2.36 1.56 0.81Force Motors 15.56 14.94 16.79 30.19 34.52Hindustan Motors 0.04 0.03 0.04 0.00 0.00Mahindra Navistar Automotives 19.67 18.99 14.59 9.74 9.01SML Isuzu 8.03 7.21 5.33 6.76 6.46Tata Motors 47.85 51.73 55.67 46.20 42.49VE CVs - Eicher 6.66 5.16 5.22 5.54 6.72Source: Company data, Macquarie Research, April 2012
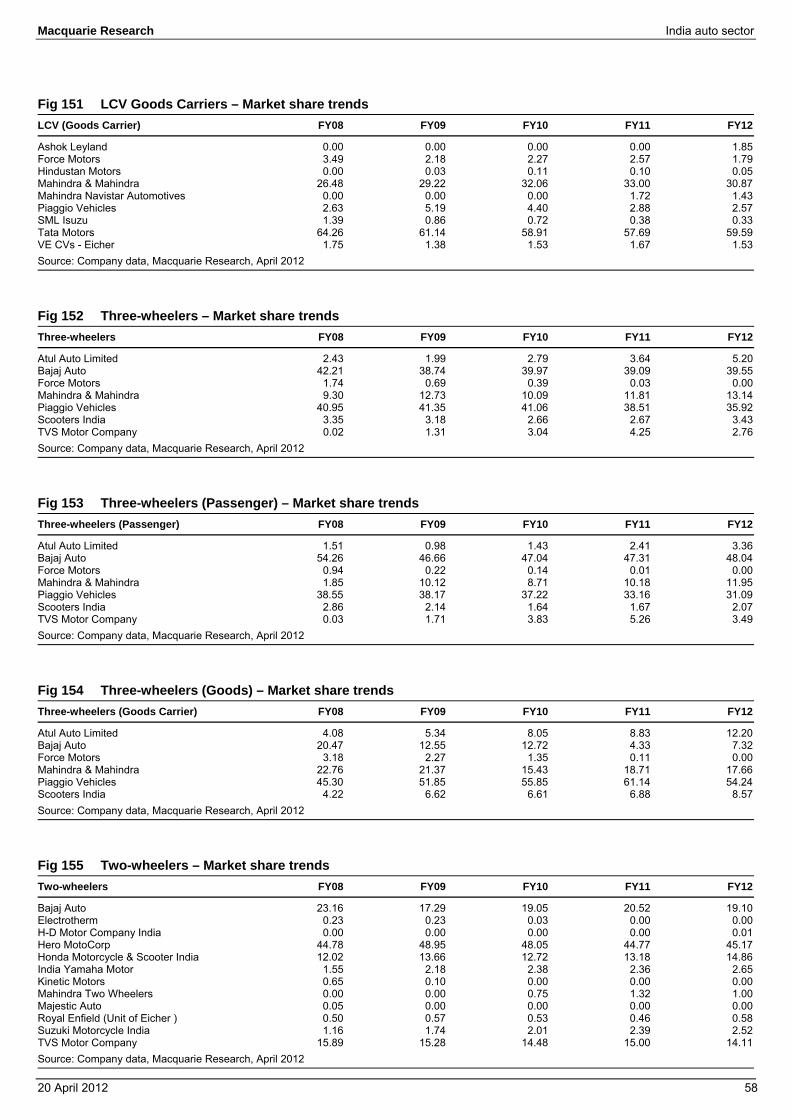
Macquarie Research India auto sector
20 April 2012 58
Fig 151 LCV Goods Carriers – Market share trends LCV (Goods Carrier) FY08 FY09 FY10 FY11 FY12
Ashok Leyland 0.00 0.00 0.00 0.00 1.85Force Motors 3.49 2.18 2.27 2.57 1.79Hindustan Motors 0.00 0.03 0.11 0.10 0.05Mahindra & Mahindra 26.48 29.22 32.06 33.00 30.87Mahindra Navistar Automotives 0.00 0.00 0.00 1.72 1.43Piaggio Vehicles 2.63 5.19 4.40 2.88 2.57SML Isuzu 1.39 0.86 0.72 0.38 0.33Tata Motors 64.26 61.14 58.91 57.69 59.59VE CVs - Eicher 1.75 1.38 1.53 1.67 1.53Source: Company data, Macquarie Research, April 2012
Fig 152 Three-wheelers – Market share trends Three-wheelers FY08 FY09 FY10 FY11 FY12
Atul Auto Limited 2.43 1.99 2.79 3.64 5.20Bajaj Auto 42.21 38.74 39.97 39.09 39.55Force Motors 1.74 0.69 0.39 0.03 0.00Mahindra & Mahindra 9.30 12.73 10.09 11.81 13.14Piaggio Vehicles 40.95 41.35 41.06 38.51 35.92Scooters India 3.35 3.18 2.66 2.67 3.43TVS Motor Company 0.02 1.31 3.04 4.25 2.76Source: Company data, Macquarie Research, April 2012
Fig 153 Three-wheelers (Passenger) – Market share trends Three-wheelers (Passenger) FY08 FY09 FY10 FY11 FY12
Atul Auto Limited 1.51 0.98 1.43 2.41 3.36Bajaj Auto 54.26 46.66 47.04 47.31 48.04Force Motors 0.94 0.22 0.14 0.01 0.00Mahindra & Mahindra 1.85 10.12 8.71 10.18 11.95Piaggio Vehicles 38.55 38.17 37.22 33.16 31.09Scooters India 2.86 2.14 1.64 1.67 2.07TVS Motor Company 0.03 1.71 3.83 5.26 3.49Source: Company data, Macquarie Research, April 2012
Fig 154 Three-wheelers (Goods) – Market share trends Three-wheelers (Goods Carrier) FY08 FY09 FY10 FY11 FY12
Atul Auto Limited 4.08 5.34 8.05 8.83 12.20Bajaj Auto 20.47 12.55 12.72 4.33 7.32Force Motors 3.18 2.27 1.35 0.11 0.00Mahindra & Mahindra 22.76 21.37 15.43 18.71 17.66Piaggio Vehicles 45.30 51.85 55.85 61.14 54.24Scooters India 4.22 6.62 6.61 6.88 8.57Source: Company data, Macquarie Research, April 2012
Fig 155 Two-wheelers – Market share trends Two-wheelers FY08 FY09 FY10 FY11 FY12
Bajaj Auto 23.16 17.29 19.05 20.52 19.10Electrotherm 0.23 0.23 0.03 0.00 0.00H-D Motor Company India 0.00 0.00 0.00 0.00 0.01Hero MotoCorp 44.78 48.95 48.05 44.77 45.17Honda Motorcycle & Scooter India 12.02 13.66 12.72 13.18 14.86India Yamaha Motor 1.55 2.18 2.38 2.36 2.65Kinetic Motors 0.65 0.10 0.00 0.00 0.00Mahindra Two Wheelers 0.00 0.00 0.75 1.32 1.00Majestic Auto 0.05 0.00 0.00 0.00 0.00Royal Enfield (Unit of Eicher ) 0.50 0.57 0.53 0.46 0.58Suzuki Motorcycle India 1.16 1.74 2.01 2.39 2.52TVS Motor Company 15.89 15.28 14.48 15.00 14.11Source: Company data, Macquarie Research, April 2012
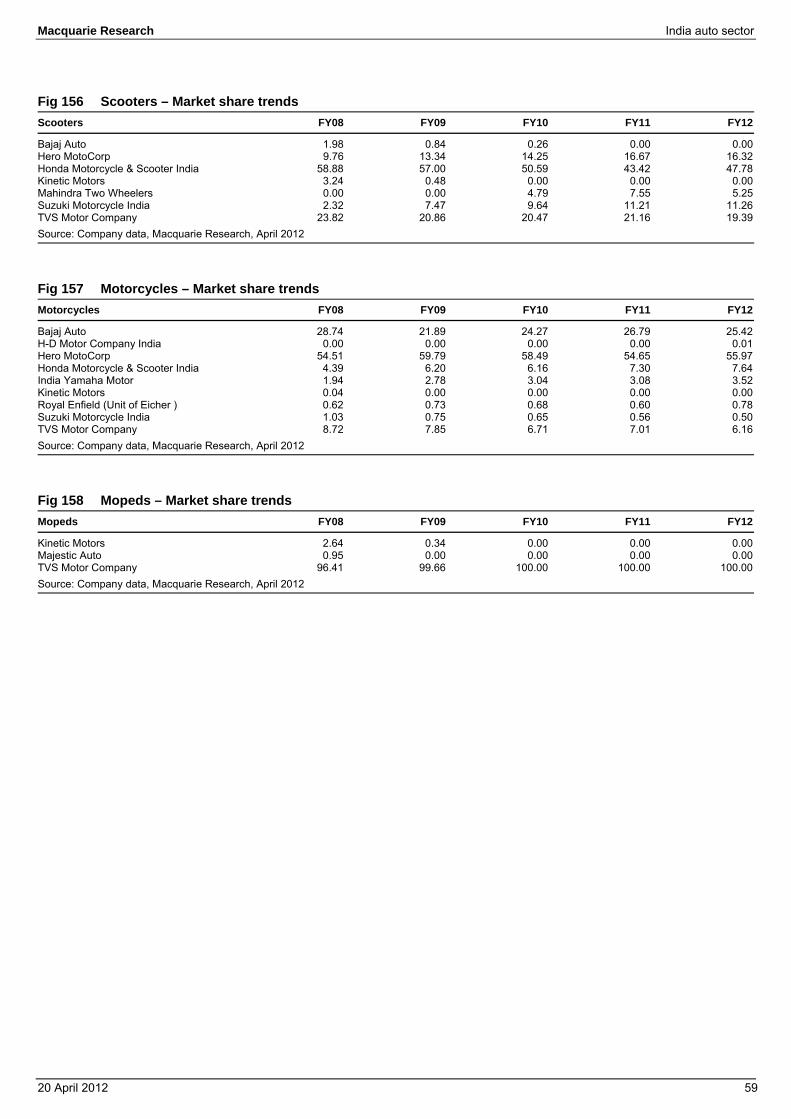
Macquarie Research India auto sector
20 April 2012 59
Fig 156 Scooters – Market share trends Scooters FY08 FY09 FY10 FY11 FY12
Bajaj Auto 1.98 0.84 0.26 0.00 0.00Hero MotoCorp 9.76 13.34 14.25 16.67 16.32Honda Motorcycle & Scooter India 58.88 57.00 50.59 43.42 47.78Kinetic Motors 3.24 0.48 0.00 0.00 0.00Mahindra Two Wheelers 0.00 0.00 4.79 7.55 5.25Suzuki Motorcycle India 2.32 7.47 9.64 11.21 11.26TVS Motor Company 23.82 20.86 20.47 21.16 19.39Source: Company data, Macquarie Research, April 2012
Fig 157 Motorcycles – Market share trends Motorcycles FY08 FY09 FY10 FY11 FY12
Bajaj Auto 28.74 21.89 24.27 26.79 25.42H-D Motor Company India 0.00 0.00 0.00 0.00 0.01Hero MotoCorp 54.51 59.79 58.49 54.65 55.97Honda Motorcycle & Scooter India 4.39 6.20 6.16 7.30 7.64India Yamaha Motor 1.94 2.78 3.04 3.08 3.52Kinetic Motors 0.04 0.00 0.00 0.00 0.00Royal Enfield (Unit of Eicher ) 0.62 0.73 0.68 0.60 0.78Suzuki Motorcycle India 1.03 0.75 0.65 0.56 0.50TVS Motor Company 8.72 7.85 6.71 7.01 6.16Source: Company data, Macquarie Research, April 2012
Fig 158 Mopeds – Market share trends Mopeds FY08 FY09 FY10 FY11 FY12
Kinetic Motors 2.64 0.34 0.00 0.00 0.00Majestic Auto 0.95 0.00 0.00 0.00 0.00TVS Motor Company 96.41 99.66 100.00 100.00 100.00Source: Company data, Macquarie Research, April 2012
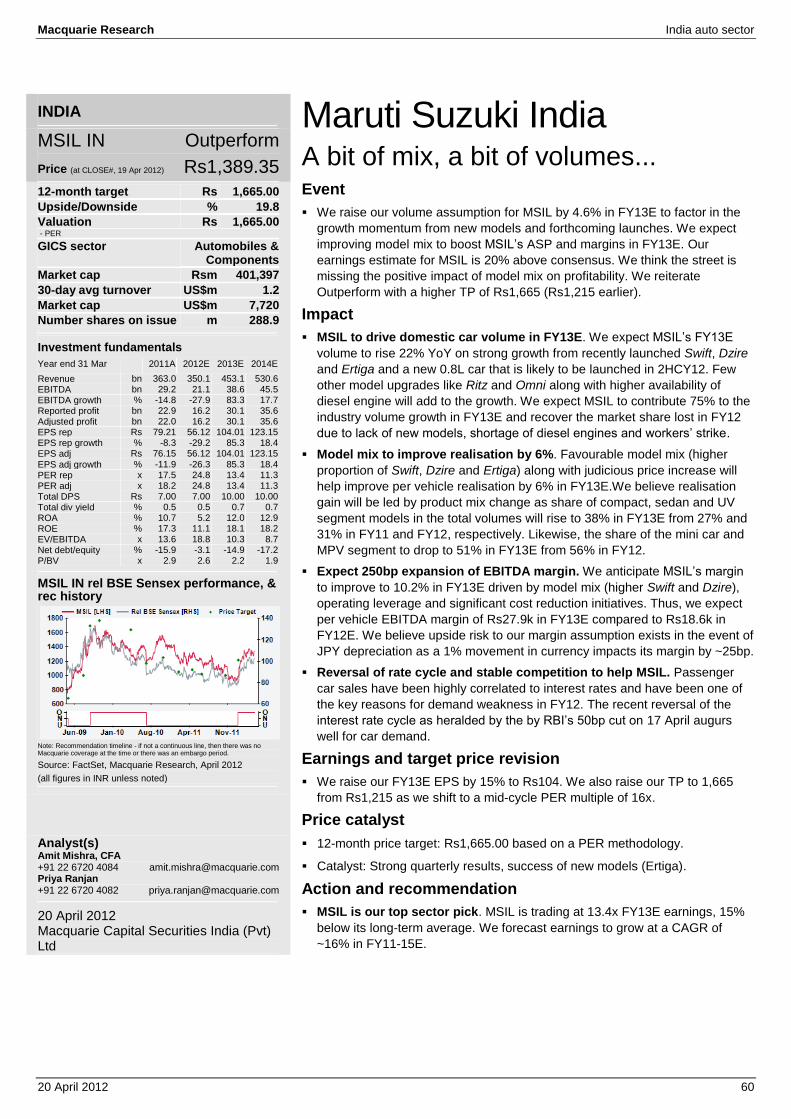
Macquarie Research India auto sector
20 April 2012 60
INDIA
MSIL IN Outperform
Price (at CLOSE#, 19 Apr 2012) Rs1,389.35
12-month target Rs 1,665.00 Upside/Downside % 19.8 Valuation Rs 1,665.00 - PER GICS sector Automobiles &
Components Market cap Rsm 401,397 30-day avg turnover US$m 1.2 Market cap US$m 7,720 Number shares on issue m 288.9
Investment fundamentals Year end 31 Mar 2011A 2012E 2013E 2014E
Revenue bn 363.0 350.1 453.1 530.6 EBITDA bn 29.2 21.1 38.6 45.5 EBITDA growth % -14.8 -27.9 83.3 17.7 Reported profit bn 22.9 16.2 30.1 35.6 Adjusted profit bn 22.0 16.2 30.1 35.6 EPS rep Rs 79.21 56.12 104.01 123.15 EPS rep growth % -8.3 -29.2 85.3 18.4 EPS adj Rs 76.15 56.12 104.01 123.15
EPS adj growth % -11.9 -26.3 85.3 18.4 PER rep x 17.5 24.8 13.4 11.3 PER adj x 18.2 24.8 13.4 11.3 Total DPS Rs 7.00 7.00 10.00 10.00 Total div yield % 0.5 0.5 0.7 0.7 ROA % 10.7 5.2 12.0 12.9 ROE % 17.3 11.1 18.1 18.2
EV/EBITDA x 13.6 18.8 10.3 8.7 Net debt/equity % -15.9 -3.1 -14.9 -17.2 P/BV x 2.9 2.6 2.2 1.9
MSIL IN rel BSE Sensex performance, & rec history
Note: Recommendation timeline - if not a continuous line, then there was no Macquarie coverage at the time or there was an embargo period.
Source: FactSet, Macquarie Research, April 2012
(all figures in INR unless noted)
Analyst(s) Amit Mishra, CFA +91 22 6720 4084 [email protected] Priya Ranjan +91 22 6720 4082 [email protected]
20 April 2012 Macquarie Capital Securities India (Pvt) Ltd
Maruti Suzuki India A bit of mix, a bit of volumes... Event We raise our volume assumption for MSIL by 4.6% in FY13E to factor in the
growth momentum from new models and forthcoming launches. We expect
improving model mix to boost MSIL’s ASP and margins in FY13E. Our
earnings estimate for MSIL is 20% above consensus. We think the street is
missing the positive impact of model mix on profitability. We reiterate
Outperform with a higher TP of Rs1,665 (Rs1,215 earlier).
Impact MSIL to drive domestic car volume in FY13E. We expect MSIL’s FY13E
volume to rise 22% YoY on strong growth from recently launched Swift, Dzire and Ertiga and a new 0.8L car that is likely to be launched in 2HCY12. Few
other model upgrades like Ritz and Omni along with higher availability of
diesel engine will add to the growth. We expect MSIL to contribute 75% to the
industry volume growth in FY13E and recover the market share lost in FY12
due to lack of new models, shortage of diesel engines and workers’ strike.
Model mix to improve realisation by 6%. Favourable model mix (higher
proportion of Swift, Dzire and Ertiga) along with judicious price increase will
help improve per vehicle realisation by 6% in FY13E.We believe realisation
gain will be led by product mix change as share of compact, sedan and UV
segment models in the total volumes will rise to 38% in FY13E from 27% and
31% in FY11 and FY12, respectively. Likewise, the share of the mini car and
MPV segment to drop to 51% in FY13E from 56% in FY12.
Expect 250bp expansion of EBITDA margin. We anticipate MSIL’s margin
to improve to 10.2% in FY13E driven by model mix (higher Swift and Dzire),
operating leverage and significant cost reduction initiatives. Thus, we expect
per vehicle EBITDA margin of Rs27.9k in FY13E compared to Rs18.6k in
FY12E. We believe upside risk to our margin assumption exists in the event of
JPY depreciation as a 1% movement in currency impacts its margin by ~25bp.
Reversal of rate cycle and stable competition to help MSIL. Passenger
car sales have been highly correlated to interest rates and have been one of
the key reasons for demand weakness in FY12. The recent reversal of the
interest rate cycle as heralded by the by RBI’s 50bp cut on 17 April augurs
well for car demand.
Earnings and target price revision We raise our FY13E EPS by 15% to Rs104. We also raise our TP to 1,665
from Rs1,215 as we shift to a mid-cycle PER multiple of 16x.
Price catalyst 12-month price target: Rs1,665.00 based on a PER methodology.
Catalyst: Strong quarterly results, success of new models (Ertiga).
Action and recommendation MSIL is our top sector pick. MSIL is trading at 13.4x FY13E earnings, 15%
below its long-term average. We forecast earnings to grow at a CAGR of
~16% in FY11-15E.

Macquarie Research India auto sector
20 April 2012 61
Fig 1 MSIL estimate change – driven by realisation and favourable model mix New Estimates Old Estimates % change FY13E FY14E FY13E FY14E FY13E FY14E
Volume 1,383,084 1,582,863 1,321,303 1,510,779 4.6% 4.8% Net Sales Rs m 453,150 530,579 415,364 485,619 9.1% 9.3% EBITDA Rs m 38,637 45,127 34,010 40,691 13.6% 10.9% EBITDA margin (%) 8.5% 8.5% 8.2% 8.4% 30 10 GM cost/car 84,332 85,793 80,596 82,574 4.2% 3.7% EBITDA/car 27,935 28,510 25,740 26,934 8.5% 4.9% EPS 104.0 121.5 90.1 108.4 15.4% 11.6%
Source: Company data, Macquarie Research, April 2012
Model mix - key realisation and margin growth driver:
Fig 2 Faster growth of Swift, Dzire and Ertiga to drive realisation for MSIL YoY Growth FY09 FY10 FY11 FY12 FY13E FY14E
M800 -29% -33% -20% -12% -15% 0% Alto/ A Star 3% 14% 44% -16% 20% 15% Omni -13% 21% 0% -8% -2% 5% Estilo -35% 27% 25% -67% -25% 0% Wagon R 2% 8% 13% -10% 5% 10%
Swift/ Ritz 24% 63% 17% 4% 40% 20%
Dzire 241% 35% 29% 2% 35% 20%
SX4 -55% 12% 48% -23% 50% 25%
Ertiga 40%
Eeco -1% 501% 690% -13% 10% 12% Gypsy 130% -46% 44% -5% 15% 12%
Source: Company data, Macquarie Research, April 2012
Valuations below historical average
Fig 3 MSIL 1 Year Fwd PER – trading at 17% below its mid-cycle multiple of 16x
Source: Company data, Macquarie Research, April 2012
5
10
15
20
25
Apr-07 Oct-07 Apr-08 Oct-08 Apr-09 Oct-09 Apr-10 Oct-10 Apr-11 Oct-11 Apr-12
1Yr Fwd PER Average -1 σ +1 σ
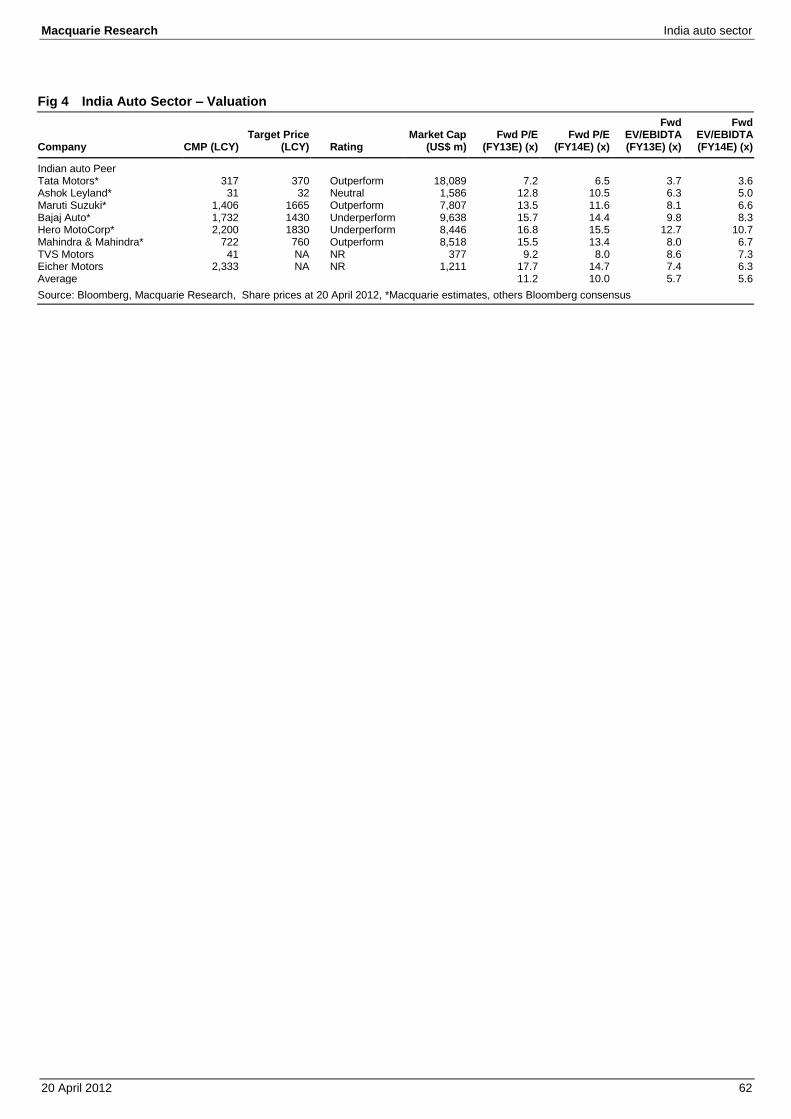
Macquarie Research India auto sector
20 April 2012 62
Fig 4 India Auto Sector – Valuation
Company CMP (LCY) Target Price
(LCY) Rating Market Cap
(US$ m) Fwd P/E
(FY13E) (x) Fwd P/E
(FY14E) (x)
Fwd EV/EBIDTA (FY13E) (x)
Fwd EV/EBIDTA (FY14E) (x)
Indian auto Peer Tata Motors* 317 370 Outperform 18,089 7.2 6.5 3.7 3.6 Ashok Leyland* 31 32 Neutral 1,586 12.8 10.5 6.3 5.0 Maruti Suzuki* 1,406 1665 Outperform 7,807 13.5 11.6 8.1 6.6 Bajaj Auto* 1,732 1430 Underperform 9,638 15.7 14.4 9.8 8.3 Hero MotoCorp* 2,200 1830 Underperform 8,446 16.8 15.5 12.7 10.7 Mahindra & Mahindra* 722 760 Outperform 8,518 15.5 13.4 8.0 6.7 TVS Motors 41 NA NR 377 9.2 8.0 8.6 7.3 Eicher Motors 2,333 NA NR 1,211 17.7 14.7 7.4 6.3 Average 11.2 10.0 5.7 5.6
Source: Bloomberg, Macquarie Research, Share prices at 20 April 2012, *Macquarie estimates, others Bloomberg consensus

Macquarie Research India auto sector
20 April 2012 63
MSIL to lead passenger vehicle sales growth Key drivers for Maruti’s volume growth Maruti has entered into agreement with Fiat to source 100k diesel engines annually. In addition,
they have raised their own diesel engine production by 50k units. In 2011, we saw a significant
shift towards diesel-powered cars, as the government subsidises diesel fuel.
Maruti should recover lost market share as production normalises this year. Maruti had lost ~85k
units due to strike. As a result, MSIL’s sales declined 11% in FY12 compared to 21% growth for
other companies.
Maruti is entering a new segment with the launch of their MPV, Ertiga. We expect MSIL to sell 45k
Ertiga units in FY13E. Strong momentum from new Swift and Dzire should aid growth.
Maruti is planning to launch new small car in November this year, which will also improve the
volume growth in the mini car segment.
New models and diesel variants to drive industry growth In the last fiscal year, passenger vehicle sales grew a modest 5% due to steep increase in interest
rates, high fuel prices and weak consumer sentiment. Growth was also impacted partly due to supply
disruptions at Maruti Suzuki because of workers’ strike. Further, we saw a significant shift towards
diesel engines as government subsidises diesel, but not petrol. As supply of diesel engine got
constrained, consumers were willing to wait for up to six months for diesel variants than to buy the
petrol variant off-the shelf. In December 2011, 55% of cars sold in India had diesel engines
compared to 25% a year ago.
Fig 5 Domestic car sales – expecting growth to bounce next year
Source: Company data, Macquarie Research, April 2012
While overall growth for car sales was subdued, companies that launched new models (and had
diesel engine variants) still grew strongly.
0.0
0.3
0.5
0.8
1.0
1.3
1.5
1.8
2.0
FY91 FY94 FY97 FY00 FY03 FY06 FY09 FY12
-15%
-5%
5%
15%
25%
35%
45%
55%
Domestic Car sales Growth % YoY
mn
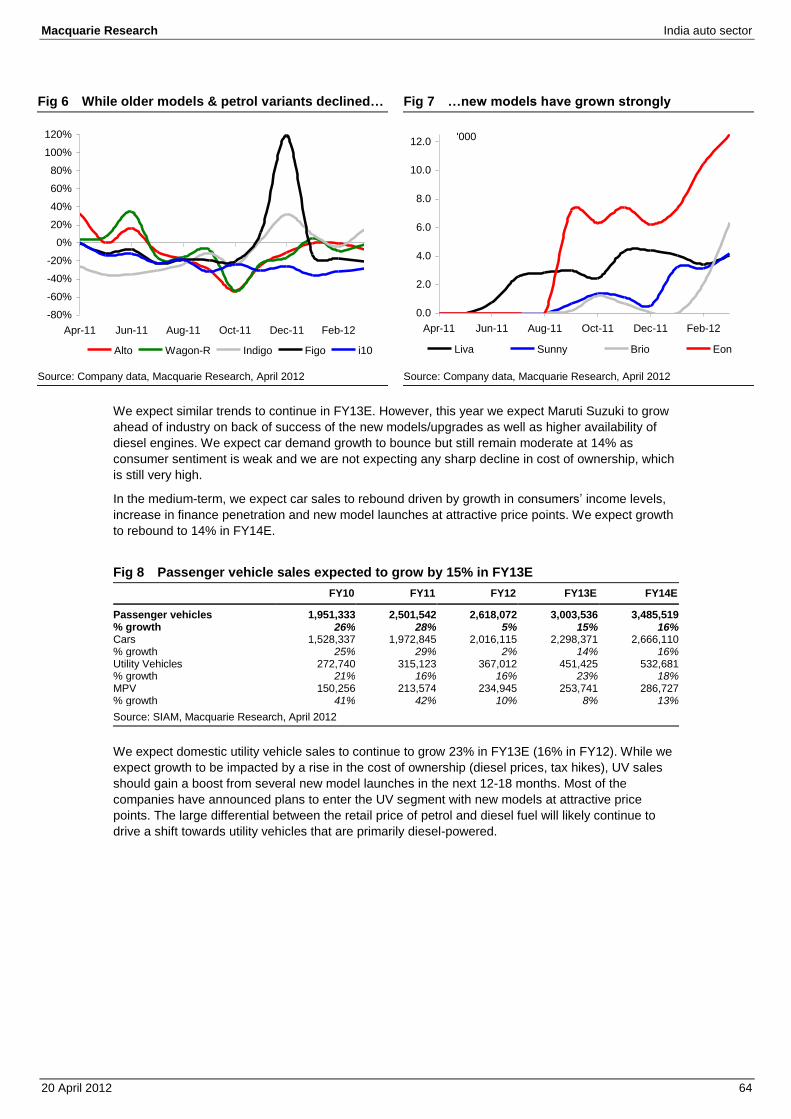
Macquarie Research India auto sector
20 April 2012 64
Fig 6 While older models & petrol variants declined… Fig 7 …new models have grown strongly
Source: Company data, Macquarie Research, April 2012 Source: Company data, Macquarie Research, April 2012
We expect similar trends to continue in FY13E. However, this year we expect Maruti Suzuki to grow
ahead of industry on back of success of the new models/upgrades as well as higher availability of
diesel engines. We expect car demand growth to bounce but still remain moderate at 14% as
consumer sentiment is weak and we are not expecting any sharp decline in cost of ownership, which
is still very high.
In the medium-term, we expect car sales to rebound driven by growth in consumers’ income levels,
increase in finance penetration and new model launches at attractive price points. We expect growth
to rebound to 14% in FY14E.
Fig 8 Passenger vehicle sales expected to grow by 15% in FY13E FY10 FY11 FY12 FY13E FY14E
Passenger vehicles 1,951,333 2,501,542 2,618,072 3,003,536 3,485,519 % growth 26% 28% 5% 15% 16% Cars 1,528,337 1,972,845 2,016,115 2,298,371 2,666,110 % growth 25% 29% 2% 14% 16% Utility Vehicles 272,740 315,123 367,012 451,425 532,681 % growth 21% 16% 16% 23% 18% MPV 150,256 213,574 234,945 253,741 286,727 % growth 41% 42% 10% 8% 13% Source: SIAM, Macquarie Research, April 2012
We expect domestic utility vehicle sales to continue to grow 23% in FY13E (16% in FY12). While we
expect growth to be impacted by a rise in the cost of ownership (diesel prices, tax hikes), UV sales
should gain a boost from several new model launches in the next 12-18 months. Most of the
companies have announced plans to enter the UV segment with new models at attractive price
points. The large differential between the retail price of petrol and diesel fuel will likely continue to
drive a shift towards utility vehicles that are primarily diesel-powered.
-80%
-60%
-40%
-20%
0%
20%
40%
60%
80%
100%
120%
Apr-11 Jun-11 Aug-11 Oct-11 Dec-11 Feb-12
Alto Wagon-R Indigo Figo i10
0.0
2.0
4.0
6.0
8.0
10.0
12.0
Apr-11 Jun-11 Aug-11 Oct-11 Dec-11 Feb-12
Liva Sunny Brio Eon
'000

Macquarie Research India auto sector
20 April 2012 65
Fig 9 Domestic UV sales – growth has been less volatile in the recent past
Source: Company data, Macquarie Research, April 2012
In the medium term, we expect UV sales growth to be driven by an increase in demand for
commercial usage, primarily by the tourist and taxi segments. More taxi permits from municipalities
should further aid volume growth. The launch of PUV and MPV models at competitive prices should
enable expansion of the market.
Fig 10 Domestic car sales growth to rebound in FY13 Fig 11 UV sales growth rate to remain strong at 23%
Source: SIAM, Macquarie Research, April 2012 Source: SIAM, Macquarie Research, April 2012
Sharp increase in passenger vehicle ownership cost will continue to affect sales
Over the last 18 months, the cost of owning a passenger vehicle has increased significantly due to a
rise in credit costs, price hikes and the rise in fuel prices. The car owner’s monthly variable cost has
increased by ~14% due to a 30% hike in gasoline prices since October 2010, an increase in EMI due
to a 300bp increase in borrowing costs and car price hikes implemented by OEMs. (Our calculations
are based on A2 segment cars with an average price of ~Rs400k per vehicle and 70% financing).
Fig 12 Car ownership cost has rise by 15% in the past year
Change in car prices Change in other
variables Net impact of changes on
ownership cost
Car price increase 6.0% 2.5% State level registration charges 1.5% 0.6% Interest rates 300bp 1.7% Increase in fuel prices Rs15/litre for Petrol 6.0% Total 14.0% Source: SIAM, Macquarie Research, April 2012
0
50
100
150
200
250
300
350
FY91 FY94 FY97 FY00 FY03 FY06 FY09 FY12
-25%
-5%
15%
35%
55%
75%
95%
Domestic utility vehicle sales Growth % YoY
'000
29%
18%
8%
22%
12%
1%
25%
29%
2%
14%16%
0%
5%
10%
15%
20%
25%
30%
FY
04
FY
05
FY
06
FY
07
FY
08
FY
09
FY
10
FY
11
FY
12
FY
13E
FY
14E
27%
22%
10%
13%11%
-7%
21%
16% 16%
23%
18%
-10%
-5%
0%
5%
10%
15%
20%
25%
30%
FY
04
FY
05
FY
06
FY
07
FY
08
FY
09
FY
10
FY
11
FY
12
FY
13E
FY
14E
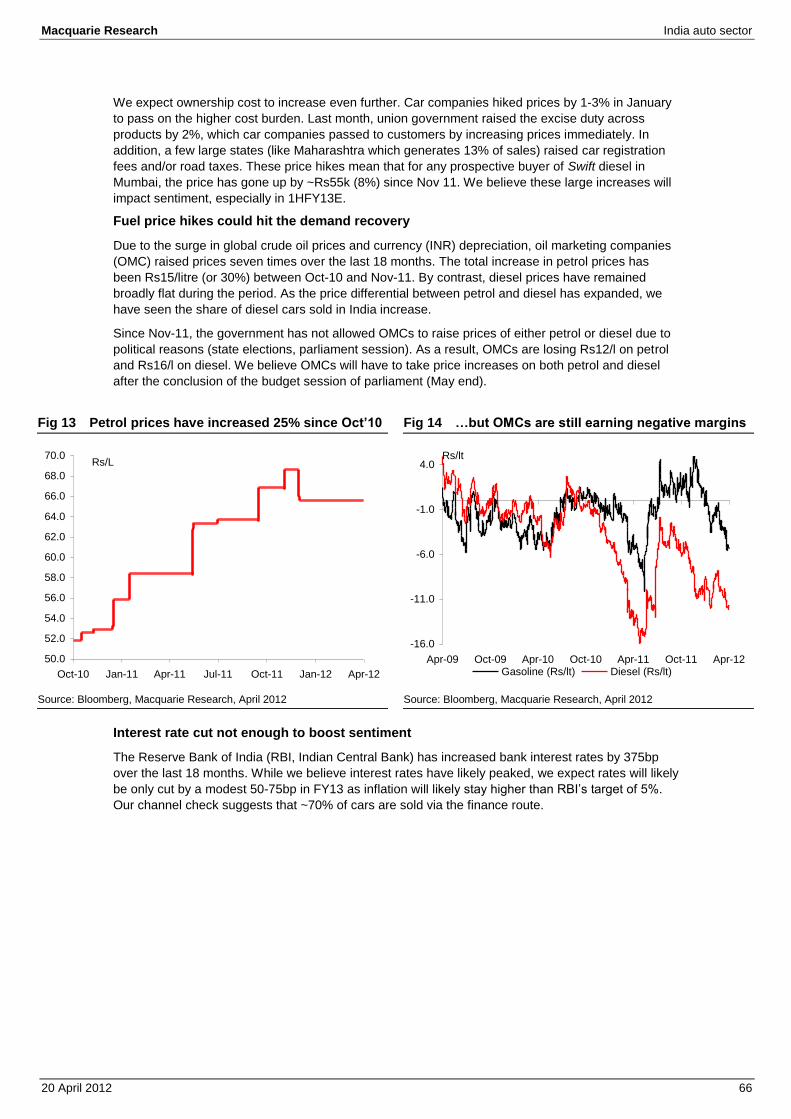
Macquarie Research India auto sector
20 April 2012 66
We expect ownership cost to increase even further. Car companies hiked prices by 1-3% in January
to pass on the higher cost burden. Last month, union government raised the excise duty across
products by 2%, which car companies passed to customers by increasing prices immediately. In
addition, a few large states (like Maharashtra which generates 13% of sales) raised car registration
fees and/or road taxes. These price hikes mean that for any prospective buyer of Swift diesel in
Mumbai, the price has gone up by ~Rs55k (8%) since Nov 11. We believe these large increases will
impact sentiment, especially in 1HFY13E.
Fuel price hikes could hit the demand recovery
Due to the surge in global crude oil prices and currency (INR) depreciation, oil marketing companies
(OMC) raised prices seven times over the last 18 months. The total increase in petrol prices has
been Rs15/litre (or 30%) between Oct-10 and Nov-11. By contrast, diesel prices have remained
broadly flat during the period. As the price differential between petrol and diesel has expanded, we
have seen the share of diesel cars sold in India increase.
Since Nov-11, the government has not allowed OMCs to raise prices of either petrol or diesel due to
political reasons (state elections, parliament session). As a result, OMCs are losing Rs12/l on petrol
and Rs16/l on diesel. We believe OMCs will have to take price increases on both petrol and diesel
after the conclusion of the budget session of parliament (May end).
Fig 13 Petrol prices have increased 25% since Oct’10 Fig 14 …but OMCs are still earning negative margins
Source: Bloomberg, Macquarie Research, April 2012 Source: Bloomberg, Macquarie Research, April 2012
Interest rate cut not enough to boost sentiment
The Reserve Bank of India (RBI, Indian Central Bank) has increased bank interest rates by 375bp
over the last 18 months. While we believe interest rates have likely peaked, we expect rates will likely
be only cut by a modest 50-75bp in FY13 as inflation will likely stay higher than RBI’s target of 5%.
Our channel check suggests that ~70% of cars are sold via the finance route.
50.0
52.0
54.0
56.0
58.0
60.0
62.0
64.0
66.0
68.0
70.0
Oct-10 Jan-11 Apr-11 Jul-11 Oct-11 Jan-12 Apr-12
Rs/L
-16.0
-11.0
-6.0
-1.0
4.0
Apr-09 Oct-09 Apr-10 Oct-10 Apr-11 Oct-11 Apr-12
Rs/lt
Gasoline (Rs/lt) Diesel (Rs/lt)
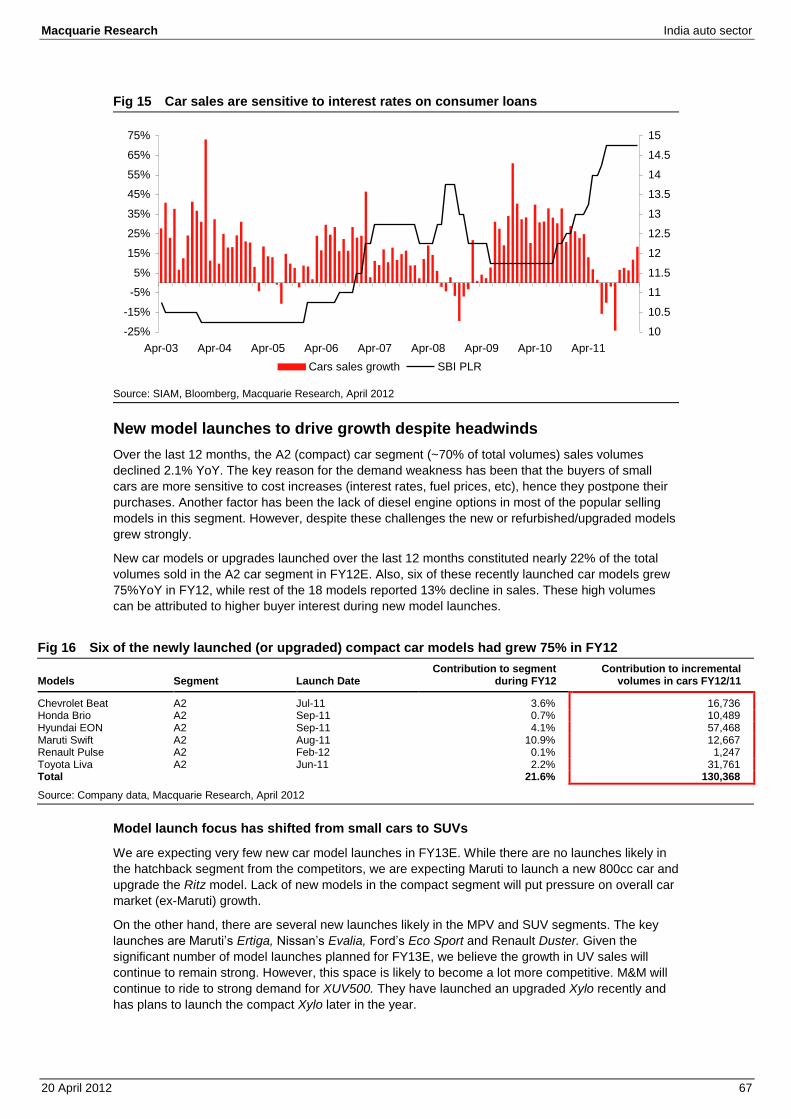
Macquarie Research India auto sector
20 April 2012 67
Fig 15 Car sales are sensitive to interest rates on consumer loans
Source: SIAM, Bloomberg, Macquarie Research, April 2012
New model launches to drive growth despite headwinds Over the last 12 months, the A2 (compact) car segment (~70% of total volumes) sales volumes
declined 2.1% YoY. The key reason for the demand weakness has been that the buyers of small
cars are more sensitive to cost increases (interest rates, fuel prices, etc), hence they postpone their
purchases. Another factor has been the lack of diesel engine options in most of the popular selling
models in this segment. However, despite these challenges the new or refurbished/upgraded models
grew strongly.
New car models or upgrades launched over the last 12 months constituted nearly 22% of the total
volumes sold in the A2 car segment in FY12E. Also, six of these recently launched car models grew
75%YoY in FY12, while rest of the 18 models reported 13% decline in sales. These high volumes
can be attributed to higher buyer interest during new model launches.
Fig 16 Six of the newly launched (or upgraded) compact car models had grew 75% in FY12
Models Segment Launch Date Contribution to segment
during FY12 Contribution to incremental
volumes in cars FY12/11
Chevrolet Beat A2 Jul-11 3.6% 16,736 Honda Brio A2 Sep-11 0.7% 10,489 Hyundai EON A2 Sep-11 4.1% 57,468 Maruti Swift A2 Aug-11 10.9% 12,667 Renault Pulse A2 Feb-12 0.1% 1,247 Toyota Liva A2 Jun-11 2.2% 31,761 Total 21.6% 130,368 Source: Company data, Macquarie Research, April 2012
Model launch focus has shifted from small cars to SUVs
We are expecting very few new car model launches in FY13E. While there are no launches likely in
the hatchback segment from the competitors, we are expecting Maruti to launch a new 800cc car and
upgrade the Ritz model. Lack of new models in the compact segment will put pressure on overall car
market (ex-Maruti) growth.
On the other hand, there are several new launches likely in the MPV and SUV segments. The key
launches are Maruti’s Ertiga, Nissan’s Evalia, Ford’s Eco Sport and Renault Duster. Given the
significant number of model launches planned for FY13E, we believe the growth in UV sales will
continue to remain strong. However, this space is likely to become a lot more competitive. M&M will
continue to ride to strong demand for XUV500. They have launched an upgraded Xylo recently and
has plans to launch the compact Xylo later in the year.
-25%
-15%
-5%
5%
15%
25%
35%
45%
55%
65%
75%
Apr-03 Apr-04 Apr-05 Apr-06 Apr-07 Apr-08 Apr-09 Apr-10 Apr-11
10
10.5
11
11.5
12
12.5
13
13.5
14
14.5
15
Cars sales growth SBI PLR
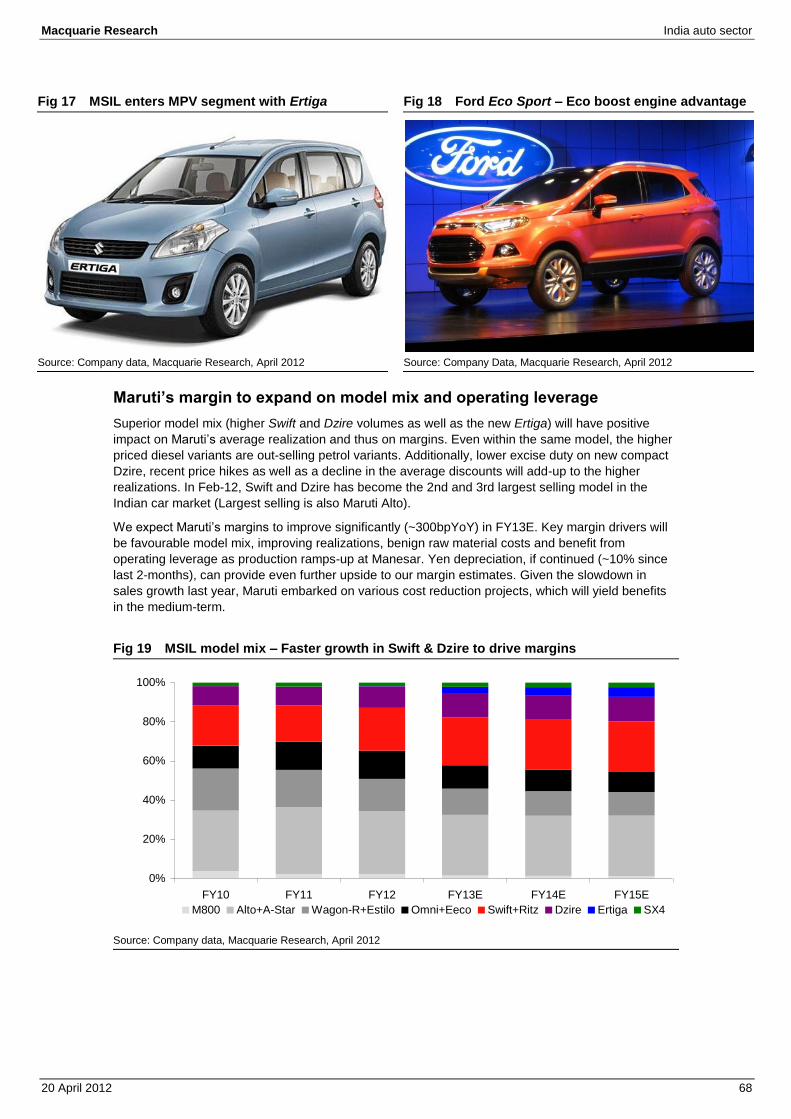
Macquarie Research India auto sector
20 April 2012 68
Fig 17 MSIL enters MPV segment with Ertiga Fig 18 Ford Eco Sport – Eco boost engine advantage
Source: Company data, Macquarie Research, April 2012 Source: Company Data, Macquarie Research, April 2012
Maruti’s margin to expand on model mix and operating leverage Superior model mix (higher Swift and Dzire volumes as well as the new Ertiga) will have positive
impact on Maruti’s average realization and thus on margins. Even within the same model, the higher
priced diesel variants are out-selling petrol variants. Additionally, lower excise duty on new compact
Dzire, recent price hikes as well as a decline in the average discounts will add-up to the higher
realizations. In Feb-12, Swift and Dzire has become the 2nd and 3rd largest selling model in the
Indian car market (Largest selling is also Maruti Alto).
We expect Maruti’s margins to improve significantly (~300bpYoY) in FY13E. Key margin drivers will
be favourable model mix, improving realizations, benign raw material costs and benefit from
operating leverage as production ramps-up at Manesar. Yen depreciation, if continued (~10% since
last 2-months), can provide even further upside to our margin estimates. Given the slowdown in
sales growth last year, Maruti embarked on various cost reduction projects, which will yield benefits
in the medium-term.
Fig 19 MSIL model mix – Faster growth in Swift & Dzire to drive margins
Source: Company data, Macquarie Research, April 2012
0%
20%
40%
60%
80%
100%
FY10 FY11 FY12 FY13E FY14E FY15E
M800 Alto+A-Star Wagon-R+Estilo Omni+Eeco Swift+Ritz Dzire Ertiga SX4
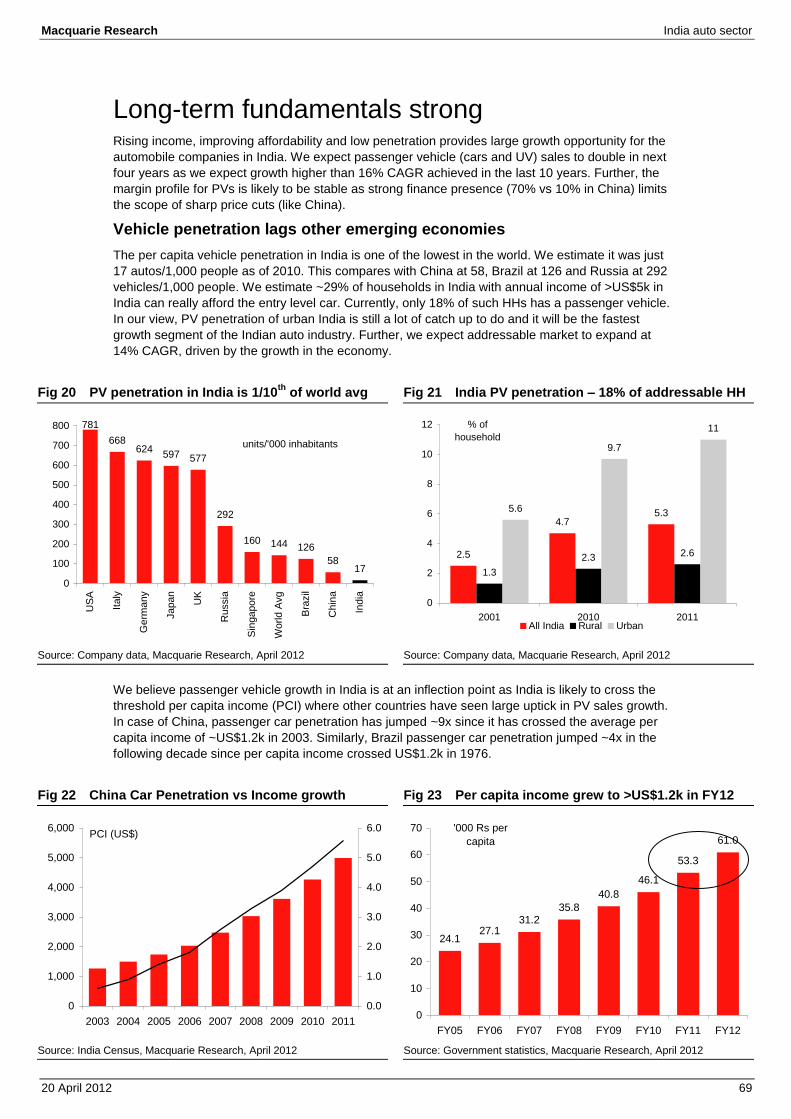
Macquarie Research India auto sector
20 April 2012 69
Long-term fundamentals strong Rising income, improving affordability and low penetration provides large growth opportunity for the
automobile companies in India. We expect passenger vehicle (cars and UV) sales to double in next
four years as we expect growth higher than 16% CAGR achieved in the last 10 years. Further, the
margin profile for PVs is likely to be stable as strong finance presence (70% vs 10% in China) limits
the scope of sharp price cuts (like China).
Vehicle penetration lags other emerging economies The per capita vehicle penetration in India is one of the lowest in the world. We estimate it was just
17 autos/1,000 people as of 2010. This compares with China at 58, Brazil at 126 and Russia at 292
vehicles/1,000 people. We estimate ~29% of households in India with annual income of >US$5k in
India can really afford the entry level car. Currently, only 18% of such HHs has a passenger vehicle.
In our view, PV penetration of urban India is still a lot of catch up to do and it will be the fastest
growth segment of the Indian auto industry. Further, we expect addressable market to expand at
14% CAGR, driven by the growth in the economy.
Fig 20 PV penetration in India is 1/10th of world avg Fig 21 India PV penetration – 18% of addressable HH
Source: Company data, Macquarie Research, April 2012 Source: Company data, Macquarie Research, April 2012
We believe passenger vehicle growth in India is at an inflection point as India is likely to cross the
threshold per capita income (PCI) where other countries have seen large uptick in PV sales growth.
In case of China, passenger car penetration has jumped ~9x since it has crossed the average per
capita income of ~US$1.2k in 2003. Similarly, Brazil passenger car penetration jumped ~4x in the
following decade since per capita income crossed US$1.2k in 1976.
Fig 22 China Car Penetration vs Income growth Fig 23 Per capita income grew to >US$1.2k in FY12
Source: India Census, Macquarie Research, April 2012 Source: Government statistics, Macquarie Research, April 2012
781
668624
597 577
292
160 144 126
5817
0
100
200
300
400
500
600
700
800
US
A
Italy
Germ
any
Japan
UK
Russia
Sin
gapore
World A
vg
Bra
zil
Chin
a
India
units/'000 inhabitants
2.5
4.75.3
1.3
2.3 2.6
5.6
9.7
11
0
2
4
6
8
10
12
2001 2010 2011
% of
household
All India Rural Urban
0
1,000
2,000
3,000
4,000
5,000
6,000
2003 2004 2005 2006 2007 2008 2009 2010 2011
PCI (US$)
0.0
1.0
2.0
3.0
4.0
5.0
6.0
PCI (US$) Household car penetration (%)
24.127.1
31.235.8
40.8
46.1
53.3
61.0
0
10
20
30
40
50
60
70
FY05 FY06 FY07 FY08 FY09 FY10 FY11 FY12
'000 Rs per
capita
Per capita income
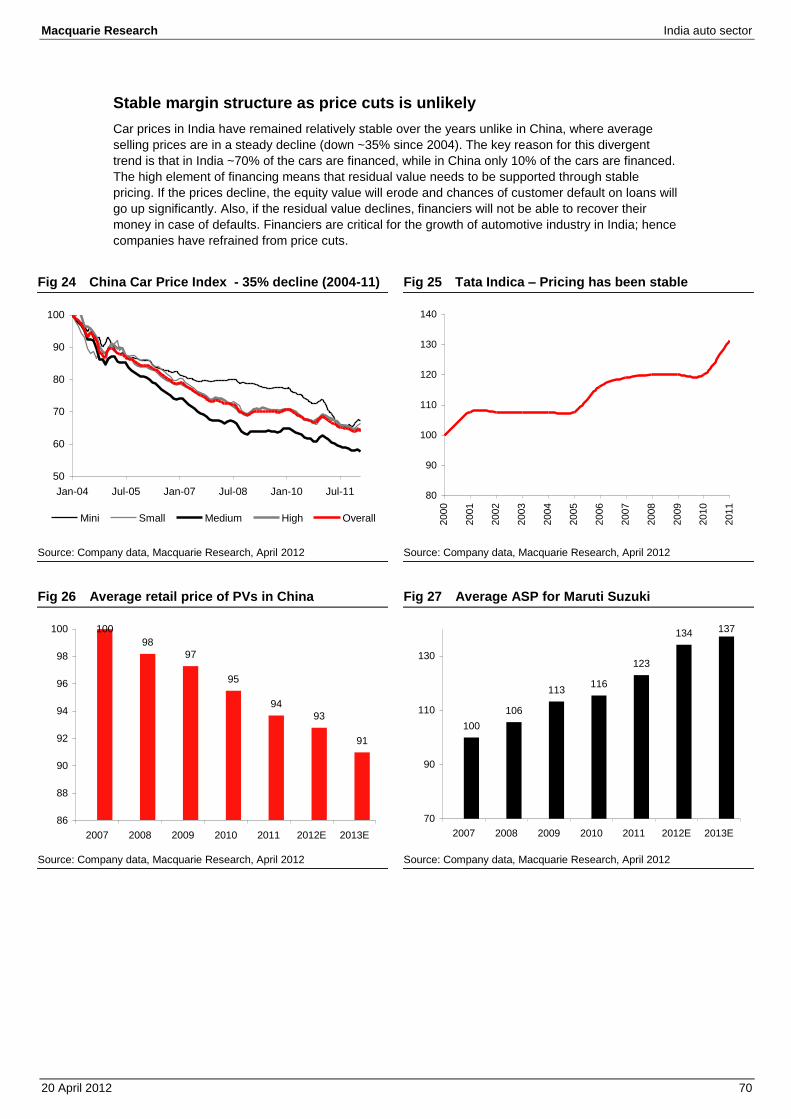
Macquarie Research India auto sector
20 April 2012 70
Stable margin structure as price cuts is unlikely Car prices in India have remained relatively stable over the years unlike in China, where average
selling prices are in a steady decline (down ~35% since 2004). The key reason for this divergent
trend is that in India ~70% of the cars are financed, while in China only 10% of the cars are financed.
The high element of financing means that residual value needs to be supported through stable
pricing. If the prices decline, the equity value will erode and chances of customer default on loans will
go up significantly. Also, if the residual value declines, financiers will not be able to recover their
money in case of defaults. Financiers are critical for the growth of automotive industry in India; hence
companies have refrained from price cuts.
Fig 24 China Car Price Index - 35% decline (2004-11) Fig 25 Tata Indica – Pricing has been stable
Source: Company data, Macquarie Research, April 2012 Source: Company data, Macquarie Research, April 2012
Fig 26 Average retail price of PVs in China Fig 27 Average ASP for Maruti Suzuki
Source: Company data, Macquarie Research, April 2012 Source: Company data, Macquarie Research, April 2012
50
60
70
80
90
100
Jan-04 Jul-05 Jan-07 Jul-08 Jan-10 Jul-11
Mini Small Medium High Overall
80
90
100
110
120
130
140
2000
2001
2002
2003
2004
2005
2006
2007
2008
2009
2010
2011
100
98
97
95
94
93
91
86
88
90
92
94
96
98
100
2007 2008 2009 2010 2011 2012E 2013E
100
106
113116
123
134 137
70
90
110
130
2007 2008 2009 2010 2011 2012E 2013E
Macquarie Research India auto sector
20 April 2012 71
Maruti Suzuki India (MSIL IN, Outperform, Target Price: Rs1,665.00) Quarterly Results 3Q/12A 4Q/12E 1Q/13E 2Q/13E Profit & Loss 2011A 2012E 2013E 2014E
Revenue bn 91 94 99 115 Revenue bn 363 350 453 531 Gross Profit bn 12 12 15 17 Gross Profit bn 51 45 66 77 Cost of Goods Sold bn 79 82 85 98 Cost of Goods Sold bn 312 305 387 453 EBITDA bn 5 6 8 10 EBITDA bn 29 21 39 45 Depreciation bn 3 3 3 3 Depreciation bn 10 11 13 13 Amortisation of Goodwill bn 0 0 0 0 Amortisation of Goodwill bn 0 0 0 0 Other Amortisation bn 0 0 0 0 Other Amortisation bn 0 0 0 0 EBIT bn 3 3 5 7 EBIT bn 19 10 26 33 Net Interest Income bn 1 1 1 1 Net Interest Income bn 2 3 3 3 Associates bn 0 0 0 0 Associates bn 0 0 0 0 Exceptionals bn 0 0 0 0 Exceptionals bn 1 0 0 0 Forex Gains / Losses bn 0 0 0 0 Forex Gains / Losses bn 0 0 0 0 Other Pre-Tax Income bn 2 2 3 3 Other Pre-Tax Income bn 9 9 12 12 Pre-Tax Profit bn 6 6 9 10 Pre-Tax Profit bn 31 22 41 48 Tax Expense bn -1 -2 -2 -3 Tax Expense bn -8 -6 -11 -13 Net Profit bn 4 5 6 8 Net Profit bn 23 16 30 36 Minority Interests bn 0 0 0 0 Minority Interests bn 0 0 0 0
Reported Earnings bn 4 5 6 8 Reported Earnings bn 23 16 30 36 Adjusted Earnings bn 4 5 6 8 Adjusted Earnings bn 22 16 30 36
EPS (rep) 14.88 15.83 21.43 26.45 EPS (rep) 79.21 56.12 104.01 123.15 EPS (adj) 14.88 15.83 21.43 26.45 EPS (adj) 76.15 56.12 104.01 123.15 EPS Growth yoy (adj) % -25.7 -25.2 93.2 84.7 EPS Growth (adj) % -11.9 -26.3 85.3 18.4
PE (rep) x 17.5 24.8 13.4 11.3 PE (adj) x 18.2 24.8 13.4 11.3
EBITDA Margin % 6.0 6.0 8.5 8.5 Total DPS 7.00 7.00 10.00 10.00 EBIT Margin % 2.9 3.1 5.4 5.8 Total Div Yield % 0.5 0.5 0.7 0.7 Earnings Split % 26.5 28.2 20.6 25.4 Weighted Average Shares m 289 289 289 289 Revenue Growth % -3.5 -3.5 29.4 29.4 Period End Shares m 289 289 289 289 EBIT Growth % -46.9 -45.9 190.7 160.5
Profit and Loss Ratios 2011A 2012E 2013E 2014E Cashflow Analysis 2011A 2012E 2013E 2014E
Revenue Growth % 24.8 -3.5 29.4 17.1 EBITDA bn 29 21 39 45 EBITDA Growth % -14.8 -27.9 83.3 17.7 Tax Paid bn -10 -4 -10 -16 EBIT Growth % -26.7 -48.0 162.5 25.7 Chgs in Working Cap bn 4 -1 -2 -0 Gross Profit Margin % 14.1 12.9 14.7 14.6 Net Interest Paid bn 0 0 0 0 EBITDA Margin % 8.1 6.0 8.5 8.6 Other bn 7 7 9 10 EBIT Margin % 5.3 2.8 5.8 6.2 Operating Cashflow bn 31 22 35 39 Net Profit Margin % 6.3 4.6 6.6 6.7 Acquisitions bn -319 -2 -2 -2 Payout Ratio % 9.2 12.5 9.6 8.1 Capex bn -24 -40 -15 -30 EV/EBITDA x 13.6 18.8 10.3 8.7 Asset Sales bn 340 0 0 0 EV/EBIT x 20.8 39.9 15.2 12.1 Other bn 4 5 6 6
Investing Cashflow bn 1 -37 -11 -26 Balance Sheet Ratios Dividend (Ordinary) bn -2 -3 -2 -3 ROE % 17.3 11.1 18.1 18.2 Equity Raised bn 0 0 0 0 ROA % 10.7 5.2 12.0 12.9 Debt Movements bn -5 0 0 0 ROIC % 17.2 6.3 13.0 15.8 Other bn -0 -0 -0 -0 Net Debt/Equity % -15.9 -3.1 -14.9 -17.2 Financing Cashflow bn -7 -3 -3 -4 Interest Cover x nmf nmf nmf nmf Price/Book x 2.9 2.6 2.2 1.9 Net Chg in Cash/Debt bn 24 -17 22 10 Book Value per Share 480.0 527.9 620.2 731.7
Free Cashflow bn 6 -18 20 9 Balance Sheet 2011A 2012E 2013E 2014E Cash bn 25 8 30 40 Receivables bn 9 13 17 20 Inventories bn 14 18 22 25 Investments bn 65 63 65 67 Fixed Assets bn 70 98 101 118 Intangibles bn 0 0 0 0 Other Assets bn 3 1 1 1 Total Assets bn 185 201 236 271 Payables bn 29 27 34 40 Short Term Debt bn 0 0 0 0 Long Term Debt bn 3 3 3 3 Provisions bn 5 6 9 6 Other Liabilities bn 9 12 11 11 Total Liabilities bn 46 48 56 59 Shareholders' Funds bn 139 153 179 211 Minority Interests bn 0 0 0 0 Other bn 0 0 0 0 Total S/H Equity bn 139 153 179 211 Total Liab & S/H Funds bn 185 201 236 271
All figures in INR unless noted. Source: Company data, Macquarie Research, April 2012
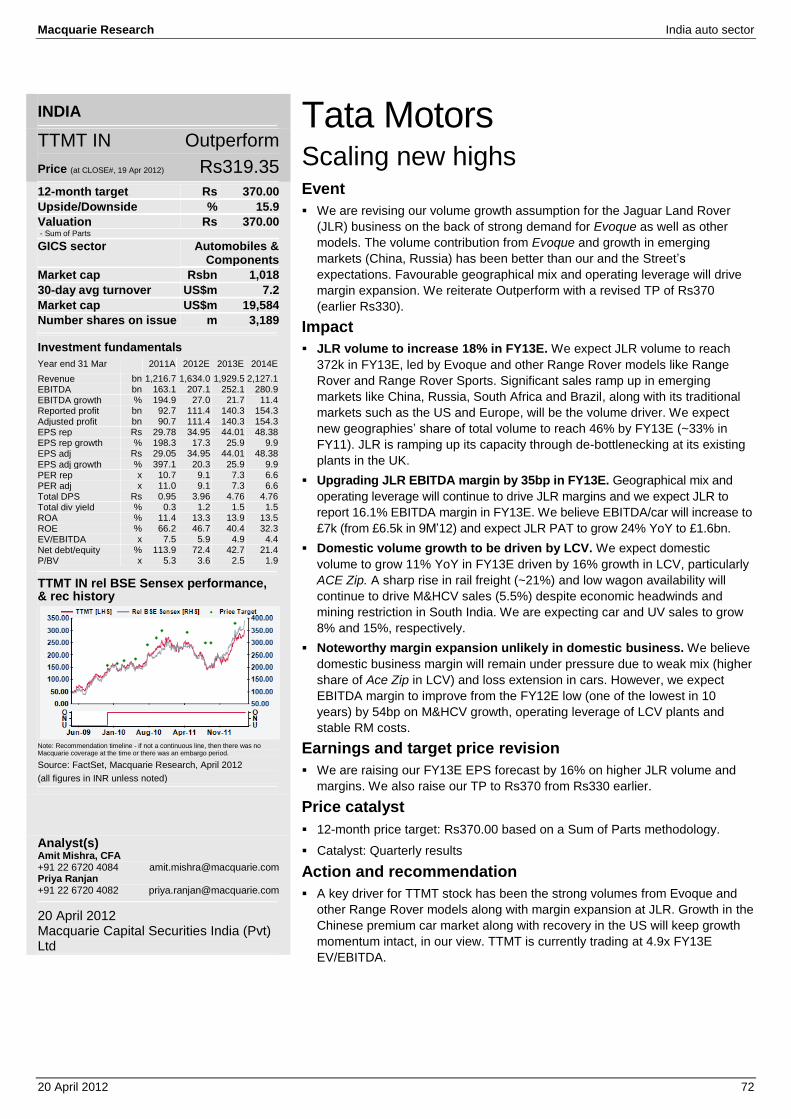
Macquarie Research India auto sector
20 April 2012 72
INDIA
TTMT IN Outperform
Price (at CLOSE#, 19 Apr 2012) Rs319.35
12-month target Rs 370.00 Upside/Downside % 15.9 Valuation Rs 370.00 - Sum of Parts GICS sector Automobiles &
Components Market cap Rsbn 1,018 30-day avg turnover US$m 7.2 Market cap US$m 19,584 Number shares on issue m 3,189
Investment fundamentals Year end 31 Mar 2011A 2012E 2013E 2014E
Revenue bn 1,216.7 1,634.0 1,929.5 2,127.1 EBITDA bn 163.1 207.1 252.1 280.9 EBITDA growth % 194.9 27.0 21.7 11.4 Reported profit bn 92.7 111.4 140.3 154.3 Adjusted profit bn 90.7 111.4 140.3 154.3 EPS rep Rs 29.78 34.95 44.01 48.38 EPS rep growth % 198.3 17.3 25.9 9.9 EPS adj Rs 29.05 34.95 44.01 48.38
EPS adj growth % 397.1 20.3 25.9 9.9 PER rep x 10.7 9.1 7.3 6.6 PER adj x 11.0 9.1 7.3 6.6 Total DPS Rs 0.95 3.96 4.76 4.76 Total div yield % 0.3 1.2 1.5 1.5 ROA % 11.4 13.3 13.9 13.5 ROE % 66.2 46.7 40.4 32.3
EV/EBITDA x 7.5 5.9 4.9 4.4 Net debt/equity % 113.9 72.4 42.7 21.4 P/BV x 5.3 3.6 2.5 1.9
TTMT IN rel BSE Sensex performance, & rec history
Note: Recommendation timeline - if not a continuous line, then there was no Macquarie coverage at the time or there was an embargo period.
Source: FactSet, Macquarie Research, April 2012
(all figures in INR unless noted)
Analyst(s) Amit Mishra, CFA +91 22 6720 4084 [email protected] Priya Ranjan +91 22 6720 4082 [email protected]
20 April 2012 Macquarie Capital Securities India (Pvt) Ltd
Tata Motors Scaling new highs Event We are revising our volume growth assumption for the Jaguar Land Rover
(JLR) business on the back of strong demand for Evoque as well as other
models. The volume contribution from Evoque and growth in emerging
markets (China, Russia) has been better than our and the Street’s
expectations. Favourable geographical mix and operating leverage will drive
margin expansion. We reiterate Outperform with a revised TP of Rs370
(earlier Rs330).
Impact JLR volume to increase 18% in FY13E. We expect JLR volume to reach
372k in FY13E, led by Evoque and other Range Rover models like Range
Rover and Range Rover Sports. Significant sales ramp up in emerging
markets like China, Russia, South Africa and Brazil, along with its traditional
markets such as the US and Europe, will be the volume driver. We expect
new geographies’ share of total volume to reach 46% by FY13E (~33% in
FY11). JLR is ramping up its capacity through de-bottlenecking at its existing
plants in the UK.
Upgrading JLR EBITDA margin by 35bp in FY13E. Geographical mix and
operating leverage will continue to drive JLR margins and we expect JLR to
report 16.1% EBITDA margin in FY13E. We believe EBITDA/car will increase to
£7k (from £6.5k in 9M’12) and expect JLR PAT to grow 24% YoY to £1.6bn.
Domestic volume growth to be driven by LCV. We expect domestic
volume to grow 11% YoY in FY13E driven by 16% growth in LCV, particularly
ACE Zip. A sharp rise in rail freight (~21%) and low wagon availability will
continue to drive M&HCV sales (5.5%) despite economic headwinds and
mining restriction in South India. We are expecting car and UV sales to grow
8% and 15%, respectively.
Noteworthy margin expansion unlikely in domestic business. We believe
domestic business margin will remain under pressure due to weak mix (higher
share of Ace Zip in LCV) and loss extension in cars. However, we expect
EBITDA margin to improve from the FY12E low (one of the lowest in 10
years) by 54bp on M&HCV growth, operating leverage of LCV plants and
stable RM costs.
Earnings and target price revision We are raising our FY13E EPS forecast by 16% on higher JLR volume and
margins. We also raise our TP to Rs370 from Rs330 earlier.
Price catalyst 12-month price target: Rs370.00 based on a Sum of Parts methodology.
Catalyst: Quarterly results
Action and recommendation A key driver for TTMT stock has been the strong volumes from Evoque and
other Range Rover models along with margin expansion at JLR. Growth in the
Chinese premium car market along with recovery in the US will keep growth
momentum intact, in our view. TTMT is currently trading at 4.9x FY13E
EV/EBITDA.
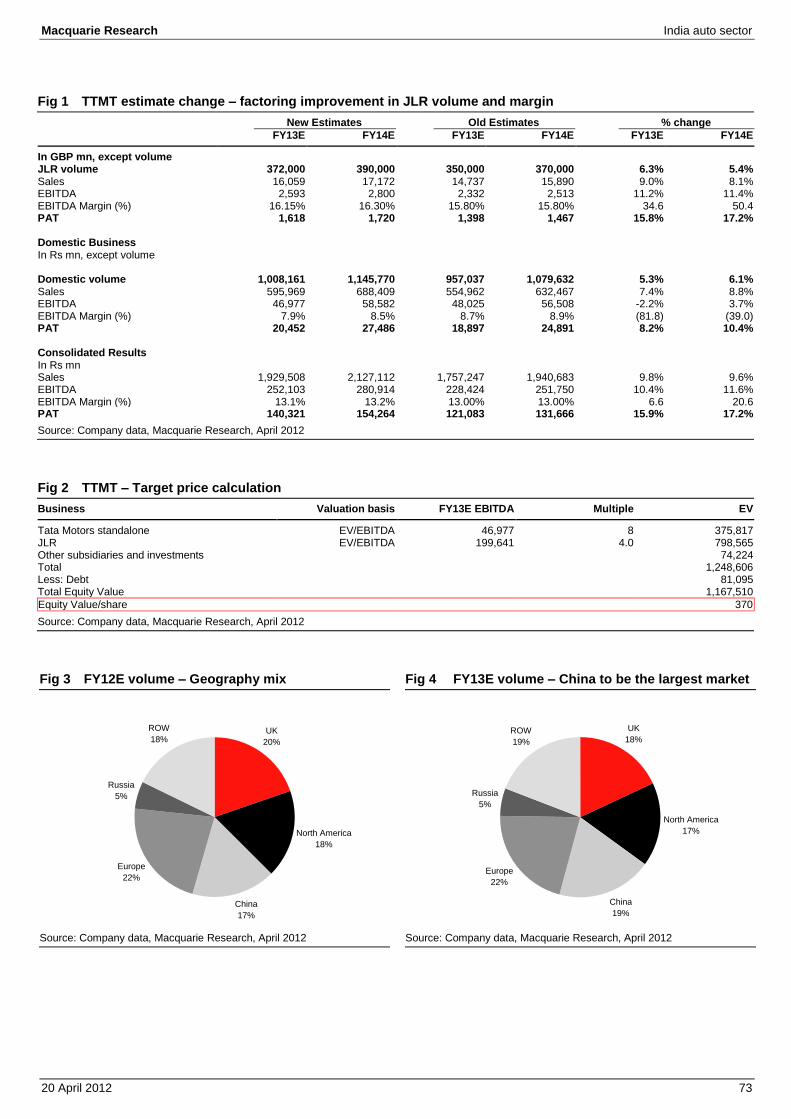
Macquarie Research India auto sector
20 April 2012 73
Fig 1 TTMT estimate change – factoring improvement in JLR volume and margin New Estimates Old Estimates % change FY13E FY14E FY13E FY14E FY13E FY14E
In GBP mn, except volume JLR volume 372,000 390,000 350,000 370,000 6.3% 5.4% Sales 16,059 17,172 14,737 15,890 9.0% 8.1% EBITDA 2,593 2,800 2,332 2,513 11.2% 11.4% EBITDA Margin (%) 16.15% 16.30% 15.80% 15.80% 34.6 50.4 PAT 1,618 1,720 1,398 1,467 15.8% 17.2% Domestic Business In Rs mn, except volume Domestic volume 1,008,161 1,145,770 957,037 1,079,632 5.3% 6.1% Sales 595,969 688,409 554,962 632,467 7.4% 8.8% EBITDA 46,977 58,582 48,025 56,508 -2.2% 3.7% EBITDA Margin (%) 7.9% 8.5% 8.7% 8.9% (81.8) (39.0) PAT 20,452 27,486 18,897 24,891 8.2% 10.4% Consolidated Results In Rs mn Sales 1,929,508 2,127,112 1,757,247 1,940,683 9.8% 9.6% EBITDA 252,103 280,914 228,424 251,750 10.4% 11.6% EBITDA Margin (%) 13.1% 13.2% 13.00% 13.00% 6.6 20.6 PAT 140,321 154,264 121,083 131,666 15.9% 17.2% Source: Company data, Macquarie Research, April 2012
Fig 2 TTMT – Target price calculation Business Valuation basis FY13E EBITDA Multiple EV
Tata Motors standalone EV/EBITDA 46,977 8 375,817 JLR EV/EBITDA 199,641 4.0 798,565 Other subsidiaries and investments 74,224 Total 1,248,606 Less: Debt 81,095 Total Equity Value 1,167,510
Equity Value/share 370
Source: Company data, Macquarie Research, April 2012
Fig 3 FY12E volume – Geography mix Fig 4 FY13E volume – China to be the largest market
Source: Company data, Macquarie Research, April 2012 Source: Company data, Macquarie Research, April 2012
UK
20%
North America
18%
China
17%
Europe
22%
Russia
5%
ROW
18%
UK
18%
North America
17%
China
19%
Europe
22%
Russia
5%
ROW
19%
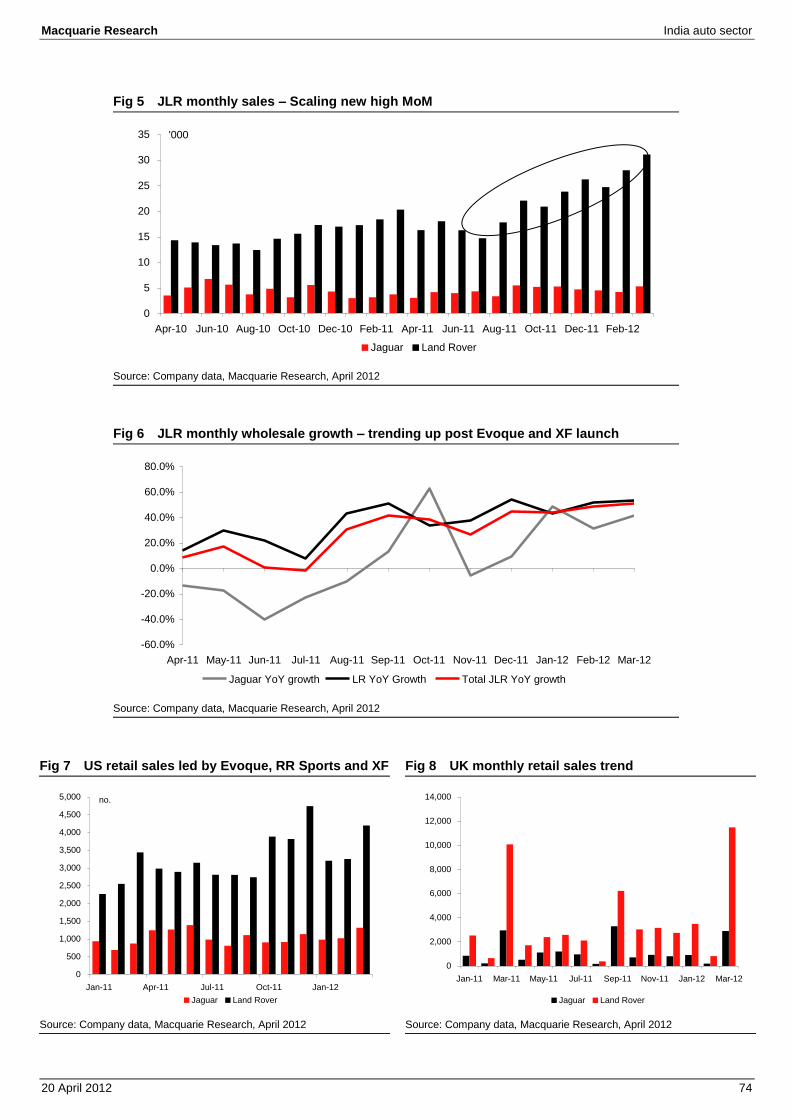
Macquarie Research India auto sector
20 April 2012 74
Fig 5 JLR monthly sales – Scaling new high MoM
Source: Company data, Macquarie Research, April 2012
Fig 6 JLR monthly wholesale growth – trending up post Evoque and XF launch
Source: Company data, Macquarie Research, April 2012
Fig 7 US retail sales led by Evoque, RR Sports and XF Fig 8 UK monthly retail sales trend
Source: Company data, Macquarie Research, April 2012 Source: Company data, Macquarie Research, April 2012
0
5
10
15
20
25
30
35
Apr-10 Jun-10 Aug-10 Oct-10 Dec-10 Feb-11 Apr-11 Jun-11 Aug-11 Oct-11 Dec-11 Feb-12
'000
Jaguar Land Rover
-60.0%
-40.0%
-20.0%
0.0%
20.0%
40.0%
60.0%
80.0%
Apr-11 May-11 Jun-11 Jul-11 Aug-11 Sep-11 Oct-11 Nov-11 Dec-11 Jan-12 Feb-12 Mar-12
Jaguar YoY growth LR YoY Growth Total JLR YoY growth
0
500
1,000
1,500
2,000
2,500
3,000
3,500
4,000
4,500
5,000
Jan-11 Apr-11 Jul-11 Oct-11 Jan-12
no.
Jaguar Land Rover
0
2,000
4,000
6,000
8,000
10,000
12,000
14,000
Jan-11 Mar-11 May-11 Jul-11 Sep-11 Nov-11 Jan-12 Mar-12
Jaguar Land Rover
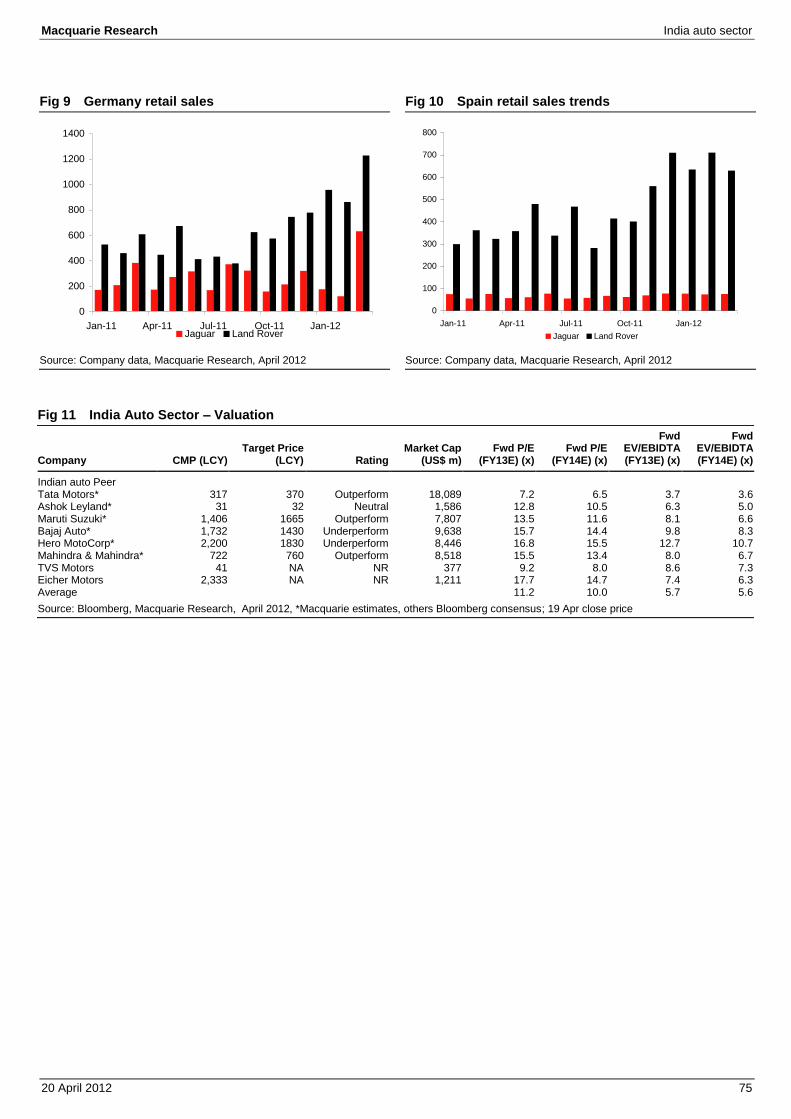
Macquarie Research India auto sector
20 April 2012 75
Fig 9 Germany retail sales Fig 10 Spain retail sales trends
Source: Company data, Macquarie Research, April 2012 Source: Company data, Macquarie Research, April 2012
Fig 11 India Auto Sector – Valuation
Company CMP (LCY) Target Price
(LCY) Rating Market Cap
(US$ m) Fwd P/E
(FY13E) (x) Fwd P/E
(FY14E) (x)
Fwd EV/EBIDTA (FY13E) (x)
Fwd EV/EBIDTA (FY14E) (x)
Indian auto Peer Tata Motors* 317 370 Outperform 18,089 7.2 6.5 3.7 3.6 Ashok Leyland* 31 32 Neutral 1,586 12.8 10.5 6.3 5.0 Maruti Suzuki* 1,406 1665 Outperform 7,807 13.5 11.6 8.1 6.6 Bajaj Auto* 1,732 1430 Underperform 9,638 15.7 14.4 9.8 8.3 Hero MotoCorp* 2,200 1830 Underperform 8,446 16.8 15.5 12.7 10.7 Mahindra & Mahindra* 722 760 Outperform 8,518 15.5 13.4 8.0 6.7 TVS Motors 41 NA NR 377 9.2 8.0 8.6 7.3 Eicher Motors 2,333 NA NR 1,211 17.7 14.7 7.4 6.3 Average 11.2 10.0 5.7 5.6
Source: Bloomberg, Macquarie Research, April 2012, *Macquarie estimates, others Bloomberg consensus; 19 Apr close price
0
200
400
600
800
1000
1200
1400
Jan-11 Apr-11 Jul-11 Oct-11 Jan-12Jaguar Land Rover
0
100
200
300
400
500
600
700
800
Jan-11 Apr-11 Jul-11 Oct-11 Jan-12
Jaguar Land Rover
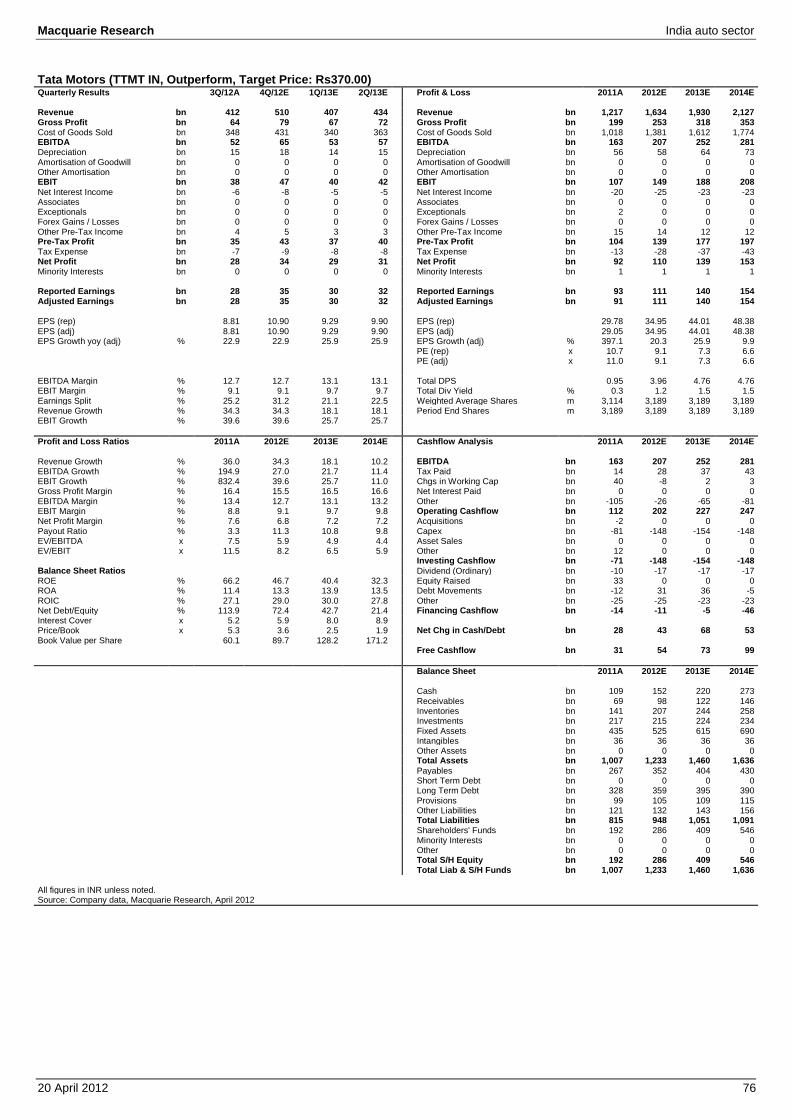
Macquarie Research India auto sector
20 April 2012 76
Tata Motors (TTMT IN, Outperform, Target Price: Rs370.00) Quarterly Results 3Q/12A 4Q/12E 1Q/13E 2Q/13E Profit & Loss 2011A 2012E 2013E 2014E
Revenue bn 412 510 407 434 Revenue bn 1,217 1,634 1,930 2,127 Gross Profit bn 64 79 67 72 Gross Profit bn 199 253 318 353 Cost of Goods Sold bn 348 431 340 363 Cost of Goods Sold bn 1,018 1,381 1,612 1,774 EBITDA bn 52 65 53 57 EBITDA bn 163 207 252 281 Depreciation bn 15 18 14 15 Depreciation bn 56 58 64 73 Amortisation of Goodwill bn 0 0 0 0 Amortisation of Goodwill bn 0 0 0 0 Other Amortisation bn 0 0 0 0 Other Amortisation bn 0 0 0 0 EBIT bn 38 47 40 42 EBIT bn 107 149 188 208 Net Interest Income bn -6 -8 -5 -5 Net Interest Income bn -20 -25 -23 -23 Associates bn 0 0 0 0 Associates bn 0 0 0 0 Exceptionals bn 0 0 0 0 Exceptionals bn 2 0 0 0 Forex Gains / Losses bn 0 0 0 0 Forex Gains / Losses bn 0 0 0 0 Other Pre-Tax Income bn 4 5 3 3 Other Pre-Tax Income bn 15 14 12 12 Pre-Tax Profit bn 35 43 37 40 Pre-Tax Profit bn 104 139 177 197 Tax Expense bn -7 -9 -8 -8 Tax Expense bn -13 -28 -37 -43 Net Profit bn 28 34 29 31 Net Profit bn 92 110 139 153 Minority Interests bn 0 0 0 0 Minority Interests bn 1 1 1 1
Reported Earnings bn 28 35 30 32 Reported Earnings bn 93 111 140 154 Adjusted Earnings bn 28 35 30 32 Adjusted Earnings bn 91 111 140 154
EPS (rep) 8.81 10.90 9.29 9.90 EPS (rep) 29.78 34.95 44.01 48.38 EPS (adj) 8.81 10.90 9.29 9.90 EPS (adj) 29.05 34.95 44.01 48.38 EPS Growth yoy (adj) % 22.9 22.9 25.9 25.9 EPS Growth (adj) % 397.1 20.3 25.9 9.9
PE (rep) x 10.7 9.1 7.3 6.6 PE (adj) x 11.0 9.1 7.3 6.6
EBITDA Margin % 12.7 12.7 13.1 13.1 Total DPS 0.95 3.96 4.76 4.76 EBIT Margin % 9.1 9.1 9.7 9.7 Total Div Yield % 0.3 1.2 1.5 1.5 Earnings Split % 25.2 31.2 21.1 22.5 Weighted Average Shares m 3,114 3,189 3,189 3,189 Revenue Growth % 34.3 34.3 18.1 18.1 Period End Shares m 3,189 3,189 3,189 3,189 EBIT Growth % 39.6 39.6 25.7 25.7
Profit and Loss Ratios 2011A 2012E 2013E 2014E Cashflow Analysis 2011A 2012E 2013E 2014E
Revenue Growth % 36.0 34.3 18.1 10.2 EBITDA bn 163 207 252 281 EBITDA Growth % 194.9 27.0 21.7 11.4 Tax Paid bn 14 28 37 43 EBIT Growth % 832.4 39.6 25.7 11.0 Chgs in Working Cap bn 40 -8 2 3 Gross Profit Margin % 16.4 15.5 16.5 16.6 Net Interest Paid bn 0 0 0 0 EBITDA Margin % 13.4 12.7 13.1 13.2 Other bn -105 -26 -65 -81 EBIT Margin % 8.8 9.1 9.7 9.8 Operating Cashflow bn 112 202 227 247 Net Profit Margin % 7.6 6.8 7.2 7.2 Acquisitions bn -2 0 0 0 Payout Ratio % 3.3 11.3 10.8 9.8 Capex bn -81 -148 -154 -148 EV/EBITDA x 7.5 5.9 4.9 4.4 Asset Sales bn 0 0 0 0 EV/EBIT x 11.5 8.2 6.5 5.9 Other bn 12 0 0 0
Investing Cashflow bn -71 -148 -154 -148 Balance Sheet Ratios Dividend (Ordinary) bn -10 -17 -17 -17 ROE % 66.2 46.7 40.4 32.3 Equity Raised bn 33 0 0 0 ROA % 11.4 13.3 13.9 13.5 Debt Movements bn -12 31 36 -5 ROIC % 27.1 29.0 30.0 27.8 Other bn -25 -25 -23 -23 Net Debt/Equity % 113.9 72.4 42.7 21.4 Financing Cashflow bn -14 -11 -5 -46 Interest Cover x 5.2 5.9 8.0 8.9 Price/Book x 5.3 3.6 2.5 1.9 Net Chg in Cash/Debt bn 28 43 68 53 Book Value per Share 60.1 89.7 128.2 171.2
Free Cashflow bn 31 54 73 99 Balance Sheet 2011A 2012E 2013E 2014E Cash bn 109 152 220 273 Receivables bn 69 98 122 146 Inventories bn 141 207 244 258 Investments bn 217 215 224 234 Fixed Assets bn 435 525 615 690 Intangibles bn 36 36 36 36 Other Assets bn 0 0 0 0 Total Assets bn 1,007 1,233 1,460 1,636 Payables bn 267 352 404 430 Short Term Debt bn 0 0 0 0 Long Term Debt bn 328 359 395 390 Provisions bn 99 105 109 115 Other Liabilities bn 121 132 143 156 Total Liabilities bn 815 948 1,051 1,091 Shareholders' Funds bn 192 286 409 546 Minority Interests bn 0 0 0 0 Other bn 0 0 0 0 Total S/H Equity bn 192 286 409 546 Total Liab & S/H Funds bn 1,007 1,233 1,460 1,636
All figures in INR unless noted. Source: Company data, Macquarie Research, April 2012
Macquarie Research India auto sector
20 April 2012 77
INDIA
MM IN Outperform
Price (at CLOSE#, 19 Apr 2012) Rs706.25
12-month target Rs 760.00 Upside/Downside % 7.6 Valuation Rs 760.00 - Sum of Parts GICS sector Automobiles &
Components Market cap Rsm 433,620 30-day avg turnover US$m 1.5 Market cap US$m 8,340 Number shares on issue m 614.0
Investment fundamentals Year end 31 Mar 2011A 2012E 2013E 2014E
Revenue bn 234.8 311.8 347.7 396.3 EBITDA bn 34.4 37.6 39.8 46.0 EBITDA growth % 16.4 9.4 5.8 15.6 Reported profit bn 26.6 27.1 28.6 32.9 Adjusted profit bn 25.7 27.1 28.6 32.9 EPS rep Rs 43.44 44.30 46.59 53.75 EPS rep growth % 17.8 2.0 5.2 15.4 EPS adj Rs 41.99 44.30 46.59 53.75
EPS adj growth % 17.6 5.5 5.2 15.4 PER rep x 16.3 15.9 15.2 13.1 PER adj x 16.8 15.9 15.2 13.1 Total DPS Rs 11.50 12.00 13.00 13.00 Total div yield % 1.6 1.7 1.8 1.8 ROA % 16.8 15.2 14.4 17.2 ROE % 28.4 24.2 21.8 21.7
EV/EBITDA x 13.1 12.0 11.3 9.8 Net debt/equity % 17.4 14.1 12.2 10.0 P/BV x 4.2 3.6 3.1 2.6
MM IN rel BSE Sensex performance, & rec history
Note: Recommendation timeline - if not a continuous line, then there was no Macquarie coverage at the time or there was an embargo period.
Source: FactSet, Macquarie Research, April 2012
(all figures in INR unless noted)
Analyst(s) Amit Mishra, CFA +91 22 6720 4084 [email protected] Priya Ranjan +91 22 6720 4082 [email protected]
20 April 2012 Macquarie Capital Securities India (Pvt) Ltd
Mahindra & Mahindra Two worlds in one stock Event We have raised our volume assumptions for M&M’s automotive business by
2-4% for FY13E and FY14E due to better-than-expected performance in the
UV and LCV business. We have lowered tractor sales volume assumptions by
7-9% for FY13-14E, as we expect sales to be impacted by a decline in
farmers’ profitability. We maintain Outperform with a lower TP of Rs760
(Rs780 earlier).
Impact Maintain growth momentum in the automotive business. We expect
M&M’s automotive segment to grow at a CAGR of 15% between FY13E-15E.
We like M&M for its leading position in two of the fastest growing segments in
the Indian auto space – UV and LCV. We expect LCV and UV sales to grow
at a CAGR of 16.5% and 14%, respectively, over the next three years.
Several new product launches planned in the next three years.
Automotive growth will be driven by new products to be launched in both the
LCV and UV segments. UV segment growth should be led by XUV 500 and a
compact MPV that is likely to be launched in 2HFY13E. M&M has plans to
launch a small passenger van on the Maxximo platform, a compact car and
Rexton from the Ssangyong portfolio in FY13E.
Cyclical slowdown in tractor sales. We expect deceleration in M&M’s
tractor volume growth (~3% in FY13E) due to a drop in farmers’ earnings
(down 10-25% YoY in FY12). Farmers’ earnings have been impacted by the
decline in prices of a few agriculture commodities and the rise in cost of
production. The slowdown in construction activities has impacted the non-
farm usage of tractors. The tractor business posted volume growth of 24%
CAGR between FY08-FY12, which was significantly ahead of the long-term
average of 10%.
Margins to reflect changing product mix. We expect M&M’s margin to
decline 62bp to 10.2% in FY13E on account of the low share of tractors in
overall volume and high share of low margin LCV business. However, robust
12% estimated growth in the UV segment in FY13E and expected stability in
raw material prices should provide a cushion to margins amidst the product
mix change.
Earnings and target price revision We are lowering our FY13E EPS by 8% on account of lower tractor volume
assumptions and margins. We lower our target price to Rs760 from Rs780.
Price catalyst 12-month price target: Rs760.00 based on a Sum of Parts methodology.
Catalyst: Revival in tractor sales and success of new models in auto business.
Action and recommendation Maintain Outperform. M&M is facing near-term challenges like weak tractor
demand growth. However, we remain positive on the medium-term prospects
of the tractor business. We further believe that near-term growth would be led
by new product launches in both the UV and LCV businesses.
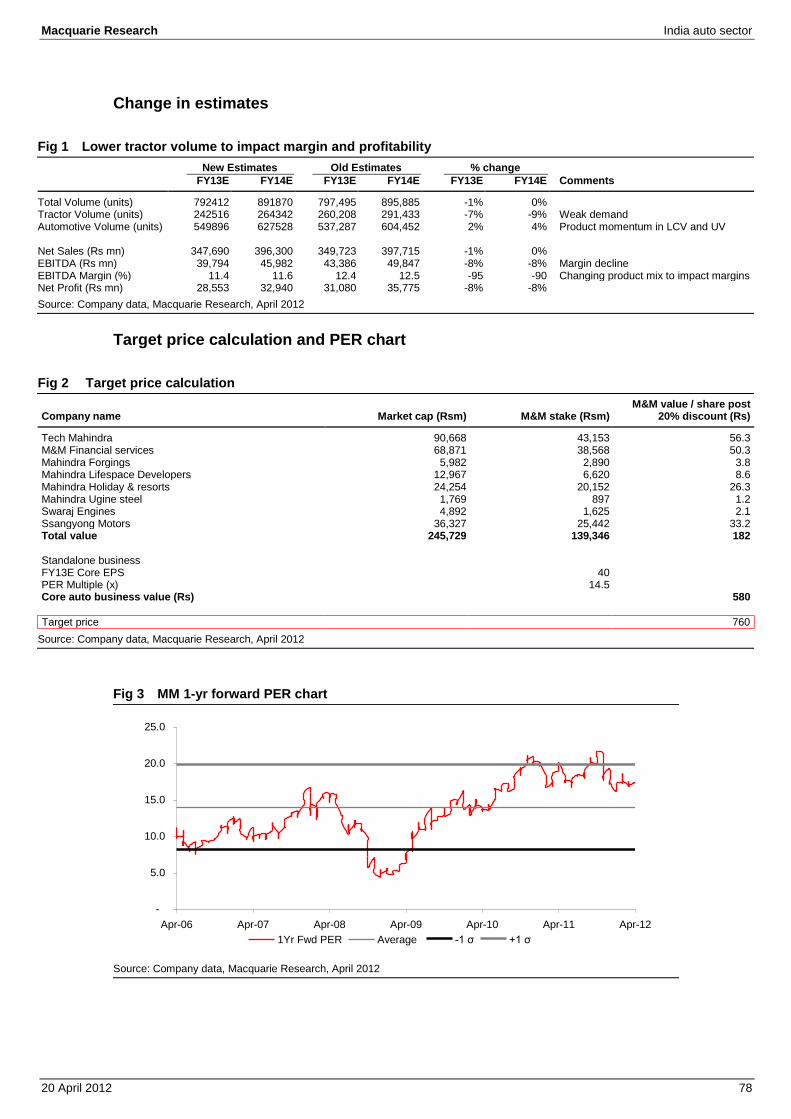
Macquarie Research India auto sector
20 April 2012 78
Change in estimates
Fig 1 Lower tractor volume to impact margin and profitability New Estimates Old Estimates % change FY13E FY14E FY13E FY14E FY13E FY14E Comments
Total Volume (units) 792412 891870 797,495 895,885 -1% 0% Tractor Volume (units) 242516 264342 260,208 291,433 -7% -9% Weak demand Automotive Volume (units) 549896 627528 537,287 604,452 2% 4% Product momentum in LCV and UV Net Sales (Rs mn) 347,690 396,300 349,723 397,715 -1% 0% EBITDA (Rs mn) 39,794 45,982 43,386 49,847 -8% -8% Margin decline EBITDA Margin (%) 11.4 11.6 12.4 12.5 -95 -90 Changing product mix to impact margins Net Profit (Rs mn) 28,553 32,940 31,080 35,775 -8% -8%
Source: Company data, Macquarie Research, April 2012
Target price calculation and PER chart
Fig 2 Target price calculation
Company name Market cap (Rsm) M&M stake (Rsm) M&M value / share post
20% discount (Rs)
Tech Mahindra 90,668 43,153 56.3 M&M Financial services 68,871 38,568 50.3 Mahindra Forgings 5,982 2,890 3.8 Mahindra Lifespace Developers 12,967 6,620 8.6 Mahindra Holiday & resorts 24,254 20,152 26.3 Mahindra Ugine steel 1,769 897 1.2 Swaraj Engines 4,892 1,625 2.1 Ssangyong Motors 36,327 25,442 33.2 Total value 245,729 139,346 182 Standalone business FY13E Core EPS 40 PER Multiple (x) 14.5 Core auto business value (Rs) 580
Target price 760
Source: Company data, Macquarie Research, April 2012
Fig 3 MM 1-yr forward PER chart
Source: Company data, Macquarie Research, April 2012
-
5.0
10.0
15.0
20.0
25.0
Apr-06 Apr-07 Apr-08 Apr-09 Apr-10 Apr-11 Apr-12
1Yr Fwd PER Average -1 σ +1 σ
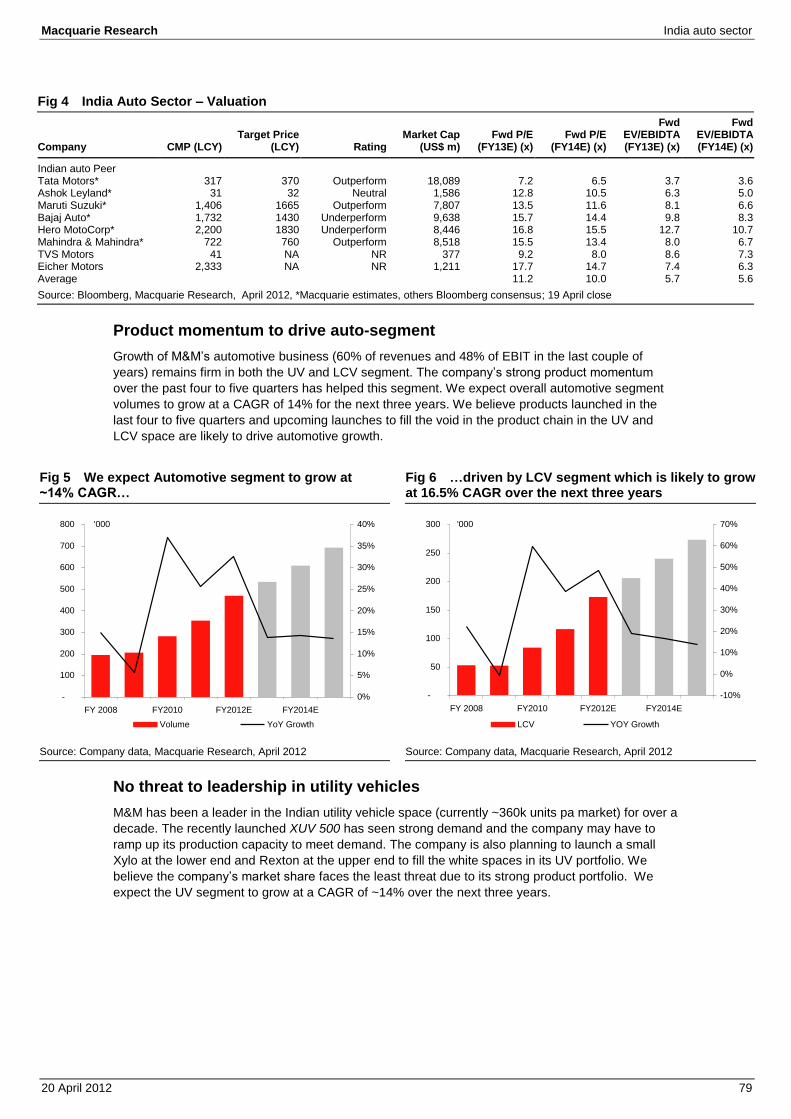
Macquarie Research India auto sector
20 April 2012 79
Fig 4 India Auto Sector – Valuation
Company CMP (LCY) Target Price
(LCY) Rating Market Cap
(US$ m) Fwd P/E
(FY13E) (x) Fwd P/E
(FY14E) (x)
Fwd EV/EBIDTA (FY13E) (x)
Fwd EV/EBIDTA (FY14E) (x)
Indian auto Peer Tata Motors* 317 370 Outperform 18,089 7.2 6.5 3.7 3.6 Ashok Leyland* 31 32 Neutral 1,586 12.8 10.5 6.3 5.0 Maruti Suzuki* 1,406 1665 Outperform 7,807 13.5 11.6 8.1 6.6 Bajaj Auto* 1,732 1430 Underperform 9,638 15.7 14.4 9.8 8.3 Hero MotoCorp* 2,200 1830 Underperform 8,446 16.8 15.5 12.7 10.7 Mahindra & Mahindra* 722 760 Outperform 8,518 15.5 13.4 8.0 6.7 TVS Motors 41 NA NR 377 9.2 8.0 8.6 7.3 Eicher Motors 2,333 NA NR 1,211 17.7 14.7 7.4 6.3 Average 11.2 10.0 5.7 5.6
Source: Bloomberg, Macquarie Research, April 2012, *Macquarie estimates, others Bloomberg consensus; 19 April close
Product momentum to drive auto-segment Growth of M&M’s automotive business (60% of revenues and 48% of EBIT in the last couple of
years) remains firm in both the UV and LCV segment. The company’s strong product momentum
over the past four to five quarters has helped this segment. We expect overall automotive segment
volumes to grow at a CAGR of 14% for the next three years. We believe products launched in the
last four to five quarters and upcoming launches to fill the void in the product chain in the UV and
LCV space are likely to drive automotive growth.
Fig 5 We expect Automotive segment to grow at ~14% CAGR…
Fig 6 …driven by LCV segment which is likely to grow at 16.5% CAGR over the next three years
Source: Company data, Macquarie Research, April 2012 Source: Company data, Macquarie Research, April 2012
No threat to leadership in utility vehicles M&M has been a leader in the Indian utility vehicle space (currently ~360k units pa market) for over a
decade. The recently launched XUV 500 has seen strong demand and the company may have to
ramp up its production capacity to meet demand. The company is also planning to launch a small
Xylo at the lower end and Rexton at the upper end to fill the white spaces in its UV portfolio. We
believe the company’s market share faces the least threat due to its strong product portfolio. We
expect the UV segment to grow at a CAGR of ~14% over the next three years.
-
100
200
300
400
500
600
700
800
FY 2008 FY2010 FY2012E FY2014E
'000
0%
5%
10%
15%
20%
25%
30%
35%
40%
Volume YoY Growth
-
50
100
150
200
250
300
FY 2008 FY2010 FY2012E FY2014E
'000
-10%
0%
10%
20%
30%
40%
50%
60%
70%
LCV YOY Growth
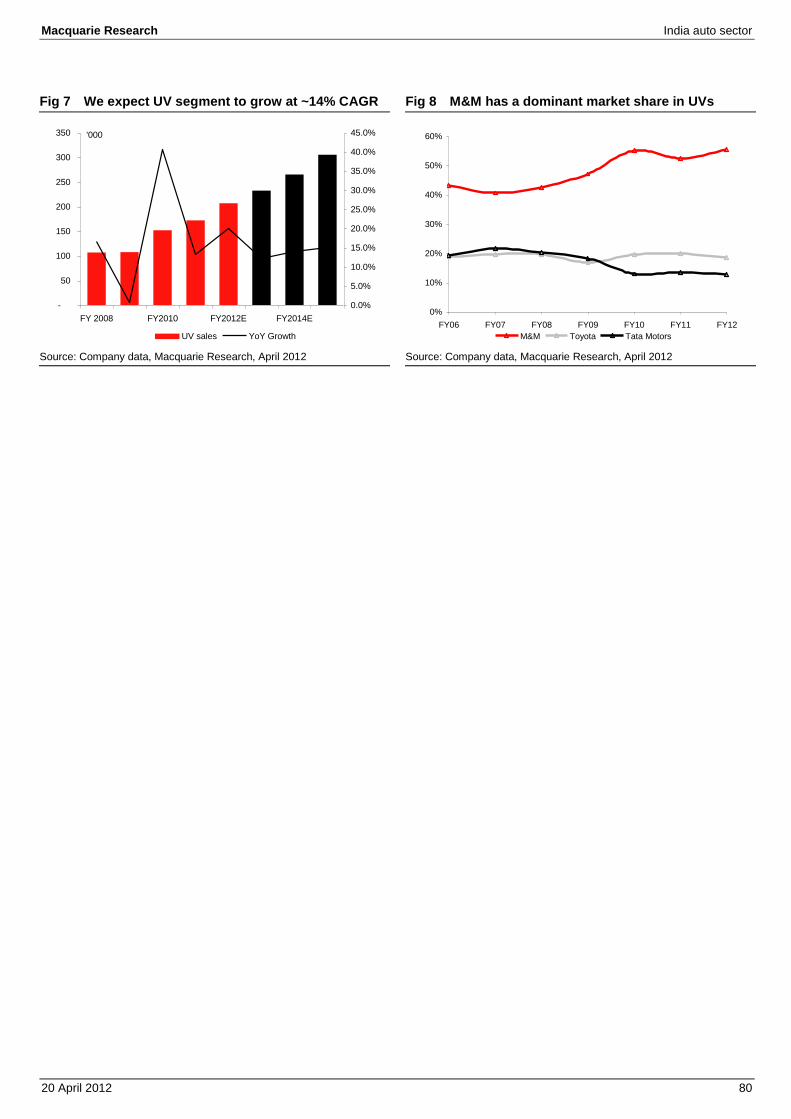
Macquarie Research India auto sector
20 April 2012 80
Fig 7 We expect UV segment to grow at ~14% CAGR Fig 8 M&M has a dominant market share in UVs
Source: Company data, Macquarie Research, April 2012 Source: Company data, Macquarie Research, April 2012
-
50
100
150
200
250
300
350
FY 2008 FY2010 FY2012E FY2014E
'000
0.0%
5.0%
10.0%
15.0%
20.0%
25.0%
30.0%
35.0%
40.0%
45.0%
UV sales YoY Growth
0%
10%
20%
30%
40%
50%
60%
FY06 FY07 FY08 FY09 FY10 FY11 FY12
M&M Toyota Tata Motors
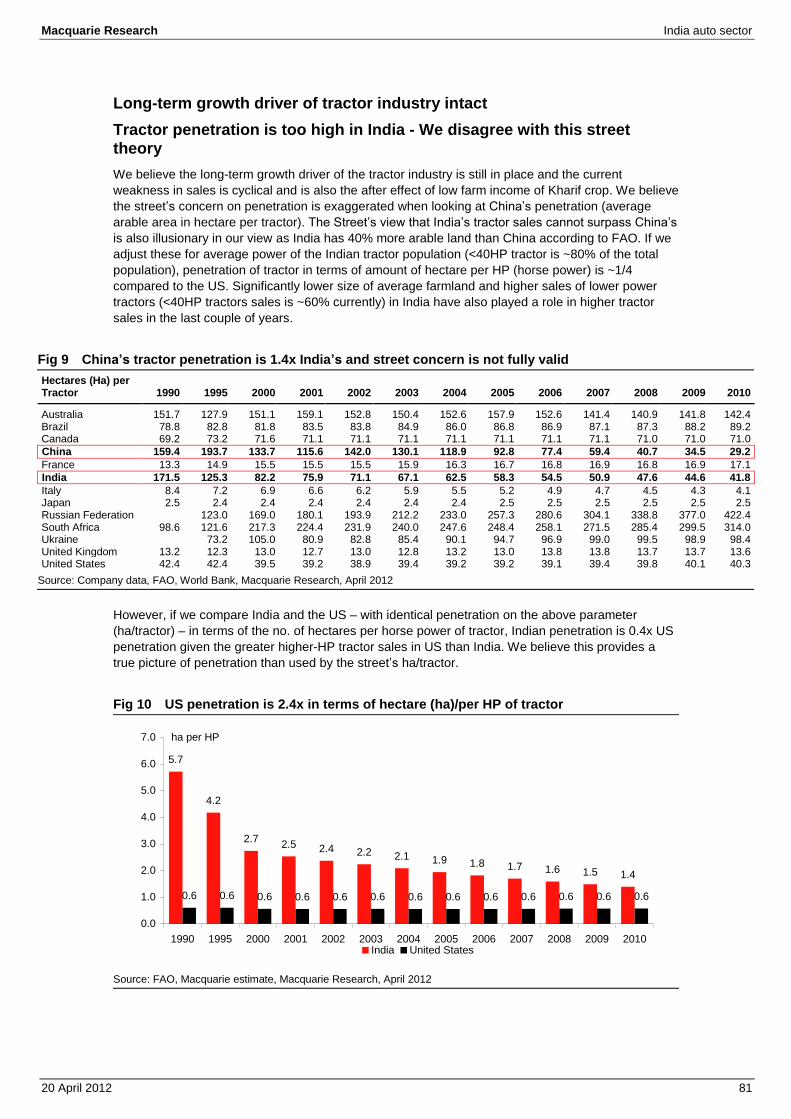
Macquarie Research India auto sector
20 April 2012 81
Long-term growth driver of tractor industry intact Tractor penetration is too high in India - We disagree with this street theory We believe the long-term growth driver of the tractor industry is still in place and the current
weakness in sales is cyclical and is also the after effect of low farm income of Kharif crop. We believe
the street’s concern on penetration is exaggerated when looking at China’s penetration (average
arable area in hectare per tractor). The Street’s view that India’s tractor sales cannot surpass China’s
is also illusionary in our view as India has 40% more arable land than China according to FAO. If we
adjust these for average power of the Indian tractor population (<40HP tractor is ~80% of the total
population), penetration of tractor in terms of amount of hectare per HP (horse power) is ~1/4
compared to the US. Significantly lower size of average farmland and higher sales of lower power
tractors (<40HP tractors sales is ~60% currently) in India have also played a role in higher tractor
sales in the last couple of years.
Fig 9 China’s tractor penetration is 1.4x India’s and street concern is not fully valid Hectares (Ha) per Tractor 1990 1995 2000 2001 2002 2003 2004 2005 2006 2007 2008 2009 2010
Australia 151.7 127.9 151.1 159.1 152.8 150.4 152.6 157.9 152.6 141.4 140.9 141.8 142.4 Brazil 78.8 82.8 81.8 83.5 83.8 84.9 86.0 86.8 86.9 87.1 87.3 88.2 89.2 Canada 69.2 73.2 71.6 71.1 71.1 71.1 71.1 71.1 71.1 71.1 71.0 71.0 71.0
China 159.4 193.7 133.7 115.6 142.0 130.1 118.9 92.8 77.4 59.4 40.7 34.5 29.2 France 13.3 14.9 15.5 15.5 15.5 15.9 16.3 16.7 16.8 16.9 16.8 16.9 17.1
India 171.5 125.3 82.2 75.9 71.1 67.1 62.5 58.3 54.5 50.9 47.6 44.6 41.8 Italy 8.4 7.2 6.9 6.6 6.2 5.9 5.5 5.2 4.9 4.7 4.5 4.3 4.1 Japan 2.5 2.4 2.4 2.4 2.4 2.4 2.4 2.5 2.5 2.5 2.5 2.5 2.5 Russian Federation 123.0 169.0 180.1 193.9 212.2 233.0 257.3 280.6 304.1 338.8 377.0 422.4 South Africa 98.6 121.6 217.3 224.4 231.9 240.0 247.6 248.4 258.1 271.5 285.4 299.5 314.0 Ukraine 73.2 105.0 80.9 82.8 85.4 90.1 94.7 96.9 99.0 99.5 98.9 98.4 United Kingdom 13.2 12.3 13.0 12.7 13.0 12.8 13.2 13.0 13.8 13.8 13.7 13.7 13.6 United States 42.4 42.4 39.5 39.2 38.9 39.4 39.2 39.2 39.1 39.4 39.8 40.1 40.3
Source: Company data, FAO, World Bank, Macquarie Research, April 2012
However, if we compare India and the US – with identical penetration on the above parameter
(ha/tractor) – in terms of the no. of hectares per horse power of tractor, Indian penetration is 0.4x US
penetration given the greater higher-HP tractor sales in US than India. We believe this provides a
true picture of penetration than used by the street’s ha/tractor.
Fig 10 US penetration is 2.4x in terms of hectare (ha)/per HP of tractor
Source: FAO, Macquarie estimate, Macquarie Research, April 2012
5.7
4.2
2.72.5 2.4 2.2 2.1 1.9 1.8 1.7 1.6 1.5 1.4
0.6 0.6 0.6 0.6 0.6 0.6 0.6 0.6 0.6 0.6 0.6 0.6 0.6
0.0
1.0
2.0
3.0
4.0
5.0
6.0
7.0
1990 1995 2000 2001 2002 2003 2004 2005 2006 2007 2008 2009 2010
ha per HP
India United States
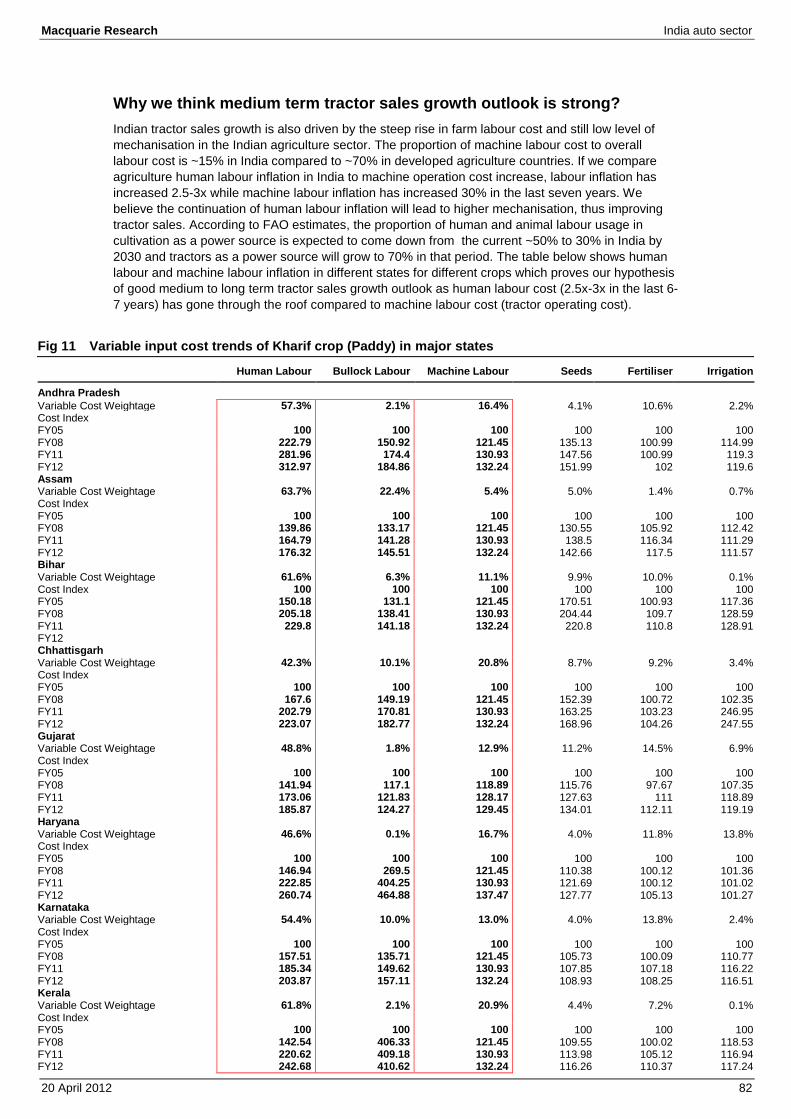
Macquarie Research India auto sector
20 April 2012 82
Why we think medium term tractor sales growth outlook is strong? Indian tractor sales growth is also driven by the steep rise in farm labour cost and still low level of
mechanisation in the Indian agriculture sector. The proportion of machine labour cost to overall
labour cost is ~15% in India compared to ~70% in developed agriculture countries. If we compare
agriculture human labour inflation in India to machine operation cost increase, labour inflation has
increased 2.5-3x while machine labour inflation has increased 30% in the last seven years. We
believe the continuation of human labour inflation will lead to higher mechanisation, thus improving
tractor sales. According to FAO estimates, the proportion of human and animal labour usage in
cultivation as a power source is expected to come down from the current ~50% to 30% in India by
2030 and tractors as a power source will grow to 70% in that period. The table below shows human
labour and machine labour inflation in different states for different crops which proves our hypothesis
of good medium to long term tractor sales growth outlook as human labour cost (2.5x-3x in the last 6-
7 years) has gone through the roof compared to machine labour cost (tractor operating cost).
Fig 11 Variable input cost trends of Kharif crop (Paddy) in major states Human Labour Bullock Labour Machine Labour Seeds Fertiliser Irrigation
Andhra Pradesh
Variable Cost Weightage 57.3% 2.1% 16.4% 4.1% 10.6% 2.2% Cost Index FY05 100 100 100 100 100 100 FY08 222.79 150.92 121.45 135.13 100.99 114.99 FY11 281.96 174.4 130.93 147.56 100.99 119.3 FY12 312.97 184.86 132.24 151.99 102 119.6 Assam Variable Cost Weightage 63.7% 22.4% 5.4% 5.0% 1.4% 0.7% Cost Index FY05 100 100 100 100 100 100 FY08 139.86 133.17 121.45 130.55 105.92 112.42 FY11 164.79 141.28 130.93 138.5 116.34 111.29 FY12 176.32 145.51 132.24 142.66 117.5 111.57 Bihar Variable Cost Weightage 61.6% 6.3% 11.1% 9.9% 10.0% 0.1% Cost Index 100 100 100 100 100 100 FY05 150.18 131.1 121.45 170.51 100.93 117.36 FY08 205.18 138.41 130.93 204.44 109.7 128.59 FY11 229.8 141.18 132.24 220.8 110.8 128.91 FY12 Chhattisgarh Variable Cost Weightage 42.3% 10.1% 20.8% 8.7% 9.2% 3.4% Cost Index FY05 100 100 100 100 100 100 FY08 167.6 149.19 121.45 152.39 100.72 102.35 FY11 202.79 170.81 130.93 163.25 103.23 246.95 FY12 223.07 182.77 132.24 168.96 104.26 247.55 Gujarat Variable Cost Weightage 48.8% 1.8% 12.9% 11.2% 14.5% 6.9% Cost Index FY05 100 100 100 100 100 100 FY08 141.94 117.1 118.89 115.76 97.67 107.35 FY11 173.06 121.83 128.17 127.63 111 118.89 FY12 185.87 124.27 129.45 134.01 112.11 119.19 Haryana Variable Cost Weightage 46.6% 0.1% 16.7% 4.0% 11.8% 13.8% Cost Index FY05 100 100 100 100 100 100 FY08 146.94 269.5 121.45 110.38 100.12 101.36 FY11 222.85 404.25 130.93 121.69 100.12 101.02 FY12 260.74 464.88 137.47 127.77 105.13 101.27 Karnataka Variable Cost Weightage 54.4% 10.0% 13.0% 4.0% 13.8% 2.4% Cost Index FY05 100 100 100 100 100 100 FY08 157.51 135.71 121.45 105.73 100.09 110.77 FY11 185.34 149.62 130.93 107.85 107.18 116.22 FY12 203.87 157.11 132.24 108.93 108.25 116.51 Kerala Variable Cost Weightage 61.8% 2.1% 20.9% 4.4% 7.2% 0.1% Cost Index FY05 100 100 100 100 100 100 FY08 142.54 406.33 121.45 109.55 100.02 118.53 FY11 220.62 409.18 130.93 113.98 105.12 116.94 FY12 242.68 410.62 132.24 116.26 110.37 117.24
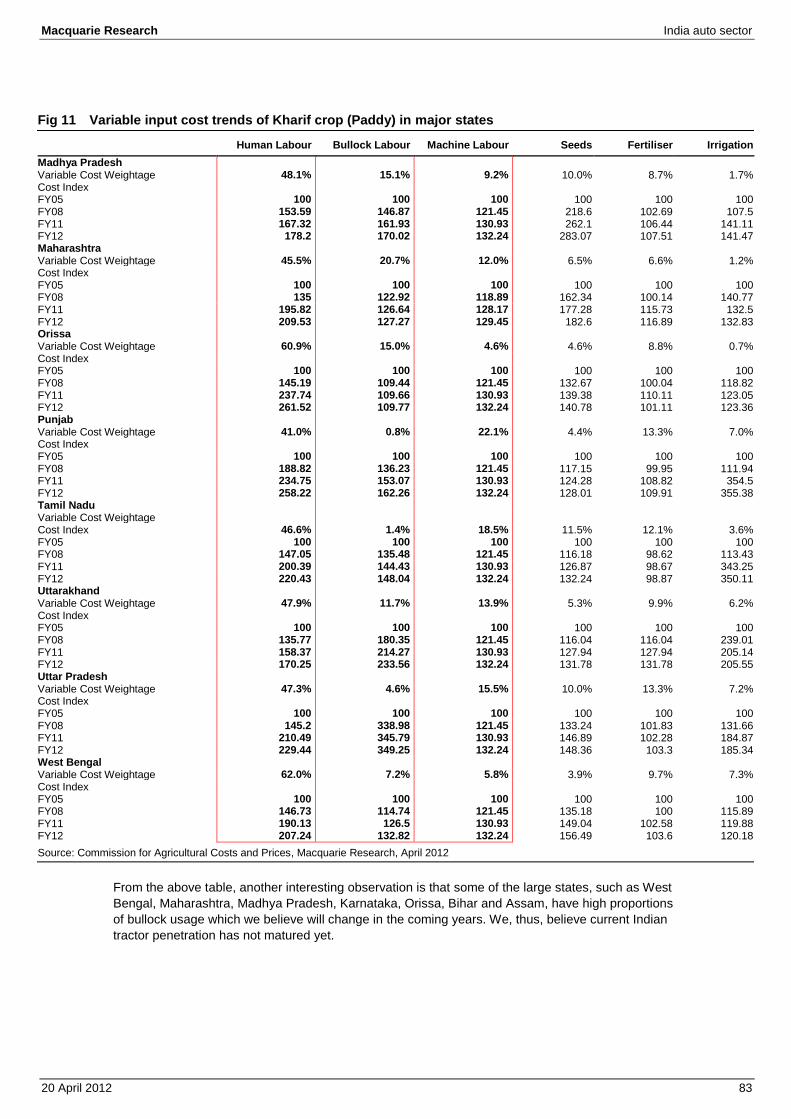
Macquarie Research India auto sector
20 April 2012 83
Fig 11 Variable input cost trends of Kharif crop (Paddy) in major states Human Labour Bullock Labour Machine Labour Seeds Fertiliser Irrigation Madhya Pradesh Variable Cost Weightage 48.1% 15.1% 9.2% 10.0% 8.7% 1.7% Cost Index FY05 100 100 100 100 100 100 FY08 153.59 146.87 121.45 218.6 102.69 107.5 FY11 167.32 161.93 130.93 262.1 106.44 141.11 FY12 178.2 170.02 132.24 283.07 107.51 141.47 Maharashtra Variable Cost Weightage 45.5% 20.7% 12.0% 6.5% 6.6% 1.2% Cost Index FY05 100 100 100 100 100 100 FY08 135 122.92 118.89 162.34 100.14 140.77 FY11 195.82 126.64 128.17 177.28 115.73 132.5 FY12 209.53 127.27 129.45 182.6 116.89 132.83 Orissa Variable Cost Weightage 60.9% 15.0% 4.6% 4.6% 8.8% 0.7% Cost Index FY05 100 100 100 100 100 100 FY08 145.19 109.44 121.45 132.67 100.04 118.82 FY11 237.74 109.66 130.93 139.38 110.11 123.05 FY12 261.52 109.77 132.24 140.78 101.11 123.36 Punjab Variable Cost Weightage 41.0% 0.8% 22.1% 4.4% 13.3% 7.0% Cost Index FY05 100 100 100 100 100 100 FY08 188.82 136.23 121.45 117.15 99.95 111.94 FY11 234.75 153.07 130.93 124.28 108.82 354.5 FY12 258.22 162.26 132.24 128.01 109.91 355.38 Tamil Nadu Variable Cost Weightage Cost Index 46.6% 1.4% 18.5% 11.5% 12.1% 3.6% FY05 100 100 100 100 100 100 FY08 147.05 135.48 121.45 116.18 98.62 113.43 FY11 200.39 144.43 130.93 126.87 98.67 343.25 FY12 220.43 148.04 132.24 132.24 98.87 350.11 Uttarakhand Variable Cost Weightage 47.9% 11.7% 13.9% 5.3% 9.9% 6.2% Cost Index FY05 100 100 100 100 100 100 FY08 135.77 180.35 121.45 116.04 116.04 239.01 FY11 158.37 214.27 130.93 127.94 127.94 205.14 FY12 170.25 233.56 132.24 131.78 131.78 205.55 Uttar Pradesh Variable Cost Weightage 47.3% 4.6% 15.5% 10.0% 13.3% 7.2% Cost Index FY05 100 100 100 100 100 100 FY08 145.2 338.98 121.45 133.24 101.83 131.66 FY11 210.49 345.79 130.93 146.89 102.28 184.87 FY12 229.44 349.25 132.24 148.36 103.3 185.34 West Bengal Variable Cost Weightage 62.0% 7.2% 5.8% 3.9% 9.7% 7.3% Cost Index FY05 100 100 100 100 100 100 FY08 146.73 114.74 121.45 135.18 100 115.89 FY11 190.13 126.5 130.93 149.04 102.58 119.88 FY12 207.24 132.82 132.24 156.49 103.6 120.18
Source: Commission for Agricultural Costs and Prices, Macquarie Research, April 2012
From the above table, another interesting observation is that some of the large states, such as West
Bengal, Maharashtra, Madhya Pradesh, Karnataka, Orissa, Bihar and Assam, have high proportions
of bullock usage which we believe will change in the coming years. We, thus, believe current Indian
tractor penetration has not matured yet.
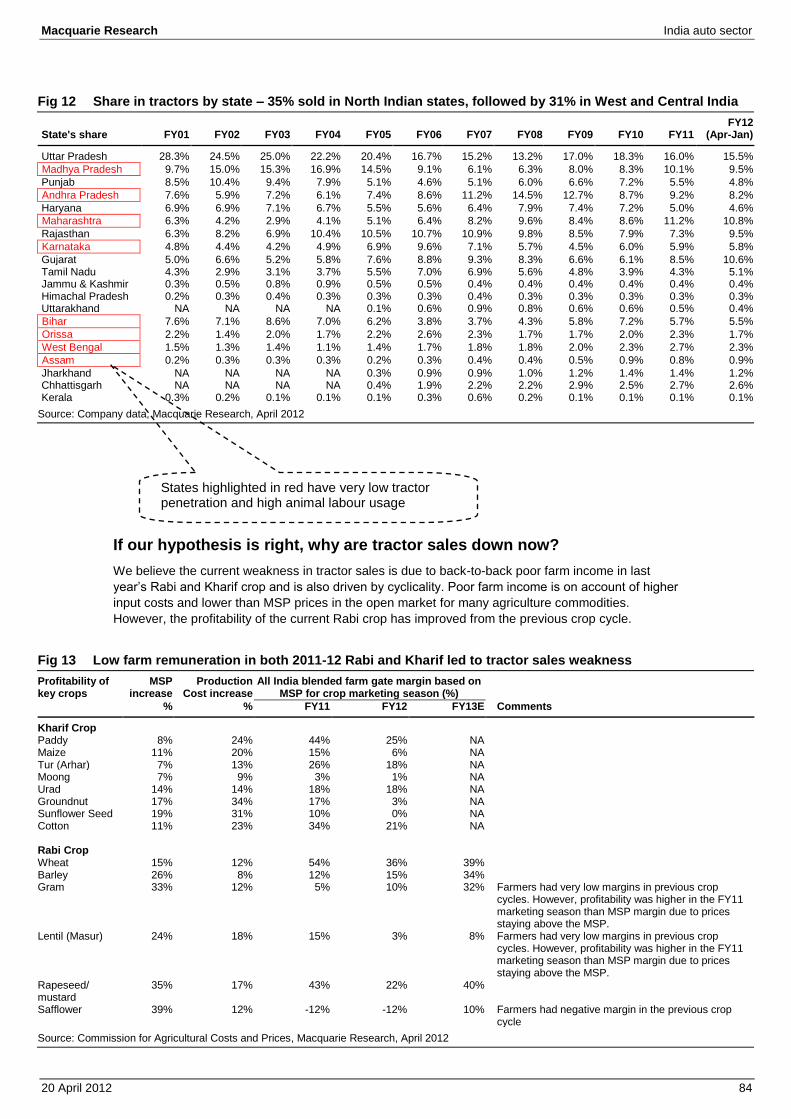
Macquarie Research India auto sector
20 April 2012 84
Fig 12 Share in tractors by state – 35% sold in North Indian states, followed by 31% in West and Central India
State's share FY01 FY02 FY03 FY04 FY05 FY06 FY07 FY08 FY09 FY10 FY11 FY12
(Apr-Jan)
Uttar Pradesh 28.3% 24.5% 25.0% 22.2% 20.4% 16.7% 15.2% 13.2% 17.0% 18.3% 16.0% 15.5%
Madhya Pradesh 9.7% 15.0% 15.3% 16.9% 14.5% 9.1% 6.1% 6.3% 8.0% 8.3% 10.1% 9.5%
Punjab 8.5% 10.4% 9.4% 7.9% 5.1% 4.6% 5.1% 6.0% 6.6% 7.2% 5.5% 4.8%
Andhra Pradesh 7.6% 5.9% 7.2% 6.1% 7.4% 8.6% 11.2% 14.5% 12.7% 8.7% 9.2% 8.2%
Haryana 6.9% 6.9% 7.1% 6.7% 5.5% 5.6% 6.4% 7.9% 7.4% 7.2% 5.0% 4.6%
Maharashtra 6.3% 4.2% 2.9% 4.1% 5.1% 6.4% 8.2% 9.6% 8.4% 8.6% 11.2% 10.8%
Rajasthan 6.3% 8.2% 6.9% 10.4% 10.5% 10.7% 10.9% 9.8% 8.5% 7.9% 7.3% 9.5%
Karnataka 4.8% 4.4% 4.2% 4.9% 6.9% 9.6% 7.1% 5.7% 4.5% 6.0% 5.9% 5.8%
Gujarat 5.0% 6.6% 5.2% 5.8% 7.6% 8.8% 9.3% 8.3% 6.6% 6.1% 8.5% 10.6% Tamil Nadu 4.3% 2.9% 3.1% 3.7% 5.5% 7.0% 6.9% 5.6% 4.8% 3.9% 4.3% 5.1% Jammu & Kashmir 0.3% 0.5% 0.8% 0.9% 0.5% 0.5% 0.4% 0.4% 0.4% 0.4% 0.4% 0.4% Himachal Pradesh 0.2% 0.3% 0.4% 0.3% 0.3% 0.3% 0.4% 0.3% 0.3% 0.3% 0.3% 0.3% Uttarakhand NA NA NA NA 0.1% 0.6% 0.9% 0.8% 0.6% 0.6% 0.5% 0.4%
Bihar 7.6% 7.1% 8.6% 7.0% 6.2% 3.8% 3.7% 4.3% 5.8% 7.2% 5.7% 5.5%
Orissa 2.2% 1.4% 2.0% 1.7% 2.2% 2.6% 2.3% 1.7% 1.7% 2.0% 2.3% 1.7%
West Bengal 1.5% 1.3% 1.4% 1.1% 1.4% 1.7% 1.8% 1.8% 2.0% 2.3% 2.7% 2.3%
Assam 0.2% 0.3% 0.3% 0.3% 0.2% 0.3% 0.4% 0.4% 0.5% 0.9% 0.8% 0.9%
Jharkhand NA NA NA NA 0.3% 0.9% 0.9% 1.0% 1.2% 1.4% 1.4% 1.2% Chhattisgarh NA NA NA NA 0.4% 1.9% 2.2% 2.2% 2.9% 2.5% 2.7% 2.6% Kerala 0.3% 0.2% 0.1% 0.1% 0.1% 0.3% 0.6% 0.2% 0.1% 0.1% 0.1% 0.1%
Source: Company data, Macquarie Research, April 2012
If our hypothesis is right, why are tractor sales down now? We believe the current weakness in tractor sales is due to back-to-back poor farm income in last
year’s Rabi and Kharif crop and is also driven by cyclicality. Poor farm income is on account of higher
input costs and lower than MSP prices in the open market for many agriculture commodities.
However, the profitability of the current Rabi crop has improved from the previous crop cycle.
Fig 13 Low farm remuneration in both 2011-12 Rabi and Kharif led to tractor sales weakness Profitability of key crops
MSP increase
Production Cost increase
All India blended farm gate margin based on MSP for crop marketing season (%)
% % FY11 FY12 FY13E Comments
Kharif Crop Paddy 8% 24% 44% 25% NA Maize 11% 20% 15% 6% NA Tur (Arhar) 7% 13% 26% 18% NA Moong 7% 9% 3% 1% NA Urad 14% 14% 18% 18% NA Groundnut 17% 34% 17% 3% NA Sunflower Seed 19% 31% 10% 0% NA Cotton 11% 23% 34% 21% NA Rabi Crop Wheat 15% 12% 54% 36% 39% Barley 26% 8% 12% 15% 34% Gram 33% 12% 5% 10% 32% Farmers had very low margins in previous crop
cycles. However, profitability was higher in the FY11 marketing season than MSP margin due to prices staying above the MSP.
Lentil (Masur) 24% 18% 15% 3% 8% Farmers had very low margins in previous crop cycles. However, profitability was higher in the FY11 marketing season than MSP margin due to prices staying above the MSP.
Rapeseed/ mustard
35% 17% 43% 22% 40%
Safflower 39% 12% -12% -12% 10% Farmers had negative margin in the previous crop cycle
Source: Commission for Agricultural Costs and Prices, Macquarie Research, April 2012
States highlighted in red have very low tractor penetration and high animal labour usage
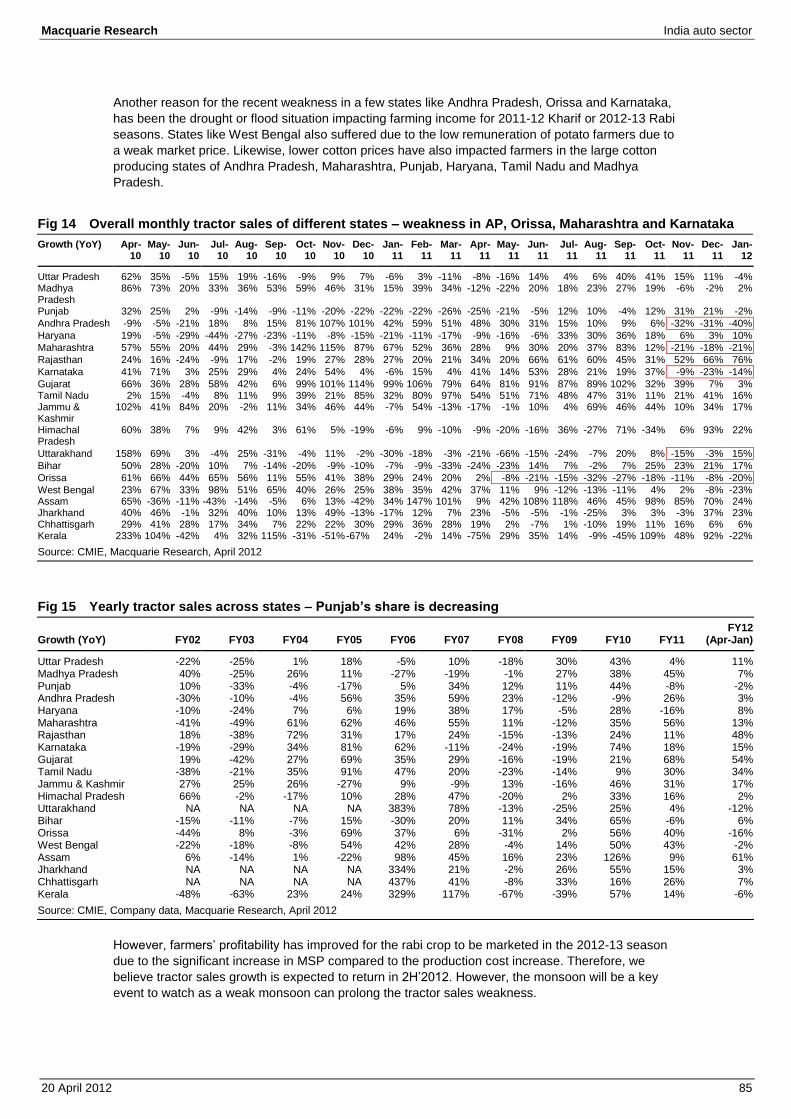
Macquarie Research India auto sector
20 April 2012 85
Another reason for the recent weakness in a few states like Andhra Pradesh, Orissa and Karnataka,
has been the drought or flood situation impacting farming income for 2011-12 Kharif or 2012-13 Rabi
seasons. States like West Bengal also suffered due to the low remuneration of potato farmers due to
a weak market price. Likewise, lower cotton prices have also impacted farmers in the large cotton
producing states of Andhra Pradesh, Maharashtra, Punjab, Haryana, Tamil Nadu and Madhya
Pradesh.
Fig 14 Overall monthly tractor sales of different states – weakness in AP, Orissa, Maharashtra and Karnataka Growth (YoY) Apr-
10 May-
10 Jun-
10 Jul-
10 Aug-
10 Sep-
10 Oct-
10 Nov-
10 Dec-
10 Jan-
11 Feb-
11 Mar-
11 Apr-
11 May-
11 Jun-
11 Jul-
11 Aug-
11 Sep-
11 Oct-
11 Nov-
11 Dec-
11 Jan-
12
Uttar Pradesh 62% 35% -5% 15% 19% -16% -9% 9% 7% -6% 3% -11% -8% -16% 14% 4% 6% 40% 41% 15% 11% -4% Madhya Pradesh
86% 73% 20% 33% 36% 53% 59% 46% 31% 15% 39% 34% -12% -22% 20% 18% 23% 27% 19% -6% -2% 2%
Punjab 32% 25% 2% -9% -14% -9% -11% -20% -22% -22% -22% -26% -25% -21% -5% 12% 10% -4% 12% 31% 21% -2%
Andhra Pradesh -9% -5% -21% 18% 8% 15% 81% 107% 101% 42% 59% 51% 48% 30% 31% 15% 10% 9% 6% -32% -31% -40%
Haryana 19% -5% -29% -44% -27% -23% -11% -8% -15% -21% -11% -17% -9% -16% -6% 33% 30% 36% 18% 6% 3% 10%
Maharashtra 57% 55% 20% 44% 29% -3% 142% 115% 87% 67% 52% 36% 28% 9% 30% 20% 37% 83% 12% -21% -18% -21%
Rajasthan 24% 16% -24% -9% 17% -2% 19% 27% 28% 27% 20% 21% 34% 20% 66% 61% 60% 45% 31% 52% 66% 76%
Karnataka 41% 71% 3% 25% 29% 4% 24% 54% 4% -6% 15% 4% 41% 14% 53% 28% 21% 19% 37% -9% -23% -14%
Gujarat 66% 36% 28% 58% 42% 6% 99% 101% 114% 99% 106% 79% 64% 81% 91% 87% 89% 102% 32% 39% 7% 3% Tamil Nadu 2% 15% -4% 8% 11% 9% 39% 21% 85% 32% 80% 97% 54% 51% 71% 48% 47% 31% 11% 21% 41% 16% Jammu & Kashmir
102% 41% 84% 20% -2% 11% 34% 46% 44% -7% 54% -13% -17% -1% 10% 4% 69% 46% 44% 10% 34% 17%
Himachal Pradesh
60% 38% 7% 9% 42% 3% 61% 5% -19% -6% 9% -10% -9% -20% -16% 36% -27% 71% -34% 6% 93% 22%
Uttarakhand 158% 69% 3% -4% 25% -31% -4% 11% -2% -30% -18% -3% -21% -66% -15% -24% -7% 20% 8% -15% -3% 15%
Bihar 50% 28% -20% 10% 7% -14% -20% -9% -10% -7% -9% -33% -24% -23% 14% 7% -2% 7% 25% 23% 21% 17%
Orissa 61% 66% 44% 65% 56% 11% 55% 41% 38% 29% 24% 20% 2% -8% -21% -15% -32% -27% -18% -11% -8% -20%
West Bengal 23% 67% 33% 98% 51% 65% 40% 26% 25% 38% 35% 42% 37% 11% 9% -12% -13% -11% 4% 2% -8% -23% Assam 65% -36% -11% -43% -14% -5% 6% 13% -42% 34% 147% 101% 9% 42% 108% 118% 46% 45% 98% 85% 70% 24% Jharkhand 40% 46% -1% 32% 40% 10% 13% 49% -13% -17% 12% 7% 23% -5% -5% -1% -25% 3% 3% -3% 37% 23% Chhattisgarh 29% 41% 28% 17% 34% 7% 22% 22% 30% 29% 36% 28% 19% 2% -7% 1% -10% 19% 11% 16% 6% 6% Kerala 233% 104% -42% 4% 32% 115% -31% -51% -67% 24% -2% 14% -75% 29% 35% 14% -9% -45% 109% 48% 92% -22%
Source: CMIE, Macquarie Research, April 2012
Fig 15 Yearly tractor sales across states – Punjab’s share is decreasing
Growth (YoY) FY02 FY03 FY04 FY05 FY06 FY07 FY08 FY09 FY10 FY11 FY12
(Apr-Jan)
Uttar Pradesh -22% -25% 1% 18% -5% 10% -18% 30% 43% 4% 11% Madhya Pradesh 40% -25% 26% 11% -27% -19% -1% 27% 38% 45% 7% Punjab 10% -33% -4% -17% 5% 34% 12% 11% 44% -8% -2% Andhra Pradesh -30% -10% -4% 56% 35% 59% 23% -12% -9% 26% 3% Haryana -10% -24% 7% 6% 19% 38% 17% -5% 28% -16% 8% Maharashtra -41% -49% 61% 62% 46% 55% 11% -12% 35% 56% 13% Rajasthan 18% -38% 72% 31% 17% 24% -15% -13% 24% 11% 48% Karnataka -19% -29% 34% 81% 62% -11% -24% -19% 74% 18% 15% Gujarat 19% -42% 27% 69% 35% 29% -16% -19% 21% 68% 54% Tamil Nadu -38% -21% 35% 91% 47% 20% -23% -14% 9% 30% 34% Jammu & Kashmir 27% 25% 26% -27% 9% -9% 13% -16% 46% 31% 17% Himachal Pradesh 66% -2% -17% 10% 28% 47% -20% 2% 33% 16% 2% Uttarakhand NA NA NA NA 383% 78% -13% -25% 25% 4% -12% Bihar -15% -11% -7% 15% -30% 20% 11% 34% 65% -6% 6% Orissa -44% 8% -3% 69% 37% 6% -31% 2% 56% 40% -16% West Bengal -22% -18% -8% 54% 42% 28% -4% 14% 50% 43% -2% Assam 6% -14% 1% -22% 98% 45% 16% 23% 126% 9% 61% Jharkhand NA NA NA NA 334% 21% -2% 26% 55% 15% 3% Chhattisgarh NA NA NA NA 437% 41% -8% 33% 16% 26% 7% Kerala -48% -63% 23% 24% 329% 117% -67% -39% 57% 14% -6%
Source: CMIE, Company data, Macquarie Research, April 2012
However, farmers’ profitability has improved for the rabi crop to be marketed in the 2012-13 season
due to the significant increase in MSP compared to the production cost increase. Therefore, we
believe tractor sales growth is expected to return in 2H’2012. However, the monsoon will be a key
event to watch as a weak monsoon can prolong the tractor sales weakness.
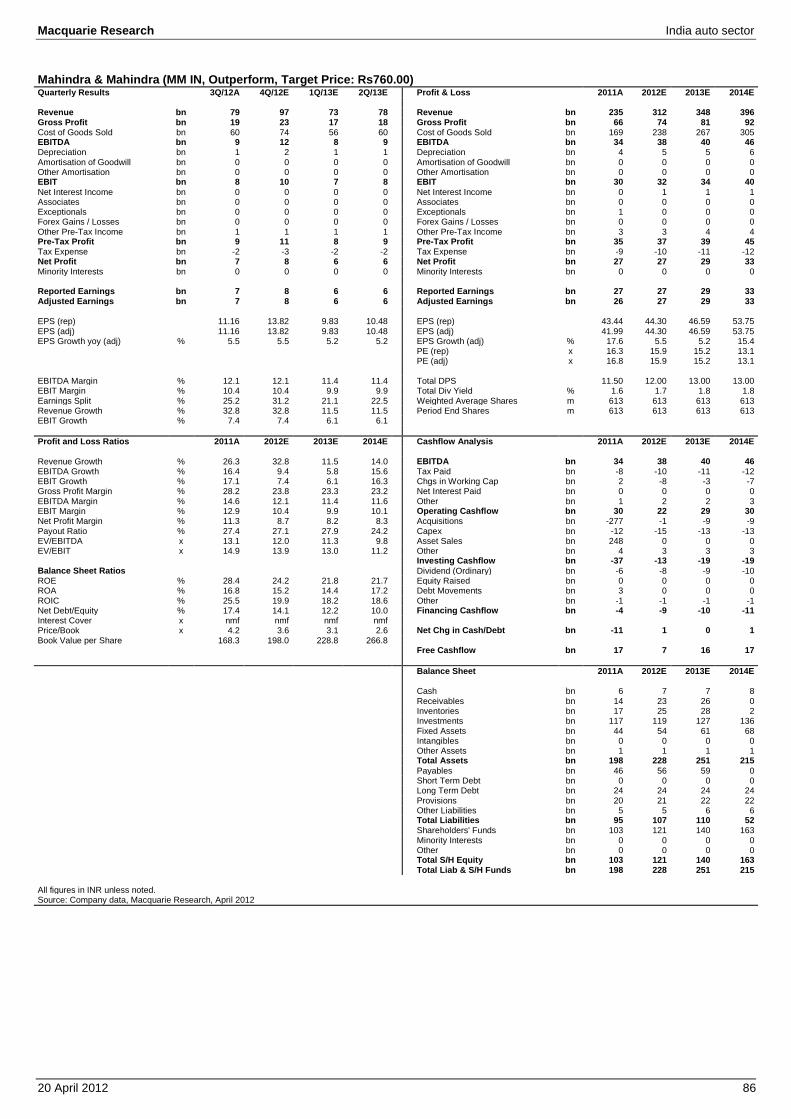
Macquarie Research India auto sector
20 April 2012 86
Mahindra & Mahindra (MM IN, Outperform, Target Price: Rs760.00) Quarterly Results 3Q/12A 4Q/12E 1Q/13E 2Q/13E Profit & Loss 2011A 2012E 2013E 2014E
Revenue bn 79 97 73 78 Revenue bn 235 312 348 396 Gross Profit bn 19 23 17 18 Gross Profit bn 66 74 81 92 Cost of Goods Sold bn 60 74 56 60 Cost of Goods Sold bn 169 238 267 305 EBITDA bn 9 12 8 9 EBITDA bn 34 38 40 46 Depreciation bn 1 2 1 1 Depreciation bn 4 5 5 6 Amortisation of Goodwill bn 0 0 0 0 Amortisation of Goodwill bn 0 0 0 0 Other Amortisation bn 0 0 0 0 Other Amortisation bn 0 0 0 0 EBIT bn 8 10 7 8 EBIT bn 30 32 34 40 Net Interest Income bn 0 0 0 0 Net Interest Income bn 0 1 1 1 Associates bn 0 0 0 0 Associates bn 0 0 0 0 Exceptionals bn 0 0 0 0 Exceptionals bn 1 0 0 0 Forex Gains / Losses bn 0 0 0 0 Forex Gains / Losses bn 0 0 0 0 Other Pre-Tax Income bn 1 1 1 1 Other Pre-Tax Income bn 3 3 4 4 Pre-Tax Profit bn 9 11 8 9 Pre-Tax Profit bn 35 37 39 45 Tax Expense bn -2 -3 -2 -2 Tax Expense bn -9 -10 -11 -12 Net Profit bn 7 8 6 6 Net Profit bn 27 27 29 33 Minority Interests bn 0 0 0 0 Minority Interests bn 0 0 0 0
Reported Earnings bn 7 8 6 6 Reported Earnings bn 27 27 29 33 Adjusted Earnings bn 7 8 6 6 Adjusted Earnings bn 26 27 29 33
EPS (rep) 11.16 13.82 9.83 10.48 EPS (rep) 43.44 44.30 46.59 53.75 EPS (adj) 11.16 13.82 9.83 10.48 EPS (adj) 41.99 44.30 46.59 53.75 EPS Growth yoy (adj) % 5.5 5.5 5.2 5.2 EPS Growth (adj) % 17.6 5.5 5.2 15.4
PE (rep) x 16.3 15.9 15.2 13.1 PE (adj) x 16.8 15.9 15.2 13.1
EBITDA Margin % 12.1 12.1 11.4 11.4 Total DPS 11.50 12.00 13.00 13.00 EBIT Margin % 10.4 10.4 9.9 9.9 Total Div Yield % 1.6 1.7 1.8 1.8 Earnings Split % 25.2 31.2 21.1 22.5 Weighted Average Shares m 613 613 613 613 Revenue Growth % 32.8 32.8 11.5 11.5 Period End Shares m 613 613 613 613 EBIT Growth % 7.4 7.4 6.1 6.1
Profit and Loss Ratios 2011A 2012E 2013E 2014E Cashflow Analysis 2011A 2012E 2013E 2014E
Revenue Growth % 26.3 32.8 11.5 14.0 EBITDA bn 34 38 40 46 EBITDA Growth % 16.4 9.4 5.8 15.6 Tax Paid bn -8 -10 -11 -12 EBIT Growth % 17.1 7.4 6.1 16.3 Chgs in Working Cap bn 2 -8 -3 -7 Gross Profit Margin % 28.2 23.8 23.3 23.2 Net Interest Paid bn 0 0 0 0 EBITDA Margin % 14.6 12.1 11.4 11.6 Other bn 1 2 2 3 EBIT Margin % 12.9 10.4 9.9 10.1 Operating Cashflow bn 30 22 29 30 Net Profit Margin % 11.3 8.7 8.2 8.3 Acquisitions bn -277 -1 -9 -9 Payout Ratio % 27.4 27.1 27.9 24.2 Capex bn -12 -15 -13 -13 EV/EBITDA x 13.1 12.0 11.3 9.8 Asset Sales bn 248 0 0 0 EV/EBIT x 14.9 13.9 13.0 11.2 Other bn 4 3 3 3
Investing Cashflow bn -37 -13 -19 -19 Balance Sheet Ratios Dividend (Ordinary) bn -6 -8 -9 -10 ROE % 28.4 24.2 21.8 21.7 Equity Raised bn 0 0 0 0 ROA % 16.8 15.2 14.4 17.2 Debt Movements bn 3 0 0 0 ROIC % 25.5 19.9 18.2 18.6 Other bn -1 -1 -1 -1 Net Debt/Equity % 17.4 14.1 12.2 10.0 Financing Cashflow bn -4 -9 -10 -11 Interest Cover x nmf nmf nmf nmf Price/Book x 4.2 3.6 3.1 2.6 Net Chg in Cash/Debt bn -11 1 0 1 Book Value per Share 168.3 198.0 228.8 266.8
Free Cashflow bn 17 7 16 17 Balance Sheet 2011A 2012E 2013E 2014E Cash bn 6 7 7 8 Receivables bn 14 23 26 0 Inventories bn 17 25 28 2 Investments bn 117 119 127 136 Fixed Assets bn 44 54 61 68 Intangibles bn 0 0 0 0 Other Assets bn 1 1 1 1 Total Assets bn 198 228 251 215 Payables bn 46 56 59 0 Short Term Debt bn 0 0 0 0 Long Term Debt bn 24 24 24 24 Provisions bn 20 21 22 22 Other Liabilities bn 5 5 6 6 Total Liabilities bn 95 107 110 52 Shareholders' Funds bn 103 121 140 163 Minority Interests bn 0 0 0 0 Other bn 0 0 0 0 Total S/H Equity bn 103 121 140 163 Total Liab & S/H Funds bn 198 228 251 215
All figures in INR unless noted. Source: Company data, Macquarie Research, April 2012
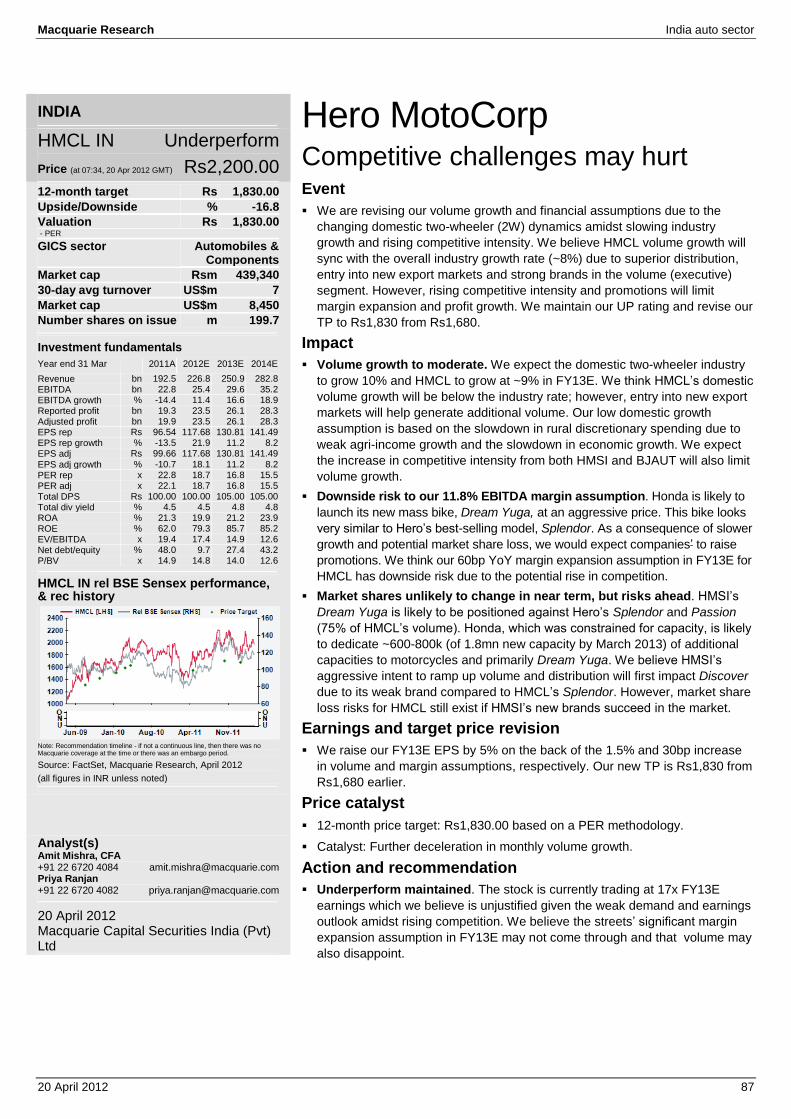
Macquarie Research India auto sector
20 April 2012 87
INDIA
HMCL IN Underperform
Price (at 07:34, 20 Apr 2012 GMT) Rs2,200.00
12-month target Rs 1,830.00 Upside/Downside % -16.8 Valuation Rs 1,830.00 - PER GICS sector Automobiles &
Components Market cap Rsm 439,340 30-day avg turnover US$m 7 Market cap US$m 8,450 Number shares on issue m 199.7
Investment fundamentals Year end 31 Mar 2011A 2012E 2013E 2014E
Revenue bn 192.5 226.8 250.9 282.8 EBITDA bn 22.8 25.4 29.6 35.2 EBITDA growth % -14.4 11.4 16.6 18.9 Reported profit bn 19.3 23.5 26.1 28.3 Adjusted profit bn 19.9 23.5 26.1 28.3 EPS rep Rs 96.54 117.68 130.81 141.49 EPS rep growth % -13.5 21.9 11.2 8.2 EPS adj Rs 99.66 117.68 130.81 141.49
EPS adj growth % -10.7 18.1 11.2 8.2 PER rep x 22.8 18.7 16.8 15.5 PER adj x 22.1 18.7 16.8 15.5 Total DPS Rs 100.00 100.00 105.00 105.00 Total div yield % 4.5 4.5 4.8 4.8 ROA % 21.3 19.9 21.2 23.9 ROE % 62.0 79.3 85.7 85.2
EV/EBITDA x 19.4 17.4 14.9 12.6 Net debt/equity % 48.0 9.7 27.4 43.2 P/BV x 14.9 14.8 14.0 12.6
HMCL IN rel BSE Sensex performance, & rec history
Note: Recommendation timeline - if not a continuous line, then there was no Macquarie coverage at the time or there was an embargo period.
Source: FactSet, Macquarie Research, April 2012
(all figures in INR unless noted)
Analyst(s) Amit Mishra, CFA +91 22 6720 4084 [email protected] Priya Ranjan +91 22 6720 4082 [email protected]
20 April 2012 Macquarie Capital Securities India (Pvt) Ltd
Hero MotoCorp Competitive challenges may hurt Event We are revising our volume growth and financial assumptions due to the
changing domestic two-wheeler (2W) dynamics amidst slowing industry
growth and rising competitive intensity. We believe HMCL volume growth will
sync with the overall industry growth rate (~8%) due to superior distribution,
entry into new export markets and strong brands in the volume (executive)
segment. However, rising competitive intensity and promotions will limit
margin expansion and profit growth. We maintain our UP rating and revise our
TP to Rs1,830 from Rs1,680.
Impact Volume growth to moderate. We expect the domestic two-wheeler industry
to grow 10% and HMCL to grow at ~9% in FY13E. We think HMCL’s domestic
volume growth will be below the industry rate; however, entry into new export
markets will help generate additional volume. Our low domestic growth
assumption is based on the slowdown in rural discretionary spending due to
weak agri-income growth and the slowdown in economic growth. We expect
the increase in competitive intensity from both HMSI and BJAUT will also limit
volume growth.
Downside risk to our 11.8% EBITDA margin assumption. Honda is likely to
launch its new mass bike, Dream Yuga, at an aggressive price. This bike looks
very similar to Hero’s best-selling model, Splendor. As a consequence of slower
growth and potential market share loss, we would expect companies’ to raise
promotions. We think our 60bp YoY margin expansion assumption in FY13E for
HMCL has downside risk due to the potential rise in competition.
Market shares unlikely to change in near term, but risks ahead. HMSI’s
Dream Yuga is likely to be positioned against Hero’s Splendor and Passion
(75% of HMCL’s volume). Honda, which was constrained for capacity, is likely
to dedicate ~600-800k (of 1.8mn new capacity by March 2013) of additional
capacities to motorcycles and primarily Dream Yuga. We believe HMSI’s
aggressive intent to ramp up volume and distribution will first impact Discover due to its weak brand compared to HMCL’s Splendor. However, market share
loss risks for HMCL still exist if HMSI’s new brands succeed in the market.
Earnings and target price revision We raise our FY13E EPS by 5% on the back of the 1.5% and 30bp increase
in volume and margin assumptions, respectively. Our new TP is Rs1,830 from
Rs1,680 earlier.
Price catalyst 12-month price target: Rs1,830.00 based on a PER methodology.
Catalyst: Further deceleration in monthly volume growth.
Action and recommendation Underperform maintained. The stock is currently trading at 17x FY13E
earnings which we believe is unjustified given the weak demand and earnings
outlook amidst rising competition. We believe the streets’ significant margin
expansion assumption in FY13E may not come through and that volume may
also disappoint.
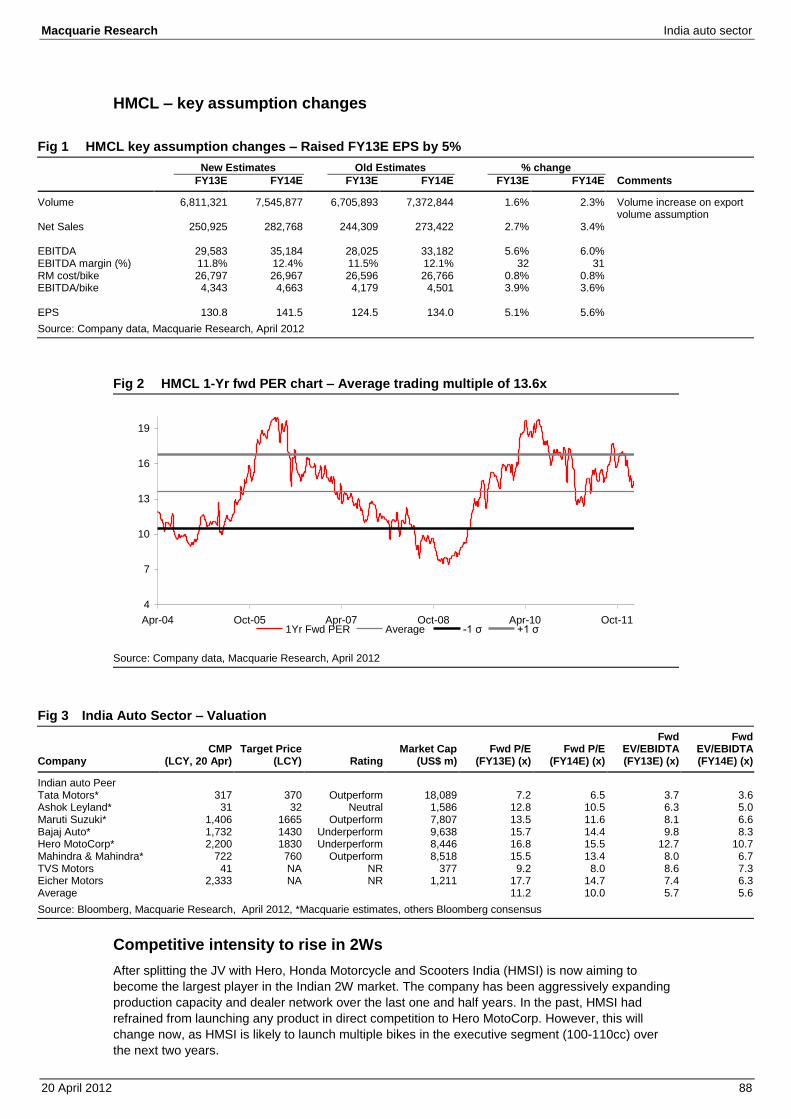
Macquarie Research India auto sector
20 April 2012 88
HMCL – key assumption changes
Fig 1 HMCL key assumption changes – Raised FY13E EPS by 5% New Estimates Old Estimates % change FY13E FY14E FY13E FY14E FY13E FY14E Comments
Volume 6,811,321 7,545,877 6,705,893 7,372,844 1.6% 2.3% Volume increase on export volume assumption
Net Sales 250,925 282,768 244,309 273,422 2.7% 3.4% EBITDA 29,583 35,184 28,025 33,182 5.6% 6.0% EBITDA margin (%) 11.8% 12.4% 11.5% 12.1% 32 31 RM cost/bike 26,797 26,967 26,596 26,766 0.8% 0.8% EBITDA/bike 4,343 4,663 4,179 4,501 3.9% 3.6% EPS 130.8 141.5 124.5 134.0 5.1% 5.6%
Source: Company data, Macquarie Research, April 2012
Fig 2 HMCL 1-Yr fwd PER chart – Average trading multiple of 13.6x
Source: Company data, Macquarie Research, April 2012
Fig 3 India Auto Sector – Valuation
Company CMP
(LCY, 20 Apr) Target Price
(LCY) Rating Market Cap
(US$ m) Fwd P/E
(FY13E) (x) Fwd P/E
(FY14E) (x)
Fwd EV/EBIDTA (FY13E) (x)
Fwd EV/EBIDTA (FY14E) (x)
Indian auto Peer Tata Motors* 317 370 Outperform 18,089 7.2 6.5 3.7 3.6 Ashok Leyland* 31 32 Neutral 1,586 12.8 10.5 6.3 5.0 Maruti Suzuki* 1,406 1665 Outperform 7,807 13.5 11.6 8.1 6.6 Bajaj Auto* 1,732 1430 Underperform 9,638 15.7 14.4 9.8 8.3 Hero MotoCorp* 2,200 1830 Underperform 8,446 16.8 15.5 12.7 10.7 Mahindra & Mahindra* 722 760 Outperform 8,518 15.5 13.4 8.0 6.7 TVS Motors 41 NA NR 377 9.2 8.0 8.6 7.3 Eicher Motors 2,333 NA NR 1,211 17.7 14.7 7.4 6.3 Average 11.2 10.0 5.7 5.6
Source: Bloomberg, Macquarie Research, April 2012, *Macquarie estimates, others Bloomberg consensus
Competitive intensity to rise in 2Ws After splitting the JV with Hero, Honda Motorcycle and Scooters India (HMSI) is now aiming to
become the largest player in the Indian 2W market. The company has been aggressively expanding
production capacity and dealer network over the last one and half years. In the past, HMSI had
refrained from launching any product in direct competition to Hero MotoCorp. However, this will
change now, as HMSI is likely to launch multiple bikes in the executive segment (100-110cc) over
the next two years.
4
7
10
13
16
19
Apr-04 Oct-05 Apr-07 Oct-08 Apr-10 Oct-111Yr Fwd PER Average -1 σ +1 σ
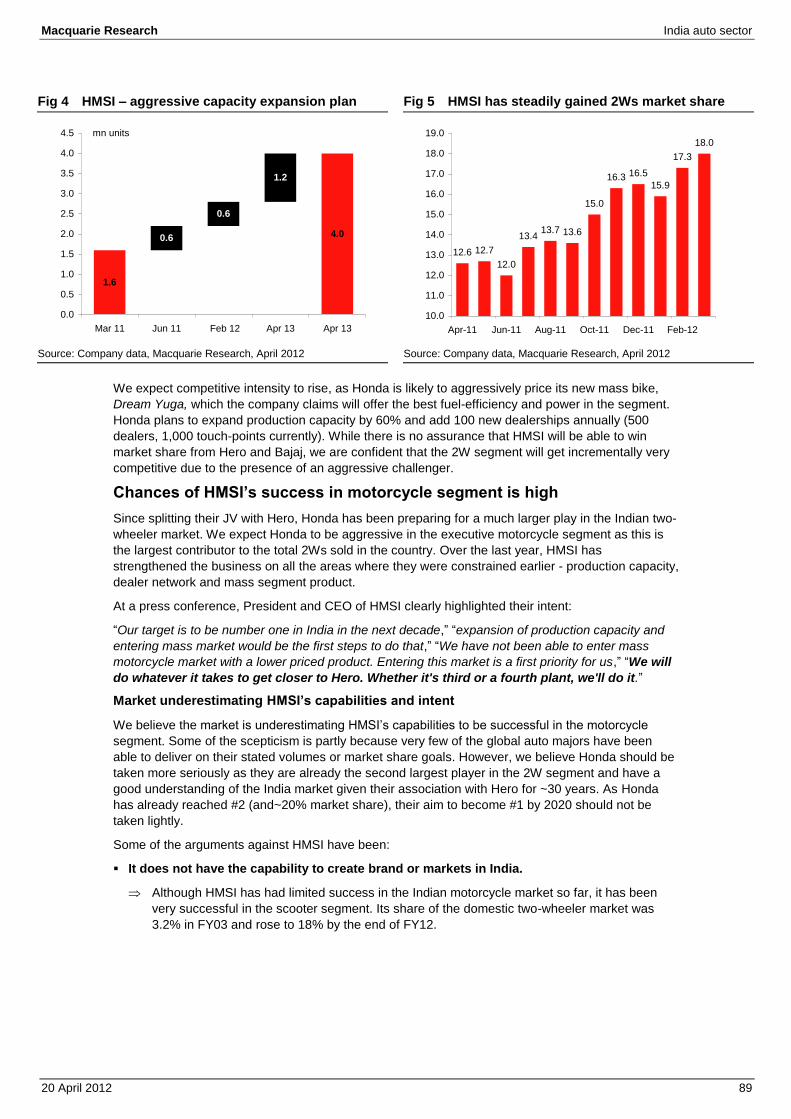
Macquarie Research India auto sector
20 April 2012 89
Fig 4 HMSI – aggressive capacity expansion plan Fig 5 HMSI has steadily gained 2Ws market share
Source: Company data, Macquarie Research, April 2012 Source: Company data, Macquarie Research, April 2012
We expect competitive intensity to rise, as Honda is likely to aggressively price its new mass bike,
Dream Yuga, which the company claims will offer the best fuel-efficiency and power in the segment.
Honda plans to expand production capacity by 60% and add 100 new dealerships annually (500
dealers, 1,000 touch-points currently). While there is no assurance that HMSI will be able to win
market share from Hero and Bajaj, we are confident that the 2W segment will get incrementally very
competitive due to the presence of an aggressive challenger.
Chances of HMSI’s success in motorcycle segment is high Since splitting their JV with Hero, Honda has been preparing for a much larger play in the Indian two-
wheeler market. We expect Honda to be aggressive in the executive motorcycle segment as this is
the largest contributor to the total 2Ws sold in the country. Over the last year, HMSI has
strengthened the business on all the areas where they were constrained earlier - production capacity,
dealer network and mass segment product.
At a press conference, President and CEO of HMSI clearly highlighted their intent:
“Our target is to be number one in India in the next decade,” “expansion of production capacity and entering mass market would be the first steps to do that,” “We have not been able to enter mass motorcycle market with a lower priced product. Entering this market is a first priority for us,” “We will do whatever it takes to get closer to Hero. Whether it's third or a fourth plant, we'll do it.”
Market underestimating HMSI’s capabilities and intent
We believe the market is underestimating HMSI’s capabilities to be successful in the motorcycle
segment. Some of the scepticism is partly because very few of the global auto majors have been
able to deliver on their stated volumes or market share goals. However, we believe Honda should be
taken more seriously as they are already the second largest player in the 2W segment and have a
good understanding of the India market given their association with Hero for ~30 years. As Honda
has already reached #2 (and~20% market share), their aim to become #1 by 2020 should not be
taken lightly.
Some of the arguments against HMSI have been:
It does not have the capability to create brand or markets in India.
Although HMSI has had limited success in the Indian motorcycle market so far, it has been
very successful in the scooter segment. Its share of the domestic two-wheeler market was
3.2% in FY03 and rose to 18% by the end of FY12.
1.6
4.00.6
0.6
1.2
0.0
0.5
1.0
1.5
2.0
2.5
3.0
3.5
4.0
4.5
Mar 11 Jun 11 Feb 12 Apr 13 Apr 13
mn units
12.6 12.7
12.0
13.413.7 13.6
15.0
16.3 16.5
15.9
17.3
18.0
10.0
11.0
12.0
13.0
14.0
15.0
16.0
17.0
18.0
19.0
Apr-11 Jun-11 Aug-11 Oct-11 Dec-11 Feb-12
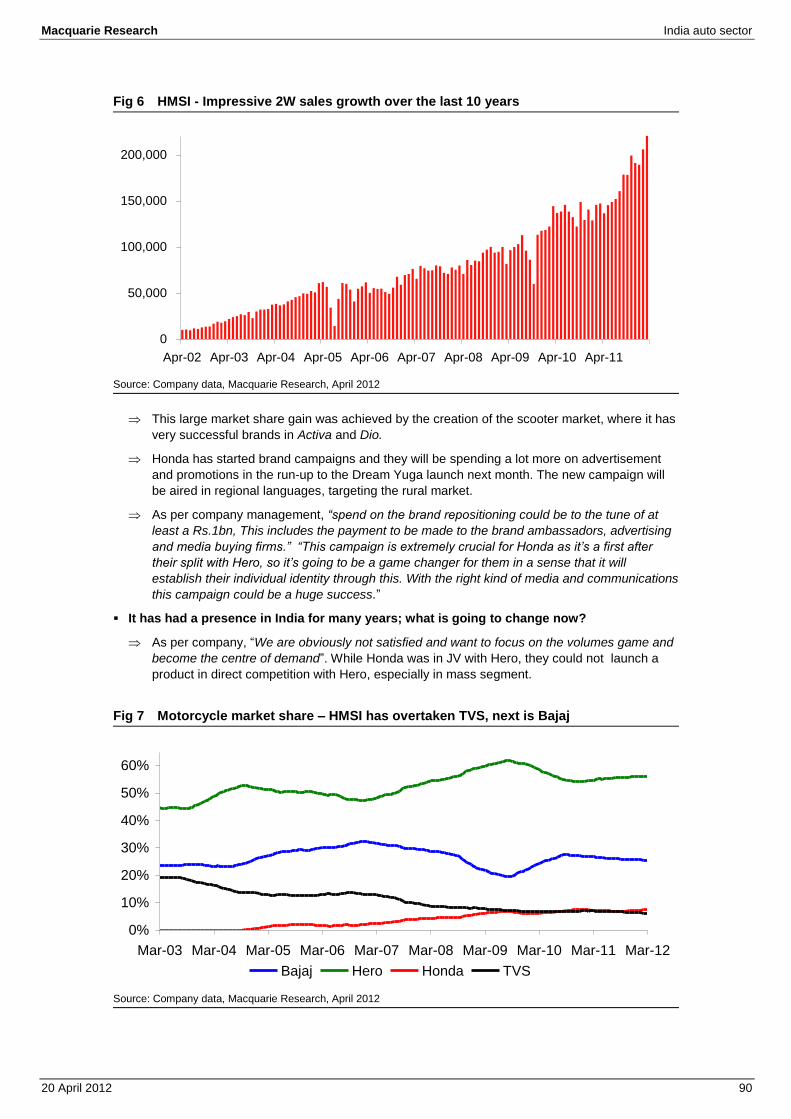
Macquarie Research India auto sector
20 April 2012 90
Fig 6 HMSI - Impressive 2W sales growth over the last 10 years
Source: Company data, Macquarie Research, April 2012
This large market share gain was achieved by the creation of the scooter market, where it has
very successful brands in Activa and Dio.
Honda has started brand campaigns and they will be spending a lot more on advertisement
and promotions in the run-up to the Dream Yuga launch next month. The new campaign will
be aired in regional languages, targeting the rural market.
As per company management, “spend on the brand repositioning could be to the tune of at least a Rs.1bn, This includes the payment to be made to the brand ambassadors, advertising and media buying firms.” “This campaign is extremely crucial for Honda as it’s a first after
their split with Hero, so it’s going to be a game changer for them in a sense that it will establish their individual identity through this. With the right kind of media and communications this campaign could be a huge success.”
It has had a presence in India for many years; what is going to change now?
As per company, “We are obviously not satisfied and want to focus on the volumes game and become the centre of demand”. While Honda was in JV with Hero, they could not launch a
product in direct competition with Hero, especially in mass segment.
Fig 7 Motorcycle market share – HMSI has overtaken TVS, next is Bajaj
Source: Company data, Macquarie Research, April 2012
0
50,000
100,000
150,000
200,000
Apr-02 Apr-03 Apr-04 Apr-05 Apr-06 Apr-07 Apr-08 Apr-09 Apr-10 Apr-11
0%
10%
20%
30%
40%
50%
60%
Mar-03 Mar-04 Mar-05 Mar-06 Mar-07 Mar-08 Mar-09 Mar-10 Mar-11 Mar-12
Bajaj Hero Honda TVS
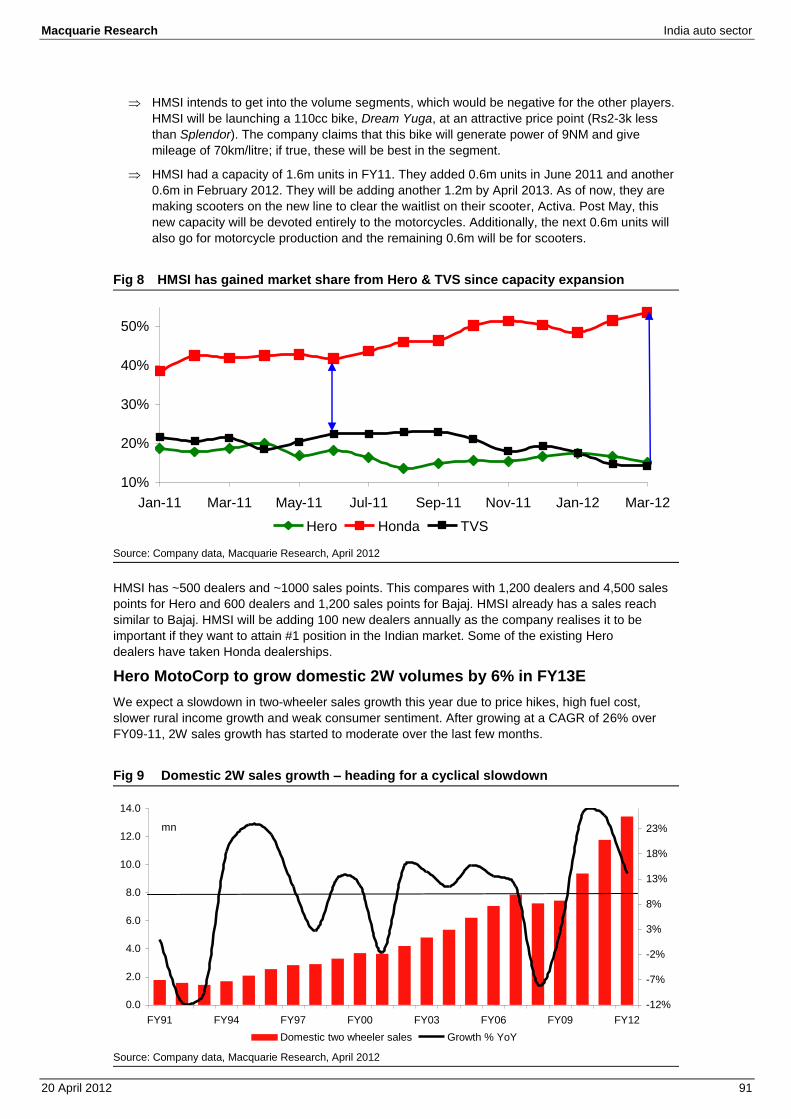
Macquarie Research India auto sector
20 April 2012 91
HMSI intends to get into the volume segments, which would be negative for the other players.
HMSI will be launching a 110cc bike, Dream Yuga, at an attractive price point (Rs2-3k less
than Splendor). The company claims that this bike will generate power of 9NM and give
mileage of 70km/litre; if true, these will be best in the segment.
HMSI had a capacity of 1.6m units in FY11. They added 0.6m units in June 2011 and another
0.6m in February 2012. They will be adding another 1.2m by April 2013. As of now, they are
making scooters on the new line to clear the waitlist on their scooter, Activa. Post May, this
new capacity will be devoted entirely to the motorcycles. Additionally, the next 0.6m units will
also go for motorcycle production and the remaining 0.6m will be for scooters.
Fig 8 HMSI has gained market share from Hero & TVS since capacity expansion
Source: Company data, Macquarie Research, April 2012
HMSI has ~500 dealers and ~1000 sales points. This compares with 1,200 dealers and 4,500 sales
points for Hero and 600 dealers and 1,200 sales points for Bajaj. HMSI already has a sales reach
similar to Bajaj. HMSI will be adding 100 new dealers annually as the company realises it to be
important if they want to attain #1 position in the Indian market. Some of the existing Hero
dealers have taken Honda dealerships.
Hero MotoCorp to grow domestic 2W volumes by 6% in FY13E We expect a slowdown in two-wheeler sales growth this year due to price hikes, high fuel cost,
slower rural income growth and weak consumer sentiment. After growing at a CAGR of 26% over
FY09-11, 2W sales growth has started to moderate over the last few months.
Fig 9 Domestic 2W sales growth – heading for a cyclical slowdown
Source: Company data, Macquarie Research, April 2012
10%
20%
30%
40%
50%
Jan-11 Mar-11 May-11 Jul-11 Sep-11 Nov-11 Jan-12 Mar-12
Hero Honda TVS
0.0
2.0
4.0
6.0
8.0
10.0
12.0
14.0
FY91 FY94 FY97 FY00 FY03 FY06 FY09 FY12
-12%
-7%
-2%
3%
8%
13%
18%
23%
Domestic two wheeler sales Growth % YoY
mn
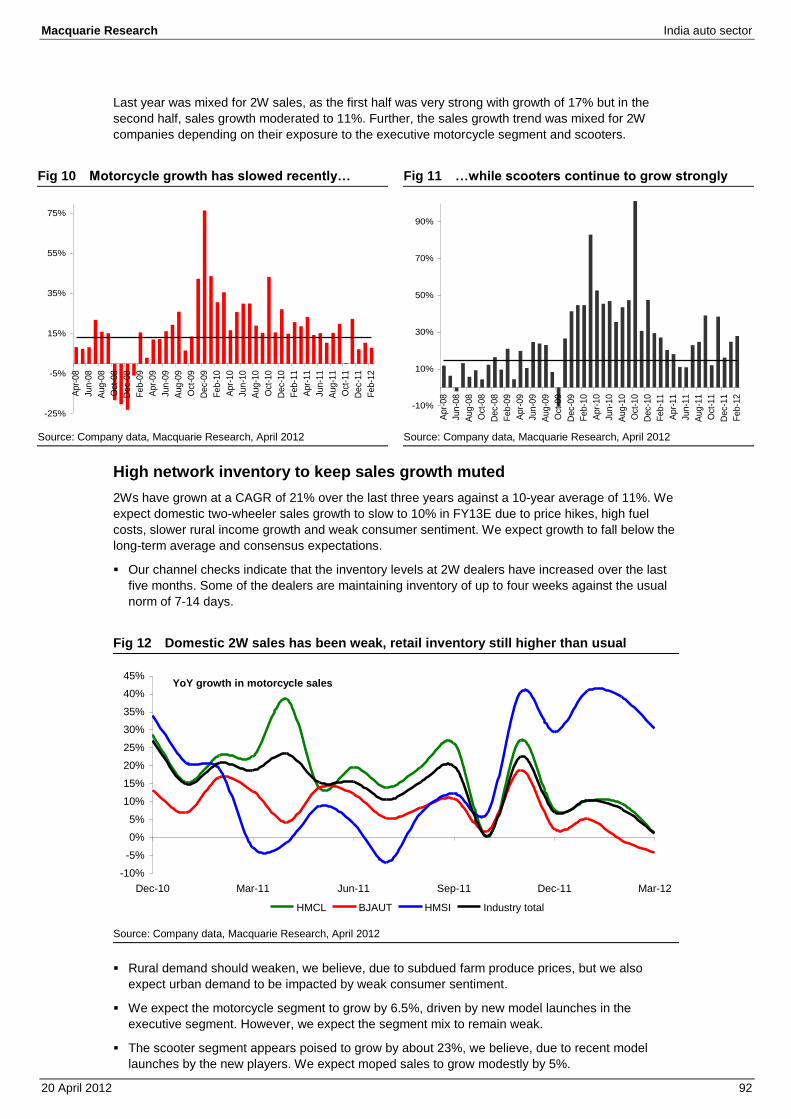
Macquarie Research India auto sector
20 April 2012 92
Last year was mixed for 2W sales, as the first half was very strong with growth of 17% but in the
second half, sales growth moderated to 11%. Further, the sales growth trend was mixed for 2W
companies depending on their exposure to the executive motorcycle segment and scooters.
Fig 10 Motorcycle growth has slowed recently… Fig 11 …while scooters continue to grow strongly
Source: Company data, Macquarie Research, April 2012 Source: Company data, Macquarie Research, April 2012
High network inventory to keep sales growth muted 2Ws have grown at a CAGR of 21% over the last three years against a 10-year average of 11%. We
expect domestic two-wheeler sales growth to slow to 10% in FY13E due to price hikes, high fuel
costs, slower rural income growth and weak consumer sentiment. We expect growth to fall below the
long-term average and consensus expectations.
Our channel checks indicate that the inventory levels at 2W dealers have increased over the last
five months. Some of the dealers are maintaining inventory of up to four weeks against the usual
norm of 7-14 days.
Fig 12 Domestic 2W sales has been weak, retail inventory still higher than usual
Source: Company data, Macquarie Research, April 2012
Rural demand should weaken, we believe, due to subdued farm produce prices, but we also
expect urban demand to be impacted by weak consumer sentiment.
We expect the motorcycle segment to grow by 6.5%, driven by new model launches in the
executive segment. However, we expect the segment mix to remain weak.
The scooter segment appears poised to grow by about 23%, we believe, due to recent model
launches by the new players. We expect moped sales to grow modestly by 5%.
-25%
-5%
15%
35%
55%
75%
Apr-
08
Jun-0
8
Aug-0
8
Oct
-08
Dec-
08
Feb-0
9
Apr-
09
Jun-0
9
Aug-0
9
Oct
-09
Dec-
09
Feb-1
0
Apr-
10
Jun-1
0
Aug-1
0
Oct
-10
Dec-
10
Feb-1
1
Apr-
11
Jun-1
1
Aug-1
1
Oct
-11
Dec-
11
Feb-1
2
-10%
10%
30%
50%
70%
90%
Apr-
08
Jun-0
8
Aug-0
8
Oct
-08
Dec-
08
Feb-0
9
Apr-
09
Jun-0
9
Aug-0
9
Oct
-09
Dec-
09
Feb-1
0
Apr-
10
Jun-1
0
Aug-1
0
Oct
-10
Dec-
10
Feb-1
1
Apr-
11
Jun-1
1
Aug-1
1
Oct
-11
Dec-
11
Feb-1
2
-10%
-5%
0%
5%
10%
15%
20%
25%
30%
35%
40%
45%
Dec-10 Mar-11 Jun-11 Sep-11 Dec-11 Mar-12
HMCL BJAUT HMSI Industry total
YoY growth in motorcycle sales
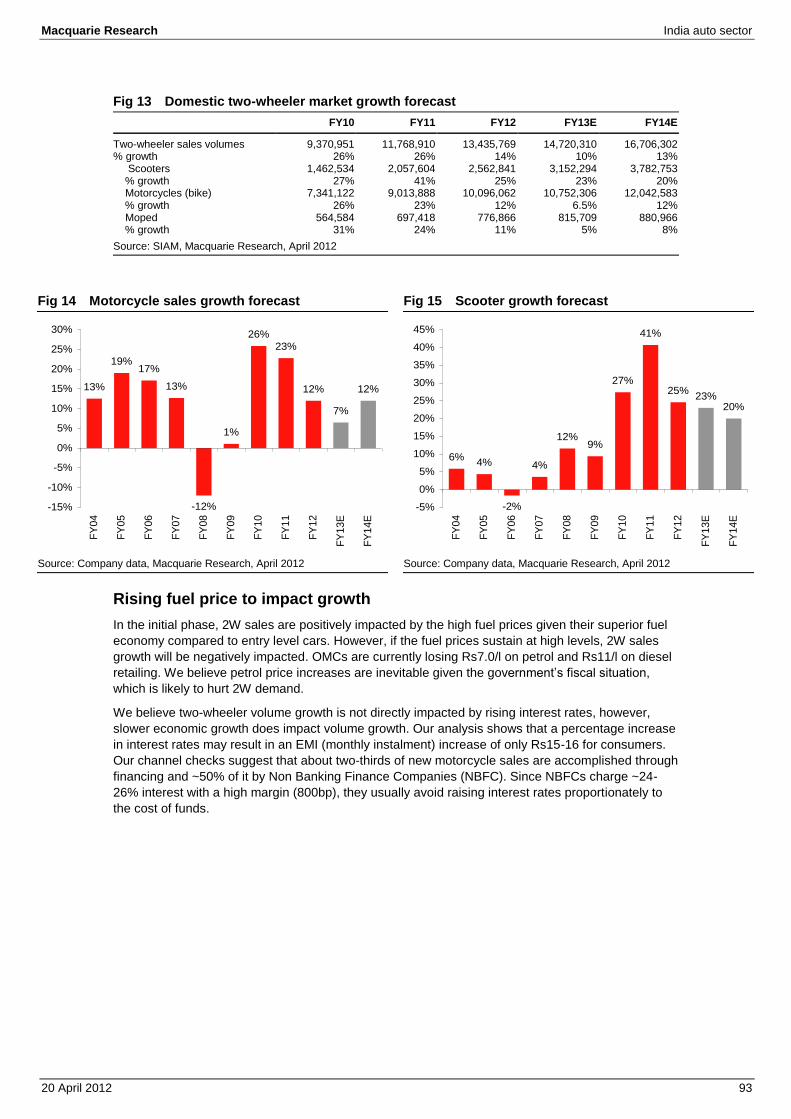
Macquarie Research India auto sector
20 April 2012 93
Fig 13 Domestic two-wheeler market growth forecast FY10 FY11 FY12 FY13E FY14E
Two-wheeler sales volumes 9,370,951 11,768,910 13,435,769 14,720,310 16,706,302 % growth 26% 26% 14% 10% 13% Scooters 1,462,534 2,057,604 2,562,841 3,152,294 3,782,753 % growth 27% 41% 25% 23% 20% Motorcycles (bike) 7,341,122 9,013,888 10,096,062 10,752,306 12,042,583 % growth 26% 23% 12% 6.5% 12% Moped 564,584 697,418 776,866 815,709 880,966 % growth 31% 24% 11% 5% 8%
Source: SIAM, Macquarie Research, April 2012
Fig 14 Motorcycle sales growth forecast Fig 15 Scooter growth forecast
Source: Company data, Macquarie Research, April 2012 Source: Company data, Macquarie Research, April 2012
Rising fuel price to impact growth In the initial phase, 2W sales are positively impacted by the high fuel prices given their superior fuel
economy compared to entry level cars. However, if the fuel prices sustain at high levels, 2W sales
growth will be negatively impacted. OMCs are currently losing Rs7.0/l on petrol and Rs11/l on diesel
retailing. We believe petrol price increases are inevitable given the government’s fiscal situation,
which is likely to hurt 2W demand.
We believe two-wheeler volume growth is not directly impacted by rising interest rates, however,
slower economic growth does impact volume growth. Our analysis shows that a percentage increase
in interest rates may result in an EMI (monthly instalment) increase of only Rs15-16 for consumers.
Our channel checks suggest that about two-thirds of new motorcycle sales are accomplished through
financing and ~50% of it by Non Banking Finance Companies (NBFC). Since NBFCs charge ~24-
26% interest with a high margin (800bp), they usually avoid raising interest rates proportionately to
the cost of funds.
13%
19%17%
13%
-12%
1%
26%
23%
12%
7%
12%
-15%
-10%
-5%
0%
5%
10%
15%
20%
25%
30%
FY
04
FY
05
FY
06
FY
07
FY
08
FY
09
FY
10
FY
11
FY
12
FY
13E
FY
14E
6%4%
-2%
4%
12%9%
27%
41%
25%23%
20%
-5%
0%
5%
10%
15%
20%
25%
30%
35%
40%
45%
FY
04
FY
05
FY
06
FY
07
FY
08
FY
09
FY
10
FY
11
FY
12
FY
13E
FY
14E
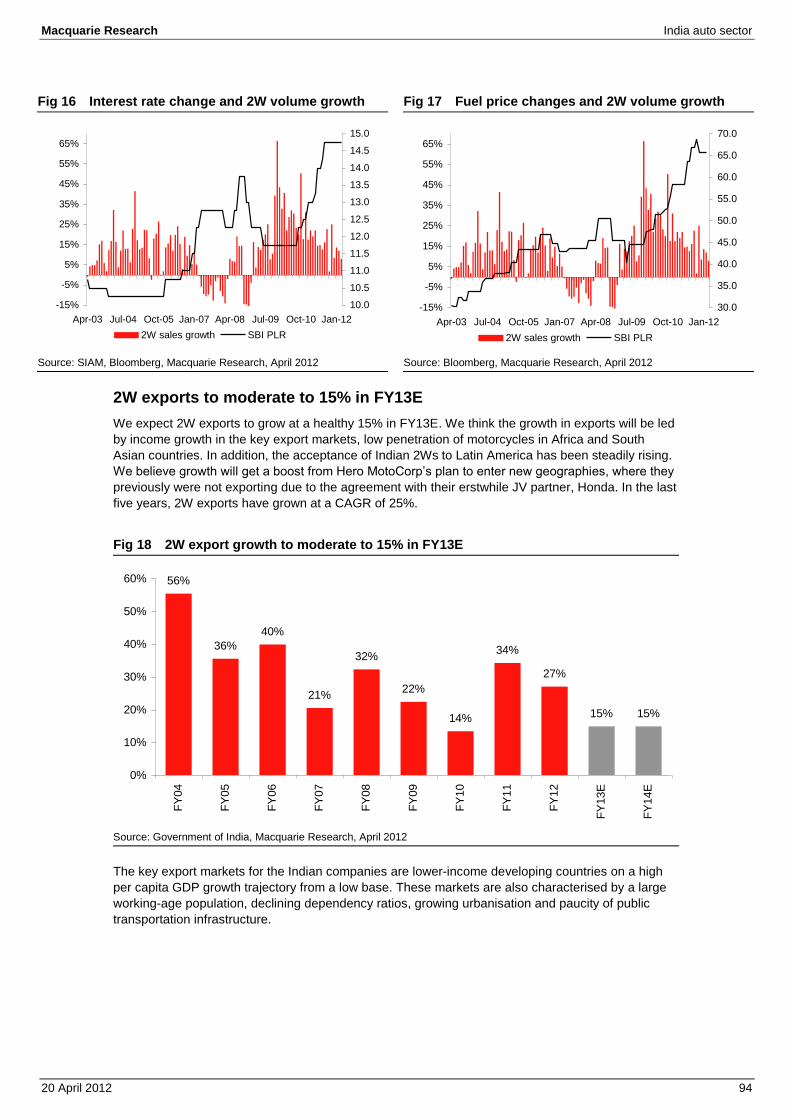
Macquarie Research India auto sector
20 April 2012 94
Fig 16 Interest rate change and 2W volume growth Fig 17 Fuel price changes and 2W volume growth
Source: SIAM, Bloomberg, Macquarie Research, April 2012 Source: Bloomberg, Macquarie Research, April 2012
2W exports to moderate to 15% in FY13E We expect 2W exports to grow at a healthy 15% in FY13E. We think the growth in exports will be led
by income growth in the key export markets, low penetration of motorcycles in Africa and South
Asian countries. In addition, the acceptance of Indian 2Ws to Latin America has been steadily rising.
We believe growth will get a boost from Hero MotoCorp’s plan to enter new geographies, where they
previously were not exporting due to the agreement with their erstwhile JV partner, Honda. In the last
five years, 2W exports have grown at a CAGR of 25%.
Fig 18 2W export growth to moderate to 15% in FY13E
Source: Government of India, Macquarie Research, April 2012
The key export markets for the Indian companies are lower-income developing countries on a high
per capita GDP growth trajectory from a low base. These markets are also characterised by a large
working-age population, declining dependency ratios, growing urbanisation and paucity of public
transportation infrastructure.
-15%
-5%
5%
15%
25%
35%
45%
55%
65%
Apr-03 Jul-04 Oct-05 Jan-07 Apr-08 Jul-09 Oct-10 Jan-12
10.0
10.5
11.0
11.5
12.0
12.5
13.0
13.5
14.0
14.5
15.0
2W sales growth SBI PLR
-15%
-5%
5%
15%
25%
35%
45%
55%
65%
Apr-03 Jul-04 Oct-05 Jan-07 Apr-08 Jul-09 Oct-10 Jan-12
30.0
35.0
40.0
45.0
50.0
55.0
60.0
65.0
70.0
2W sales growth SBI PLR
56%
36%
40%
21%
32%
22%
14%
34%
27%
15% 15%
0%
10%
20%
30%
40%
50%
60%
FY
04
FY
05
FY
06
FY
07
FY
08
FY
09
FY
10
FY
11
FY
12
FY
13E
FY
14E
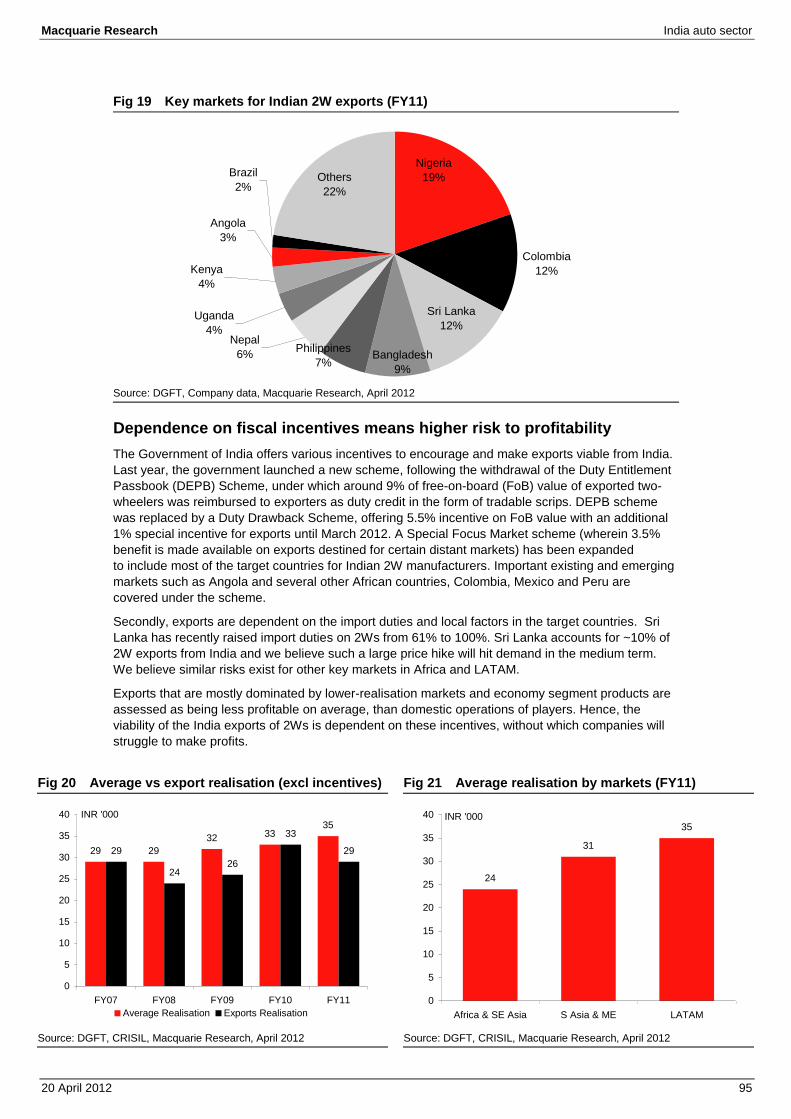
Macquarie Research India auto sector
20 April 2012 95
Fig 19 Key markets for Indian 2W exports (FY11)
Source: DGFT, Company data, Macquarie Research, April 2012
Dependence on fiscal incentives means higher risk to profitability The Government of India offers various incentives to encourage and make exports viable from India.
Last year, the government launched a new scheme, following the withdrawal of the Duty Entitlement
Passbook (DEPB) Scheme, under which around 9% of free-on-board (FoB) value of exported two-
wheelers was reimbursed to exporters as duty credit in the form of tradable scrips. DEPB scheme
was replaced by a Duty Drawback Scheme, offering 5.5% incentive on FoB value with an additional
1% special incentive for exports until March 2012. A Special Focus Market scheme (wherein 3.5%
benefit is made available on exports destined for certain distant markets) has been expanded
to include most of the target countries for Indian 2W manufacturers. Important existing and emerging
markets such as Angola and several other African countries, Colombia, Mexico and Peru are
covered under the scheme.
Secondly, exports are dependent on the import duties and local factors in the target countries. Sri
Lanka has recently raised import duties on 2Ws from 61% to 100%. Sri Lanka accounts for ~10% of
2W exports from India and we believe such a large price hike will hit demand in the medium term.
We believe similar risks exist for other key markets in Africa and LATAM.
Exports that are mostly dominated by lower-realisation markets and economy segment products are
assessed as being less profitable on average, than domestic operations of players. Hence, the
viability of the India exports of 2Ws is dependent on these incentives, without which companies will
struggle to make profits.
Fig 20 Average vs export realisation (excl incentives) Fig 21 Average realisation by markets (FY11)
Source: DGFT, CRISIL, Macquarie Research, April 2012 Source: DGFT, CRISIL, Macquarie Research, April 2012
Colombia
12%
Bangladesh
9%
Philippines
7%
Nepal
6%
Uganda
4%
Kenya
4%
Angola
3%
Brazil
2%
Sri Lanka
12%
Others
22%
Nigeria
19%
29 29
32 3335
29
2426
33
29
0
5
10
15
20
25
30
35
40
FY07 FY08 FY09 FY10 FY11
INR '000
Average Realisation Exports Realisation
24
31
35
0
5
10
15
20
25
30
35
40
Africa & SE Asia S Asia & ME LATAM
INR '000
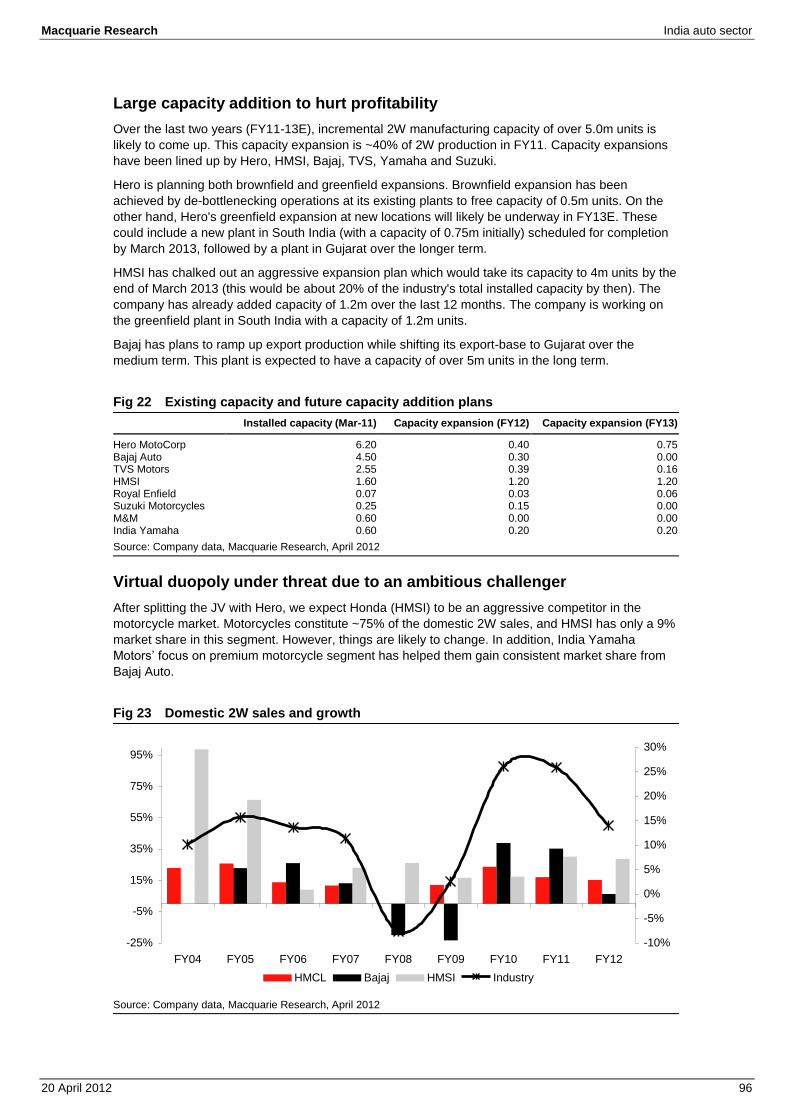
Macquarie Research India auto sector
20 April 2012 96
Large capacity addition to hurt profitability Over the last two years (FY11-13E), incremental 2W manufacturing capacity of over 5.0m units is
likely to come up. This capacity expansion is ~40% of 2W production in FY11. Capacity expansions
have been lined up by Hero, HMSI, Bajaj, TVS, Yamaha and Suzuki.
Hero is planning both brownfield and greenfield expansions. Brownfield expansion has been
achieved by de-bottlenecking operations at its existing plants to free capacity of 0.5m units. On the
other hand, Hero's greenfield expansion at new locations will likely be underway in FY13E. These
could include a new plant in South India (with a capacity of 0.75m initially) scheduled for completion
by March 2013, followed by a plant in Gujarat over the longer term.
HMSI has chalked out an aggressive expansion plan which would take its capacity to 4m units by the
end of March 2013 (this would be about 20% of the industry's total installed capacity by then). The
company has already added capacity of 1.2m over the last 12 months. The company is working on
the greenfield plant in South India with a capacity of 1.2m units.
Bajaj has plans to ramp up export production while shifting its export-base to Gujarat over the
medium term. This plant is expected to have a capacity of over 5m units in the long term.
Fig 22 Existing capacity and future capacity addition plans Installed capacity (Mar-11) Capacity expansion (FY12) Capacity expansion (FY13)
Hero MotoCorp 6.20 0.40 0.75 Bajaj Auto 4.50 0.30 0.00 TVS Motors 2.55 0.39 0.16 HMSI 1.60 1.20 1.20 Royal Enfield 0.07 0.03 0.06 Suzuki Motorcycles 0.25 0.15 0.00 M&M 0.60 0.00 0.00 India Yamaha 0.60 0.20 0.20
Source: Company data, Macquarie Research, April 2012
Virtual duopoly under threat due to an ambitious challenger After splitting the JV with Hero, we expect Honda (HMSI) to be an aggressive competitor in the
motorcycle market. Motorcycles constitute ~75% of the domestic 2W sales, and HMSI has only a 9%
market share in this segment. However, things are likely to change. In addition, India Yamaha
Motors’ focus on premium motorcycle segment has helped them gain consistent market share from
Bajaj Auto.
Fig 23 Domestic 2W sales and growth
Source: Company data, Macquarie Research, April 2012
-25%
-5%
15%
35%
55%
75%
95%
FY04 FY05 FY06 FY07 FY08 FY09 FY10 FY11 FY12
-10%
-5%
0%
5%
10%
15%
20%
25%
30%
HMCL Bajaj HMSI Industry

Macquarie Research India auto sector
20 April 2012 97
The motorcycle segment continues to be dominated by Hero MotoCorp and Bajaj Auto, which
together have a ~80% market share. On the other hand, HMSI has done well in the scooters
segment. HMSI is the market leader in scooters, with a 48% market share in FY12. While there is no
assurance that HMSI will be able to win market share from Hero Honda and Bajaj Auto, we are
confident that the two-wheeler segment will get incrementally very competitive due to the presence of
an aggressive challenger.
Fig 24 HMCL & BJAUT have 80% MS of motorcycles Fig 25 HMSI dominate scooter segment with 48% MS
Source: SIAM, Macquarie Research, April 2012 Source: SIAM, Macquarie Research, April 2012
Economy Segment – HMCL has maintained its leadership position The economy bike segment has been the fastest growing segment in the Indian motorcycle market
over the last two years. The share of the economy segment in the motorcycle market increased from
17% to 20% over the last year. A sizeable portion of the incremental demand in this segment comes
from commercial applications like courier services, restaurants, etc.
The focus of players on higher-segment products has caused a dearth of new products in this
segment, whereas the new products launched in the executive segment offer significantly improved
features at marginally higher price-points. Thus, higher cost-benefit ratios have led to a shift in
demand to the executive segment. Hero has ~45% market share in the segment. Strong sales
growth in Platina has led to Bajaj’s market share rising to 33% from 24% in March 2011. Bajaj’s gain
has come from TVS Motors, as sales for TVS Star has remained stagnant.
Fig 26 CD Deluxe – leadership in economy segment Fig 27 Platina has been holding on to 2nd position
Source: Company data, Macquarie Research, April 2012 Source: Company data, Macquarie Research, April 2012
0%
10%
20%
30%
40%
50%
60%
70%
80%
90%
100%
FY06 FY07 FY08 FY09 FY10 FY11 FY12
HMCL BJAUT TVS HMSI Yamaha Others
0%
10%
20%
30%
40%
50%
60%
70%
80%
90%
100%
FY06 FY07 FY08 FY09 FY10 FY11 FY12
HMSI HMCL TVS Suzuki Others
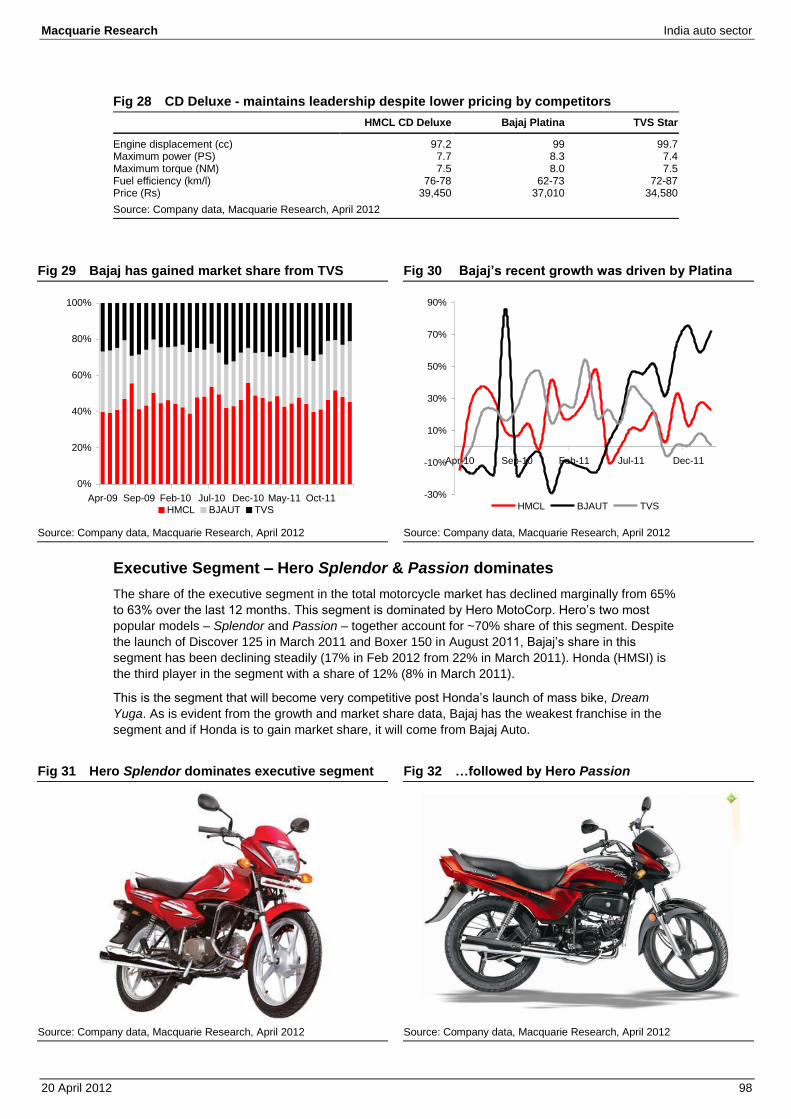
Macquarie Research India auto sector
20 April 2012 98
Fig 28 CD Deluxe - maintains leadership despite lower pricing by competitors HMCL CD Deluxe Bajaj Platina TVS Star
Engine displacement (cc) 97.2 99 99.7 Maximum power (PS) 7.7 8.3 7.4 Maximum torque (NM) 7.5 8.0 7.5 Fuel efficiency (km/l) 76-78 62-73 72-87 Price (Rs) 39,450 37,010 34,580
Source: Company data, Macquarie Research, April 2012
Fig 29 Bajaj has gained market share from TVS Fig 30 Bajaj’s recent growth was driven by Platina
Source: Company data, Macquarie Research, April 2012 Source: Company data, Macquarie Research, April 2012
Executive Segment – Hero Splendor & Passion dominates The share of the executive segment in the total motorcycle market has declined marginally from 65%
to 63% over the last 12 months. This segment is dominated by Hero MotoCorp. Hero’s two most
popular models – Splendor and Passion – together account for ~70% share of this segment. Despite
the launch of Discover 125 in March 2011 and Boxer 150 in August 2011, Bajaj’s share in this
segment has been declining steadily (17% in Feb 2012 from 22% in March 2011). Honda (HMSI) is
the third player in the segment with a share of 12% (8% in March 2011).
This is the segment that will become very competitive post Honda’s launch of mass bike, Dream Yuga. As is evident from the growth and market share data, Bajaj has the weakest franchise in the
segment and if Honda is to gain market share, it will come from Bajaj Auto.
Fig 31 Hero Splendor dominates executive segment Fig 32 …followed by Hero Passion
Source: Company data, Macquarie Research, April 2012 Source: Company data, Macquarie Research, April 2012
0%
20%
40%
60%
80%
100%
Apr-09 Sep-09 Feb-10 Jul-10 Dec-10 May-11 Oct-11
HMCL BJAUT TVS
-30%
-10%
10%
30%
50%
70%
90%
Apr-10 Sep-10 Feb-11 Jul-11 Dec-11
HMCL BJAUT TVS
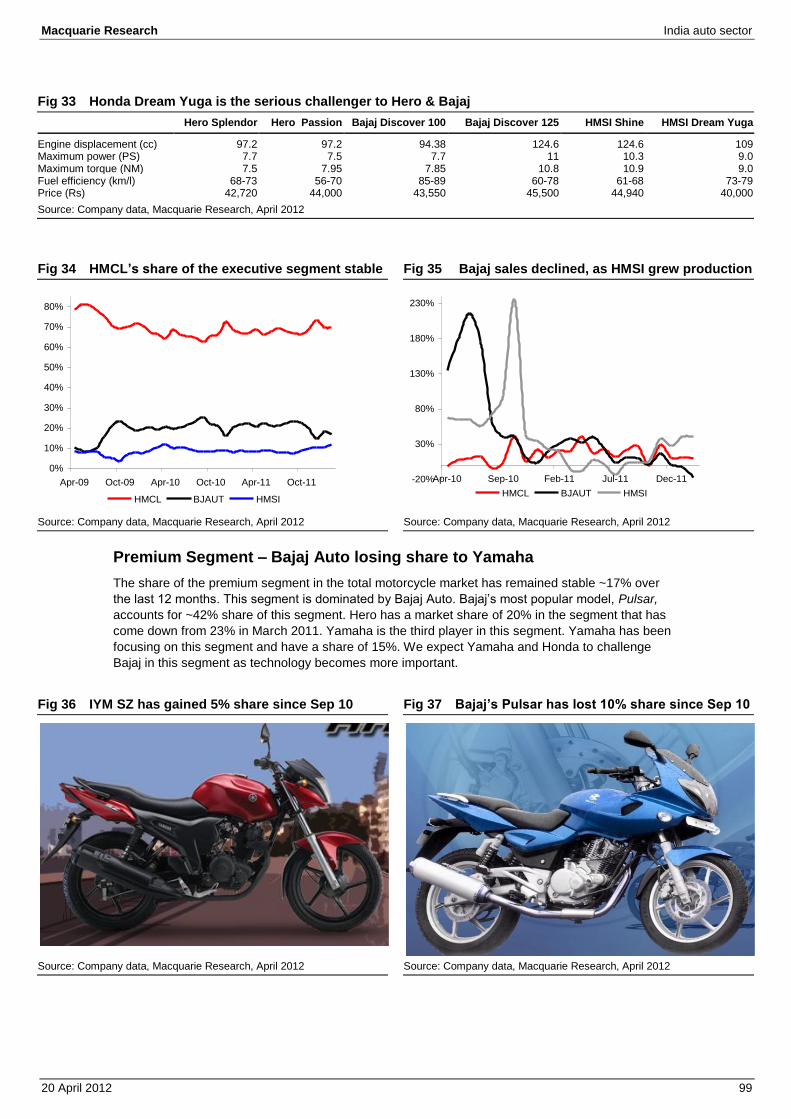
Macquarie Research India auto sector
20 April 2012 99
Fig 33 Honda Dream Yuga is the serious challenger to Hero & Bajaj Hero Splendor Hero Passion Bajaj Discover 100 Bajaj Discover 125 HMSI Shine HMSI Dream Yuga
Engine displacement (cc) 97.2 97.2 94.38 124.6 124.6 109 Maximum power (PS) 7.7 7.5 7.7 11 10.3 9.0 Maximum torque (NM) 7.5 7.95 7.85 10.8 10.9 9.0 Fuel efficiency (km/l) 68-73 56-70 85-89 60-78 61-68 73-79 Price (Rs) 42,720 44,000 43,550 45,500 44,940 40,000
Source: Company data, Macquarie Research, April 2012
Fig 34 HMCL’s share of the executive segment stable Fig 35 Bajaj sales declined, as HMSI grew production
Source: Company data, Macquarie Research, April 2012 Source: Company data, Macquarie Research, April 2012
Premium Segment – Bajaj Auto losing share to Yamaha The share of the premium segment in the total motorcycle market has remained stable ~17% over
the last 12 months. This segment is dominated by Bajaj Auto. Bajaj’s most popular model, Pulsar, accounts for ~42% share of this segment. Hero has a market share of 20% in the segment that has
come down from 23% in March 2011. Yamaha is the third player in this segment. Yamaha has been
focusing on this segment and have a share of 15%. We expect Yamaha and Honda to challenge
Bajaj in this segment as technology becomes more important.
Fig 36 IYM SZ has gained 5% share since Sep 10 Fig 37 Bajaj’s Pulsar has lost 10% share since Sep 10
Source: Company data, Macquarie Research, April 2012 Source: Company data, Macquarie Research, April 2012
0%
10%
20%
30%
40%
50%
60%
70%
80%
Apr-09 Oct-09 Apr-10 Oct-10 Apr-11 Oct-11
HMCL BJAUT HMSI
-20%
30%
80%
130%
180%
230%
Apr-10 Sep-10 Feb-11 Jul-11 Dec-11
HMCL BJAUT HMSI

Macquarie Research India auto sector
20 April 2012 100
Fig 38 Yamaha SZ stands out because of aggressive pricing Yamaha SZ Yamaha FZ16 Yamaha Fazer Bajaj Pulsar 150 HMCL CBZ 150 Honda Unicorn
Engine displacement (cc) 153 153 153 149 149.2 149.1 Maximum power (PS) 12.1/7,500 14.0/7,500 14.0/7,500 15.06/9,000 14.4/8,500 13.5/8,000 Maximum torque (NM) 12.8/4,500 13.6/6,000 13.6/6,000 12.76/6,500 12.80/6,500 12.75/5,500 Fuel efficiency (km/l) 52.9-61.2 46.4-53.2 46.4-53.2 56.5-65.0 56.0-61.2 57.0-68.0 Price (Rs) 49,550 65,230 72,560 63,630 62,220 60,810
Source: Company data, Macquarie Research, April 2012
Fig 39 Bajaj’s premium segment share on a decline Fig 40 Volume growth in premium segment
Source: Company data, Macquarie Research, April 2012 Source: Company data, Macquarie Research, April 2012
Model mix has been unfavourable for Bajaj Auto Bajaj’s economy bike, Platina, grew 39% in FY12 but premium bike, Pulsar, declined 10%. The
premium bike segment contributed 28% to Bajaj’s sales in FY12, versus 34% in FY11. Moreover,
Discover sales have also declined ~7% in the last six months. Bajaj’s recent bike launches, like
Boxer 150 or Discover 125, were not well-received by customers.
Fig 41 Segment-wise market share of key players in the domestic motorcycle market Market share Mar-12 Feb-12 Jan-12 Dec-11 Nov-11 Oct-11 Sep-11 Aug-11 Jul-11 Jun-11 May-11 Apr-11 Mar-11
Economy Segment Hero Honda 44% 45% 47% 51% 46% 41% 39% 44% 47% 44% 42% 48% 45% Bajaj Auto 32% 33% 28% 27% 32% 30% 28% 27% 27% 28% 27% 24% 24% TVS Motors 21% 21% 23% 20% 21% 28% 31% 28% 24% 27% 30% 27% 29% Yamaha India 2% 2% 1% 2% 2% 2% 2% 1% 2% 1% 1% 1% 1% Executive Segment Hero Honda 70% 70% 70% 73% 69% 67% 67% 68% 69% 68% 66% 69% 67% Bajaj Auto 17% 17% 18% 15% 20% 23% 24% 22% 21% 21% 23% 21% 22% HMSI 11% 12% 11% 10% 10% 9% 8% 8% 8% 9% 9% 8% 8% TVS Motors 0% 0% 0% 0% 0% 0% 0% 0% 0% 0% 0% 0% 0% Yamaha India 1% 1% 1% 1% 1% 1% 1% 1% 1% 1% 1% 1% 1% Suzuki 0% 1% 1% 0% 0% 0% 1% 1% 1% 1% 1% 1% 1% Mahindra & Mahindra 0% 0% 0% 0% 0% 0% 0% 0% 0% 0% 0% 0% 0% Premium Segment Hero Honda 20% 20% 17% 18% 16% 16% 19% 20% 23% 23% 22% 19% 23% Bajaj Auto 41% 41% 43% 40% 46% 44% 42% 44% 41% 40% 42% 41% 43% HMSI 10% 9% 9% 11% 11% 9% 10% 8% 9% 10% 9% 10% 8% TVS Motors 8% 9% 10% 8% 7% 9% 9% 9% 8% 8% 8% 9% 9% Yamaha India 14% 15% 15% 19% 14% 18% 15% 15% 15% 15% 15% 16% 13% Suzuki 1% 1% 1% 1% 1% 0% 1% 0% 0% 0% 1% 0% 0% Royal Enfield 6% 5% 5% 4% 5% 4% 4% 4% 4% 4% 4% 5% 4%
Source: Company data, Macquarie Research, April 2012
30%
35%
40%
45%
50%
55%
Apr-09 Oct-09 Apr-10 Oct-10 Apr-11 Oct-11
-25%
25%
75%
125%
175%
225%
Apr-10 Aug-10 Dec-10 Apr-11 Aug-11 Dec-11
Bajaj Yamaha
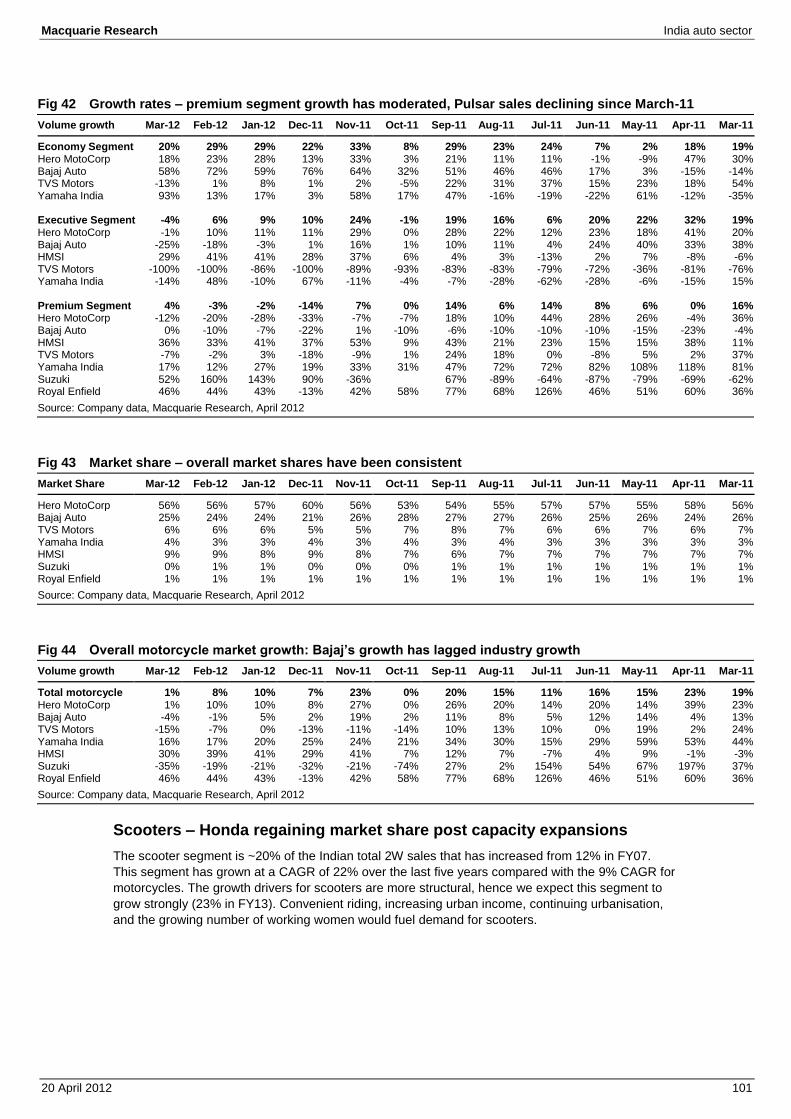
Macquarie Research India auto sector
20 April 2012 101
Fig 42 Growth rates – premium segment growth has moderated, Pulsar sales declining since March-11 Volume growth Mar-12 Feb-12 Jan-12 Dec-11 Nov-11 Oct-11 Sep-11 Aug-11 Jul-11 Jun-11 May-11 Apr-11 Mar-11
Economy Segment 20% 29% 29% 22% 33% 8% 29% 23% 24% 7% 2% 18% 19% Hero MotoCorp 18% 23% 28% 13% 33% 3% 21% 11% 11% -1% -9% 47% 30% Bajaj Auto 58% 72% 59% 76% 64% 32% 51% 46% 46% 17% 3% -15% -14% TVS Motors -13% 1% 8% 1% 2% -5% 22% 31% 37% 15% 23% 18% 54% Yamaha India 93% 13% 17% 3% 58% 17% 47% -16% -19% -22% 61% -12% -35% Executive Segment -4% 6% 9% 10% 24% -1% 19% 16% 6% 20% 22% 32% 19% Hero MotoCorp -1% 10% 11% 11% 29% 0% 28% 22% 12% 23% 18% 41% 20% Bajaj Auto -25% -18% -3% 1% 16% 1% 10% 11% 4% 24% 40% 33% 38% HMSI 29% 41% 41% 28% 37% 6% 4% 3% -13% 2% 7% -8% -6% TVS Motors -100% -100% -86% -100% -89% -93% -83% -83% -79% -72% -36% -81% -76% Yamaha India -14% 48% -10% 67% -11% -4% -7% -28% -62% -28% -6% -15% 15% Premium Segment 4% -3% -2% -14% 7% 0% 14% 6% 14% 8% 6% 0% 16% Hero MotoCorp -12% -20% -28% -33% -7% -7% 18% 10% 44% 28% 26% -4% 36% Bajaj Auto 0% -10% -7% -22% 1% -10% -6% -10% -10% -10% -15% -23% -4% HMSI 36% 33% 41% 37% 53% 9% 43% 21% 23% 15% 15% 38% 11% TVS Motors -7% -2% 3% -18% -9% 1% 24% 18% 0% -8% 5% 2% 37% Yamaha India 17% 12% 27% 19% 33% 31% 47% 72% 72% 82% 108% 118% 81% Suzuki 52% 160% 143% 90% -36% 67% -89% -64% -87% -79% -69% -62% Royal Enfield 46% 44% 43% -13% 42% 58% 77% 68% 126% 46% 51% 60% 36%
Source: Company data, Macquarie Research, April 2012
Fig 43 Market share – overall market shares have been consistent Market Share Mar-12 Feb-12 Jan-12 Dec-11 Nov-11 Oct-11 Sep-11 Aug-11 Jul-11 Jun-11 May-11 Apr-11 Mar-11
Hero MotoCorp 56% 56% 57% 60% 56% 53% 54% 55% 57% 57% 55% 58% 56% Bajaj Auto 25% 24% 24% 21% 26% 28% 27% 27% 26% 25% 26% 24% 26% TVS Motors 6% 6% 6% 5% 5% 7% 8% 7% 6% 6% 7% 6% 7% Yamaha India 4% 3% 3% 4% 3% 4% 3% 4% 3% 3% 3% 3% 3% HMSI 9% 9% 8% 9% 8% 7% 6% 7% 7% 7% 7% 7% 7% Suzuki 0% 1% 1% 0% 0% 0% 1% 1% 1% 1% 1% 1% 1% Royal Enfield 1% 1% 1% 1% 1% 1% 1% 1% 1% 1% 1% 1% 1%
Source: Company data, Macquarie Research, April 2012
Fig 44 Overall motorcycle market growth: Bajaj’s growth has lagged industry growth Volume growth Mar-12 Feb-12 Jan-12 Dec-11 Nov-11 Oct-11 Sep-11 Aug-11 Jul-11 Jun-11 May-11 Apr-11 Mar-11
Total motorcycle 1% 8% 10% 7% 23% 0% 20% 15% 11% 16% 15% 23% 19% Hero MotoCorp 1% 10% 10% 8% 27% 0% 26% 20% 14% 20% 14% 39% 23% Bajaj Auto -4% -1% 5% 2% 19% 2% 11% 8% 5% 12% 14% 4% 13% TVS Motors -15% -7% 0% -13% -11% -14% 10% 13% 10% 0% 19% 2% 24% Yamaha India 16% 17% 20% 25% 24% 21% 34% 30% 15% 29% 59% 53% 44% HMSI 30% 39% 41% 29% 41% 7% 12% 7% -7% 4% 9% -1% -3% Suzuki -35% -19% -21% -32% -21% -74% 27% 2% 154% 54% 67% 197% 37% Royal Enfield 46% 44% 43% -13% 42% 58% 77% 68% 126% 46% 51% 60% 36%
Source: Company data, Macquarie Research, April 2012
Scooters – Honda regaining market share post capacity expansions The scooter segment is ~20% of the Indian total 2W sales that has increased from 12% in FY07.
This segment has grown at a CAGR of 22% over the last five years compared with the 9% CAGR for
motorcycles. The growth drivers for scooters are more structural, hence we expect this segment to
grow strongly (23% in FY13). Convenient riding, increasing urban income, continuing urbanisation,
and the growing number of working women would fuel demand for scooters.
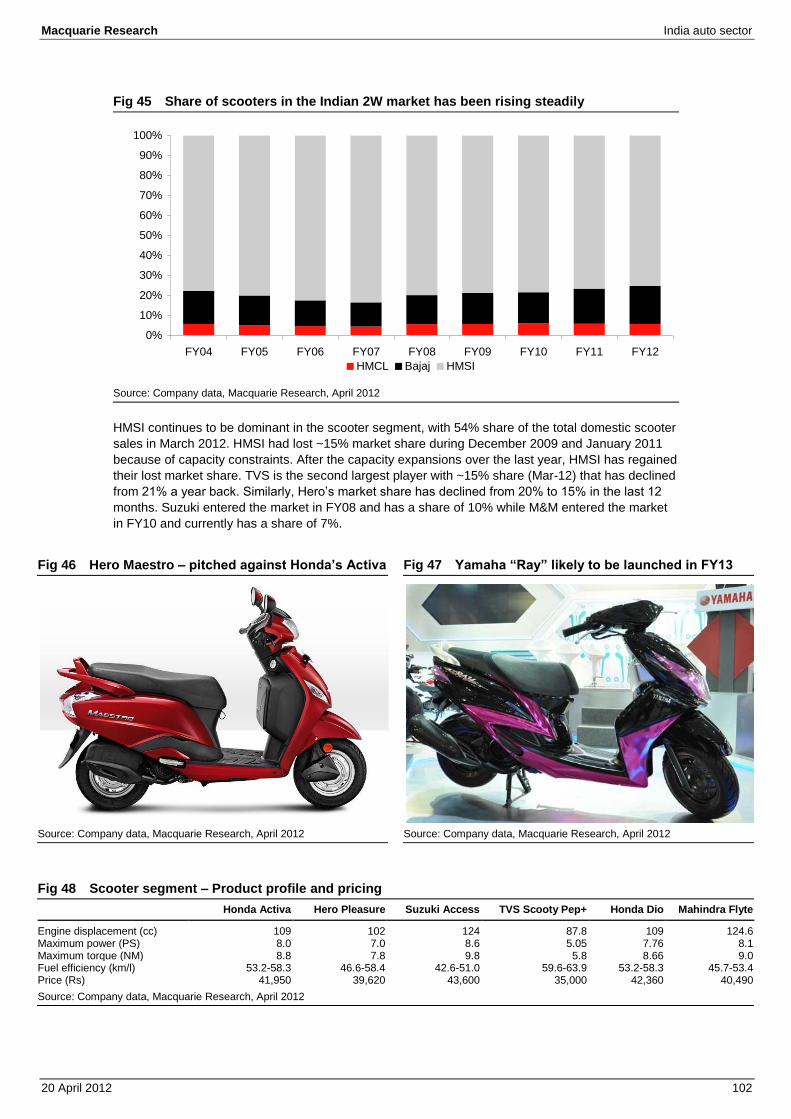
Macquarie Research India auto sector
20 April 2012 102
Fig 45 Share of scooters in the Indian 2W market has been rising steadily
Source: Company data, Macquarie Research, April 2012
HMSI continues to be dominant in the scooter segment, with 54% share of the total domestic scooter
sales in March 2012. HMSI had lost ~15% market share during December 2009 and January 2011
because of capacity constraints. After the capacity expansions over the last year, HMSI has regained
their lost market share. TVS is the second largest player with ~15% share (Mar-12) that has declined
from 21% a year back. Similarly, Hero’s market share has declined from 20% to 15% in the last 12
months. Suzuki entered the market in FY08 and has a share of 10% while M&M entered the market
in FY10 and currently has a share of 7%.
Fig 46 Hero Maestro – pitched against Honda’s Activa Fig 47 Yamaha “Ray” likely to be launched in FY13
Source: Company data, Macquarie Research, April 2012 Source: Company data, Macquarie Research, April 2012
Fig 48 Scooter segment – Product profile and pricing Honda Activa Hero Pleasure Suzuki Access TVS Scooty Pep+ Honda Dio Mahindra Flyte
Engine displacement (cc) 109 102 124 87.8 109 124.6 Maximum power (PS) 8.0 7.0 8.6 5.05 7.76 8.1 Maximum torque (NM) 8.8 7.8 9.8 5.8 8.66 9.0 Fuel efficiency (km/l) 53.2-58.3 46.6-58.4 42.6-51.0 59.6-63.9 53.2-58.3 45.7-53.4 Price (Rs) 41,950 39,620 43,600 35,000 42,360 40,490
Source: Company data, Macquarie Research, April 2012
0%
10%
20%
30%
40%
50%
60%
70%
80%
90%
100%
FY04 FY05 FY06 FY07 FY08 FY09 FY10 FY11 FY12
HMCL Bajaj HMSI
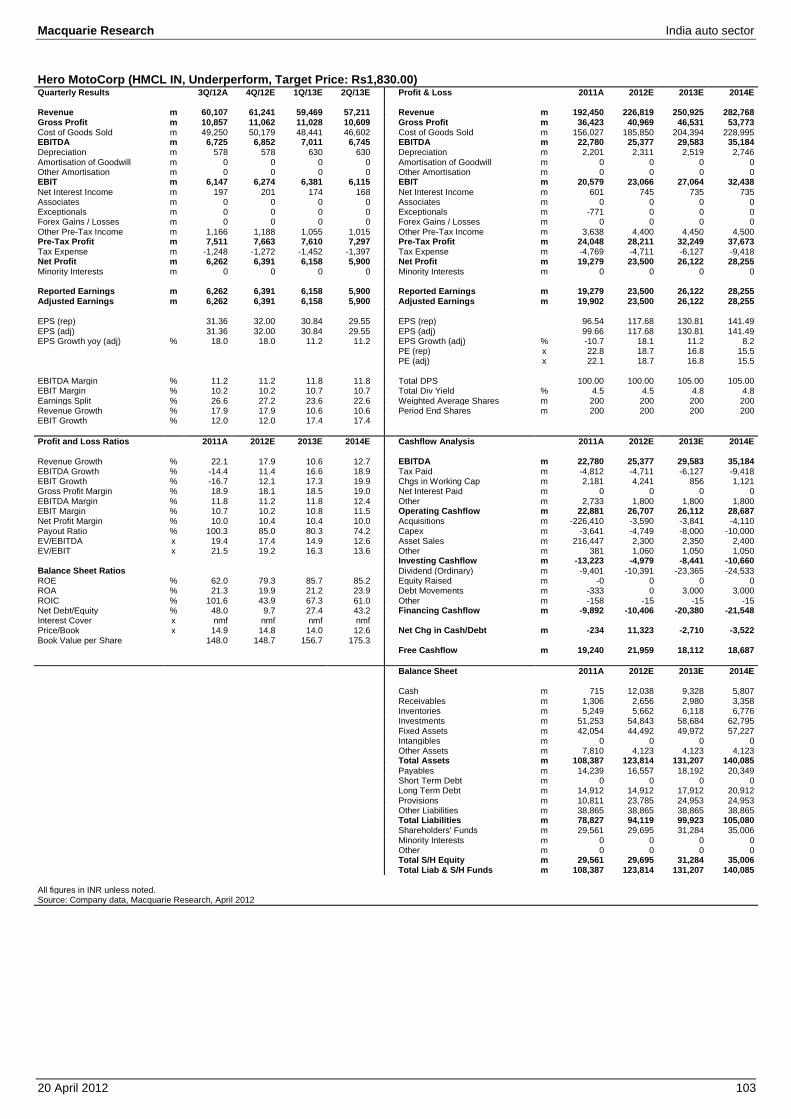
Macquarie Research India auto sector
20 April 2012 103
Hero MotoCorp (HMCL IN, Underperform, Target Price: Rs1,830.00) Quarterly Results 3Q/12A 4Q/12E 1Q/13E 2Q/13E Profit & Loss 2011A 2012E 2013E 2014E
Revenue m 60,107 61,241 59,469 57,211 Revenue m 192,450 226,819 250,925 282,768 Gross Profit m 10,857 11,062 11,028 10,609 Gross Profit m 36,423 40,969 46,531 53,773 Cost of Goods Sold m 49,250 50,179 48,441 46,602 Cost of Goods Sold m 156,027 185,850 204,394 228,995 EBITDA m 6,725 6,852 7,011 6,745 EBITDA m 22,780 25,377 29,583 35,184 Depreciation m 578 578 630 630 Depreciation m 2,201 2,311 2,519 2,746 Amortisation of Goodwill m 0 0 0 0 Amortisation of Goodwill m 0 0 0 0 Other Amortisation m 0 0 0 0 Other Amortisation m 0 0 0 0 EBIT m 6,147 6,274 6,381 6,115 EBIT m 20,579 23,066 27,064 32,438 Net Interest Income m 197 201 174 168 Net Interest Income m 601 745 735 735 Associates m 0 0 0 0 Associates m 0 0 0 0 Exceptionals m 0 0 0 0 Exceptionals m -771 0 0 0 Forex Gains / Losses m 0 0 0 0 Forex Gains / Losses m 0 0 0 0 Other Pre-Tax Income m 1,166 1,188 1,055 1,015 Other Pre-Tax Income m 3,638 4,400 4,450 4,500 Pre-Tax Profit m 7,511 7,663 7,610 7,297 Pre-Tax Profit m 24,048 28,211 32,249 37,673 Tax Expense m -1,248 -1,272 -1,452 -1,397 Tax Expense m -4,769 -4,711 -6,127 -9,418 Net Profit m 6,262 6,391 6,158 5,900 Net Profit m 19,279 23,500 26,122 28,255 Minority Interests m 0 0 0 0 Minority Interests m 0 0 0 0
Reported Earnings m 6,262 6,391 6,158 5,900 Reported Earnings m 19,279 23,500 26,122 28,255 Adjusted Earnings m 6,262 6,391 6,158 5,900 Adjusted Earnings m 19,902 23,500 26,122 28,255
EPS (rep) 31.36 32.00 30.84 29.55 EPS (rep) 96.54 117.68 130.81 141.49 EPS (adj) 31.36 32.00 30.84 29.55 EPS (adj) 99.66 117.68 130.81 141.49 EPS Growth yoy (adj) % 18.0 18.0 11.2 11.2 EPS Growth (adj) % -10.7 18.1 11.2 8.2
PE (rep) x 22.8 18.7 16.8 15.5 PE (adj) x 22.1 18.7 16.8 15.5
EBITDA Margin % 11.2 11.2 11.8 11.8 Total DPS 100.00 100.00 105.00 105.00 EBIT Margin % 10.2 10.2 10.7 10.7 Total Div Yield % 4.5 4.5 4.8 4.8 Earnings Split % 26.6 27.2 23.6 22.6 Weighted Average Shares m 200 200 200 200 Revenue Growth % 17.9 17.9 10.6 10.6 Period End Shares m 200 200 200 200 EBIT Growth % 12.0 12.0 17.4 17.4
Profit and Loss Ratios 2011A 2012E 2013E 2014E Cashflow Analysis 2011A 2012E 2013E 2014E
Revenue Growth % 22.1 17.9 10.6 12.7 EBITDA m 22,780 25,377 29,583 35,184 EBITDA Growth % -14.4 11.4 16.6 18.9 Tax Paid m -4,812 -4,711 -6,127 -9,418 EBIT Growth % -16.7 12.1 17.3 19.9 Chgs in Working Cap m 2,181 4,241 856 1,121 Gross Profit Margin % 18.9 18.1 18.5 19.0 Net Interest Paid m 0 0 0 0 EBITDA Margin % 11.8 11.2 11.8 12.4 Other m 2,733 1,800 1,800 1,800 EBIT Margin % 10.7 10.2 10.8 11.5 Operating Cashflow m 22,881 26,707 26,112 28,687 Net Profit Margin % 10.0 10.4 10.4 10.0 Acquisitions m -226,410 -3,590 -3,841 -4,110 Payout Ratio % 100.3 85.0 80.3 74.2 Capex m -3,641 -4,749 -8,000 -10,000 EV/EBITDA x 19.4 17.4 14.9 12.6 Asset Sales m 216,447 2,300 2,350 2,400 EV/EBIT x 21.5 19.2 16.3 13.6 Other m 381 1,060 1,050 1,050
Investing Cashflow m -13,223 -4,979 -8,441 -10,660 Balance Sheet Ratios Dividend (Ordinary) m -9,401 -10,391 -23,365 -24,533 ROE % 62.0 79.3 85.7 85.2 Equity Raised m -0 0 0 0 ROA % 21.3 19.9 21.2 23.9 Debt Movements m -333 0 3,000 3,000 ROIC % 101.6 43.9 67.3 61.0 Other m -158 -15 -15 -15 Net Debt/Equity % 48.0 9.7 27.4 43.2 Financing Cashflow m -9,892 -10,406 -20,380 -21,548 Interest Cover x nmf nmf nmf nmf Price/Book x 14.9 14.8 14.0 12.6 Net Chg in Cash/Debt m -234 11,323 -2,710 -3,522 Book Value per Share 148.0 148.7 156.7 175.3
Free Cashflow m 19,240 21,959 18,112 18,687 Balance Sheet 2011A 2012E 2013E 2014E Cash m 715 12,038 9,328 5,807 Receivables m 1,306 2,656 2,980 3,358 Inventories m 5,249 5,662 6,118 6,776 Investments m 51,253 54,843 58,684 62,795 Fixed Assets m 42,054 44,492 49,972 57,227 Intangibles m 0 0 0 0 Other Assets m 7,810 4,123 4,123 4,123 Total Assets m 108,387 123,814 131,207 140,085 Payables m 14,239 16,557 18,192 20,349 Short Term Debt m 0 0 0 0 Long Term Debt m 14,912 14,912 17,912 20,912 Provisions m 10,811 23,785 24,953 24,953 Other Liabilities m 38,865 38,865 38,865 38,865 Total Liabilities m 78,827 94,119 99,923 105,080 Shareholders' Funds m 29,561 29,695 31,284 35,006 Minority Interests m 0 0 0 0 Other m 0 0 0 0 Total S/H Equity m 29,561 29,695 31,284 35,006 Total Liab & S/H Funds m 108,387 123,814 131,207 140,085
All figures in INR unless noted. Source: Company data, Macquarie Research, April 2012
Macquarie Research India auto sector
20 April 2012 104
INDIA
BJAUT IN Underperform
Price (at 10:00, 19 Apr 2012 GMT) Rs1,732.05
12-month target Rs 1,430.00 Upside/Downside % -17.4 Valuation Rs 1,430.00 - PER GICS sector Automobiles &
Components Market cap Rsm 501,198 30-day avg turnover US$m 4 Market cap US$m 9,690 Number shares on issue m 289.4
Investment fundamentals Year end 31 Mar 2011A 2012E 2013E 2014E
Revenue bn 166.2 199.8 214.5 240.9 EBITDA bn 34.0 40.2 41.9 47.1 EBITDA growth % 29.1 18.1 4.3 12.3 Reported profit bn 33.4 31.2 31.9 34.9 Adjusted profit bn 27.8 31.2 31.9 34.9 EPS rep Rs 115.41 107.99 110.12 120.69 EPS rep growth % 96.1 -6.4 2.0 9.6 EPS adj Rs 96.19 107.99 110.12 120.69
EPS adj growth % 53.2 12.3 2.0 9.6 PER rep x 15.0 16.0 15.7 14.4 PER adj x 18.0 16.0 15.7 14.4 Total DPS Rs 40.00 50.00 50.00 55.00 Total div yield % 2.3 2.9 2.9 3.2 ROA % 40.1 38.7 34.4 32.8 ROE % 71.0 55.3 44.5 39.9
EV/EBITDA x 14.4 12.2 11.7 10.4 Net debt/equity % -4.7 -17.0 -24.8 -33.7 P/BV x 10.2 7.8 6.3 5.2
BJAUT IN rel BSE Sensex performance, & rec history
Note: Recommendation timeline - if not a continuous line, then there was no Macquarie coverage at the time or there was an embargo period.
Source: FactSet, Macquarie Research, April 2012
(all figures in INR unless noted)
Analyst(s) Amit Mishra, CFA +91 22 6720 4084 [email protected] Priya Ranjan +91 22 6720 4082 [email protected]
20 April 2012 Macquarie Capital Securities India (Pvt) Ltd
Bajaj Auto A tale of two continents Event We have revised downward our volume growth assumption for Bajaj’s
domestic as well as export business. We believe the company faces a serious
growth challenge in the domestic motorcycle industry, given rising competitive
intensity and a demand slowdown. Headwinds for exports to Sri Lanka (35%
of 3W and ~10% of 2W exports) in the form of a sharp increase in import duty,
and rising competition in Africa, are also likely to weigh on Bajaj’s export
growth. We reiterate our contrarian Underperform.
Impact Sharp deceleration in domestic motorcycle volumes. We expect Bajaj’s
domestic 2W volumes to grow ~1% in FY13E compared to industry growth of
6.5%. This slowdown would be due to a likely decline in volume sales of the
Discover after HMSI’s entry into the executive segment (Dream Yuga), as we
believe Discover is a weaker brand than HMCL’s Splendor or Passion.
Further, we think the weak demand outlook of the premium segment, in which
Bajaj has a strong brand in Pulsar, would also weigh on growth.
Performance of new launches holds the key. Bajaj has recently launched a
new premium segment bike, Duke 200 (from KTM). It also plans to launch the
new Pulsar 200 (based on a KTM engine) and upgrade the Discover, to stem
volume declines in its two biggest brands. We think performance of new
models is the key for Bajaj, as the Discover – which accounts for 50% of
Bajaj’s domestic unit sales – faces a decline.
Export growth likely to moderate sharply. We believe the large increase in
import duty on 2Ws and 3Ws in Sri Lanka and rising competition from Honda
in Nigeria will moderate export growth in FY13E. Bajaj’s 2W and 3W export
sales grew 2x and 1.7x, respectively, in two years (FY10–12). We think our
2W and 3W export growth assumption of 14% and 12% for FY213E have
downside risk, given the headwinds in Bajaj’s key export markets.
Guidance of 20% EBITDA margin is too optimistic. We believe Bajaj is
struggling to reverse volume decline in its high-margin premium bike Pulsar, due to weak demand in the premium segment. Higher growth of the Platina
compared to Pulsar and Discover, along with slowdown in 3W exports to Sri
Lanka, will also likely impact margins. Higher advertising and promotion
spends due to a weak demand environment would also impact margins. We
expect Bajaj’s EBITDA margin to come down by 60bp to 19.5% in FY13E with
more downside risks than upside.
Earnings and target price revision No EPS change. We are raising our TP to Rs1430 from Rs1,320 as we value
BJAUT at 13x its FY13E earnings.
Price catalyst 12-month price target: Rs1,430.00 based on a PER methodology.
Catalyst: Sharp slowdown in export growth
Action and recommendation Underperform maintained: BJAUT is trading at FY13E PER of 15.7x, which
is a ~22% premium to its historical valuation. With downside risk to volume
amidst rising competition, we expect valuations to revert towards the mean.
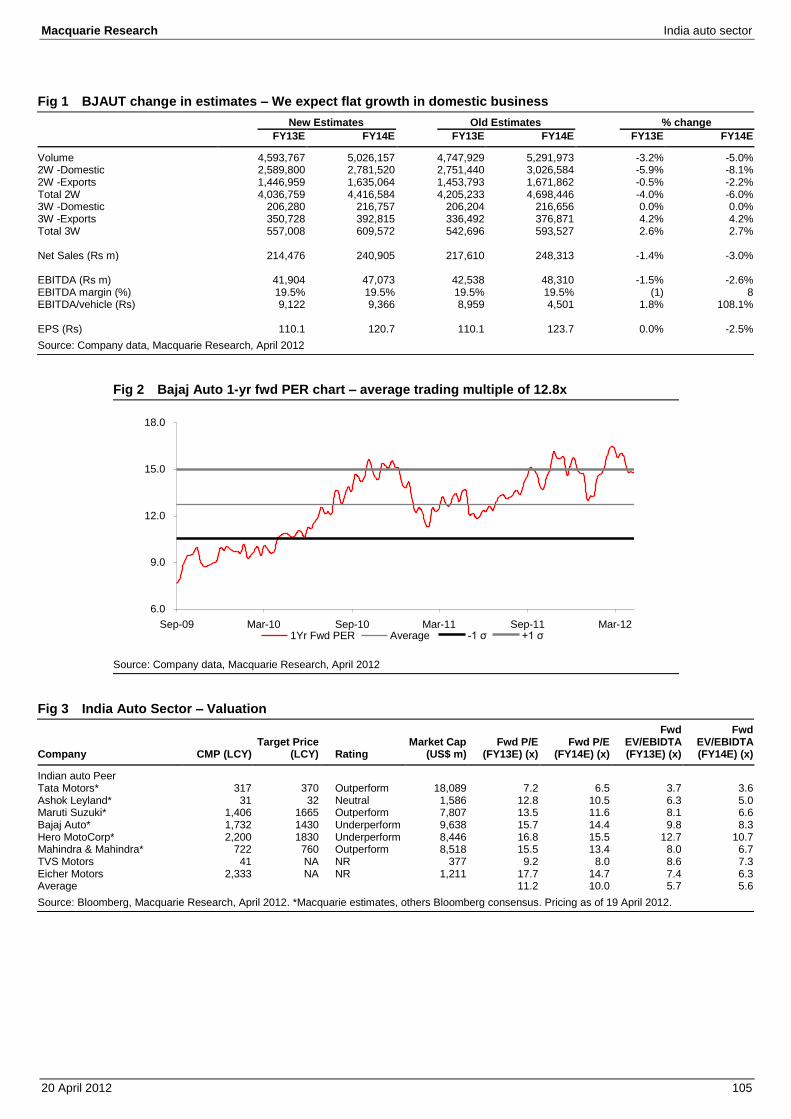
Macquarie Research India auto sector
20 April 2012 105
Fig 1 BJAUT change in estimates – We expect flat growth in domestic business New Estimates Old Estimates % change FY13E FY14E FY13E FY14E FY13E FY14E
Volume 4,593,767 5,026,157 4,747,929 5,291,973 -3.2% -5.0% 2W -Domestic 2,589,800 2,781,520 2,751,440 3,026,584 -5.9% -8.1% 2W -Exports 1,446,959 1,635,064 1,453,793 1,671,862 -0.5% -2.2% Total 2W 4,036,759 4,416,584 4,205,233 4,698,446 -4.0% -6.0% 3W -Domestic 206,280 216,757 206,204 216,656 0.0% 0.0% 3W -Exports 350,728 392,815 336,492 376,871 4.2% 4.2% Total 3W 557,008 609,572 542,696 593,527 2.6% 2.7% Net Sales (Rs m) 214,476 240,905 217,610 248,313 -1.4% -3.0% EBITDA (Rs m) 41,904 47,073 42,538 48,310 -1.5% -2.6% EBITDA margin (%) 19.5% 19.5% 19.5% 19.5% (1) 8 EBITDA/vehicle (Rs) 9,122 9,366 8,959 4,501 1.8% 108.1% EPS (Rs) 110.1 120.7 110.1 123.7 0.0% -2.5%
Source: Company data, Macquarie Research, April 2012
Fig 2 Bajaj Auto 1-yr fwd PER chart – average trading multiple of 12.8x
Source: Company data, Macquarie Research, April 2012
Fig 3 India Auto Sector – Valuation
Company CMP (LCY) Target Price
(LCY) Rating Market Cap
(US$ m) Fwd P/E
(FY13E) (x) Fwd P/E
(FY14E) (x)
Fwd EV/EBIDTA (FY13E) (x)
Fwd EV/EBIDTA (FY14E) (x)
Indian auto Peer Tata Motors* 317 370 Outperform 18,089 7.2 6.5 3.7 3.6 Ashok Leyland* 31 32 Neutral 1,586 12.8 10.5 6.3 5.0 Maruti Suzuki* 1,406 1665 Outperform 7,807 13.5 11.6 8.1 6.6 Bajaj Auto* 1,732 1430 Underperform 9,638 15.7 14.4 9.8 8.3 Hero MotoCorp* 2,200 1830 Underperform 8,446 16.8 15.5 12.7 10.7 Mahindra & Mahindra* 722 760 Outperform 8,518 15.5 13.4 8.0 6.7 TVS Motors 41 NA NR 377 9.2 8.0 8.6 7.3 Eicher Motors 2,333 NA NR 1,211 17.7 14.7 7.4 6.3 Average 11.2 10.0 5.7 5.6
Source: Bloomberg, Macquarie Research, April 2012. *Macquarie estimates, others Bloomberg consensus. Pricing as of 19 April 2012.
6.0
9.0
12.0
15.0
18.0
Sep-09 Mar-10 Sep-10 Mar-11 Sep-11 Mar-121Yr Fwd PER Average -1 σ +1 σ
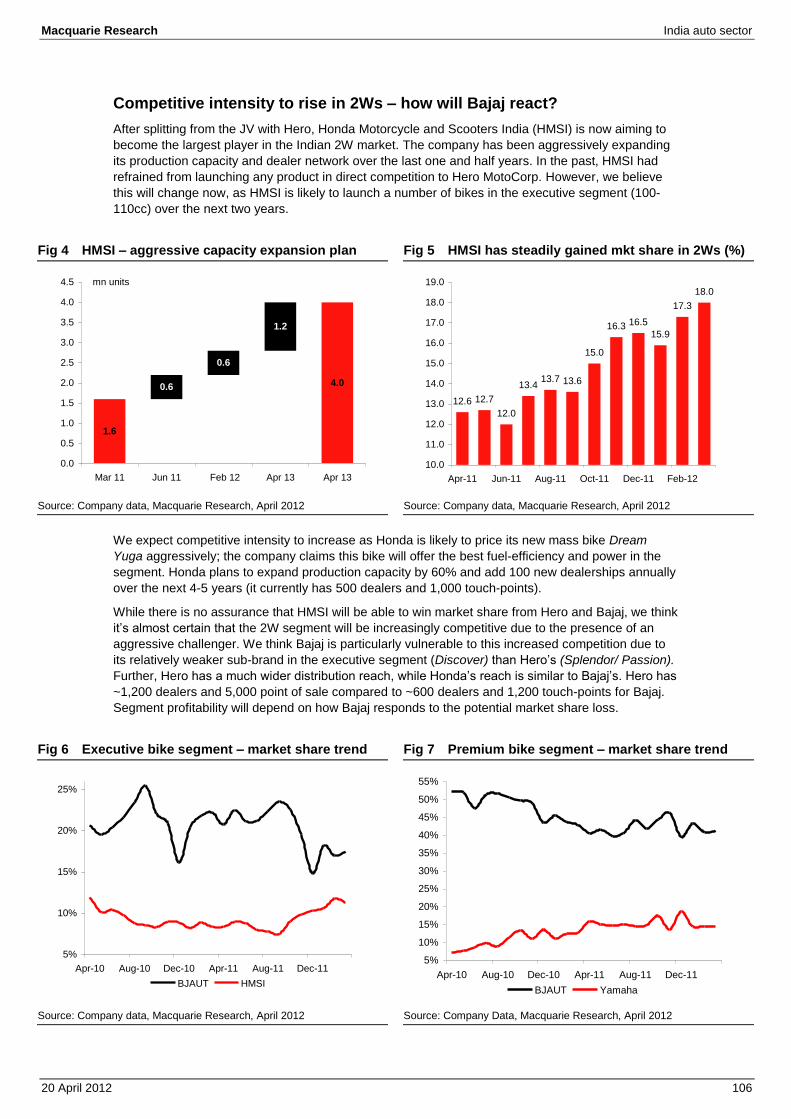
Macquarie Research India auto sector
20 April 2012 106
Competitive intensity to rise in 2Ws – how will Bajaj react? After splitting from the JV with Hero, Honda Motorcycle and Scooters India (HMSI) is now aiming to
become the largest player in the Indian 2W market. The company has been aggressively expanding
its production capacity and dealer network over the last one and half years. In the past, HMSI had
refrained from launching any product in direct competition to Hero MotoCorp. However, we believe
this will change now, as HMSI is likely to launch a number of bikes in the executive segment (100-
110cc) over the next two years.
Fig 4 HMSI – aggressive capacity expansion plan Fig 5 HMSI has steadily gained mkt share in 2Ws (%)
Source: Company data, Macquarie Research, April 2012 Source: Company data, Macquarie Research, April 2012
We expect competitive intensity to increase as Honda is likely to price its new mass bike Dream Yuga aggressively; the company claims this bike will offer the best fuel-efficiency and power in the
segment. Honda plans to expand production capacity by 60% and add 100 new dealerships annually
over the next 4-5 years (it currently has 500 dealers and 1,000 touch-points).
While there is no assurance that HMSI will be able to win market share from Hero and Bajaj, we think
it’s almost certain that the 2W segment will be increasingly competitive due to the presence of an
aggressive challenger. We think Bajaj is particularly vulnerable to this increased competition due to
its relatively weaker sub-brand in the executive segment (Discover) than Hero’s (Splendor/ Passion). Further, Hero has a much wider distribution reach, while Honda’s reach is similar to Bajaj’s. Hero has
~1,200 dealers and 5,000 point of sale compared to ~600 dealers and 1,200 touch-points for Bajaj.
Segment profitability will depend on how Bajaj responds to the potential market share loss.
Fig 6 Executive bike segment – market share trend Fig 7 Premium bike segment – market share trend
Source: Company data, Macquarie Research, April 2012 Source: Company Data, Macquarie Research, April 2012
1.6
4.00.6
0.6
1.2
0.0
0.5
1.0
1.5
2.0
2.5
3.0
3.5
4.0
4.5
Mar 11 Jun 11 Feb 12 Apr 13 Apr 13
mn units
12.6 12.7
12.0
13.413.7 13.6
15.0
16.3 16.5
15.9
17.3
18.0
10.0
11.0
12.0
13.0
14.0
15.0
16.0
17.0
18.0
19.0
Apr-11 Jun-11 Aug-11 Oct-11 Dec-11 Feb-12
5%
10%
15%
20%
25%
Apr-10 Aug-10 Dec-10 Apr-11 Aug-11 Dec-11
BJAUT HMSI
5%
10%
15%
20%
25%
30%
35%
40%
45%
50%
55%
Apr-10 Aug-10 Dec-10 Apr-11 Aug-11 Dec-11
BJAUT Yamaha

Macquarie Research India auto sector
20 April 2012 107
Bajaj has been losing market share for the last one year to Hero in the executive segment and to
Yamaha in the premium bike segment. Bajaj’s attempt to boost Discover sales through ad campaigns
targeting Hero’s Splendor and Passion should be seen in this context. However, despite an aggressive
ad campaign, Discover sales declined 18% YoY in February 2012, while Hero’s sales grew 10% YoY in
this segment. In March 2012, Discover sales declined 25% YoY, while Hero was flat.
Fig 8 Despite aggressive advertising – Discover sales declined 25% in March 2012
Source: Bloomberg, Macquarie Research, April 2012
In fact, the bigger concern for Bajaj has been that the company’s most recent two launches –
Discover 125 and Boxer 150 – have been disappointing. While Discover 125 cannibalised the
Discover M and Discover 150 sales, sales of the much-hyped Boxer 150, aimed at the rural market
fell far short of the company’s expectation. We believe the market has high hopes for Bajaj’s
upcoming new launches – Pulsar 200NS and a new commuter bike (likely the next-generation
Discover 125). We don’t think these two bikes will be enough to stem the market share loss trend for
Bajaj. Pulsar 200NS is likely to be priced closer to Rs100k and is unlikely to be a big volume
generator. We think the new commuter bike is likely to be launched at the same time as the planned
launch of Honda’s commuter bike Dream Yuga.
HMSI well-positioned to succeed in motorcycle segment Since splitting from the JV with Hero, Honda has been preparing for a much larger play in the Indian
two-wheeler market. We expect Honda to be aggressive in the executive motorcycle segment, which
accounts for the largest proportion of 2Ws sold in the country. Over the last year, HMSI has
strengthened its business in all the areas where it was constrained earlier – production capacity,
dealer network and mass-segment product.
At a press conference, President and CEO of HMSI clearly highlighted the company’s intent:
“Our target is to be number one in India in the next decade,” “expansion of production capacity and entering mass market would be the first steps to do that,” “We have not been able to enter mass motorcycle market with a lower-priced product. Entering this market is a first priority for us,” “We will do whatever it takes to get closer to Hero. Whether it's a third or a fourth plant, we'll do it.”
Market underestimating HMSI’s capabilities and intent
We believe the market is underestimating HMSI’s potential in the motorcycle segment. Some of
scepticism is partly because very few of the global auto majors have been able to deliver on their
stated volumes or market share goals. However, we believe Honda should be taken more seriously,
as it is already the 2nd
largest player in the 2W segment and has good understanding of the Indian
market, given its association with Hero for ~30 years. As Honda is already #2 (with ~20% market
share), its aim to become #1 by 2020 should not be taken lightly.
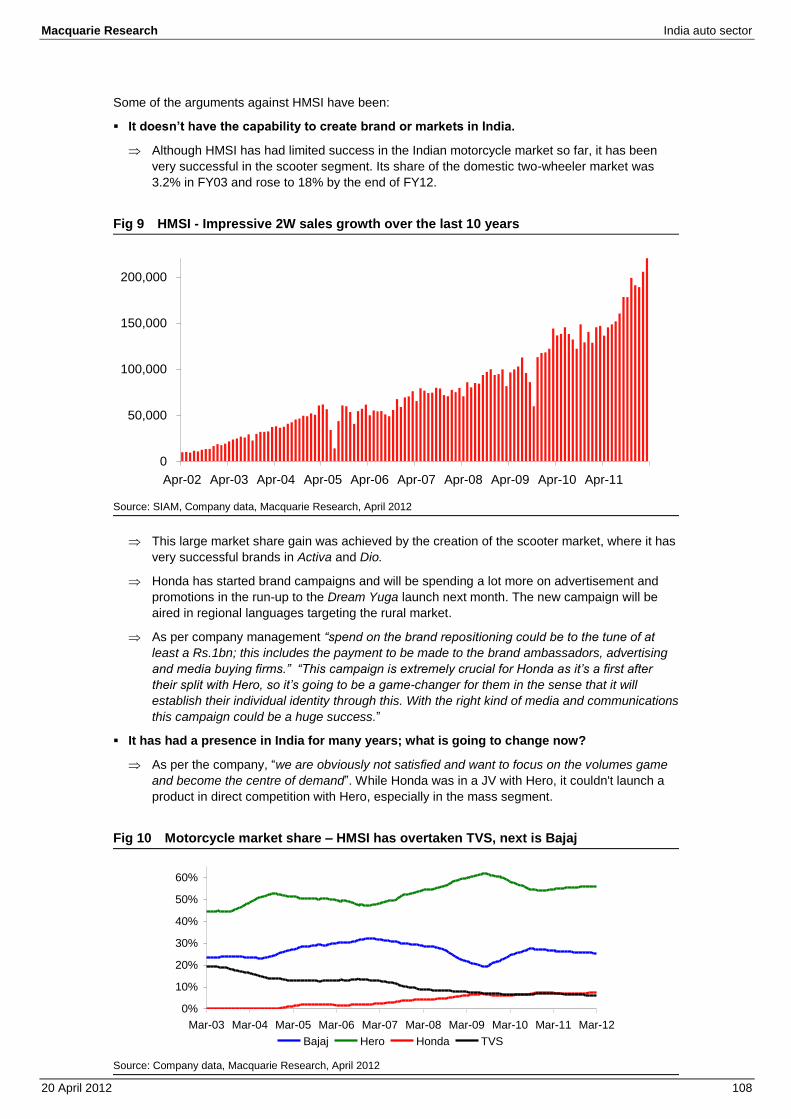
Macquarie Research India auto sector
20 April 2012 108
Some of the arguments against HMSI have been:
It doesn’t have the capability to create brand or markets in India.
Although HMSI has had limited success in the Indian motorcycle market so far, it has been
very successful in the scooter segment. Its share of the domestic two-wheeler market was
3.2% in FY03 and rose to 18% by the end of FY12.
Fig 9 HMSI - Impressive 2W sales growth over the last 10 years
Source: SIAM, Company data, Macquarie Research, April 2012
This large market share gain was achieved by the creation of the scooter market, where it has
very successful brands in Activa and Dio.
Honda has started brand campaigns and will be spending a lot more on advertisement and
promotions in the run-up to the Dream Yuga launch next month. The new campaign will be
aired in regional languages targeting the rural market.
As per company management “spend on the brand repositioning could be to the tune of at
least a Rs.1bn; this includes the payment to be made to the brand ambassadors, advertising and media buying firms.” “This campaign is extremely crucial for Honda as it’s a first after
their split with Hero, so it’s going to be a game-changer for them in the sense that it will establish their individual identity through this. With the right kind of media and communications this campaign could be a huge success.”
It has had a presence in India for many years; what is going to change now?
As per the company, “we are obviously not satisfied and want to focus on the volumes game and become the centre of demand”. While Honda was in a JV with Hero, it couldn't launch a
product in direct competition with Hero, especially in the mass segment.
Fig 10 Motorcycle market share – HMSI has overtaken TVS, next is Bajaj
Source: Company data, Macquarie Research, April 2012
0
50,000
100,000
150,000
200,000
Apr-02 Apr-03 Apr-04 Apr-05 Apr-06 Apr-07 Apr-08 Apr-09 Apr-10 Apr-11
0%
10%
20%
30%
40%
50%
60%
Mar-03 Mar-04 Mar-05 Mar-06 Mar-07 Mar-08 Mar-09 Mar-10 Mar-11 Mar-12
Bajaj Hero Honda TVS
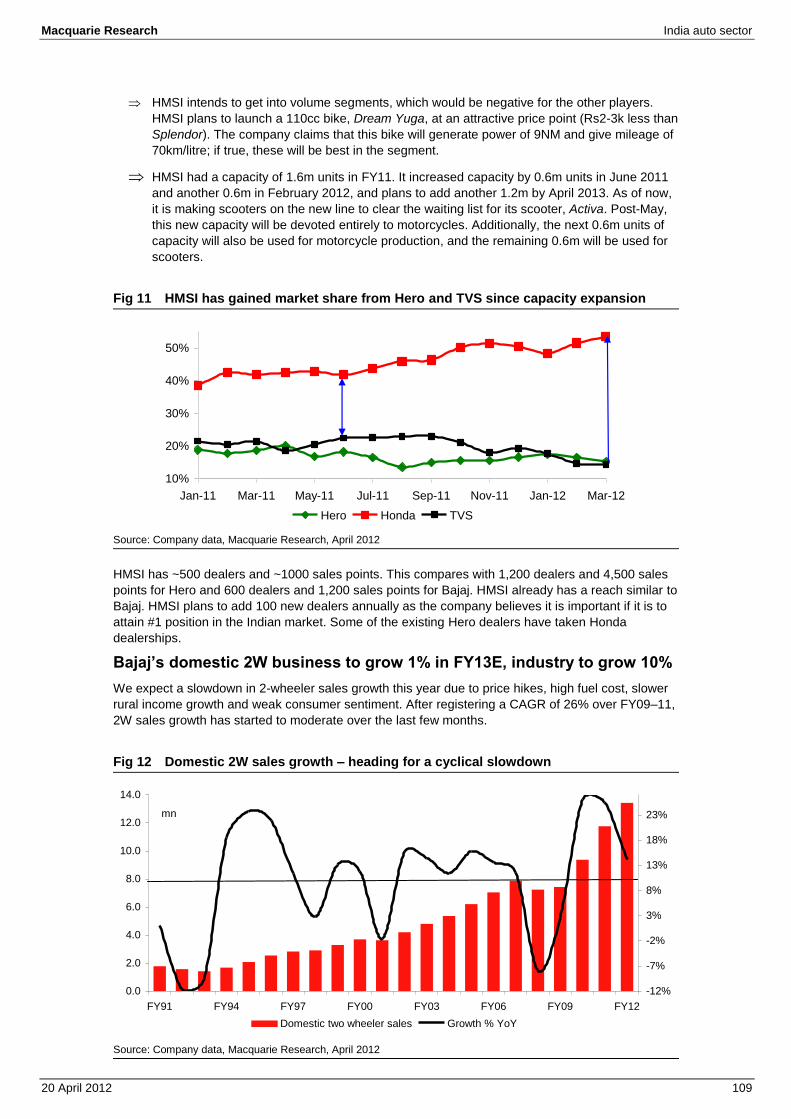
Macquarie Research India auto sector
20 April 2012 109
HMSI intends to get into volume segments, which would be negative for the other players.
HMSI plans to launch a 110cc bike, Dream Yuga, at an attractive price point (Rs2-3k less than
Splendor). The company claims that this bike will generate power of 9NM and give mileage of
70km/litre; if true, these will be best in the segment.
HMSI had a capacity of 1.6m units in FY11. It increased capacity by 0.6m units in June 2011
and another 0.6m in February 2012, and plans to add another 1.2m by April 2013. As of now,
it is making scooters on the new line to clear the waiting list for its scooter, Activa. Post-May,
this new capacity will be devoted entirely to motorcycles. Additionally, the next 0.6m units of
capacity will also be used for motorcycle production, and the remaining 0.6m will be used for
scooters.
Fig 11 HMSI has gained market share from Hero and TVS since capacity expansion
Source: Company data, Macquarie Research, April 2012
HMSI has ~500 dealers and ~1000 sales points. This compares with 1,200 dealers and 4,500 sales
points for Hero and 600 dealers and 1,200 sales points for Bajaj. HMSI already has a reach similar to
Bajaj. HMSI plans to add 100 new dealers annually as the company believes it is important if it is to
attain #1 position in the Indian market. Some of the existing Hero dealers have taken Honda
dealerships.
Bajaj’s domestic 2W business to grow 1% in FY13E, industry to grow 10% We expect a slowdown in 2-wheeler sales growth this year due to price hikes, high fuel cost, slower
rural income growth and weak consumer sentiment. After registering a CAGR of 26% over FY09–11,
2W sales growth has started to moderate over the last few months.
Fig 12 Domestic 2W sales growth – heading for a cyclical slowdown
Source: Company data, Macquarie Research, April 2012
10%
20%
30%
40%
50%
Jan-11 Mar-11 May-11 Jul-11 Sep-11 Nov-11 Jan-12 Mar-12
Hero Honda TVS
0.0
2.0
4.0
6.0
8.0
10.0
12.0
14.0
FY91 FY94 FY97 FY00 FY03 FY06 FY09 FY12
-12%
-7%
-2%
3%
8%
13%
18%
23%
Domestic two wheeler sales Growth % YoY
mn
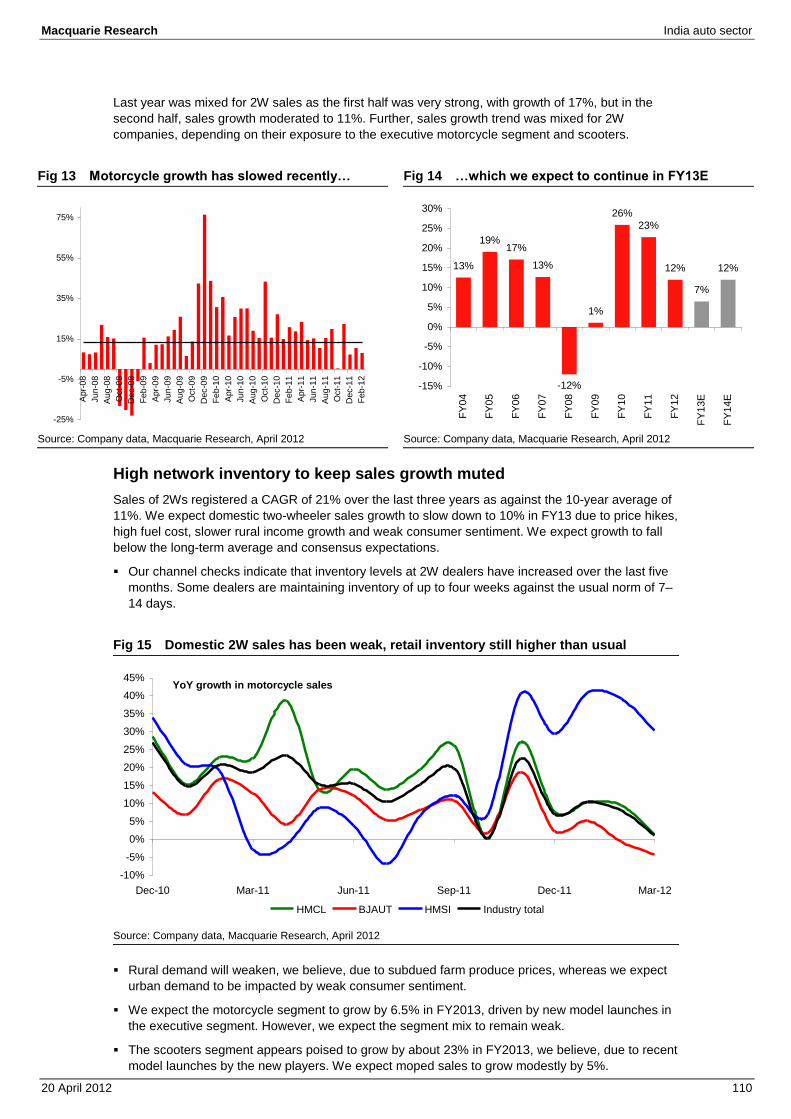
Macquarie Research India auto sector
20 April 2012 110
Last year was mixed for 2W sales as the first half was very strong, with growth of 17%, but in the
second half, sales growth moderated to 11%. Further, sales growth trend was mixed for 2W
companies, depending on their exposure to the executive motorcycle segment and scooters.
Fig 13 Motorcycle growth has slowed recently… Fig 14 …which we expect to continue in FY13E
Source: Company data, Macquarie Research, April 2012 Source: Company data, Macquarie Research, April 2012
High network inventory to keep sales growth muted Sales of 2Ws registered a CAGR of 21% over the last three years as against the 10-year average of
11%. We expect domestic two-wheeler sales growth to slow down to 10% in FY13 due to price hikes,
high fuel cost, slower rural income growth and weak consumer sentiment. We expect growth to fall
below the long-term average and consensus expectations.
Our channel checks indicate that inventory levels at 2W dealers have increased over the last five
months. Some dealers are maintaining inventory of up to four weeks against the usual norm of 7–
14 days.
Fig 15 Domestic 2W sales has been weak, retail inventory still higher than usual
Source: Company data, Macquarie Research, April 2012
Rural demand will weaken, we believe, due to subdued farm produce prices, whereas we expect
urban demand to be impacted by weak consumer sentiment.
We expect the motorcycle segment to grow by 6.5% in FY2013, driven by new model launches in
the executive segment. However, we expect the segment mix to remain weak.
The scooters segment appears poised to grow by about 23% in FY2013, we believe, due to recent
model launches by the new players. We expect moped sales to grow modestly by 5%.
-25%
-5%
15%
35%
55%
75%
Apr-
08
Jun-0
8
Aug-0
8
Oct-
08
De
c-0
8
Feb-0
9
Apr-
09
Jun-0
9
Aug-0
9
Oct-
09
De
c-0
9
Feb-1
0
Apr-
10
Jun-1
0
Aug-1
0
Oct-
10
De
c-1
0
Feb-1
1
Apr-
11
Jun-1
1
Aug-1
1
Oct-
11
De
c-1
1
Feb-1
2
13%
19%17%
13%
-12%
1%
26%
23%
12%
7%
12%
-15%
-10%
-5%
0%
5%
10%
15%
20%
25%
30%
FY
04
FY
05
FY
06
FY
07
FY
08
FY
09
FY
10
FY
11
FY
12
FY
13E
FY
14E
-10%
-5%
0%
5%
10%
15%
20%
25%
30%
35%
40%
45%
Dec-10 Mar-11 Jun-11 Sep-11 Dec-11 Mar-12
HMCL BJAUT HMSI Industry total
YoY growth in motorcycle sales
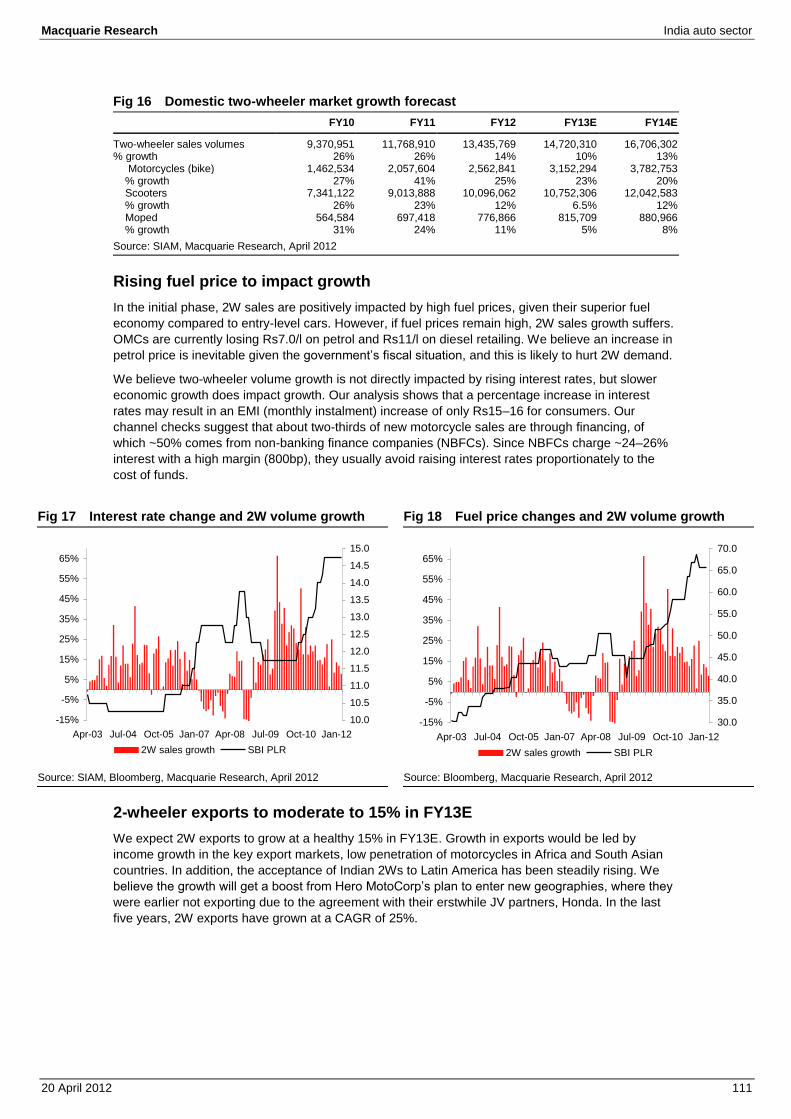
Macquarie Research India auto sector
20 April 2012 111
Fig 16 Domestic two-wheeler market growth forecast FY10 FY11 FY12 FY13E FY14E
Two-wheeler sales volumes 9,370,951 11,768,910 13,435,769 14,720,310 16,706,302 % growth 26% 26% 14% 10% 13% Motorcycles (bike) 1,462,534 2,057,604 2,562,841 3,152,294 3,782,753 % growth 27% 41% 25% 23% 20% Scooters 7,341,122 9,013,888 10,096,062 10,752,306 12,042,583 % growth 26% 23% 12% 6.5% 12% Moped 564,584 697,418 776,866 815,709 880,966 % growth 31% 24% 11% 5% 8%
Source: SIAM, Macquarie Research, April 2012
Rising fuel price to impact growth In the initial phase, 2W sales are positively impacted by high fuel prices, given their superior fuel
economy compared to entry-level cars. However, if fuel prices remain high, 2W sales growth suffers.
OMCs are currently losing Rs7.0/l on petrol and Rs11/l on diesel retailing. We believe an increase in
petrol price is inevitable given the government’s fiscal situation, and this is likely to hurt 2W demand.
We believe two-wheeler volume growth is not directly impacted by rising interest rates, but slower
economic growth does impact growth. Our analysis shows that a percentage increase in interest
rates may result in an EMI (monthly instalment) increase of only Rs15–16 for consumers. Our
channel checks suggest that about two-thirds of new motorcycle sales are through financing, of
which ~50% comes from non-banking finance companies (NBFCs). Since NBFCs charge ~24–26%
interest with a high margin (800bp), they usually avoid raising interest rates proportionately to the
cost of funds.
Fig 17 Interest rate change and 2W volume growth Fig 18 Fuel price changes and 2W volume growth
Source: SIAM, Bloomberg, Macquarie Research, April 2012 Source: Bloomberg, Macquarie Research, April 2012
2-wheeler exports to moderate to 15% in FY13E We expect 2W exports to grow at a healthy 15% in FY13E. Growth in exports would be led by
income growth in the key export markets, low penetration of motorcycles in Africa and South Asian
countries. In addition, the acceptance of Indian 2Ws to Latin America has been steadily rising. We
believe the growth will get a boost from Hero MotoCorp’s plan to enter new geographies, where they
were earlier not exporting due to the agreement with their erstwhile JV partners, Honda. In the last
five years, 2W exports have grown at a CAGR of 25%.
-15%
-5%
5%
15%
25%
35%
45%
55%
65%
Apr-03 Jul-04 Oct-05 Jan-07 Apr-08 Jul-09 Oct-10 Jan-12
10.0
10.5
11.0
11.5
12.0
12.5
13.0
13.5
14.0
14.5
15.0
2W sales growth SBI PLR
-15%
-5%
5%
15%
25%
35%
45%
55%
65%
Apr-03 Jul-04 Oct-05 Jan-07 Apr-08 Jul-09 Oct-10 Jan-12
30.0
35.0
40.0
45.0
50.0
55.0
60.0
65.0
70.0
2W sales growth SBI PLR
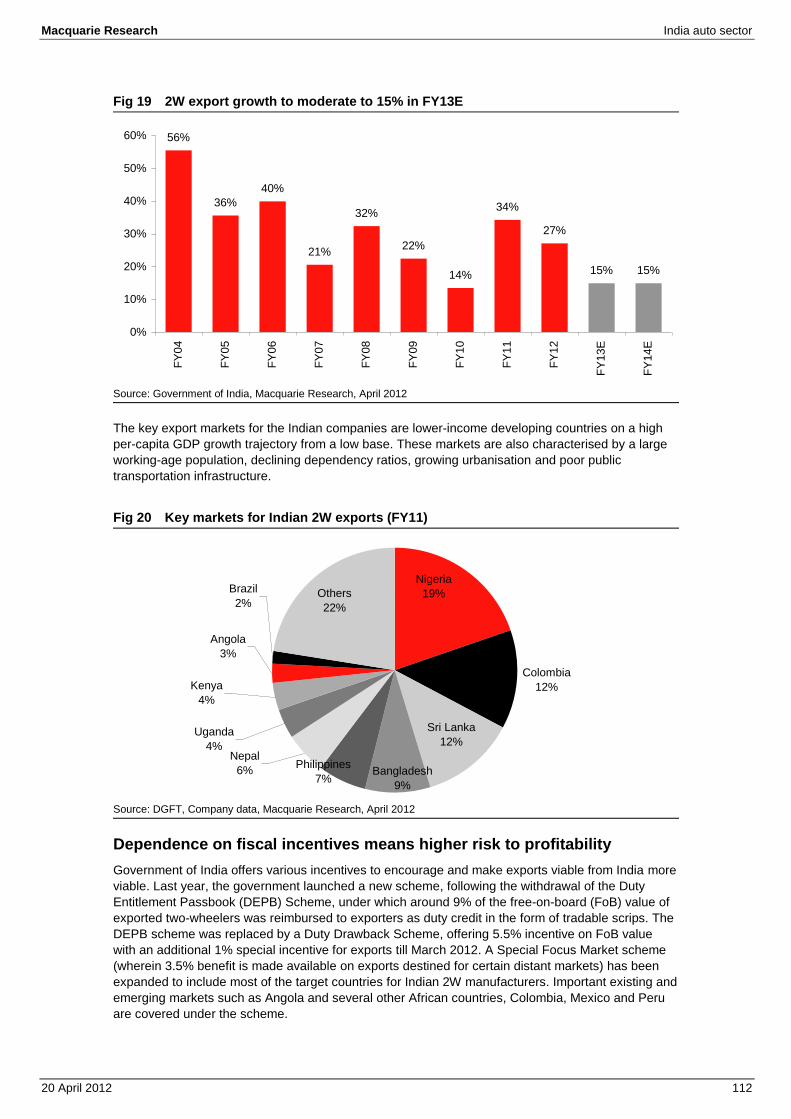
Macquarie Research India auto sector
20 April 2012 112
Fig 19 2W export growth to moderate to 15% in FY13E
Source: Government of India, Macquarie Research, April 2012
The key export markets for the Indian companies are lower-income developing countries on a high
per-capita GDP growth trajectory from a low base. These markets are also characterised by a large
working-age population, declining dependency ratios, growing urbanisation and poor public
transportation infrastructure.
Fig 20 Key markets for Indian 2W exports (FY11)
Source: DGFT, Company data, Macquarie Research, April 2012
Dependence on fiscal incentives means higher risk to profitability Government of India offers various incentives to encourage and make exports viable from India more
viable. Last year, the government launched a new scheme, following the withdrawal of the Duty
Entitlement Passbook (DEPB) Scheme, under which around 9% of the free-on-board (FoB) value of
exported two-wheelers was reimbursed to exporters as duty credit in the form of tradable scrips. The
DEPB scheme was replaced by a Duty Drawback Scheme, offering 5.5% incentive on FoB value
with an additional 1% special incentive for exports till March 2012. A Special Focus Market scheme
(wherein 3.5% benefit is made available on exports destined for certain distant markets) has been
expanded to include most of the target countries for Indian 2W manufacturers. Important existing and
emerging markets such as Angola and several other African countries, Colombia, Mexico and Peru
are covered under the scheme.
56%
36%
40%
21%
32%
22%
14%
34%
27%
15% 15%
0%
10%
20%
30%
40%
50%
60%
FY
04
FY
05
FY
06
FY
07
FY
08
FY
09
FY
10
FY
11
FY
12
FY
13E
FY
14E
Colombia
12%
Bangladesh
9%
Philippines
7%
Nepal
6%
Uganda
4%
Kenya
4%
Angola
3%
Brazil
2%
Sri Lanka
12%
Others
22%
Nigeria
19%
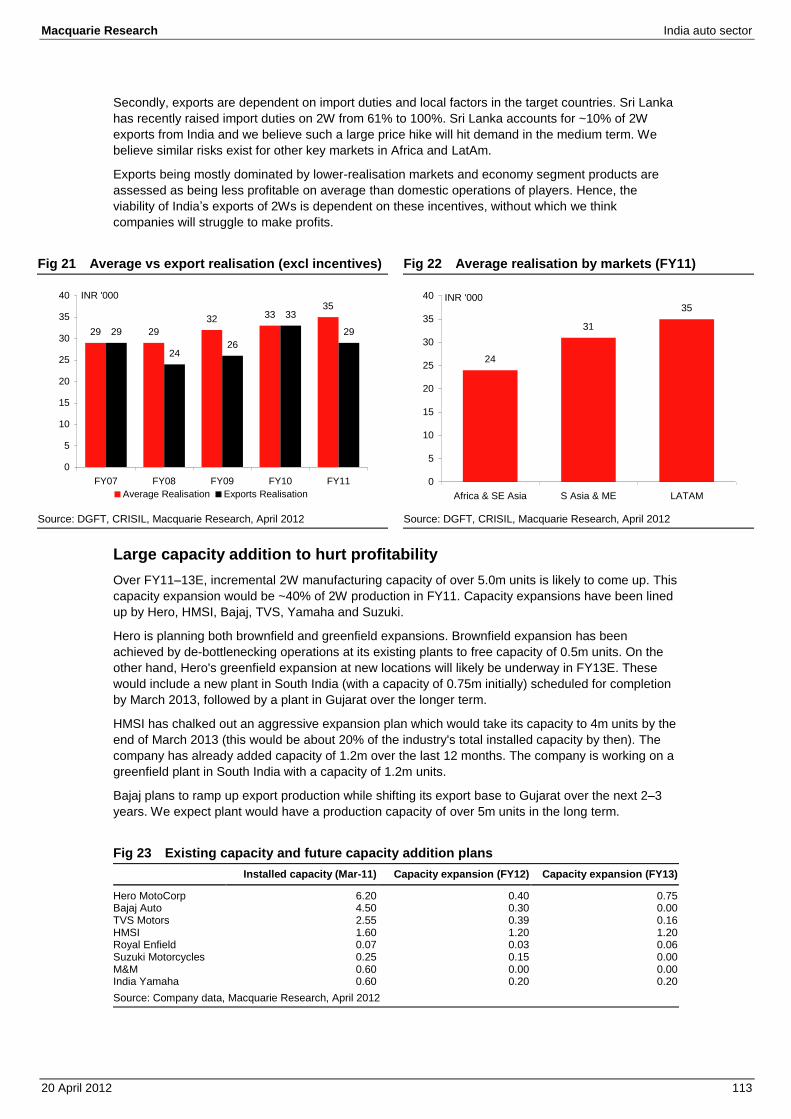
Macquarie Research India auto sector
20 April 2012 113
Secondly, exports are dependent on import duties and local factors in the target countries. Sri Lanka
has recently raised import duties on 2W from 61% to 100%. Sri Lanka accounts for ~10% of 2W
exports from India and we believe such a large price hike will hit demand in the medium term. We
believe similar risks exist for other key markets in Africa and LatAm.
Exports being mostly dominated by lower-realisation markets and economy segment products are
assessed as being less profitable on average than domestic operations of players. Hence, the
viability of India’s exports of 2Ws is dependent on these incentives, without which we think
companies will struggle to make profits.
Fig 21 Average vs export realisation (excl incentives) Fig 22 Average realisation by markets (FY11)
Source: DGFT, CRISIL, Macquarie Research, April 2012 Source: DGFT, CRISIL, Macquarie Research, April 2012
Large capacity addition to hurt profitability Over FY11–13E, incremental 2W manufacturing capacity of over 5.0m units is likely to come up. This
capacity expansion would be ~40% of 2W production in FY11. Capacity expansions have been lined
up by Hero, HMSI, Bajaj, TVS, Yamaha and Suzuki.
Hero is planning both brownfield and greenfield expansions. Brownfield expansion has been
achieved by de-bottlenecking operations at its existing plants to free capacity of 0.5m units. On the
other hand, Hero's greenfield expansion at new locations will likely be underway in FY13E. These
would include a new plant in South India (with a capacity of 0.75m initially) scheduled for completion
by March 2013, followed by a plant in Gujarat over the longer term.
HMSI has chalked out an aggressive expansion plan which would take its capacity to 4m units by the
end of March 2013 (this would be about 20% of the industry's total installed capacity by then). The
company has already added capacity of 1.2m over the last 12 months. The company is working on a
greenfield plant in South India with a capacity of 1.2m units.
Bajaj plans to ramp up export production while shifting its export base to Gujarat over the next 2–3
years. We expect plant would have a production capacity of over 5m units in the long term.
Fig 23 Existing capacity and future capacity addition plans Installed capacity (Mar-11) Capacity expansion (FY12) Capacity expansion (FY13)
Hero MotoCorp 6.20 0.40 0.75 Bajaj Auto 4.50 0.30 0.00 TVS Motors 2.55 0.39 0.16 HMSI 1.60 1.20 1.20 Royal Enfield 0.07 0.03 0.06 Suzuki Motorcycles 0.25 0.15 0.00 M&M 0.60 0.00 0.00 India Yamaha 0.60 0.20 0.20
Source: Company data, Macquarie Research, April 2012
29 29
32 3335
29
2426
33
29
0
5
10
15
20
25
30
35
40
FY07 FY08 FY09 FY10 FY11
INR '000
Average Realisation Exports Realisation
24
31
35
0
5
10
15
20
25
30
35
40
Africa & SE Asia S Asia & ME LATAM
INR '000
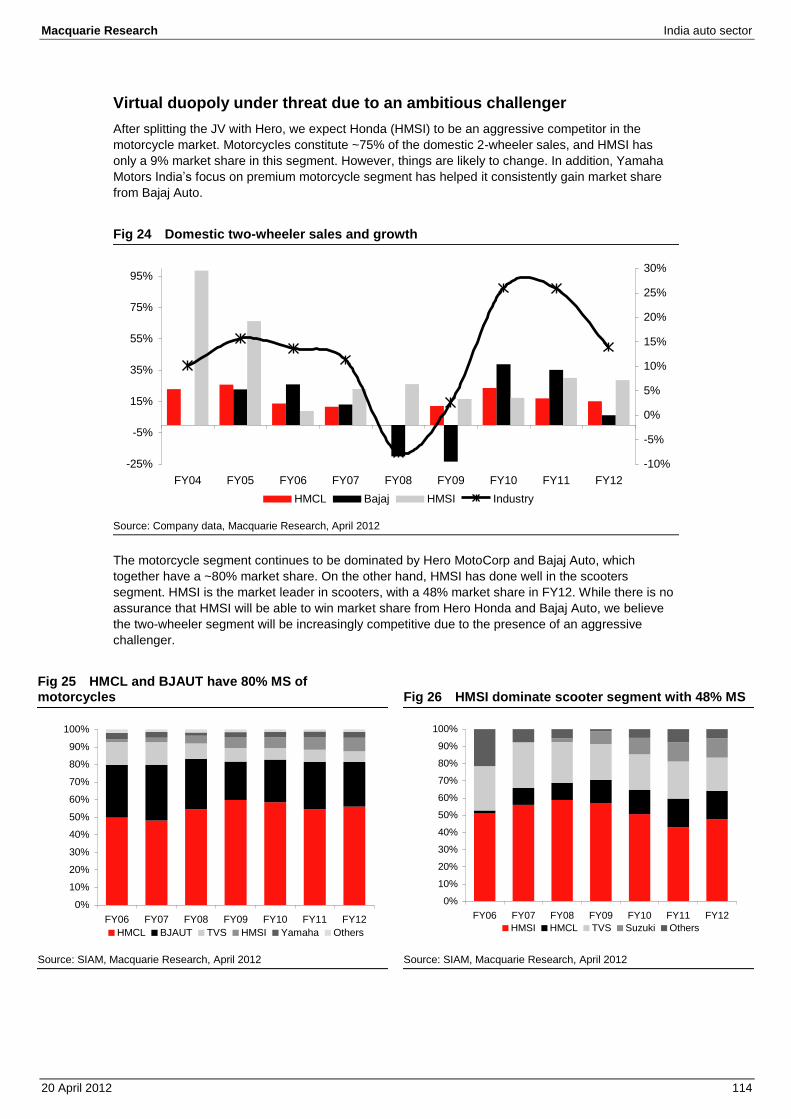
Macquarie Research India auto sector
20 April 2012 114
Virtual duopoly under threat due to an ambitious challenger After splitting the JV with Hero, we expect Honda (HMSI) to be an aggressive competitor in the
motorcycle market. Motorcycles constitute ~75% of the domestic 2-wheeler sales, and HMSI has
only a 9% market share in this segment. However, things are likely to change. In addition, Yamaha
Motors India’s focus on premium motorcycle segment has helped it consistently gain market share
from Bajaj Auto.
Fig 24 Domestic two-wheeler sales and growth
Source: Company data, Macquarie Research, April 2012
The motorcycle segment continues to be dominated by Hero MotoCorp and Bajaj Auto, which
together have a ~80% market share. On the other hand, HMSI has done well in the scooters
segment. HMSI is the market leader in scooters, with a 48% market share in FY12. While there is no
assurance that HMSI will be able to win market share from Hero Honda and Bajaj Auto, we believe
the two-wheeler segment will be increasingly competitive due to the presence of an aggressive
challenger.
Fig 25 HMCL and BJAUT have 80% MS of motorcycles
Fig 26 HMSI dominate scooter segment with 48% MS
Source: SIAM, Macquarie Research, April 2012 Source: SIAM, Macquarie Research, April 2012
-25%
-5%
15%
35%
55%
75%
95%
FY04 FY05 FY06 FY07 FY08 FY09 FY10 FY11 FY12
-10%
-5%
0%
5%
10%
15%
20%
25%
30%
HMCL Bajaj HMSI Industry
0%
10%
20%
30%
40%
50%
60%
70%
80%
90%
100%
FY06 FY07 FY08 FY09 FY10 FY11 FY12
HMCL BJAUT TVS HMSI Yamaha Others
0%
10%
20%
30%
40%
50%
60%
70%
80%
90%
100%
FY06 FY07 FY08 FY09 FY10 FY11 FY12
HMSI HMCL TVS Suzuki Others
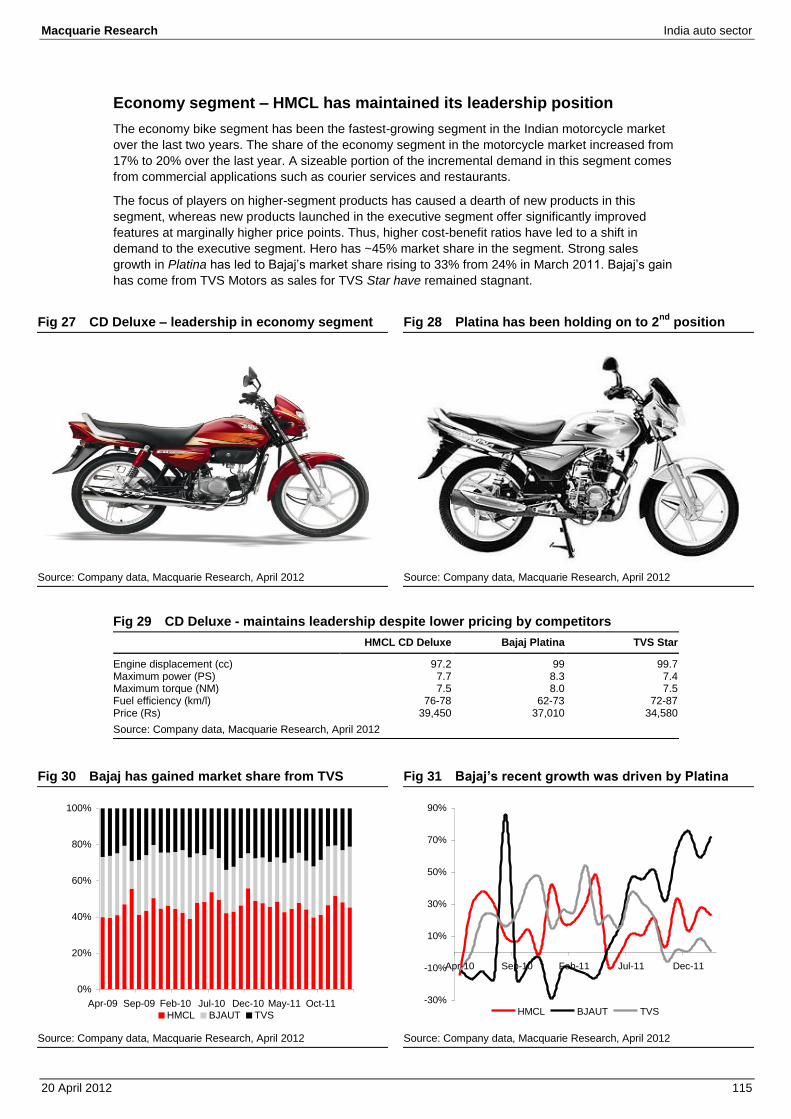
Macquarie Research India auto sector
20 April 2012 115
Economy segment – HMCL has maintained its leadership position The economy bike segment has been the fastest-growing segment in the Indian motorcycle market
over the last two years. The share of the economy segment in the motorcycle market increased from
17% to 20% over the last year. A sizeable portion of the incremental demand in this segment comes
from commercial applications such as courier services and restaurants.
The focus of players on higher-segment products has caused a dearth of new products in this
segment, whereas new products launched in the executive segment offer significantly improved
features at marginally higher price points. Thus, higher cost-benefit ratios have led to a shift in
demand to the executive segment. Hero has ~45% market share in the segment. Strong sales
growth in Platina has led to Bajaj’s market share rising to 33% from 24% in March 2011. Bajaj’s gain
has come from TVS Motors as sales for TVS Star have remained stagnant.
Fig 27 CD Deluxe – leadership in economy segment Fig 28 Platina has been holding on to 2nd position
Source: Company data, Macquarie Research, April 2012 Source: Company data, Macquarie Research, April 2012
Fig 29 CD Deluxe - maintains leadership despite lower pricing by competitors HMCL CD Deluxe Bajaj Platina TVS Star
Engine displacement (cc) 97.2 99 99.7 Maximum power (PS) 7.7 8.3 7.4 Maximum torque (NM) 7.5 8.0 7.5 Fuel efficiency (km/l) 76-78 62-73 72-87 Price (Rs) 39,450 37,010 34,580
Source: Company data, Macquarie Research, April 2012
Fig 30 Bajaj has gained market share from TVS Fig 31 Bajaj’s recent growth was driven by Platina
Source: Company data, Macquarie Research, April 2012 Source: Company data, Macquarie Research, April 2012
0%
20%
40%
60%
80%
100%
Apr-09 Sep-09 Feb-10 Jul-10 Dec-10 May-11 Oct-11
HMCL BJAUT TVS
-30%
-10%
10%
30%
50%
70%
90%
Apr-10 Sep-10 Feb-11 Jul-11 Dec-11
HMCL BJAUT TVS
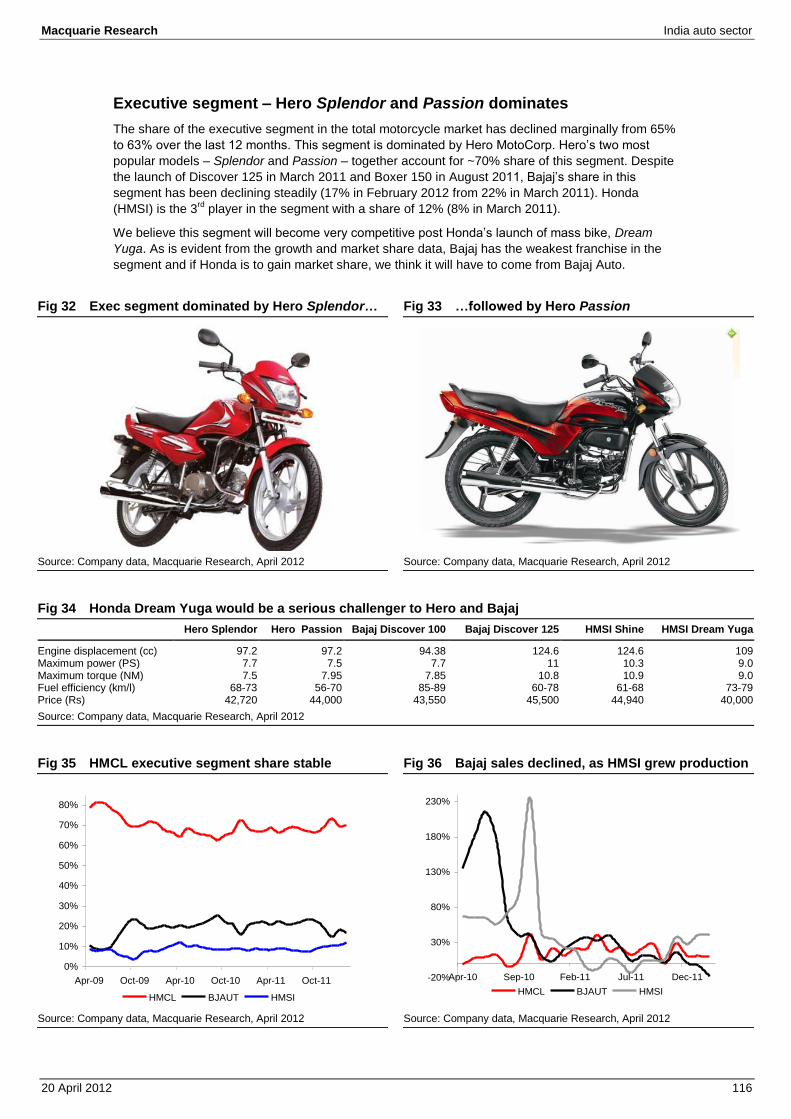
Macquarie Research India auto sector
20 April 2012 116
Executive segment – Hero Splendor and Passion dominates The share of the executive segment in the total motorcycle market has declined marginally from 65%
to 63% over the last 12 months. This segment is dominated by Hero MotoCorp. Hero’s two most
popular models – Splendor and Passion – together account for ~70% share of this segment. Despite
the launch of Discover 125 in March 2011 and Boxer 150 in August 2011, Bajaj’s share in this
segment has been declining steadily (17% in February 2012 from 22% in March 2011). Honda
(HMSI) is the 3rd
player in the segment with a share of 12% (8% in March 2011).
We believe this segment will become very competitive post Honda’s launch of mass bike, Dream Yuga. As is evident from the growth and market share data, Bajaj has the weakest franchise in the
segment and if Honda is to gain market share, we think it will have to come from Bajaj Auto.
Fig 32 Exec segment dominated by Hero Splendor… Fig 33 …followed by Hero Passion
Source: Company data, Macquarie Research, April 2012 Source: Company data, Macquarie Research, April 2012
Fig 34 Honda Dream Yuga would be a serious challenger to Hero and Bajaj Hero Splendor Hero Passion Bajaj Discover 100 Bajaj Discover 125 HMSI Shine HMSI Dream Yuga
Engine displacement (cc) 97.2 97.2 94.38 124.6 124.6 109 Maximum power (PS) 7.7 7.5 7.7 11 10.3 9.0 Maximum torque (NM) 7.5 7.95 7.85 10.8 10.9 9.0 Fuel efficiency (km/l) 68-73 56-70 85-89 60-78 61-68 73-79 Price (Rs) 42,720 44,000 43,550 45,500 44,940 40,000
Source: Company data, Macquarie Research, April 2012
Fig 35 HMCL executive segment share stable Fig 36 Bajaj sales declined, as HMSI grew production
Source: Company data, Macquarie Research, April 2012 Source: Company data, Macquarie Research, April 2012
0%
10%
20%
30%
40%
50%
60%
70%
80%
Apr-09 Oct-09 Apr-10 Oct-10 Apr-11 Oct-11
HMCL BJAUT HMSI
-20%
30%
80%
130%
180%
230%
Apr-10 Sep-10 Feb-11 Jul-11 Dec-11
HMCL BJAUT HMSI
Macquarie Research India auto sector
20 April 2012 117
Premium Segment – Bajaj Auto losing share to Yamaha The share of the premium segment in the total motorcycle market has remained stable at ~17% over
the last 12 months. This segment is dominated by Bajaj Auto. Bajaj’s most popular model, Pulsar, accounts for ~42% share of this segment. Hero has a market share of 20% in the segment, down
from 23% in March 2011. Yamaha is the third player in this segment. The company has been
focusing on this segment and has a share of 15%. We expect Yamaha and Honda to challenge Bajaj
in this segment as technology becomes increasingly more important.
Fig 37 IYM SZ has gained 5% share since Sep 2010 Fig 38 Bajaj Pulsar has lost 10% share since Sep 2010
Source: Company data, Macquarie Research, April 2012 Source: Company data, Macquarie Research, April 2012
Fig 39 Yamaha SZ stands out because of aggressive pricing Yamaha SZ Yamaha FZ16 Yamaha Fazer Bajaj Pulsar 150 HMCL CBZ 150 Honda Unicorn
Engine displacement (cc) 153 153 153 149 149.2 149.1 Maximum power (PS) 12.1/7,500 14.0/7,500 14.0/7,500 15.06/9,000 14.4/8,500 13.5/8,000 Maximum torque (NM) 12.8/4,500 13.6/6,000 13.6/6,000 12.76/6,500 12.80/6,500 12.75/5,500 Fuel efficiency (km/l) 52.9-61.2 46.4-53.2 46.4-53.2 56.5-65.0 56.0-61.2 57.0-68.0 Price (Rs) 49,550 65,230 72,560 63,630 62,220 60,810
Source: Company data, Macquarie Research, April 2012
Fig 40 Bajaj’s premium segment share on a decline Fig 41 Volume growth in premium segment
Source: Company data, Macquarie Research, April 2012 Source: Company data, Macquarie Research, April 2012
30%
35%
40%
45%
50%
55%
Apr-09 Oct-09 Apr-10 Oct-10 Apr-11 Oct-11
-25%
25%
75%
125%
175%
225%
Apr-10 Aug-10 Dec-10 Apr-11 Aug-11 Dec-11
Bajaj Yamaha
Macquarie Research India auto sector
20 April 2012 118
Model mix has been unfavourable for Bajaj Auto Unit sales of Bajaj’s economy bike, Platina, grew 39% in FY12, but premium bike, Pulsar, declined
10%. The premium bike contributed 28% of Bajaj’s sales in FY12, as against 34% in FY11.
Moreover, Discover sales have also declined ~7% in the last six months. Sales of Bajaj’s recent bike
launches such as Boxer 150 and Discover 125 have fallen short of the company’s targets.
Fig 42 Segment wise market share of key players in the domestic motorcycle market Market share Mar-12 Feb-12 Jan-12 Dec-11 Nov-11 Oct-11 Sep-11 Aug-11 Jul-11 Jun-11 May-11 Apr-11 Mar-11
Economy Segment Hero Honda 44% 45% 47% 51% 46% 41% 39% 44% 47% 44% 42% 48% 45% Bajaj Auto 32% 33% 28% 27% 32% 30% 28% 27% 27% 28% 27% 24% 24% TVS Motors 21% 21% 23% 20% 21% 28% 31% 28% 24% 27% 30% 27% 29% Yamaha India 2% 2% 1% 2% 2% 2% 2% 1% 2% 1% 1% 1% 1% Executive Segment Hero Honda 70% 70% 70% 73% 69% 67% 67% 68% 69% 68% 66% 69% 67% Bajaj Auto 17% 17% 18% 15% 20% 23% 24% 22% 21% 21% 23% 21% 22% HMSI 11% 12% 11% 10% 10% 9% 8% 8% 8% 9% 9% 8% 8% TVS Motors 0% 0% 0% 0% 0% 0% 0% 0% 0% 0% 0% 0% 0% Yamaha India 1% 1% 1% 1% 1% 1% 1% 1% 1% 1% 1% 1% 1% Suzuki 0% 1% 1% 0% 0% 0% 1% 1% 1% 1% 1% 1% 1% Mahindra & Mahindra 0% 0% 0% 0% 0% 0% 0% 0% 0% 0% 0% 0% 0% Premium Segment Hero Honda 20% 20% 17% 18% 16% 16% 19% 20% 23% 23% 22% 19% 23% Bajaj Auto 41% 41% 43% 40% 46% 44% 42% 44% 41% 40% 42% 41% 43% HMSI 10% 9% 9% 11% 11% 9% 10% 8% 9% 10% 9% 10% 8% TVS Motors 8% 9% 10% 8% 7% 9% 9% 9% 8% 8% 8% 9% 9% Yamaha India 14% 15% 15% 19% 14% 18% 15% 15% 15% 15% 15% 16% 13% Suzuki 1% 1% 1% 1% 1% 0% 1% 0% 0% 0% 1% 0% 0% Royal Enfield 6% 5% 5% 4% 5% 4% 4% 4% 4% 4% 4% 5% 4%
Source: Company data, Macquarie Research, April 2012
Fig 43 Growth rates – premium segment growth has moderated, Pulsar sales declining since March 2011 Volume growth Mar-12 Feb-12 Jan-12 Dec-11 Nov-11 Oct-11 Sep-11 Aug-11 Jul-11 Jun-11 May-11 Apr-11 Mar-11
Economy Segment 20% 29% 29% 22% 33% 8% 29% 23% 24% 7% 2% 18% 19% Hero MotoCorp 18% 23% 28% 13% 33% 3% 21% 11% 11% -1% -9% 47% 30% Bajaj Auto 58% 72% 59% 76% 64% 32% 51% 46% 46% 17% 3% -15% -14% TVS Motors -13% 1% 8% 1% 2% -5% 22% 31% 37% 15% 23% 18% 54% Yamaha India 93% 13% 17% 3% 58% 17% 47% -16% -19% -22% 61% -12% -35% Executive Segment -4% 6% 9% 10% 24% -1% 19% 16% 6% 20% 22% 32% 19% Hero MotoCorp -1% 10% 11% 11% 29% 0% 28% 22% 12% 23% 18% 41% 20% Bajaj Auto -25% -18% -3% 1% 16% 1% 10% 11% 4% 24% 40% 33% 38% HMSI 29% 41% 41% 28% 37% 6% 4% 3% -13% 2% 7% -8% -6% TVS Motors -100% -100% -86% -100% -89% -93% -83% -83% -79% -72% -36% -81% -76% Yamaha India -14% 48% -10% 67% -11% -4% -7% -28% -62% -28% -6% -15% 15% Premium Segment 4% -3% -2% -14% 7% 0% 14% 6% 14% 8% 6% 0% 16% Hero MotoCorp -12% -20% -28% -33% -7% -7% 18% 10% 44% 28% 26% -4% 36% Bajaj Auto 0% -10% -7% -22% 1% -10% -6% -10% -10% -10% -15% -23% -4% HMSI 36% 33% 41% 37% 53% 9% 43% 21% 23% 15% 15% 38% 11% TVS Motors -7% -2% 3% -18% -9% 1% 24% 18% 0% -8% 5% 2% 37% Yamaha India 17% 12% 27% 19% 33% 31% 47% 72% 72% 82% 108% 118% 81% Suzuki 52% 160% 143% 90% -36% 67% -89% -64% -87% -79% -69% -62% Royal Enfield 46% 44% 43% -13% 42% 58% 77% 68% 126% 46% 51% 60% 36%
Source: Company data, Macquarie Research, April 2012
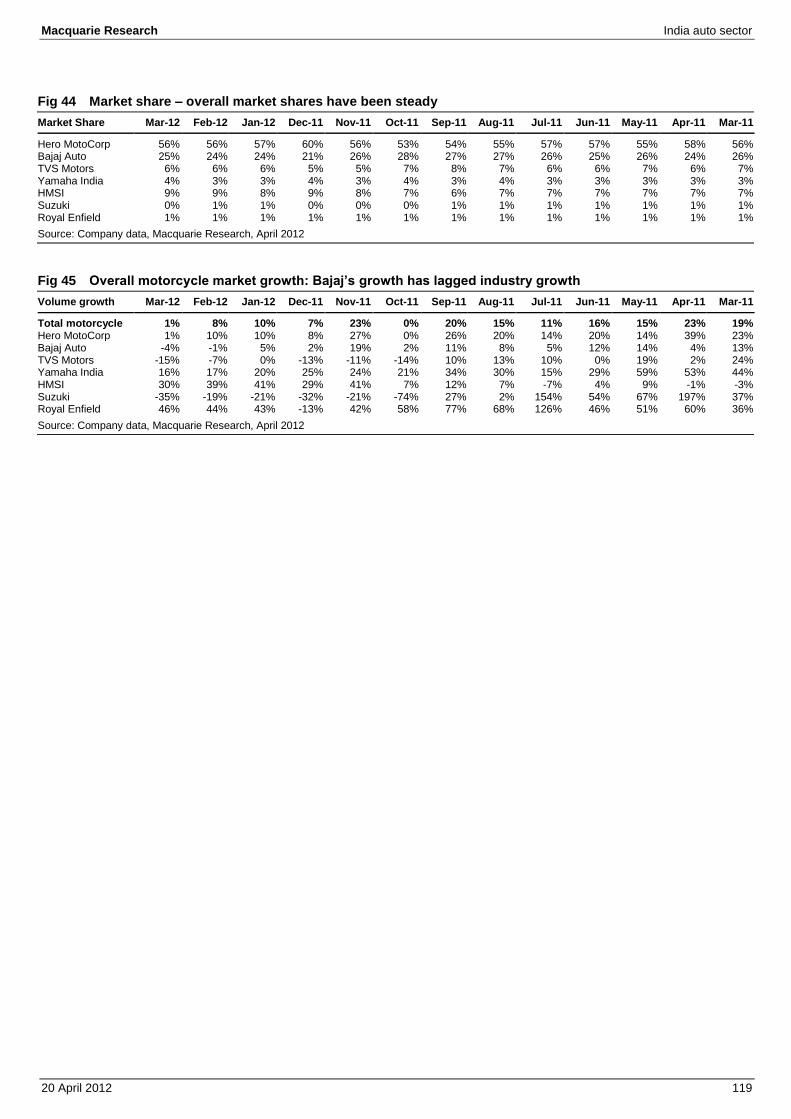
Macquarie Research India auto sector
20 April 2012 119
Fig 44 Market share – overall market shares have been steady Market Share Mar-12 Feb-12 Jan-12 Dec-11 Nov-11 Oct-11 Sep-11 Aug-11 Jul-11 Jun-11 May-11 Apr-11 Mar-11
Hero MotoCorp 56% 56% 57% 60% 56% 53% 54% 55% 57% 57% 55% 58% 56% Bajaj Auto 25% 24% 24% 21% 26% 28% 27% 27% 26% 25% 26% 24% 26% TVS Motors 6% 6% 6% 5% 5% 7% 8% 7% 6% 6% 7% 6% 7% Yamaha India 4% 3% 3% 4% 3% 4% 3% 4% 3% 3% 3% 3% 3% HMSI 9% 9% 8% 9% 8% 7% 6% 7% 7% 7% 7% 7% 7% Suzuki 0% 1% 1% 0% 0% 0% 1% 1% 1% 1% 1% 1% 1% Royal Enfield 1% 1% 1% 1% 1% 1% 1% 1% 1% 1% 1% 1% 1%
Source: Company data, Macquarie Research, April 2012
Fig 45 Overall motorcycle market growth: Bajaj’s growth has lagged industry growth Volume growth Mar-12 Feb-12 Jan-12 Dec-11 Nov-11 Oct-11 Sep-11 Aug-11 Jul-11 Jun-11 May-11 Apr-11 Mar-11
Total motorcycle 1% 8% 10% 7% 23% 0% 20% 15% 11% 16% 15% 23% 19% Hero MotoCorp 1% 10% 10% 8% 27% 0% 26% 20% 14% 20% 14% 39% 23% Bajaj Auto -4% -1% 5% 2% 19% 2% 11% 8% 5% 12% 14% 4% 13% TVS Motors -15% -7% 0% -13% -11% -14% 10% 13% 10% 0% 19% 2% 24% Yamaha India 16% 17% 20% 25% 24% 21% 34% 30% 15% 29% 59% 53% 44% HMSI 30% 39% 41% 29% 41% 7% 12% 7% -7% 4% 9% -1% -3% Suzuki -35% -19% -21% -32% -21% -74% 27% 2% 154% 54% 67% 197% 37% Royal Enfield 46% 44% 43% -13% 42% 58% 77% 68% 126% 46% 51% 60% 36%
Source: Company data, Macquarie Research, April 2012
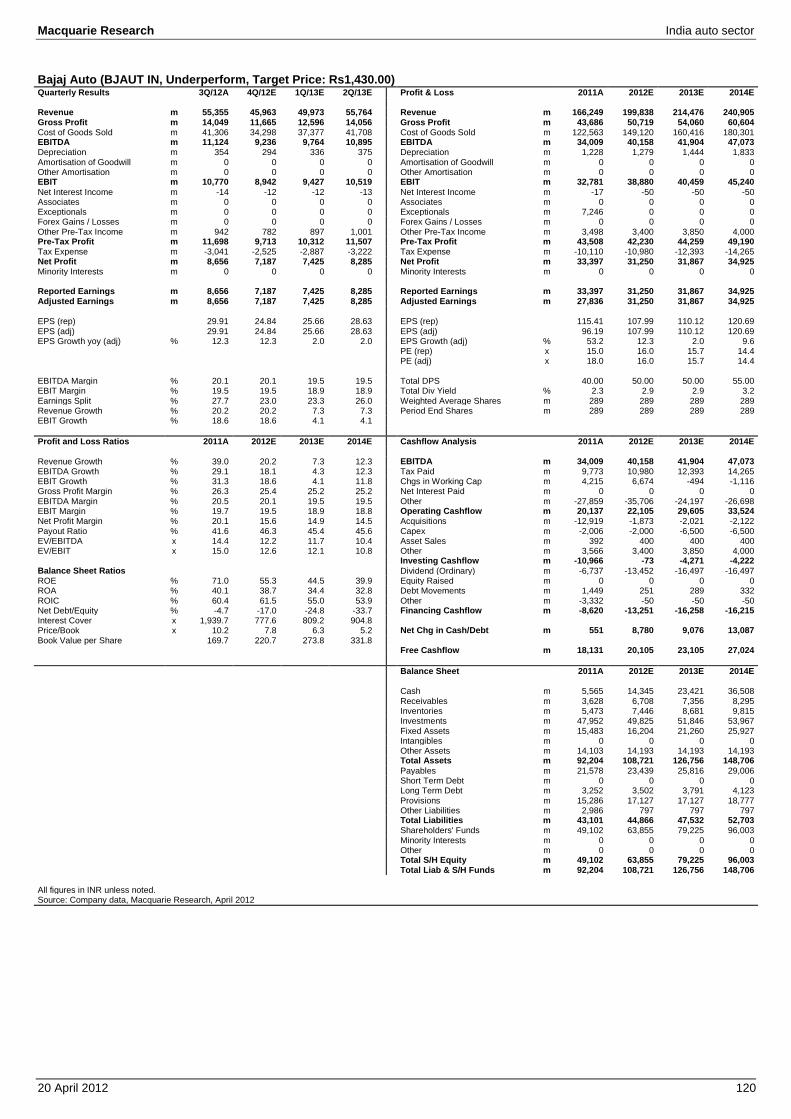
Macquarie Research India auto sector
20 April 2012 120
Bajaj Auto (BJAUT IN, Underperform, Target Price: Rs1,430.00) Quarterly Results 3Q/12A 4Q/12E 1Q/13E 2Q/13E Profit & Loss 2011A 2012E 2013E 2014E
Revenue m 55,355 45,963 49,973 55,764 Revenue m 166,249 199,838 214,476 240,905 Gross Profit m 14,049 11,665 12,596 14,056 Gross Profit m 43,686 50,719 54,060 60,604 Cost of Goods Sold m 41,306 34,298 37,377 41,708 Cost of Goods Sold m 122,563 149,120 160,416 180,301 EBITDA m 11,124 9,236 9,764 10,895 EBITDA m 34,009 40,158 41,904 47,073 Depreciation m 354 294 336 375 Depreciation m 1,228 1,279 1,444 1,833 Amortisation of Goodwill m 0 0 0 0 Amortisation of Goodwill m 0 0 0 0 Other Amortisation m 0 0 0 0 Other Amortisation m 0 0 0 0 EBIT m 10,770 8,942 9,427 10,519 EBIT m 32,781 38,880 40,459 45,240 Net Interest Income m -14 -12 -12 -13 Net Interest Income m -17 -50 -50 -50 Associates m 0 0 0 0 Associates m 0 0 0 0 Exceptionals m 0 0 0 0 Exceptionals m 7,246 0 0 0 Forex Gains / Losses m 0 0 0 0 Forex Gains / Losses m 0 0 0 0 Other Pre-Tax Income m 942 782 897 1,001 Other Pre-Tax Income m 3,498 3,400 3,850 4,000 Pre-Tax Profit m 11,698 9,713 10,312 11,507 Pre-Tax Profit m 43,508 42,230 44,259 49,190 Tax Expense m -3,041 -2,525 -2,887 -3,222 Tax Expense m -10,110 -10,980 -12,393 -14,265 Net Profit m 8,656 7,187 7,425 8,285 Net Profit m 33,397 31,250 31,867 34,925 Minority Interests m 0 0 0 0 Minority Interests m 0 0 0 0
Reported Earnings m 8,656 7,187 7,425 8,285 Reported Earnings m 33,397 31,250 31,867 34,925 Adjusted Earnings m 8,656 7,187 7,425 8,285 Adjusted Earnings m 27,836 31,250 31,867 34,925
EPS (rep) 29.91 24.84 25.66 28.63 EPS (rep) 115.41 107.99 110.12 120.69 EPS (adj) 29.91 24.84 25.66 28.63 EPS (adj) 96.19 107.99 110.12 120.69 EPS Growth yoy (adj) % 12.3 12.3 2.0 2.0 EPS Growth (adj) % 53.2 12.3 2.0 9.6
PE (rep) x 15.0 16.0 15.7 14.4 PE (adj) x 18.0 16.0 15.7 14.4
EBITDA Margin % 20.1 20.1 19.5 19.5 Total DPS 40.00 50.00 50.00 55.00 EBIT Margin % 19.5 19.5 18.9 18.9 Total Div Yield % 2.3 2.9 2.9 3.2 Earnings Split % 27.7 23.0 23.3 26.0 Weighted Average Shares m 289 289 289 289 Revenue Growth % 20.2 20.2 7.3 7.3 Period End Shares m 289 289 289 289 EBIT Growth % 18.6 18.6 4.1 4.1
Profit and Loss Ratios 2011A 2012E 2013E 2014E Cashflow Analysis 2011A 2012E 2013E 2014E
Revenue Growth % 39.0 20.2 7.3 12.3 EBITDA m 34,009 40,158 41,904 47,073 EBITDA Growth % 29.1 18.1 4.3 12.3 Tax Paid m 9,773 10,980 12,393 14,265 EBIT Growth % 31.3 18.6 4.1 11.8 Chgs in Working Cap m 4,215 6,674 -494 -1,116 Gross Profit Margin % 26.3 25.4 25.2 25.2 Net Interest Paid m 0 0 0 0 EBITDA Margin % 20.5 20.1 19.5 19.5 Other m -27,859 -35,706 -24,197 -26,698 EBIT Margin % 19.7 19.5 18.9 18.8 Operating Cashflow m 20,137 22,105 29,605 33,524 Net Profit Margin % 20.1 15.6 14.9 14.5 Acquisitions m -12,919 -1,873 -2,021 -2,122 Payout Ratio % 41.6 46.3 45.4 45.6 Capex m -2,006 -2,000 -6,500 -6,500 EV/EBITDA x 14.4 12.2 11.7 10.4 Asset Sales m 392 400 400 400 EV/EBIT x 15.0 12.6 12.1 10.8 Other m 3,566 3,400 3,850 4,000
Investing Cashflow m -10,966 -73 -4,271 -4,222 Balance Sheet Ratios Dividend (Ordinary) m -6,737 -13,452 -16,497 -16,497 ROE % 71.0 55.3 44.5 39.9 Equity Raised m 0 0 0 0 ROA % 40.1 38.7 34.4 32.8 Debt Movements m 1,449 251 289 332 ROIC % 60.4 61.5 55.0 53.9 Other m -3,332 -50 -50 -50 Net Debt/Equity % -4.7 -17.0 -24.8 -33.7 Financing Cashflow m -8,620 -13,251 -16,258 -16,215 Interest Cover x 1,939.7 777.6 809.2 904.8 Price/Book x 10.2 7.8 6.3 5.2 Net Chg in Cash/Debt m 551 8,780 9,076 13,087 Book Value per Share 169.7 220.7 273.8 331.8
Free Cashflow m 18,131 20,105 23,105 27,024 Balance Sheet 2011A 2012E 2013E 2014E Cash m 5,565 14,345 23,421 36,508 Receivables m 3,628 6,708 7,356 8,295 Inventories m 5,473 7,446 8,681 9,815 Investments m 47,952 49,825 51,846 53,967 Fixed Assets m 15,483 16,204 21,260 25,927 Intangibles m 0 0 0 0 Other Assets m 14,103 14,193 14,193 14,193 Total Assets m 92,204 108,721 126,756 148,706 Payables m 21,578 23,439 25,816 29,006 Short Term Debt m 0 0 0 0 Long Term Debt m 3,252 3,502 3,791 4,123 Provisions m 15,286 17,127 17,127 18,777 Other Liabilities m 2,986 797 797 797 Total Liabilities m 43,101 44,866 47,532 52,703 Shareholders' Funds m 49,102 63,855 79,225 96,003 Minority Interests m 0 0 0 0 Other m 0 0 0 0 Total S/H Equity m 49,102 63,855 79,225 96,003 Total Liab & S/H Funds m 92,204 108,721 126,756 148,706
All figures in INR unless noted. Source: Company data, Macquarie Research, April 2012
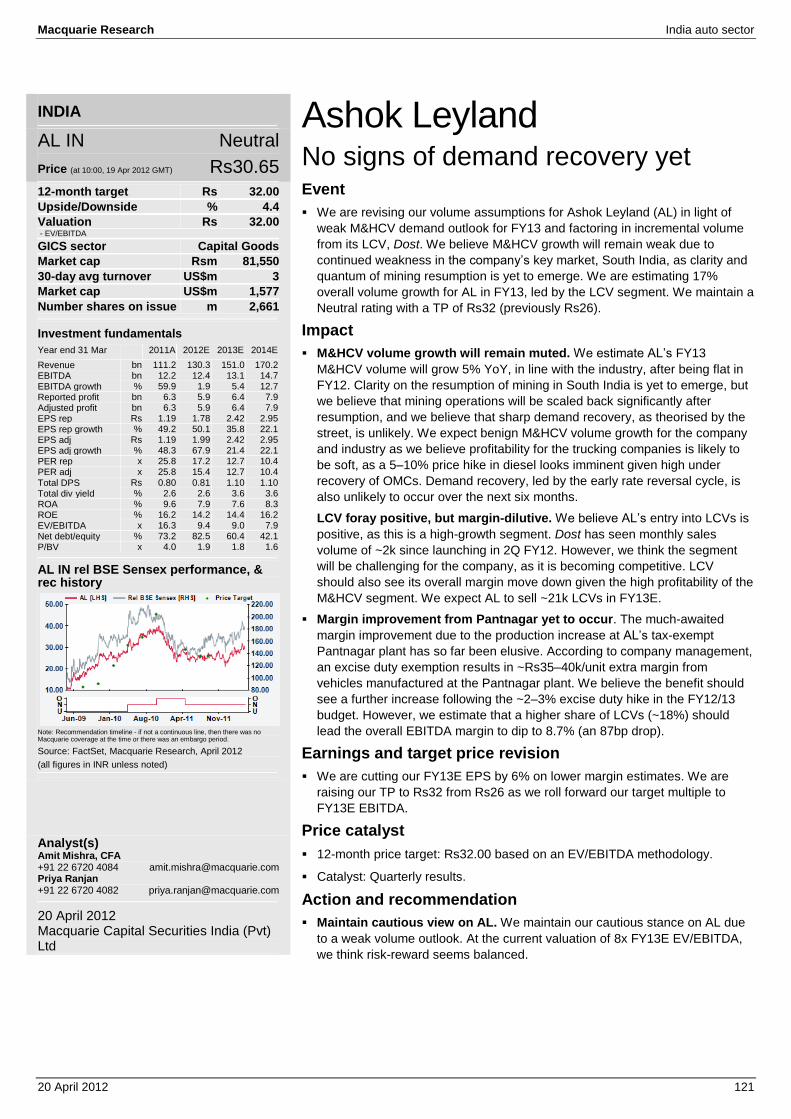
Macquarie Research India auto sector
20 April 2012 121
INDIA
AL IN Neutral
Price (at 10:00, 19 Apr 2012 GMT) Rs30.65
12-month target Rs 32.00 Upside/Downside % 4.4 Valuation Rs 32.00 - EV/EBITDA GICS sector Capital Goods Market cap Rsm 81,550 30-day avg turnover US$m 3 Market cap US$m 1,577 Number shares on issue m 2,661
Investment fundamentals Year end 31 Mar 2011A 2012E 2013E 2014E
Revenue bn 111.2 130.3 151.0 170.2 EBITDA bn 12.2 12.4 13.1 14.7 EBITDA growth % 59.9 1.9 5.4 12.7 Reported profit bn 6.3 5.9 6.4 7.9 Adjusted profit bn 6.3 5.9 6.4 7.9 EPS rep Rs 1.19 1.78 2.42 2.95 EPS rep growth % 49.2 50.1 35.8 22.1 EPS adj Rs 1.19 1.99 2.42 2.95 EPS adj growth % 48.3 67.9 21.4 22.1 PER rep x 25.8 17.2 12.7 10.4 PER adj x 25.8 15.4 12.7 10.4
Total DPS Rs 0.80 0.81 1.10 1.10 Total div yield % 2.6 2.6 3.6 3.6 ROA % 9.6 7.9 7.6 8.3 ROE % 16.2 14.2 14.4 16.2 EV/EBITDA x 16.3 9.4 9.0 7.9 Net debt/equity % 73.2 82.5 60.4 42.1
P/BV x 4.0 1.9 1.8 1.6
AL IN rel BSE Sensex performance, & rec history
Note: Recommendation timeline - if not a continuous line, then there was no Macquarie coverage at the time or there was an embargo period.
Source: FactSet, Macquarie Research, April 2012
(all figures in INR unless noted)
Analyst(s) Amit Mishra, CFA +91 22 6720 4084 [email protected] Priya Ranjan +91 22 6720 4082 [email protected]
20 April 2012 Macquarie Capital Securities India (Pvt) Ltd
Ashok Leyland No signs of demand recovery yet Event We are revising our volume assumptions for Ashok Leyland (AL) in light of
weak M&HCV demand outlook for FY13 and factoring in incremental volume
from its LCV, Dost. We believe M&HCV growth will remain weak due to
continued weakness in the company’s key market, South India, as clarity and
quantum of mining resumption is yet to emerge. We are estimating 17%
overall volume growth for AL in FY13, led by the LCV segment. We maintain a
Neutral rating with a TP of Rs32 (previously Rs26).
Impact M&HCV volume growth will remain muted. We estimate AL’s FY13
M&HCV volume will grow 5% YoY, in line with the industry, after being flat in
FY12. Clarity on the resumption of mining in South India is yet to emerge, but
we believe that mining operations will be scaled back significantly after
resumption, and we believe that sharp demand recovery, as theorised by the
street, is unlikely. We expect benign M&HCV volume growth for the company
and industry as we believe profitability for the trucking companies is likely to
be soft, as a 5–10% price hike in diesel looks imminent given high under
recovery of OMCs. Demand recovery, led by the early rate reversal cycle, is
also unlikely to occur over the next six months. LCV foray positive, but margin-dilutive. We believe AL’s entry into LCVs is
positive, as this is a high-growth segment. Dost has seen monthly sales
volume of ~2k since launching in 2Q FY12. However, we think the segment
will be challenging for the company, as it is becoming competitive. LCV
should also see its overall margin move down given the high profitability of the
M&HCV segment. We expect AL to sell ~21k LCVs in FY13E.
Margin improvement from Pantnagar yet to occur. The much-awaited
margin improvement due to the production increase at AL’s tax-exempt
Pantnagar plant has so far been elusive. According to company management,
an excise duty exemption results in ~Rs35–40k/unit extra margin from
vehicles manufactured at the Pantnagar plant. We believe the benefit should
see a further increase following the ~2–3% excise duty hike in the FY12/13
budget. However, we estimate that a higher share of LCVs (~18%) should
lead the overall EBITDA margin to dip to 8.7% (an 87bp drop).
Earnings and target price revision We are cutting our FY13E EPS by 6% on lower margin estimates. We are
raising our TP to Rs32 from Rs26 as we roll forward our target multiple to
FY13E EBITDA.
Price catalyst 12-month price target: Rs32.00 based on an EV/EBITDA methodology.
Catalyst: Quarterly results.
Action and recommendation Maintain cautious view on AL. We maintain our cautious stance on AL due
to a weak volume outlook. At the current valuation of 8x FY13E EV/EBITDA,
we think risk-reward seems balanced.
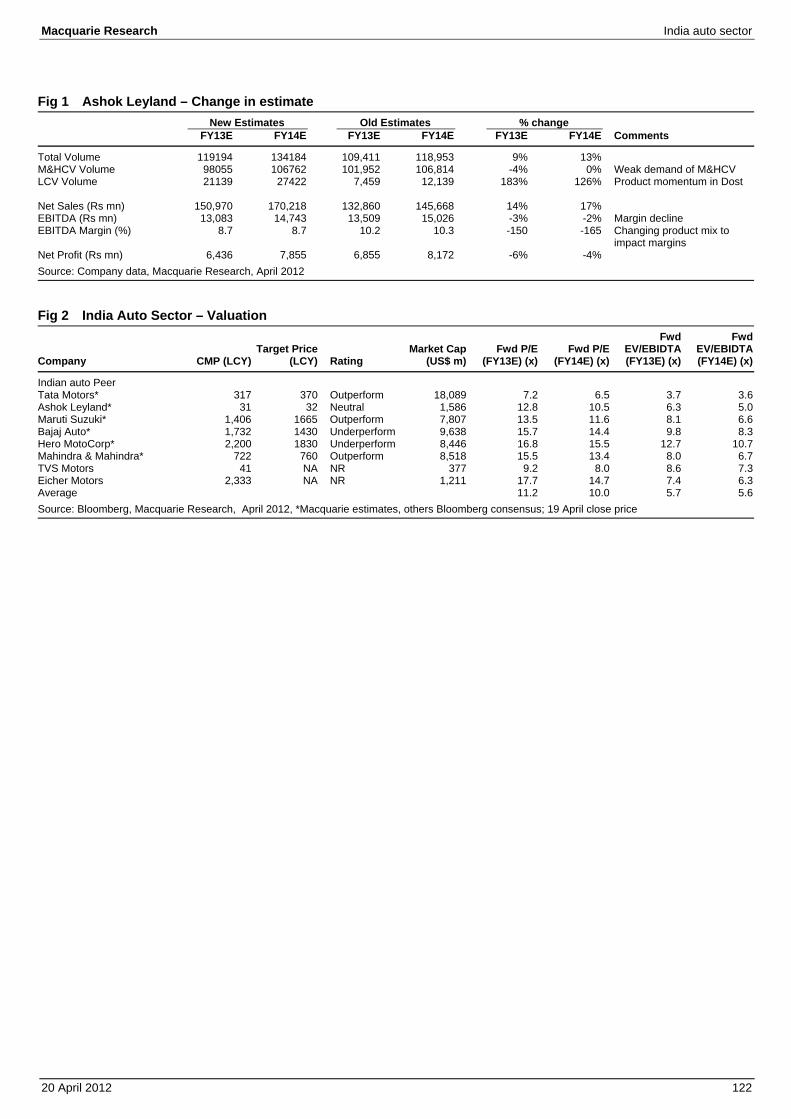
Macquarie Research India auto sector
20 April 2012 122
Fig 1 Ashok Leyland – Change in estimate New Estimates Old Estimates % change FY13E FY14E FY13E FY14E FY13E FY14E Comments
Total Volume 119194 134184 109,411 118,953 9% 13% M&HCV Volume 98055 106762 101,952 106,814 -4% 0% Weak demand of M&HCV LCV Volume 21139 27422 7,459 12,139 183% 126% Product momentum in Dost Net Sales (Rs mn) 150,970 170,218 132,860 145,668 14% 17% EBITDA (Rs mn) 13,083 14,743 13,509 15,026 -3% -2% Margin decline EBITDA Margin (%) 8.7 8.7 10.2 10.3 -150 -165 Changing product mix to
impact margins Net Profit (Rs mn) 6,436 7,855 6,855 8,172 -6% -4%
Source: Company data, Macquarie Research, April 2012
Fig 2 India Auto Sector – Valuation
Company CMP (LCY) Target Price
(LCY) Rating Market Cap
(US$ m)Fwd P/E
(FY13E) (x)Fwd P/E
(FY14E) (x)
Fwd EV/EBIDTA (FY13E) (x)
Fwd EV/EBIDTA (FY14E) (x)
Indian auto Peer Tata Motors* 317 370 Outperform 18,089 7.2 6.5 3.7 3.6Ashok Leyland* 31 32 Neutral 1,586 12.8 10.5 6.3 5.0Maruti Suzuki* 1,406 1665 Outperform 7,807 13.5 11.6 8.1 6.6Bajaj Auto* 1,732 1430 Underperform 9,638 15.7 14.4 9.8 8.3Hero MotoCorp* 2,200 1830 Underperform 8,446 16.8 15.5 12.7 10.7Mahindra & Mahindra* 722 760 Outperform 8,518 15.5 13.4 8.0 6.7TVS Motors 41 NA NR 377 9.2 8.0 8.6 7.3Eicher Motors 2,333 NA NR 1,211 17.7 14.7 7.4 6.3Average 11.2 10.0 5.7 5.6
Source: Bloomberg, Macquarie Research, April 2012, *Macquarie estimates, others Bloomberg consensus; 19 April close price
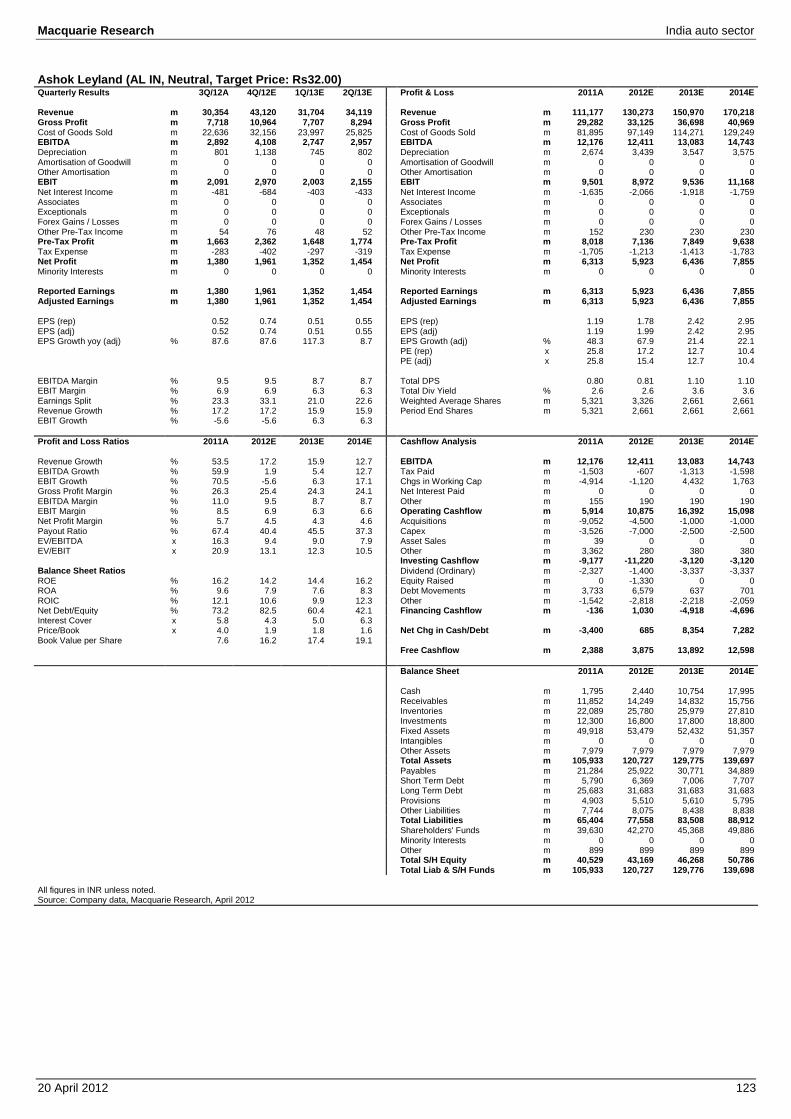
Macquarie Research India auto sector
20 April 2012 123
Ashok Leyland (AL IN, Neutral, Target Price: Rs32.00) Quarterly Results 3Q/12A 4Q/12E 1Q/13E 2Q/13E Profit & Loss 2011A 2012E 2013E 2014E
Revenue m 30,354 43,120 31,704 34,119 Revenue m 111,177 130,273 150,970 170,218 Gross Profit m 7,718 10,964 7,707 8,294 Gross Profit m 29,282 33,125 36,698 40,969 Cost of Goods Sold m 22,636 32,156 23,997 25,825 Cost of Goods Sold m 81,895 97,149 114,271 129,249 EBITDA m 2,892 4,108 2,747 2,957 EBITDA m 12,176 12,411 13,083 14,743 Depreciation m 801 1,138 745 802 Depreciation m 2,674 3,439 3,547 3,575 Amortisation of Goodwill m 0 0 0 0 Amortisation of Goodwill m 0 0 0 0 Other Amortisation m 0 0 0 0 Other Amortisation m 0 0 0 0 EBIT m 2,091 2,970 2,003 2,155 EBIT m 9,501 8,972 9,536 11,168 Net Interest Income m -481 -684 -403 -433 Net Interest Income m -1,635 -2,066 -1,918 -1,759 Associates m 0 0 0 0 Associates m 0 0 0 0 Exceptionals m 0 0 0 0 Exceptionals m 0 0 0 0 Forex Gains / Losses m 0 0 0 0 Forex Gains / Losses m 0 0 0 0 Other Pre-Tax Income m 54 76 48 52 Other Pre-Tax Income m 152 230 230 230 Pre-Tax Profit m 1,663 2,362 1,648 1,774 Pre-Tax Profit m 8,018 7,136 7,849 9,638 Tax Expense m -283 -402 -297 -319 Tax Expense m -1,705 -1,213 -1,413 -1,783 Net Profit m 1,380 1,961 1,352 1,454 Net Profit m 6,313 5,923 6,436 7,855 Minority Interests m 0 0 0 0 Minority Interests m 0 0 0 0
Reported Earnings m 1,380 1,961 1,352 1,454 Reported Earnings m 6,313 5,923 6,436 7,855 Adjusted Earnings m 1,380 1,961 1,352 1,454 Adjusted Earnings m 6,313 5,923 6,436 7,855
EPS (rep) 0.52 0.74 0.51 0.55 EPS (rep) 1.19 1.78 2.42 2.95 EPS (adj) 0.52 0.74 0.51 0.55 EPS (adj) 1.19 1.99 2.42 2.95 EPS Growth yoy (adj) % 87.6 87.6 117.3 8.7 EPS Growth (adj) % 48.3 67.9 21.4 22.1
PE (rep) x 25.8 17.2 12.7 10.4 PE (adj) x 25.8 15.4 12.7 10.4
EBITDA Margin % 9.5 9.5 8.7 8.7 Total DPS 0.80 0.81 1.10 1.10 EBIT Margin % 6.9 6.9 6.3 6.3 Total Div Yield % 2.6 2.6 3.6 3.6 Earnings Split % 23.3 33.1 21.0 22.6 Weighted Average Shares m 5,321 3,326 2,661 2,661 Revenue Growth % 17.2 17.2 15.9 15.9 Period End Shares m 5,321 2,661 2,661 2,661 EBIT Growth % -5.6 -5.6 6.3 6.3
Profit and Loss Ratios 2011A 2012E 2013E 2014E Cashflow Analysis 2011A 2012E 2013E 2014E
Revenue Growth % 53.5 17.2 15.9 12.7 EBITDA m 12,176 12,411 13,083 14,743 EBITDA Growth % 59.9 1.9 5.4 12.7 Tax Paid m -1,503 -607 -1,313 -1,598 EBIT Growth % 70.5 -5.6 6.3 17.1 Chgs in Working Cap m -4,914 -1,120 4,432 1,763 Gross Profit Margin % 26.3 25.4 24.3 24.1 Net Interest Paid m 0 0 0 0 EBITDA Margin % 11.0 9.5 8.7 8.7 Other m 155 190 190 190 EBIT Margin % 8.5 6.9 6.3 6.6 Operating Cashflow m 5,914 10,875 16,392 15,098 Net Profit Margin % 5.7 4.5 4.3 4.6 Acquisitions m -9,052 -4,500 -1,000 -1,000 Payout Ratio % 67.4 40.4 45.5 37.3 Capex m -3,526 -7,000 -2,500 -2,500 EV/EBITDA x 16.3 9.4 9.0 7.9 Asset Sales m 39 0 0 0 EV/EBIT x 20.9 13.1 12.3 10.5 Other m 3,362 280 380 380
Investing Cashflow m -9,177 -11,220 -3,120 -3,120 Balance Sheet Ratios Dividend (Ordinary) m -2,327 -1,400 -3,337 -3,337 ROE % 16.2 14.2 14.4 16.2 Equity Raised m 0 -1,330 0 0 ROA % 9.6 7.9 7.6 8.3 Debt Movements m 3,733 6,579 637 701 ROIC % 12.1 10.6 9.9 12.3 Other m -1,542 -2,818 -2,218 -2,059 Net Debt/Equity % 73.2 82.5 60.4 42.1 Financing Cashflow m -136 1,030 -4,918 -4,696 Interest Cover x 5.8 4.3 5.0 6.3 Price/Book x 4.0 1.9 1.8 1.6 Net Chg in Cash/Debt m -3,400 685 8,354 7,282 Book Value per Share 7.6 16.2 17.4 19.1
Free Cashflow m 2,388 3,875 13,892 12,598 Balance Sheet 2011A 2012E 2013E 2014E Cash m 1,795 2,440 10,754 17,995 Receivables m 11,852 14,249 14,832 15,756 Inventories m 22,089 25,780 25,979 27,810 Investments m 12,300 16,800 17,800 18,800 Fixed Assets m 49,918 53,479 52,432 51,357 Intangibles m 0 0 0 0 Other Assets m 7,979 7,979 7,979 7,979 Total Assets m 105,933 120,727 129,775 139,697 Payables m 21,284 25,922 30,771 34,889 Short Term Debt m 5,790 6,369 7,006 7,707 Long Term Debt m 25,683 31,683 31,683 31,683 Provisions m 4,903 5,510 5,610 5,795 Other Liabilities m 7,744 8,075 8,438 8,838 Total Liabilities m 65,404 77,558 83,508 88,912 Shareholders' Funds m 39,630 42,270 45,368 49,886 Minority Interests m 0 0 0 0 Other m 899 899 899 899 Total S/H Equity m 40,529 43,169 46,268 50,786 Total Liab & S/H Funds m 105,933 120,727 129,776 139,698
All figures in INR unless noted. Source: Company data, Macquarie Research, April 2012
Macquarie Research India auto sector
20 April 2012 124
Important disclosures: Recommendation definitions Macquarie - Australia/New Zealand Outperform – return >3% in excess of benchmark return Neutral – return within 3% of benchmark return Underperform – return >3% below benchmark return Benchmark return is determined by long term nominal GDP growth plus 12 month forward market dividend yield Macquarie – Asia/Europe Outperform – expected return >+10% Neutral – expected return from -10% to +10% Underperform – expected return <-10% Macquarie First South - South Africa Outperform – expected return >+10% Neutral – expected return from -10% to +10% Underperform – expected return <-10% Macquarie - Canada Outperform – return >5% in excess of benchmark return Neutral – return within 5% of benchmark return Underperform – return >5% below benchmark return Macquarie - USA Outperform (Buy) – return >5% in excess of Russell 3000 index return Neutral (Hold) – return within 5% of Russell 3000 index return Underperform (Sell)– return >5% below Russell 3000 index return
Volatility index definition* This is calculated from the volatility of historical price movements. Very high–highest risk – Stock should be expected to move up or down 60–100% in a year – investors should be aware this stock is highly speculative. High – stock should be expected to move up or down at least 40–60% in a year – investors should be aware this stock could be speculative. Medium – stock should be expected to move up or down at least 30–40% in a year. Low–medium – stock should be expected to move up or down at least 25–30% in a year. Low – stock should be expected to move up or down at least 15–25% in a year. * Applicable to Australian/NZ/Canada stocks only Recommendations – 12 months Note: Quant recommendations may differ from Fundamental Analyst recommendations
Financial definitions All "Adjusted" data items have had the following adjustments made: Added back: goodwill amortisation, provision for catastrophe reserves, IFRS derivatives & hedging, IFRS impairments & IFRS interest expense Excluded: non recurring items, asset revals, property revals, appraisal value uplift, preference dividends & minority interests EPS = adjusted net profit / efpowa* ROA = adjusted ebit / average total assets ROA Banks/Insurance = adjusted net profit /average total assets ROE = adjusted net profit / average shareholders funds Gross cashflow = adjusted net profit + depreciation *equivalent fully paid ordinary weighted average number of shares All Reported numbers for Australian/NZ listed stocks are modelled under IFRS (International Financial Reporting Standards).
Recommendation proportions – For quarter ending 31 March 2012 AU/NZ Asia RSA USA CA EUR Outperform 53.90% 60.60% 57.50% 43.59% 66.67% 46.89% (for US coverage by MCUSA, 10.86% of stocks covered are investment banking clients) Neutral 31.56% 23.00% 32.50% 51.09% 30.00% 32.60% (for US coverage by MCUSA, 9.50% of stocks covered are investment banking clients) Underperform 14.54% 16.40% 10.00% 5.32% 3.33% 20.51% (for US coverage by MCUSA, 1.36% of stocks covered are investment banking clients)
Company Specific Disclosures: Important disclosure information regarding the subject companies covered in this report is available at www.macquarie.com/disclosures.
Analyst Certification: The views expressed in this research accurately reflect the personal views of the analyst(s) about the subject securities or issuers and no part of the compensation of the analyst(s) was, is, or will be directly or indirectly related to the inclusion of specific recommendations or views in this research. The analyst principally responsible for the preparation of this research receives compensation based on overall revenues of Macquarie Group Ltd ABN 94 122 169 279 (AFSL No. 318062) (MGL) and its related entities (the Macquarie Group) and has taken reasonable care to achieve and maintain independence and objectivity in making any recommendations. General Disclaimers: Macquarie Securities (Australia) Ltd; Macquarie Capital (Europe) Ltd; Macquarie Capital Markets Canada Ltd; Macquarie Capital Markets North America Ltd; Macquarie Capital (USA) Inc; Macquarie Capital Securities Ltd and its Taiwan branch; Macquarie Capital Securities (Singapore) Pte Ltd; Macquarie Securities (NZ) Ltd; Macquarie First South Securities (Pty) Limited; Macquarie Capital Securities (India) Pvt Ltd; Macquarie Capital Securities (Malaysia) Sdn Bhd; Macquarie Securities Korea Limited and Macquarie Securities (Thailand) Ltd are not authorized deposit-taking institutions for the purposes of the Banking Act 1959 (Commonwealth of Australia), and their obligations do not represent deposits or other liabilities of Macquarie Bank Limited ABN 46 008 583 542 (MBL) or MGL. MBL does not guarantee or otherwise provide assurance in respect of the obligations of any of the above mentioned entities. MGL provides a guarantee to the Monetary Authority of Singapore in respect of the obligations and liabilities of Macquarie Capital Securities (Singapore) Pte Ltd for up to SGD 35 million. This research has been prepared for the general use of the wholesale clients of the Macquarie Group and must not be copied, either in whole or in part, or distributed to any other person. If you are not the intended recipient you must not use or disclose the information in this research in any way. If you received it in error, please tell us immediately by return e-mail and delete the document. We do not guarantee the integrity of any e-mails or attached files and are not responsible for any changes made to them by any other person. MGL has established and implemented a conflicts policy at group level (which may be revised and updated from time to time) (the "Conflicts Policy") pursuant to regulatory requirements (including the FSA Rules) which sets out how we must seek to identify and manage all material conflicts of interest. Nothing in this research shall be construed as a solicitation to buy or sell any security or product, or to engage in or refrain from engaging in any transaction. In preparing this research, we did not take into account your investment objectives, financial situation or particular needs. Macquarie salespeople, traders and other professionals may provide oral or written market commentary or trading strategies to our clients that reflect opinions which are contrary to the opinions expressed in this research. Macquarie Research produces a variety of research products including, but not limited to, fundamental analysis, macro-economic analysis, quantitative analysis, and trade ideas. Recommendations contained in one type of research product may differ from recommendations contained in other types of research, whether as a result of differing time horizons, methodologies, or otherwise. Before making an investment decision on the basis of this research, you need to consider, with or without the assistance of an adviser, whether the advice is appropriate in light of your particular investment needs, objectives and financial circumstances. There are risks involved in securities trading. The price of securities can and does fluctuate, and an individual security may even become valueless. International investors are reminded of the additional risks inherent in international investments, such as currency fluctuations and international stock market or economic conditions, which may adversely affect the value of the investment. This research is based on information obtained from sources believed to be reliable but we do not make any representation or warranty that it is accurate, complete or up to date. We accept no obligation to correct or update the information or opinions in it. Opinions expressed are subject to change without notice. No member of the Macquarie Group accepts any liability whatsoever for any direct, indirect, consequential or other loss arising from any use of this research and/or further communication in relation to this research. Clients should contact analysts at, and execute transactions through, a Macquarie Group entity in their home jurisdiction unless governing law permits otherwise. The date and timestamp for above share price and market cap is the closed price of the price date. #CLOSE is the final price at which the security is traded in the relevant exchange on the date indicated. Country-Specific Disclaimers: Australia: In Australia, research is issued and distributed by Macquarie Securities (Australia) Ltd (AFSL No. 238947), a participating organisation of the Australian Securities Exchange. New Zealand: In New Zealand, research is issued and distributed by Macquarie Securities (NZ) Ltd, a NZX Firm. Canada: In Canada, research is prepared, approved and distributed by Macquarie Capital Markets Canada Ltd, a participating organisation of the Toronto Stock Exchange, TSX Venture Exchange & Montréal Exchange. Macquarie Capital Markets North America Ltd., which is a registered broker-dealer and member of FINRA, accepts responsibility for the contents of reports issued by Macquarie Capital Markets Canada Ltd in the United States and sent to US persons. Any person wishing to effect transactions in the securities described in the reports issued by Macquarie Capital Markets Canada Ltd should do so with Macquarie Capital Markets North America Ltd. The Research Distribution Policy of Macquarie Capital Markets Canada Ltd is to allow all clients that are entitled to have equal access to our research. United Kingdom: In the United Kingdom, research is issued and
Macquarie Research India auto sector
20 April 2012 125
distributed by Macquarie Capital (Europe) Ltd, which is authorised and regulated by the Financial Services Authority (No. 193905). Germany: In Germany, this research is issued and/or distributed by Macquarie Capital (Europe) Limited, Niederlassung Deutschland, which is authorised and regulated by the UK Financial Services Authority (No. 193905). and in Germany by BaFin. France: In France, research is issued and distributed by Macquarie Capital (Europe) Ltd, which is authorised and regulated in the United Kingdom by the Financial Services Authority (No. 193905). Hong Kong & Mainland China: In Hong Kong, research is issued and distributed by Macquarie Capital Securities Ltd, which is licensed and regulated by the Securities and Futures Commission. In Mainland China, Macquarie Securities (Australia) Limited Shanghai Representative Office only engages in non-business operational activities excluding issuing and distributing research. Only non-A share research is distributed into Mainland China by Macquarie Capital Securities Ltd. Japan: In Japan, research is issued and distributed by Macquarie Capital Securities (Japan) Limited, a member of the Tokyo Stock Exchange, Inc. and Osaka Securities Exchange Co. Ltd (Financial Instruments Firm, Kanto Financial Bureau (kin-sho) No. 231, a member of Japan Securities Dealers Association and The Financial Futures Association of Japan and Japan Securities Investment Advisers Association). India: In India, research is issued and distributed by Macquarie Capital Securities (India) Pvt Ltd., 92, Level 9, 2 North Avenue, Maker Maxity, Bandra Kurla Complex, Bandra (East), Mumbai – 400 051, India, which is a SEBI registered Stock Broker having membership with National Stock Exchange of India Limited (INB231246738) and Bombay Stock Exchange Limited (INB011246734). Malaysia: In Malaysia, research is issued and distributed by Macquarie Capital Securities (Malaysia) Sdn. Bhd. (Company registration number: 463469-W) which is a Participating Organisation of Bursa Malaysia Berhad and a holder of Capital Markets Services License issued by the Securities Commission. Taiwan: Information on securities/instruments that are traded in Taiwan is distributed by Macquarie Capital Securities Ltd, Taiwan Branch, which is licensed and regulated by the Financial Supervisory Commission. No portion of the report may be reproduced or quoted by the press or any other person without authorisation from Macquarie. Nothing in this research shall be construed as a solicitation to buy or sell any security or product. Research Associate(s) in this report who are registered as Clerks only assist in the preparation of research and are not engaged in writing the research. Thailand: In Thailand, research is produced with the contribution of Kasikorn Securities Public Company Limited, issued and distributed by Macquarie Securities (Thailand) Ltd. Macquarie Securities (Thailand) Ltd. is a licensed securities company that is authorized by the Ministry of Finance, regulated by the Securities and Exchange Commission of Thailand and is an exchange member of the Stock Exchange of Thailand. Macquarie Securities (Thailand) Limited and Kasikorn Securities Public Company Limited have entered into an exclusive strategic alliance agreement to broaden and deepen the scope of services provided to each parties respective clients. The strategic alliance does not constitute a joint venture. The Thai Institute of Directors Association has disclosed the Corporate Governance Report of Thai Listed Companies made pursuant to the policy of the Securities and Exchange Commission of Thailand. Macquarie Securities (Thailand) Ltd does not endorse the result of the Corporate Governance Report of Thai Listed Companies but this Report can be accessed at: http://www.thai-iod.com/en/publications.asp?type=4. South Korea: In South Korea, unless otherwise stated, research is prepared, issued and distributed by Macquarie Securities Korea Limited, which is regulated by the Financial Supervisory Services. Information on analysts in MSKL is disclosed at http://dis.kofia.or.kr/fs/dis2/fundMgr/DISFundMgrAnalystPop.jsp?companyCd2=A03053&pageDiv=02. South Africa: In South Africa, research is issued and distributed by Macquarie First South Securities (Pty) Limited, a member of the JSE Limited. Singapore: In Singapore, research is issued and distributed by Macquarie Capital Securities (Singapore) Pte Ltd (Company Registration Number: 198702912C), a Capital Markets Services license holder under the Securities and Futures Act to deal in securities and provide custodial services in Singapore. Pursuant to the Financial Advisers (Amendment) Regulations 2005, Macquarie Capital Securities (Singapore) Pte Ltd is exempt from complying with sections 25, 27 and 36 of the Financial Advisers Act. All Singapore-based recipients of research produced by Macquarie Capital (Europe) Limited, Macquarie Capital Markets Canada Ltd, Macquarie First South Securities (Pty) Limited and Macquarie Capital (USA) Inc. represent and warrant that they are institutional investors as defined in the Securities and Futures Act. United States: In the United States, research is issued and distributed by Macquarie Capital (USA) Inc., which is a registered broker-dealer and member of FINRA. Macquarie Capital (USA) Inc, accepts responsibility for the content of each research report prepared by one of its non-US affiliates when the research report is distributed in the United States by Macquarie Capital (USA) Inc. Macquarie Capital (USA) Inc.’s affiliate’s analysts are not registered as research analysts with FINRA, may not be associated persons of Macquarie Capital (USA) Inc., and therefore may not be subject to FINRA rule restrictions on communications with a subject company, public appearances, and trading securities held by a research analyst account. Any persons receiving this report directly from Macquarie Capital (USA) Inc. and wishing to effect a transaction in any security described herein should do so with Macquarie Capital (USA) Inc. Important disclosure information regarding the subject companies covered in this report is available at www.macquarie.com/research/disclosures, or contact your registered representative at 1-888-MAC-STOCK, or write to the Supervisory Analysts, Research Department, Macquarie Securities, 125 W.55th Street, New York, NY 10019. © Macquarie Group Auckland Tel: (649) 377 6433
Jakarta Tel: (62 21) 515 1818
Mumbai Tel: (91 22) 6653 3000
Singapore Tel: (65) 6601 1111
Bangkok Tel: (662) 694 7999
Johannesburg Tel: (2711) 583 2000
Munich Tel: (089) 2444 31800
Sydney Tel: (612) 8232 9555
Calgary Tel: (1 403) 218 6650
Kuala Lumpur Tel: (60 3) 2059 8833
New York Tel: (1 212) 231 2500
Taipei Tel: (886 2) 2734 7500
Denver Tel: (303) 952 2800
London Tel: (44 20) 3037 2000
Paris Tel: (33 1) 7842 3823
Tokyo Tel: (81 3) 3512 7900
Frankfurt Tel: (069) 509 578 000
Manila Tel: (63 2) 857 0888
Perth Tel: (618) 9224 0888
Toronto Tel: (1 416) 848 3500
Geneva Tel: (41) 22 818 7777
Melbourne Tel: (613) 9635 8139
Seoul Tel: (82 2) 3705 8500
Hong Kong Tel: (852) 2823 3588
Montreal Tel: (1 514) 925 2850
Shanghai Tel: (86 21) 6841 3355
Available to clients on the world wide web at www.macquarieresearch.com and through Thomson Financial, FactSet, Reuters, Bloomberg, CapitalIQ and TheMarkets.com.
Asia Research Head of Equity Research John O’Connell (Global Co – Head) (612) 8232 7544 David Rickards (Global Co – Head) (612) 8237 1159
Chris Hunt (Asia – Head) (852) 3922 1119
Tim Smart (Asia – Deputy Head) (852) 3922 3565
Automobiles/Auto Parts Janet Lewis (China) (852) 3922 5417
Amit Mishra (India) (9122) 6720 4084
Clive Wiggins (Japan) (813) 3512 7856
Michael Sohn (Korea) (82 2) 3705 8644
Banks and Non-Bank Financials Ismael Pili (Asia, Hong Kong) (852) 3922 4774
Victor Wang (China) (852) 3922 1479
Suresh Ganapathy (India) (9122) 6720 4078
Nicolaos Oentung (Indonesia) (6221) 2598 8366
Alastair Macdonald (Japan) (813) 3512 7476
Chan Hwang (Korea) (822) 3705 8643
Matthew Smith (Malaysia, Singapore) (65) 6601 0981
Alex Pomento (Philippines) (632) 857 0899
Jemmy Huang (Taiwan) (8862) 2734 7530
Passakorn Linmaneechote (Thailand) (662) 694 7728
Conglomerates Alex Pomento (Philippines) (632) 857 0899 Somesh Agarwal (Singapore) (65) 6601 0840
Consumer and Gaming Gary Pinge (Asia) (852) 3922 3557
Linda Huang (China, Hong Kong) (852) 3922 4068
Amit Mishra (India) (9122) 6720 4084
Lyall Taylor (Indonesia) (6221) 2598 8489
Toby Williams (Japan) (813) 3512 7392
HongSuk Na (Korea) (822) 3705 8678
Alex Pomento (Philippines) (632) 857 0899 Somesh Agarwal (Singapore) (65) 6601 0840
Best Waiyanont (Thailand) (662) 694 7993
Emerging Leaders Jake Lynch (China, Asia) (8621) 2412 9007
Makoto Egami (Japan) (813) 3512 7879
Industrials Janet Lewis (Asia) (852) 3922 5417
Patrick Dai (China) (8621) 2412 9082
Saiyi He (China) (852) 3922 3585
Inderjeetsingh Bhatia (India) (9122) 6720 4087 Alex Kong (Korea) (822) 3705 8551 Juwon Lee (Korea) (822) 3705 8661
Sunaina Dhanuka (Malaysia) (603) 2059 8993
David Gambrill (Thailand) (662) 694 7753
Insurance Scott Russell (Asia, China) (852) 3922 3567
Chung Jun Yun (Korea) (822) 2095 7222
Media and Internet Jiong Shao (China, Hong Kong) (852) 3922 3566
Steve Zhang (China, Hong Kong) (852) 3922 3578
Nitin Mohta (India) (9122) 6720 4090 Prem Jearajasingam (Malaysia) (603) 2059 8989
Alex Pomento (Philippines) (632) 857 0899
Oil, Gas and Petrochemicals James Hubbard (Asia) (852) 3922 1226 Jal Irani (India) (9122) 6720 4080
Polina Diyachkina (Japan) (813) 3512 7886
Brandon Lee (Korea) (822) 3705 8669 Sunaina Dhanuka (Malaysia) (603) 2059 8993
Trevor Buchinski (Thailand) (662) 694 7829
Pharmaceuticals and Healthcare Abhishek Singhal (India) (9122) 6720 4086 Eunice Bu (Korea) (822) 2095 7223
Property Callum Bramah (Asia) (852) 3922 4731
David Ng (China, Hong Kong) (852) 3922 1291 Jeffrey Gao (China) (8621) 2412 9026
Unmesh Sharma (India) (9122) 6720 4092
Felicia Barus (Indonesia) (6221) 2598 8480 Sunaina Dhanuka (Malaysia) (603) 2059 8993
Alex Pomento (Philippines) (632) 857 0899
Tuck Yin Soong (Singapore) (65) 6601 0838 Corinne Jian (Taiwan) (8862) 2734 7522
Patti Tomaitrichitr (Thailand) (662) 694 7727
Resources / Metals and Mining Andrew Dale (Asia) (852) 3922 3587 Graeme Train (China) (8621) 2412 9035
Matty Zhao (Hong Kong) (852) 3922 1293
Pelen Ji (China, Hong Kong) (852) 3922 4741 Christina Lee (Hong Kong) (852) 3922 3571
Rakesh Arora (India) (9122) 6720 4093
Adam Worthington (Indonesia) (852) 3922 4626 Polina Diyachkina (Japan) (813) 3512 7886
Chak Reungsinpinya (Thailand) (662) 694 7982
Technology Jeffrey Su (Asia, Taiwan) (8862) 2734 7512 Lisa Soh (China) (852) 3922 1401
Nitin Mohta (India) (9122) 6720 4090
Damian Thong (Japan) (813) 3512 7877 David Gibson (Japan) (813) 3512 7880
George Chang (Japan) (813) 3512 7854
Jeff Loff (Japan) (813) 3512 7851 Daniel Kim (Korea) (822) 3705 8641
Soyun Shin (Korea) (822) 3705 8659
Andrew Chang (Taiwan) (8862) 2734 7526 Daniel Chang (Taiwan) (8862) 2734 7516
Kylie Huang (Taiwan) (8862) 2734 7528
Telecoms Nathan Ramler (Asia) (813) 3512 7875 Lisa Soh (China, Hong Kong) (852) 3922 1401
Riaz Hyder (Indonesia) (6221) 2598 8486
Prem Jearajasingam (Malaysia, Singapore) (603) 2059 8989
Alex Pomento (Philippines) (632) 857 0899 Joseph Quinn (Taiwan) (8862) 2734 7519
Transport & Infrastructure Janet Lewis (Asia, Japan) (852) 3922 5417
Bonnie Chan (Hong Kong) (852) 3922 3898
Nicholas Cunningham (Japan) (813) 3512 6044 Sunaina Dhanuka (Malaysia) (603) 2059 8993
Corinne Jian (Taiwan) (8862) 2734 7522
Utilities & Renewables Adam Worthington (Asia) (852) 3922 4626 Inderjeetsingh Bhatia (India) (9122) 6720 4087
Prem Jearajasingam (Malaysia) (603) 2059 8989
Alex Pomento (Philippines) (632) 857 0899
Commodities Jim Lennon (4420) 3037 4271
Duncan Hobbs (4420) 3037 4497
Bonnie Liu (65) 6601 0144 Graeme Train (8621) 2412 9035
Rakesh Arora (9122) 6720 4093
Data Services Josh Holcroft (852) 3922 1279
Economics Peter Eadon-Clarke (Asia, Japan) (813) 3512 7850
Richard Gibbs (Australia) (612) 8232 3935
Paul Cavey (China) (852) 3922 3570 Tanvee Gupta (India) (9122) 6720 3455
Quantitative / CPG Gurvinder Brar (Global) (4420) 3037 4036
Burke Lau (Asia) (852) 3922 5494 Simon Rigney (Asia) (852) 3922 4719
Eric Yeung (Asia) (852) 3922 4077
Patrick Hansen (Japan) (813) 3512 7876 Ayumu Kuroda (Japan) (813) 3512 7569
Strategy/Country Emil Wolter (Asia) (65) 6601 0538
Peter Eadon-Clarke (Japan) (813) 3512 7850 Chris Hunt (China, Hong Kong) (852) 3922 1119
Jiong Shao (China) (852) 3922 3566
Rakesh Arora (India) (9122) 6720 4093 Nicolaos Oentung (Indonesia) (6121) 2598 8366
Michael Newman (Japan) (813) 3512 7920
Chan Hwang (Korea) (822) 3705 8643 Yeonzon Yeow (Malaysia) (603) 2059 8982
Alex Pomento (Philippines) (632) 857 0899
Conrad Werner (Singapore) (65) 6601 0182 Daniel Chang (Taiwan) (8862) 2734 7516
David Gambrill (Thailand) (662) 694 7753 Find our research at Macquarie: www.macquarie.com.au/research Thomson: www.thomson.com/financial Reuters: www.knowledge.reuters.com Bloomberg: MAC GO Factset: http://www.factset.com/home.aspx CapitalIQ www.capitaliq.com TheMarkets.com www.themarkets.com Email [email protected] for access
Asia Sales Regional Heads of Sales Robin Black (Asia) (852) 3922 2074 Chris Gray (ASEAN) (65) 6601 0288
Peter Slater (Boston) (1 617) 598 2502
Jeffrey Shiu (China & Hong Kong) (852) 3922 2061 Thomas Renz (Geneva) (41) 22 818 7712
Andrew Mouat (India) (9122) 6720 4100
JJ Kim (Korea) (822) 3705 8799 Chris Gould (Malaysia) (603) 2059 8888
Gino C Rojas (Philippines) (632) 857 0861
Eric Roles (New York) (1 212) 231 2559 Luke Sullivan (New York) (1 212) 231 2507
Paul Colaco (New York) (1 212) 231 2496
Sheila Schroeder (San Francisco) (1 415) 762 5001 Miki Edelman (Taiwan) (8862) 2734 7580
Regional Heads of Sales cont’d Angus Kent (Thailand) (662) 694 7601
Angus Innes (UK/Europe) (44) 20 3037 4841
Rob Fabbro (UK/Europe) (44) 20 3037 4865 Sean Alexander (Generalist) (852) 3922 2101
Regional Head of Distribution Justin Crawford (Asia) (852) 3922 2065
Sales Trading Adam Zaki (Asia) (852) 3922 2002 Phil Sellaroli (Japan) (813) 3512 7837
Grace Lee (Korea) (822) 3705 8601
Jonathan Seymour (Singapore) (65) 6601 0202
Sales Trading cont’d Mike Keen (Europe) (44) 20 3037 4905 Chris Reale (New York) (1 212) 231 2555
Marc Rosa (New York) (1 212) 231 2555
Stanley Dunda (Indonesia) (6221) 515 1555 Kenneth Cheung (Malaysia) (603) 2059 8888
Michael Santos (Philippines) (632) 857 0813
Isaac Huang (Taiwan) (8862) 2734 7582 Dominic Shore (Thailand) (662) 694 7707


![Auto Sector Analyst Meet Presentation[1]](https://img.pdfslide.us/doc/110x75/577cda2e1a28ab9e78a504ec/auto-sector-analyst-meet-presentation1.jpg)