Embed Size (px)
Citation preview
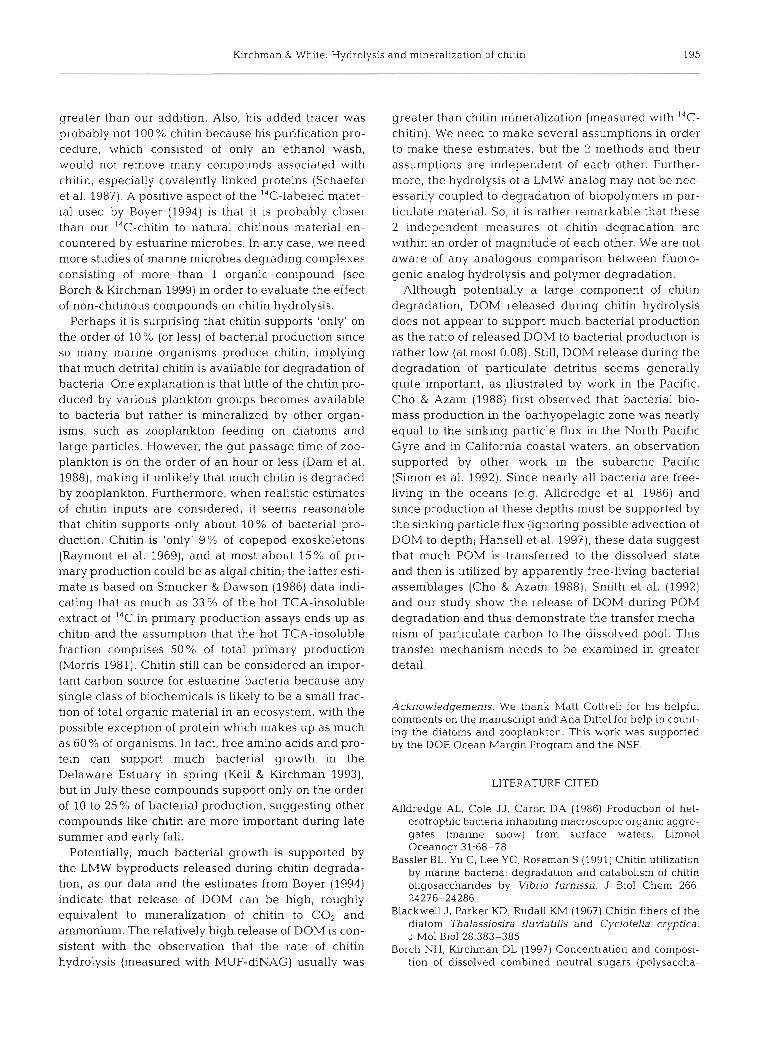
Vol. 18: 187-196.1999 AQUATIC MICROBIAL ECOLOGY
Aquat Microb Ecol Published August 9
Hydrolysis and mineralization of chitin in the Delaware Estuary
David L. Kirchman*, Jacques White* *
College of Marine Studies, University of Delaware, Lewes. Delaware 19958, USA
ABSTRACT. We examined various aspects of chitin degradation in order to estimate degradation rates and the contribution of chltin to supporting bacterial growth in the Delaware estuary. Hydrolysis of the chtin analog, methylumbelliferyl-N,Nf-diacetyl-chitobioside (MUF-&NAG), and mineralization of 14C- chitin varied in a conlplex pattern in the estuary and correlated only weakly at best with various indices of chitin production. Rates of MUF-diNAG hydrolysis and '"-chitin degradation were within an order of magnitude of each other, with hydrolysis rates usually exceeding chtin mineralization. Consistent with hydrolysis being greater than mineralization, we found substantial release of I4C-labeled dis- solved organic matter (DOM) during degradation of the '"-chitin; DOM release was roughly equal to respiration of 14C-chitin. This DOM release could support growth of bactena not attached or otherwise associated with the chitin, but rates of DOM release and direct chitin degradation seem low relative to bacterial production During 2 cruises in July and October, chitin appeared to support 5% or less of bacterial production, whereas during one cruise in September the percentage was about 30%. Esti- mates of chitin inputs into marine systems indicate that on the order of 10% of bacterial production could be supported by chitin. Although it appears low, few individual biochemicals are likely to sup- port much more bacterial growth than chitin, with the possible exception of protein and amino acids.
KEY WORDS: Chitin - DOC . DOM . Heterotrophic bacteria . Detritus
INTRODUCTION
T h e genera l mechanism by which bacteria d e g r a d e organic detritus in pelagic environments is understood. Bacteria at tach to detritus, if only briefly, in o rder to hydrolyze detrital biopolymers via cell-bound ecto- enzymes or exoenzymes released into restricted micro- niches afforded b y t h e detritus. T h e low molecular weight (LMW) byproducts a r e t h e n assimilated b y par- ticle-bound bacteria, o r a r e released into t h e surround- i n g wate r if rates of biopolymer hydrolysis exceed u p t a k e by t h e particle-bound bacteria. Although t h e genera l outline of detritus degradat ion is understood, w e n e e d more information a b o u t overall ra tes of detri- tus degradat ion, t h e relative contribution of detrital
'E-mail: [email protected] "Present address: People for Puget Sound, Seattle, Washing-
ton 98101, USA
carbon to support ing bacterial growth, a n d t h e rela- tionships a m o n g various aspects of particulate organic matter (POM) degradat ion, specifically hydrolysis of macromolecules comprising detritus a n d subsequent up take of LMW byproducts by bacteria.
T h e r e is some evidence indicating that hydrolysis exceeds up take of LMW byproducts, a t least over short t ime periods (<l d ) . Smith e t al. (1992) observed a l a r g e release of dissolved combined amino acids (DCAA) from larvacean houses, diatom flocs a n d fecal pel le t mar ine s n o w aggrega tes in t h e California Bight. This release w a s calculated to b e 50 to 98 % of total degra- dation, w h e r e t h e 'total' w a s defined a s DCAA release plus bacterial carbon d e m a n d , as est imated from bac- terial production. Release of DCAA a n d presumably of other dissolved organic mat te r (DOM) implies that hydrolysis rates of detrital biopolymers exceed u p t a k e by particle-bound bacteria. It is not clear if this uncou- pling be tween hydrolysis a n d u p t a k e is conlrnon a n d occurs with other types of particulate detritus.
O Inter-Research 1999
188 Aquat Microb Ec
The few studies examining hydrolysis of dissolved biopolymers have come to different conclusions about the relationship between hydrolysis and uptake. Keil & Kirchman (1993), for example, found that about 30% of utilized dissolved protein was released as LMW byproducts in the Delaware Bay Estuary, whereas Rosenstock & Simon (1993) observed little if any free amino acid release during protein degrada- tion in Lake Constance. Although the methodological details of the 2 studies differed, both used radiola- beled substrates to examine protein utilization, an approach not entirely suited for examining hydrolysis per se, because it is difficult to separate hydrolysis from uptake of the radiolabeled byproducts. Hydroly- sis is usually measured using fluorogenic analogs because they are sensitive and easy to use and because uptake of byproducts does not affect esti- mates of hydrolysis rates. However, these analogs may not trace adequately all aspects of biopolymer degradation. Even when the analog mimics faithfully the characteristic linkage of a biopolymer, hydrolysis of a LMW analog may not correlate with rates at all steps in the degradation of a high molecular weight polymer. Although these potential problems are well known, the relationship between fluorogenic analog hydrolysis and degradation of an actual biopolymer has not been examined.
Chitin is an important compound for examining the relationship between hydrolysis and degradation because inputs of detrital chitin into the oceans may be very high. Chitin is synthesized by several marine organisms (for general reviews, see Gooday 1990, Mulisch 1993), as extracellular material from selected algae (e.g. Blackwell et al. 1967, Chretiennot-Dinet & Giraud-Guille 1997), cell walls of some chlorophytes (Mulisch 1993), exoskeletons, including molts from copepods and marine invertebrate larvae (Gooday 1990), and the peritrophic membrane of fecal pellets excreted by copepods (Yoshikoshi & K6 1988). In spite of being recognized as the second most abundant biopolymer in nature (Gooday 1990), surprisingly few ecological studies have examined chitin degradation (Boyer 1986. 1994, Herwig et al. 1988), although sev- eral studies have used fluorogenic analogs to examine chitinase activity. Chitin is generally thought to be degraded easily, but recent studies indicate that some forms of chitin may be somewhat refractory to bacter- ial attack. McCarthy et al. (1997) suggested that byproducts from chitin degradation may contribute to the dissolved organic nitrogen pool, implying that some soluble chitin components are degraded slowly. Also, chitin has been found preserved in fossils (e.g. Stankiewicz et al. 1997).
There is some evidence that DOM is released during chitin degradation, i.e. that hydrolysis exceeds uptake
and degradation of LMW byproducts. Boyer (1994) found 12 to 21 % of added I4C-chitin was released into the dissolved pool in sediment samples, but he did not observe any DOM production in water column sam- ples. Chitin appears to be degraded very rapidly, with 20 to 30% removed d-' in the York River estuary (Boyer 1994), although other studies have found slower rates (e.g. Hillman et al. 1989). The contribution of chitin to supporting bacterial growth, however, is unknown.
Here we examine chitinase activity and the degrada- tion of chitin in the Delaware estuary. We compared hydrolysis of the fluorogenic analog of chitin, methyl- umbelliferyl-N,N1-diacetyl-chitobioside (MUF-diNAG), with rates of mineralization and solubilization (DOM production) from '"-chitin. We found substantial DOM production during chitin degradation, consistent with data showing chitin hydrolysis generally exceed- ing chitin mineralization. Rates of chitin degradation, however, were low compared to bacterial production.
METHODS AND MATERIALS
The experiments discussed here were conducted with surface water samples collected along transects of the Delaware Bay in 1995. Hoch & Kirchman (1993) give a map of the transects that ranged from the DeIaware River (freshwater) to coastal waters. Chloro- phyll concentrations were measured from the fluores- cence in acetone-extractions of particulate material collected on GF/F filters. In October, chlorophyll was estimated from in vivo fluorescence and from regres- sion analysis of chlorophyll concentrations versus jn vivo fluorescence measured during other cruises weeks before and after the October cruise. Incubations for chitinase activity and chitin degradation (see below) were conducted at surface seawater tempera- tures in the dark.
Hydrolysis of a chitin analog. Chitinase activity was estimated from the hyd.rolysis of the chitin analog MUF-diNAG (Sigma). Hydrolysis of the chitin-like bond releases a fluorescent byproduct, methylum- bellerone (MUF). In July and September, MUF- diNAG was added at 2 concentrations (50 nM or 50 PM) and after a ca 10 h incubation, the reaction was killed by the addition of glycine buffer (pH 10.5; Montgomery & Kirchman 1993) which also enhances the fluorescence. Fluorescence was measured by a Hoeffer DNA fluorometer. Fluorescence of MUF at various concentrations was determined to estimate moles of MUF released during MUF-diNAG hydroly- sis. In September, MUF-diNAG hydrolysis was exam- ined at several MUF-diNAG concentrations (see 'ResuIts').
Kirchman & White: Hydroly sls and m~neralization of chitin 189
Synthesis and characterization of 14C-chitin. We examined the production of I4C-labeled dissolved organic carbon (D014C) and respiration of 14C02 dur- ing degradation of 14C-chitin. Since it is not commer- cially available, it was necessary to synthesize 14C- chitin by feeding the fungus Paeosphaeria spartinicola N-acetyl-'4C-glucosamine (Amersham). This fungus, originally isolated from the salt marsh around Sapelo Island, Georgia, is thought to be one of the major decomposers of standing-dead marsh grass, specifi- cally Spartina alterniflora (Newell 1993), although we used it mainly because fungi have chitinous cell walls.
The fungus was inoculated into a media containing glucose (0.1 g 100 ml-l), yeast extract (0.01 g 100 ml-l), and 10 pCi of N-acetyl-[l-'4C]-glucosamine in 15 PSU seawater (20 m1 total). After growth for 5 d, the fungus was harvested by centrifugation and the pellet rinsed twice with dionized water (Milli Q-water); all centrifu- gations mentioned here were at 13000 rpm (15 000 X g) in a microcentrifuge. Epifluorescence microscopy revealed no contaminating bacteria. The following procedure to isolate I4C-chitin was based on Roff et al. (1994). After sonicating the resuspended fungal pellet briefly to break up the clumps, SDS was added to 4 % final concentration and incubated at 90°C for 2 h. After cooling, the mixture was centrifuged and the resulting pellet resuspended in a Tris-EDTA buffer (pH 7.5); the pellet was again sonicated briefly to break up the clumps. Protease K was added to a final concentration of 1 mg ml-' and incubated overnight at 37OC. The mixture was again centrifuged and the pellet was resuspended in SDS to remove protease bound to the partially-purified chitin. The mixture was again cen- trifuged and the pellet washed 3 times with Milli-Q water. The pellet was then resuspended and washed twice in chloroform plus methanol (1: l ) after which the pellet was dried. The dried pellet was resuspended in sterile deionized water and sonicated to disperse the pellet. The average specific activity of the 14C-chitin preparations was 26 dpm ng-l, as estimated by high performance liquid chromatography (HPLC).
The specificity of the labeling and purity of the I4C- chitin preparations were examined by HPLC. Subsam- ples from various radiolabeled chitin batches were hydrolyzed in HC1 (1 part aqueous sample:9 parts con- centrated HCl) for 10 h at 80°C (Rupley 1964). Our pre- liminary analysis indicates that this procedure gives equal or higher recovery of glucosamine from chitin than the following procedures: 6 N HCl for 20 h at 110°C (Smucker & Dawson 1986), 3 N HCl for 4 h at 10O0C, and the H2S04 method often used for polysac- charides (Pakulski & Benner 1992). Subsamples from the hydrolyzed chitin were diluted 1:500 with deion- ized water and analyzed by ion exchange HPLC with pulse amperometric detection (Borch & Kirchman
1997). Aliquots (0.5 ml) from the HPLC were collected with a fraction collector and radioassayed.
In order to measure incorporation of chitin carbon into bacterial biomass, it is necessary to examine uptake of 'soluble chitin', i.e. chitin oligomers that pass through 0.2 pm filters. Incorporation of carbon from particulate 14C-chitin cannot be examined because I4C in bacterial bion~ass cannot be distinguished from the original particulate I4C-chitin. To synthesize I4C-chitin oligomers, we did a partial acid hydrolysis of I4C-chitin obtained as described above. Domard & Cartier (1989) found that hydrolysis of chitosan with 12 M HC1 for 30 min at 70°C resulted in chitin oligomers, >90% of which were larger than dimers of glucosamine; the dimer is thought to be the largest chitin byproduct that can be transported by bacteria (e.g. Bassler et al. 1991). However, we found that hydrolysis of chitin in 3 M HC1 for 5 min at 7O0C was necessary; based on HPLC analysis, this hydrolysis condition gave <5% LMW products (e.g. glucosamine and dimers of glucosamine and N-acetylglucosamine) while resulting in usable amounts of soluble, high molecular weight 14C-chitin oligomers. After hydrolysis, the chitin suspension was placed on ice, neutralized by slowing adding solid NaHC03 until the bubbling stopped, and then filtered through a 0.22 pm microfuge filter (Micropure, Ami- con). The soluble chitin oligomers (<0.22 pm) were used in experiments.
Uptake and respiration of 14C-chitin oligomers in Delaware coastal waters were examined in an experi- ment in December 1998. The 14C-chitin oligomers were added to 3 live and 2 killed samples and were incubated for 24 h at lg°C (7" above in situ tem- perature). After incubation, the water was acidified and I4CO2 collected as described below. After respira- tion was measured, radioactivity incorporated into microbes was collected on 0.2 pm polycarbonate filters (Poretics) and rinsed twice with about 3 m1 filtered sea- water. We define % incorporation efficiency as: incor- poration into biomass/(respiration + incorporation) X
100. Degradation of 14C-chitin. After storage at -20°C,
14C-chitin preparations were thawed and sonicated to break up the clumps and to obtain a uniform suspen- sion of particles. Subsamples of these suspensions were added to surface seawater (ca 0.5 m) from various locations in the Delaware estuary (see 'Results') and incubated for about 12 h at in situ temperatures in the dark. The final concentration of added I4C-chitin was 489 pg l?' in July and 293 pg 1-' in September and October. Controls killed with formaldehyde were run at the same time. At the end of the incubation, the undegraded chitin particles were removed by filtration (0.45 pm) and the I4CO2 was radioassayed by acidify- ing the sample and collecting the evolved 14C02 in a
190 Aquat Microb Ecol 18: 187-196, 1999
base trap (Crawford & Crawford Table 1 . Summary of HPLC analysis of radiolabeled chitin preparations. GlcN =
1976). The acid stable radioactivity glucosamine; GalN = galactosarnine See Fig. 1 for example of a chromatogram
remaininq in solution, i.e. dissolved I I
sured using the dual label approach I I4C 79 21 95 68 14 10 7 1
organic carbon ( ~ 0 ~ 1 , was also radioassayed.
Bacterial production was mea-
with 14c-leucine (Leu) and 3H- 89 11 66 69 15 9
thymidine (TdR) (Chin-Leo & Kirch- 90 10 72 68 15 8
Radio- % of recovered % recoveryb % of total sugars label radioactivityd GlcN GalN Galactose Glucose
GlcN GalN
man 1988). Incorporation rates (nM I Average 86 14 78 68 15 9 1
- . . . mol-' for TdR and Leu, respectively. ( analyzed) X i00
h-') were converted to carbon units (pg C 1-l d-') using the conversion factor 1.1 X 10¹⁸ and 6.5 X 10¹⁶ cell
These factors were measured in the I I
"(Radioactivity recovered as either GlcN or GalN)/(Total radioactivity recovered during HPLC analysis) X 100
b[Radioactivit~ recovered durina HPLC analvsis)/(Total radioactivity
Delaware estuary during empirical conversion factor experiments conducted in 1986-1989 RESULTS (Hoch & Kirchman 1993). The more commonly used factors are higher by almost 2-fold than these factors, Chzracterization of I4C-chitin and MUF-diNAG but if we would use the higher factors, our conclusions hydrolysis would not change. Cell mass was assumed to be 20 fg C cell-' (Lee & Fuhrman 1987). The I4C-chitin used to examine chitin degradation
during this study was characterized by HPLC analysis
1 GlcN
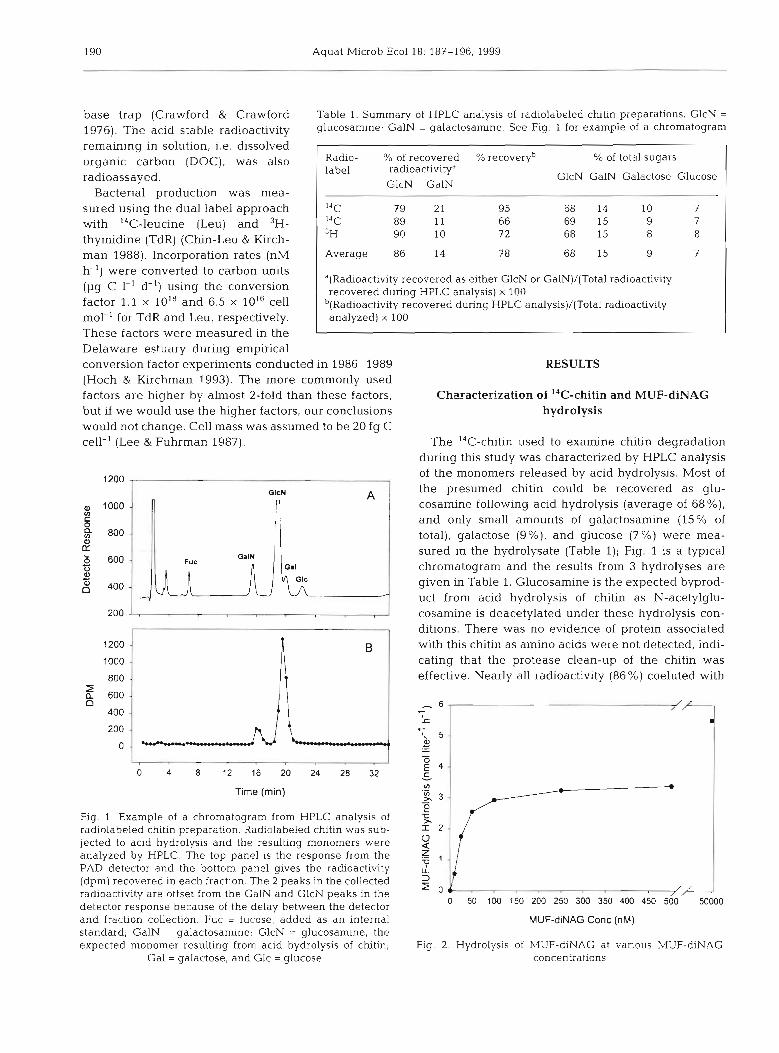
of the monomers released by acid hydrolysis. Most of the presumed chitin could be recovered as glu- cosarnine following acid hydrolysis (average of 68%), and only small amounts of galactosamine (15% of total), galactose (g%), and glucose (7%) were mea- sured in the hydrolysate (Table l); Fig. l is a typical chrornatograrn and the results from 3 hydrolyses are given in Table 1. Glucosamine is the expected byprod- uct from acid hydrolysis of chitin as N-acetylglu-
200 l . cosamine is deacetylated under these hydrolysis con- I ! ditions. There was no evidence of protein associated
with this chitin as amino acids were not detected, indi- cating that the protease clean-up of the chitin was effective. Nearly all radioactivity (86%) coeluted with
Time (min) - Fig. l . Example of a chromatogram from HPLC analysis of radiolabeled chitin preparation. Radiolabeled chltin was sub- jected to acid hydrolysis and the resulting monomers were analyzed by HPLC. The top panel is the response from the Z PAD detector and the bottom panel gives the radioactivity 2 (dpm) recovered in each fraction. The 2 peaks in the collected j radioactivity are offset from the GalN and GlcN peaks in the /F detector response because of the delay between the detector 0 50 100 150 200 250 300 350 400 450 500 50000
and fraction collection. Fuc = fucose, added as an internal MUFdiNAG Conc (nM) standard; GalN = galactosamine; GlcN = glucosamine, the expected monomer resulting from acld hydrolysis of chitin; Fig. 2 Hydrolysis of MUF-diNAG at vanous MUF-diNAG
Gal = galactose, and Glc = glucose concentratlons
l r c h m a n & White: Hydrolysis and mineralization of ch~t in 191
glucosamine and the rest of the radioactivity (14 Yo) coeluted with galactosamine (Table 1). Although we do not understand the presence of galactosamine, and the hydrolysis procedure could be improved (overall recovery of radioactivity in HPLC elutions was 78 15 'L) , these results indicate that the I4C-chitin was suf- ficiently pure and radiolabeled correctly for the pur- poses of this study.
An experiment in September determined that MUF- diNAG hydrolysis was highest at 50 pM (Fig. 2). Dur- ing July and September, hydrolysis rates were mea- sured at 2 concentrations (50 pM and 50 nM) along the transect. The ratio of 50 pM rate to the 50 nM rate was 14.7 rt 6.6 (SE; n = 23). Hydrolysis rates of MUF-diNAG at 50 PM and 50 nM were not correlated (r = 0.29; n =
23). For simplicity, we discuss below only rates of MUF-diNAG hydrolysis determined by hydrolysis of 50 ~.IM MUF-diNAG.
Spatial and temporary variation in chitin degradation and chitinase activity
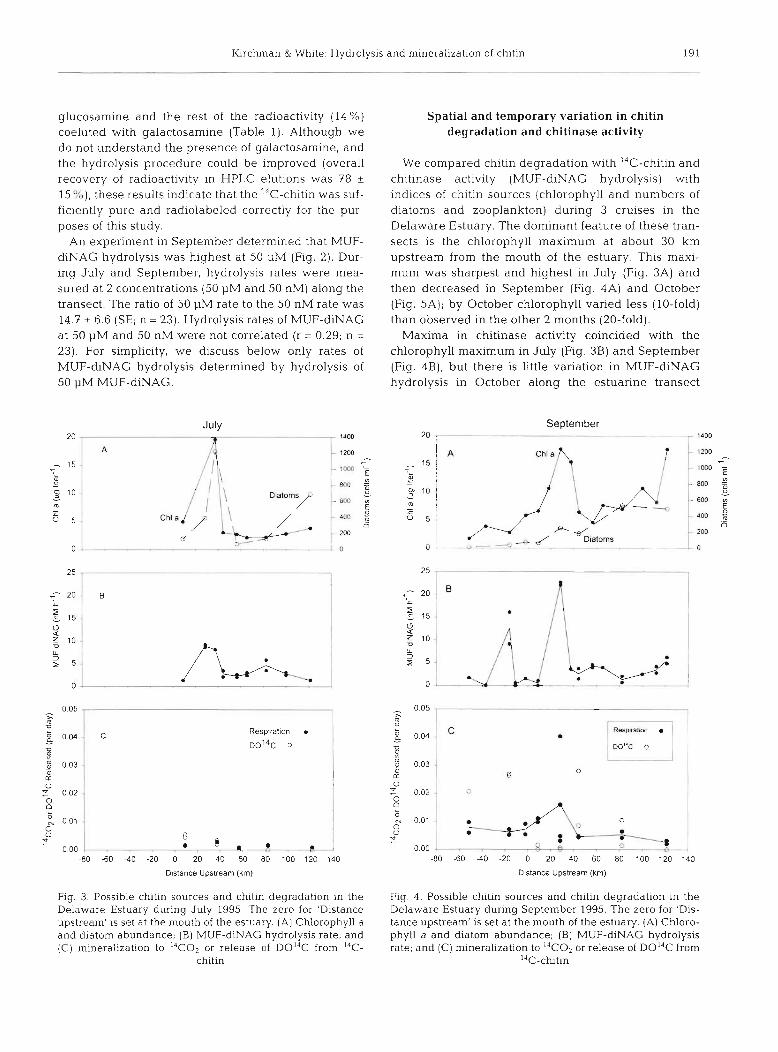
We compared chitin degradation with I4C-chitin and chitinase activity (MUF-diNAG hydrolysis) with indices of chitin sources (chlorophyll and numbers of diatoms and zooplankton) during 3 cruises in the Delaware Estuary. The dominant feature of these tran- sects is the chlorophyll maximum at about 30 km upstream from the mouth of the estuary. This maxi- mum was sharpest and highest in July (Fig. 3A) and then decreased in September (Fig. 4A) and October (Fig. 5A); by October chlorophyll varied less (10-fold) than observed in the other 2 months (20-fold).
Maxima in chitinase activity coincided with the chlorophyll maximum in July (Fig. 3B) and September (Fig. 4B), but there is little variation in MUF-diNAG hydrolysis in October along the estuarine transect
July September 20 - ----- -- T -- - p 1400 20 -- - - - - - 14w
D~stance Upstream (km)
Fig. 3. Possible chltln sources and chitln degradation In the Delaware Estuary during July 1995. The zero for 'Distance upstream' is set at the mouth of the estuary. (A) Chlorophyll a and d~atom abundance; (B) MUF-&NAG hydrolysis rate; and (C) mineralization to I4CO2 or release of D0I4C from "C-
chitin
-80 -60 4 0 -20 0 20 40 60 80 100 120 140
D~stance Upstream (km)
Fig. 4. Possible chitin sources and chitin degradation in the Delaware Estuary during September 1995. The zero for 'Dis- tance upstream' is set at the mouth of the estuary. (A) Chloro- phyll a and diatom abundance; (B) MUF-diNAG hydrolysis rate; and (C) mineralization to 14C02 or release of D014C from
14C-chtln
192 Aquat ~Microb Ecol 18: 187-196, 1999
October 20 -
A - 15
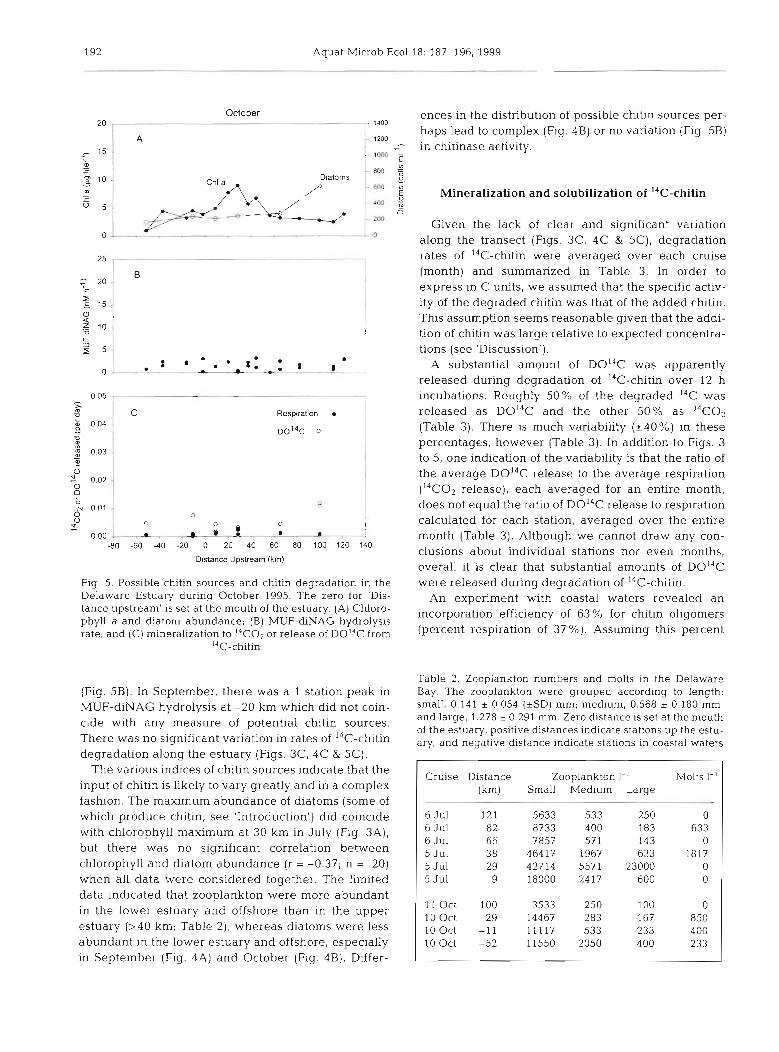
ences in the distribution of possible chitin sources per- haps lead to complex (Fig. 4B) or no variation (Fig. 5B) in chitinase activity.
Mineralization and solubilization of 14C-chitin
Given the lack of clear and significant variation along the transect (Figs. 3C, 4C & SC), degradation rates of I4C-chitin were averaged over each cruise (month) and summarized in Table 3. In order to express in C units, we assumed that the specific activ- ity of the degraded chitin was that of the added chitin. This assumption seems reasonable given that the addi- tion of chitin was large relative to expected concentra- tions (see 'Discussion').
A substantial amount of D0I4C was apparently released during degradation of 14C-chitin over 12 h
005 ,-- p
- - p- incubations. Roughly 50% of the degraded 14C was
3 1 . Respirat~on released as D0l4C and the other 50% as 14C02 g 0 0 4
0014c 0 (Table 3). There is much variability (+40%) in these
U percentages, however (Table 3). In addition to Figs. 3 g 0.03 - to 5, one indication of the variability is that the ratio of o 1 the average DO14C release to the average respiration
0 C]
O o 2 l (14C02 release), each averaged for an entire month, B does not equal the ratio of D014C release to respiration g "01
0 0
G 0 o calculated for each station, averaged over the entire
P, 0 00 . . . L@- --c m J-. month (Table 3). Although we cannot draw any con-
-80 -60 -40 -20 0 20 40 60 80 100 120 140 clusions about individual stations nor even months, O~stance Upstream (km)
overall it is clear that substantial amounts of D0I4C Flg. 5. Possible chitin sources and chitin degradation in the were released during degradation of I4C-chitin.
- -
Delaware Estuary during October 1995. The zero for 'Dis- An experiment with coastal waters revealed an tance upstream' is set a t the mouth of the estuary. (A) Chloro- incorporation efficiency of 63 for chitin oligomers phyll a and diatom abundance; (B) MUF-diNAG hydrolysis rate; and (C) mineralization to I4Co2 or release of D ~ ~ ~ c from (Percent respiration of 37 %). ~ s s u m i n ~ this percent
(Fig. 5B). In September, there was a 1 station peak in MUF-diNAG hydrolysis at -20 km which did not coin- cide with any measure of potential chitin sources. There was no significant variation in rates of 14C-chitin degradation along the estuary (Figs. 3C, 4C & 5C).
The various indices of chitin sources indicate that the input of chitin is likely to vary greatly and in a complex fashion. The maximum abundance of diatoms (some of which produce chitin; see 'Introduction') did coincide with chlorophyll maximum at 30 km in July (Fig. 3A), but there was no significant correlation between chlorophyll and diatom abundance (r = -0.37; n = 20) when all data were considered together. The limited data indicated that zooplankton were more abundant In the lower estuary and offshore than in the upper estuary (>40 km; Table 2) , whereas diatoms were less abundant in the lower estuary and offshore, especially
Table 2. Zooplankton numbers and molts in the Delaware Bay. The zooplankton were grouped according to length: small, 0.141 t 0.054 (t SD) mm; medium, 0.568 * 0.180 mm; and large, 1.218 + 0.291 mm. Zero &stance is set at the mouth of the estuary; positive distances indicate stations up the estu- ary, and negative distance indicate stations in coastal waters
Cruise Distance (km)
6 Jul 221 6 Jul 82 6 Jul 66 5 Jul 3 8 5 Jul 2 9 5 Jul 9
Zooplankton 1.' Small Medium Large
5633 533 250 8733 400 183 7857 571 143
46417 1967 633 42714 5571 23000 18000 2417 600
Molts I-'
I l O c t 100 3533 250 100 0 10 Oct 29 14467 283 167 850 10 Oct -11 11117 533 233 400 10 Oct -52 11550 2050 400 233
in September (Fig. 4A) and October (Fig. 4B). Differ-
Kirchinan & White. Hydi-olysls and mineralization of ch~t in 193
Table 3. Summary of chitin hydrolysis (V,,, of MUF-diNAG hydrolysis) and de- average of these 2 measures is suffi- gradation of I4C-chitin In the Delaware Estuary. Numbers are mean and SD of all cient to estimates of
samples in the Delaware Estuary (see Figs. 3 to 5 ) chitin degradation. To determine I I how much bacterial lsroduction is
Date DO1" Respiration % DOI4C " Hydrolysis Hydrolys~sl release (pg (1: I-' d..') (pg C 1.' d.') degradationh
(pg c l r l d-l) - - - - -
5-6 Jul 0.75 + 1.1 0 7 i- 0 4 25 t 33 9 24 k 6.4 6 4 6-9 Sep 2 45 ? 2.5 10.2 ? 13 6 52 i 39 11.5 14.1 0.9 10-11 Oct 0 41 t 0.2 0.4 ? 0.2 52 ? 38 2.35 ? 3 16 2 9
"Percent DOC release was calculated as. [DOC release/(DOC release + Respi- ration)] X 100. This percentage was calculated for each sample and then the percentages were averaged for the entire month. Because of high variabhty (see Figs. 3 to 5), the ratio of the averages does not equal the average of the ratios
bRatio of MUF-diNAG hydrolysis rate to sum of D014C release plus respiration
supported by chitin, we applied the incorporation efficiency estimate to the respiration data (Table 4) in order to estimate the amount of chitin carbon incorporated into bio- mass. This parameter can be com- pared directly with bacterial biomass production.
The ratio of chitin hydrolysis to bacterial production ranged from 0.16 to 0.37 over the 3 mo, whereas the ratio of '"C-chitin incorporation into biomass to bacterial production was low (0.03 and 0.05) in July and
incorporation efficiency measured with 'soluble' chitin October and high (0.55) in September (Table 4 ) . The applies to particulate chitin, then of total chitin high ratio in September was due to fast rates of chitin degraded over a c24 h period, roughly 30 % is released degradation, not low bacterial production. With the as DOC, another 30% is respired as CO,, and the possible exception of September, these data indicate remaining 40 % is incorporated into bacterial biomass.
50 A July Chitin hydrolysis and 14C-chitin degradation
40
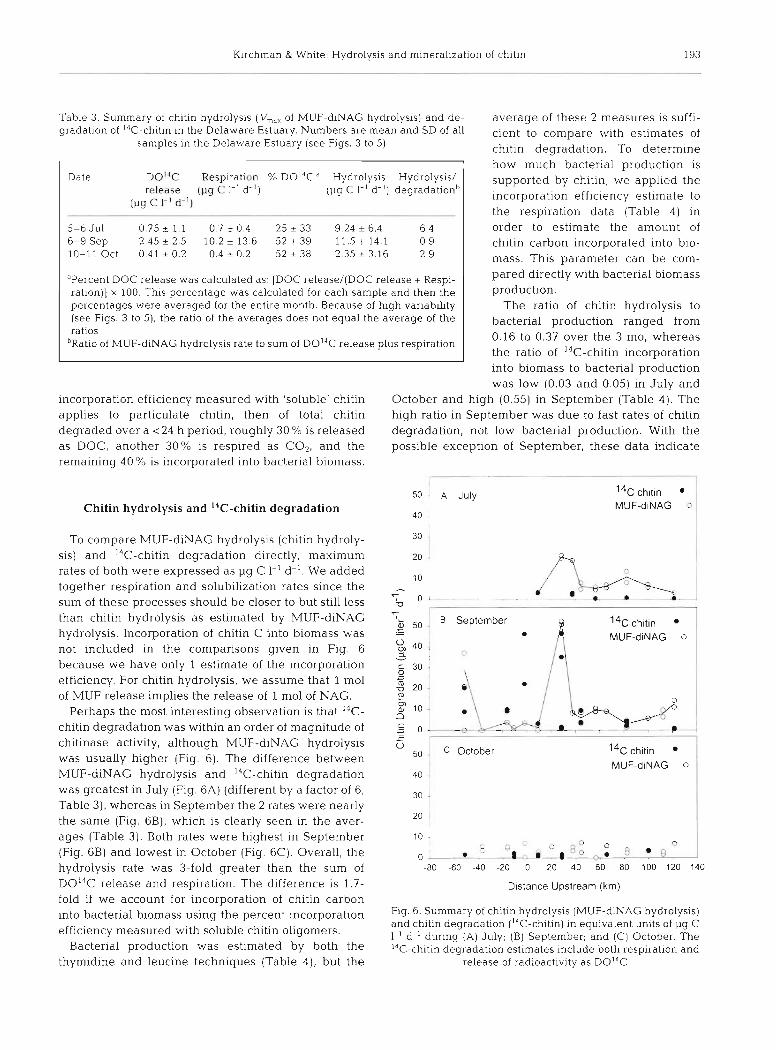
To compare MUF-diNAG hydrolysis (chitin hydroly- sis) and I4C-chitin degradation directly, maximum rates of both were expressed as pg C 1-' d- ' . We added together respiration and solubilization rates since the sum of these processes should be closer to but still less than chitin hydrolysis as estimated by MUF-diNAG hydrolysis. Incorporation of chitin C into biomass was not included in the comparisons given in Fig. 6 because we have only 1 estimate of the incorporation efficiency. For chitin hydrolysis, we assume that 1 m01 of MUF release implies the release of 1 m01 of NAG.
Perhaps the most interesting observation is that 14C- chitin degradation was within an order of magnitude of chitinase activity, although MUF-diNAG hydrolysis was usually higher (Fig. 6). The difference between MUF-diNAG hydrolysis and I4C-chitin degradation
B September I4c ch~tin
MUFdNAG o
-
0 50 C October
40 l
was greatest in July (Fig. 6A) (different by a factor of 6; 30
Table 3), whereas in September the 2 rates were nearly the same (Fig. 6B), which is clearly seen in the aver- 20 -1
ages (Table 3). Both rates were highest in September 10 - , -
(Fig. 6B) and lowest in October (Fig. 6C). Overall, the >A 0
0 -. .* . 8 ,:. & .a.:.-.+-" hydrolysis rate was 3-fold greater than the sum of -80 -60 -40 -20 o 20 40 60 80 l o o 120 140
DOI4C release and respiration. The difference is 1.7- D~stance Upstream (km) fold if we account for incorporation of chitin carbon into bacterial biomass using the percent incorporation Fig. 6. Summary of chitin hydrolysis (MUF- NAG hydrolysis)
and chitin degradation (I4C-chitin) in equivalent units of pg C efficiency measured with soluble chitin oligomers. 1.' d-' during (A) July; (B) September, and (C) October. The
production was the 14C-chitin degradation estimates include both respiration and thymidine and leucine techniques (Table 4), but the release of radioactivity as DOI4C
194 Aquat Microb Ecol 18: 187-196, 1999
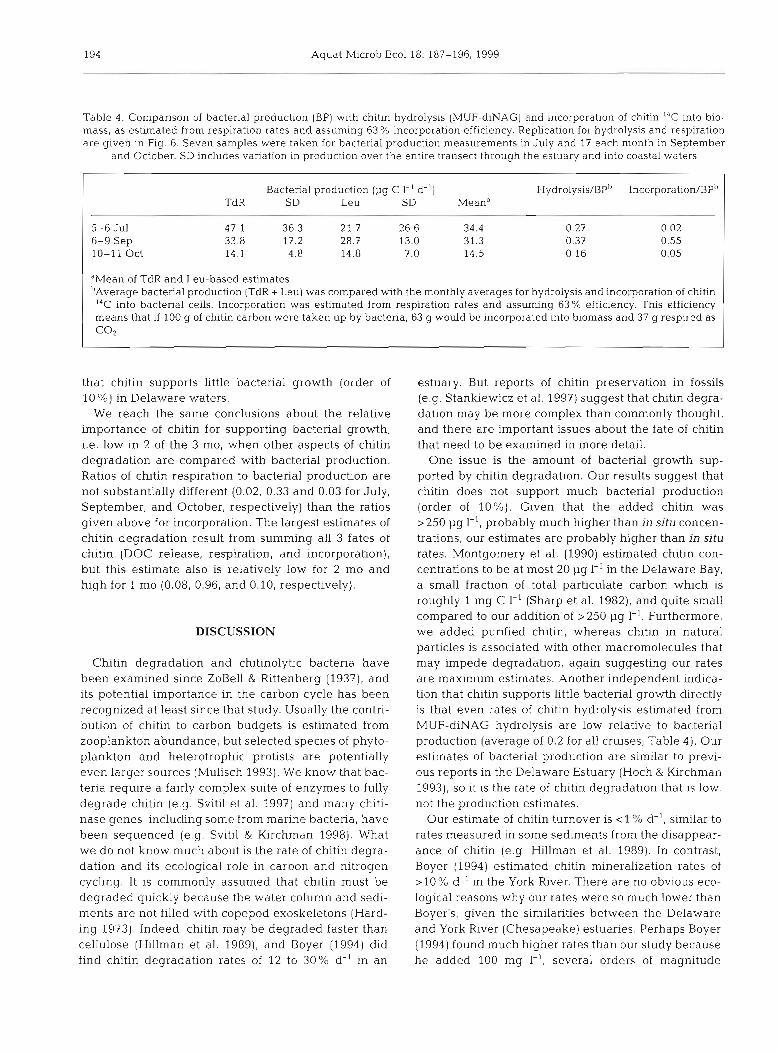
Table 4. Comparison of bacterial production (BP) with chitin hydrolysis (MUF-diNAG) and incorporation of chitin 14C into bio- mass, as estimated from respiration rates and assuming 63 "/o incorporation efficiency. Replication for hydrolysis and respiration are given in Fig. 6. Seven samples were taken for bacteria1 production measurements in July and 17 each month in September
and October. SD includes variation in production over the entlre transect through the estuary and into coastal waters
Bacterial production (pg C 1-' d-l) ~ ~ d r o l ~ s i s / ~ ~ ~ ~ncorpora t ion /~P~ TdR S D Leu SD Meana
5-6 Jul 47.1 36.3 21.7 26.6 34.4 0.27 0.02 6-9 Sep 33.8 17.2 28.7 13.0 31.3 0.37 0.55 10-11 Oct 14.1 4.8 14.8 7.0 14.5 0.16 0.05
dMean of TdR and Leu-based estimates ' ~ v e r a g e bacterial production (TdR + Leu) was compared with the monthly averages for hydrolysis and incorporation of chitin I4C into bacterial cells. Incorporation was estimated from respiration rates and assuming 63% efficiency. This efficiency means that ~f 100 g of ch~tin carbon were taken up by bacteria, 63 g would be incorporated into biomass and 37 g respired as c02
that chitin supports little bacterial growth (order of 10%) in Delaware waters.
We reach the same conclusions about the relative importance of chitin for supporting bacterial growth, i.e. low in 2 of the 3 mo, when other aspects of chitin degradation are compared with bacterial production. Ratios of chitin respiration to bacterial production are not substantially different (0.02, 0.33 and 0.03 for July. September, and October, respectively) than the ratios given above for incorporation. The largest estimates of chitin degradation result from summing all 3 fates of chitin (DOC release, respiration, and incorporation), but this estimate also is relatively low for 2 mo and high for 1 mo (0.08, 0.96, and 0.10, respectively).
DISCUSSION
Chitin degradation and chitinolytic bacteria have been examined since ZoBell & Rittenberg (1937), and its potential importance in the carbon cycle has been recognized at least since that study. Usually the contri- bution of chitin to carbon budgets is estimated from zooplankton abundance, but selected species of phyto- plankton and heterotrophic protists are potentially even larger sources (Mulisch 1993). We know that bac- teria require a fairly complex suite of enzymes to fully degrade chitin (e.g. Svitil et al. 1997) and many chiti- nase genes, including some from marine bacteria, have been sequenced (e.g. Svitil & Kirchman 1998). What we do not know much about is the rate of chitin degra- dation and its ecological role in carbon and nitrogen cycling. It is commonly assumed that chitin must be degraded quickly because the water column and sedi- ments are not filled with copepod exoskeletons (Hard- ing 1973). Indeed, chitin may be degraded fa.ster than cellulose (Hillman et al. 1989), and Boyer (1994) did find chitin degradation rates of 12 to 30% d-' in an
estuary. But reports of chitin preservation in fossils (e.g. Stankiewicz et a!. 1997) suggest that chitin degra- dation may be more complex than commonly thought, and there are important issues about the fate of chitin that need to be examined in more detail.
One issue is the amount of bacterial growth sup- ported by chitin degradation. Our results suggest that chitin does not support much bacterial production (order of 10%). Given that the added chitin was >250 pg 1-l, probably much higher than in situ concen- trations, our estimates are probably higher than in situ rates. Montgomery et al. (1990) estimated chitin con- centrations to be at most 20 pg 1-' in the Delaware Bay, a small fraction of total particulate carbon which is roughly 1 mg C l-' (Sharp et al. 1982), and quite small compared to our addition of >250 pg 1-l. Furthermore, we added purified chitin, whereas chitin in natural particles is associated with other macromolecules that may impede degradation, again suggesting our rates are maximum estimates. Another independent indica- tion that chitin supports little bacterial growth directly is that even rates of chitin hydrolysis estimated from MUF-diNAG hydrolysis are low relative to bacterial production (average of 0.2 for all cruises; Table 4). Our estimates of bacterial production are similar to previ- ous reports in the Delaware Estuary (Hoch & Kirchman 1993), so it is the rate of chitin degradation that is low, not the production estimates.
Our estimate of chitin turnover is <? % d-', sim.ilar to rates measured in some sed~ments from the disappear- ance of chitin (e.g. Hillman et al. 1989). In contrast, Boyer (1994) estimated chitin mineralization rates of > 10 % d-' in the York River. There are no obvious eco- logical reasons why our rates were so much lower than Boyer's, given the similarities between the Delaware and York River (Chesapeake) estuaries. Perhaps Boyer (1994) found much higher rates than our study because he added 100 mg 1-l, several orders of magnitude
Kirchman & White: Hydrolysis and m~neralization of chitin 195
greater than our addition. Also, his added tracer was probably not l00 % chitin because his purification pro- cedure, which consisted of only an ethanol wash, would not remove many compounds associated with chitin, especially covalently linked proteins (Schaefer et al. 1987). A positive aspect of the I4C-labeled mater- ial used by Boyer (1994) is that it is probably closer than our I4C-chitin to natural chitinous material en- countered by estuarine microbes. In any case, we need more studies of marine microbes degrading conlplexes consisting of more than 1 organic compound (see Borch & Kirchman 1999) in order to evaluate the effect of non-chitinous compounds on chitin hydrolysis.
Perhaps it is surprising that chitin supports 'only' on the order of 10 % (or less) of bacterial production since so many marine organisms produce chitin, implying that much detrital chitin is available for degradation of bacteria. One explanation is that little of the chitin pro- duced by various plankton groups becomes available to bacteria but rather is mineralized by other organ- isms, such as zooplankton feeding on diatoms and large particles. However, the gut passage time of zoo- plankton is on the order of an hour or less (Dam et al. 1988), making it unlikely that much chitin is degraded by zooplankton. Furthermore, when realistic estimates of chitin inputs are considered, it seems reasonable that chitin supports only about 10% of bacterial pro- duction. Chitin is 'only' 9% of copepod exoskeletons (Raymont et al. 1969), and at most about 15% of prl- mary production could be as algal chitin; the latter esti- mate is based on Smucker & Dawson (1986) data indi- cating that as much as 33% of the hot TCA-insoluble extract of I4C in primary production assays ends up as chitin and the assumption that the hot TCA-insoluble fraction comprises 50% of total primary production (Morris 1981). Chitin still can be considered an impor- tant carbon source for estuarine bacteria because any single class of biochemicals is likely to be a small frac- tion of total organic material in an ecosystem, with the possible exception of protein which makes up as much as 60 % of organisms. In fact, free amino acids and pro- tein can support much bacterial growth in the Delaware Estuary in spring (Keil & Kirchman 1993), but in July these compounds support only on the order of 10 to 25 % of bacterial production, suggesting other compounds like chitin are more important during late summer and early fall.
Potentially, much bacterial growth is supported by the LMW byproducts released during chitin degrada- tion, as our data and the estimates from Boyer (1994) indicate that release of DOM can be high, roughly equivalent to mineralization of chitin to CO2 and arnnlonium. The relatively high release of DOM is con- sistent with the observation that the rate of chitin hydrolysis (measured with MUF-diNAG) usually was
greater than chitin mineralization (measured with I4C- chitin). We need to make several assunlptions in order to make these estimates, but the 2 methods and their assumptions are independent of each other. Further- more, the hydrolysis of a LMW analog may not be nec- essarily coupled to degradation of biopolymers in par- ticulate material. So, it is rather remarkable that these 2 independent measures of chitin degradation are within an order of magnitude of each other. We are not aware of any analogous comparison between fluoro- genic analog hydrolysis and polynler degradation.
Although potentially a large component of chitin degradation, DOM released during chitin hydrolysis does not appear to support much bacterial production as the ratio of released DOM to bacterial production is rather low (at most 0.08). Still, DOM release during the degradation of particulate detritus seems generally quite important, as illustrated by work in the Pacific. Cho & Azam (1988) first observed that bacterial bio- mass production in the bathyopelagic zone was nearly equal to the sinking particle flux in the North Pacific Gyre and in California coastal waters, an observation supported by other work in the subarctic Pacific (Simon et al. 1992). Since nearly all bacteria are free- living in the oceans (e.g. Alldredge et al. 1986) and since production at these depths must be supported by the sinking particle flux (ignoring possible advection of DOM to depth; Hansell et al. 1997), these data suggest that much POM is transferred to the dissolved state and then is utilized by apparently free-living bacterial assemblages (Cho & Azam 1988). Smith et al. (1992) and our study show the release of DOM during POM degradation and thus demonstrate the transfer mecha- nism of particulate carbon to the dissolved pool. This transfer mechanism needs to be examined in greater detail.
Acknowledgements. We thank h4att Cottrell for his helpful comments on the manuscript and Ana Dittel for help in count- ing the diatoms and zooplankton. This work was supported by the DOE Ocean Margin Program and the NSF.
LITERATURE CITED
Alldredge AL, Cole JJ, Caron DA (1986) Production of het- erotrophic bacteria inhabiting macroscopic organic aggre- gates (marine snow) from surface waters. Limnol Oceanogr 31 68-78
Bassler BL, Yu C, Lee YC, Roseman S (1991) Chitin utilization by marine bacteria: degradation and catabolism of chitin oligosaccharides by Vibno furnissii. J Biol Chem 266: 24276-24286
Blackwell J, Parker KD, Rudall KM (1967) Chitin fibers of the diatom Thalassiosira fluviatilis and Cyclotella cryptica. J Mol Biol28:383-385
Borch NH, Kirchman DL (1997) Concentration and composi- tion of dissolved combined neutral sugars (polysaccha-
Aquat Microb Ecol 18: 187-196, 1999
rides) in sewater determined by HPLC-PAD. mar Chem 57:85-95
Borch NH, Kirchman DL (1999) Protection of protein from bacterial degradation by submicron particles. Aquat Microb Ecol 16:265-272
Boyer J (1986) End products of anaerobic chitin degradation by salt marsh bacteria as substrates for dissimilatory sul- fate reduction and methanogenesis. Appl Environ Micro- bio1 52:1415-1418
Boyer JN (1994) Aerobic and anaerobic degradation and min- eralization of 14C-chitin by water column and sediment inocula of the York River Estuary, Virginia. Appl Environ Microbiol 60:174-179
Chin-Leo G, Kirchman DL (1988) Estimating bacterial pro- duction in marine waters from the simultaneous incorpo- ration of thymidine and leucine. Appl Environ Microbiol 54:1934-1939
Cho BC, Azarn F (1988) Major role of bacteria in biogeochem- ical fluxes in the ocean's 1nteri.or. Nature 332.441-443
Chretiennot-Dinet MJ, Giraud-Guille MM (1997) The chiti- nous nature of filaments ejected by Phaeocystis (Prymne- siophyceae). J Phycol33:666-672
Crawford DL, Crawford RL (1976) Microbial degradation of lignocellulose: the lignin component. Appl Environ Micro- bio131.714-717
Dam HG, Peterson WT (1988) The effect of temperature on the gut clearance rate constant of planktonic copepods. J Exp Mar Biol Ecol 123:l-14
Domard A, Cartier N (1989) Glucosamine oligomers: 1. Prepa- ration and characterization. Int J Biol Macromol 11: 297-302
Gooday GW (1990) The ecology of chitin degradation. Adv Microb Ecol 11:387-430
Hansell DA, Bates NR, Carlson CA (1997) Predominance of vertical loss of carbon from surface waters of the equator- ial Pacific Ocean. Nature 386:59-61
Harding GCH (1973) Decomposition of marine copepods. Limnol Oceanogr 18:670-673
Herwig RP, Pellerin NB, Irgens RL, Maki JS, Staley JT (1988) Chitinolytic bacteria and chitin mineralization in the marine waters and sediments along the Antarctic penin- sula. FEMS Microb Ecol53:lOl-112
Hillman K, Gooday GW, Prosser JI (1989) The mineralization of chitin in the sediments of the Ythan Estuary, Aberdeen- shire, Scotland. Estuar Coast Shelf Sci 29:601-612
Hoch MP, Kirchman DL (1993) Seasonal and inter-annual variability in bacterial production and biomass in a tem- perate estuary. Mar Ecol Prog Ser 98:283-295
Keil RG, Kirchman DL (1993) Dissolved combined amino acids: chemical form and utilization by marine bacteria. Limnol Oceanogr 38: 1256-1270
Lee S, Fuhrrnan JA (1987) Relationships between biovol.ume and biomass of naturally derived marine bacterioplank- ton. Appl Environ Microbiol53(6):1298-1303
McCarthy IM, Pratum T, Hedges J , Benner R (1997) Chemical composition of dissolved organic nitrogen in the ocean. Nature 390:150-154
Montgornery MT, Kirchman DL (1993) Estlrnating degrada- tion rates of chitin in aquatic samples. In: Kemp P, Sherr E, Sherr B. Cole JJ (eds) Current methods in aquatic micro- bial ecology. Lewis, Chelsea, MI, p 597-600
Montgomery MT, Welschmeyer NA, brchman DL (1990) A simple assay for chitin: application to sediment trap sam-
Editorial responsibility: Farooq Azam, La Jolla, California, USA
ples from the subarctic Pacific. Mar Ecol Prog Ser 64: 301-308
Morris I (1981) Photosynthetic products, physiological state, and phytoplankton growth. In: Platt T (ed) Physiological bases of phytoplankton ecology. Department of Fisheries and Oceans, Ottawa, p 83-102
Mulisch M (1993) Chitin in protistan organisms: d~stribution, synthesis and deposition. Eur J Protistol29:l-18
Newel1 SY (1993) Decomposition of shoots of a salt-marsh grass. In: Jones JG (ed) Advances in microbial ecology. Plenum Press, New York, p 301-326
Pakulski JD, Benner R (1992) An improved method for the hydrolysis and MBTH analysls of dissolved and particu- late carbohydrates in seawater. Mar Chem 40:143-160
Raymont JEG, Srinivasagam RT, Raymont JKB (1969) Bio- chemical studies on marine zooplankton. VII. Observa- tions on certain deep sea zooplankton. Int Rev Ges Hydro- biol 54:357-368
Roff JC, Kroetsch JT, Cl.arke AJ (1994) A radiochemical method for secondary production in plankton~c crustacea based on rate of chitin synthesis. J Plankton Res 16: 961-976
Rosenstock B, S h o n M (1993) Use of dissolved combined and free amino acids by planktonic bacteria in Lake Con- stance. Lirnnol Oceanogr 38:1521-1531
Rupley JA (1964) The hydrolysis of chitin by concentrated hydrochloric acid, and the preparation of low-molecular- weight substrates for lysozyrne. Biochim Biophy Acta 83: 245-255
Schaefer J, Kramer KJ, Garbow JR, Jacob GS. Stejskal EO, Hopkins TL, Speirs RD (1987) Aromatic cross-links in insect cutlcle: detection by solid-state '" and 15N NMR. Science 235,1200-1204
Sharp JH, Culberson CH, Church TM (1982) The chemistry of the Delaware Estuary: general considerations. Limnol Oceanogr 27:1015-1028
Sirnon M, Welschmeyer NA, Kirchman DL (1992) Bacterial production and the sinking flux of particulate organic mat- ter in the subarctic Paciflc. Deep-Sea Res I 39 1997-2008
Smith DC, Sunon M, Alldredge AL, Azam F (1992) Intense hydrolytic enzyme activity on marine aggregates and implications for rapid particle dissolution. Nature 359: 139-142
Smucker RA. Dawson R (1986) Products of photosynthesis by marine phytoplankton: chitin in TCA 'protein' precipi- tates. J Exp Mar Biol Ecol 104:143-152
Stankiewicz BA, Briggs DEG. Evershed RP, Flannery MB, Wuttke M (1997) Preservation of chitin in 25-million-year- old fossils. Science 2?6:1541-1543
Svitil A, Kirchman DL (1998) A chitin-binding domain in a marine bacterial chitinase and other microbial chitinases: implicat~ons for the evolution of 1,4-P-glycanases. Micro- biology-UK 144:1299-1308
Svitil A, Ni Chadhain S, Moore JA, Kirchman DL (1997) Chitin degradation proteins produced by the marine bac- terium Vibrio harveyi growing on different forms of chitin. Appl Environ Microbiol 63:408-413
Yoshikoshi K , K 6 Y (1988) Structure and funct~on of the peri- trophic membranes of copepods. Nippon Suisan Gakkaishi 54: 1077-1082
Zobell CE, Rittenberg SC (1937) The occurrence and charac- teristics of chitinoclastic bacteria in the sea. J Bacteriol35: 275-287
Submitted. August 31, 1998, Accepted: December 17, 1998 Proofs received from authorls): July 22, 1999