Embed Size (px)
Citation preview
2
HUMAN RESOURCE ALLOCATION MANAGEMENT IN MULTIPLE PROJECTS USING
SOCIOMETRIC TECHNIQUES
Additional Information:
Managing Teams, Managing Human Resources.
Authors:
Ballesteros-Pérez, P a ; González-Cruz, Mª Carmen b ; Fernández-Diego, Marta c
a Head of Construction studies in Depuración de Aguas del Mediterráneo SL (Spain).
PhD. and Msc. in Civil engineering. IPMA certified Project Manager (C level) Depuración de Aguas del Mediterráneo S.L. C/Guglielmo Marconi 11, 2nd, office 19 Parque
Tecnológico 46980 Paterna (Valencia, Spain)
Part-time Lecturer in Departamento de Ingeniería del Terreno. Escuela Técnica Superior de
Ingenieros de Caminos, Canales y Puertos. Universitat Politècnica de València. Cº de Vera
s/n, 46022 Valencia, Spain
Phone: +34 902 881 510 (ext.: 366) Fax: +34 96 353 12 25.
E-mail : [email protected]
b Lecturer in Departamento de Proyectos de Ingeniería. Escuela Técnica Superior de
Ingenieros Industriales. Universitat Politècnica de València. Cº de Vera s/n, 46022 Valencia,
Spain
PhD. Industrial Engineering. IPMA certified Project Manager (C level) Phone: +34 963 879 866 (ext.:75654 ) Fax: +34 963 879 869 (ext.:79869 ).
E-mail: [email protected]
Corresponding author
c Lecturer in Departamento de Organización de Empresas. Universitat Politècnica de
València. Cº de Vera s/n, 46022 Valencia, Spain
PhD. Telecommunications Engineering.
Phone: +34 963 877 685 (ext.:76850) Fax: +34 963 879 779 (ext.:79779).
E-mail: [email protected]
3
HUMAN RESOURCE ALLOCATION MANAGEMENT IN MULTIPLE PROJECTS USING
SOCIOMETRIC TECHNIQUES
Abstract
This article describes a new application of key psychological concepts in the area of
Sociometry for the selection of workers within organizations in which projects are developed.
The project manager can use a new procedure to determine which individuals should be
chosen from a given pool of resources and how to combine them into one or several
simultaneous groups/projects in order to assure the highest possible overall work efficiency
from the standpoint of social interaction. The optimization process was carried out by means
of matrix calculations performed using a computer or even manually, and based on a number
of new ratios generated ad-hoc and composed on the basis of indices frequently used in
Sociometry.
Keywords: Sociometry; team composition; quantitative methods; groups; optimization;
cohesion.
1. Introduction
A Team can be defined as a social system of three or more people, which is embedded in an
organisation (context), whose members perceive themselves as such and are perceived as
members by others (identity), and who collaborate on a common task (teamwork) (Aldefer,
1987; Guzzo & Shea, 1992; Hackman,1987; Wiendieck, 1992;).
The domains of organisational behavior and industrial and organisational (I/O) psychology
have served as the principal caretakers of team research and, over the last decade, have
made considerable strides in advancing knowledge on team functioning (Hollenbeck et al.,
2004).The literature on Human Resource Management (HRM) has focused more closely on
the individual members of work teams (Campion et al.,1993) HRM’s adoption of team-level
4
phenomena is beginning to occur in the scientific domain but is lagging in the field of practice
(Baiden & Andrew, 2011; Hollenbeck et al., 2004; Zwikael & Unger-Aviram, 2010), especially
in project-oriented companies (Huemann et al., 2007).
Empirical research on the management of multiple projects in the project manager level is
still rare and well behind its rate of utilization in the industry (Patanakul & Milosevic, 2009).
Besides, the problem is that recent research is peppered with examples of nonintuitive, and
sometimes counterintuitive, findings about how best to compose teams, train them, and
combine their individual members’ contributions (Hollenbeck et al., 2004; Maurer, 2010,
Zwikael & Unger-Aviram, 2010).
Recent scientific research has shown that the Group's success or failure is often dependent
on the interdependence between a group’s teamworking skills, its integration, trust and the
technical skills of each of its members (Baiden & Andrew, 2011; Campion et al., 1993;
Chansler et al., 2003; Maurer, 2010).
Additionally an appropriate level of cohesion is necessary for a team to stay together,
collaborate, and thus to build the basis for high team work quality (Hoegl & Gemuenden,
2001).
Generally, technical competence is the attribute most commonly studied in the literature on
team design, particularly with regard to characterizing tasks and team members (Fitzpatrick
& Askin, 2005; Hadj-Hamou & Caillaud, 2004; Hlaoittinun, et al., 2007; Tsai et al., 2003;
Tseng et al., 2004; Zakarian & Kusiak, 1999). However, Social identity theory suggests that
the more members identify with their respective groups, the more likely they are to actively
contribute to the welfare of the group and work toward common goals (Maurer, 2010).
Indeed, empirical research indicates that members of these groups display higher affective
commitment and have higher unit performance than groups with low perceived cohesion
(Andrews et al., 2008).
In this paper it has been posited that a team’s outcome depends heavily on how individuals
develop their social ties and group interactions. Thus, if it were possible to maximize several
5
groups’ cohesion joining certain team members, selecting them from a pool of resources
whose social ties are known (both positives and negatives), an optimum outcome should be
expected whenever technical skills are fulfilled beforehand by the individuals. An ‘optimum
outcome’ is referred to the best performance possible taking into account the circumstances
and quality, quantity and social bonds between group members. For this, a case study is
examined and a calculation procedure is established in order to give an example and to
illustrate how the proposal can be used in any other team formation situation from the
standpoint of social interaction.
So far, several studies proposed tools and techniques for scarce resource allocation, which
include integer programming, heuristic methods, queuing theory, fuzzy optimization by
genetic algorithms, fuzzy linear programming, etc (Dean et al, 1992; Hendricks et al., 1999;
Morse et al, 1996, Tong & Tam, 2003; Wu, 2007). However, these techniques were
proposed for a use in the functional level, so they usually tend to generate organisational
conflict between project managers and functional managers (Laslo & Goldberg, 2008).
Besides, they may not be applicable to an operational-level for a multiple-project manager to
allocate resources across his/her projects (Patanakul & Milosevic, 2009). A new approach is
going to be proposed trying to maximise group cohesion while solving these other problems.
2. Group cohesion
The concept of group cohesion has been extensively studied in the field of sociology.
(Eisenberg, 2007). Group cohesion is defined as the degree to which group members feel
accepted or rejected by each other (Beal et al., 2003) or the degree to which the members of
a group desire to remain in the group (Cartwright, 1968).
Groups may be more or less cohesive and the force keeping the group united may vary over
time and be different from one group to another.

6
The integration of members of a group in a work team depends on the following (Baiden &
Price, 2011; Piper et al.,1983): team identity, shared vision, communication, collaboration
and participation, issue negotiation and resolution; reflection and self-assessment
(Dwivedula & Bredillet;2010). Therefore, a team’s outcome depends heavily on how
individuals develop their social ties and group interactions (Zwikael & Unger-Aviram, 2010).
The project manager manages the human resources available to achieve the objectives of
the organisation (Asquin et al., 2009; Chiocchio et al., 2010; Ferrin et al., 2007; Zwikael &
Unger-Aviram, 2010). Human capital is the essential component of the organisation and
depending on whether there is a proper combination of employees, assignment of tasks,
trust and motivation, very different results will be achieved (Maurer, 2010). This, as
mentioned, is an important responsibility of project managers.
Some studies indicate that cohesion generally has a positive influence, significantly
increasing the following (Dwivedula & Bredillet;2010; Piper et al.,1983) : attraction to the
group; degree of motivation; morale; compliance with group norms; coordination of efforts;
synergy; resources available for the task; productivity; effectiveness in achieving objectives;
number of positive and cordial interactions; cooperation; and satisfaction with the group.
On the other hand, cohesion can be influenced (or sometimes even conditioned positively or
negatively) by factors such as compatibility of character, culture, gender, ethnicity and needs
among group members.
Cohesion can be assessed through various methods (Campion et al., 1993):
� Sociometric tests or sociometric choice tests
� Work environment studies
� Analysis of motivations
� Analysis of interactions; study of quality and frequency
7
The first of these four methods is a quantitative method which provides a large amount of
factual information, and consequently, it has been used in this study.
3. Sociometry and Sociometric matrix
Sociometry, a method created by Jacob Levy Moreno, studies the structure of groups
through the web of interpersonal relationships that occur within it (Moreno, 1961). Sociometry
conceives the human being as possessing infinite creativity and spontaneity, and as being
born, growing and dying in a social context (Bezanilla & Miranda, 2008).
The sociometric test (Moreno, 1961) is the instrument used by sociometry to understand the
basic structures of relationships within the group. Each group member chooses or rejects
other people as mates.
Differences in personality can greatly affect individual behaviour and thus, group
performance within the organisation (Chen & Lin, 2004; Dwivedula & Bredillet, 2009). A true
appreciation of the nature of personality differences allows project managers to manage
effectively, thereby enhancing the individual and group performance of the their subordinate
units (Asquin et al., 2009; Gordon et al., 1990). However, sociometry does not address how
and why social interactions occur among individuals but rather quantifies them, characterises
their distribution and even represents them, for which purpose the sociogram is used.
In addition, the Sociometric test describes various aspects in a particular group (Moreno,
1961): informal structure; communication system; leadership; and possible formation of
subgroups, pairs and trios.
Other separate data can also be analysed from the results obtained using a sociometric test
(Moreno, 1961): Number of personal choices made; Number of personal choices received;
Number of mutual or reciprocal choices; Number of choices within a group; Number of
negative choices or rejections made; Number of personal negative choices or rejections

8
received; Number of mutual or reciprocal negative choices or rejections; and Number of
negative choices or rejections within a group.
The results of sociometric research can be represented graphically (sociogram), but also as
an array, which is henceforth to be used for matrix optimization purposes to form work
groups. One example of Sociometric matrix will be shown later in Table 1.
In Table 1’s cells: a +1 means a “Choice”, a -1 means a “Rejection” and a blank or a 0 mean
an Omission, made by the individuals of the left column in regard to individuals displayed in
the heading row.
Note that the matrix need not be symmetric, since any member can choose another group
member, but in turn, the latter member may choose to reject the former.
The degree of cohesion can be observed through indicators, such as the total number of
choices made within a Group or the number of mutual choices. The number of choices
received by each individual also provides important information, for example, in relation to
leadership.
Group members are classified by the number of choices and rejections received, yielding
four types of sociometric individuals (Moreno, 1961):
� Popular individuals or leaders: receive a large number of choices and a low or normal
number of rejections
� Average: obtain an average degree of acceptance, and medium-low rejection.
� Forgotten, ignored or isolated: have low acceptance and also medium-low rejection.
� Rejected, excluded or marginalized: with a high degree of rejection and medium-low
acceptance.
This classification is obtained using the following Individual Sociometric Indices (Moreno,
1961):

9
Popularity or positive status: number of choices received / n-1. It represents the
proportion of members who choose the subject in proportion to the full number
of possible choices (n-1), where n is the total number of group members.
Antipathy or negative status: number of rejections received / n-1. Proportion of
members who reject the subject to the full number of possible rejections.
Positive expansiveness: number of choices made / n-1. Proportion of members who
are chosen by the subject.
Negative expansiveness: number of rejections made / n-1. Proportion of members
who are rejected by the subject.
Positive reciprocity: number of reciprocal choices.
Negative reciprocity: number of reciprocal rejections.
Nevertheless, there are also Global Sociometric Indices (Moreno, 1961), three of them
are:
Cohesion or association: number of reciprocal choices / possible number of reciprocal
choices. It is the proportion of positive reciprocity.
Dissociation: number of reciprocal rejections / possible number of reciprocal
rejections. It is the proportion of negative reciprocity.
Social intensity: (Total number of choices + Total number of rejections) / n-1.
There is a widespread fundamental proposition that the success of the work performed by a
team depends, beyond the amount and accuracy of the design of work activities, on how well
the members cooperate or interact (Hoegl & Gemuenden, 2001). Most of the sociometric
indices shown describe the quality of the internal interactions of a group at the individual
level and on the level of the group as a whole.

10
4. Case Study
The sociometric test detects the “social atoms” built by each individual and their social
network, consisting of the choices made and received by this person; by contrast, it is unable
to detect the causes that have led to a specific social structure (Moreno, 1941).
The method developed in this paper aims to form multiple work teams from a group of
individuals in order to make them as efficient as possible, and numerically quantifies this
efficiency from the standpoint of expected social interaction. However, social interactions are
never to be observed in silos: while an individual working on a project may experience
interactions with other team members in that project team, he/she may also be influenced by
the interactions of other members in other project teams (even if there is no face-face
interaction). Therefore, the method proposed later represents a new line in the application of
sociometry and the artificial forming of work groups, since it addresses the kind of issues
mentioned above.
The method was tried out in a private company (‘Depuración de Aguas del Mediterráneo’ or
DAM hereinafter) devoted to design, construction, exploitation and maintenance of big Waste
Water Treatment Plants, most of them located in Spain.
DAM is a medium-sized company which currently employs more than two hundred and fifty
people, most of them either technicians and/or engineers. DAM’s personnel are organised on
the basis of a matrix type where different company’s departments exist vertically
(construction, exploitation, maintenance, R&D, quality, accounting and management) and
each project/contract the company develops co-exists horizontally (for instance, each WWTP
awarded usually constitutes a single project).
The method was applied to the allocation of human resources in 12 new WWTP construction
projects and monitor their performance. Projects ranged from about 30.000 € to 120.000 €

11
while their duration were from 1 to 5 months. Each new project required from one-person-
dedication (though this may mean 50% of two workers’ time or 100% of one person’s
dedication) to seven people’s dedication, depending mainly on its importance, strategic
value, time available and/or contract budget.
For the purpose of this study, four out of the twelve projects carried out have been picked out
to show how the sociometric algorithm was implemented. Thus, the scenario has been
strongly simplified in order to keep it as simple as possible, especially for facilitating
understanding. Nevertheless, the core of the problem has been kept intact so the usefulness
of the Sociometric application is shown as well.
The fact of implementing sociometric tools was the vehicle that enabled the company to
rationalize the selection and allocation process of human resources. In fact the new
sociometric method developed allowed measurement (from -1 to +1) of the expected
Efficiency of each group selected to work together, as long as to increase the overall
Efficiency, considering several projects as a whole.
Next, it will be illustrated the whole process of assigning employees as efficiently as possible,
as it was approximately implemented in DAM. Nevertheless, the explanations will be given
as if they were addressed to any company with the same problems. Therefore, from now on,
DAM’s case will be considered just like a generic Company.
4.1. Problem formulation
Take a company that develops projects of any nature. Such a company, whose
organisational structure can range from a matrix type organisation to an organic type
organisation operating exclusively from the basis of project development, is composed of
different individuals each belonging to an area of expertise or to a functional department.

12
Also, assume that a project manager of this company who is responsible for managing
several projects at the same time (or Multiple-project Manager) and who is empowered to
choose his staff from the available employees in the company, is required to implement a
number of projects that will add value to the company.
Assuming that all the employees available to the project manager have the same technical
level and sufficient skills and knowledge to carry out the tasks required, the aim of this case
study is to develop a human resources combination method enabling the project manager to
select individuals to form work (project) groups with the highest possible overall efficiency.
Interpersonal relationships between the different employees considered as human resources
are quite varied: positive, negative, and in other cases, neutral or non-existent. This problem
will be solved using classic sociometric techniques combined with the calculation of matrix
optimisation.
4.2. Nomenclature
Prior to solving this problem and for clarification purposes, the nomenclatures of the indices
which will represent the various elements to be studied are as follows:
i= 1, 2, 3, …, ni is each employee (resource pool) within the same area of expertise or
functional department. Seven people were used (ni=7), there were more people but they
was not available at that moment.
j= A, B, C, …, nj are each of the areas of knowledge or functional departments of the
company for which the manager is required to maximize the benefits derived from their
projects. In this case study, there were four departments (nj=4): Construction (A), with
three people; Exploitation (B), with two people; Maintenance (C), with one person; and
R&D (D), with one person as well.
k=1, 2, 3, …, nk are each of the subgroups (from one or more employees who belong to
one or several functional departments of the company) to be formed corresponding to the
13
different projects which must be developed by the company and managed by the
manager; in principle, at the same time. In our case, four simultaneous projects (nk=4)
were developed: G1, G2, G3 and G4.
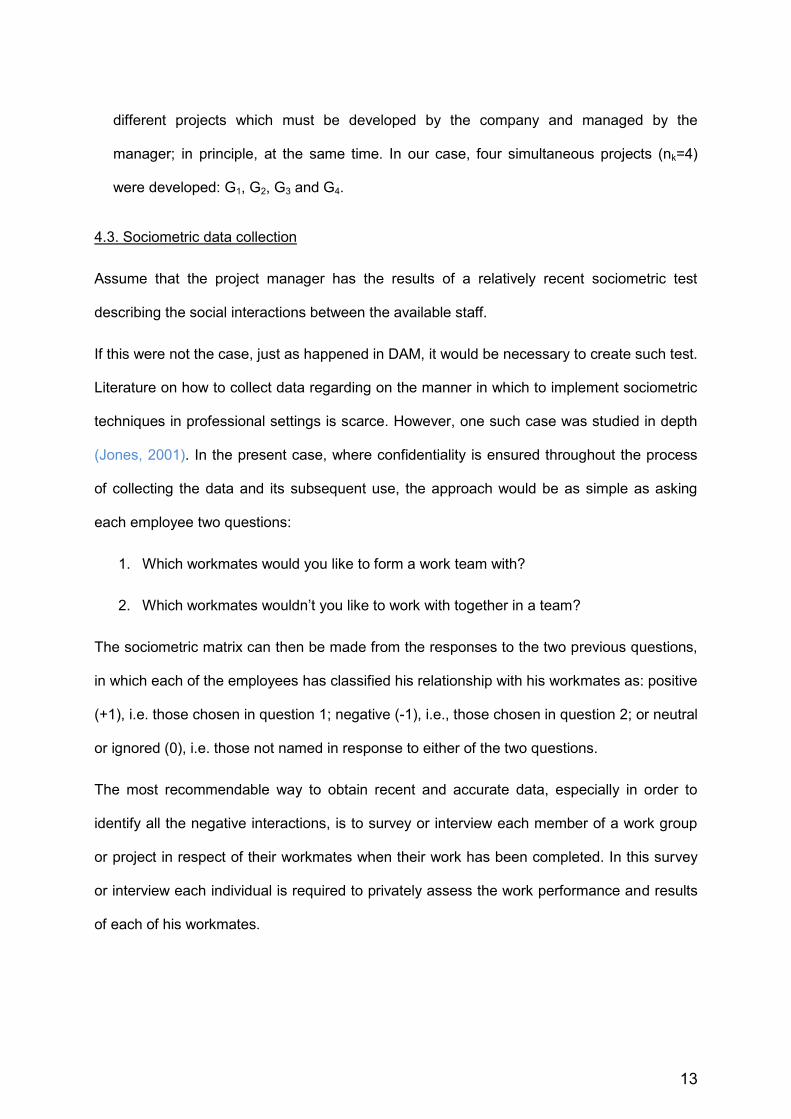
4.3. Sociometric data collection
Assume that the project manager has the results of a relatively recent sociometric test
describing the social interactions between the available staff.
If this were not the case, just as happened in DAM, it would be necessary to create such test.
Literature on how to collect data regarding on the manner in which to implement sociometric
techniques in professional settings is scarce. However, one such case was studied in depth
(Jones, 2001). In the present case, where confidentiality is ensured throughout the process
of collecting the data and its subsequent use, the approach would be as simple as asking
each employee two questions:
1. Which workmates would you like to form a work team with?
2. Which workmates wouldn’t you like to work with together in a team?
The sociometric matrix can then be made from the responses to the two previous questions,
in which each of the employees has classified his relationship with his workmates as: positive
(+1), i.e. those chosen in question 1; negative (-1), i.e., those chosen in question 2; or neutral
or ignored (0), i.e. those not named in response to either of the two questions.
The most recommendable way to obtain recent and accurate data, especially in order to
identify all the negative interactions, is to survey or interview each member of a work group
or project in respect of their workmates when their work has been completed. In this survey
or interview each individual is required to privately assess the work performance and results
of each of his workmates.

14
If the manager were ultimately to lack such data and were to consider the possibility of
obtaining it easily to be unlikely, it would be advantageous to speak to the other peer project
managers to attempt to infer an approximate sociometric matrix, i.e. to attempt to subjectively
classify the relationships between subordinates according to their project managers.
Obviously, this method would be much less accurate.
4.4. Pool of resources
As was previously stated, this study illustrates the process of assigning seven people (A1, A2,
and A3; B1 and B2; C1; and D1) from four different departments (A, B, C and D) to four
different and simultaneous projects (G1, G2, G3 and G4). These data with the up-to-date
sociometric tests made possible the sociometric matrix (S) graphed in Table 1. Note that the
left column represents the employees interviewed and the top row represents the employees
whom the interviewed individuals want or do not want to work with.
Table 1: Sociometric Matrix of DAM’s case study
Although not strictly necessary for the subsequent mathematical calculations, the main group
sociometric indices Cohesion and Dissociation have been calculated, for the purpose of
obtaining an improved description of the example group as a whole (see Table 2).
Chosen ► Interview ed▼ A1 A2 A3 B1 B2 C1 D1
A1 0 1 -1 0 1 0 0A2 -1 0 -1 0 1 1 1A3 0 0 0 1 -1 -1 -1B1 1 1 1 0 1 0 0B2 -1 -1 1 0 0 1 1C1 0 1 -1 1 0 0 0D1 0 -1 -1 1 1 0 0
15
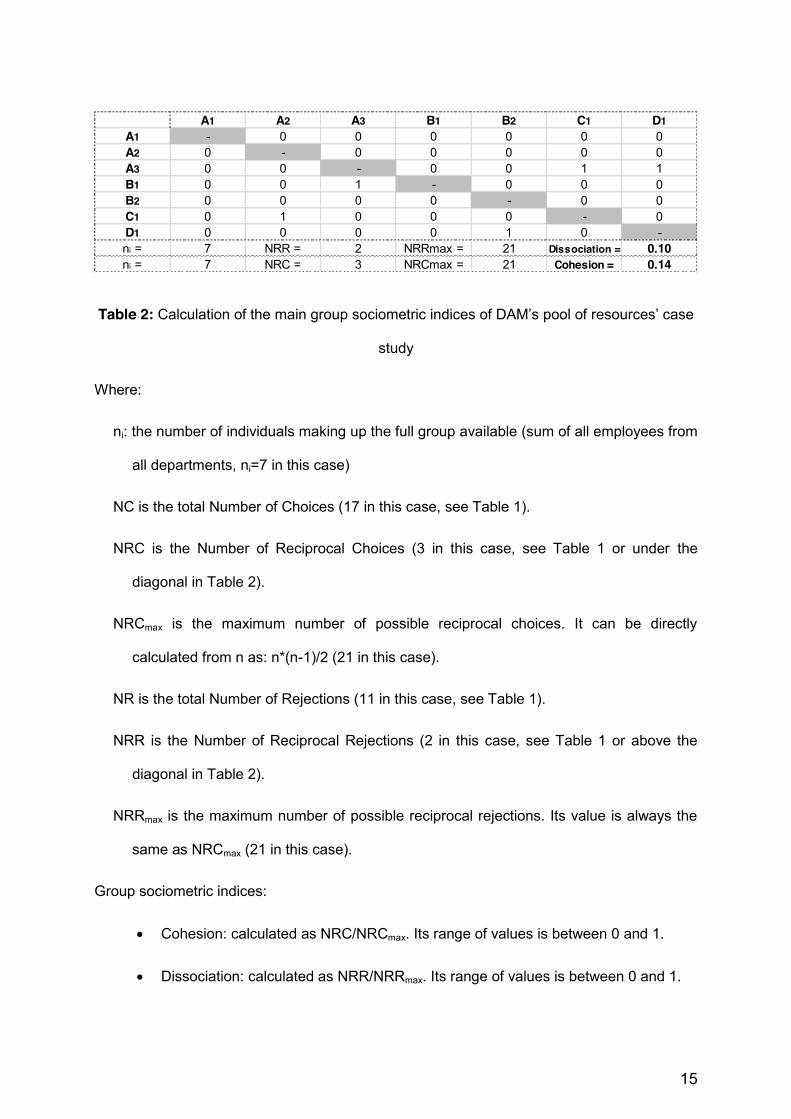
Table 2: Calculation of the main group sociometric indices of DAM’s pool of resources’ case
study
Where:
ni: the number of individuals making up the full group available (sum of all employees from
all departments, ni=7 in this case)
NC is the total Number of Choices (17 in this case, see Table 1).
NRC is the Number of Reciprocal Choices (3 in this case, see Table 1 or under the
diagonal in Table 2).
NRCmax is the maximum number of possible reciprocal choices. It can be directly
calculated from n as: n*(n-1)/2 (21 in this case).
NR is the total Number of Rejections (11 in this case, see Table 1).
NRR is the Number of Reciprocal Rejections (2 in this case, see Table 1 or above the
diagonal in Table 2).
NRRmax is the maximum number of possible reciprocal rejections. Its value is always the
same as NRCmax (21 in this case).
Group sociometric indices:
x Cohesion: calculated as NRC/NRCmax. Its range of values is between 0 and 1.
x Dissociation: calculated as NRR/NRRmax. Its range of values is between 0 and 1.
A1 A2 A3 B1 B2 C1 D1A1 - 0 0 0 0 0 0A2 0 - 0 0 0 0 0A3 0 0 - 0 0 1 1B1 0 0 1 - 0 0 0B2 0 0 0 0 - 0 0C1 0 1 0 0 0 - 0D1 0 0 0 0 1 0 -ni = 7 NRR = 2 NRRmax = 21 Dissociation = 0.10ni = 7 NRC = 3 NRCmax = 21 Cohesion = 0.14
16
x Social intensity, calculated as (NC+NR)/(n-1). Its range of values is between 0 and
n.
The reciprocal rejections are represented above the diagonal and the reciprocal choices are
represented under the diagonal in Table 2. Social intensity” is calculated by adding together
the absolute value of the cells of the sociometric matrix (S), which amount to around 28,
(sum of choices and rejections) divided by “n-1”, which equals 4.
Generally, the values of cohesion, dissociation and social intensity are low, i.e. the least
cohesive, although no major hostilities are evidenced. The group of available resources does
not yet appear to have achieved a stable structure. This coincided with the fact that three out
of the seven group members had a seniority of less than 3 months when the Sociometric
algorithm was implemented in DAM.
4.5. Projects to be developed
The company needed to develop four projects. First it would be necessary to define how
many and what kind of experts each project needs.
The project manager in charge of the supervision of the four projects estimated that the
following generic staff would be required for each project:
x Project G1: would require a group formed by 1 Ai, 1 Bi and 1 Ci
x Project G2: would require a group formed by 1 Ai and 0.5 Di
x Project G3: would require a group formed by 0.5 Ai, 0.5 Bi and 0.5 Di
x Project G4: would require a group formed by 0.5 Ai and 0.5 Bi
As observed, given the specific needs of each project, part-time employees are allowed.
Now it would be necessary for the project manager to assign each individual to the group
where he will most contribute to the development of the project, thereby maximizing overall
work efficiency and complying with the self imposed staff restrictions for each project in terms
17
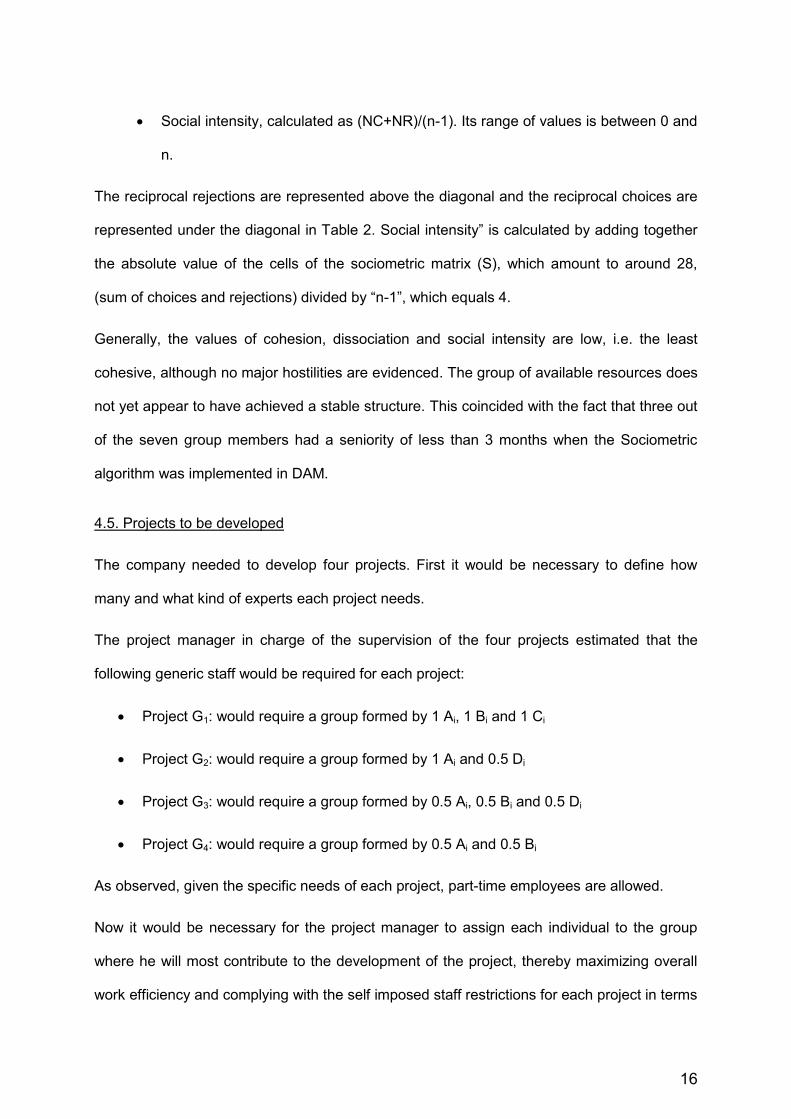
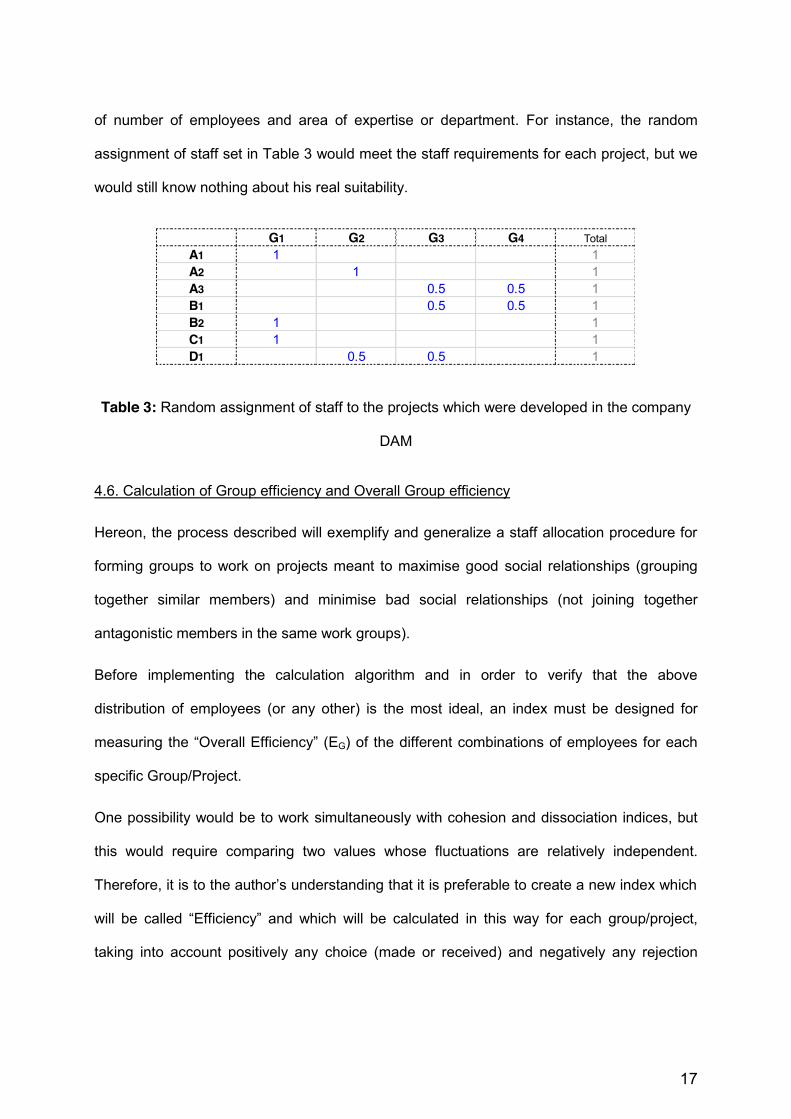
of number of employees and area of expertise or department. For instance, the random
assignment of staff set in Table 3 would meet the staff requirements for each project, but we
would still know nothing about his real suitability.
Table 3: Random assignment of staff to the projects which were developed in the company
DAM
4.6. Calculation of Group efficiency and Overall Group efficiency
Hereon, the process described will exemplify and generalize a staff allocation procedure for
forming groups to work on projects meant to maximise good social relationships (grouping
together similar members) and minimise bad social relationships (not joining together
antagonistic members in the same work groups).
Before implementing the calculation algorithm and in order to verify that the above
distribution of employees (or any other) is the most ideal, an index must be designed for
measuring the “Overall Efficiency” (EG) of the different combinations of employees for each
specific Group/Project.
One possibility would be to work simultaneously with cohesion and dissociation indices, but
this would require comparing two values whose fluctuations are relatively independent.
Therefore, it is to the author’s understanding that it is preferable to create a new index which
will be called “Efficiency” and which will be calculated in this way for each group/project,
taking into account positively any choice (made or received) and negatively any rejection
G1 G2 G3 G4 TotalA1 1 1A2 1 1A3 0.5 0.5 1B1 0.5 0.5 1B2 1 1C1 1 1D1 0.5 0.5 1

18
(also made or received), rather than only reciprocal choices and rejections (as Cohesion and
Dissociation are calculated).
Then, the Efficiency of a particular the group/project “k” (EGk) will be calculated as follows:
(1)
Where:
nik: the number of individuals composing group/project “k”
NCk: Number of Choices made or received between all members included in group/project
“k”.
NRk: Number of Rejections made or received between all members included in
group/project “k”.
And after calculating EGk for all groups/projects (in this case, four values for projects G1, G2,
G3 and G4 are calculated), the Overall Efficiency (EG) for the whole of the groups/projects is
the weighted sum thereof:
∑ ∑
(2)
Where WGk is the weight (importance or priority) of each group/project.
To assign weights (WGk) to each project, one or several criteria can be used. For example:
x Mathematical calculation of the WGk coefficients based on the ratio of employees
assigned to each project “k” divided by the total staff available “ni” (in our case
ni=7). This is the criteria used in the case study and mathematically is expressed
as:
(3)

19
x Mathematical calculation based on the investment budget for each project or the
ratio of expected economic returns to the total amounts.
x Subjective assignment of weights based on the importance of each project/group,
which depends on the specific strategy of the company or the restrictions of the
economic, legal and social environment, etc.
In this case, the above calculations yielded the following results:
Table 4: Calculation of Groups’ Efficiency (EGk) and Overall Efficiency (EG) based on the
random assignment of staff (according to Table 3) to the projects to be developed in
the case study
In appendix A, a detailed breakdown of the calculation of EGk. coefficients is shown.
The Global Efficiency (EG) of the chosen combination is equal to 0.07 (the EG can range
between -1 and +1). To assure that this combination of employees would be the most ideal,
no other combination could have a higher EG.
4.7. Calculation of the Expansiveness and Status of the resources
The positive or negative contribution of any of the individuals in the sociometric matrix (Table
1), i.e., the amount of choices and rejections made and received, are calculated based on
which of these employees will finally be fellow members in each work group/project.
G1 G2 G3 G4 TotalA1 1 1A2 1 1A3 0.5 0.5 1B1 0.5 0.5 1B2 1 1C1 1 1D1 0.5 0.5 1nik 3 1.5 1.5 1 7
WGk 0.43 0.21 0.21 0.14 1EGk (appendix A) 0.17 0.00 0.00 0.00 EG = ▼
EGk*WGk 0.07 0.00 0.00 0.00 0.07

20
However, to facilitate the optimization calculations, it is necessary to create an index that
describes, although generally, how much a group member from the group in full (the whole
pool of resources available) contributes to Overall Efficiency.
This index, which will be called “Personal Contribution of the individual i” (Ci), is calculated
based on four of the standard individual sociometric indices (Positive expansiveness,
Negative expansiveness, Positive status and Negative status) previously described taking
into consideration the “ni” members of the sociometric matrix in full.
(3a)
This index can also be mathematically expressed more simply using the following equation:
( )
(3b)
Where ni=7 in every calculation and:
NCmi: Number of choices made by individual/employee i.
NRmi: Number of rejections made by individual/employee i.
NCri: Number of choices received by individual/employee i.
NRri: Number of rejections received by individual/employee i.
Ci will have values between -1 and +1, and, the higher the positive value, the greater the
positive Contribution (a priori expected) made by this individual “i” on his/her future
group/project. On the contrary, an individual with high negative values will be seen as “toxic”
to group health as a whole, and as an individual who will decrease the value of Group
21
efficiency (EG) whenever he/she is not sub-combined with other sympathizer co-workers (if
they exist) and kept away from non-sympathizer co-workers.
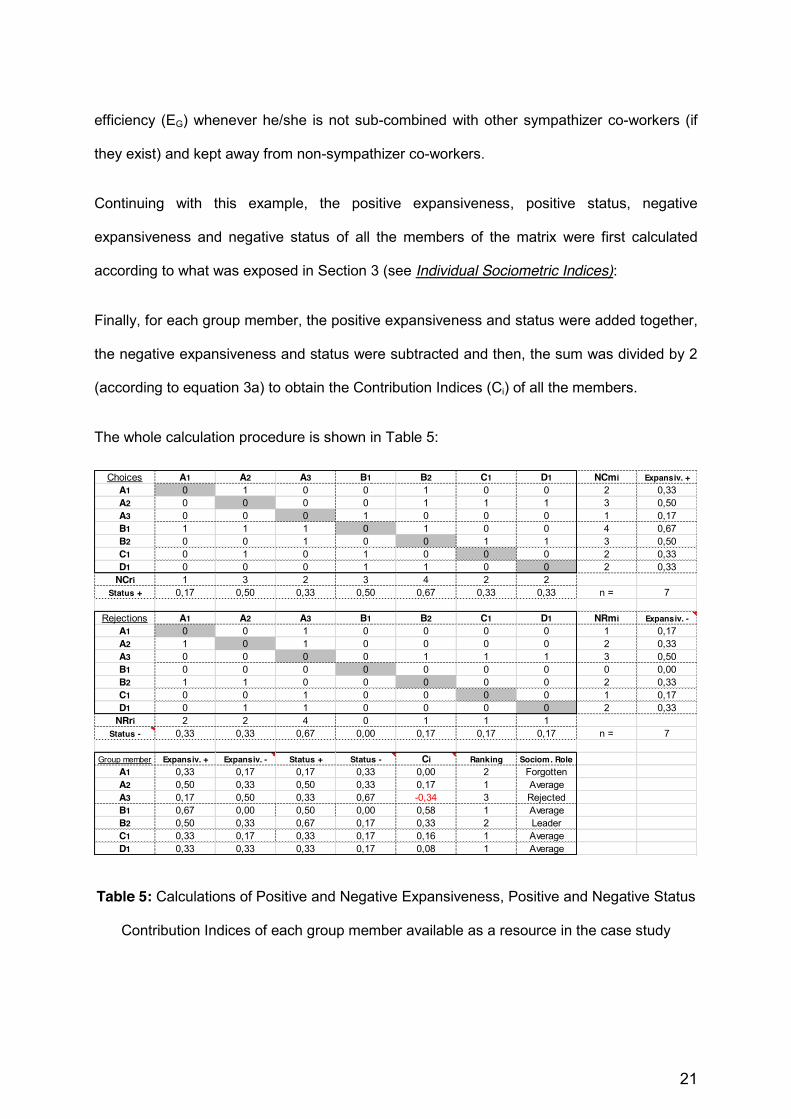
Continuing with this example, the positive expansiveness, positive status, negative
expansiveness and negative status of all the members of the matrix were first calculated
according to what was exposed in Section 3 (see Individual Sociometric Indices):
Finally, for each group member, the positive expansiveness and status were added together,
the negative expansiveness and status were subtracted and then, the sum was divided by 2
(according to equation 3a) to obtain the Contribution Indices (Ci) of all the members.
The whole calculation procedure is shown in Table 5:
Table 5: Calculations of Positive and Negative Expansiveness, Positive and Negative Status
Contribution Indices of each group member available as a resource in the case study
Choices A1 A2 A3 B1 B2 C1 D1 NCmi Expansiv. +A1 0 1 0 0 1 0 0 2 0,33A2 0 0 0 0 1 1 1 3 0,50A3 0 0 0 1 0 0 0 1 0,17B1 1 1 1 0 1 0 0 4 0,67B2 0 0 1 0 0 1 1 3 0,50C1 0 1 0 1 0 0 0 2 0,33D1 0 0 0 1 1 0 0 2 0,33
NCri 1 3 2 3 4 2 2Status + 0,17 0,50 0,33 0,50 0,67 0,33 0,33 n = 7
Rejections A1 A2 A3 B1 B2 C1 D1 NRmi Expansiv. -A1 0 0 1 0 0 0 0 1 0,17A2 1 0 1 0 0 0 0 2 0,33A3 0 0 0 0 1 1 1 3 0,50B1 0 0 0 0 0 0 0 0 0,00B2 1 1 0 0 0 0 0 2 0,33C1 0 0 1 0 0 0 0 1 0,17D1 0 1 1 0 0 0 0 2 0,33
NRri 2 2 4 0 1 1 1Status - 0,33 0,33 0,67 0,00 0,17 0,17 0,17 n = 7
Group member Expansiv. + Expansiv. - Status + Status - Ci Ranking Sociom. RoleA1 0,33 0,17 0,17 0,33 0,00 2 ForgottenA2 0,50 0,33 0,50 0,33 0,17 1 AverageA3 0,17 0,50 0,33 0,67 -0,34 3 RejectedB1 0,67 0,00 0,50 0,00 0,58 1 AverageB2 0,50 0,33 0,67 0,17 0,33 2 LeaderC1 0,33 0,17 0,33 0,17 0,16 1 AverageD1 0,33 0,33 0,33 0,17 0,08 1 Average

22
In the “Ranking” column, the individuals have been be ranked by department/area of
knowledge (A, B, C and D) for assignment to the different groups/projects (G1, G2, G3 and
G4) to the extent that they contribute a greater positive environment to the group in full, that
is, depending on how high its Ci-value is.
Finally, the last column of Table 5 represents the Sociometric roles of each group member
according to their positive and negative status (see types of sociometric individuals).
4.8. Results
In the case of the example, if the individuals are assigned in order from highest to lowest
project weight “WGk” (assignment order: G1, G2, G3 and G4), and group members from
highest to lowest Ci-values (area/department assignment order A: A2, A1 and A3 ;
area/department B: B1 and B2 ; areas/departments C and D only have one individual so there
is no need to rank them) the results are as follows:
Table 6: Optimal solution. Calculation of Groups’ (EGk) and Overall Efficiency (EG) based on
the assignment of staff to the projects to be developed in the case study according to their
assignment in decreasing order of Contribution Coefficients (Ci) and decreasing order of
Weight factors (WGk).
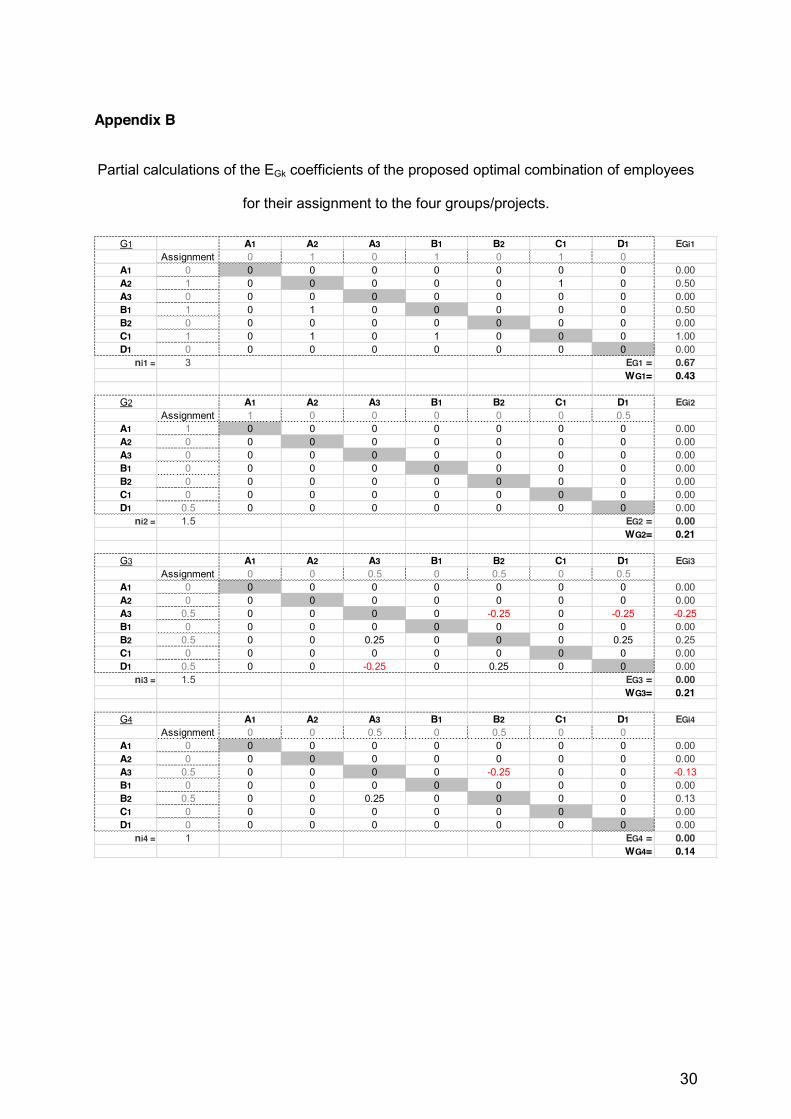
Appendix B shows the calculations of the coefficients EGk.
G1 G2 G3 G4 TotalA1 1 1A2 1 1A3 0.5 0.5 1B1 1 1B2 0.5 0.5 1C1 1 1D1 0.5 0.5 1nik 3 1.5 1.5 1 7
WGk 0.43 0.21 0.21 0.14 1EGk (appendix B) 0.67 0.00 0.00 0.00 EG = ▼
EGk*WGk 0.29 0.00 0.00 0.00 0.29
23
It can be observed that the Overall Efficiency value (EG) rose from 0.07 (from the first
distribution proposed) to 0.29 (the current value shown in table 6). In this case, the
combination finally shown is the most optimal of all the possible combinations, based on the
resources and their good and bad relationships, and based on the staffing needs specified by
the project managers for each of its groups/projects.
The solution is optimal given that neither of the two exception situations described later in
section 5.2 arise. In any other case, this fact should be checked.
If the restrictions set by the project manager are respected, any combination of the available
team members will not lead to an Overall Efficiency exceeding 29%.
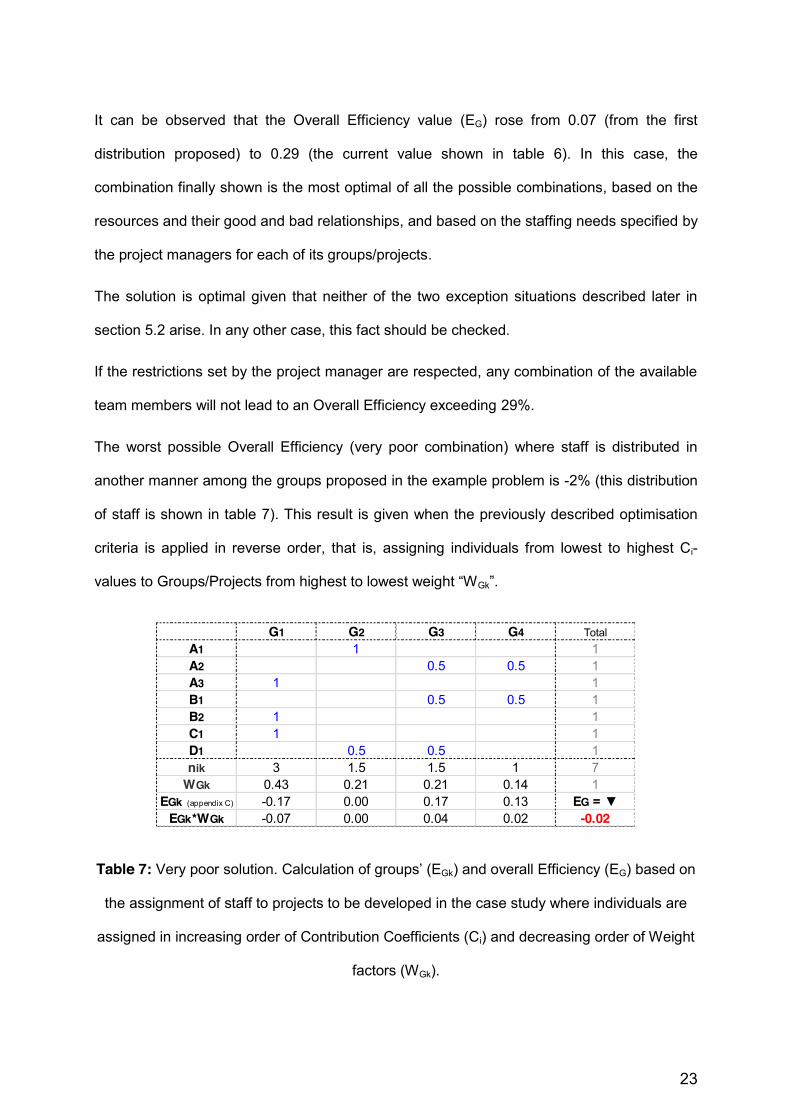
The worst possible Overall Efficiency (very poor combination) where staff is distributed in
another manner among the groups proposed in the example problem is -2% (this distribution
of staff is shown in table 7). This result is given when the previously described optimisation
criteria is applied in reverse order, that is, assigning individuals from lowest to highest Ci-
values to Groups/Projects from highest to lowest weight “WGk”.
Table 7: Very poor solution. Calculation of groups’ (EGk) and overall Efficiency (EG) based on
the assignment of staff to projects to be developed in the case study where individuals are
assigned in increasing order of Contribution Coefficients (Ci) and decreasing order of Weight
factors (WGk).
G1 G2 G3 G4 TotalA1 1 1A2 0.5 0.5 1A3 1 1B1 0.5 0.5 1B2 1 1C1 1 1D1 0.5 0.5 1nik 3 1.5 1.5 1 7
WGk 0.43 0.21 0.21 0.14 1EGk (appendix C) -0.17 0.00 0.17 0.13 EG = ▼
EGk*WGk -0.07 0.00 0.04 0.02 -0.02
24
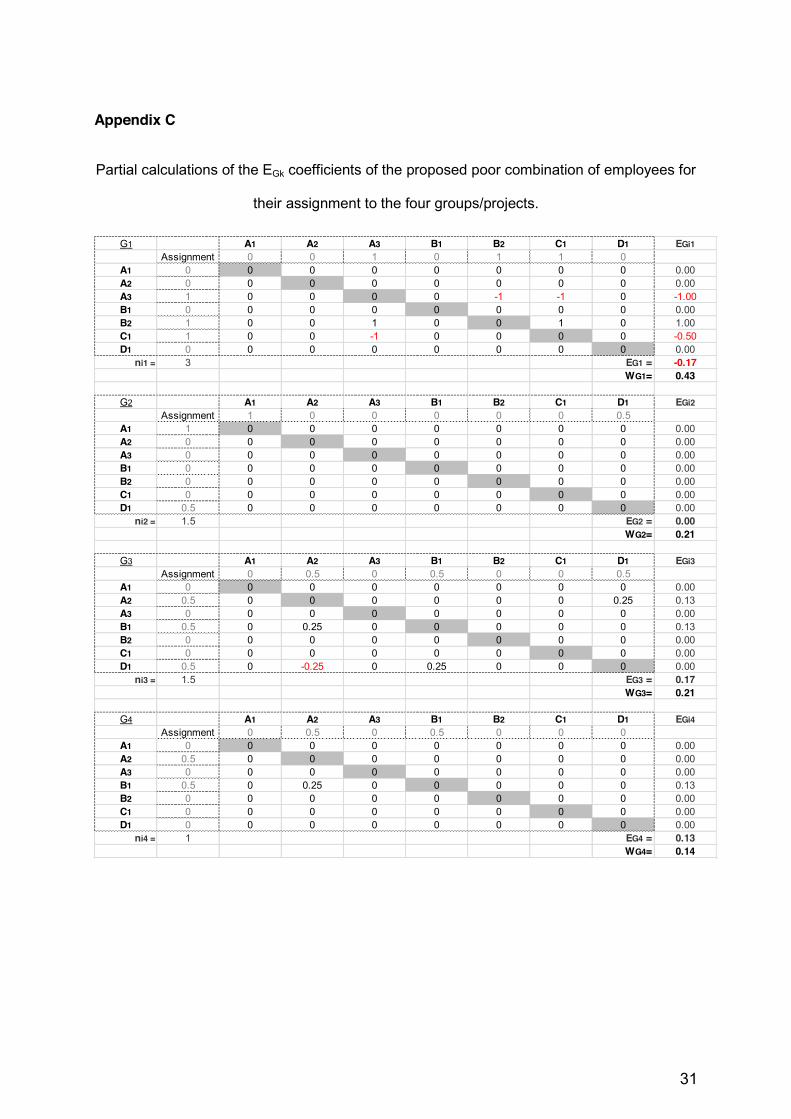
Appendix C shoes the detailed calculations of the EGk coefficients.
These results indicate that the possible combinations of staff, taking into account the
restrictions of the case study, allow the groups as a whole to work with Efficiencies ranging
from -2% to +29%, which is a noticeable enough difference to be sufficiently analysed.
5. General calculation process
5.1. Computer and Manual calculations
A computer application can be programmed to make these calculations. This application will
take into account the staff assignment restrictions imposed by the project manager for each
group/project and will calculate all the possible permutations in a matrix similar to that of
section 4.6 and Appendix A.
However, if calculations are done manually, a simple calculation process enabling an optimal
solution or the solution coming closest to being optimal has to be established.
Manually calculating the large number of permutations whose calculations are needed in
groups with many members and/or many areas of expertise or departments, is impossible.
For informational purposes, it should be noted that the number of permutations possible in
the example being used for the 4 groups/projects to be generated is 7. However, the number
of permutations depends to a large extent on how much you want the assignment to be
divided among part-time employees.
Recent research has shown that companies have problems setting multi-role assignments to
workers that usually lead to role conflict in multi-project environments, causing, among
others, job dissatisfaction (Turner et al., 2008).
Generally speaking, assignments of less than 33% are not recommended since this would
affect the performance of the employee who would have too many projects at the same time.
However, where it is accepted that based on the percent of work assigned to an employee,

25
he can be assigned to different projects at the same time, the number of permutations
skyrockets.
Returning to the example first referred to in section 4.4, to find or limit the optimal solution
easily by means of manual calculations (without a computer), the following work process
should be performed:
1. The different groups/projects are first ranked from highest to lowest Weight (WGk),
and the staff assigned to the most important group/projects and who contribute to the
highest extent to the EG are analyzed. In the example provided, the groups are
already ranked in this order (from G1 to G4).
2. Within each group/project, the group members who meet the staffing requirements
established by the project manager will be assigned in descending order of
Contribution (Ci) until all posts are filled.
This procedure does NOT ensure that the result is optimal in all cases, especially in large
groups where independent sub-groups may be formed, but it does ensure that the solution
found is likely to be very close, with a very low number of calculations.
The above statement is based on the following fact: the Contribution indices (Ci) used to
determine the assignment of human resources is of an overall nature for the group in full,
meaning that it is calculated independently and prior to forming subgroups.
5.2. Observations on the calculation process
As mentioned above, if the simple calculation procedure is performed, not all the possible
individual permutations are assessed and the most optimal solution may not be achieved.
Obtaining a solution which is not optimal only occurs in two possible cases, and in both
cases the groups would consist of a very large number of individuals:
Exception 1:

26
The case in which certain individuals all have high Ci , and they are assigned to work
together in/on the same group/project but they do not happen to get along together.
Exception 2:
The case in which some individuals have low Ci , but they all work well together in/on a
certain group/project. If they are assigned to different subgroups and in accordance with
the manual calculation procedure they all end up in different groups/projects, the only
possible combination that would increase Group and Overall Efficiency, i.e. having them
work together, is lost.
It was pointed out that these two cases only occur in large groups, i.e. with many individuals.
The rationale is that in these groups, the effects on the Contribution indices (Ci) leading to
these “closed” groups (since they accept each other but reject everyone else) is diluted given
their low weight in relation to the overall number of individuals.
On the other hand, the first exception can be minimised by verifying an additional item that
does lead to a significant increase in the calculation weight: ”The efficiencies of each
group/project (EGk) should decrease to the extent that the groups/projects have a lower
weight (WGk) or importance. If not, something similar to what happens in the case of
exception 1 is likely to occur.
Exception 1 usually has the greatest effect on overall efficiency (EG) since it occurs in
groups/projects with greater importance (higher WGk), meaning that their eviction is a priority.
Regarding exception 2, this is only possible to discretely analyse in groups/projects with
lower Efficiencies (EGk) by observing whether certain of the members divide themselves into
a “closed” group such as the one described. The latter is a complex task given the number of
individuals the groups have with many available resources.

27
Consequently, for very large groups it is proposed that a computer programming calculation
procedure be used in which the Overall Efficiencies of all the possible permutations are
obtained.
6. Discussion
The calculation procedure shown develops a new way of understanding classical
Sociometry, as this is one of the first occasions Sociometry is put into practice in business
issues and the first time that it has been used as a proactive tool.
This method enables any project manager to make better decisions when it comes to
objectively deciding which human resources will perform better, from the standpoint of social
interaction, if joining them with some other individuals from a given pool of resources. That
this is probably the easiest way of getting the sociometric data required and the fact that the
calculations may also be done by hand are two additional advantages of this proposal.
The broad spectrum this procedure is subject to be implemented in is the same as the
Sociometry itself, since it applies exactly the same theoretical principles. If there is a
possibility of choosing among different potential members to form one or several teams, the
method described will be valid, and then, in a given social context and only from the
standpoint of social interaction, an optimal outcome should be expected.
Furthermore, there is one more condition that must be fulfilled: the project manager must, as
a first step, select which individuals are able to meet the requirements each project has
(whether these be legal, technical or experience requirements, etc). Once eligible individuals
are identified, the project manager can apply the sociometric method explained with those
particular members. If this is not so, teamwork might be compromised. For this reason
technical requirements and capabilities will have to be reviewed before making the final
decision of which resources to use.
28
Finally, despite the simplified case study shown in this paper, the algorithm described can be
applied with functional departments broken down by other criteria, for instance, by groups of
members with different experience or expertise levels. In that case, each group subdivision
will have to be treated as a completely new independent group, from which it is possible to
draw resources. These kinds of subdivisions can help when it comes to fulfilling specific
technical requirements of the staff to be selected for different projects. Nevertheless, this
aspect does not change the method at all, aside from increasing the number of groups and
decreasing the possible permutations since the number of potential possible individuals per
group is narrower.
7. Conclusions
By implementing classic sociometric techniques and seeking both to maximize positive group
interactions and to minimize negative group interactions, a novel mathematical calculation
procedure was developed to assure that, given the need to assign staff to different work
groups or projects from a team of available human resources, their combination will be as
efficient as possible from the standpoint of social interaction.
A computer application can be programmed to calculate all the possible matrix permutations,
but a manual calculation procedure is proposed which is considered to be satisfactory
enough and can be used by any project manager, in small and medium-sized groups.
29
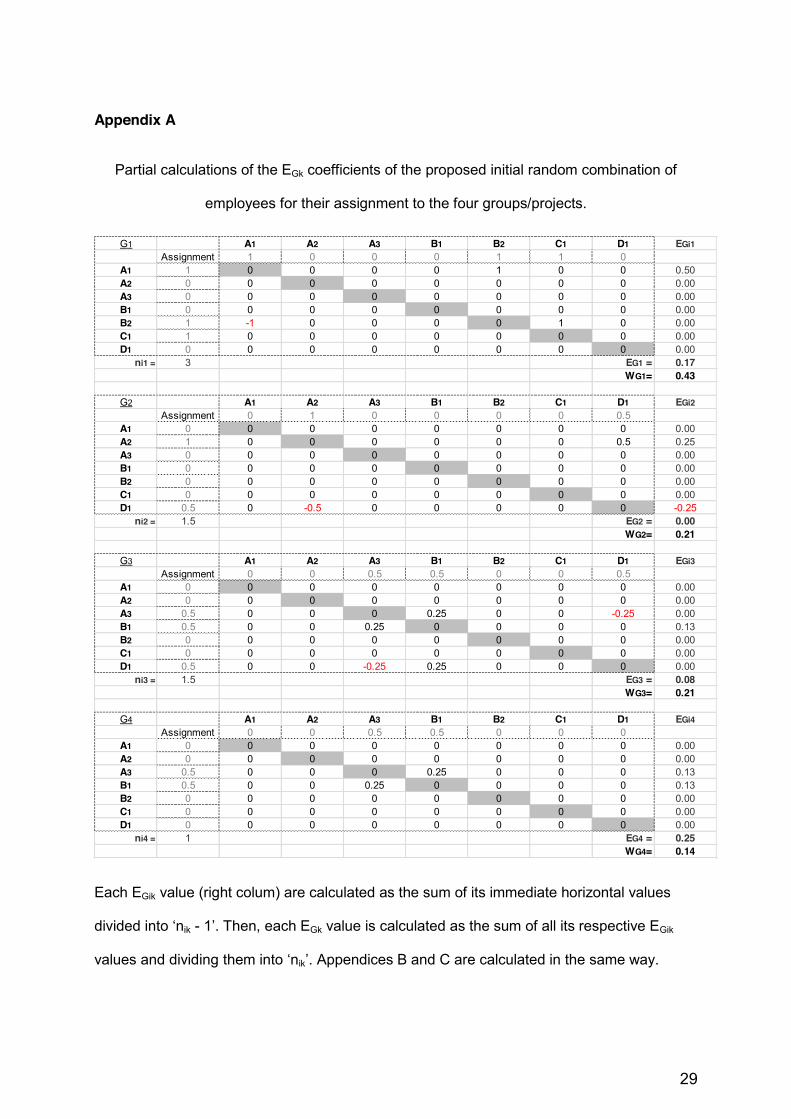
Appendix A
Partial calculations of the EGk coefficients of the proposed initial random combination of
employees for their assignment to the four groups/projects.
Each EGik value (right colum) are calculated as the sum of its immediate horizontal values
divided into ‘nik - 1’. Then, each EGk value is calculated as the sum of all its respective EGik
values and dividing them into ‘nik’. Appendices B and C are calculated in the same way.
G1 A1 A2 A3 B1 B2 C1 D1 EGi1Assignment 1 0 0 0 1 1 0
A1 1 0 0 0 0 1 0 0 0.50A2 0 0 0 0 0 0 0 0 0.00A3 0 0 0 0 0 0 0 0 0.00B1 0 0 0 0 0 0 0 0 0.00B2 1 -1 0 0 0 0 1 0 0.00C1 1 0 0 0 0 0 0 0 0.00D1 0 0 0 0 0 0 0 0 0.00
ni1 = 3 EG1 = 0.17WG1= 0.43
G2 A1 A2 A3 B1 B2 C1 D1 EGi2Assignment 0 1 0 0 0 0 0.5
A1 0 0 0 0 0 0 0 0 0.00A2 1 0 0 0 0 0 0 0.5 0.25A3 0 0 0 0 0 0 0 0 0.00B1 0 0 0 0 0 0 0 0 0.00B2 0 0 0 0 0 0 0 0 0.00C1 0 0 0 0 0 0 0 0 0.00D1 0.5 0 -0.5 0 0 0 0 0 -0.25
ni2 = 1.5 EG2 = 0.00WG2= 0.21
G3 A1 A2 A3 B1 B2 C1 D1 EGi3Assignment 0 0 0.5 0.5 0 0 0.5
A1 0 0 0 0 0 0 0 0 0.00A2 0 0 0 0 0 0 0 0 0.00A3 0.5 0 0 0 0.25 0 0 -0.25 0.00B1 0.5 0 0 0.25 0 0 0 0 0.13B2 0 0 0 0 0 0 0 0 0.00C1 0 0 0 0 0 0 0 0 0.00D1 0.5 0 0 -0.25 0.25 0 0 0 0.00
ni3 = 1.5 EG3 = 0.08WG3= 0.21
G4 A1 A2 A3 B1 B2 C1 D1 EGi4Assignment 0 0 0.5 0.5 0 0 0
A1 0 0 0 0 0 0 0 0 0.00A2 0 0 0 0 0 0 0 0 0.00A3 0.5 0 0 0 0.25 0 0 0 0.13B1 0.5 0 0 0.25 0 0 0 0 0.13B2 0 0 0 0 0 0 0 0 0.00C1 0 0 0 0 0 0 0 0 0.00D1 0 0 0 0 0 0 0 0 0.00
ni4 = 1 EG4 = 0.25WG4= 0.14
30
Appendix B
Partial calculations of the EGk coefficients of the proposed optimal combination of employees
for their assignment to the four groups/projects.
G1 A1 A2 A3 B1 B2 C1 D1 EGi1Assignment 0 1 0 1 0 1 0
A1 0 0 0 0 0 0 0 0 0.00A2 1 0 0 0 0 0 1 0 0.50A3 0 0 0 0 0 0 0 0 0.00B1 1 0 1 0 0 0 0 0 0.50B2 0 0 0 0 0 0 0 0 0.00C1 1 0 1 0 1 0 0 0 1.00D1 0 0 0 0 0 0 0 0 0.00
ni1 = 3 EG1 = 0.67WG1= 0.43
G2 A1 A2 A3 B1 B2 C1 D1 EGi2Assignment 1 0 0 0 0 0 0.5
A1 1 0 0 0 0 0 0 0 0.00A2 0 0 0 0 0 0 0 0 0.00A3 0 0 0 0 0 0 0 0 0.00B1 0 0 0 0 0 0 0 0 0.00B2 0 0 0 0 0 0 0 0 0.00C1 0 0 0 0 0 0 0 0 0.00D1 0.5 0 0 0 0 0 0 0 0.00
ni2 = 1.5 EG2 = 0.00WG2= 0.21
G3 A1 A2 A3 B1 B2 C1 D1 EGi3Assignment 0 0 0.5 0 0.5 0 0.5
A1 0 0 0 0 0 0 0 0 0.00A2 0 0 0 0 0 0 0 0 0.00A3 0.5 0 0 0 0 -0.25 0 -0.25 -0.25B1 0 0 0 0 0 0 0 0 0.00B2 0.5 0 0 0.25 0 0 0 0.25 0.25C1 0 0 0 0 0 0 0 0 0.00D1 0.5 0 0 -0.25 0 0.25 0 0 0.00
ni3 = 1.5 EG3 = 0.00WG3= 0.21
G4 A1 A2 A3 B1 B2 C1 D1 EGi4Assignment 0 0 0.5 0 0.5 0 0
A1 0 0 0 0 0 0 0 0 0.00A2 0 0 0 0 0 0 0 0 0.00A3 0.5 0 0 0 0 -0.25 0 0 -0.13B1 0 0 0 0 0 0 0 0 0.00B2 0.5 0 0 0.25 0 0 0 0 0.13C1 0 0 0 0 0 0 0 0 0.00D1 0 0 0 0 0 0 0 0 0.00
ni4 = 1 EG4 = 0.00WG4= 0.14
31
Appendix C
Partial calculations of the EGk coefficients of the proposed poor combination of employees for
their assignment to the four groups/projects.
G1 A1 A2 A3 B1 B2 C1 D1 EGi1Assignment 0 0 1 0 1 1 0
A1 0 0 0 0 0 0 0 0 0.00A2 0 0 0 0 0 0 0 0 0.00A3 1 0 0 0 0 -1 -1 0 -1.00B1 0 0 0 0 0 0 0 0 0.00B2 1 0 0 1 0 0 1 0 1.00C1 1 0 0 -1 0 0 0 0 -0.50D1 0 0 0 0 0 0 0 0 0.00
ni1 = 3 EG1 = -0.17WG1= 0.43
G2 A1 A2 A3 B1 B2 C1 D1 EGi2Assignment 1 0 0 0 0 0 0.5
A1 1 0 0 0 0 0 0 0 0.00A2 0 0 0 0 0 0 0 0 0.00A3 0 0 0 0 0 0 0 0 0.00B1 0 0 0 0 0 0 0 0 0.00B2 0 0 0 0 0 0 0 0 0.00C1 0 0 0 0 0 0 0 0 0.00D1 0.5 0 0 0 0 0 0 0 0.00
ni2 = 1.5 EG2 = 0.00WG2= 0.21
G3 A1 A2 A3 B1 B2 C1 D1 EGi3Assignment 0 0.5 0 0.5 0 0 0.5
A1 0 0 0 0 0 0 0 0 0.00A2 0.5 0 0 0 0 0 0 0.25 0.13A3 0 0 0 0 0 0 0 0 0.00B1 0.5 0 0.25 0 0 0 0 0 0.13B2 0 0 0 0 0 0 0 0 0.00C1 0 0 0 0 0 0 0 0 0.00D1 0.5 0 -0.25 0 0.25 0 0 0 0.00
ni3 = 1.5 EG3 = 0.17WG3= 0.21
G4 A1 A2 A3 B1 B2 C1 D1 EGi4Assignment 0 0.5 0 0.5 0 0 0
A1 0 0 0 0 0 0 0 0 0.00A2 0.5 0 0 0 0 0 0 0 0.00A3 0 0 0 0 0 0 0 0 0.00B1 0.5 0 0.25 0 0 0 0 0 0.13B2 0 0 0 0 0 0 0 0 0.00C1 0 0 0 0 0 0 0 0 0.00D1 0 0 0 0 0 0 0 0 0.00
ni4 = 1 EG4 = 0.13WG4= 0.14
32
Acknowledgements
We would like to thank the effort made by the Languages Centre of the Universidad
Politécnica de Valencia translating this paper into English.
References
Aldefer, C.P., 1987. An intergroup perspective on group dynamics. JW. Lorsch, ed.
Handbook of organizational behavior. Prentice-Hall, Englewood Cliffs. NJ 190-222.
Andrews, M. C., Kacmar, K. M., Blakely, G. L., & Bucklew, N. S., 2008. Group
Cohesion as an Enhancement to the Justice—Affective Commitment Relationship. Group &
Organization Management, 33(6), 736 -755.
Asquin, A., Garel, G. & Picq, T., 2009. When project-based management causes
distress at work. International Journal of Project Management. 28(2), 166-172
Baiden, B. K. & Price, A.D.F., 2011. The effect of integration on project delivery team
effectiveness. International Journal of Project Management. 29(2), 129-136.
Beal, D. J., Cohen, R., Burke, M. J. & McLendon, C. L., 2003. Cohesion and
performance in groups: A meta-analytic clarification of construct relation. Journal of Applied
Psychology. 88: 989-1004.
Bezanilla, J.M. & Miranda, A., 2008. Validez del método sociométrico. Alternativas
en psicología. Segunda época, Año XIII, Número 19.
Campion, M.A., Medsker, G.J., & Higgs, A.C., 1993. Relations between work group
characteristics and effectiveness: implications for designing effective work groups. Personnel
Psychology. 46: 823-847.
Cartwright, D., 1968. The nature of group cohesiveness. D. Cartwright and A.
Zander, eds. Group Dynamics: Research and Theory, 3rd ed. Tavistock Publications.
London U.K., 91-109.
33
Chansler, P. A., Swamidass, P. M., & Cammann, C., 2003. Self-Managing Work
Teams. An empirical study of Group Cohesiveness in "Natural Work Groups" at a Harley-
Davidson Motor Company Plant. Small Group Research, 34(1), 101 -120.
Chen, S.J. & Lin, L., 2004. Modelling team member characteristics for the formation
of a multifunctional team in concurrent engineering. IEEE Transactions on Engineering
Management. 51: 111-124.
Chiocchio, F., Beaulieu, G., Boudrias, JB., Rousseau, V., Aubé, C., & Morin E.M.,
2010. The Project Involvement Index, psychological distress, and psychological well-being:
Comparing workers from projectized and non-projectized organizations. International Journal
of Project Management. 28 (3), 201-211.
Dean BV., Denzler DR., Watkins JJ., 1992. Multiproject staff scheduling with variable
resource constraints. IEEE Trans Eng Manage 39: 59–72.
Dwivedula, R. & Bredillet, C.N., 2010. Profiling work motivation of project workers.
International Journal of Project Management. 28 (2), 158-165.
Eisenberg, J., 2007. Group Cohesiveness, in R. F. Baumeister & K. D. Vohs (Eds.),
Encyclopaedia of Social Psychology, 386-388. Thousand Oaks, CA: Sage.
Ferrin, D. L., Bligh, M. C., & Kohles, J. C., 2007. Can I Trust You to Trust Me? Group
& Organization Management, 32(4), 465 -499.
Fitzpatrick, E.L. & Askin, R.G., 2005. Forming effective worker teams with multi-
functional skill requirements. Journal of Computers & Industrial Engineering. 48: 593–608.
Gordon, J. R., Mondy, R. W., Sharplin, A., & Premeaux, S. R., 1990. Management
and Organizational Behavior. Boston, MA: Allyn and Bacon.

34
Guzzo, R.A. & Shea, G.P., 1992. Group performance and intergroup relations in
organizations. M.D. Dunnette, L.M. Hough, eds. Handbook of Industrial and Organizational
Psychology, 3rd ed. Consulting Psycologists Press, Palo Alto, CA 269-313.
Hackman, J.R., 1987. The design of work teams, JW. Lorsch, ed. Handbook of
organizational behavior. Prentice-Hall, Englewood Cliffs. NJ 67-102.
Hadj-Hamou, K. & Caillaud, E., 2004. Cooperative design : A framework for a
competency-based approach. 5th International Conference on Integrated Design and
Manufacturing in Mechanical Engineering, IDMME’04, University of Bath.
Hendriks M, Voeten B, Kroep L., 1999. Human resource allocation in a multi-project
R&D environment: resource capacity allocation and project portfolio planning in practice.
International Journal of Project Management. 17, 181–188.
Hlaoittinun, O., Bonjour, E., & Dulmet, M., 2007. A team building approach for
competency development. IEEE International Conference on Industrial Engineering and
Engineering Management. Singapur. DOI 10.1109/IEEM.2007.4419343
Hoegl, M. & Gemuenden, H.G., 2001. Teamwork quality and the success of
Innovative Projects: a theoretical concept and empirical evidence. Organization Science. 12:
435-449.
Hollenbeck, J. H., Scott, D. & Guzzo, R., 2004. Bridging the Gap between I/O
research and HR practice: improving team composition, team training and task design.
Human Resource Management. 43: 353-366.
Huemann, M., Keegan, A. & Turner, J.R., 2007. Human resource management in the
project-oriented company: A review. International Journal of Project Management. 25 (3),
315-323.
Jones, D., 2001. Sociometry in team and Organisation development. British Journal
of Psychodrama and Sociodrama. 16: 1.

35
Laslo, Z. & Goldberg, A.I., 2008. Resource allocation under uncertainty in a multi-
project matrix environment: Is organizational conflict inevitable?. International Journal of
Project Management. 26 (8), 773-788.
Maurer, I., 2010. How to build trust in inter-organizational projects: The impact of
project staffing and project rewards on the formation of trust, knowledge acquisition and
product innovation. International Journal of Project Management. 28 (7), 629-637.
Moreno, J. L., 1941. Foundations of Sociometry: an Introduction. Sociometry, 4 (1)
15-35.
Moreno, J. L. 1961. Fundamentos de la Sociometría. Buenos Aires: Paidós.
Morse LC., McIntosh JO., Whitehouse GE., 1996. Using combinations of heuristics to
schedule activities of constrained multiple resource projects. Project Manage Journal
1996(1), 34–40.
Patanakul, P. & Milosevic, D., 2009. The effectiveness in managing a group of
multiple projects: Factors of influence and measurement criteria. International Journal of
Project Management. 27(3), 216-233
Piper, W., Marrache, M., Lacroix, R., Richardson, A. & Jones, B., 1983. Cohesion as
a basic bond in groups. Human Relations. 36: 93-108.
Tong TKL. & Tam CM., 2003. Fuzzy optimisation of labour allocation by genetic
algorithms. Eng Const Archit Manag. 10(2):146–55.
Tsai, H.T., Moskowitz, H. & Lee, L.H., 2003. Human resource selection for software
development projects using Taguchi’s parameter design. European Journal of Operational
Research. 151: 167-180.
Tseng, T.L., Huang, C.C., Chu, H.W., & Gung, R.R., 2004. Novel approach to multi-
functional project team formation. International Journal of Project Management. 22: 147–159.
36
Turner, R., Huemann, M. & Keegan, A., 2008. Human resource management in the
project-oriented organization: Employee well-being and ethical treatment. International
Journal of Project Management. 26 (5), 577-585.
Wiendieck, G., 1992. Teamarbeit. Frese, Erich, eds. Handwoerterbuch der
Organisation. C.E. Poeschel Verlag, Stuttgart, Germany.
Wu YK., 2007. On the manpower allocation within matrix organization: a fuzzy linear
programming approach. European Journal of Operational Research. 183(1):384–93.
Zakarian, A. & Kusiak, A., 1999. Forming teams: an analytical approach. IIE
Transactions. 31: 85-97.
Zwikael, O. & Unger-Aviram, E., 2010. HRM in project groups: The effect of project
duration on team development effectiveness. International Journal of Project Management.
28(5), 413-421.