Embed Size (px)
Citation preview
Resource Allocationand Purchasingin Africa:What is effective in improvingthe health of the poor?
Tonia Marek
Rena Eichler
Philip Schnabl
Africa Region
The World Bank
Washington, D.C.
Africa Region Human DevelopmentWorking Paper Series
ii
Copyright © August 2004Human Development SectorAfrica RegionThe World Bank
The findings, interpretations, and conclusionsexpressed herein are entirely those of the authors They do not necessarily represent the views of the World Bank Group, its ExecutiveDirectors, or the countries that they representand should not be attributed to them.
Cover design by Word ExpressTypography by Word Design, Inc.Cover photo: Antelope, Burkina Faso – Musée de l’Homme, Paris in Afrique Noire by Laure Meyer, Terrail Editions, Paris, 1991
Contact: Tonia MarekLead Public Health SpecialistThe World [email protected]
Contents
Acknowledgement . . . . . . . . . . . . . . . . . . . . . . . . . . . . . . . . . . . . . . . . . . . . . . . . . . . .v
List of Acronyms . . . . . . . . . . . . . . . . . . . . . . . . . . . . . . . . . . . . . . . . . . . . . . . . . . . .vi
Executive Summary . . . . . . . . . . . . . . . . . . . . . . . . . . . . . . . . . . . . . . . . . . . . . . . . . . .1Ten key findings emerge from this review: . . . . . . . . . . . . . . . . . . . . . . . . . . . . . . . .2Nine main messages to guide future interventions: . . . . . . . . . . . . . . . . . . . . . . . . . .3
I Introduction . . . . . . . . . . . . . . . . . . . . . . . . . . . . . . . . . . . . . . . . . . . . . . . . . . . . . . . .4
II Current Practices and Trends in Resource Generation . . . . . . . . . . . . . . . . . . . . . . . . . .5Emergence of untapped opportunities upon closer study of who finances health care .6Funding health services through tax and social health insurance schemes . . . . . . . . . .7Charging user fees . . . . . . . . . . . . . . . . . . . . . . . . . . . . . . . . . . . . . . . . . . . . . . . . . .7Implementing employer-based insurance . . . . . . . . . . . . . . . . . . . . . . . . . . . . . . . . . .8The rise of community-based health insurance (CBHI) . . . . . . . . . . . . . . . . . . . . . . .9The role of external development assistance . . . . . . . . . . . . . . . . . . . . . . . . . . . . . . .9
III Current Practices and Trends in Resource Pooling . . . . . . . . . . . . . . . . . . . . . . . . . . .12Establishing Social Health Insurance . . . . . . . . . . . . . . . . . . . . . . . . . . . . . . . . . . .12Setting up Medical Aid Societies . . . . . . . . . . . . . . . . . . . . . . . . . . . . . . . . . . . . . . .15Promoting risk pooling schemes for the informal sector . . . . . . . . . . . . . . . . . . . . .15Building on the Bamako Initiative: A pooling mechanism with local ownership . . . .20
IV Current Practices and Trends in Resource Allocation . . . . . . . . . . . . . . . . . . . . . . . . .24Utilizing budget mechanisms to ensure better resource allocation . . . . . . . . . . . . . .24Decentralization: an ongoing trend . . . . . . . . . . . . . . . . . . . . . . . . . . . . . . . . . . . . .24Better allocation through primary health care . . . . . . . . . . . . . . . . . . . . . . . . . . . . .27Policy measures which have considerable public health impact . . . . . . . . . . . . . . . .28Technicians overlook the importance of local politicians in allocating resources . . . .30Some Trends to Better use external aid for resource allocation . . . . . . . . . . . . . . . . .30
V Who is Covered? . . . . . . . . . . . . . . . . . . . . . . . . . . . . . . . . . . . . . . . . . . . . . . . . . . . .33Addressing inequities . . . . . . . . . . . . . . . . . . . . . . . . . . . . . . . . . . . . . . . . . . . . . . .33Where else can the poor go for services? . . . . . . . . . . . . . . . . . . . . . . . . . . . . . . . . .34
iii
iv
VI Current Trends and Practices in Purchasing Health Services . . . . . . . . . . . . . . . . . . . .38Public–public arrangements: Local level purchasing within a decentralized
public model . . . . . . . . . . . . . . . . . . . . . . . . . . . . . . . . . . . . . . . . . . . . . . . . . . .38Public–private arrangements . . . . . . . . . . . . . . . . . . . . . . . . . . . . . . . . . . . . . . . . .38Private–private arrangements . . . . . . . . . . . . . . . . . . . . . . . . . . . . . . . . . . . . . . . . .41Demand-side strategies to enable purchasing among target groups . . . . . . . . . . . . . .41
VII Conclusion: Misconceptions, Constraints, and Future Opportunities . . . . . . . . . . . . . .44
Bibliography . . . . . . . . . . . . . . . . . . . . . . . . . . . . . . . . . . . . . . . . . . . . . . . . . . . . . . .49
v
Acknowledgement
Financial support from a CIDA (Canadian International Development Agency) Grant andfrom a Dutch Trust Fund were used to carry out this study and is gratefully acknowledged.The authors would also like to thank Ok Pannenborg, Oscar Picazo, Alex Preker, and AgnesSoucat for their constructive comments, and Isabelle Dupond for her help in finalizing thedocument.
vi
List of Acronyms
AfDB African Development BankAIDS Acquired Immuno-Deficiency SyndromeARI Acute Respiratory InfectionCBHI Community-based Health InsuranceCFW Cry for the World FoundationCHF Community Health FundsCIMAS Commercial/Industrial Medical Aid SocietiesESA Eastern and Southern AfricaGDP Gross Domestic ProductHIPC Heavily Indebted Poor Country InitiativeHIV Human Immuno-Deficiency VirusITN Insecticide Treated netsKHHS The Kisiizi Hospital Health SocietyMBB Marginal Budgeting for BottlenecksMCH Maternal and Child HealthMOH Ministry of HealthNGO Non-governmental OrganizationNHA National Health AccountsNHIF National Hospital Insurance Fund (Kenya)OECD Organization for Economic Cooperation and DevelopmentORT Oral Rehydration TherapyPCP Primary Care PhysicianRAP Resource Allocation and PurchasingSSA Sub-Saharan AfricaSWAP Sector Wide Approach ProgramUN United NationsUSAID United States Agency for International DevelopmentWDR World Development Report published by the World BankWHO World Health Organization
Executive Summary
he primary objective of this paper is toassess how Resource Allocation andPurchasing (RAP) is being implementedin Africa, and to consolidate some of
the lessons that have been learned. This objec-tive is accomplished by reviewing trends andspecific cases in Africa where RAP strategieshave increased the effectiveness of a health sys-tem, in terms of efficiency, equity, quality, own-ership or a combination of these factors. Theselection of case studies is solely based on theavailability of empirical evidence to show thatthe arrangement had improved health out-
comes. This review is not exhaustive, but givesa clear idea of the current situation in Africa,putting forth information and insight intowhat approaches have worked and what cur-rent trends in this area are today. Further, thispaper highlights a number of promising effortsthat have been implemented or are currentlyunderway that could provide direction usefulto decision makers who should take action onthese issues. Although these findings are notnew — their organization and presentation is— and they are worth repeating.
1
T
2 Resource Allocation and Purchasing in Africa
Ten key findings emerge from this review:
1) The public sector finances less than half of total expenditure on health. The remaining costsare financed with out-of-pocket funds, that go primarily to purchasing private sector services.The private sector herein comprises formal or informal service providers as well as Non-gov-ernmental Organizations (NGOs). Since money spent on private providers is unpooled, it pro-vides little bargaining power for individual purchasers of commodities, resulting in inefficien-cy and inequity. Those issues must be addressed by governments.
2) The private sector plays a more significant role than the government in most African coun-tries compared to the Organization for Economic Cooperation and Development (OECD)countries.
3) Social health insurance is an existing trend for the formal as well as for the informal sec-tors. Community-based health insurance (CBHI) mutuals are created in a rapidly increasingrate in Africa. The problem of re-insurance for the sake of sustainability needs to be addressed.
4) Some governments depend primarily on donors to cover health costs, and some even relyon donors to cover recurrent costs as well, which is of serious concern.
5) Although there is a need to increase funding for health in Africa, there is also a need toimprove the utilization of existing funding as a large portion of available funding is not beingdisbursed.
6) Large funding allocations earmarked for addressing and treating specific diseases have thepotential to skew key health sector priorities if attention is not paid to the long-term strength-ening of health systems in Africa. This is a growing problem as donors have adopted a trendof increasingly financing vertical initiatives, rather than focusing on the health system as awhole.
7) Most governments in Africa have not yet assumed their stewardship function and are stillstruggling with service delivery issues rather than focusing on outcomes and performance.
8) Donors are part of the existing problem, adding to the fragmentation and the lack of own-ership.
9) Decentralization in the health sector is often undertaken in parallel with others movestoward decentralization in and by the government. To date, the health sector has only achievedminimal decentralization, and health expenditure tracking surveys show that funds have haddifficulties reaching the base.
10) Primary health care has permitted great strides in improving health outcomes, but moretargeting is needed now to ensure that resources actually reach the poor and to improve healthindicators.
Executive Summary 3
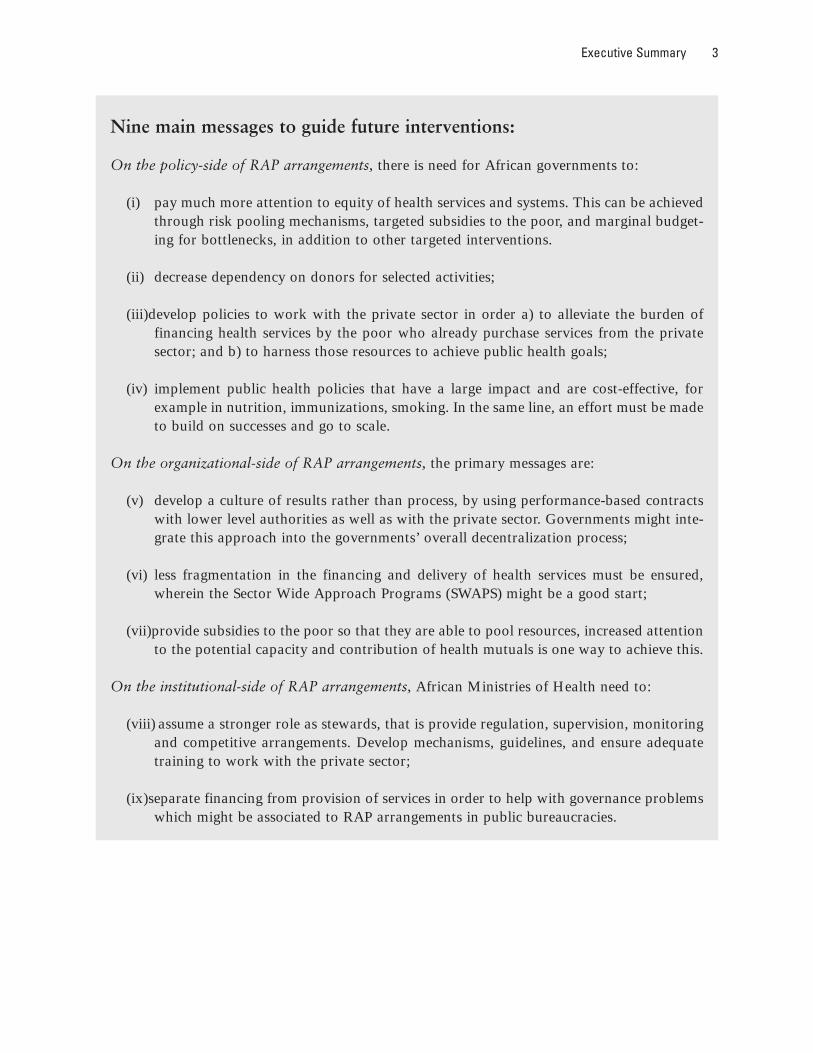
Nine main messages to guide future interventions:
On the policy-side of RAP arrangements, there is need for African governments to:
(i) pay much more attention to equity of health services and systems. This can be achievedthrough risk pooling mechanisms, targeted subsidies to the poor, and marginal budget-ing for bottlenecks, in addition to other targeted interventions.
(ii) decrease dependency on donors for selected activities;
(iii)develop policies to work with the private sector in order a) to alleviate the burden offinancing health services by the poor who already purchase services from the privatesector; and b) to harness those resources to achieve public health goals;
(iv) implement public health policies that have a large impact and are cost-effective, forexample in nutrition, immunizations, smoking. In the same line, an effort must be madeto build on successes and go to scale.
On the organizational-side of RAP arrangements, the primary messages are:
(v) develop a culture of results rather than process, by using performance-based contractswith lower level authorities as well as with the private sector. Governments might inte-grate this approach into the governments’ overall decentralization process;
(vi) less fragmentation in the financing and delivery of health services must be ensured,wherein the Sector Wide Approach Programs (SWAPS) might be a good start;
(vii)provide subsidies to the poor so that they are able to pool resources, increased attentionto the potential capacity and contribution of health mutuals is one way to achieve this.
On the institutional-side of RAP arrangements, African Ministries of Health need to:
(viii) assume a stronger role as stewards, that is provide regulation, supervision, monitoringand competitive arrangements. Develop mechanisms, guidelines, and ensure adequatetraining to work with the private sector;
(ix)separate financing from provision of services in order to help with governance problemswhich might be associated to RAP arrangements in public bureaucracies.
CHAPTER I
Introduction
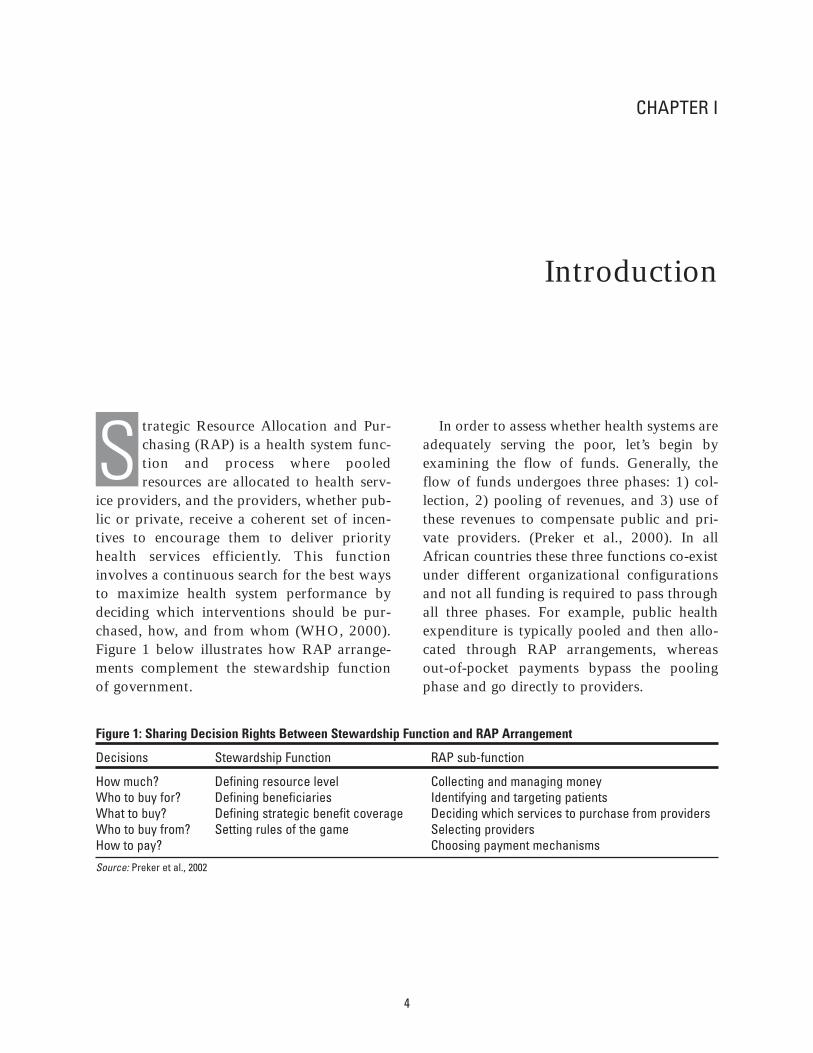
trategic Resource Allocation and Pur-chasing (RAP) is a health system func-tion and process where pooledresources are allocated to health serv-
ice providers, and the providers, whether pub-lic or private, receive a coherent set of incen-tives to encourage them to deliver priorityhealth services efficiently. This functioninvolves a continuous search for the best waysto maximize health system performance bydeciding which interventions should be pur-chased, how, and from whom (WHO, 2000).Figure 1 below illustrates how RAP arrange-ments complement the stewardship functionof government.
In order to assess whether health systems areadequately serving the poor, let’s begin byexamining the flow of funds. Generally, theflow of funds undergoes three phases: 1) col-lection, 2) pooling of revenues, and 3) use ofthese revenues to compensate public and pri-vate providers. (Preker et al., 2000). In allAfrican countries these three functions co-existunder different organizational configurationsand not all funding is required to pass throughall three phases. For example, public healthexpenditure is typically pooled and then allo-cated through RAP arrangements, whereasout-of-pocket payments bypass the poolingphase and go directly to providers.
4
S
Figure 1: Sharing Decision Rights Between Stewardship Function and RAP Arrangement
Decisions Stewardship Function RAP sub-function
How much? Defining resource level Collecting and managing money Who to buy for? Defining beneficiaries Identifying and targeting patients What to buy? Defining strategic benefit coverage Deciding which services to purchase from providers Who to buy from? Setting rules of the game Selecting providers How to pay? Choosing payment mechanisms
Source: Preker et al., 2002
CHAPTER II
Current Practices and Trends in Resource Generation
n a worldwide comparison based on anindex of performance which reportshow efficiently health systems translateexpenditures into health as measured
by disability-adjusted life expectancy (DALE),The World Health Organization (WHO, 2000)ranks most African health systems within thebottom quarter. There are several possibleexplanations for this state of affairs; one couldbe the fact that most African countries do nothave adequate resources to establish any func-tioning health systems. For example, Sub-Saha-ran African (SSA) countries have total per capi-ta health expenditures ranging from US$ 4 inEthiopia to US$ 230 in South Africa, with amedian situated at US$ 18, an average at US$30 if South Africa is not included, and US$ 40if it is included (World Bank, 2002). In 1997,in absolute per capita terms South Africa,Namibia, Gabon, Botswana and Mauritiusspent the largest amounts on health care (morethan US$ 100 per capita per year) (WHO,2000). All the other countries spend less, with19 countries spending less than US$ 25 percapita. (McLaughlin, 2004).
Total health expenditure in SSA, as a per-centage of Gross Domestic Product (GDP), ison average 4.9 percent, which compares to the5 percent of all lower-middle income countries,
but is less than the 6.2% of upper-middleincome countries (World Bank, 2002a). Out of44 countries with data, only 10 spent morethan 5 percent of GDP on health services(WHO, 2000). Several countries have beenable to significantly increase their public healthspending per capita in the last decade. Forexample between 1990 and 1998, Senegalincreased it by 19 percent, Ethiopia by 10 per-cent, Burkina Faso by 6.4 percent. On theother hand, a number of countries saw adecrease in those percentages, the worst beingBurundi with –11 percent, Gambia and Tanza-nia followed with –3 percent. (Wagstaff, 2002)
A report by the WHO Commission onMacroeconomics and Health (2002) thereforeconcludes that significant increases in donorfunding are needed to provide basic healthservices in Africa. (WHO, 2002a) However,care is required when pretending to increaseexpenditures at the country level on the basisof donor financing. Increased financing maynot translate into larger expenditures at thecountry level as will be seen later in this paper.Moreover, increases in expenditures may notbe efficient or directed to those determinantsthat have the largest impact or outcome. (Got-tret & Preker, 2003) Other possible explana-tions and solutions can be found in this paper.
5
I
6 Resource Allocation and Purchasing in Africa
The following is a review of existing prac-tices and issues with accompanying suggestionsthat provide guidance in addressing these limi-tations.
Emergence of untapped opportunitiesupon closer study of who financeshealth care
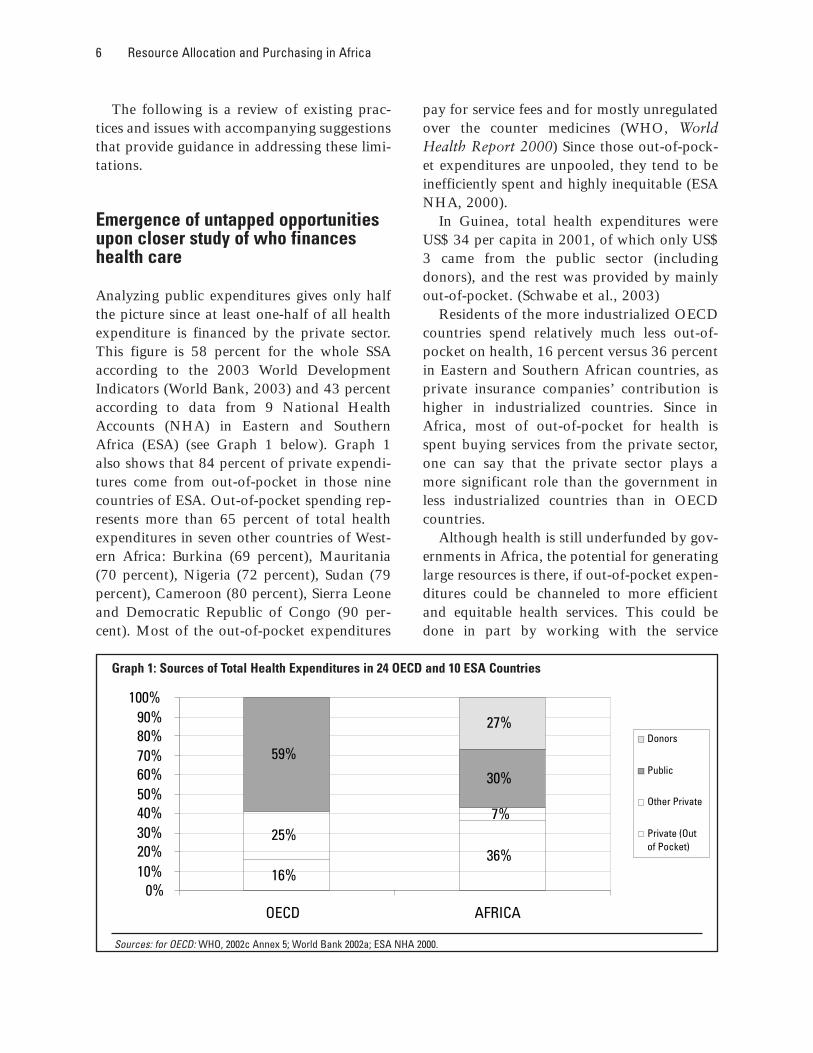
Analyzing public expenditures gives only halfthe picture since at least one-half of all healthexpenditure is financed by the private sector.This figure is 58 percent for the whole SSAaccording to the 2003 World DevelopmentIndicators (World Bank, 2003) and 43 percentaccording to data from 9 National HealthAccounts (NHA) in Eastern and SouthernAfrica (ESA) (see Graph 1 below). Graph 1also shows that 84 percent of private expendi-tures come from out-of-pocket in those ninecountries of ESA. Out-of-pocket spending rep-resents more than 65 percent of total healthexpenditures in seven other countries of West-ern Africa: Burkina (69 percent), Mauritania(70 percent), Nigeria (72 percent), Sudan (79percent), Cameroon (80 percent), Sierra Leoneand Democratic Republic of Congo (90 per-cent). Most of the out-of-pocket expenditures
pay for service fees and for mostly unregulatedover the counter medicines (WHO, WorldHealth Report 2000) Since those out-of-pock-et expenditures are unpooled, they tend to beinefficiently spent and highly inequitable (ESANHA, 2000).
In Guinea, total health expenditures wereUS$ 34 per capita in 2001, of which only US$3 came from the public sector (includingdonors), and the rest was provided by mainlyout-of-pocket. (Schwabe et al., 2003)
Residents of the more industrialized OECDcountries spend relatively much less out-of-pocket on health, 16 percent versus 36 percentin Eastern and Southern African countries, asprivate insurance companies’ contribution ishigher in industrialized countries. Since inAfrica, most of out-of-pocket for health isspent buying services from the private sector,one can say that the private sector plays amore significant role than the government inless industrialized countries than in OECDcountries.
Although health is still underfunded by gov-ernments in Africa, the potential for generatinglarge resources is there, if out-of-pocket expen-ditures could be channeled to more efficientand equitable health services. This could bedone in part by working with the service
36%25%
7%
59%
30%
27%
16%0%
10%20%30%40%50%60%70%80%90%
100%
OECD AFRICA
Donors
Public
Other Private
Private (Outof Pocket)
Graph 1: Sources of Total Health Expenditures in 24 OECD and 10 ESA Countries
Sources: for OECD: WHO, 2002c Annex 5; World Bank 2002a; ESA NHA 2000.
Current Practices and Trends in Resource Generation 7
providers used by the population, namely theprivate sector.
Funding health services through taxand social health insurance schemes
Tax-funded health expenditure is around 14percent of GDP for 16 African countries withavailable data (World Bank, 2003). In mostAfrican countries, adequate revenue collectionthrough public taxes has proven difficultbecause a large proportion of the populationworks in the informal sector and tax collectionmechanisms are weak. Since most publichealth expenditure is tax-funded, overall pub-lic spending on health services is very low. Theprospects for increased public funding in themedium term are thus slim.
Several African countries complement taxrevenues by mandating participation by govern-ment workers and/or formal sector workers insocial health insurance. In 1993, a World BankSurvey identified 14 African countries whichhave some form of social health insurance. Thepopulation covered ranged between 0.1 percent(Ethiopia) and 25 percent (Kenya) (Shaw andGriffin 1995). However, WHO estimates thatKenya was the only country where social securi-ty contributions exceeded one percent of publichealth expenditure. (WHO, 2000) Social insur-ance has not been a major contributor to thegeneration of resources in SSA. Details of socialhealth insurance and lessons for SSA are pre-sented in section IV that covers risk pooling,drawing on lessons from the Kenya NationalHospital Insurance Fund (NHIF).
Charging user fees
It is generally believed that cost-recoveryschemes administered locally (i) ensure a steadycash flow at the local level; (ii) promote moreefficient drug use; and (iii) provide the commu-nity with more flexibility in financing necessary
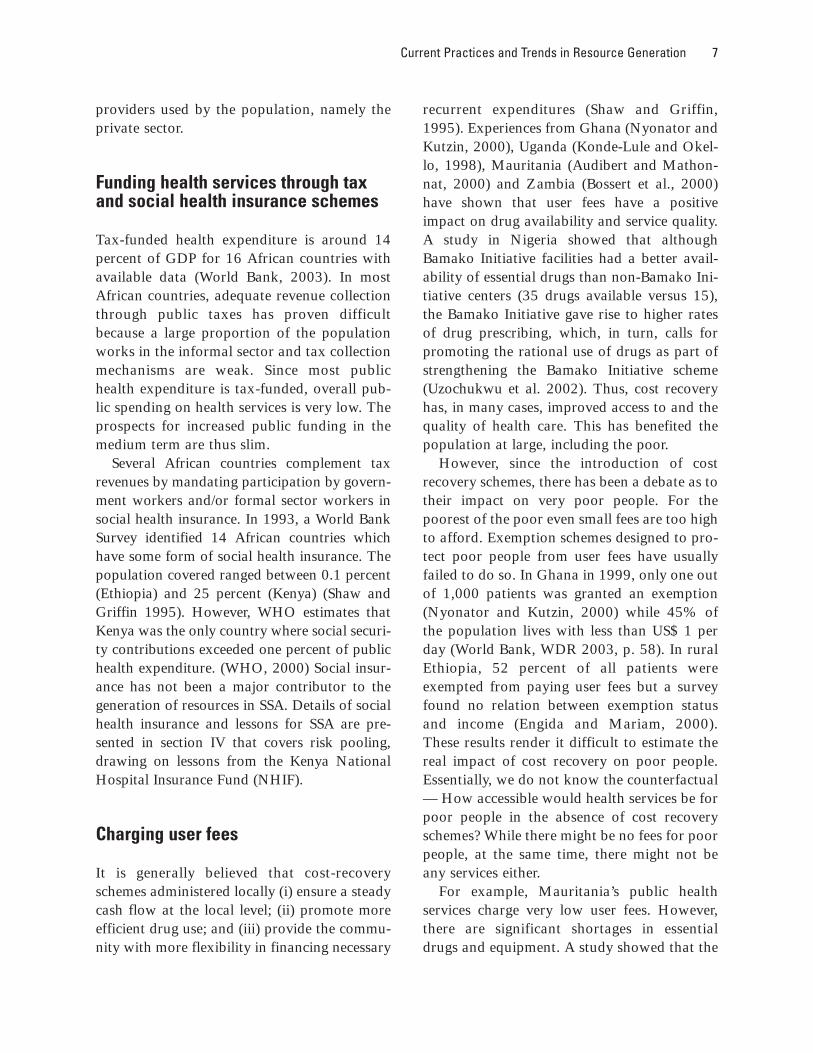
recurrent expenditures (Shaw and Griffin,1995). Experiences from Ghana (Nyonator andKutzin, 2000), Uganda (Konde-Lule and Okel-lo, 1998), Mauritania (Audibert and Mathon-nat, 2000) and Zambia (Bossert et al., 2000)have shown that user fees have a positiveimpact on drug availability and service quality.A study in Nigeria showed that althoughBamako Initiative facilities had a better avail-ability of essential drugs than non-Bamako Ini-tiative centers (35 drugs available versus 15),the Bamako Initiative gave rise to higher ratesof drug prescribing, which, in turn, calls forpromoting the rational use of drugs as part ofstrengthening the Bamako Initiative scheme(Uzochukwu et al. 2002). Thus, cost recoveryhas, in many cases, improved access to and thequality of health care. This has benefited thepopulation at large, including the poor.
However, since the introduction of costrecovery schemes, there has been a debate as totheir impact on very poor people. For thepoorest of the poor even small fees are too highto afford. Exemption schemes designed to pro-tect poor people from user fees have usuallyfailed to do so. In Ghana in 1999, only one outof 1,000 patients was granted an exemption(Nyonator and Kutzin, 2000) while 45% ofthe population lives with less than US$ 1 perday (World Bank, WDR 2003, p. 58). In ruralEthiopia, 52 percent of all patients wereexempted from paying user fees but a surveyfound no relation between exemption statusand income (Engida and Mariam, 2000).These results render it difficult to estimate thereal impact of cost recovery on poor people.Essentially, we do not know the counterfactual— How accessible would health services be forpoor people in the absence of cost recoveryschemes? While there might be no fees for poorpeople, at the same time, there might not beany services either.
For example, Mauritania’s public healthservices charge very low user fees. However,there are significant shortages in essentialdrugs and equipment. A study showed that the
8 Resource Allocation and Purchasing in Africa
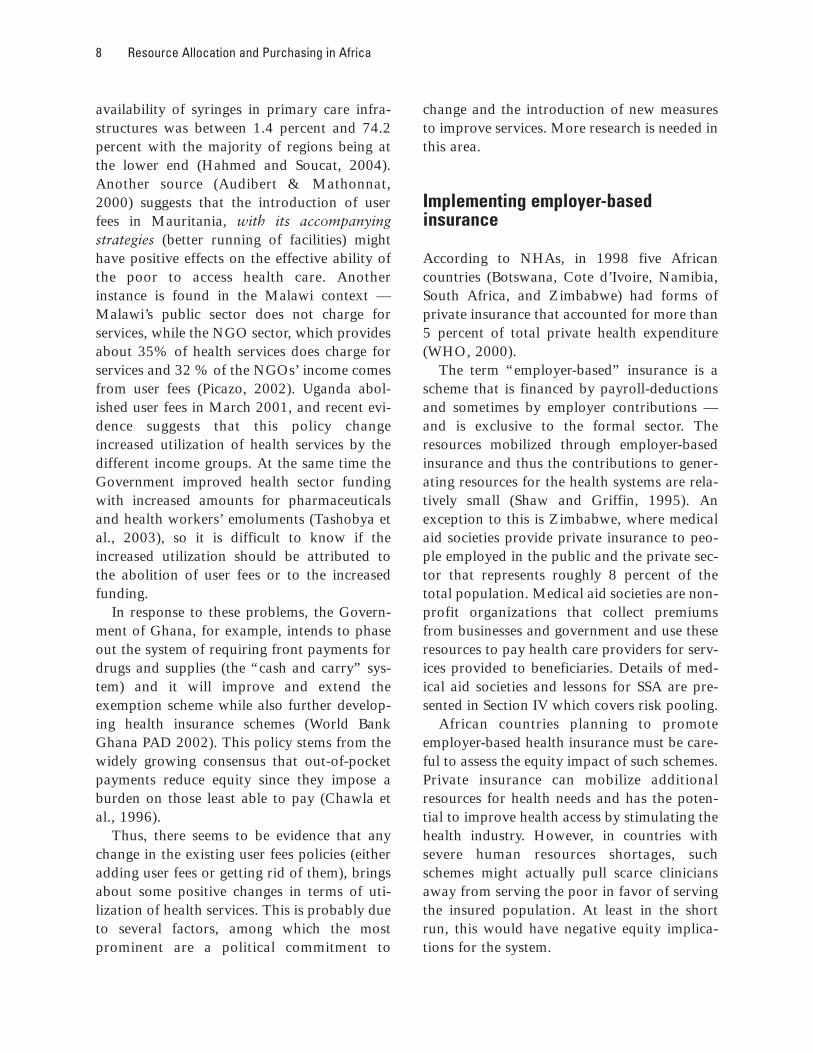
availability of syringes in primary care infra-structures was between 1.4 percent and 74.2percent with the majority of regions being atthe lower end (Hahmed and Soucat, 2004).Another source (Audibert & Mathonnat,2000) suggests that the introduction of userfees in Mauritania, with its accompanyingstrategies (better running of facilities) mighthave positive effects on the effective ability ofthe poor to access health care. Anotherinstance is found in the Malawi context —Malawi’s public sector does not charge forservices, while the NGO sector, which providesabout 35% of health services does charge forservices and 32 % of the NGOs’ income comesfrom user fees (Picazo, 2002). Uganda abol-ished user fees in March 2001, and recent evi-dence suggests that this policy changeincreased utilization of health services by thedifferent income groups. At the same time theGovernment improved health sector fundingwith increased amounts for pharmaceuticalsand health workers’ emoluments (Tashobya etal., 2003), so it is difficult to know if theincreased utilization should be attributed tothe abolition of user fees or to the increasedfunding.
In response to these problems, the Govern-ment of Ghana, for example, intends to phaseout the system of requiring front payments fordrugs and supplies (the “cash and carry” sys-tem) and it will improve and extend theexemption scheme while also further develop-ing health insurance schemes (World BankGhana PAD 2002). This policy stems from thewidely growing consensus that out-of-pocketpayments reduce equity since they impose aburden on those least able to pay (Chawla etal., 1996).
Thus, there seems to be evidence that anychange in the existing user fees policies (eitheradding user fees or getting rid of them), bringsabout some positive changes in terms of uti-lization of health services. This is probably dueto several factors, among which the mostprominent are a political commitment to
change and the introduction of new measuresto improve services. More research is needed inthis area.
Implementing employer-basedinsurance
According to NHAs, in 1998 five Africancountries (Botswana, Cote d’Ivoire, Namibia,South Africa, and Zimbabwe) had forms ofprivate insurance that accounted for more than5 percent of total private health expenditure(WHO, 2000).
The term “employer-based” insurance is ascheme that is financed by payroll-deductionsand sometimes by employer contributions —and is exclusive to the formal sector. Theresources mobilized through employer-basedinsurance and thus the contributions to gener-ating resources for the health systems are rela-tively small (Shaw and Griffin, 1995). Anexception to this is Zimbabwe, where medicalaid societies provide private insurance to peo-ple employed in the public and the private sec-tor that represents roughly 8 percent of thetotal population. Medical aid societies are non-profit organizations that collect premiumsfrom businesses and government and use theseresources to pay health care providers for serv-ices provided to beneficiaries. Details of med-ical aid societies and lessons for SSA are pre-sented in Section IV which covers risk pooling.
African countries planning to promoteemployer-based health insurance must be care-ful to assess the equity impact of such schemes.Private insurance can mobilize additionalresources for health needs and has the poten-tial to improve health access by stimulating thehealth industry. However, in countries withsevere human resources shortages, suchschemes might actually pull scarce cliniciansaway from serving the poor in favor of servingthe insured population. At least in the shortrun, this would have negative equity implica-tions for the system.
Current Practices and Trends in Resource Generation 9
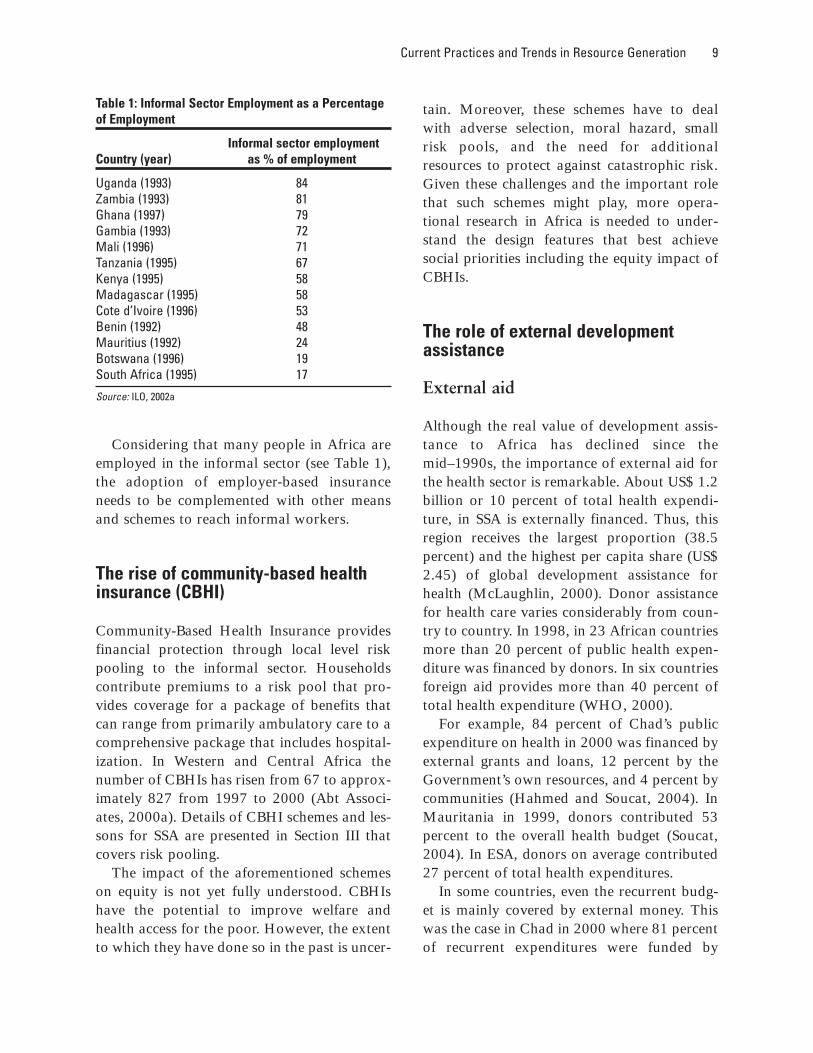
Considering that many people in Africa areemployed in the informal sector (see Table 1),the adoption of employer-based insuranceneeds to be complemented with other meansand schemes to reach informal workers.
The rise of community-based healthinsurance (CBHI)
Community-Based Health Insurance providesfinancial protection through local level riskpooling to the informal sector. Householdscontribute premiums to a risk pool that pro-vides coverage for a package of benefits thatcan range from primarily ambulatory care to acomprehensive package that includes hospital-ization. In Western and Central Africa thenumber of CBHIs has risen from 67 to approx-imately 827 from 1997 to 2000 (Abt Associ-ates, 2000a). Details of CBHI schemes and les-sons for SSA are presented in Section III thatcovers risk pooling.
The impact of the aforementioned schemeson equity is not yet fully understood. CBHIshave the potential to improve welfare andhealth access for the poor. However, the extentto which they have done so in the past is uncer-
tain. Moreover, these schemes have to dealwith adverse selection, moral hazard, smallrisk pools, and the need for additionalresources to protect against catastrophic risk.Given these challenges and the important rolethat such schemes might play, more opera-tional research in Africa is needed to under-stand the design features that best achievesocial priorities including the equity impact ofCBHIs.
The role of external developmentassistance
External aid
Although the real value of development assis-tance to Africa has declined since themid–1990s, the importance of external aid forthe health sector is remarkable. About US$ 1.2billion or 10 percent of total health expendi-ture, in SSA is externally financed. Thus, thisregion receives the largest proportion (38.5percent) and the highest per capita share (US$2.45) of global development assistance forhealth (McLaughlin, 2000). Donor assistancefor health care varies considerably from coun-try to country. In 1998, in 23 African countriesmore than 20 percent of public health expen-diture was financed by donors. In six countriesforeign aid provides more than 40 percent oftotal health expenditure (WHO, 2000).
For example, 84 percent of Chad’s publicexpenditure on health in 2000 was financed byexternal grants and loans, 12 percent by theGovernment’s own resources, and 4 percent bycommunities (Hahmed and Soucat, 2004). InMauritania in 1999, donors contributed 53percent to the overall health budget (Soucat,2004). In ESA, donors on average contributed27 percent of total health expenditures.
In some countries, even the recurrent budg-et is mainly covered by external money. Thiswas the case in Chad in 2000 where 81 percentof recurrent expenditures were funded by
Table 1: Informal Sector Employment as a Percentageof Employment
Informal sector employment Country (year) as % of employment
Uganda (1993) 84 Zambia (1993) 81 Ghana (1997) 79 Gambia (1993) 72 Mali (1996) 71 Tanzania (1995) 67 Kenya (1995) 58 Madagascar (1995) 58 Cote d’Ivoire (1996) 53 Benin (1992) 48 Mauritius (1992) 24 Botswana (1996) 19 South Africa (1995) 17
Source: ILO, 2002a
10 Resource Allocation and Purchasing in Africa
external sources and only 19 percent by theGovernment’s own funds (Hahmed and Sou-cat, 2004). In Guinea in 2001, external financ-ing paid for 32 percent of recurrent costs,which included 93 percent of vaccines, 91 per-cent of training, and 84 percent of vehiclesmaintenance paid by the outside (Schwabe etal., 2003). In Mozambique in 1997, 47% ofrecurrent costs were financed by donors, anddonors also covered 92% of drugs and medicalequipment (S. Chao and K. Kostermans,2002).
The World Bank and other multilateraldonors have supported health expenditureswith the Debt Initiative for Heavily IndebtedPoor Countries (HIPC). The HIPC initiativewas launched in 1996 with the goal of reduc-ing unsustainable levels of debt. As of July2003, 27 of the 38 countries that potentiallyqualify for assistance under HIPC had usedthis initiative which resulted in the freeing ofabout US$1.0 billion in annual debt-servicesavings. As a result of the HIPC debt relief,debt stocks for those 27 countries are expectedto decline by two-thirds in net present valueterms. Part of the debt relief initiative is apoverty reduction strategy, which includes pro-grams to improve health care services for poorpeople. In the 27 countries, poverty-reducingexpenditures, including those for health, haveincreased from about US$6.1 billion in 1999 toUS$8.4 billion in 2002, and are projected toincrease to US$11.9 billion in 2005 (IMF, Sept.12, 2003. HIPC Initative: Status of Implemen-tation).
The high dependency on donor funding in anumber of countries is a serious concern. Anycountry’s health system should aim at havingenough reliable funding within the country’sown resources to maintain basic health servicesfor a growing population (ESA NHA, 2000).
The paradigm of undisbursed aid
Despite the growing need for additionalresources, there is the problem of non-dis-
bursement of available funds. For example, inthe period from 1994 to 1999, the World Bankapproved 27 International Development Asso-ciation (IDA) loans in Africa with a total com-mitment of US$ 751 million. However, by June2000 only 53 percent had been actually dis-bursed. The undisbursed balance amounted toUS$ 353 million. (World Bank, 2002d) Otherdonors like the United Nations (UN), theAfrican Development Bank (AfDB) and bilat-eral donors experience slow disbursement aswell. In Malawi, between 1994 and 1998 only61 percent of the donors’ health allocation wasdisbursed (Picazo, 2002).
African countries experience implementa-tion constraints which limit the ability to uti-lize funds effectively. Among those, severeshortages of human resources represent amajor challenge to health systems in Africa.Another reason for slow disbursement is thecomplexity involved in coordinating differentdonors’ priorities with local health strategies.Administrating and coordinating donors con-sumes scarce local government administrativeresources. A recent study in Rwanda lists 27international donors contributing to the healthbudget, each donating amounts ranging fromUS$ 100,000 to US$ 4 million (Schneider et al.,2000). Another problem with donor assistanceis that it is often not tracked in a consistentmanner, and is often maintained “off budget”,which makes proper planning and manage-ment by the government more difficult.
Multiplicity of initiatives
An additional challenge facing SSA is the pres-sure placed on African health systems by thespread of the HIV/AIDS epidemic. It is esti-mated that in SSA alone, more than 55 millionpeople will die from AIDS within the nexttwenty years. In Botswana, life expectancy hasdropped below 40 years, a level not seen since1950 (Joint UN Program on HIV/AIDS, 2002).Therefore, several initiatives to increaseresources to fund programs that address the
Current Practices and Trends in Resource Generation 11
challenges of prevention, and care of the infect-ed and affected people have been undertakento react to this new threat in Africa. The mostprominent initiative is The Global Fund toFight AIDS, Malaria and Tuberculosis whichhas collected US$ 2.1 billion from industrial-ized countries prior to May 2002. The WorldBank also launched the Multi-Sectoral AIDSProgram (MAP) which up until May 2003 hadfunded 21 HIV/AIDS Projects with a net com-mitment of US$ 722 million. (World Bank,2002b) Other recent initiatives also aim toincrease funds for HIV/AIDS as well as forother health conditions. While a strong com-mitment from the international community forfunding programs to address, treat and preventHIV/AIDS and other health problems are need-ed, limited attention has been given to ensuringthat local governments have the adequatecapacity to effectively manage these new funds.Large funding allocations targeted specificallyfor specific diseases have the potential to skewpriorities if attention is not paid to the long-term strengthening of African health systems.
Some of the problems that plague govern-ments at the central level also find their way tolocal levels of government. This is the case inTanzania, where the health office in Dar EsSalaam, the country’s capital city, has to man-age 12 different financing sources (Dar EsSalaam City Medical Office of Health, 2003),thus stretching its management capacity.
Foreign aid and ownership
Another important constraint faced by coun-tries in the context of external developmentassistance is the need for ownership by localgovernments in order to ensure a program’ssuccess. Recent evidence suggests that externalaid does not help to improve health indicatorsif a government is not committed to the pro-grams. Even the conditionality of loans orgrants will have little effect on a country’shealth outcomes if the local government doesnot fully support the project(s) (Devarajan etal., 2001).
Most African governments have not yetassumed their stewardship function and arestill struggling with delivering services them-selves, rather than embarking on strategicreforms of the existing service delivery system.Africa could benefit from Latin America’s les-sons on health reform strategies, where it wasfound that a major factor in the success ofreforms was that a relatively stable and coher-ent “change team” was formed, supported bythe President and other major political actors,and included members drawn from the Min-istries of Planning and of Finance. This changeteam was isolated from the broader politicalprocess until it had developed a significant,technically defined package of reforms (HSPH,2000).
CHAPTER III
Current Practices and Trends in Resource Pooling
Establishing Social Health Insurance
hrough social health insuranceschemes, governments can providefinancial protection to households byaggregating contributions and pooling
risk. Social insurance agencies have the poten-tial to drive improvements in the performanceof the delivery system by active and strategicpurchasing. There are few examples of govern-ment-managed social insurance in SSA. Tanza-nia is in the early stages of implementation ofa program for civil servants, and Mozambiquehas begun withholding wage contributions fora future social insurance program (Conversa-tion with Daniel Kraushaar, 2002). Othercountries in SSA have considered introducingsocial health insurance for civil servants andemployees of formal sector companies (Ghana,Nigeria, Uganda, South Africa, Zimbabwe) butlittle progress has been made. Only Kenya hasa long history of experience with social insur-ance through its NHIF.
When evaluating the performance of theNHIF in Kenya and aiming to determinewhether this is a model that can be adapted toother countries in the region, it is important tolook at both the system’s successes, failures andproblems. The biggest strength of the system is
that a large portion of the population, in boththe formal and informal sectors, is receivingsome financial protection from high cost healthevents. The NHIF has increased revenue forboth private and public providers raising thetotal amount of resources available for health.This availability of funds seems to have alsostimulated the development of the private sec-tor which has enabled consumers to have choic-es (See Box 2 below). Weaknesses of the NHIFinclude its limited capacity that extends to mostaspects of insurance design, implementation,management and ongoing monitoring. More-over, poor design features, such as perverseincentives in the reimbursement system andweak monitoring of fraud and abuse, have ledto some unintended negative consequences.Individuals with the technical skills needed toeffectively run health insurance schemes are inshort supply in Africa. An additional factor thatmust be well thought out when consideringsocial insurance is the impact of the AIDS epi-demic which is a catastrophic risk that can ren-der broke nascent insurance schemes in popula-tions with high prevalence of the disease.
If other African countries plan to implementor expand similar schemes, they would have toanalyze the supply side of health services toadequately assess its impact on equity. Social
12
T
Current Practices and Trends in Resource Pooling 13
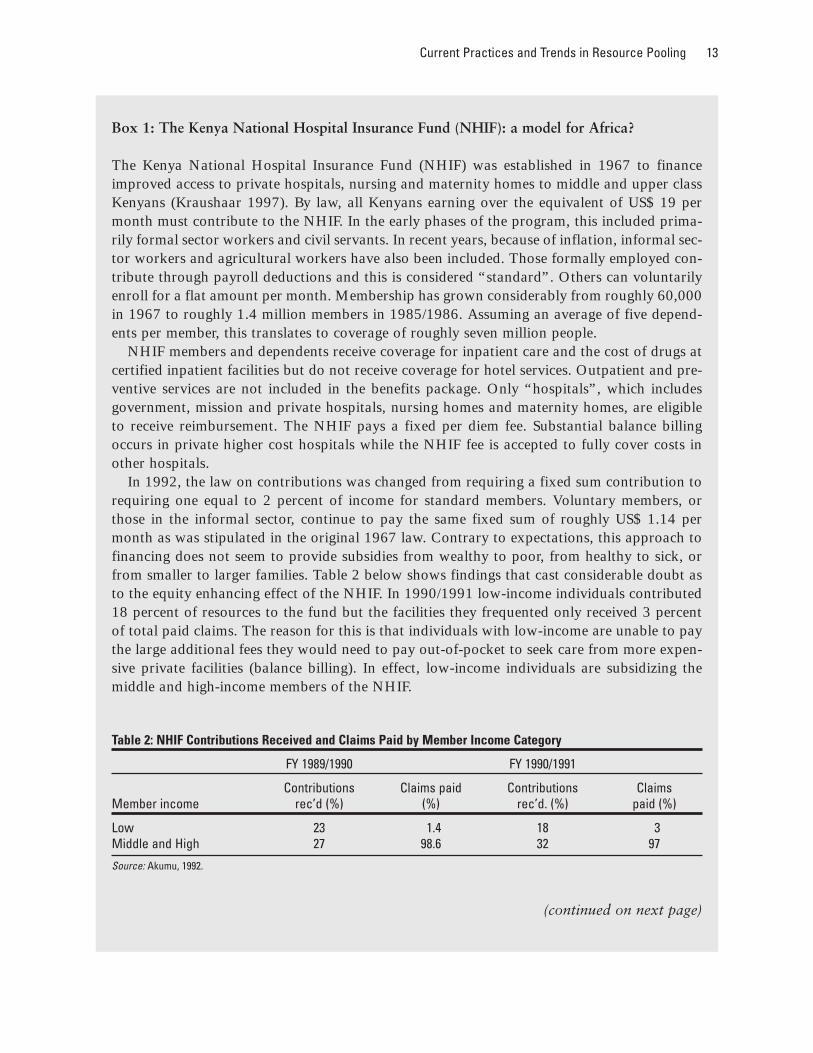
Box 1: The Kenya National Hospital Insurance Fund (NHIF): a model for Africa?
The Kenya National Hospital Insurance Fund (NHIF) was established in 1967 to financeimproved access to private hospitals, nursing and maternity homes to middle and upper classKenyans (Kraushaar 1997). By law, all Kenyans earning over the equivalent of US$ 19 permonth must contribute to the NHIF. In the early phases of the program, this included prima-rily formal sector workers and civil servants. In recent years, because of inflation, informal sec-tor workers and agricultural workers have also been included. Those formally employed con-tribute through payroll deductions and this is considered “standard”. Others can voluntarilyenroll for a flat amount per month. Membership has grown considerably from roughly 60,000in 1967 to roughly 1.4 million members in 1985/1986. Assuming an average of five depend-ents per member, this translates to coverage of roughly seven million people.
NHIF members and dependents receive coverage for inpatient care and the cost of drugs atcertified inpatient facilities but do not receive coverage for hotel services. Outpatient and pre-ventive services are not included in the benefits package. Only “hospitals”, which includesgovernment, mission and private hospitals, nursing homes and maternity homes, are eligibleto receive reimbursement. The NHIF pays a fixed per diem fee. Substantial balance billingoccurs in private higher cost hospitals while the NHIF fee is accepted to fully cover costs inother hospitals.
In 1992, the law on contributions was changed from requiring a fixed sum contribution torequiring one equal to 2 percent of income for standard members. Voluntary members, orthose in the informal sector, continue to pay the same fixed sum of roughly US$ 1.14 permonth as was stipulated in the original 1967 law. Contrary to expectations, this approach tofinancing does not seem to provide subsidies from wealthy to poor, from healthy to sick, orfrom smaller to larger families. Table 2 below shows findings that cast considerable doubt asto the equity enhancing effect of the NHIF. In 1990/1991 low-income individuals contributed18 percent of resources to the fund but the facilities they frequented only received 3 percentof total paid claims. The reason for this is that individuals with low-income are unable to paythe large additional fees they would need to pay out-of-pocket to seek care from more expen-sive private facilities (balance billing). In effect, low-income individuals are subsidizing themiddle and high-income members of the NHIF.
Table 2: NHIF Contributions Received and Claims Paid by Member Income Category
FY 1989/1990 FY 1990/1991
Contributions Claims paid Contributions Claims Member income rec’d (%) (%) rec’d. (%) paid (%)
Low 23 1.4 18 3Middle and High 27 98.6 32 97
Source: Akumu, 1992.
(continued on next page)
14 Resource Allocation and Purchasing in Africa
Box 1 (continued)
Assessment of both the strengths and considerable weaknesses of the NHIF system gener-ates lessons for RAP arrangements for the rest of the region. By providing insurance coveragefor hospitalization, NHIF provides a degree of financial protection for households. Increasingvoluntary enrollment of the informal sector indicates that households are willing to pay for thistype of risk coverage.
The NHIF, as a predominant purchaser of health services in Kenya, exerts significant influ-ence on both government and private provision of hospital services. Allowing multiple com-peting providers to receive reimbursement has stimulated an expansion in the number ofproviders who can service beneficiaries leading to increased access in Kenya’s urban areas. Thepurchasing power of the NHIF has the potential to be used strategically to influence appro-priate growth of the private sector.
A major weakness of the NHIF is that poorly developed compliance and monitoring systemshave enabled fraud and abuse by both providers and the covered population. In some cases,providers have been known to overcharge clients and members are known to share NHIF mem-bership cards with non-members. Weak capacity to manage these insurance systems is a con-siderable impediment to effective implementation and ongoing management of the NHIF. Theper diem reimbursement system provides incentives to providers to increase lengths of stay whilebasing reimbursement rates on facility characteristics such as the number of beds does notencourage quality care. The NHIF should take advantage of its considerable purchasing powerto drive improvements in efficiency and quality by implementing stronger systems to monitorfraud and abuse, to control utilization, and to reward quality of care.
Box 2: The link between health insurance and the existence of private for-profit providers
Evidence seems to indicate that health insurance encourages the development of privateproviders. For example, in Kenya the private sector has grown from a few private providers atindependence in 1963 to about 1,500 providers in 1993. Currently, the private sector accountsfor 50 percent of all hospitals and provides 36 percent of all hospital beds. Approximately 21percent of all health centres and 51 percent of all other outpatient treatment facilities are pri-vately owned. New facilities offering routine hospital services are mostly privately owned andfor-profit. This rapid development of private, for-profit hospitals is unique in SSA (Shaw &Griffin, 1995).
The most plausible explanation for these developments is the existence of national healthinsurance, supplemented by private insurance schemes. Kenya established an NHIF in 1967which covers more than 25 percent of the population. Contrary to volatile public subsidies,payments by public and private insurance schemes provide a stable source of income for pri-vate providers. Although this evidence is not conclusive it provides support for the argumentthat health insurance encourages the development of private providers.
Current Practices and Trends in Resource Pooling 15
health insurance provides financial incentivesto providers to serve insured individuals, whoare typically wealthier than uninsured individ-uals. If a government wants to mobilize moreresources through a social insurance schemeand the sector has an upward sloping supplycurve for medical services you would expect anincrease in the size of the health industry andimproved health access as a consequence ofsuch improved financial incentives forproviders. This was the case in Kenya and is apossible scenario for other African countries.
However, most African countries do nothave an elastic supply for medical services, atleast not in the short-run. A number of SSAcountries continuously suffer from chronicshortages of medical personnel. In 2000, aWorld Bank study reported that the shortage ofhuman resources is the single most importantproblem in African health care (McLaughlin,2000). Under these circumstances, the intro-duction of public insurance schemes wouldshift resources towards the insured rather thanincreasing overall access to the health system.In this case, the introduction or expansion ofsocial insurance would have a negative impacton equity, at least in the short-run.
Setting up Medical Aid Societies
As previously mentioned, medical aid societiesare generally private non-profit entities organ-ized to provide health insurance, or prepay-ment schemes, to a particular industry or pop-ulation (Quigley 1997). In Africa, medical aidsocieties primarily collect and pool resourcesand provide financial protection to formal sec-tor working populations. Usually they are gov-erned by a Board of Directors comprised ofmember firms and sometimes with representa-tives of the covered population. When mem-bership is employment based, members con-tribute through wage deductions that aresometimes supplemented by employer contri-butions. Some governments have chosen to
stimulate the development of medical aid soci-eties through tax incentives. This is the case inZimbabwe (see Box 3). They function as aform of social insurance in that premium con-tributions are income based or flat fees and notbased on the risk characteristics of individualsor households. Premium contributions frommembers of a given plan are pooled to providefinancial coverage for the benefits included inthe package. Medical aid societies also havethe potential to stimulate innovation in theinsurance market by encouraging competitionamong competing funds.
As implemented in Zimbabwe, medical aidsocieties have not explicitly targeted the poor.The concept of medical aid societies, however,is similar to some of the CBHI schemes that arebeing introduced for the informal sector inSSA. Lessons from the development of riskpooling schemes in the region include that it isimportant to implement sound systems tomonitor fraud and abuse and that welldesigned provider payment mechanisms canprovide powerful incentives to both improvequality and overall costs.
Promoting risk pooling schemes forthe informal sector
Poor people not only face financial barriers toaccess proper health care but they are also veryvulnerable to high cost health events whichmay force them into further poverty. Thisrequires solutions to protect such householdsagainst financial risk. In SSA the majority ofpublic systems have failed to provide financialprotection for the poor. The previous sectionsdescribed schemes that pool resources and pro-tect primarily formal sector households againstfinancial risk. This section will present threeprepayment schemes that pool resources andprovide some degree of financial protection forthe informal sector.
It should be noted that traditional solidarityschemes have existed for a long time in most
16 Resource Allocation and Purchasing in Africa
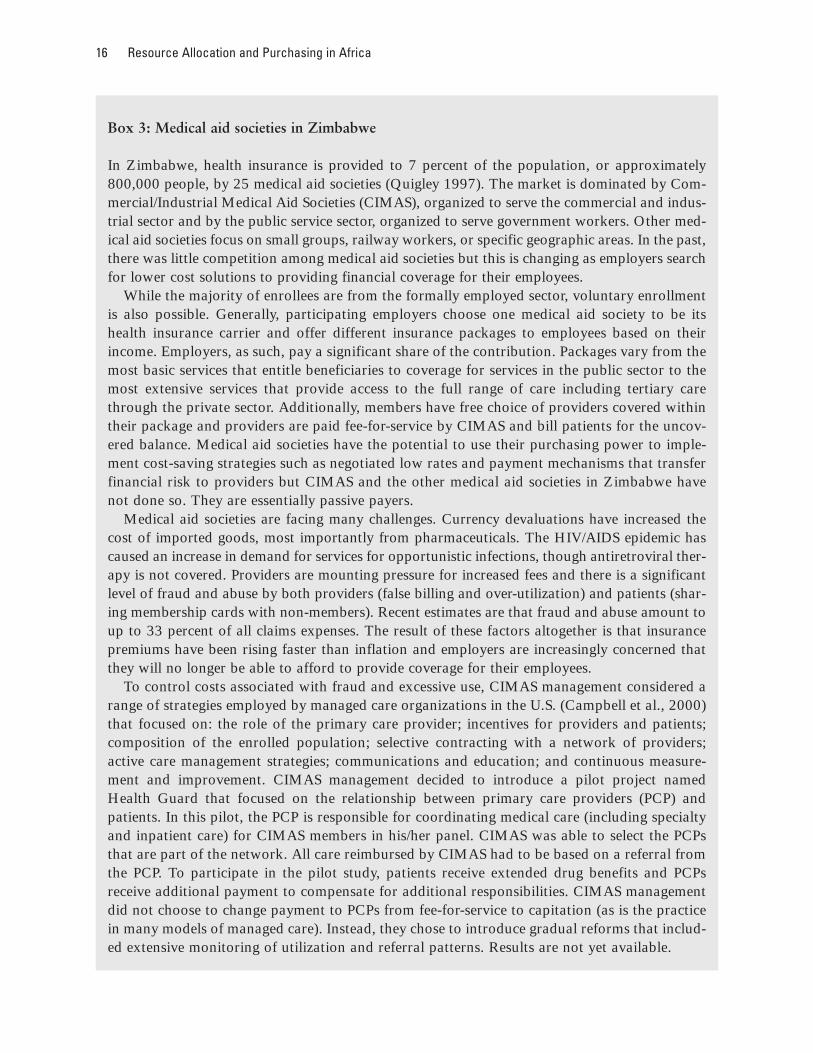
Box 3: Medical aid societies in Zimbabwe
In Zimbabwe, health insurance is provided to 7 percent of the population, or approximately800,000 people, by 25 medical aid societies (Quigley 1997). The market is dominated by Com-mercial/Industrial Medical Aid Societies (CIMAS), organized to serve the commercial and indus-trial sector and by the public service sector, organized to serve government workers. Other med-ical aid societies focus on small groups, railway workers, or specific geographic areas. In the past,there was little competition among medical aid societies but this is changing as employers searchfor lower cost solutions to providing financial coverage for their employees.
While the majority of enrollees are from the formally employed sector, voluntary enrollmentis also possible. Generally, participating employers choose one medical aid society to be itshealth insurance carrier and offer different insurance packages to employees based on theirincome. Employers, as such, pay a significant share of the contribution. Packages vary from themost basic services that entitle beneficiaries to coverage for services in the public sector to themost extensive services that provide access to the full range of care including tertiary carethrough the private sector. Additionally, members have free choice of providers covered withintheir package and providers are paid fee-for-service by CIMAS and bill patients for the uncov-ered balance. Medical aid societies have the potential to use their purchasing power to imple-ment cost-saving strategies such as negotiated low rates and payment mechanisms that transferfinancial risk to providers but CIMAS and the other medical aid societies in Zimbabwe havenot done so. They are essentially passive payers.
Medical aid societies are facing many challenges. Currency devaluations have increased thecost of imported goods, most importantly from pharmaceuticals. The HIV/AIDS epidemic hascaused an increase in demand for services for opportunistic infections, though antiretroviral ther-apy is not covered. Providers are mounting pressure for increased fees and there is a significantlevel of fraud and abuse by both providers (false billing and over-utilization) and patients (shar-ing membership cards with non-members). Recent estimates are that fraud and abuse amount toup to 33 percent of all claims expenses. The result of these factors altogether is that insurancepremiums have been rising faster than inflation and employers are increasingly concerned thatthey will no longer be able to afford to provide coverage for their employees.
To control costs associated with fraud and excessive use, CIMAS management considered arange of strategies employed by managed care organizations in the U.S. (Campbell et al., 2000)that focused on: the role of the primary care provider; incentives for providers and patients;composition of the enrolled population; selective contracting with a network of providers;active care management strategies; communications and education; and continuous measure-ment and improvement. CIMAS management decided to introduce a pilot project namedHealth Guard that focused on the relationship between primary care providers (PCP) andpatients. In this pilot, the PCP is responsible for coordinating medical care (including specialtyand inpatient care) for CIMAS members in his/her panel. CIMAS was able to select the PCPsthat are part of the network. All care reimbursed by CIMAS had to be based on a referral fromthe PCP. To participate in the pilot study, patients receive extended drug benefits and PCPsreceive additional payment to compensate for additional responsibilities. CIMAS managementdid not choose to change payment to PCPs from fee-for-service to capitation (as is the practicein many models of managed care). Instead, they chose to introduce gradual reforms that includ-ed extensive monitoring of utilization and referral patterns. Results are not yet available.
Current Practices and Trends in Resource Pooling 17
African countries. They are prepaymentschemes which are often used to help during acatastrophic event, such as burial.
In a government-stimulated communityhealth fund (CHF) model, the government,often with donor resources, provides matchingfunds to community-managed prepaymentschemes that offer access to a limited packageof ambulatory care services. This was the casein Tanzania. In the provider-initiated model,health providers offer prepayment schemes tohouseholds in the communities they serve thatprovide access to a wide range of services, asoccurred in Uganda. In the CBHI model,households prepay into a community-managedfund for coverage for a defined package ofservices delivered by a range of local providers.This model was utilized in Rwanda.
For most participants in such schemes it isthe first time that they had access to healthinsurance. Such risk-sharing agreements repre-sent a significant welfare gain for the insuredpopulation, since individuals who take out vol-untary insurance prefer to pay monthly premi-ums rather than being exposed to the risk of amajor health expenditure. It is, however,unclear whether these schemes improve overallhealth access for poor people. A survey of 258CBHIs in developing countries, including 131CBHIs in Africa, shows that little is knownabout the health impact of CBHIs. The studyconcludes that there is no evidence that CBHIspositively impact health status and financialprotection, particularly of poor people (ILO,2002).
However, another study, undertaken inrural Senegal arrives at a more favourable con-clusion. The study analyzes four CBHIs whichhave been operating between three to tenyears. Using household survey data, the studyshows that insured members have higher uti-lization rates than non-members. Furthermore,members report “less personal worries” as aresult of having health insurance. WithoutCBHIs they would have been forced to rely ontheir social network or money lenders in the
case of illness or disability. These results seemto indicate that CBHIs increase health access(higher utilization) and welfare (risk-sharing)for its members. However, the study also con-cludes that CBHIs fail to protect the poorest ofthe poor because they cannot afford the premi-ums. Furthermore, CBHIs typically suffer froma relatively small risk pool (500 to 2,000 mem-bers) and lack funds to cover catastrophic risk(Jutting, 2001).
The experience of CHFs in Tanzania (seeBox 4) contain lessons for the design andimplementation of similar schemes for theinformal sector in SSA. From household sur-veys in Kilosa, it appears that the population iswilling to prepay for participation in a pool forcoverage of a range of services if the servicesthey will have access to are perceived to be ofadequate quality (Kihombo, 2002). Suggestionsto improve the functioning of the CHF whichhave the potential of making similar approach-es more attractive to households include:expanding coverage to include higher cost serv-ices such as hospitalizations; allowing choice ofprovider, and introducing incentives to improveservice quality as perceived by patients.
It is obvious that CHFs include only thosepeople who can pay the premium, not thepoorest people. To reach the poorest, govern-ment subsidies would be necessary. In Tanza-nia, the Government’s matching grant programhelps reach those that can still pay, not thepoorest.
CHFs are also interesting in that they createa local collective power, and it has purchasingcapacity.
The design and implementation of providerbased prepayment schemes in Uganda (see Box5) provides lessons for the rest of SSA. Theseschemes provide coverage for both outpatientand inpatient services and provide financialprotection against catastrophic costs for thosehouseholds that can afford to and choose toenroll. The restriction that only groups canenroll controls adverse selection and co-pay-ments mitigate moral hazard. Schemes begin
18 Resource Allocation and Purchasing in Africa
with little knowledge of the expected utiliza-tion of their covered population making it dif-ficult to price premiums to cover actual costs inthe first years of implementation. There is aneed for better marketing of the advantages of
the prepayment schemes to the general popula-tion. In addition, it clearly shows that poorpeople are familiar with the way insuranceschemes operate, appreciate their value, andare willing to pay for financial protection
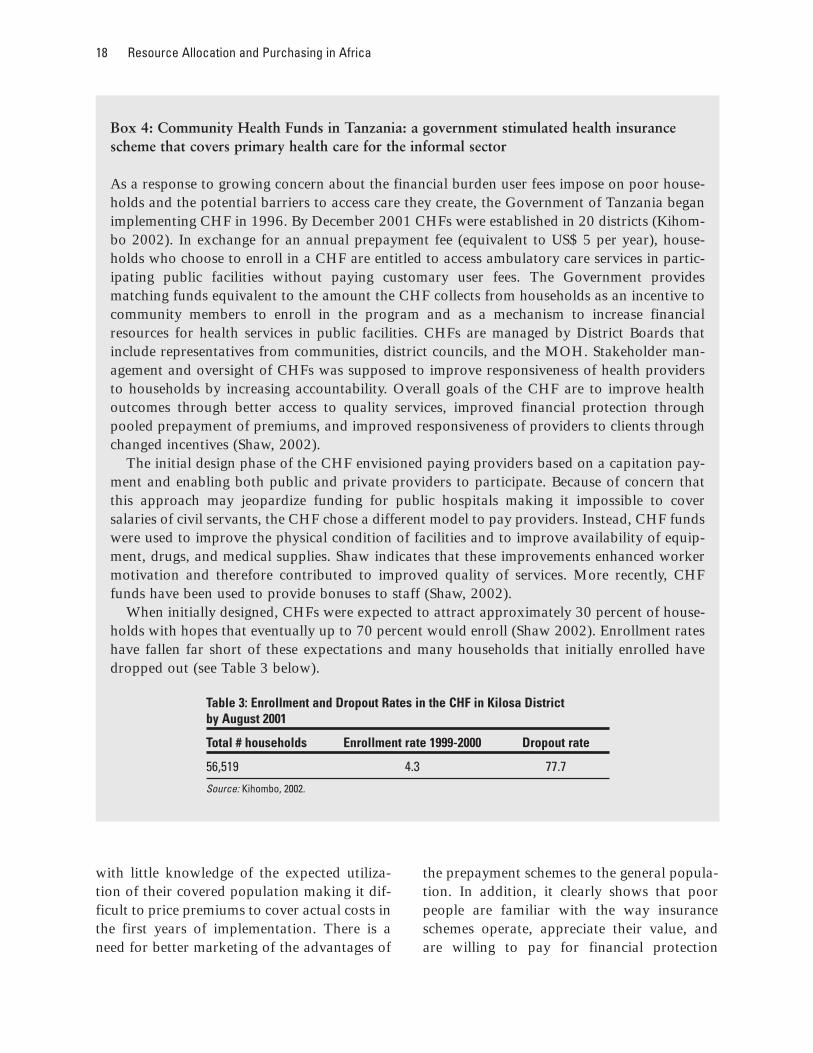
Box 4: Community Health Funds in Tanzania: a government stimulated health insurancescheme that covers primary health care for the informal sector
As a response to growing concern about the financial burden user fees impose on poor house-holds and the potential barriers to access care they create, the Government of Tanzania beganimplementing CHF in 1996. By December 2001 CHFs were established in 20 districts (Kihom-bo 2002). In exchange for an annual prepayment fee (equivalent to US$ 5 per year), house-holds who choose to enroll in a CHF are entitled to access ambulatory care services in partic-ipating public facilities without paying customary user fees. The Government providesmatching funds equivalent to the amount the CHF collects from households as an incentive tocommunity members to enroll in the program and as a mechanism to increase financialresources for health services in public facilities. CHFs are managed by District Boards thatinclude representatives from communities, district councils, and the MOH. Stakeholder man-agement and oversight of CHFs was supposed to improve responsiveness of health providersto households by increasing accountability. Overall goals of the CHF are to improve healthoutcomes through better access to quality services, improved financial protection throughpooled prepayment of premiums, and improved responsiveness of providers to clients throughchanged incentives (Shaw, 2002).
The initial design phase of the CHF envisioned paying providers based on a capitation pay-ment and enabling both public and private providers to participate. Because of concern thatthis approach may jeopardize funding for public hospitals making it impossible to coversalaries of civil servants, the CHF chose a different model to pay providers. Instead, CHF fundswere used to improve the physical condition of facilities and to improve availability of equip-ment, drugs, and medical supplies. Shaw indicates that these improvements enhanced workermotivation and therefore contributed to improved quality of services. More recently, CHFfunds have been used to provide bonuses to staff (Shaw, 2002).
When initially designed, CHFs were expected to attract approximately 30 percent of house-holds with hopes that eventually up to 70 percent would enroll (Shaw 2002). Enrollment rateshave fallen far short of these expectations and many households that initially enrolled havedropped out (see Table 3 below).
Table 3: Enrollment and Dropout Rates in the CHF in Kilosa District by August 2001
Total # households Enrollment rate 1999-2000 Dropout rate
56,519 4.3 77.7
Source: Kihombo, 2002.
Current Practices and Trends in Resource Pooling 19
against uncertain events if they can be assuredof access to good quality services.
The experience of CBHI schemes in Rwanda(see Box 6) indicates that low income individ-uals will prepay for services if they can beassured of quality services, can trust schememanagers with their contributions, and canafford the premiums and co-payments.
Expanding membership beyond the currentlevel remains a challenge.
The sustainability of community risk-pool-ing schemes needs to be tackled by govern-ments, especially in countries with high HIVprevalence. Re-insurance might need to beintroduced to ensure the sustainability ofthose schemes. Governments also need to
Box 4 (continued)
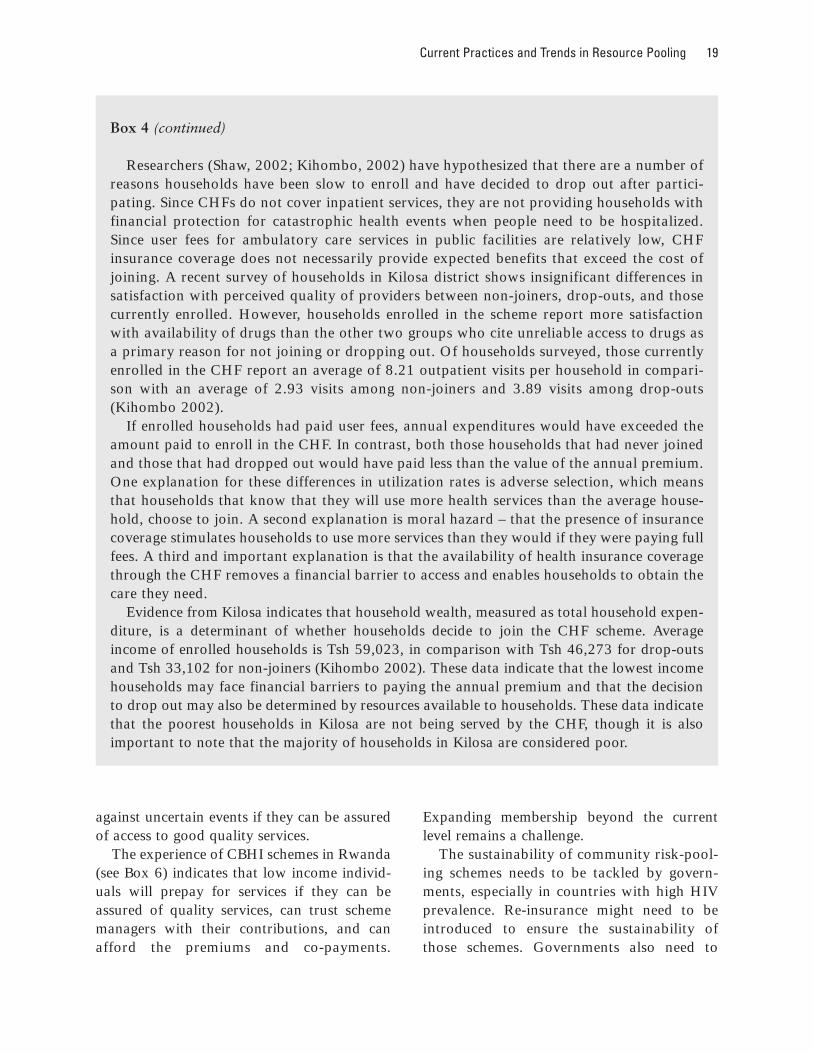
Researchers (Shaw, 2002; Kihombo, 2002) have hypothesized that there are a number ofreasons households have been slow to enroll and have decided to drop out after partici-pating. Since CHFs do not cover inpatient services, they are not providing households withfinancial protection for catastrophic health events when people need to be hospitalized.Since user fees for ambulatory care services in public facilities are relatively low, CHFinsurance coverage does not necessarily provide expected benefits that exceed the cost ofjoining. A recent survey of households in Kilosa district shows insignificant differences insatisfaction with perceived quality of providers between non-joiners, drop-outs, and thosecurrently enrolled. However, households enrolled in the scheme report more satisfactionwith availability of drugs than the other two groups who cite unreliable access to drugs asa primary reason for not joining or dropping out. Of households surveyed, those currentlyenrolled in the CHF report an average of 8.21 outpatient visits per household in compari-son with an average of 2.93 visits among non-joiners and 3.89 visits among drop-outs(Kihombo 2002).
If enrolled households had paid user fees, annual expenditures would have exceeded theamount paid to enroll in the CHF. In contrast, both those households that had never joinedand those that had dropped out would have paid less than the value of the annual premium.One explanation for these differences in utilization rates is adverse selection, which meansthat households that know that they will use more health services than the average house-hold, choose to join. A second explanation is moral hazard – that the presence of insurancecoverage stimulates households to use more services than they would if they were paying fullfees. A third and important explanation is that the availability of health insurance coveragethrough the CHF removes a financial barrier to access and enables households to obtain thecare they need.
Evidence from Kilosa indicates that household wealth, measured as total household expen-diture, is a determinant of whether households decide to join the CHF scheme. Averageincome of enrolled households is Tsh 59,023, in comparison with Tsh 46,273 for drop-outsand Tsh 33,102 for non-joiners (Kihombo 2002). These data indicate that the lowest incomehouseholds may face financial barriers to paying the annual premium and that the decisionto drop out may also be determined by resources available to households. These data indicatethat the poorest households in Kilosa are not being served by the CHF, though it is alsoimportant to note that the majority of households in Kilosa are considered poor.
20 Resource Allocation and Purchasing in Africa
consider providing targeted subsidies to thevery poor so they can benefit from theschemes.
Building on the Bamako Initiative: A pooling mechanism with localownership
As a result of the Bamako Initiative imple-mented in 1988, which promoted communityfinancing and management of recurrent costs,27 African countries had introduced a costrecovery scheme by the mid–1990s (Shaw andGriffin, 1995).
The Bamako Initiative’s main principles arethat (i) it is a financial contribution to a self-managed system which includes the communi-ty; (ii) the money is kept at the local level; and(iii) it is used to replenish the local drugsrevolving fund, and for local maintenance ofthe health infrastructure. The Bamako Initia-tive has been implemented differently in vari-ous countries, most countries applied it only asa cost-recovery scheme with the implementa-tion of user fees for health services and medi-cines, while other countries also stressed com-munity management of the money. Everycountry kept the money at the local level and
Box 5: Provider based prepayment schemes in Uganda offer access to ambulatory andinpatient care.
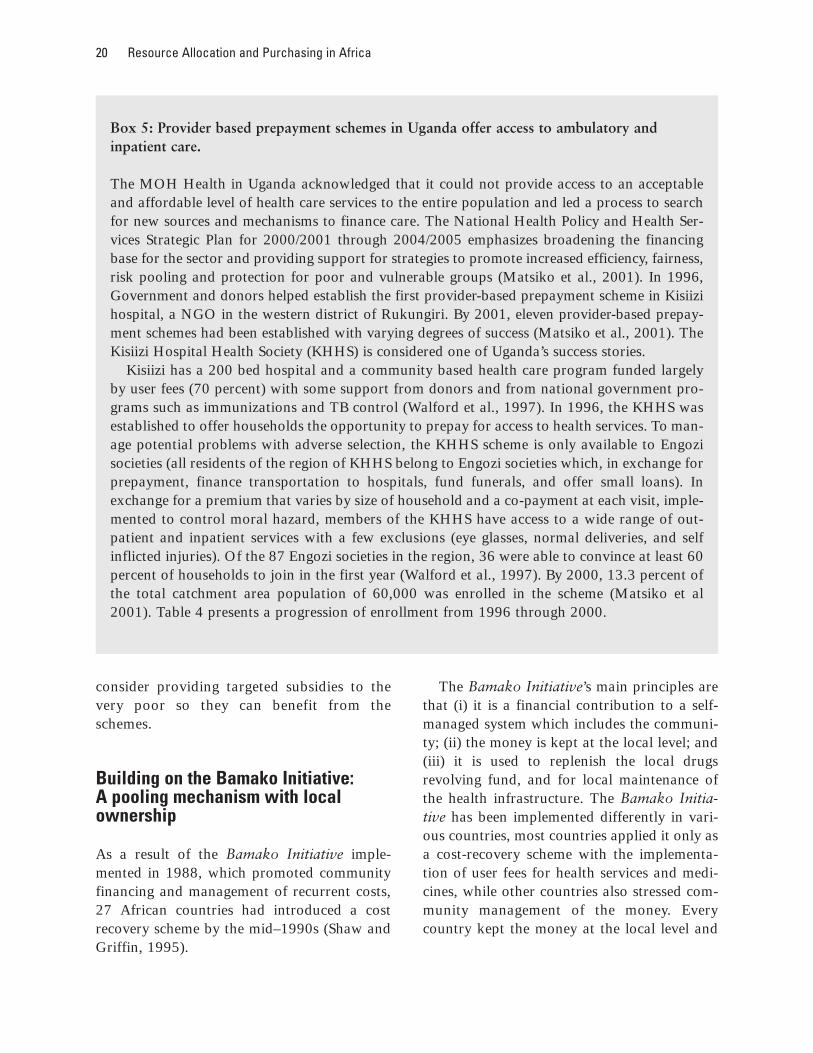
The MOH Health in Uganda acknowledged that it could not provide access to an acceptableand affordable level of health care services to the entire population and led a process to searchfor new sources and mechanisms to finance care. The National Health Policy and Health Ser-vices Strategic Plan for 2000/2001 through 2004/2005 emphasizes broadening the financingbase for the sector and providing support for strategies to promote increased efficiency, fairness,risk pooling and protection for poor and vulnerable groups (Matsiko et al., 2001). In 1996,Government and donors helped establish the first provider-based prepayment scheme in Kisiizihospital, a NGO in the western district of Rukungiri. By 2001, eleven provider-based prepay-ment schemes had been established with varying degrees of success (Matsiko et al., 2001). TheKisiizi Hospital Health Society (KHHS) is considered one of Uganda’s success stories.
Kisiizi has a 200 bed hospital and a community based health care program funded largelyby user fees (70 percent) with some support from donors and from national government pro-grams such as immunizations and TB control (Walford et al., 1997). In 1996, the KHHS wasestablished to offer households the opportunity to prepay for access to health services. To man-age potential problems with adverse selection, the KHHS scheme is only available to Engozisocieties (all residents of the region of KHHS belong to Engozi societies which, in exchange forprepayment, finance transportation to hospitals, fund funerals, and offer small loans). Inexchange for a premium that varies by size of household and a co-payment at each visit, imple-mented to control moral hazard, members of the KHHS have access to a wide range of out-patient and inpatient services with a few exclusions (eye glasses, normal deliveries, and selfinflicted injuries). Of the 87 Engozi societies in the region, 36 were able to convince at least 60percent of households to join in the first year (Walford et al., 1997). By 2000, 13.3 percent ofthe total catchment area population of 60,000 was enrolled in the scheme (Matsiko et al2001). Table 4 presents a progression of enrollment from 1996 through 2000.
Current Practices and Trends in Resource Pooling 21
benefited from the pooling of funds to buydrugs and equipment.
Implementation of the Bamako Initiative inBenin, Guinea and Mali for example, helpedthe MOHs focus on defining the primaryhealth care package, its costs and on improvingthe accessibility of primary care. Since the early1980s the Bamako Initiative helped cover morethan 20 million people in those three countries,under-five mortality declined significantly, evenamong the poorest, and immunization levelsincreased (World Bank, WDR 2004, pp.
76–77). Some of the problems were that localmanagement committees typically valuedinvestment over redistribution, and exemp-tions did not reach the poorest.
The community financing of key operationalcosts bought communities a seat at the table.Governments had to systematically negotiatenew activities with community organizations.However, all three countries need to establishmechanisms to subsidize and protect the poorbetter and this is a priority in those countries’reform process (WDR 2004).
Box 5 (continued)
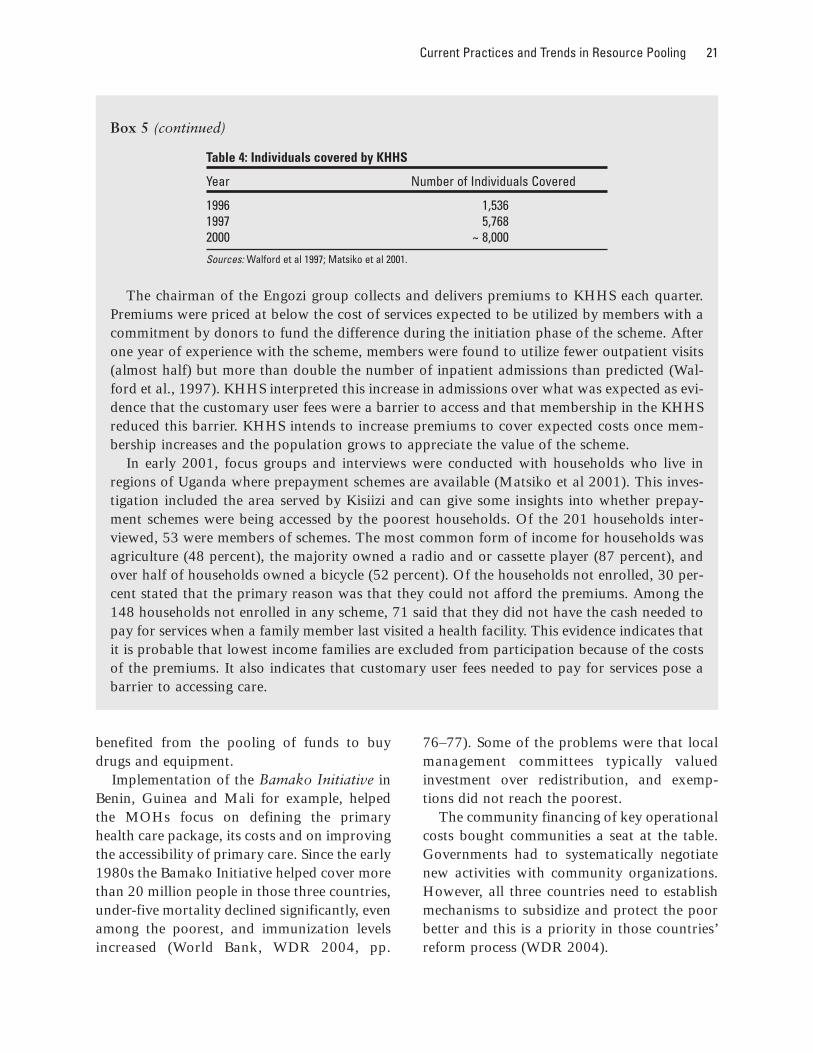
Table 4: Individuals covered by KHHS
Year Number of Individuals Covered
1996 1,5361997 5,7682000 ~ 8,000
Sources: Walford et al 1997; Matsiko et al 2001.
The chairman of the Engozi group collects and delivers premiums to KHHS each quarter.Premiums were priced at below the cost of services expected to be utilized by members with acommitment by donors to fund the difference during the initiation phase of the scheme. Afterone year of experience with the scheme, members were found to utilize fewer outpatient visits(almost half) but more than double the number of inpatient admissions than predicted (Wal-ford et al., 1997). KHHS interpreted this increase in admissions over what was expected as evi-dence that the customary user fees were a barrier to access and that membership in the KHHSreduced this barrier. KHHS intends to increase premiums to cover expected costs once mem-bership increases and the population grows to appreciate the value of the scheme.
In early 2001, focus groups and interviews were conducted with households who live inregions of Uganda where prepayment schemes are available (Matsiko et al 2001). This inves-tigation included the area served by Kisiizi and can give some insights into whether prepay-ment schemes were being accessed by the poorest households. Of the 201 households inter-viewed, 53 were members of schemes. The most common form of income for households wasagriculture (48 percent), the majority owned a radio and or cassette player (87 percent), andover half of households owned a bicycle (52 percent). Of the households not enrolled, 30 per-cent stated that the primary reason was that they could not afford the premiums. Among the148 households not enrolled in any scheme, 71 said that they did not have the cash needed topay for services when a family member last visited a health facility. This evidence indicates thatit is probable that lowest income families are excluded from participation because of the costsof the premiums. It also indicates that customary user fees needed to pay for services pose abarrier to accessing care.
22 Resource Allocation and Purchasing in Africa
Box 6: Community-Based Health Insurance (CBHI) Funds in Rwanda increase utilizationand reduce financial barriers to access health care
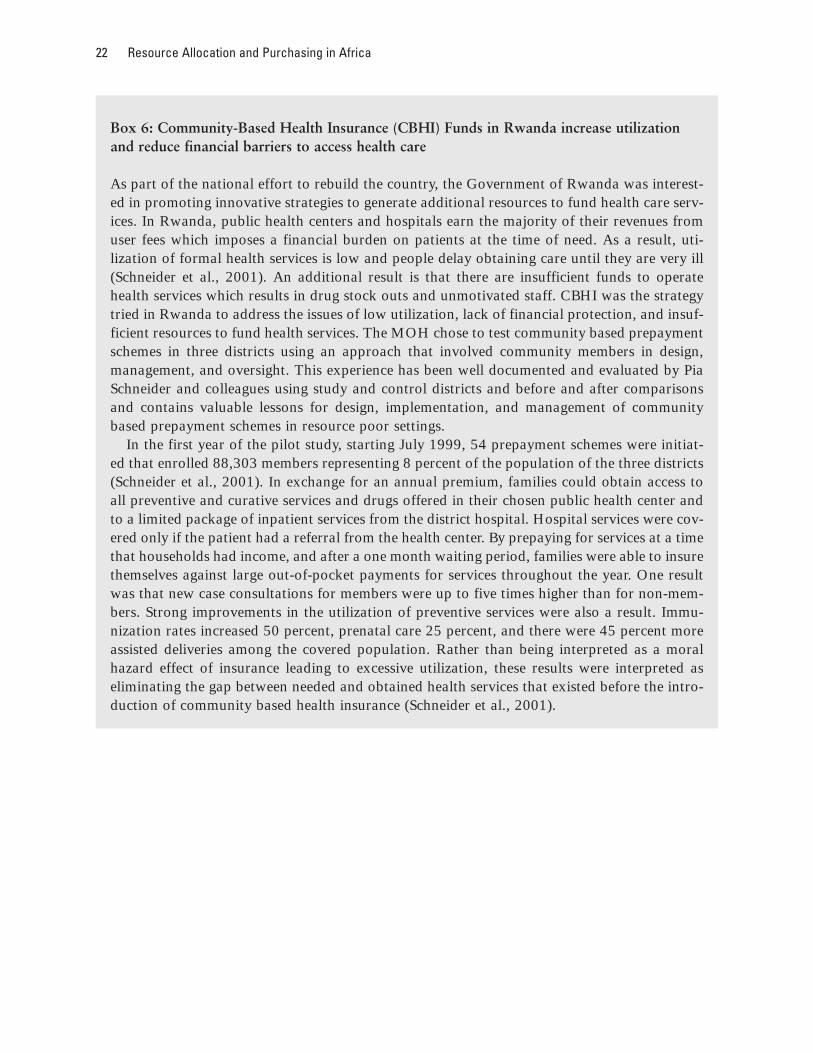
As part of the national effort to rebuild the country, the Government of Rwanda was interest-ed in promoting innovative strategies to generate additional resources to fund health care serv-ices. In Rwanda, public health centers and hospitals earn the majority of their revenues fromuser fees which imposes a financial burden on patients at the time of need. As a result, uti-lization of formal health services is low and people delay obtaining care until they are very ill(Schneider et al., 2001). An additional result is that there are insufficient funds to operatehealth services which results in drug stock outs and unmotivated staff. CBHI was the strategytried in Rwanda to address the issues of low utilization, lack of financial protection, and insuf-ficient resources to fund health services. The MOH chose to test community based prepaymentschemes in three districts using an approach that involved community members in design,management, and oversight. This experience has been well documented and evaluated by PiaSchneider and colleagues using study and control districts and before and after comparisonsand contains valuable lessons for design, implementation, and management of communitybased prepayment schemes in resource poor settings.
In the first year of the pilot study, starting July 1999, 54 prepayment schemes were initiat-ed that enrolled 88,303 members representing 8 percent of the population of the three districts(Schneider et al., 2001). In exchange for an annual premium, families could obtain access toall preventive and curative services and drugs offered in their chosen public health center andto a limited package of inpatient services from the district hospital. Hospital services were cov-ered only if the patient had a referral from the health center. By prepaying for services at a timethat households had income, and after a one month waiting period, families were able to insurethemselves against large out-of-pocket payments for services throughout the year. One resultwas that new case consultations for members were up to five times higher than for non-mem-bers. Strong improvements in the utilization of preventive services were also a result. Immu-nization rates increased 50 percent, prenatal care 25 percent, and there were 45 percent moreassisted deliveries among the covered population. Rather than being interpreted as a moralhazard effect of insurance leading to excessive utilization, these results were interpreted aseliminating the gap between needed and obtained health services that existed before the intro-duction of community based health insurance (Schneider et al., 2001).
Current Practices and Trends in Resource Pooling 23
Box 6 (continued)
With the introduction of CBHI, each of the 54 health centers in the three pilot districtsbecame a partner that offers one prepayment scheme. Families that enroll choose theirpreferred participating public health center. Each month, scheme managers retain 4 percent ofpremiums for administration; send 4 percent to the district hospital fund that pools risks forthe district and manages funds to cover hospital services for members; send 49 percent tohealth centers to cover capitation payments; and retain 43 percent in bank assets to coverfuture payments. Health centers receive a monthly capitation payment for each member whoenrolls with them. Hospitals are paid by the district federation per episode for cesareansections, malaria treatment and non-surgical pediatric cases and fee-for-services forconsultations and overnight stays. By the end of a year, 7 percent of premiums were spent onadministration, 7 percent on hospital services, and 86 percent on health center level care(Schneider et al., 2001).
As part of the evaluation of the impact of the pilots, the MOH wanted to understand whatpopulation groups chose to enroll in the community based insurance schemes and whethermembership improved financial access without increasing the overall burden of out-of-pocketspending. To answer these questions Pia Schneider and colleagues estimated three demandmodels using household data (Schneider and Diop, 2001a).
Results indicated that the probability of purchasing insurance was not determined by healthneed or economic factors but by the level of education of the head of the household, familysize, district of residence, distance to the health center, and radio ownership. The income quar-tile of families was not shown to be significant and cattle ownership, an indication of house-hold wealth, was also insignificant. The second model looked at the determinant of use of serv-ices and found that members used up to five times the number of curative and preventiveservices than non-members. The probability of a visit decreased with distance to the healthcenter and increased with severity of illness, but those with coverage sought care when lesssick. Results from the third model found that annual per capita contributions of member areup to five times greater than payments by non-members but payments at the time of serviceare significantly lower for members. This indicates that the presence of insurance changed careseeking behavior of members causing them to access care more frequently and sooner.
CHAPTER IV
Current Practices and Trends in Resource Allocation
Utilizing budget mechanisms to ensurebetter resource allocation
ost African countries use historicalbudgeting to distribute theirresources. Under this process, thecurrent year’s budget is based on
last year’s allocation, typically with minormodifications. Historical budgeting ensuresthat existing capacity is funded but it does notnecessarily ensure that the optimal mix of serv-ices is funded, that priority population groupsreceive services, or that funds are used effi-ciently and effectively. Moreover, historicalbudgeting provides no incentives for outputsor outcomes.
If health facilities are poorly distributed inthe first place, such a resource allocationarrangement will continue to lead to severeinequity. To improve allocation, some coun-tries have started to allocate funds on a needsbasis rather than on the basis of what wasneeded in the past. A needs-based approachrequires a country to develop a new resourceallocation formula, one that is typically basedon indicators such as population size, age andsex profile, and degrees of absolute and rela-tive poverty. For example, in 1994, Zambiaintroduced a population-based resource alloca-
tion formula to distribute funds. Two studiessuggest this change resulted in a more equi-table distribution of the government budget inall but two provinces. It also supported anincrease in the average share of primary careexpenditure from 39 to 54 percent by 1998.(Bossert et al., 2000; Gilson et al., 2000).
Efficiency improvements could result from amore rational approach to resource allocation.For example, in Malawi, budgetary allocationsto hospitals are based on cost-per-bed. Thiscreates a perverse incentive either to increasebeds or to inflate costs; it does not provideincentive for hospitals to be resource-efficient(Picazo, 2002).
Decentralization: an ongoing trend
A number of countries have begun to decen-tralize health services, although most achievedonly some form of deconcentration to date.This move towards decentralization stemsfrom the desire to increase local ownership,and to improve efficiency and equity of healthservices. Reform initiatives usually focus ongiving more political and administrative auton-omy to decentralized districts. They often alsoconsist of raising local revenue for health serv-
24
M
Current Practices and Trends in Resource Allocation 25
ices through cost recovery schemes, integratingother health service providers, and introducingneeds-based resource allocation (Bossert,2000).
To date, most governments have notachieved significant improvements in efficiencyand equity as a result of their move towardsdecentralization. For example, the Govern-ment of Uganda began in 1993 to undertakedecentralization by devolving responsibilitiesfor primary care from the central to the districtlevel, including the provision of basic healthservices and control over health personnel.District funding was provided by three mainsources: government grants (81 percent),donor assistance (12 percent), and local rev-enue (7 percent). Between unconditionalgrants, flexible donor funding, and local rev-enue districts are free to decide the allocationof between 25 and 60 percent of their totalhealth revenue, which represents a consider-able rise in local autonomy compared to theearlier system. However, studies suggest thatdistricts have allocated fewer funds to publicgoods type activities, in particular to primarycare, as they progress further into the decen-tralization process. On average, district spend-ing on primary health care fell from 33 to 16percent in the period from 1995 to 1998. (Akinet al, 2001) The utilization of maternal andchild health services has also fallen significant-ly since the introduction of decentralization(Mwesigye, 1999). A World Bank study warnsthat poorly carried out decentralization runsthe risk of recreating inefficient centralized sys-tems within each district (Habte et al., 1999).
Other countries also reported difficulties inimplementing decentralization. In Senegal,resources were allocated to local authorities,who were not accountable for health outcomes(Diop et al., 2001). In Chad, the Governmentgranted 60 percent of its federal budget to thedistricts. However, the allocation process wasnot an a needs-basis and the wealthier districtsreceived significantly higher shares of fundingthan the poorer provinces (Soucat, 2004). A
study on Zambia’s decentralization is slightlymore favorable. It concludes that Zambia’sdecentralization effort’s probably improvedoverall efficiency since the activity levels havebeen maintained in face of declining funding(Bossert et al, 2000). More recent analysis(Bossert et al, 2003) however concludes thatdecentralization may not have had either apositive nor negative impact on services. InRwanda less than 1% of public resources wentto finance preventive and primary health careservices in health centers in 1998, but in 2000,for the first time, almost one-third of the pub-lic health budget was decentralized and dis-bursed to the regional/prefecture level (Rwan-da Health Accounts, 2000). While theexperience of decentralization varies fromcountry to country in Africa, it seems that it ismore difficult to increase ownership andaccountability through decentralization thaninitially expected.
A public expenditure tracking surveyundertaken in Ghana in 2000 (Xiao Ye &Canagarajah, 2002) showed that only about20 percent of non-salary public health expen-diture reached the primary care sub-districtfacilities. A large proportion of the leakageoccurred between line ministries and districtoffices, where public expenditures are usuallyturned into materials from cash flows. Thestudy underscored the need to set up a consis-tent and transparent recording system all theway down to the service provision facilities.The following table (Table 5) shows the dis-connect between the measurement of theresource flows at the central government andat the facility level. At the central level, theGovernment is committed to provide moreresources to basic health care, however, clin-ics receive a large proportion, if not all, ofpublic non-salary expenditures in kind, andthus don’t have much control over it. More-over, salaries are distributed directly toemployees by a central government agency.Consequently, at the facility level, there is lit-tle knowledge about what public resources
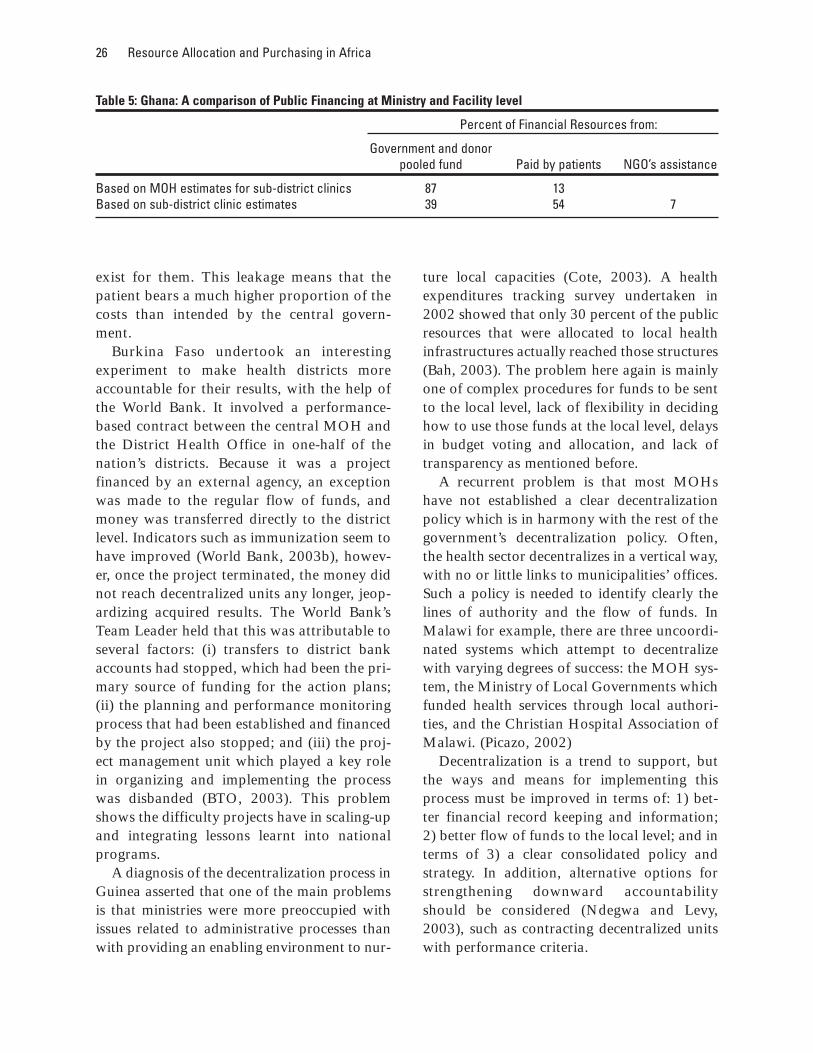
26 Resource Allocation and Purchasing in Africa
exist for them. This leakage means that thepatient bears a much higher proportion of thecosts than intended by the central govern-ment.
Burkina Faso undertook an interestingexperiment to make health districts moreaccountable for their results, with the help ofthe World Bank. It involved a performance-based contract between the central MOH andthe District Health Office in one-half of thenation’s districts. Because it was a projectfinanced by an external agency, an exceptionwas made to the regular flow of funds, andmoney was transferred directly to the districtlevel. Indicators such as immunization seem tohave improved (World Bank, 2003b), howev-er, once the project terminated, the money didnot reach decentralized units any longer, jeop-ardizing acquired results. The World Bank’sTeam Leader held that this was attributable toseveral factors: (i) transfers to district bankaccounts had stopped, which had been the pri-mary source of funding for the action plans;(ii) the planning and performance monitoringprocess that had been established and financedby the project also stopped; and (iii) the proj-ect management unit which played a key rolein organizing and implementing the processwas disbanded (BTO, 2003). This problemshows the difficulty projects have in scaling-upand integrating lessons learnt into nationalprograms.
A diagnosis of the decentralization process inGuinea asserted that one of the main problemsis that ministries were more preoccupied withissues related to administrative processes thanwith providing an enabling environment to nur-
ture local capacities (Cote, 2003). A healthexpenditures tracking survey undertaken in2002 showed that only 30 percent of the publicresources that were allocated to local healthinfrastructures actually reached those structures(Bah, 2003). The problem here again is mainlyone of complex procedures for funds to be sentto the local level, lack of flexibility in decidinghow to use those funds at the local level, delaysin budget voting and allocation, and lack oftransparency as mentioned before.
A recurrent problem is that most MOHshave not established a clear decentralizationpolicy which is in harmony with the rest of thegovernment’s decentralization policy. Often,the health sector decentralizes in a vertical way,with no or little links to municipalities’ offices.Such a policy is needed to identify clearly thelines of authority and the flow of funds. InMalawi for example, there are three uncoordi-nated systems which attempt to decentralizewith varying degrees of success: the MOH sys-tem, the Ministry of Local Governments whichfunded health services through local authori-ties, and the Christian Hospital Association ofMalawi. (Picazo, 2002)
Decentralization is a trend to support, butthe ways and means for implementing thisprocess must be improved in terms of: 1) bet-ter financial record keeping and information;2) better flow of funds to the local level; and interms of 3) a clear consolidated policy andstrategy. In addition, alternative options forstrengthening downward accountabilityshould be considered (Ndegwa and Levy,2003), such as contracting decentralized unitswith performance criteria.
Table 5: Ghana: A comparison of Public Financing at Ministry and Facility level
Percent of Financial Resources from:
Government and donor pooled fund Paid by patients NGO’s assistance
Based on MOH estimates for sub-district clinics 87 13 Based on sub-district clinic estimates 39 54 7
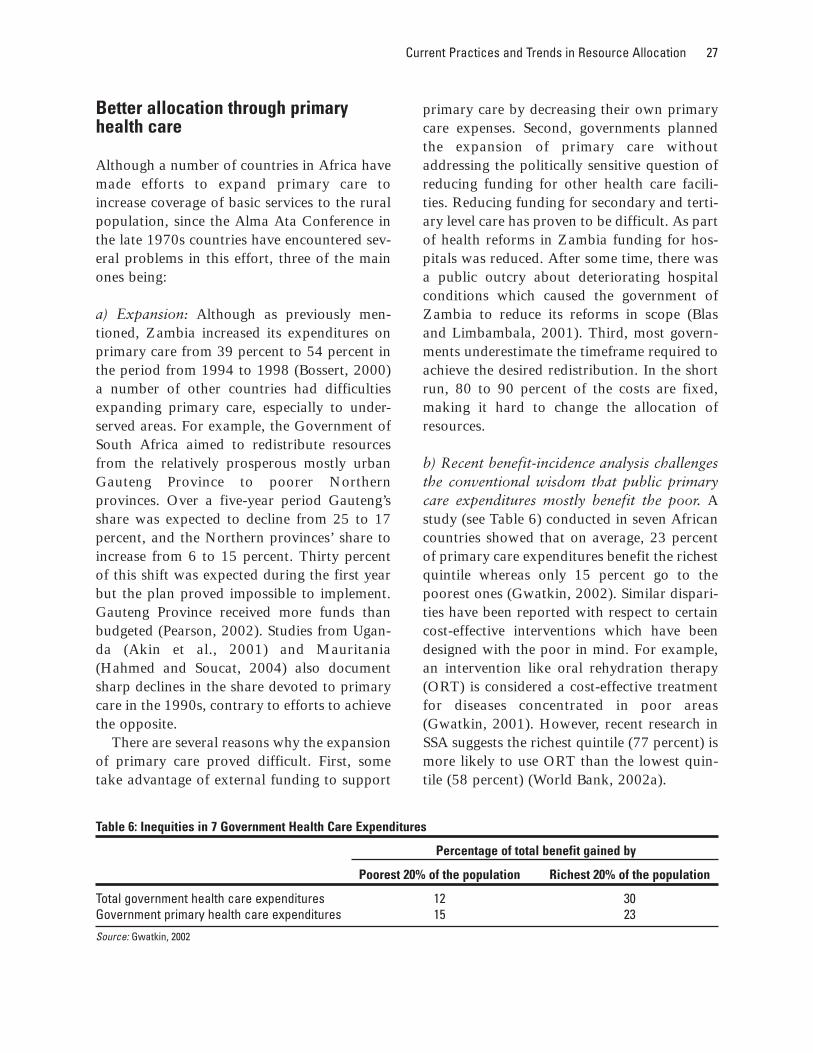
Current Practices and Trends in Resource Allocation 27
Better allocation through primaryhealth care
Although a number of countries in Africa havemade efforts to expand primary care toincrease coverage of basic services to the ruralpopulation, since the Alma Ata Conference inthe late 1970s countries have encountered sev-eral problems in this effort, three of the mainones being:
a) Expansion: Although as previously men-tioned, Zambia increased its expenditures onprimary care from 39 percent to 54 percent inthe period from 1994 to 1998 (Bossert, 2000)a number of other countries had difficultiesexpanding primary care, especially to under-served areas. For example, the Government ofSouth Africa aimed to redistribute resourcesfrom the relatively prosperous mostly urbanGauteng Province to poorer Northernprovinces. Over a five-year period Gauteng’sshare was expected to decline from 25 to 17percent, and the Northern provinces’ share toincrease from 6 to 15 percent. Thirty percentof this shift was expected during the first yearbut the plan proved impossible to implement.Gauteng Province received more funds thanbudgeted (Pearson, 2002). Studies from Ugan-da (Akin et al., 2001) and Mauritania(Hahmed and Soucat, 2004) also documentsharp declines in the share devoted to primarycare in the 1990s, contrary to efforts to achievethe opposite.
There are several reasons why the expansionof primary care proved difficult. First, sometake advantage of external funding to support
primary care by decreasing their own primarycare expenses. Second, governments plannedthe expansion of primary care withoutaddressing the politically sensitive question ofreducing funding for other health care facili-ties. Reducing funding for secondary and terti-ary level care has proven to be difficult. As partof health reforms in Zambia funding for hos-pitals was reduced. After some time, there wasa public outcry about deteriorating hospitalconditions which caused the government ofZambia to reduce its reforms in scope (Blasand Limbambala, 2001). Third, most govern-ments underestimate the timeframe required toachieve the desired redistribution. In the shortrun, 80 to 90 percent of the costs are fixed,making it hard to change the allocation ofresources.
b) Recent benefit-incidence analysis challengesthe conventional wisdom that public primarycare expenditures mostly benefit the poor. Astudy (see Table 6) conducted in seven Africancountries showed that on average, 23 percentof primary care expenditures benefit the richestquintile whereas only 15 percent go to thepoorest ones (Gwatkin, 2002). Similar dispari-ties have been reported with respect to certaincost-effective interventions which have beendesigned with the poor in mind. For example,an intervention like oral rehydration therapy(ORT) is considered a cost-effective treatmentfor diseases concentrated in poor areas(Gwatkin, 2001). However, recent research inSSA suggests the richest quintile (77 percent) ismore likely to use ORT than the lowest quin-tile (58 percent) (World Bank, 2002a).
Table 6: Inequities in 7 Government Health Care Expenditures
Percentage of total benefit gained by
Poorest 20% of the population Richest 20% of the population
Total government health care expenditures 12 30 Government primary health care expenditures 15 23
Source: Gwatkin, 2002
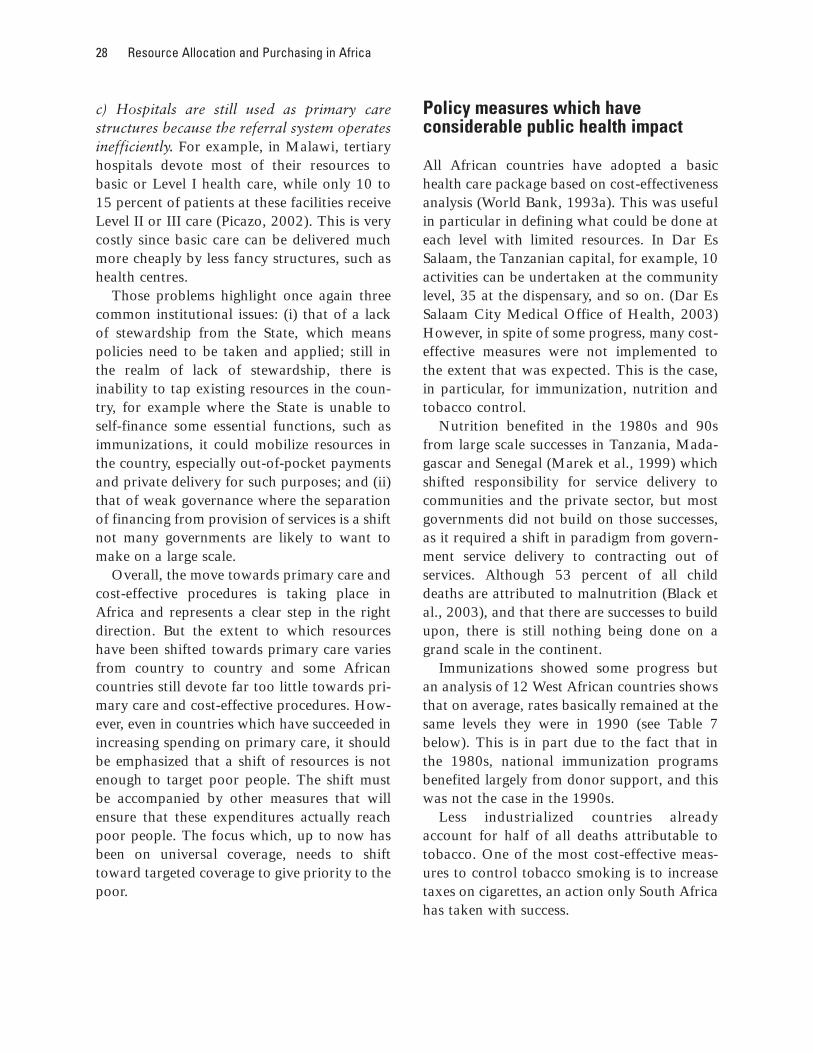
28 Resource Allocation and Purchasing in Africa
c) Hospitals are still used as primary carestructures because the referral system operatesinefficiently. For example, in Malawi, tertiaryhospitals devote most of their resources tobasic or Level I health care, while only 10 to15 percent of patients at these facilities receiveLevel II or III care (Picazo, 2002). This is verycostly since basic care can be delivered muchmore cheaply by less fancy structures, such ashealth centres.
Those problems highlight once again threecommon institutional issues: (i) that of a lackof stewardship from the State, which meanspolicies need to be taken and applied; still inthe realm of lack of stewardship, there isinability to tap existing resources in the coun-try, for example where the State is unable toself-finance some essential functions, such asimmunizations, it could mobilize resources inthe country, especially out-of-pocket paymentsand private delivery for such purposes; and (ii)that of weak governance where the separationof financing from provision of services is a shiftnot many governments are likely to want tomake on a large scale.
Overall, the move towards primary care andcost-effective procedures is taking place inAfrica and represents a clear step in the rightdirection. But the extent to which resourceshave been shifted towards primary care variesfrom country to country and some Africancountries still devote far too little towards pri-mary care and cost-effective procedures. How-ever, even in countries which have succeeded inincreasing spending on primary care, it shouldbe emphasized that a shift of resources is notenough to target poor people. The shift mustbe accompanied by other measures that willensure that these expenditures actually reachpoor people. The focus which, up to now hasbeen on universal coverage, needs to shifttoward targeted coverage to give priority to thepoor.
Policy measures which haveconsiderable public health impact
All African countries have adopted a basichealth care package based on cost-effectivenessanalysis (World Bank, 1993a). This was usefulin particular in defining what could be done ateach level with limited resources. In Dar EsSalaam, the Tanzanian capital, for example, 10activities can be undertaken at the communitylevel, 35 at the dispensary, and so on. (Dar EsSalaam City Medical Office of Health, 2003)However, in spite of some progress, many cost-effective measures were not implemented tothe extent that was expected. This is the case,in particular, for immunization, nutrition andtobacco control.
Nutrition benefited in the 1980s and 90sfrom large scale successes in Tanzania, Mada-gascar and Senegal (Marek et al., 1999) whichshifted responsibility for service delivery tocommunities and the private sector, but mostgovernments did not build on those successes,as it required a shift in paradigm from govern-ment service delivery to contracting out ofservices. Although 53 percent of all childdeaths are attributed to malnutrition (Black etal., 2003), and that there are successes to buildupon, there is still nothing being done on agrand scale in the continent.
Immunizations showed some progress butan analysis of 12 West African countries showsthat on average, rates basically remained at thesame levels they were in 1990 (see Table 7below). This is in part due to the fact that inthe 1980s, national immunization programsbenefited largely from donor support, and thiswas not the case in the 1990s.
Less industrialized countries alreadyaccount for half of all deaths attributable totobacco. One of the most cost-effective meas-ures to control tobacco smoking is to increasetaxes on cigarettes, an action only South Africahas taken with success.
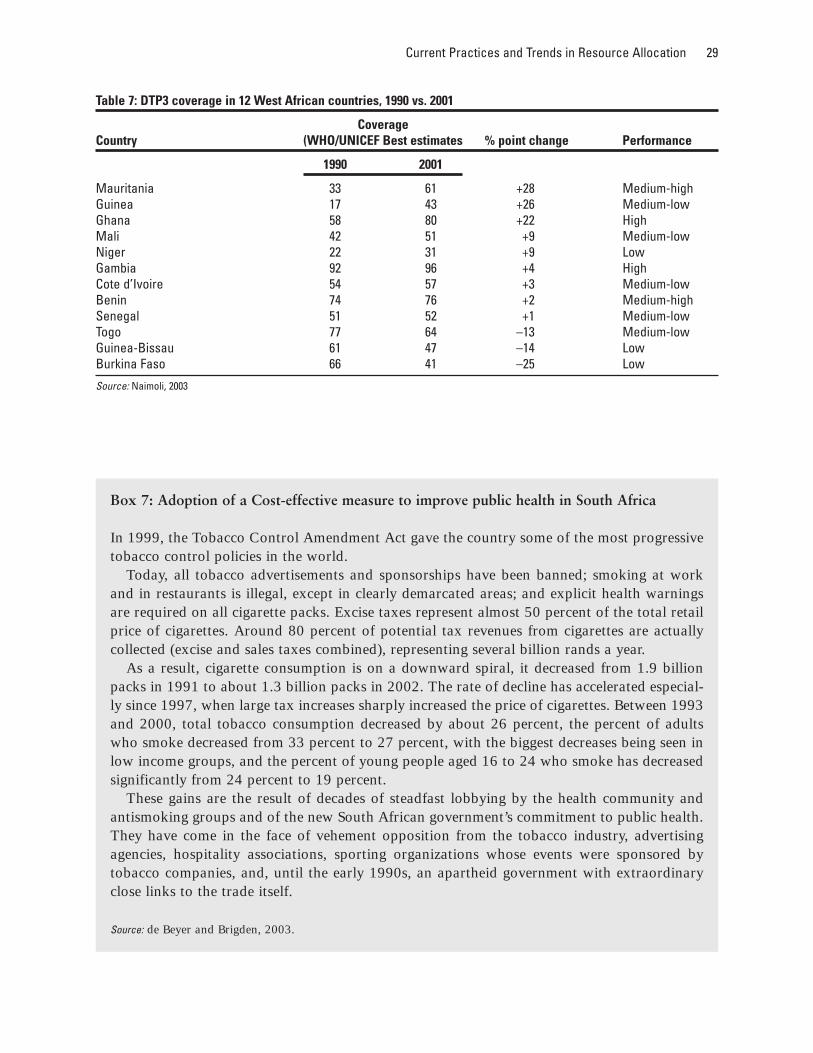
Current Practices and Trends in Resource Allocation 29
Table 7: DTP3 coverage in 12 West African countries, 1990 vs. 2001
Coverage Country (WHO/UNICEF Best estimates % point change Performance
1990 2001
Mauritania 33 61 +28 Medium-high Guinea 17 43 +26 Medium-low Ghana 58 80 +22 High Mali 42 51 +9 Medium-low Niger 22 31 +9 Low Gambia 92 96 +4 High Cote d’Ivoire 54 57 +3 Medium-low Benin 74 76 +2 Medium-high Senegal 51 52 +1 Medium-low Togo 77 64 –13 Medium-low Guinea-Bissau 61 47 –14 Low Burkina Faso 66 41 –25 Low
Source: Naimoli, 2003
Box 7: Adoption of a Cost-effective measure to improve public health in South Africa
In 1999, the Tobacco Control Amendment Act gave the country some of the most progressivetobacco control policies in the world.
Today, all tobacco advertisements and sponsorships have been banned; smoking at workand in restaurants is illegal, except in clearly demarcated areas; and explicit health warningsare required on all cigarette packs. Excise taxes represent almost 50 percent of the total retailprice of cigarettes. Around 80 percent of potential tax revenues from cigarettes are actuallycollected (excise and sales taxes combined), representing several billion rands a year.
As a result, cigarette consumption is on a downward spiral, it decreased from 1.9 billionpacks in 1991 to about 1.3 billion packs in 2002. The rate of decline has accelerated especial-ly since 1997, when large tax increases sharply increased the price of cigarettes. Between 1993and 2000, total tobacco consumption decreased by about 26 percent, the percent of adultswho smoke decreased from 33 percent to 27 percent, with the biggest decreases being seen inlow income groups, and the percent of young people aged 16 to 24 who smoke has decreasedsignificantly from 24 percent to 19 percent.
These gains are the result of decades of steadfast lobbying by the health community andantismoking groups and of the new South African government’s commitment to public health.They have come in the face of vehement opposition from the tobacco industry, advertisingagencies, hospitality associations, sporting organizations whose events were sponsored bytobacco companies, and, until the early 1990s, an apartheid government with extraordinaryclose links to the trade itself.
Source: de Beyer and Brigden, 2003.
30 Resource Allocation and Purchasing in Africa
Governments are thus missing opportunitiesto build on existing best practices and scale up,to harness existing resources to expand, and toimplement policies which have great impact onpublic health. To do so, Governments wouldneed to focus on their stewardship role to setand ensure that policies are implemented, tomonitor progress, to set standards and ensurethey are applied, to partner with serviceproviders from the private sector, among othertasks.
Technicians overlook the importanceof local politicians in allocatingresources
Most African governments have expressedtheir intention to focus scarce resources onproviding health services to poor people. Inpractice, however, as mentioned before, fundsare frequently spent disproportionately onfacilities and services which primarily servewealthier populations (Gwatkin, 2000). Tounderstand this imbalance it is important toemphasize that decisions pertaining to resourceallocation are made within a wider politicalcontext. Funding for health usually competeswith other tax-funded government activities.Vocal interest groups, typically urban popula-tions, and other vested interests influence allo-cation decisions (Pearson, 2002).
The difficulties in achieving commitment tolarge-scale health reform are analyzed in arecent study on the dynamics of policy changein South Africa and Zambia during the 1990s.In both countries, political transition brought agovernment to power which demanded speedyand visible health policy changes and createdwindows of opportunity for change. The studyshows that reforms were heavily shaped by afew key actors, in particular the Minister ofHealth. Technical experts and analysts general-ly had less influence than politicians on thedesign of the health reform and its implemen-tation. The study recommends that in order to
achieve their objectives, technicians and ana-lysts have to pay more attention to “the art ofpolitics”. Analytical techniques like stakehold-er analysis or policy characteristics analysiscan be used to gain a better understanding ofthe actors’ positions. Generally, the study sug-gests to balance strong political analysis withrigorous technical analysis (Gilson et al.,2000).
Some Trends to Better use external aidfor resource allocation
The usefulness of conditionalitiesversus political commitment
In order to ensure that health funding reachespoor people, external donors typically attachconditions to grants and loans. Recentresearch, however, suggests that conditionalityhas very little effect if the government is notfully committed. For example, the DemocraticRepublic of Congo received significant exter-nal aid, including six structural adjustmentloans by the World Bank between 1965 and1996 (Easterly, 2001). However, the lack of acoherent macroeconomic framework andendemic corruption under the Mobutu Gov-ernment led to a three decade-long decline. In1996, GDP per capita was estimated at US$150, less than 40 percent of its 1958 level. For-eign aid probably has reduced the urgency forreform rather than promoted better economicpolicies (Devarajan et al., 2001). Thus, com-mitment by the government to reform is anessential component of any successful interven-tion.
Sector Wide Approaches Programs(SWAPs): A Trend to Watch
In order to deal with the challenge of owner-ship and coordination, some African countrieshave agreed on a SWAP to managing healthfunds. SWAPs focus attention on the perform-
Current Practices and Trends in Resource Allocation 31
ance of the entire health sector in contrast toperformance of individual projects. The ulti-mate vision of SWAPs is to provide budgetarysupport, i.e. all sources of public financingwould be disbursed against a comprehensivebudget of the MOH in the respective country.In practice, many donors still provide ear-marked funding to support specific compo-nents of the budget that are articulated as partof a national health strategy. This approachhas required changes in standards andapproaches by both donors and clients.Donors are assured a voice in the process ofdeveloping a national health strategy andcountries are required to develop soundnational health policies and secure their imple-mentation (McLaughlin, 2000). The shortageof resources for the health sector has oftenfrustrated the intentions of donor earmarkedfinancing as Government resources will some-times be reallocated away from the externallyfinanced categories by the Government. Thispartly explains the preference for SWAPs inSSA by donors (McLaughlin, 2004).
Many countries, however, do not have anational health policy in place and their budg-ets often do not reflect stated priorities. Thus,a one-step transition to the new approach isnot feasible as many donors are reluctant tochannel their funds through existing systems.SWAPs, however, provide direction for futuredevelopment work which both sides can agreeupon and gradually establish over time. Todate, there has not yet been evaluation of afully implemented SWAP. Experience inGhana, however, shows increased governmenthealth spending in line with agreements nego-tiated with external partners, which might like-ly have a positive impact on health outcomes.
SWAPs provide a framework as to how towork towards a broad-based consensus. Bud-geting via a SWAP helps to make conflictinginterests transparent and encourages a dia-logue between donors and government. How-ever, SWAPs only provide a framework; theirsuccess depends on the genuine commitment of
governments towards pro-poor policy (Peters1998). If the parties cannot establish such acommitment, any externally proposed pro-poor initiative has a high likelihood of failure.
Marginal Budgeting for Bottleneck(MBB)
Despite extensive Sector Reforms, the healthsystems in many SSA countries still fail toreach large numbers of women and children—especially the poorest and most vulnerable—with these interventions. It is increasingly clearthat the strategies adopted previously in thehealth sector have to be different.
This situation triggers a growing demand fortools that help answer three questions:
■ What are the major health systems bottle-necks hampering the delivery of healthservices, and what is the potential fortheir improvement?
■ How much money is needed for theexpected results?
■ How much can be achieved in health out-comes by removing the bottlenecks?
The MBB tool recently developed byUNICEF, the World Bank and WHO, and test-ed in several countries is a response to thisdemand.
The mainstay of MBB is to identify coun-try/province specific “implementation con-straints” of health system and estimate the“marginal costs” to overcome them. MBB usesexisting information available for selected trac-er interventions to identify the “bottlenecks,”— the weakest links in the chain of conditionsand debate various options to address them.The tool also allows to assess the likely impactof alternate options on health outcomes basedon available evidence. The MBB approach thushelps in improving allocative efficiency of gov-ernment health budgets. This makes MBB dif-
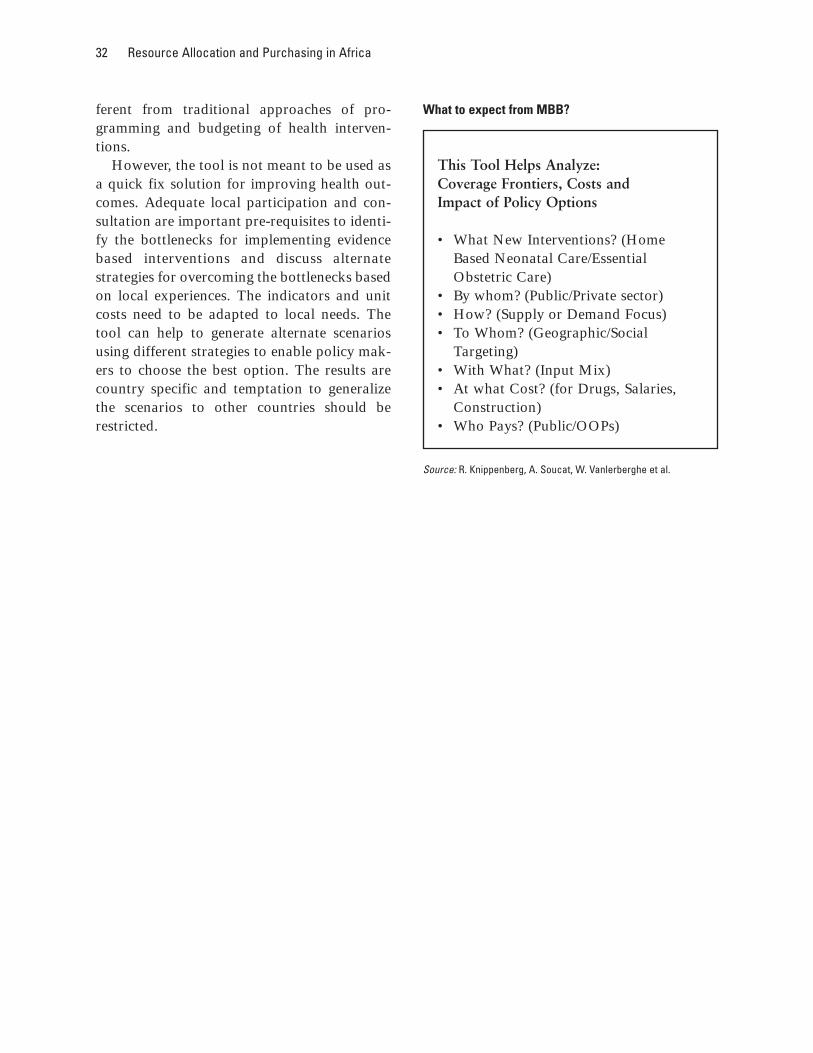
32 Resource Allocation and Purchasing in Africa
ferent from traditional approaches of pro-gramming and budgeting of health interven-tions.
However, the tool is not meant to be used asa quick fix solution for improving health out-comes. Adequate local participation and con-sultation are important pre-requisites to identi-fy the bottlenecks for implementing evidencebased interventions and discuss alternatestrategies for overcoming the bottlenecks basedon local experiences. The indicators and unitcosts need to be adapted to local needs. Thetool can help to generate alternate scenariosusing different strategies to enable policy mak-ers to choose the best option. The results arecountry specific and temptation to generalizethe scenarios to other countries should berestricted.
What to expect from MBB?
Source: R. Knippenberg, A. Soucat, W. Vanlerberghe et al.
This Tool Helps Analyze: Coverage Frontiers, Costs and Impact of Policy Options
• What New Interventions? (HomeBased Neonatal Care/EssentialObstetric Care)
• By whom? (Public/Private sector)• How? (Supply or Demand Focus)• To Whom? (Geographic/Social
Targeting)• With What? (Input Mix)• At what Cost? (for Drugs, Salaries,
Construction)• Who Pays? (Public/OOPs)
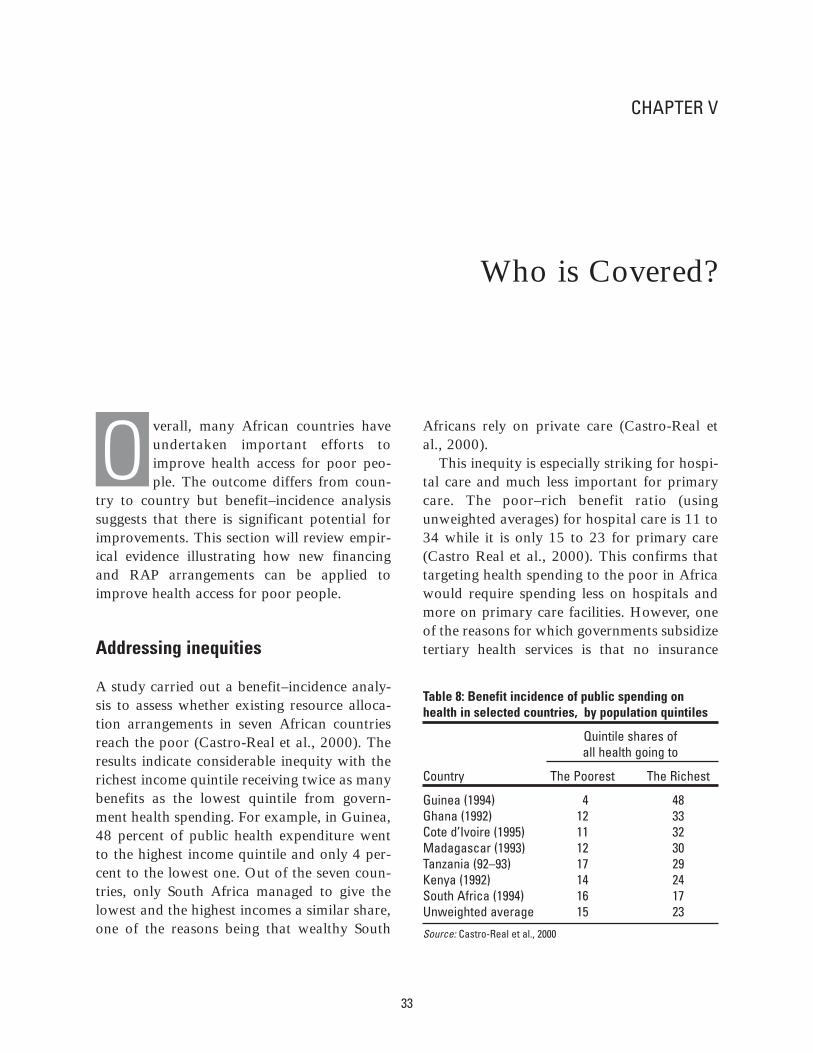
CHAPTER V
Who is Covered?
verall, many African countries haveundertaken important efforts toimprove health access for poor peo-ple. The outcome differs from coun-
try to country but benefit–incidence analysissuggests that there is significant potential forimprovements. This section will review empir-ical evidence illustrating how new financingand RAP arrangements can be applied toimprove health access for poor people.
Addressing inequities
A study carried out a benefit–incidence analy-sis to assess whether existing resource alloca-tion arrangements in seven African countriesreach the poor (Castro-Real et al., 2000). Theresults indicate considerable inequity with therichest income quintile receiving twice as manybenefits as the lowest quintile from govern-ment health spending. For example, in Guinea,48 percent of public health expenditure wentto the highest income quintile and only 4 per-cent to the lowest one. Out of the seven coun-tries, only South Africa managed to give thelowest and the highest incomes a similar share,one of the reasons being that wealthy South
Africans rely on private care (Castro-Real etal., 2000).
This inequity is especially striking for hospi-tal care and much less important for primarycare. The poor–rich benefit ratio (usingunweighted averages) for hospital care is 11 to34 while it is only 15 to 23 for primary care(Castro Real et al., 2000). This confirms thattargeting health spending to the poor in Africawould require spending less on hospitals andmore on primary care facilities. However, oneof the reasons for which governments subsidizetertiary health services is that no insurance
33
O
Table 8: Benefit incidence of public spending onhealth in selected countries, by population quintiles
Quintile shares of all health going to
Country The Poorest The Richest
Guinea (1994) 4 48 Ghana (1992) 12 33 Cote d’Ivoire (1995) 11 32 Madagascar (1993) 12 30 Tanzania (92–93) 17 29 Kenya (1992) 14 24 South Africa (1994) 16 17 Unweighted average 15 23
Source: Castro-Real et al., 2000
34 Resource Allocation and Purchasing in Africa
market exists. Households cannot insure them-selves against the risk of serious illness orinjury and the consequent need for very expen-sive treatment (Castro Real et al., 2000).
On the other hand, some countries havemade significant headway in tackling this equi-ty problem. Ghana, for example, where benefitincidence has increased slightly for the poorestone-fifth of the population, from 12 to 13 per-cent, and decreased for the richest two quin-tiles of the population, from 54 to 50 percent,between 1992 and 1998. The middle incomegroup also seems to benefit more from publichealth services than before. Similarly, the ruralpopulation benefits significantly more in ’98,getting 61 percent of resources compared to 51percent in 1992 (World Bank, Ghana PAD,2002).
In conclusion, targeting the poor via: 1) abetter supply and provision of services throughoutreach to reach them where they live; or via2) demand mechanisms through subsidies; or 3)some kind of risk pooling mechanisms, is oneof the most urgent challenges governments arefacing in efforts to improve health indicators.
Where else can the poor go forservices?
Although the public sector plays an importantrole in health service delivery in Africa, publicproviders still fail in general to concentrate onthe poor, and seem to rather support the better-off population. There is thus a need for gov-ernments to specifically target the poor.
There is evidence that the poor buy servicesfrom the private sector, but to a differentextent in each country in Africa. On one end,in 1997 in Eritrea, the private sector was usedas a source of care by fewer than 20 percent ofmedical care seekers (World Bank, 2001). Thesame happened in Ethiopia where a studyshowed that between 1997 and 2000, nearly80 percent of the population obtained theircare for malaria from the public sector
(Ethiopia Survey, 2002). On the other end,more than 60 percent of the children belongingto the poorest 20 percent of the populationwere treated outside the public sector for theirmost recent ARI or diarrhoea bout in 16 out of19 SSA countries (Bustreo et al., 2003). In thesame way, in Uganda, of the sick children whowere seeking treatment for diarrhoea, cough orfever, only 17 percent went to a public institu-tion, 41 percent were brought to a private clin-ic. This latter percentage was lower among thecaretakers who were less educated (33 percent)and higher among the more educated (47 per-cent) (Ministry Of Health Uganda, 2001).Data for 1997 in Ghana suggests that in gener-al the patients prefer to use private for profitservices for minor ailments because of slow-ness, unavailability of drugs and poor staffattitude in the public facilities. But for moreserious cases, government or mission facilitiesare perceived to be better (Ghana Policy Analy-sis and Development Group, 1999 referred toin World Bank Ghana PAD, 2002). In SouthAfrica public sector primary care is free, yetaround 30 percent of people without medicalinsurance still choose to pay out of their ownpocket to attend facilities in the private sector.Even in the lowest income quintile this propor-tion is estimated to be 20 percent (Palmer etal., 2001).
Who comprises the private sector? Most for-profit providers work in urban areas, other pri-vate providers cater to rural as well as to poorurban populations. For example in Benin, 60percent of service providers are concentrated inthe capital city, while only 15 percent of thepopulation lives there (Decaillet and May,2000), but mission and church hospitals sup-ply crucial health services to disadvantagedand poor areas. In Zimbabwe, about 35 per-cent of all hospital beds are privately owned,and about 96 percent are located in poor anddisadvantaged areas (Gilson et al., 2000).
Although for-profit providers are less com-mon in Africa than in other non-industrializedcountries, they play an important role, and it is
Who is Covered? 35
a very rapidly expanding sector: it was esti-mated that in the 1980’s and early 1990’s thenumber of for-profit physicians in eightAfrican countries ranged from 2 (Burundi) to86 (Zimbabwe), significantly below the aver-age of 213 for all developing countries. About46 percent of all physicians were private inAfrica (Hanson and Berman, 1998). In Coto-nou, the capital of Benin, alone there are 328private providers. One-half of the managers ofthose private structures admit having a secondjob, and half of those said it was a job in thepublic sector. It is interesting to note that morethan 75 percent of those private providers areopen or available 24 hours a day. It was alsofound that the majority of those providersaccepted to treat a poor person freely orthrough credit with less than 10 percent saidthey would refuse to treat a person who couldnot pay (Decaillet and May, 2000). Tanzaniabegan to encourage private provision of healthcare in 1991, and it is estimated that betweenthat date and 1996 there was a 36-foldincrease in the number of private for-profit dis-pensaries and that the number of for-profithospitals increased five-fold (McLaughlin2004). Development of this sector is also seenas a way to reverse the brain-drain, as is thecase in Ghana. For-profit hospitals have astrong foothold mainly in Kenya and SouthAfrica (Shaw and Griffin, 1995). In Ethiopia,the private sector and NGOs owned 9 percentof hospitals and 28 percent of clinics in 1995,the numbers increased respectively to 24 and41 percent in 2000 (Abay Asfaw, 2003).
Since urbanization is rapidly increasing inSSA from 34% in 2000 to 51% in 2030 (L’In-telligent, 2002), private health providers willlikely grow quickly to serve those 621 millioninhabitants in 2030.
In rural areas, private providers are alsoquite present, but more as NGOs and tradi-tional healers. In Kenya, in 1998, among therural people who sought care for young chil-dren with diarrhea or cough, 52% went to aprivate provider, this figure was 55% for the
urban population (Marek et al., 2004). InGuinea’s rural areas, independent practitionerswho do home visits absorb 91 percent of theout-of-pocket expenditures (44 percent inurban areas), and private clinics absorb anoth-er 44 percent of urban out-of-pocket expendi-tures (4 percent in rural areas) (Schwabe et al.,2003). Those rural independent practioners arelikely to be mainly traditional healers and mid-wives.
Recent research also suggests that privateproviders, in particular NGOs, often providehealth services more efficiently than do gov-ernments. A study on the performance ofchurch and mission hospitals in Ghana, Tan-zania and Zimbabwe showed that they wereon average more efficient than their govern-ment counterparts: In Tanzania, private hospi-tals treated twice as many outpatients andinpatients as the government hospitals. InGhana, private and government hospitals hadsimilar costs but drug availability was about15 percent higher in private facilities. In Zim-babwe, the average doctor to bed ratio wassignificantly higher for private providers(Gilson et al., 1997). Another case study fromZimbabwe suggests that subsidies to non-profit providers leads to better improvementsin equity than those to for-profit providers(Mudyarabikwa, 2000). In Ethiopia (EthiopiaSurvey, 2002), recurrent costs per patientstreated in 2 public and 3 NGO health stationsand clinics in 1999 showed that the cost was12.6 and 9.8 Birrs respectively; however, atthe health center level the NGO spends 42Birrs while the public sector spends 38 Birrs;finally at the hospital level the recurrent costper patient is lowest in the public sector at 21Birrs, followed by a sugar factory hospital at41 Birrs while a private hospital spent themost, at 114 Birrs. So evidence is not quiteconclusive on how cost efficient the privatesector is compared to the public. For themoment, one should, therefore, look to theprivate sector to improve quality and coveragemore than to decrease costs.
36 Resource Allocation and Purchasing in Africa
What can be done? Already in 1993, theWorld Development Report called for anincreased use of the private sector to improveequity and efficiency (World Bank, 1993).
Africa is very rich in local traditional organ-izations, such as age groups, women groups,youth groups, sports groups, which can bemobilized to work with communities, as thecase of Senegal illustrates (see Box 8 below).Such local organizations are considered part ofthe private sector too. Thus, partnerships withthe private sector have the potential to improveequity in African health systems. To date, mostcountries are starting to implement formalagreements between private providers and thegovernment. Generally, there seems to be anincreased appreciation of the importance ofprivate providers as an untapped resource toeffectively deliver health services. The privatefor-profit sector could continue to serve therich urban population making this segment ofthe population pay for it, while the public sec-tor and not-for-profit private sector could con-centrate on the poor.
Increased partnership with the private sec-tor, however, will require that governmentsshift their effort to functions such as regulationand leave more service delivery to the privatesector. Current regulations of the private sectorare inadequate. In Tanzania and Zimbabwecurrent regulations: (i) focus on individualinputs rather than health system organizations;(ii) aim to control entry and quality rather thanexplicitly quantity, price or distribution; and
(iii) fail to address the market-level problemsof anti-competitive practices and lack ofpatient rights (Lilani et al., 2000).
In Ethiopia, the private sector is constrainedin a variety of ways. One constraint is licen-sure. Providers obtain their licenses only fromregional health bureaus, and this is perceivedto be overly centralized and could be delegatedto the zonal level. License renewal is also timeconsuming and bureaucratic (Ethiopia Survey,2002).
Some might argue that many governmentshave a limited capacity to regulate, and this is,indeed, why the unregulated private marketflourishes. So, in countries with very limitedcapacity, it is more helpful to think in terms ofwhat can be achieved in the short- and long-term. In the short-term, efforts can be made to:(i) increase health related knowledge and infor-mation to users, (ii) work with commercial andinformal providers (traditional healers, streetdrug vendors, etc.) to improve dispensing andtreatment practices; (iii) expand good practiceswhere they exist; and (iv) encourage localorganizations to manage or monitor healthprovisions. In the long-term, policy needs toconcentrate on building capacity to (i) developregulatory frameworks and formal accounta-bility mechanisms to improve health sectorperformance, (ii) contract with providersagainst specific outputs, and (iii) establishinformation systems to monitor performance(Bloom and Standing, 2001).
Who is Covered? 37
Box 8: The government as an active purchaser through strategic contracting in Senegal
An example of successful contracting by the public sector for preventive services can be foundin community nutrition projects in Senegal. (Marek et al., 1999) This project avoided most ofthe challenges mentioned by Anne Mills (1997). In Senegal, contract management was dele-gated to a third party, an NGO called Agetip which became the project management unit. Thisproject management entity manages and monitors contracts for the government and is respon-sible for project implementation and results. Transaction costs of introducing and maintainingthe contracts amount to 17 percent of total project costs. As the project is focused on improv-ing the nutritional status of malnourished children, it is a clear example of using strategic pur-chasing to benefit the poor. This was further verified by results of a study in Senegal thatdemonstrated that 79 percent of project expenditures were spent in the poor peri-urban targetneighborhoods.
High-risk children receive the following services: monthly growth monitoring; weekly nutri-tion and health education services to mothers; referral to health centers and home visits whennecessary; food supplementation for the malnourished; improved access to water. Service deliv-ery is contracted out as well as training, supervision and operations research. Services are deliv-ered by a group of previously unemployed young people who create a legal entity, and whocome from and live in the target neighborhoods. The youth groups who are the serviceproviders, are supervised by a supervisor (often a pair of unemployed medical doctors) who is,in turn, supervised by Agetip.
The project did not use competition to award contracts for overall project management butopen tendering was used to choose the supervising NGOs. The youth entities are chosen bytheir communities and they sign a formal contract with Agetip. Contractual agreements spec-ify the services that are to be provided, the number of beneficiaries served, and the amount ofattendance to weekly health and nutrition education sessions required. Performance is assessedby evaluating results as reported in the management information system that is built and main-tained by each service delivery unit. Supervisors and community nutrition workers can be firedif their performance is below expectations. The same four indicators are monitored monthlyby the targeted community, the supervisors and Agetip. Local community committees moni-tored in part the service delivery, which increased accountability.
Malnutrition rates decreased rapidly and coverage steadily increased. A community basedstudy confirmed that malnutrition rates decreased steadily and that after 17 months of projectimplementation severe malnutrition disappeared among children of 6-11 months and moder-ate malnutrition fell from 28 to 24 percent among the 6 to 35-month age group. Project man-agers believe that the decrease in malnutrition is caused more by better care through regulargrowth monitoring and nutritional education for mothers than by the food supplement.
ational Health Accounts revealedthat in ESA, 53 percent of healthexpenditures go through private pur-chasers: 33 percent through house-
holds, 11 percent through NGOs, 9 percentthrough private insurance and employers (ESANHA, 2000).
In spite of those figures, governments inAfrica are still in the early stage of the financ-ing–providers split, and only recently did timidefforts start to purchase services in a strategicway.
Public–public arrangements: Local level purchasing within adecentralized public model
As mentioned previously, in recent years, somecountries in SSA have decentralized their pub-licly funded health systems. This move towarddecentralization has been partly driven by thebelief that local control over resources willresult in better performing health systemsbecause local authorities are more accountableto their populations. Design and implementa-tion of “decentralization” in the continent hasincluded a variety of models ranging from theestablishment of regional bodies that have no
influence over critical management decisionssuch as hiring and firing or how resources willbe allocated to models with a higher degree oflocal control. There are some attempts atautonomization of hospitals, but no data is yetavailable to assess their impact. Few systemshave effectively evaluated the impact of thesereforms. One exception is Burkina Faso wherethe health system has been decentralized (seeBox 9). It must be noted that this successfulexperience has since ceased in Burkina itself, asmentioned previously.
Public–private arrangements
International advisors have been actively pro-moting contracting out health services ratherthan direct government provision as a way toimprove efficiency and quality of care and toimprove access by providing services in regionswhere public providers are scarce. While gov-ernments in Africa have contracted the privatesector to provide non-health services such aslaundry, food service, and cleaning there are fewexamples of governments contracting privatesector providers to deliver health services andfewer cases that have been evaluated. The Gov-ernment of Malawi plans to contract out clean-
38
CHAPTER VI
Current Trends and Practices in Purchasing Health Services
N
Current Trends and Practices in Purchasing Health Services 39
ing, maintenance and other ancillary servicesaffecting 5,237 civil servants who will then beretrenched from the civil service, retrained or beabsorbed by the private sector (Picazo, 2002).
Anne Mills (1997) describes examples of con-tracting with the private for-profit hospital sec-tor in South Africa and Zimbabwe with mixedresults. She cautions that key issues that must be
Box 9: Innovation in RAP arrangements within a hierarchical public structure: Burkina FasoCase study
Presented here is the bottom-up planning, oversight, and resource control approach imple-mented by Burkina Faso (Eichler, 2001). One of the primary strategies to improve perform-ance of primary health care in Burkina Faso is to engage each community to assume leader-ship for their own community’s health. Community committees have been established to:formulate priorities for health; identify strategies to solve identified problems; incorporatestrategies into annual action plans; oversee operations of community primary health care facil-ities; establish local user fee schedules for cost recovery; manage drug depots as revolving drugfunds; and to manage funding from the government, donors and user fees. What is unique isthat action plans are developed at the community level and funds flow from the central levelto districts and then to communities and are managed at the community level. Communitieseffectively become purchasers for some inputs important for primary health care service deliv-ery (e.g., motorbikes for health education outreach and essential drugs), control user fees,manage funds for drugs and consultations, and oversee the performance of the primary healthcare workers whose salaries are covered through the central ministry.
Central to this model of decentralization is the bottom-up approach to developing actionplans. Each year action plans are developed at the regional, district, and community level(defined as the group of villages served by a primary health care center) according to a clearprocess established by the central ministry. Action plans define specific activities that will becarried out by each level in the system to address priority problems, the funding required, indi-cators of performance, and procedures for appropriate management of funds. Manuals docu-ment the process to be followed and provide formats for preparing budgets and performanceindicators. Staff in regions and districts facilitate the planning process with community healthcommittees to develop community level action plans. Each year a conference is organized withthe regions, the central government and donors to discuss and approve plans and to obtaincommitments to contribute resources. After this consultative process, plans are revised andfunding commitments are made.
While defining performance targets that communities perceive to be important is anapproach to focus efforts on results, communities are not fully held accountable for achievingthe goals established in their action plans. Current management agreements do not containeither rewards for attaining targets or penalties for failing to reach them. Burkina Faso is con-sidering introducing explicit performance based funding to provide more powerful incentivesto each level in the public system to attain performance goals. The current information systemis adequate for monitoring key primary health care indicators and the management systemcould be revised to accommodate a performance based payment scheme.
(continued on next page)
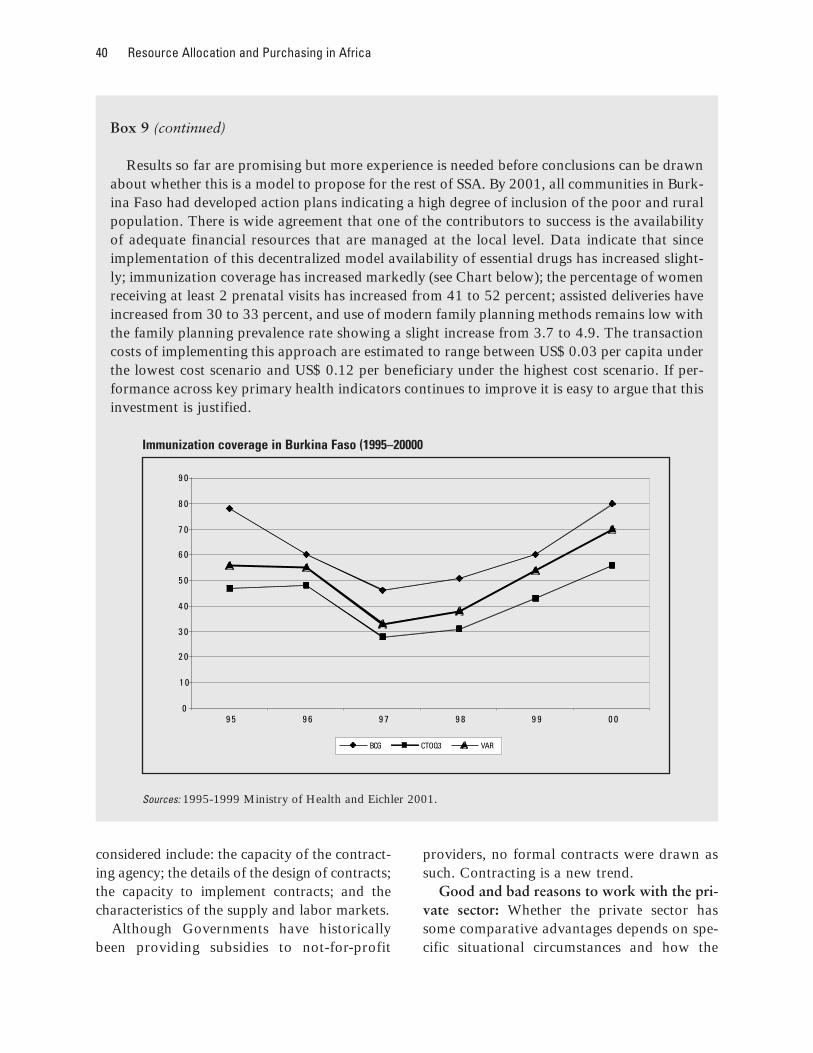
40 Resource Allocation and Purchasing in Africa
considered include: the capacity of the contract-ing agency; the details of the design of contracts;the capacity to implement contracts; and thecharacteristics of the supply and labor markets.
Although Governments have historicallybeen providing subsidies to not-for-profit
providers, no formal contracts were drawn assuch. Contracting is a new trend.
Good and bad reasons to work with the pri-vate sector: Whether the private sector hassome comparative advantages depends on spe-cific situational circumstances and how the
Box 9 (continued)
Results so far are promising but more experience is needed before conclusions can be drawnabout whether this is a model to propose for the rest of SSA. By 2001, all communities in Burk-ina Faso had developed action plans indicating a high degree of inclusion of the poor and ruralpopulation. There is wide agreement that one of the contributors to success is the availabilityof adequate financial resources that are managed at the local level. Data indicate that sinceimplementation of this decentralized model availability of essential drugs has increased slight-ly; immunization coverage has increased markedly (see Chart below); the percentage of womenreceiving at least 2 prenatal visits has increased from 41 to 52 percent; assisted deliveries haveincreased from 30 to 33 percent, and use of modern family planning methods remains low withthe family planning prevalence rate showing a slight increase from 3.7 to 4.9. The transactioncosts of implementing this approach are estimated to range between US$ 0.03 per capita underthe lowest cost scenario and US$ 0.12 per beneficiary under the highest cost scenario. If per-formance across key primary health indicators continues to improve it is easy to argue that thisinvestment is justified.
Immunization coverage in Burkina Faso (1995–20000
Sources: 1995-1999 Ministry of Health and Eichler 2001.
0
1 0
2 0
3 0
4 0
5 0
6 0
7 0
8 0
9 0
9 5 9 6 9 7 9 8 9 9 0 0
BCG CTOQ3 VAR
Current Trends and Practices in Purchasing Health Services 41
partnership was established. There is, however,evidence to show that using the private sectorcan increase equity, especially if NGOs orCommunity-based organizations are used towork in areas not covered by the public sector.Another advantage of using the private sectoris the possibility of improving quality of serv-ices, mainly through better accountability tothe client. Finally, the private sector can inmany instances increase coverage very fastwhen mobilized. There already exist goodexamples of different types of instrumentsupon which to build, such as contracting, leas-ing and concessions (Marek and Yamamato,2003).
Private not-for-profit providers have beenproven effective in reaching the poor in areaswhich have been typically under-serviced byusing explicit contractual agreements. Forexample, in a community nutrition project inSenegal, service delivery was contracted out tolocal youth groups, to cover poor peri-urbanareas (see Box 8).
Private–private arrangements
Another approach to increasing the availabili-ty of adequate quality health services andessential medicines is to stimulate the develop-ment of private providers. One way to do thisis through franchises. Franchisors develop abusiness model that franchisees can buy into.Each franchise is a private business. Fran-chisees must comply with standards and proce-dures developed by the franchisor, sell prod-ucts purchased through the franchisor, andcharge prices determined by the franchisor.Moreover, the franchisees must comply withthe franchisor’s management and reportingsystems. This degree of standardization offersassurances to consumers of quality and consis-tency.
One level of strategic purchasing happenswhen the franchisor purchases products tosupply the franchisees. In a social franchise
that is motivated to achieve social goals, thisapproach to purchasing enables the franchisorto take advantage of market power to negoti-ate low prices and assure quality with suppli-ers. After products are distributed to fran-chisees, final purchases are made either without-of-pocket payments by consumers or byconsumers who have some form of third partypayment. Governments can stimulate the cre-ation of franchises by making capital availableand by establishing social priorities. If fran-chises are viable private enterprises, they aresustainable.
There are a few franchises in Africa, someare for reproductive health services, such asMary Stopes in East Africa, others produceand distribute condoms or impregnated mos-quito nets. Many seem to face the problem ofsustainability as they cannot recover all theircosts they need to have subsidies in order tocontinue reaching the poor. A promising fran-chise is that of Cry for the World, in Kenya,which sells drugs (see Box 10).
In addition to franchises, there are severallarge companies which act as purchasers aswell as financiers for the health of their work-ers. Mining and large agricultural estates havebeen known to invest heavily to reach the com-munities from where their workers come, espe-cially in regards to AIDS.
Demand-side strategies to enablepurchasing among target groups
A potentially powerful strategy to enable pri-ority population groups to purchase healthservices is to subsidize their demand. One suchmechanism is to provide consumers withvouchers that enables their access to either dis-counted or completely free services. A projectin Tanzania provided pregnant women withvouchers to purchase insecticide-treated nets(ITNs) (see Box 11). The mixed results providegood lessons for the design and implementa-tion of similar schemes in SSA (Marchant et
42 Resource Allocation and Purchasing in Africa
al., 2002), and to help answer the question ofwhether vouchers can be used to target popu-lation groups to increase utilization of a prod-uct or service.
Conclusions about the effectiveness ofvouchers to stimulate demand cannot fully bemade based on this experience in Tanzania.What is clear is that in order to be effective, asocial marketing strategy must target pur-chasers in households and that incentives touse the system in ways other than is intendedmust be considered as part of the design andimplementation process. This example isincluded as a strategy that has potential tostimulate service utilization among target pop-
ulation groups in SSA but more evidence isneeded.
Overall there are some very good purchasingexperiences to build upon to reach the poor inSSA, especially in terms of public–public andpublic–private arrangements. It would be rela-tively easy to build on the positive experiencesin order to go to scale. More attention needs tobe given to evaluating the schemes and totraining of both government and private actorsin contracting. There’s also a need to providethe nurturing policy and administrative envi-ronment for those schemes to be implementedwith the least hurdles possible.
Box 10: Expanding access to essential medicines through franchised drug shops in Kenya
Cry for the World Foundation (CFW) started a network of franchised drug retail outlets in thedistricts of Kirinyaga and Mbere in Kenya in early 2000. By 2002, 26 retail shops had beenopened. Initially, the shops were operated by community health workers who received train-ing by the franchisor. In order to open an outlet, an outlet manager must provide 20 percentof the financing and take a loan for the additional 80 percent for an interest rate of 18 percentper year. Only drugs on Kenya’s essential drug list are sold. Outlet managers are required todistribute only those products that are supplied through CFW and to keep financial and stockmanagement records and records of patient interactions according to the rules of the franchise.Prices are determined by CFW and are considered to be among the lowest in Kenya (Marsden,2002).
At the central level in Nairobi, CFW is responsible for helping to establish new shops, super-vising and developing training materials, purchasing drugs and supervising drug distribution,assuring drug quality control, and managing relationships with the MOH. Supervisors locat-ed at the district level train franchise outlet owners and assure that franchise procedures arebeing followed. Because franchisees own their shops and earn a return on sales, they havefinancial incentives to be responsive to population preferences by adapting location, hours ofoperation, styles of interaction, and physical appearance of their shops.
By 2002, a population of roughly 100,000 people were being served by CFW outlets. Astudy of sales and patient interaction records examined the impact of the franchise on preven-tion and treatment for malaria. Of the 60,000 patient records that were examined, over 20,000were found to be for malaria. Record reviews found that outlets are strictly adhering to nation-al treatment guidelines which indicates that quality services are being provided. In addition,impregnated bed-nets were sold by outlets. CFW does claim to be reaching the poor, but notthe very poor who cannot pay (CFW, 2002).
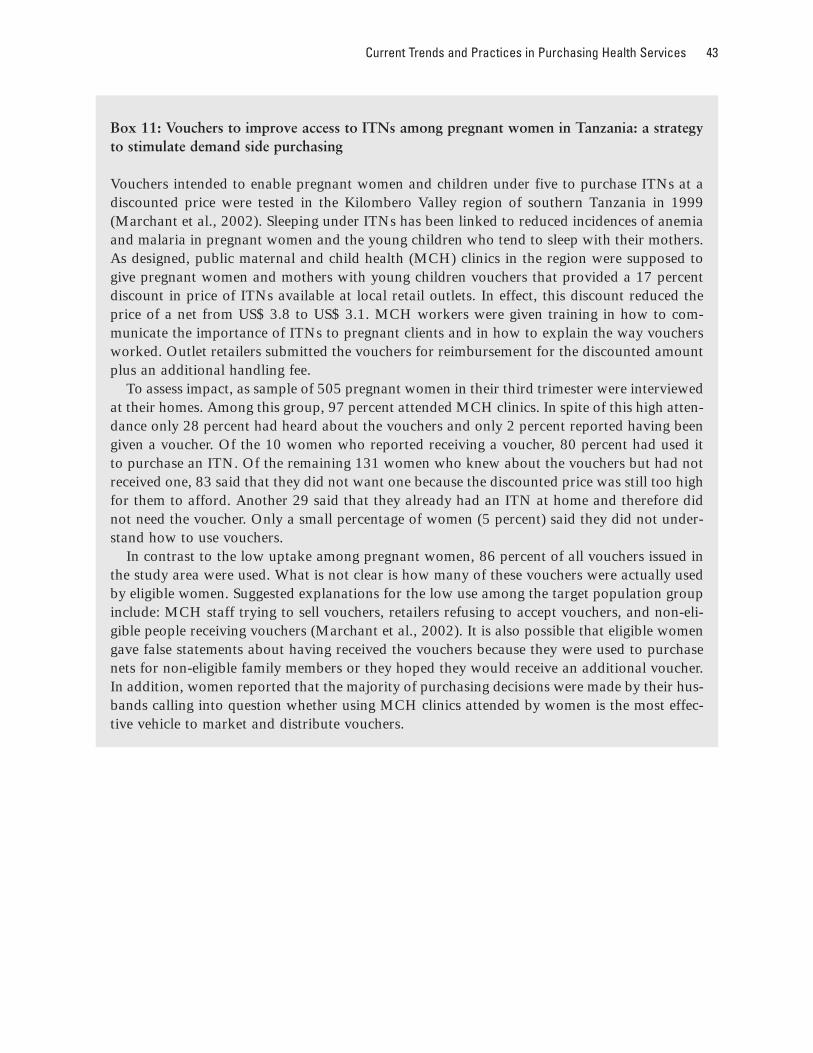
Current Trends and Practices in Purchasing Health Services 43
Box 11: Vouchers to improve access to ITNs among pregnant women in Tanzania: a strategyto stimulate demand side purchasing
Vouchers intended to enable pregnant women and children under five to purchase ITNs at adiscounted price were tested in the Kilombero Valley region of southern Tanzania in 1999(Marchant et al., 2002). Sleeping under ITNs has been linked to reduced incidences of anemiaand malaria in pregnant women and the young children who tend to sleep with their mothers.As designed, public maternal and child health (MCH) clinics in the region were supposed togive pregnant women and mothers with young children vouchers that provided a 17 percentdiscount in price of ITNs available at local retail outlets. In effect, this discount reduced theprice of a net from US$ 3.8 to US$ 3.1. MCH workers were given training in how to com-municate the importance of ITNs to pregnant clients and in how to explain the way vouchersworked. Outlet retailers submitted the vouchers for reimbursement for the discounted amountplus an additional handling fee.
To assess impact, as sample of 505 pregnant women in their third trimester were interviewedat their homes. Among this group, 97 percent attended MCH clinics. In spite of this high atten-dance only 28 percent had heard about the vouchers and only 2 percent reported having beengiven a voucher. Of the 10 women who reported receiving a voucher, 80 percent had used itto purchase an ITN. Of the remaining 131 women who knew about the vouchers but had notreceived one, 83 said that they did not want one because the discounted price was still too highfor them to afford. Another 29 said that they already had an ITN at home and therefore didnot need the voucher. Only a small percentage of women (5 percent) said they did not under-stand how to use vouchers.
In contrast to the low uptake among pregnant women, 86 percent of all vouchers issued inthe study area were used. What is not clear is how many of these vouchers were actually usedby eligible women. Suggested explanations for the low use among the target population groupinclude: MCH staff trying to sell vouchers, retailers refusing to accept vouchers, and non-eli-gible people receiving vouchers (Marchant et al., 2002). It is also possible that eligible womengave false statements about having received the vouchers because they were used to purchasenets for non-eligible family members or they hoped they would receive an additional voucher.In addition, women reported that the majority of purchasing decisions were made by their hus-bands calling into question whether using MCH clinics attended by women is the most effec-tive vehicle to market and distribute vouchers.
44
CHAPTER VII
Conclusion: Misconceptions, Constraints,and Future Opportunities
Misconceptions
This paper highlights a few (7) common misconceptions:1) The problem is one of money: although funding for health is severely constrained in SSA,
there are plenty of resources which are either not used (large amounts of undisbursed donormoney, untapped and unregulated private sector providers, low levels of execution of publicbudget) or used in an inefficient manner;
2) Resources allocated to primary health care are reaching the poor: they usually benefit thewealthy more than the poor, unless proper targeting mechanisms are in place;
3) The public sector is the main provider of health services in Africa. Although donors haveup to recently focused mostly on how to improve public sector spending, there is a large shareof health spending which is private, which also needs to be utilized more effectively;
4) Public–private partnerships are justified because they draw on the efficiencies of the pri-vate sector. Evidence indicates that public private partnerships are more likely to benefit equi-ty, service quality, and community empowerment than cost control;
5) The private sector can do better than the public sector. This is not always the case. Pub-lic–private partnerships are usually justified when a government wants to improve equity, qual-ity, empower communities, but does not want to deliver that service or perform that functionitself, or when a private entity has a comparative advantage in service delivery. Such partner-ships should not be attempted for other reasons;
6) Working with the private sector means neglecting the public sector. On the contrary, fora government to work effectively with the private sector it has to be able to: 1) negotiate con-tracts; 2) set up the right enabling environment for the private sector to operate; and 3) pro-vide norms and ensure that they are implemented — among other functions. Other functions,particularly those related to service delivery, can be devolved to the private sector;
7) External aid will solve the problem: reliance on external sources of financing is still veryhigh in most countries, but donors seem to provide aid more based on political considerations,and the fragmentation in external sources of financing adds to the countries’ problem of man-aging and coordinating.
Conclusions: Misconceptions, Constraints, and Future Opportunities 45
Constraints to Effective RAP
This paper also highlights some (3) of the constraints faced by governments in Africa:1) Many governments experience a lack of stewardship. There are many reasons for this,
some of which are political and some are technical. Inadequate management of humanresource represents a major challenge to African health systems that results in the non-dis-bursement of a considerable amount of available funds. Added to this is the complexity ofmanaging often conflicting donor priorities and the pressure placed by the HIV/AIDS epidem-ic and the result is health systems that are overwhelmed and, thus, perform poorly. Govern-ments, with donor support, have tried to introduce SWAPs to establish priorities for the sectorand to manage competing donor agendas.
2) The allocation of resources based on historical budgeting only perpetuates existinginequities. Decentralization is one strategy used to improve resource allocation, but it has notyet generated the expected results. Reallocation of resources toward primary care and awayfrom secondary and tertiary care has also proven to be difficult to implement. Even in coun-tries where some reallocation has occurred, the poorest populations are not necessarily thebeneficiaries. There is, therefore, a need to target public services specifically to the poor and toensure that those that can pay, do pay.
3) Donors need to ensure that their aid helps reinforce health systems rather than createfragmentation and more strain on already stretched human resources.
Future Opportunities to improve RAP
This paper shows that some African governments have already looked for ways to improveresource generation, provide risk protection, and carry out strategic purchasing. This alsopaper mentions a number of successful examples and lessons learnt which can be built upon,and are to be encouraged. There are trends which need to be encouraged to improve RAP, andwe classified them into three categories:
To improve the policy-side of RAP arrangements:
(i) There are several ways to improve equity, which include:
■ Risk pooling: A challenge to the increasing utilization of essential services by the pooris providing mechanisms to protect households from the financial burden of high costhealth events. Various insurance schemes can provide this needed financial protection andcan result in higher utilization of essential services by removing the financial barriers toaccess that households face. While each risk pooling scheme is different, experiences con-tain the following common lessons to be considered when designing and introducingschemes:
(continued on next page)
46 Resource Allocation and Purchasing in Africa
• The human resource capacity needed to manage insurance schemes must be consideredcarefully;
• Systems are needed to control fraud and abuse by both providers (excessive billing) andpatients (sharing membership cards with non-members);
• Payers should use their purchasing power more strategically by using payment mecha-nisms that consider incentives for both provider and patient behavior;
• There appear to be advantages to enrolling groups rather than individuals to avoidadverse selection;
• Attention needs to be paid to ensuring that services are of adequate quality as perceivedby patients;
• Schemes should consider expanding coverage to include high cost services such as hos-pitalization;
• If catastrophic costs are covered, larger risk pools or social re-insurance schemes willbe needed to ensure the financial viability of community schemes;
• Choice of provider may make voluntary schemes more attractive to the population;and
• More attention needs to be paid to effective marketing of voluntary schemes.
Poor people are willing to pay premiums in advance to receive coverage for uncertainfuture events if they can be assured of access to quality services and that the perceivedbenefits outweigh the costs. Participation in a community based health insurance schemetends to increase utilization as compared to the uninsured population. Except in Rwandawhere household wealth did not seem to be a determinant of enrollment, studies indicatethat having to pay premiums continues to pose a barrier to the participation of poor peo-ple. Evidence from CBHI schemes indicates that overall enrollment rates are low and dropout rates are high. An improved design that increases responsiveness, controls expendi-tures, and effectively markets to the population may increase the success of CBHI schemesin SSA though more time, experience, and evidence is needed.
■ Utilization of targeting instruments: There are a number of tools that can be utilized forpro-poor strategies, such as vouchers and performance-based contracts. Vouchers repre-sent a demand-side strategy that has the potential to increase access among low incomepeople. By providing consumers with vouchers that entitle them to either discounted orfree services, consumers are enabled to obtain essential services from a range of outlets.Establishing the rules and system which govern vouchers and reimbursement of providerscalls for government leadership and increased capacity along these lines. Performance-based contracts can be used to increase coverage among certain populations.
■ Marginal Budgeting for Bottlenecks: Despite extensive Sector Reforms, the health sys-tems in many SSA countries still fail to reach large numbers of women and children—especially the poorest and most vulnerable—with these interventions.
(continued on next page)
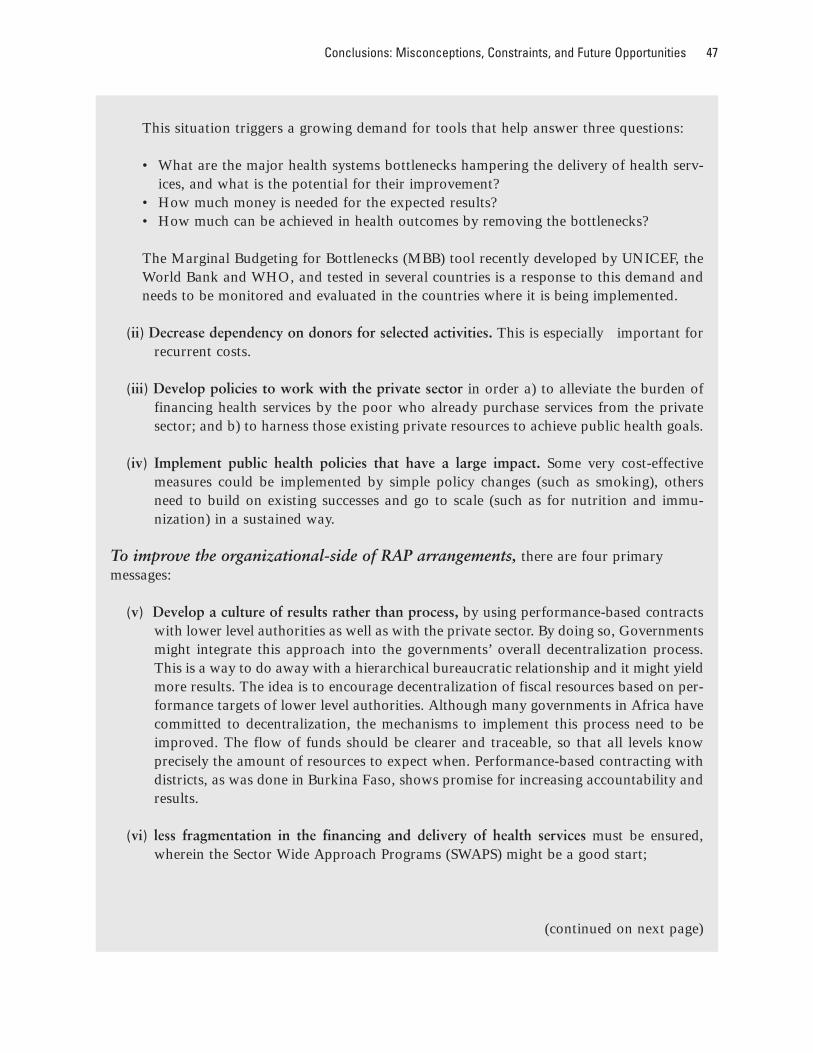
Conclusions: Misconceptions, Constraints, and Future Opportunities 47
This situation triggers a growing demand for tools that help answer three questions:
• What are the major health systems bottlenecks hampering the delivery of health serv-ices, and what is the potential for their improvement?
• How much money is needed for the expected results? • How much can be achieved in health outcomes by removing the bottlenecks?
The Marginal Budgeting for Bottlenecks (MBB) tool recently developed by UNICEF, theWorld Bank and WHO, and tested in several countries is a response to this demand andneeds to be monitored and evaluated in the countries where it is being implemented.
(ii) Decrease dependency on donors for selected activities. This is especially important forrecurrent costs.
(iii) Develop policies to work with the private sector in order a) to alleviate the burden offinancing health services by the poor who already purchase services from the privatesector; and b) to harness those existing private resources to achieve public health goals.
(iv) Implement public health policies that have a large impact. Some very cost-effectivemeasures could be implemented by simple policy changes (such as smoking), othersneed to build on existing successes and go to scale (such as for nutrition and immu-nization) in a sustained way.
To improve the organizational-side of RAP arrangements, there are four primarymessages:
(v) Develop a culture of results rather than process, by using performance-based contractswith lower level authorities as well as with the private sector. By doing so, Governmentsmight integrate this approach into the governments’ overall decentralization process.This is a way to do away with a hierarchical bureaucratic relationship and it might yieldmore results. The idea is to encourage decentralization of fiscal resources based on per-formance targets of lower level authorities. Although many governments in Africa havecommitted to decentralization, the mechanisms to implement this process need to beimproved. The flow of funds should be clearer and traceable, so that all levels knowprecisely the amount of resources to expect when. Performance-based contracting withdistricts, as was done in Burkina Faso, shows promise for increasing accountability andresults.
(vi) less fragmentation in the financing and delivery of health services must be ensured,wherein the Sector Wide Approach Programs (SWAPS) might be a good start;
(continued on next page)
48 Resource Allocation and Purchasing in Africa
(vii) provide subsidies to the poor so that they are able to pool resources, increased atten-tion to the potential capacity and contribution of health mutuals is one way to achievethis.
To improve the institutional-side of RAP arrangements, here are some options forAfrican Ministries of Health:
(viii) assume a stronger role as stewards, that is provide regulation, supervision, monitoringand competitive arrangements. Develop mechanisms, guidelines, and ensure adequatetraining to work with the private sector. The issue is not whether services should beprovided by the public sector or by the private sector. What is important is that all thepeople be covered by quality health services. This paper reveals that both the public andprivate sectors could greatly improve on ensuring that this important objective isachieved. Governments need to focus on the essential functions that only they canundertake, and harness the potential of private providers for services provision. The pri-vate sector can function effectively on a large scale only if the public sector is able to fillits role as regulator. The literature shows that ministries of health are still trying to doeverything — but that they are not able to do it. There is, therefore, the need to designsimple yet precise public–private partnership strategies, a few examples of which arereviewed in this paper. Such strategies must include strengthening the public sector to:1) set norms, 2) control quality, and to 3) design and implement regulations so as toprovide an enabling environment where the private sector can serve social goals.
To effectively contract service providers, governments also need the capacity todesign, negotiate, manage, and evaluate the performance of contractors. An example ofeffective contracting that avoided the contracting capacity constraints that usually pres-ent bottlenecks in many MOHs can be seen in a nutrition project in Senegal (Box 8). Bycontracting a delegated contract management agency, Agetip, it was possible to mini-mize transaction costs and and ensure the work was done without increasing Govern-ment personnel.
Franchises are another approach to increasing availability of services and essentialmedicines. Presented here is the case of Cry for the World, a franchise of drug retail out-let shops in Kenya that provides access to high quality and reasonably priced essentialdrugs. Because consumers must pay out-of-pocket for drugs, the poorest populationdoes not specifically benefit. This strategy has the potential to improve access to quali-ty products at controlled prices. Third party payment such as subsidized participationin a CBHI scheme could help increase access to franchise services and products by thepoorest people.
Community organizations constitute an opportunity to increase coverage in Africawhich still remains to be acknowledged, harnessed and contracted as service providersby governments.
(ix) separate financing from provision of services in order to help with governance problemsand to improve accountability.
Bibliography
Abt Associates (2000a). Health InsuranceBecoming Popular in Africa. Health-Watch, Fall, Volume 5, No.1.
Abt Associates (2000b). Rwanda NationalHealth Accounts 1998, PHR TechnicalReport No. 53, September 2000.
Akin, John, Hutchinson, Paul and Strumpf,Koleman (2001). Decentralization andGovernment Provision of Public Goods:The Public Health Sector in Uganda.MEASURE Evaluation Project, WorkingPaper 01–35.
Akumu, O. Some Issues of Class Equity at theNational Hospital Insurance Fund, July1992 with data derived from NHIFarchives by Kraushaar (1997).
Arhin-Tenkorang, D. (2001, September)Health Insurance for the Informal Sectorin Africa: Design Features, Risk Protec-tion, and Resource Mobilization, Com-mission on Macroeconomics in HealthWorking Paper Series, Paper No. WG3:1.
Asfaw Abay(2003). Costs of illness, demandfor medical care, and the prospect ofcommunity health insurance schemes inthe rural areas of Ethiopia, DevelopmentEconomics and Policy Vol.34. Frankfurt,Peter Lang Verlag 2003. Germany.
Atim, Chris. (July, 1998) The Contributionof Mutual Health Organizations toFinancing, Delivery, and Access toHealth Care: Synthesis of Research inNine West and Central African Coun-tries, Abt Associates.
Atim, Chris, Steven Grey, Patrick Apoya,Sylvia J. Anie, and Moses Aikins, (2001,September) A Survey of Health FinancingSchemes in Ghana, Partnerships forHealth Reform Plus.
Audibert Martine and Mathonnat Jacky,« Cost recovery in Mauritania: initial les-sons », Health Policy and Planning; 15(1):66–75. Oxford University Press,2000.
Back to Office (BTO) Report of a Health Sec-tor Supervision Mission in Burkina Faso,February 18, 2003. Schneidman, Miriam.The World Bank, Washington, D.C. —internal document).
Bah, Oumar. “Traçabilité des dépensespubliques appliquées au secteur de lasanté en Guinée”, August 2003, Ministryof Health, Guinea.
Bennett, Sara and Gilson, Lucy (2001). HealthFinancing: Designing and ImplementingPro-poor Policies. DFID Health SystemResource Centre, London.
49
50 Resource Allocation and Purchasing in Africa
Black et al. (2003, June) “Where and why are10 million children dying every year?”,The Lancet, vol. 361, N. 9351,.
Blas, Erik and Limbambala, Me (2001). Thechallenge of hospitals in health sectorreform: the case of Zambia. Health Policyand Planning, 16(Suppl 2): 29–43.
Bloom, Gerald and Standing, Hilary. (2001)“Pluralism and marketisation in thehealth sector: meeting health needs incontexts of social change in low and mid-dle income countries”, Institute of Devel-opment studies Working Paper 136.
Bossert Thomas, Mucosa Bona Chitah, MaryseSimonet, Ladslous Mwanza, MaureenDaura, Musa Mabandhala, Diana Bows-er, Joseph Sevilla, Joel Bauvais, GloriaSilondwa, Munalinga Simatele (2000).Decentralization of the health system inZambia, Technical Paper No. 2. Bethesda,MD: Partnership for Health Reform Pro-ject, Abt Associates.
Bossert Th., M. Bona Chitah, D. Bowser(2003). Decentralization in Zambia:resource allocation and district perform-ance, Health Policy and Planning, Vol. 18(4)
Bustreo Flavia, Harding April, Axelsson Hen-rik. Can developing countries achieveadequate improvements in child healthoutcomes without engaging the privatesector? Bulletin of the World HealthOrganization. May 2003.
Castro-Real F, Dayton J, Demery L and MehraK. (2000) Public spending on healthcarein Africa: Do the poor benefit? Bulletin ofthe World Health Organization, 78:66–74.
Campbell, Paul, Karen Quigley, Pano Yer-acaris, and MacDonald Chaora. (2000)Applying Managed Care Concepts andTools to Middle and Low Income Coun-tries: The Case of Medical Aid Societies inZimbabwe, Harvard School of PublicHealth report.
Chao S. and Kostermans K., (2002) Improvinghealth for the poor in Mozambique,Africa Region, The World Bank.
Chawla Mukesh, Ramesh Govindaraj, PeterBerman, Jack Needleman. ImprovingHospital Performance through Policies toIncrease Hospital autonomy: Method-ological Guidelines. August 1996.
Cote, Michel. (2003, July 10) “Diagnosticorganisationnel PRCI (Projet de renforce-ment des capacités institutionnelles)—Guinée” from SOGEMA/Canada.(SOGEMA = Canadian management con-sulting firm working closely on the inter-national scene with developing countriesin the fields of management, training andsystemization.) Presentation made at theWorld Bank.
Cry for the World Foundation –CFW– (2002)A Network of Franchised Drug Shops inKenya, powerpoint presentation toForum 5.
Dar Es Salaam City Medical Office of Health(2003, January). “Minimum package ofhealth and related management activi-ties”, January 2003.
De Beyer, Joy and Brigden, Linda Waverly. Edi-tors. “Tobacco Control Policy: Strategies,successes and setbacks”, World Bank andRITC, 2003, Washington.
Decaillet François, and John May. (2000, May)Le secteur médical privé à Cotonou,Bénin, en 1999. World Bank, Washing-ton, DC. p. 27.
Devarajan, Shantyanan; Dollar, David andHolmgren, Torgny (2001). Aid andReform in Africa. World Bank, Washing-ton, D.C.
Deville, Leo, Joseph Decosas, Peter Nhindiri,Shelagh Leyland, and Bernard McLough-lin. (1997, November) “Review of theHealth Sector of the Republic of Zimbab-we”, Health Research for Action(HERA).
Diop, Francois, Ndiaye, Colonel and Grunde-mann, Christophe (2001). Décentralisa-
Bibliography 51
tion et système de santé au Sénégal: Unesynthèse. Bethesda, MD: Partnership forHealth Reform Project, Abt Associates.
Demissie Habte, Mary Mulusa, and PaulHutchinson (1999). Health Care in Ugan-da: Selected Issues. World Bank Discus-sion Paper 404. World Bank, Washington,D.C.
Easterly, William (2001). The Elusive Questfor Growth: Economist’s Adventuresand Misadventures in the Tropics. MITPress.
Eichler, Rena (2001, October) ImprovingImmunization Coverage in an InnovativePrimary Health Care Delivery Model:Lessons from Burkina Faso’s Bottom UpPlanning, Oversight, and Resource Con-trol Approach that holds ProvidersAccountable for Results. World Bank,Washington, DC.
Engida, Endale and Mariam, Damen (2000)Assessment of the Free Health Care Pro-vision in Northern Ethiopia. Presented toCERDI, France. CERDI=Centre d’Etudeset de Recherches sur le DeveloppementInternational.
Enright, Michael, Daniel Kraushaar, Derek J.Oatway, Ikiara Gerrishon. (1994) Devel-oping Prepaid Health Programs in Kenya:A Private Insurance Assessment, PROFITProject, USAID.
Ethiopia Survey: Roll Back Malaria: Study onMalaria Financing and Expenditures inEthiopia, KUAWAB Business Consultants(PLC), Addis Ababa under contract withthe World Bank’s Malaria Team, August2002.
Fiedler, Jack, Anne Levin and DennisMulikelela. (November 1998) A Feasibil-ity Analysis of Franchising the PROS-ALUD/Bolivia Primary Health Care Ser-vice Delivery Strategy in Lusaka, Zambia,Technical Report No. 15, Partnerships forHealth Reform.
Gilson, Lucy et al. (2000). The Dynamics ofPolicy Change: Lessons from Health
Financing Reform in South Africa andZambia. Major Applied Research, Tech-nical Paper No. 3. Bethesda, MD: Part-nership for Health Reform Project, AbtAssociates.
Global Fund to fight AIDS, Tubercolosis, andMalaria (2002). Initial Questions on theGlobal Fund: FAQ. Geneva.
Gilson, Lucy, Joseph Adusei, Dyna Arhin,Charles Hongoro, Phare Mujinja and KenSagoe, “Should African GovernmentsContract Out Clinical Health Services toChurch Providers”, in Private HealthProviders in Developing Countries: Serv-ing the Public Interest, ed. Sara Bennett,Barbara McPake, and Anne Mills, ZedBooks: London and New Jersey, p.276–302, 1997.
Gottret Pablo and Preker Alex (2003, May)“Accelerating progress towards the MDGand health financing issues”, DRAFT.The World Bank, Washington, D.C.
Gwatkin, Davidson (2000). Health inequalitiesand the health of the poor: What do weknow? What can we do?. Bulletin of theWorld Health Organization 78 (1): 3–18.
Gwatkin, Davidson (2001). Overcoming theinverse law: Designing Health Programsto Serve Disadvantaged PopulationGroups in Developing Countries. WorldBank, Washington, D.C.
Gwatkin Davidson (2002). Presentation madeat the Liverpool School of Tropical Med-icine, Leverhulme Lecture, September 17,2002
Habte Demessie, Mulusa Marie, and Hutchin-son Paul (1999) Health Care in Uganda:Selected Issues. 1999.
Hahmed, Mohamed and Soucat, Agnes (Févri-er 2004). Santé et Pauvreté en Mauri-tanie: Analyse et Cadre Stratégique deLutte contre la Pauvreté. Ministre de laSante et des Affaires Sociales de la Planifi-cation, de la Coopération, et des Statis-tiques.
52 Resource Allocation and Purchasing in Africa
Hanson, Kara and Berman, Peter (1998). Pri-vate health care provision in developingcountries: a preliminary analysis of levelsand composition. Health Policy and Plan-ning, 13(3): 195–211.
HSPH, Issue Brief: Policy process of healthreform in Latin America, Data for Deci-sion Making, Harvard School of PublicHealth. Guidelines for Enhancing thePolitical Feasibility of Health Reform inLatin America. June 2000
Hutchinson, Paul and Ignacio Parker (1997,February) Review of the CommunityHealth Fund Pre-Test in Igunga District,Government of Tanzania/World Banksupport to Tanzania Health SectorReform in Health Care Financing..L’Intel-ligent, No. 2151, April 1–7, 2002,p. 48.
International Labour Office (2002). ExtendingSocial Protection in Health ThroughCommunity Based Health Organizations.ILO-Universitas, Geneva.
ILO (2002a), International Labor Organiza-tion, “Key Indicators of Labour Market2001–2002”, Geneva.
International Monetary Fund (2002). Actionsto Strengthen the Tracking of Poverty-Reducing Public Spending in HighlyIndebted Poor Countries (HIPCs). Inter-national Monetary Fund, Washington,D.C.
Joint United Nations Program on HIV/AIDS(2002). Fact Sheet: Sub-Saharan Africa.Barcelona.
Jutting, Johannes, The Impact of Health Insur-ance on the Access to Health Care andFinancial Protection in Rural Areas ofDeveloping Countries: The Example ofSenegal, Center for DevelopmentResearch report, December 2001.
Knippenberg R., Soucat A., Vanlerberghe W.,et al., “Marginal budgeting for bottle-necks: a tool for performance-based plan-ning of health and nutrition services forachieving the millennium development
goals”, Concept Note, Unicef/WorldBank/WHO, 2003
Konde-Lule, Joseph, and Okello, David.(1998). User Fees in Health Units inUganda: Implementation, Impact andScope. Bethesda, MD: Partnership forHealth Reform Project, Abt Associates.
Kraushaar, Daniel (1997, February) The KenyaNational Hospital Insurance Fund: WhatCan We Learn from Thirty Years’ Experi-ence?, REDSO/BASICS consultant report,February 1997.
Kihombo, Aggrey (2002, October) Communi-ty Health Insurance in Tanzania, Enroll-ment Determinants: The Case of KilosaDistrict, Dissertation to be submitted tothe Heller School of Social Policy andManagement of Brandeis University,DRAFT.
Kumaranayake Lilani et al. (2000) « How docountries regulate the health sector? Evi-dence form Tanzania and Zimbabe”,Health Policy and Planning; 15(4):357–367, 2000.
L’Intelligent, No. 2151, April 1–7, 2002, p. 48.Marchant, Tanya, Joanna Armstrong Schellen-
berg, Tabitha Edgar, Rose Nathan, SalimAbdulla, Oscar Mukasa, Hadji Mponda,Christian Lengeler. (2002, February)“Socially Marketed Insecticide-TreatedNets Improve Malaria and Anaemia inPregnancy in Southern Tanzania”, Tropi-cal Medicine and International Health,Volume 7, Number 2, pp. 149–158.
Marek, Tonia, Issakha Diallo, Biram Ndiayeand Jean Rakotosalama. (1999) “Success-ful Contracting of Prevention Services:Fighting Malnutrition in Senegal andMadagasgar”, Health Policy and Plan-ning; 14(4): 382–389.
Marek, Tonia, O’Farrell Catherine, YamamotoChiaki, Zable Ilyse. “Snapshot of Trendsand Opportunities in Public–Private Part-nerships for Health Service Delivery inAfrica,” to be published in 2004. WorldBank, Washington, D.C.
Bibliography 53
Marek, Tonia and Yamamoto Chiaki. “PrivateHealth Policy v. Regulatory Options forPrivate Participation,” Viewpoint NoteNo. 264, June 2003. The World Bank,Washington, D.C.
Marsden, Andrew (2002, January) Cry for theWorld, Kenya: Logistics and InformationTechnology Assessment, report for theSEAM (Strategies for Enhancing Accessto Essential Medicines) Project, managedby Management Sciences for Health.
Matsiko, Augustine, Elioda Tumwesigye, andCharles Rwabukwari. (2001, April)Assessing Health Pre-payment Schemes inUganda, Health Planning Department,Ministry of Health, Kampala, Uganda,supported by the Delivery of ImprovesServices (DISH) project and the WorldHealth Organization.
McLaughlin, Julie. (2000, August) The Evolu-tion of the Sector-Wide Approach(SWAPs) and Explaining the Correlationbetween SWAps and Reform Initiatives-Background. Note for the World BankInstitute Core Course on Population andReproductive Health and Health SectorReform, Washington, DC.
McLaughlin, Julie. (2004) Improving Health,Nutrition and Population Outcomes forthe Poor: The Role of the World Bank inSub-Saharan Africa. Chapter Five: Sus-tainable Financing for Health, Nutritionand Population Interventions. PendingPublication, World Bank Africa Region,Washington, DC.
Mills, Anne (1997). “Contractual Relation-ships Between Government and the Com-mercial Private Sector in DevelopingCountries”, in Private Health Providersin Developing Countries: Serving thePublic Interest, ed. Sara Bennett, BarbaraMcPake, and Anne Mills, Zed Books:London and New Jersey, p. 189–213.
Ministry of Health (2001). IMCI Multi-Coun-try Evaluation Study, Uganda.
Ministry of Health and Child Welfare Harare,Zimbabwe (1997, December). NationalHealth Strategy for Zimbabwe 1997-2007.
Mudyarabikwa, Oliver (2000). An examina-tion of Public Sector subsidies o the Pri-vate Health Sector: A Zimbabwe CaseStudy. Equinet Policy Series No. 8.
Musau, Stephen N., (1999, August) Communi-ty-Based Health Insurance: Experiencesand Lessons Learned from East andSouthern Africa, Partnerships for HealthReform, Technical Report No. 34.
Mwesigye, Frederick (1999). Priority ServiceProvision Under Decentralization: A CaseStudy of Maternal and Child Health Carein Uganda. Bethesda, MD: Partnershipfor Health Reform Project, Abt Associ-ates.
ESA National Health Accounts, 2000. Nation-al Health Accounts in Eastern and South-ern Africa: a comparative analysis, ESANHA Country Teams, 2000.
Naimoli Joseph. (2003) “Benchmarking in thehealth sector: a tool for improving WorldBank operations,” May 3, 2003. TheWorld Bank
Ndegwa Stephen and Levy Brian, June 2003,“The politics of decentralization in Africa,a Comparative Analysis”, World Bank.
Nyonator, Frank and Kutzin, Joseph (2000)Financement des systemes de sante dansles pays a faible revenue d’Afrique etd’Asie. Presented to CERDI (Centre d’E-tudes et de Recherches sur le Developpe-ment international), France.
Palmer Natasha et al. (2001) A new face forprivate providers in developing countries:what implications for public health? Bul-leting of the WHO, 2003, 81 (4) quotingCornell et al. “National Health Accounts— The Private Sector Report”. TechnicalReport, Health Economics Unit, Universi-ty of Cape Town, 2001.
Pearson, Mark (2002). Allocating publicresources for health: developing pro-poor
54 Resource Allocation and Purchasing in Africa
approaches. DFID Health SystemsResource Center, London.
Peters, David (1998). The sector-wideapproach in health: What is it? Where isit leading? World Bank, Washington,D.C.
Picazo, Oscar (2002) “Better health outcomesfrom limited resources: focusing on prior-ity services in Malawi”, Africa RegionHuman Development Working PaperSeries, The World Bank, April 2002
Preker, Alexander; Baeza, Christian; Jakab,Melitta and Langenbrunner, Jack (2002).Resource Allocation and Purchasing(RAP) Arrangements that Benefit thePoor and Excluded Groups. World Bank,Washington, DC.
Preker, Alexander, Guy Carrin, David Dror,Melitta Jakab, William Hsiao, DynaArhin-Tenkorang (2001, August) HealthCare Financing for Rural and Low-Income Populations: The Role of Com-munities in Resource Mobilization andRisk Sharing, Commission on Macroeco-nomics and Health, August 2001.
Quigley, Karen. (1994) Technical Assistance inProvider Contracting and Provider Rela-tions in Managed Care Health Plans, tripreport for the Kenya Health Care Financ-ing Project, USAID.
Quigley, Karen. (1997) Zimbabwe: NewHealth Care Models in a DevelopingCountry,
Schneider Pia, Francois Diop, Daniel Maceira,and Damascene Butera (2001, March)Utilization, Cost, and Financing of Dis-trict Health Services in Rwanda, Partner-ships for Health Reform Technical ReportNo. 61.
Schneider et al. (2000). Rwanda NationalHealth Accounts 1998. Bethesda, MD:Partnership for Health Reform Project,Abt Associates.
Schneider Pia and Francois Diop. (2001a,May) Synopsis of Results in the Impact ofCommunity-Based Health Insurance
(CBHI) on Financial Accessibility toHealth Care in Rwanda, Partnerships forHealth Reform Technical Paper.
Schwabe, Christopher et al. (2003, May)“Revue des dépenses du secteur de lasanté en Guinée”, Medical Care Develop-ment International, Washington, D.C.
Shaw, Paul and Griffin, Charles (1995).Financing Health Care in Sub-SaharanAfrica through User Fees and Insurance.World Bank, Washington, D.C.
Shaw, R. Paul. (2002, August) “Tanzania’sCommunity Health fund: Prepayment asan Alternative to User Fees”, World BankInstitute, Flagship On-Line Journal onHealth Sector Reform and SustainableFinancing.
Shirima, R.M. (1997) Community HealthFund in Tanzania One Year PretestingExperience in Igunga, paper presented tothe Nairobi Regional Seminar for HealthFinancing.
Soucat, Agnes (mars 2004). Le secteur de laSanté au Tchad: Analyse et Perspectivedans le Cadre de la Stratégie de Réductionde la Pauvreté. World Bank, WashingtonD.C.
Tashobya C.K., Chao S., Nabyonga J.,Kadama P.Y., Nguyen S. “The impact ofabolition of user fees on the demand foran supply of health care in Uganda”,paper presented at the InternationalHealth Economics Association 4th WorldCongress, San Francisco, June 2003.
Uzochukwu Benjamin, Onwujekwe Obinna,Akpala Cyril, “Effect of the Bamako Ini-tiative drug revolving fund on availabilityand rational use of essential drugs in pri-mary health care facilities in south-eastNigeria”, Health Policy and Planning,17(4), 2002.
Wagstaff Adam. (2002, October) HealthSpending and the MDGs: the case ofunder-five mortality.
Walford, Veronica and Sebastian OlikiraBaine. (1997, September) Review of Kisi-
Bibliography 55
izi Hospital Health Society, Ministry ofHealth, government of Uganda andDepartment of International Develop-ment, United Kingdom.
Waters, Hugh, Laurel Hatt, and Henrik Axels-son (2002, June) Working with the Pri-vate Sector for Child Health, HNP Dis-cussion Paper, The World Bank, June2002.
World Bank (1993). World development report1993 — investing in health. New York:Oxford University Press.
World Bank 1993a. Better Health in Africa,World Bank, 1993
World Bank. (2001, June) Eritrea Health Sec-tor Note, June 2001. Washington, D.C.
World Bank Ghana Project Appraisal Document(PAD) for Second Health Program SupportProject (2002), by Francois Decaillet.
World Bank (2002). World Development Indi-cators 2002. World Bank, WashingtonD.C.
World Bank (2002a). Multi-Country Reportsby HNP Indicators on Socio-EconomicInequalities. World Bank, Washington,D.C.
World Bank (2002b). World Bank PortfolioIndicators. World Bank, Washington,D.C.
World Bank (2002d). World Bank OperationDatabase. World Bank, Washington, D.C.
World Bank (2003) World DevelopmentReport 2003. World Bank, Washington,DC. p. 94.
World Bank (2003b). Partnership within thepublic sector to achieve health objectives,World Bank, Washington, D.C., March2003)
World Bank (2004) World DevelopmentReport 2004. World Bank, Washington,DC.
World Health Organization (2000). WorldHealth Report 2000 (Statistical Annex).World Health Organization, Geneva.
World Health Organization (2002a). Report ofthe Commission of Macroeconomics andHealth (page 3, reference 3) (Add)
World Health Organization (2002b) TheWorld Health Report 2002, Annex 5:Selected National Health Accounts indi-cators for all Member States, estimatesfor 1995 to 2000. Geneva
World Health Organization (2002c) — WorldHealth Report Annex 5: Selected NationalHealth Accounts indicators for all Mem-ber States, estimates for 1995 to 2000
Xiao Ye and Sudharshan Canagarajah. (2002,June) “Efficiency of public expendituredistribution and beyond: a report onGhana’s 2000 public expenditure trackingsurvey in the sectors of primary healthand education”, Africa Region WorkingPaper Series No. 31.