Embed Size (px)
Citation preview
House of Commons
Treasury Committee
Household finances: income, saving and debt
Nineteenth Report of Session 2017–19
Report, together with formal minutes relating to the report
Ordered by the House of Commons to be printed 18 July 2018
HC 565Published on 26 July 2018
by authority of the House of Commons
The Treasury Committee
The Treasury Committee is appointed by the House of Commons to examine the expenditure, administration, and policy of HM Treasury, HM Revenue and Customs and associated public bodies
Current membership
Nicky Morgan MP (Conservative, Loughborough) (Chair)
Rushanara Ali MP (Labour, Bethnal Green and Bow)
Mr Simon Clarke MP (Conservative, Middlesbrough South and East Cleveland)
Charlie Elphicke MP (Independent, Dover)
Stephen Hammond MP (Conservative, Wimbledon)
Stewart Hosie MP (Scottish National Party, Dundee East)
Mr Alister Jack MP (Conservative, Dumfries and Galloway)
Alison McGovern MP (Labour, Wirral South)
Catherine McKinnell MP (Labour, Newcastle upon Tyne North)
John Mann MP (Labour, Bassetlaw)
Wes Streeting MP (Labour, Ilford North)
Powers
The committee is one of the departmental select committees, the powers of which are set out in House of Commons Standing Orders, principally in SO No. 152. These are available on the internet via www.parliament.uk.
Publication
Committee reports are published on the Committee’s website at www.parliament.uk/treascom and in print by Order of the House.
Evidence relating to this report is published on the inquiry publications page of the Committee’s website.
Committee staff
The current staff of the Committee are Sarah Rees (Clerk), Peter Stam (Second Clerk), Gavin Thompson, Marcus Wilton and Dan Lee (Senior Economists), Adam Wales (Chief Policy Adviser), Sarah Crandell (Senior Committee Assistant), Nick Berry (Committee Support Assistant), Matt Panteli (Senior Media and Policy Officer), Anne Stark (on secondment from HM Revenue & Customs), Tom Ludlow (on secondment from the Bank of England), Carolyn Draper (on secondment from the Financial Conduct Authority), and Mei Jie Wang (on secondment from the Prudential Regulation Authority).
Contacts
All correspondence should be addressed to the Clerk of the Treasury Committee, House of Commons, London SW1A 0AA. The telephone number for general enquiries is 020 7219 5769; the Committee’s email address is [email protected].
1 Household financess income, saving and debt
ContentsIntroduction 3
1 Background 4
A slowdown in household income growth 4
The “new normal”s productivity and interest rates 5
Trends in inter-generational wealth and home ownership 6
Conclusion 7
2 Overall levels of household saving and debt 8
The flow of income into savings (the household saving ratio) 8
Overall levels of household debt 10
The balance of responsibility between regulators and Government 12
3 Helping over-indebted households 14
The scale and incidence of over-indebtedness 14
Non-credit debts, and arrears to government and local authorities 16
Remediess Regulating high-cost credit 18
Remediess easing the burden of over-indebtedness 21
Remediess improving the availability of lower-cost credit 23
4 Saving for a rainy day 26
Incentivising cash saving 26
“Sidecar” savings 28
5 Saving for retirement 30
The UK savings gap 30
Tax relief on pensions 32
The Lifetime ISA 36
Increasing savings under automatic enrolment—auto-escalation and self-employment 38
The state pension triple lock 40
6 Planning for retirement after pension freedoms 41
Advice, guidance and consumer engagement 41
Default options and consumer protection 44
Annuities and longevity risk 46

7 Conclusions and recommendations 48
Formal minutes 54
Witnesses 55
Published written evidence 56
List of Reports from the Committee during the current Parliament 58
3 Household financess income, saving and debt
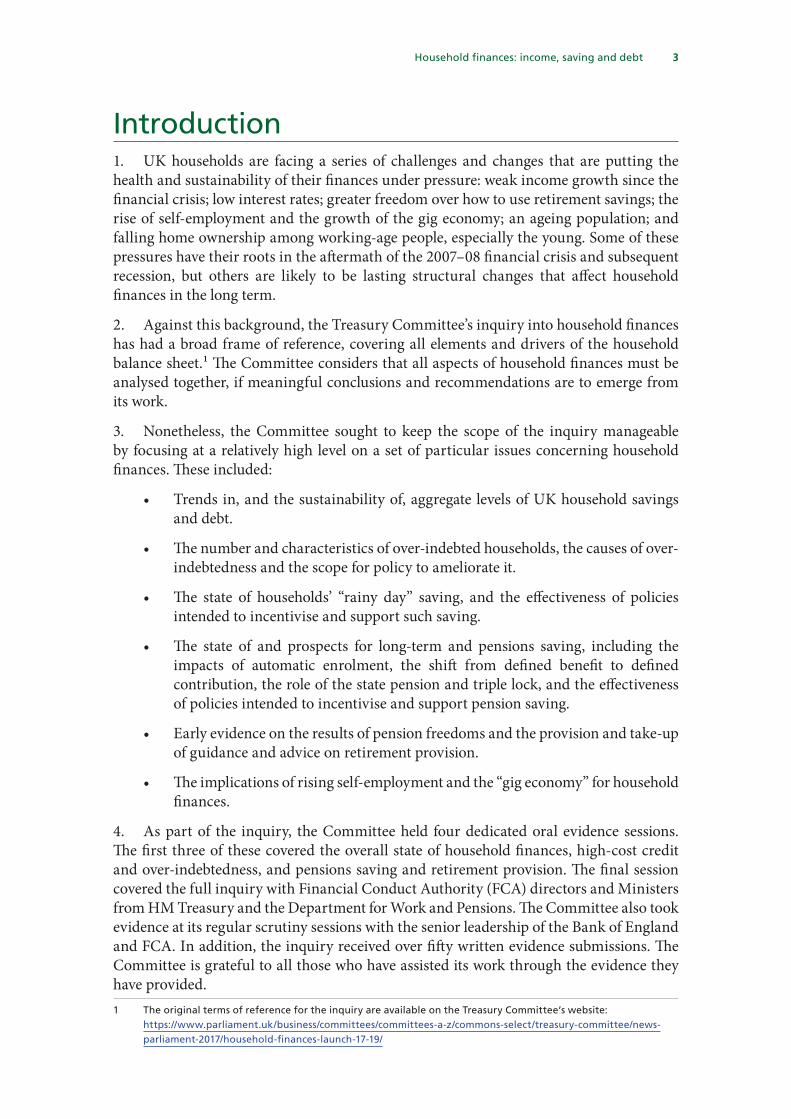
Introduction1. UK households are facing a series of challenges and changes that are putting the health and sustainability of their finances under pressure: weak income growth since the financial crisis; low interest rates; greater freedom over how to use retirement savings; the rise of self-employment and the growth of the gig economy; an ageing population; and falling home ownership among working-age people, especially the young. Some of these pressures have their roots in the aftermath of the 2007–08 financial crisis and subsequent recession, but others are likely to be lasting structural changes that affect household finances in the long term.
2. Against this background, the Treasury Committee’s inquiry into household finances has had a broad frame of reference, covering all elements and drivers of the household balance sheet.1 The Committee considers that all aspects of household finances must be analysed together, if meaningful conclusions and recommendations are to emerge from its work.
3. Nonetheless, the Committee sought to keep the scope of the inquiry manageable by focusing at a relatively high level on a set of particular issues concerning household finances. These included:
• Trends in, and the sustainability of, aggregate levels of UK household savings and debt.
• The number and characteristics of over-indebted households, the causes of over-indebtedness and the scope for policy to ameliorate it.
• The state of households’ “rainy day” saving, and the effectiveness of policies intended to incentivise and support such saving.
• The state of and prospects for long-term and pensions saving, including the impacts of automatic enrolment, the shift from defined benefit to defined contribution, the role of the state pension and triple lock, and the effectiveness of policies intended to incentivise and support pension saving.
• Early evidence on the results of pension freedoms and the provision and take-up of guidance and advice on retirement provision.
• The implications of rising self-employment and the “gig economy” for household finances.
4. As part of the inquiry, the Committee held four dedicated oral evidence sessions. The first three of these covered the overall state of household finances, high-cost credit and over-indebtedness, and pensions saving and retirement provision. The final session covered the full inquiry with Financial Conduct Authority (FCA) directors and Ministers from HM Treasury and the Department for Work and Pensions. The Committee also took evidence at its regular scrutiny sessions with the senior leadership of the Bank of England and FCA. In addition, the inquiry received over fifty written evidence submissions. The Committee is grateful to all those who have assisted its work through the evidence they have provided.1 The original terms of reference for the inquiry are available on the Treasury Committee’s websites
httpss//www.parliament.uk/business/committees/committees-a-z/commons-select/treasury-committee/news-parliament-2017/household-finances-launch-17-19/
Household financess income, saving and debt 4
1 Background5. In evidence to the Committee, Andrew Bailey, the Chief Executive of the Financial Conduct Authority (FCA), set out some of the challenges to UK household finances that form the motivation and background for this inquiry:2
If we put Brexit to one side, heroically, this is the big issue [we face]: what I broadly call the lifecycle model of borrowing, saving and pension drawdown. It is a very serious issue. What you have in the mix here is a combination of lower retirement saving rates, higher indebtedness at a younger age… people going into the housing market at a later age and therefore having mortgages to a later age, and a prolonged period of low real interest rates.
6. These challenges are linked to long-term structural changes in the UK’s economy and demography. For the most part, these changes lie outside the scope of this report’s terms of reference, but they form an important backdrop to understanding current and future pressures on household finances. Some of the changes that have a particular bearing are outlined below.
A slowdown in household income growth
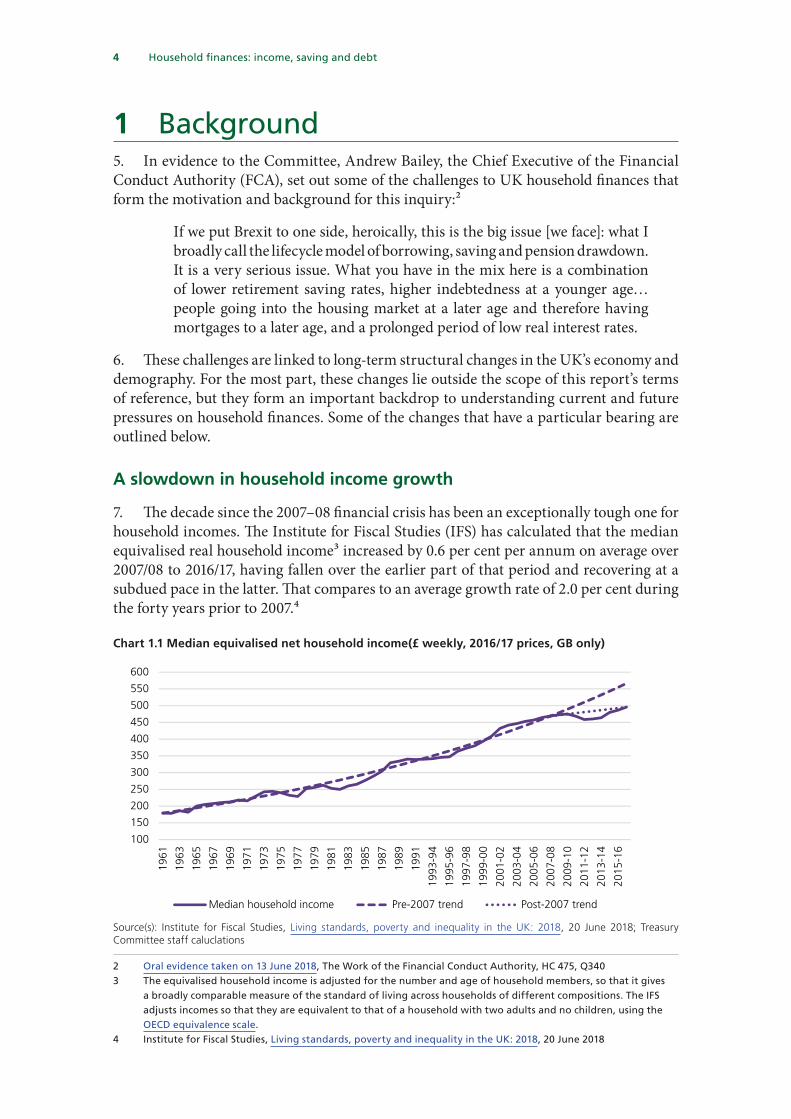
7. The decade since the 2007–08 financial crisis has been an exceptionally tough one for household incomes. The Institute for Fiscal Studies (IFS) has calculated that the median equivalised real household income3 increased by 0.6 per cent per annum on average over 2007/08 to 2016/17, having fallen over the earlier part of that period and recovering at a subdued pace in the latter. That compares to an average growth rate of 2.0 per cent during the forty years prior to 2007.4
Chart 1.1 Median equivalised net household income(£ weekly, 2016/17 prices, GB only)
IN CONFIDENCE – FOR COMMITTEE USE 6
Source(s): Institute for Fiscal Studies, Living standards, poverty and inequality in the UK: 2018, 20 June 2018; Treasury Committee staff caluclations
Thedifferentcomponentsofhouseholdincomehaveevolvedindifferentwayssince the crisis. Wage growth – the most important element for working5households–hasbeenslowerinthelastdecadethanatanypointsincethemid‐19th Century (although there has been a robust recovery in numbersemployed).5 Growth in working age benefits has been roughly zero since2007/08 (they rose in the immediate aftermath of the crisis but fell later,reflecting employment growth and policies of successive governments to10control welfare expenditure), while pensioner benefits and income fromprivatepensionshavebothincreased.Asaresult,thepressuresonhouseholdfinanceshavetendedtodifferacrossdemographics.Forexample,accordingtotheIFS,thegapinincomesbetweenworking‐ageandpensionerhouseholdshasshrunksince2007fromaround20to10percent(andhasdisappeared15entirelyifadjustedforhousingcosts).6
Relatively weak growth in earnings has been one of the most importantinfluencesonhouseholdfinancesinrecentyears.TorstenBell,theDirectoroftheResolutionFoundation,toldtheCommitteethat"[theeffectonincomesof]the earnings squeeze that start to somedegree in themid‐2000s and then20becameveryseverefrom2009to2014…isverybig,anditdominatesalmosteverythingelse."Hewentontosaythat,althoughearningsgrowthmaypickupinthecomingyears,particularlyforthosebenefitingfromminimumwagerises,theincomesofsomehouseholdswouldfacepressurefromtheongoingworking‐agebenefitfreeze:"Nooneisdoingwell,sothemacropictureisnot25an inequalitypicture…But thedifferencefor thenext fouryearsversusthe
5 Mark Carney, The Spectre of Monetarism, Speech at Liverpool John Moores University, 6 December 2016 6 Institute for Fiscal Studies, Living standards, poverty and inequality in the UK: 2018, 20 June 2018
100
150
200
250
300
350
400
450
500
550
600
1961
1963
1965
1967
1969
1971
1973
1975
1977
1979
1981
1983
1985
1987
1989
1991
1993
-94
1995
-96
1997
-98
1999
-00
2001
-02
2003
-04
2005
-06
2007
-08
2009
-10
2011
-12
2013
-14
2015
-16
Chart 1.1 Median equivalised net household income(£ weekly, 2016/17 prices, GB only)
Median household income Pre-2007 trend Post-2007 trend
Source(s): Institute for Fiscal Studies, Living standards, poverty and inequality in the UK: 2018, 20 June 2018; Treasury Committee staff caluclations
2 Oral evidence taken on 13 June 2018, The Work of the Financial Conduct Authority, HC 475, Q3403 The equivalised household income is adjusted for the number and age of household members, so that it gives
a broadly comparable measure of the standard of living across households of different compositions. The IFS adjusts incomes so that they are equivalent to that of a household with two adults and no children, using the OECD equivalence scale.
4 Institute for Fiscal Studies, Living standards, poverty and inequality in the UKs 2018, 20 June 2018
5 Household financess income, saving and debt
8. The different components of household income have evolved in different ways since the crisis. Wage growth–the most important element for working households–has been slower in the last decade than at any point since the mid-19th Century (although there has been a robust recovery in numbers employed).5 Growth in working age benefits has been roughly zero since 2007/08 (they rose in the immediate aftermath of the crisis but fell later, reflecting employment growth and policies of successive governments to control welfare expenditure), while pensioner benefits and income from private pensions have both increased. As a result, the pressures on household finances have tended to differ across demographics. For example, according to the IFS, the gap in incomes between working-age and pensioner households has shrunk since 2007 from around 20 to 10 per cent (and has disappeared entirely if adjusted for housing costs).6
9. Relatively weak growth in earnings has been one of the most important influences on household finances in recent years. Torsten Bell, the Director of the Resolution Foundation, told the Committee that “[the effect on incomes of] the earnings squeeze that start to some degree in the mid-2000s and then became very severe from 2009 to 2014… is very big, and it dominates almost everything else.” He went on to say that, although earnings growth may pick up in the coming years, particularly for those benefiting from minimum wage rises, the incomes of some households would face pressure from the ongoing working-age benefit freeze: “No one is doing well, so the macro picture is not an inequality picture… But the difference for the next four years versus the previous five is that we are moving into more of a skewed thing… because of the benefit freeze.”7
The “new normal”: productivity and interest rates
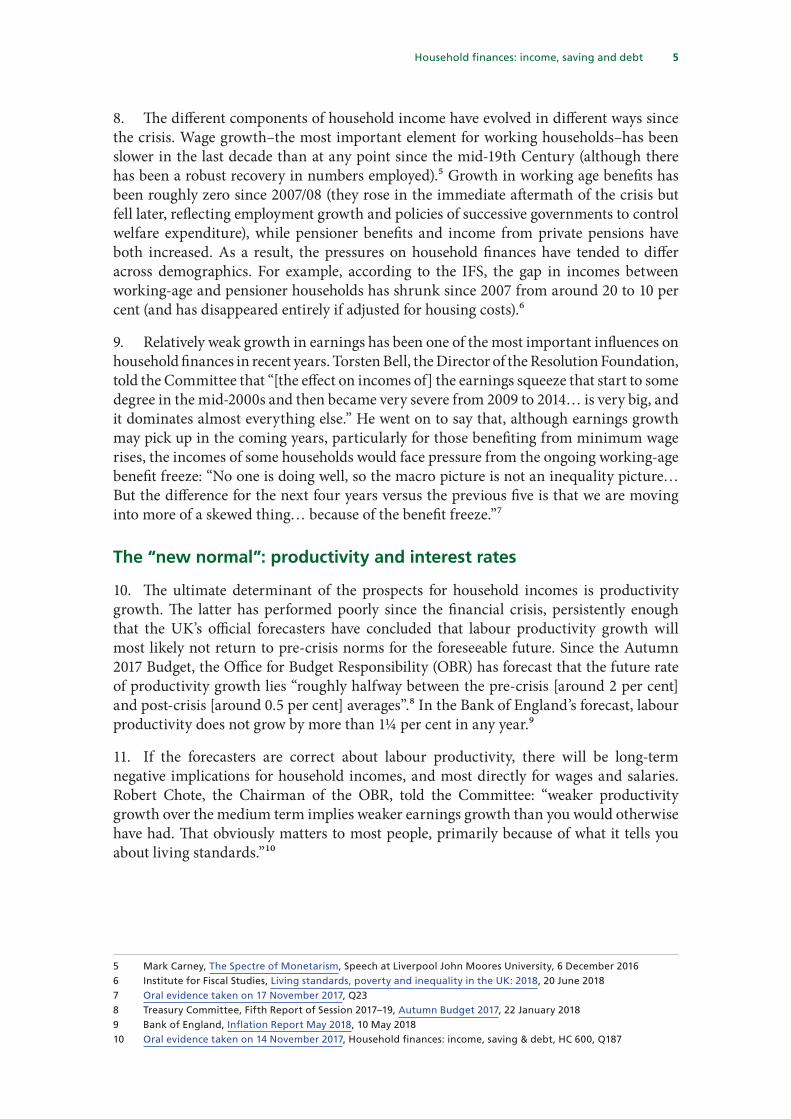
10. The ultimate determinant of the prospects for household incomes is productivity growth. The latter has performed poorly since the financial crisis, persistently enough that the UK’s official forecasters have concluded that labour productivity growth will most likely not return to pre-crisis norms for the foreseeable future. Since the Autumn 2017 Budget, the Office for Budget Responsibility (OBR) has forecast that the future rate of productivity growth lies “roughly halfway between the pre-crisis [around 2 per cent] and post-crisis [around 0.5 per cent] averages”.8 In the Bank of England’s forecast, labour productivity does not grow by more than 1¼ per cent in any year.9
11. If the forecasters are correct about labour productivity, there will be long-term negative implications for household incomes, and most directly for wages and salaries. Robert Chote, the Chairman of the OBR, told the Committee: “weaker productivity growth over the medium term implies weaker earnings growth than you would otherwise have had. That obviously matters to most people, primarily because of what it tells you about living standards.”10
5 Mark Carney, The Spectre of Monetarism, Speech at Liverpool John Moores University, 6 December 20166 Institute for Fiscal Studies, Living standards, poverty and inequality in the UKs 2018, 20 June 20187 Oral evidence taken on 17 November 2017, Q238 Treasury Committee, Fifth Report of Session 2017–19, Autumn Budget 2017, 22 January 20189 Bank of England, Inflation Report May 2018, 10 May 201810 Oral evidence taken on 14 November 2017, Household financess income, saving & debt, HC 600, Q187
Household financess income, saving and debt 6
Chart 1.2 UK productivity (output per hour, 2007=100)
IN CONFIDENCE – FOR COMMITTEE USE 7
previousfiveisthatwearemovingintomoreofaskewedthing…becauseofthebenefitfreeze."7
The "new normal": productivity and interest rates
The ultimate determinant of the prospects for household incomes isproductivitygrowth.Thelatterhasperformedpoorlysincethefinancialcrisis,5persistently enough that the UK's official forecasters have concluded thatlabourproductivitygrowthwillmostlikelynotreturntopre‐crisisnormsfortheforeseeablefuture.SincetheAutumn2017Budget,theOfficeforBudgetResponsibility(OBR)hasforecastthatthefuturerateofproductivitygrowthlies "roughly halfwaybetween thepre‐crisis [around2per cent] andpost‐10crisis [around 0.5 per cent] averages".8 In the Bank of England's forecast,labourproductivitydoesnotgrowbymorethan1¼percentinanyyear.9
Sources: Office for National Statistics, Labour productivity time series, 6 July 2018; Office for Budget Responsibility, Economic and fiscal outlook March 2018, 13 March 2018; and Treasury 15Committee staff calculations
Iftheforecastersarecorrectaboutlabourproductivity,therewillbelong‐termnegativeimplicationsforhouseholdincomes,andmostdirectlyforwagesandsalaries.RobertChote,theChairmanoftheOBR,toldtheCommittee:"weakerproductivitygrowthoverthemediumtermimpliesweakerearningsgrowth20
7 Oral evidence taken on 17 November 2017, Q23 8 Treasury Committee, Fifth Report of Session 2017‐19, Autumn Budget 2017, 22 January 2018 9 Bank of England, Inflation Report May 2018, 10 May 2018
0
20
40
60
80
100
120
140
160
180
20019
7119
7319
7519
7719
7919
8119
8319
8519
8719
8919
9119
9319
9519
9719
9920
0120
0320
0520
0720
0920
1120
1320
1520
1720
1920
2120
2320
2520
2720
2920
31
Chart 1.2 UK productivity (output per hour, 2007=100)
Outturn Pre-2007 trend OBR forecast (March 2018)
Sources: Office for National Statistics, Labour productivity time series, 6 July 2018; Office for Budget Responsibility, Economic and fiscal outlook March 2018, 13 March 2018; and Treasury Committee staff calculations
12. Another aspect of the changed economic outlook that has direct implications for household finances is lower real and nominal interest rates. Bank rate, the nominal interest rate set by the Bank of England’s Monetary Policy Committee (MPC), has yet to move above the record low of 0.5 per cent it reached in March 2009, and the MPC has repeatedly issued unanimously-agreed guidance “that any increases in Bank Rate would be expected to be at a gradual pace and to a limited extent”.11 Michael Saunders, a current MPC member, has indicated recently that he expects Bank rate to rise to just 2 per cent over the next few years.12 The average Bank rate in the ten years leading up to the financial crisis was close to 5 per cent.
13. Lower interest rates make mortgages and credit cheaper for households. However, for long-term saving, they imply that more income needs to be put aside, or a greater share needs to be allocated, to higher-reward, higher-risk investments, in order to obtain a given level of return. In the words of the Financial Services Consumer Panel in written evidence to the Committee, “Saving [needs] to be seen in the context of a seemingly permanent low interest rate environment… It is difficult and unrewarding to save.”13
Trends in inter-generational wealth and home ownership
14. The rate of home ownership in the UK has fallen, and the decline is concentrated among younger households. In mid-2017, 51 per cent of households were owner-occupiers (with or without mortages), from a peak of 58 per cent during 2002. Home-ownership rates have fallen among all age groups, except those over the age of 65, but most steeply for those aged 24–35 (from around half in 1990 to a quarter in 2017).14
11 For examples Bank of England, Monetary Policy Summary and minutes of the Monetary Policy Committee meeting ending on 20 June 2018, 21 June 2018
12 Michael Saunders, ‘Why raise rates? Why “Limited and Gradual”?’, Speech at the Fraser of Allander Institute, 20 April 2018
13 Evidence submitted by Financial Services Consumer Panel (HHF0023)14 Resolution Foundation, Home ownership in the UK, 22 September 2017. The share of all households that
own their home outright (currently 27 per cent) has continued to increase and surpassed the share of those with mortgages (currently 24 per cent) in 2013. Adults living in their parents’ homes are counted as separate households in these figures.
7 Household financess income, saving and debt
15. This shift in the rate of home ownership reflects a broader inter-generational shift in overall household wealth. A Resolution Foundation report has found that each generation born since 1956–60 currently has lower median net wealth than the preceding five-year cohort had at the same age. The shortfall is greater for those born more recently, with those born in 1986–90 having 84 per cent less wealth than those born in 1981–85 had at the same age.15 Torsten Bell told the Committee that the “dominant problem” behind the shortfall in savings for the youngest cohort was “that their wages are no higher today… than people born 15 years before them.”16
16. The impact of these trends in wealth and home ownership on lifetime household finances will unfold over decades and could be profound. If today’s younger households continue to experience a reduced rate of home ownership through their lives, more of them will need to finance rent payments out of their retirement savings. Ashwin Kumar, Chief Economist at the Joseph Rowntree Foundation, told the Committee that “there is probably 100 pounds a week difference in your housing cost if you are a renter or an owner-occupier in retirement” and Torsten Bell said “we should start worrying about how we provide that security to people who are going to be renting… think of the housing benefit bill”. In this context, the role of inheritances and parental gifts could have an amplified impact on the intra-generational distribution of wealth. An aging population is further complicating the role of inheritance by delaying the point in their lives at which people typically receive bequests. Mr Kumar said “I am particularly concerned about the idea of reinforcing inequalities through inheritances… I do not think we are even at the start of understanding how those interactions are going to play out.”17
17. Housing and incomes are only some of the pressures on inter-generational household finances. Michael Johnson, a research fellow at the Centre for Policy Studies, expanded on some of the other pressures facing younger generations:
… Generation Y18 have burdens the previous generations have not had. Currently there is around £101 billion or £102 billion of student debt, for example. Although it is income-contingent, it is not an experience that many of us in this room have had, along with all the other challenges that Generation Y has: no [defined benefit] pensions, fragmented careers etc.19
Conclusion
18. Household incomes were hit hard by the financial crisis and its aftermath. But structural changes to the economy—including permanently weaker productivity growth, lower rates of home ownership, lower real interest rates and an ageing population—mean that, for many households, the pressure on their finances will persist. Left unchecked, these pressures are also likely to exacerbate inter- and intra-generational differences between households.
15 Resolution Foundation, The generation of wealths asset accumulation across and within cohorts, 20 June 201716 Oral evidence taken on 14 November 2017, Household financess income, saving & debt, HC 600, Q817 Ibid, Q14, Q17, Q19, Q20, Q5418 Born in the 1980s and 1990s—Generation Y is broadly synonymous with Millennials19 Ibid, Q54
Household financess income, saving and debt 8
2 Overall levels of household saving and debt
The flow of income into savings (the household saving ratio)
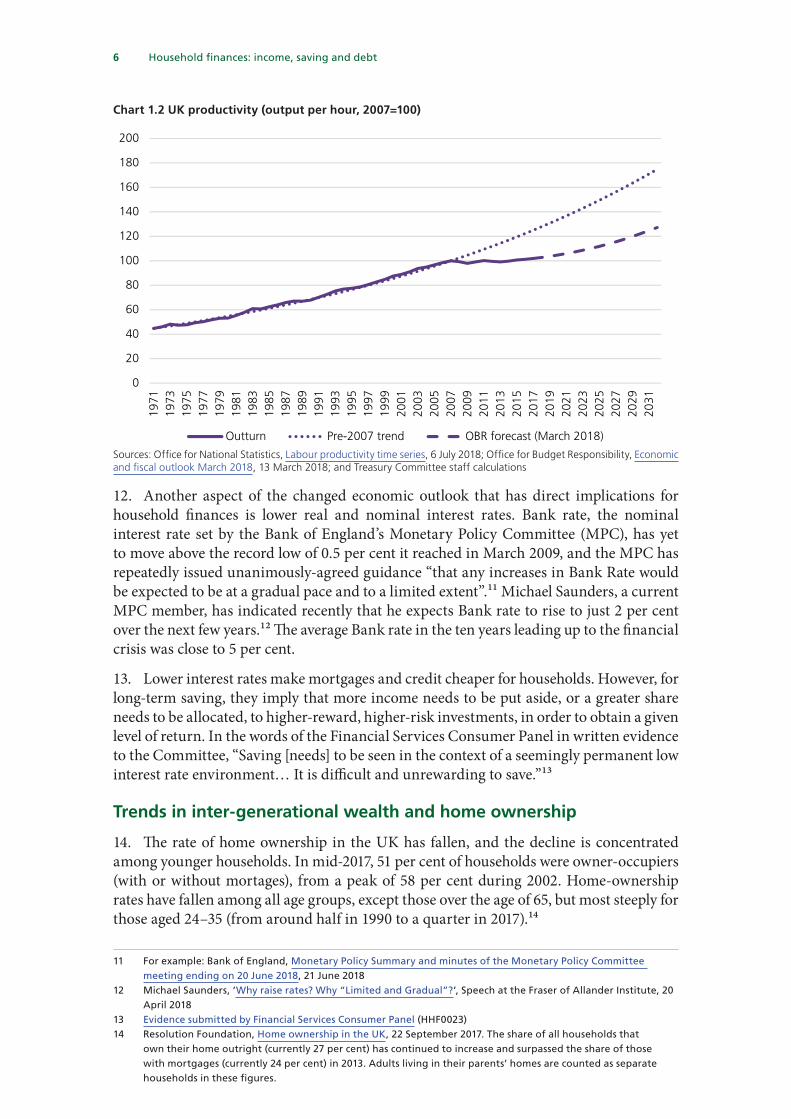
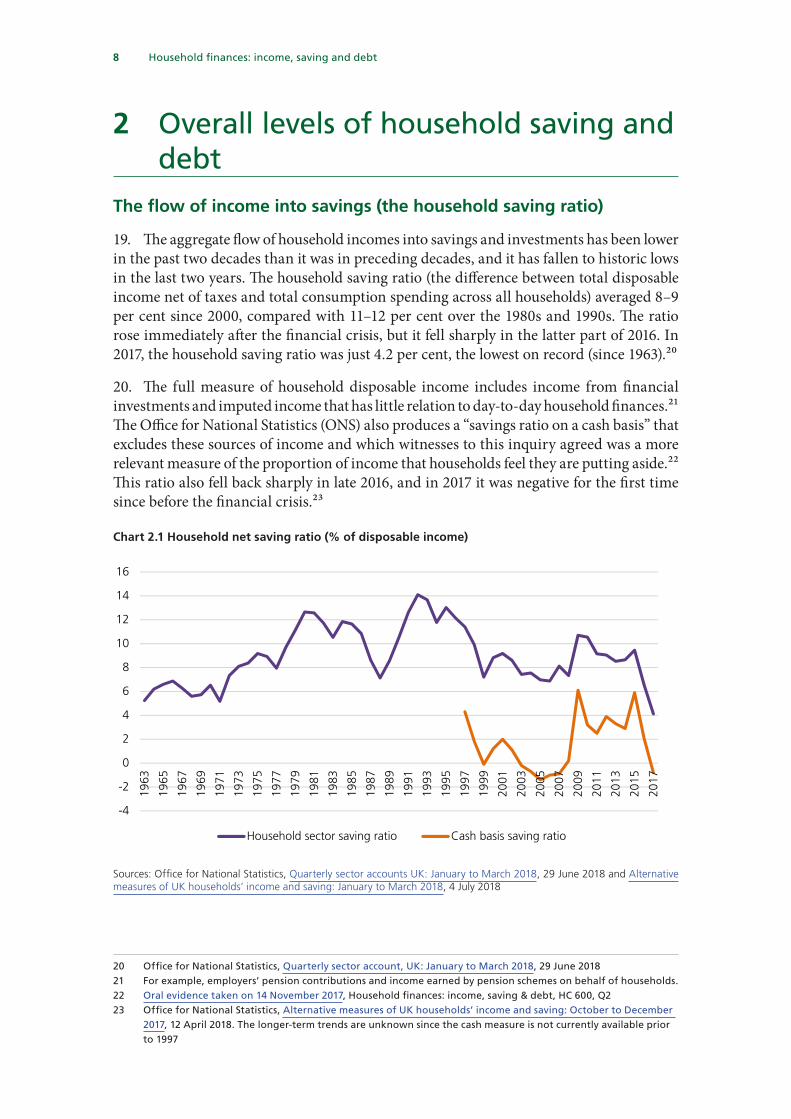
19. The aggregate flow of household incomes into savings and investments has been lower in the past two decades than it was in preceding decades, and it has fallen to historic lows in the last two years. The household saving ratio (the difference between total disposable income net of taxes and total consumption spending across all households) averaged 8–9 per cent since 2000, compared with 11–12 per cent over the 1980s and 1990s. The ratio rose immediately after the financial crisis, but it fell sharply in the latter part of 2016. In 2017, the household saving ratio was just 4.2 per cent, the lowest on record (since 1963).20
20. The full measure of household disposable income includes income from financial investments and imputed income that has little relation to day-to-day household finances.21 The Office for National Statistics (ONS) also produces a “savings ratio on a cash basis” that excludes these sources of income and which witnesses to this inquiry agreed was a more relevant measure of the proportion of income that households feel they are putting aside.22 This ratio also fell back sharply in late 2016, and in 2017 it was negative for the first time since before the financial crisis.23
Chart 2.1 Household net saving ratio (% of disposable income)
IN CONFIDENCE – FOR COMMITTEE USE 12
Sources: Office for National Statistics, Quarterly sector accounts UK: January to March 2018, 29 June 2018 and Alternative measures of UK households' income and saving: January to March 2018, 4 July 2018
The long‐term decline in the total saving ratio may reflect an ageing5population,asretireesdrawingdowntheirsavingsaccountforanever‐greatershareofhouseholds.24JohnGlen,theEconomicSecretarytotheTreasurytoldtheCommitteethatthedeclinesince2016mayalsobearesultofimprovedconfidence,since"peopletendtosavemorewhentheeconomyisinaworsestate,becausetheyfeelvulnerableandtheycannotaccesscredit".25Thismay10be a factor, but the Committee has taken evidence that the interruption togrowth in real incomes that occurred over 2016 to 2017, while consumerspendingslowedbutcontinuedtogrow,wasagreater influence inpushingdownsavingrates.26
Thesavingratioisamacroeconomicresidualthatcanbehighlyvolatilefrom15quarter to quarter, so short‐term movements in it must be interpretedcautiously.27 Nonetheless, the prospect of the saving ratio remaining athistoricallylowlevels,asitdoesinthelatestOfficeforBudgetResponsibility(OBR)andBankofEnglandforecasts28,maybeacauseforconcern.Professor
24 Evidence submitted by the Open University PUFin (HHF0030) 25 Oral evidence taken on 8 May 2018, Household finances: income, saving & debt, HC 600, Q296 26 Oral evidence taken on 22 May 2018, Bank of England Inflation Reports, HC 596, Q162‐163 and Oral
evidence taken on 30 November 2017, The Budget Autumn 2017, Household finances: income, saving & debt, HC 600, Q209‐210
27 Oral evidence taken on 14 November 2017, Household finances: income, saving & debt, HC 600, Q2 28 SOURCES
-4
-2
0
2
4
6
8
10
12
14
16
1963
1965
1967
1969
1971
1973
1975
1977
1979
1981
1983
1985
1987
1989
1991
1993
1995
1997
1999
2001
2003
2005
2007
2009
2011
2013
2015
2017
Chart 2.1 Household net saving ratio (% of disposable income)
Household sector saving ratio Cash basis saving ratio
Sources: Office for National Statistics, Quarterly sector accounts UK: January to March 2018, 29 June 2018 and Alternative measures of UK households’ income and saving: January to March 2018, 4 July 2018
20 Office for National Statistics, Quarterly sector account, UKs January to March 2018, 29 June 201821 For example, employers’ pension contributions and income earned by pension schemes on behalf of households. 22 Oral evidence taken on 14 November 2017, Household financess income, saving & debt, HC 600, Q223 Office for National Statistics, Alternative measures of UK households’ income and savings October to December
2017, 12 April 2018. The longer-term trends are unknown since the cash measure is not currently available prior to 1997
9 Household financess income, saving and debt
21. The long-term decline in the total saving ratio may reflect an ageing population, as retirees drawing down their savings account for an ever-greater share of households.24 John Glen, the Economic Secretary to the Treasury told the Committee that the decline since 2016 may also be a result of improved confidence, since “people tend to save more when the economy is in a worse state, because they feel vulnerable and they cannot access credit”.25 This may be a factor, but the Committee has taken evidence that the interruption to growth in real incomes that occurred over 2016 to 2017, while consumer spending slowed but continued to grow, was a greater influence in pushing down saving rates.26
22. The saving ratio is a macroeconomic residual that can be highly volatile from quarter to quarter, so short-term movements in it must be interpreted cautiously.27 Nonetheless, the prospect of the saving ratio remaining at historically low levels, as it does in the latest Office for Budget Responsibility (OBR) and Bank of England forecasts,28 may be a cause for concern. Professor Sir Charles Bean, a member of the OBR’s Budget Responsibility Committee, told the Committee:
The point that the saving ratio cannot keep on falling is an important one. The only way you can do that is by building up more and more debt and, ultimately, that would be unsustainable for households, so that is the reason for thinking that there is a limit to how far down it can go. Obviously if you have temporary fluctuations in income, you might have shortterm movements in the saving ratio, but you would not expect it to settle at a very low rate.29
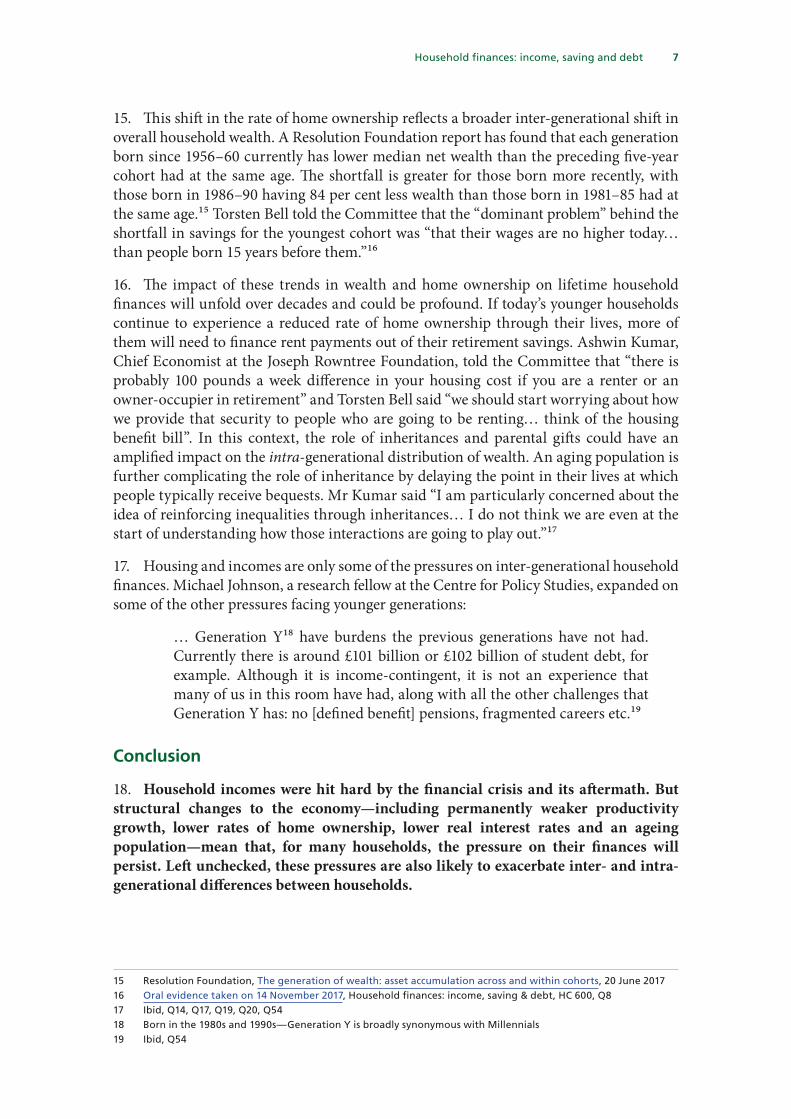
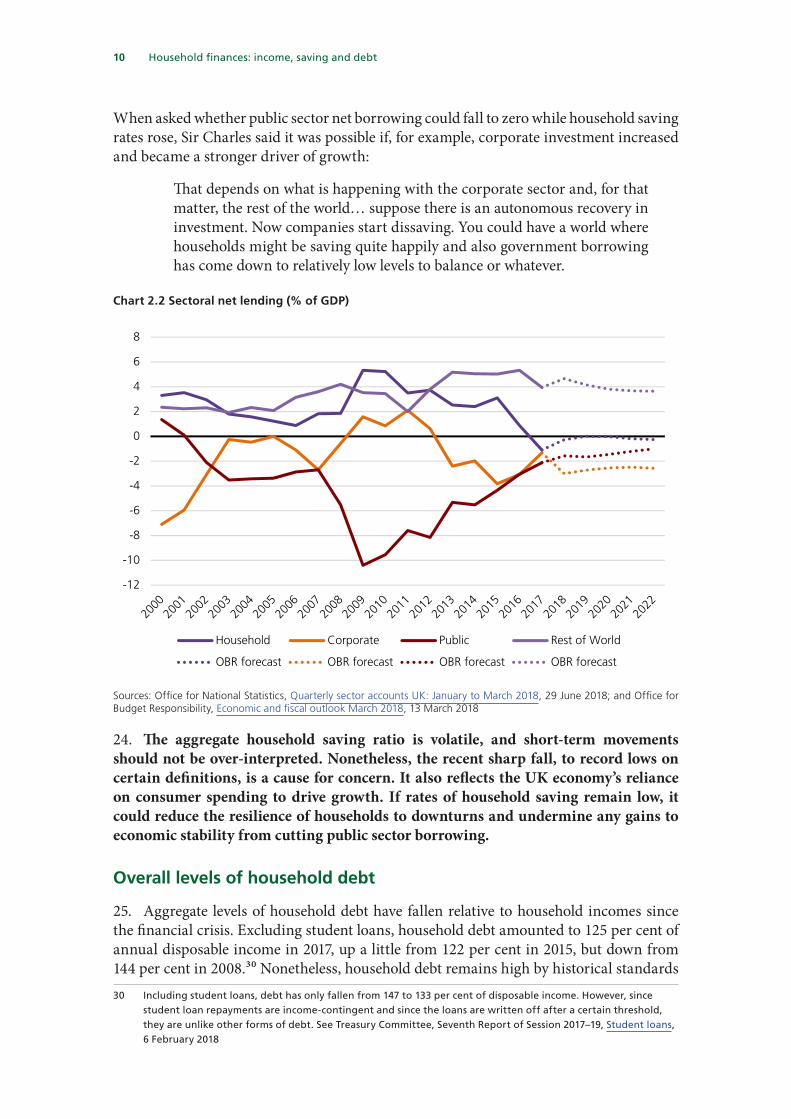
23. Household saving can be combined with household investment to give the household sector’s overall rate of net lending (net saving) to the other sectors of the economy. Across the economy as a whole, sectoral borrowing and saving must balance. If households are to be net lenders, then the combination of government, corporations and the rest of the world must be net borrowers. Sir Charles observed that falls in household saving in recent years has been correlated, to some extent, with falls in government borrowing, although he was unsure about causation:
There certainly is a correlation… [whether it is causal] is the much harder thing to tease out. My story for the last few years would be that consumers retrenched at the time of the financial crisis… with the rise in unemployment and the slowdown in income growth… it stayed high for quite a while and then has been coming down gradually. That is the sort of mirror, at least partially, of what has been happening to government borrowing. As the Government have been borrowing less, households have been saving less. That is the flip.
24 Evidence submitted by the Open University PUFin (HHF0030)25 Oral evidence taken on 8 May 2018, Household financess income, saving & debt, HC 600, Q29626 Oral evidence taken on 22 May 2018, Bank of England Inflation Reports, HC 596, Q162–163 and Oral evidence
taken on 30 November 2017, The Budget Autumn 2017, Household financess income, saving & debt, HC 600, Q209–210
27 Oral evidence taken on 14 November 2017, Household financess income, saving & debt, HC 600, Q228 Economic and fiscal outlook March 2018, 13 March 2018 and Bank of England, Inflation Report May 2018, 10
May 201829 Oral evidence taken on 30 November 2017, The Budget Autumn 2017, Household financess income, saving &
debt, HC 600, Q204
Household financess income, saving and debt 10
When asked whether public sector net borrowing could fall to zero while household saving rates rose, Sir Charles said it was possible if, for example, corporate investment increased and became a stronger driver of growth:
That depends on what is happening with the corporate sector and, for that matter, the rest of the world… suppose there is an autonomous recovery in investment. Now companies start dissaving. You could have a world where households might be saving quite happily and also government borrowing has come down to relatively low levels to balance or whatever.
Chart 2.2 Sectoral net lending (% of GDP)
IN CONFIDENCE – FOR COMMITTEE USE 14
Sources:OfficeforNationalStatistics,QuarterlysectoraccountsUK:JanuarytoMarch2018,29June2018;andOfficeforBudgetResponsibility,EconomicandfiscaloutlookMarch2018,13March2018
The aggregate household saving ratio is volatile, and short‐term5movements should not be over‐interpreted. Nonetheless, the recentsharpfall,torecordlowsoncertaindefinitions,isacauseforconcern.ItalsoreflectstheUKeconomy'srelianceonconsumerspendingtodrivegrowth. If rates of household saving remain low, it could reduce theresilience of households to downturns and undermine any gains to10economicstabilityfromcuttingpublicsectorborrowing.
Overall levels of household debt
Aggregatelevelsofhouseholddebthavefallenrelativetohouseholdincomessincethefinancialcrisis.Excludingstudentloans,householddebtamountedto125percentofannualdisposableincomein2017,upalittlefrom122per15centin2015,butdownfrom144percentin2008.30Nonetheless,householddebtremainshighbyhistoricalstandards(itwasbelow100percentofincomepriorto2002).Theclearmajority(78percentofthetotal)ofhouseholddebtismortgagedebtsecuredondwellings,andthereforerisesinhousepricesareadriverof the long‐termrise indebt levels.Consumercredit isarelatively20smallpartofoverallhouseholddebt(12percent),buthasgrownrapidly in
30 Including student loans, debt has only fallen from 147 to 133 per cent of disposable income. However,
since student loan repayments are income‐contingent and since the loans are written off after a certain threshold, they are unlike other forms of debt. See Treasury Committee, Seventh Report of Session 2017‐19, Student loans, 6 February 2018
-12
-10
-8
-6
-4
-2
0
2
4
6
8
Chart 2.2 Sectoral net lending (% of GDP)
Household Corporate Public Rest of World
OBR forecast OBR forecast OBR forecast OBR forecast
Sources: Office for National Statistics, Quarterly sector accounts UK: January to March 2018, 29 June 2018; and Office for Budget Responsibility, Economic and fiscal outlook March 2018, 13 March 2018
24. The aggregate household saving ratio is volatile, and short-term movements should not be over-interpreted. Nonetheless, the recent sharp fall, to record lows on certain definitions, is a cause for concern. It also reflects the UK economy’s reliance on consumer spending to drive growth. If rates of household saving remain low, it could reduce the resilience of households to downturns and undermine any gains to economic stability from cutting public sector borrowing.
Overall levels of household debt
25. Aggregate levels of household debt have fallen relative to household incomes since the financial crisis. Excluding student loans, household debt amounted to 125 per cent of annual disposable income in 2017, up a little from 122 per cent in 2015, but down from 144 per cent in 2008.30 Nonetheless, household debt remains high by historical standards 30 Including student loans, debt has only fallen from 147 to 133 per cent of disposable income. However, since
student loan repayments are income-contingent and since the loans are written off after a certain threshold, they are unlike other forms of debt. See Treasury Committee, Seventh Report of Session 2017–19, Student loans, 6 February 2018
11 Household financess income, saving and debt
(it was below 100 per cent of income prior to 2002). The clear majority (78 per cent of the total) of household debt is mortgage debt secured on dwellings, and therefore rises in house prices are a driver of the long-term rise in debt levels. Consumer credit is a relatively small part of overall household debt (12 percent), but has grown rapidly in recent years. The pace has eased recently, from a peak of 11 per cent annually in November 2016 to 9 per cent in April 2018.31
26. The Bank of England’s Financial Policy Committee believes that the risk to UK financial stability arising from UK household debt is at a manageable level. The FPC has taken steps to constrain the growth in consumer credit and high income-multiple mortgages in recent years. The Governor told the Committee:
The overall context is that UK households have worked hard. They have paid down a lot of debt. At its trough, they paid down 20 percentage points of debt relative to income, vis-à-vis the peak that came in 2008. There has been some pickup from there, but it is still down 14 percentage points from the peak. The second point is that people have got themselves into work. They have improved their balance sheets. The quality of the borrowers has gone up quite substantially …
The third point is that from a debt service perspective… the burden on the people who are borrowing… is very low. The debt service ratio is about 7.7 per cent. The historic average is about 9 per cent.
With that context, from a Financial Policy Committee perspective, we see [consumer credit] as a pocket of risk. As you note, it has been growing at 10 per cent rates and, as we note in terms of our reviews of the underwriting standards, as I said a moment ago, in our judgment, banks have given too much credit for the improvement in the underlying creditworthiness of those households. We are looking for an adjustment to be made …
Dr Carney also said that the rapid growth in consumer credit in recent years had been inflated by a “statistical anomaly” due to the growth in personal contract purchase (PCP) car finance.32
27. A number of witnesses told the Committee that, in terms of the impact on household finances and harm to households, at present the distribution of debt, and particular types of potentially more damaging debt, were a greater concern than the overall level of debt. Ashwin Kumar, Chief Economist at the Joseph Rowntree Foundation, told the Committee:
… there are higher levels of unsecured debt for people who have higher income. It is not the debt per se; it is the problem debt that is the problem, as it were. It is people who are in arrears, people who are finding their debt a burden. Therefore, the aggregate amount of debt is perhaps not the issue.33
28. Matt Upton, Head of Policy for Consumer and Public Services at Citizens Advice, made the point that “debt with consequences”, such as bills arrears, may not fall under the strict definitions of consumer credit or household debt at all:31 Figures are drawn from staff calculations and Bank of England, Financial Stability Report—June 2018, 27 June
201832 Oral evidence taken on 17 October 2017, The Work of the Bank of England, HC 474, Q40–4233 Oral evidence taken on 14 November 2017, Household financess income, saving & debt, HC 600, Q21
Household financess income, saving and debt 12
… people can get fixated on this £200 billion to £210 billion figure … One thing that is worth focusing on is those debts that, for obvious reasons, have more significant consequences. Those would be priority household debts around rent arrears that can involve you being kicked out of your home, energy debts that can mean you being cut off, or debts to, say, your council that can involve imprisonment.
One of the real dangers is that a lot of those debts, the non-consumer-credit debts, are not captured as part of this £200 billion figure. The Bank of England and other bodies are very clear on the size of this consumer credit bubble, but absolutely no attention is being paid to these much more damaging debts, which we know run into the billions and billions of pounds and have those more severe consequences. There is a sense of someone needing to grip the overall picture, rather than just obsessing about consumer credit.
29. In identifying where debt may cause harm to households and pose risks to the stability of household finances, it is relevant to consider the distribution of household debt, as well as the aggregate level. Additionally, it is important to take a broad view of debt, including not only financial debts, but also non-credit debts, such as rent and bills arrears to both the private and public sectors.
The balance of responsibility between regulators and Government
30. Some submissions to this inquiry have called for the Financial Conduct Authority (FCA) to be given an objective to take account of and/or improve overall levels of household saving, arguing that “there is no coherent, joined up government policy to promote saving and investing.”34 When they appeared before the Committee for this inquiry, FCA directors and the Economic Secretary to the Treasury were asked to clarify the remit of the FCA and other regulators as regards household saving and debt. They were asked in particular about the point at which saving and debt becomes a broader Government and Treasury responsibility. Christopher Woolard, the FCA’s executive director of strategy and competition said:
As a regulator, we act where we see the most harm and we particularly prioritise those who are vulnerable. If we want to translate that into the specifics that relate to households, we have looked at a number of the major markets that most affect households, so credit cards, mortgages, retirement income, asset management, which sits behind pensions that people have, and things like the payday cap and high-cost credit.
When you want to think about the overlap between ourselves and Government … when I think we are approaching questions of what you might describe as social policy, we very much look at Government …
[Regarding the overall health of the UK household balance sheet] When you look across the regulators, there are specific things that the Bank of England does, that the PRA does, that we do, and indeed some of the other utility regulators may do, that can contribute to this. When you look at
34 Evidence submitted by Hargreaves Lansdowne (HHF0015), and Evidence submitted by TISA (HF0034)
13 Household financess income, saving and debt
the balance sheet in the round, and in particular some of the big questions like intergenerational issues, they are clearly matters principally for Government, even though regulators may contribute to some part of that.35
31. When asked whether the Treasury gives weight to the health of the household finances of the nation, as well as the public finances, when forming economic strategy, John Glen responded “absolutely we do”. When further asked to clarify whether the impact of savings on long-term structural economic stability and on future living standards is a Treasury responsibility, he responded “ultimately, of course… the Chancellor makes decisions every fiscal event about making adjustments to how we raise money and how that affects different cohorts in the population.”36
32. Ministers have not always been so clear about the Treasury’s responsibilities in the past. In response to a question in the House regarding the Government’s responsibilities for alleviating the risk of a household debt crisis, the previous Economic Secretary, Stephen Barclay, responded:
The hon. Gentleman misstates the position. It is an independent responsibility of the Bank of England to address that—[Interruption.] It is. It is of course an area where there will always be frequent discussions with the Treasury, but it is a Bank of England matter.37
The Autumn Budget 2017 report does not mention the household saving or household debt forecasts of the OBR, or discuss the implications of historically low household savings rates.38
33. The responsibility for improving overall levels of household net saving sits more appropriately with the Government and HM Treasury than the financial regulators, because they have a broader remit and a wider range of policy objectives and tools.
34. The Committee welcomes the Economic Secretary’s clarification that the Treasury does take into account the health of household finances in setting economic policy, and that Treasury Ministers are ultimately responsible for ensuring that low rates of saving or high rates of indebtedness do not imperil long-term economic stability or living standards.
35. The importance of this responsibility is not reflected in the Autumn Budget report, which contains no discussion of household savings or debt. The Treasury rightly has much to say about the public finances. In the next Budget, the Treasury should report on the state of household finances and the level and rate of household savings, at a regional and national level, including its assessment of the implications for future living standards and wider economic stability. It should identify the most consequential risks to the financial resilience of households and set out its strategy for addressing them.
35 Oral evidence taken on 8 May 2018, Household financess income, saving & debt, HC 600, Q249–25136 Ibid Q29737 HC Deb 18 July 2017 c70638 HM Treasury, Autumn Budget 2017, 22 November 2017
Household financess income, saving and debt 14
3 Helping over-indebted households36. The previous chapter considered the aggregate levels of household debt, and reached the conclusion that attention should be focused on identifing cases where debt may cause most harm to households. How this might be done, and an overview of an approach that could help ameliorate the damage from household debt, is considered in this chapter. It first discusses evidence on the scale and distribution of problem debt and over-indebtedness, including non-credit arrears owed to the public sector. The remainder of the chapter considers remedies for over-indebtedness under three broad categories: regulation of high-cost credit; easing the burden of debt; and improving the availability of lower-cost credit. The next chapter considers a forth category of remedy: precautionary “rainy day” saving buffers.
The scale and incidence of over-indebtedness
37. Submissions to this inquiry offered a number of definitions and figures to describe the scale of over-indebtedness, some of which are quite broad. The Money Advice Service (MAS) said in written evidence that 8.3 million adults in the UK—around one in six—are over-indebted, defined as being likely to find meeting monthly bills a heavy burden and/or missing more than two bill payments within a six-month period.39 Phil Andrew, Chief Executive of the debt charity StepChange, told the Committee that he sees this as a fair definition of over-indebtedness, but that there is a subset of 2.9 million people that are in “significant financial difficulty”. Matt Upton, Head of Policy for Consumer and Public Services at Citizens Advice, said that their figures showed that 1 million people had struggled with debt persistently over eight years.40
38. Both of these witnesses felt that problems of insecurity and indebtedness were getting worse rather than better. Mr Andrew said:
We are seeing the average amount owed going up slightly at the moment, with the amount owed on individual credit cards going up to over £8,000 for individuals. We are seeing that individuals are not just owing to one creditor, but owing on average to just over five creditors.
However, he added:
… we do not see credit in itself as a bad thing. The question is whether it is affordable, appropriate and sustainable. Do you understand, when you are getting into it, what you are getting yourself into, and then are you using it appropriately? For instance, if you are using credit cards to pay your utility bills or you are using credit to pay off credit, these are the classic signs that you are getting yourself into trouble.41
39 Evidence submitted by the Money Advice Service (HHF0020)40 Oral evidence taken on 28 February 2018, Household financess income, savings and debt, HC 565, Q75–7641 Ibid, Q77,Q79
15 Household financess income, saving and debt
39. StepChange’s written evidence identifies a rise in the share of their clients aged under 40 (from 53 per cent to 63 per cent) and who are renters (from 67 per cent to 80 per cent).42 When asked about the drivers and causes of this over-indebtedness, Mr Upton pointed to the importance of “a life shock of some kind—they fall ill, lose their jobs or have a quiet month on a zero-hours contract”.43
40. Nisha Arora, Director of Market Intelligence, Data and Analysis at the Financial Conduct Authority (FCA), described the findings of its inaugural Financial Lives survey regarding the distribution of household debt:
if we take the younger generation, so our 18-to-34 group, what we are seeing is fledgling earnings, low saving levels, and… a higher average debt level. If we look at the 25-to-34 age group, 23 per cent of that age group are over-indebted. That is the highest proportion in any of the age groups we looked at.44
Ms Arora described the key characteristics that make people vulnerable to financial harm. The FCA’s measure of the overall scale of over-indebtedness comes to a similar figure as that of the MAS (around one sixth).
The key characteristic… is low financial resilience. That might be because people are over-indebted. We found 15 per cent who were over-indebted. It might be that, if there is a small financial shock, they would suffer …
There are then people who also have low financial capability, who might have health problems. For example, 5 per cent of people have health problems that affect their day-to-day activities. There are also people who suffer serious life events. For all those people, that is going to make engaging with financial services much harder. It will limit access to financial services. It can mean people cannot plan properly, and it might mean people cannot make the right choices. When they have to make these really complicated choices and take various options, it inhibits that.
That is the overall picture, but then within that there are people who have low financial resilience and then, within that, arguably the worst-off are what we call people in difficulty. We found that 8 per cent of the population are in difficulty. That is people who, in the last six months, have failed to pay a bill or a credit commitment three or more times.45
41. In written evidence, the Financial Services Consumer Panel (FSCP) said that “the UK lacks any robust system for monitoring problem debt, and there is no coherent cross-government policy for tackling the issue” and “there is not even an agreed definition of ‘over-indebtedness’”.46 The Committtee heard that the FCA’s Financial Lives survey could form an evidential basis for this work: Ms Arora said that “one of the reasons we have done [the survey] is not only to inform our interventions but to publish the data tables to make them available to others, so others in Government, policy makers and charities.”47 42 Evidence submitted by StepChange (HHF0009)43 Oral evidence taken on 28 February 2018, Household financess income, savings and debt, HC 565, Q7544 Oral evidence taken on 8 May 2018, Household financess income, saving & debt, HC 600, Q26445 Ibid, Q27246 Evidence submitted by Financial Services Consumer Panel (HHF0023)47 Oral evidence taken on 8 May 2018, Household financess income, saving & debt, HC 600, Q254
Household financess income, saving and debt 16
When they appeared before the Committee, the Economic Secretary to the Treasury and the Minister for Pensions and Financial Inclusion said that they had not to date read Financial Lives.48
42. There is no formally-agreed definition of over-indebtedness, but there seems to be a rough consensus that a key indicator is difficulty in keeping up with bills and credit commitments. Risk factors for over-indebtedness include being young, renting and exposure to a ‘life shock’.
43. The FCA’s Financial Lives survey contains important information on the distribution and causes of over-indebtedness and financial vulnerability that should form the basis of evidence-led policy to tackle these problems. It is concerning that Treasury and Department for Work and Pensions (DWP) Ministers were not familiar with it before they gave evidence to the Committee. The fact that officials had not familiarised Ministers with the report gives the appearance that the departments do not attach enough importance to it. The Treasury and DWP should produce a joint response to Financial Lives, in which they set out how it has informed their co-ordinated efforts to identify the most financially vulnerable households, and which policies could be most targeted and effective in improving their situation.
Non-credit debts, and arrears to government and local authorities
44. These definitions of over-indebtedness include not only conventional credit, but also arrears (or potential arrears) on bills, including those owed to government and local authorities. The witnesses from StepChange and Citizens Advice, among other contributors to the inquiry, stressed that debts of this type were an important contributor to over-indebtedness; that they represent an increasing share of problem debts; and, that government and local authorities were often found to be the most zealous and unsympathetic of creditors in collecting arrears. Phil Andrew of StepChange told the Committee that the charity was now seeing “council tax debts, over 1,000 pounds on average… in around 31 per cent of our clients”. According to StepChange’s written evidence, 40.6 per cent of clients are in all type household bill arrears, including council tax.49 Mr Andrew added:
Quite often, the governmental organisations are very aggressive in the way in which they go about getting the payments made. This quick jump to the use of bailiffs, particularly on council tax areas, is something that we are really quite concerned about.50
Matt Upton of Citizens Advice expanded on the debt collection standards of public authorities:
This is a point that people find slightly difficult to grasp, because when people first hear that government collection and local authority collection is effectively worst in class, versus consumer creditors, perhaps they hear it on a rational level, but it is quite difficult to accept emotionally. Government
48 Ibid, Q30049 Evidence submitted by StepChange (HHF0009)50 Oral evidence taken on 28 February 2018, Household financess income, savings and debt, HC 565, Q80
17 Household financess income, saving and debt
must be better than some of these rapacious firms that we hear about. Actually, there is a lot that Government could learn in terms of forbearance and standing from some of those consumer creditors.
Part of that has been because regulation has brought some of those firms in line but, partly, if you talk to banks, it is because lots of organisations have realised that incredibly aggressive collection methods are not effective in and of themselves at getting money in the door, because people do not respond well to some of those tactics. There are a couple of reasons why Government and local authorities should look at the way that they collect debts.51
45. Committee members had also heard similar testimonies on a visit to a Citizens Advice Bureau in Nottingham, where concerns about central government collection practices were also expressed. The Money Advice Trust said in written evidence that it had found that 2.3 million debts were passed to bailiffs by local authorities in 2016/17.52
46. Christopher Woolard, the FCA’s Executive Director of Strategy and Competition, told the Committee that instances of non-credit arrears had risen in recent years, and linked this to the decline in payday loans that followed the imposition of the high-cost short-term credit cap in 2014:
If we go back pre-payday cap, so three years ago, when people were arriving for debt advice at Citizens Advice or a similar body, they were, roughly speaking, turning up with about £5,000 worth of debt. That was the problem they found themselves in. What we have seen over time, particularly as we have introduced the cap on payday lending and a number of other things have tightened up in this space, is the average point at which someone seeks debt advice is now roughly closer to £2,500. The amount has halved.
However, the proportion of people who are arriving as what Citizens Advice calls nocredit clients—in other words, their debts are about utility bills, council tax and those kinds of things—has gone up. That has gone up to somewhere possibly in the region of about 20 per cent of their client base. Undoubtedly, we are seeing some shifts there …53
47. Written submissions to this inquiry recommended that the Government improve practices around the collection of arrears to public authorities along that same lines that have been adopted by the utilities sector. For example, the MAS “would encourage the adoption of our Creditor Toolkit… [which] encourages creditors to examine their debt collection strategies and collaborate with the debt advice sector”.54 These calls were echoed in evidence from the financial services industry. For example, UK Finance called for the inclusion of DWP, HMRC, local authorities and utilities in forbearance frameworks.55
48. John Glen, the Economic Secretary to the Treasury, told the Committee that the Government had initiatives to tackle the problem:51 Ibid, Q8052 Evidence submitted by the Money Advice Trust (HHF0042)53 Oral evidence taken on 8 May 2018, Household financess income, saving & debt, HC 600, Q25254 Evidence submitted by the Money Advice Service (HHF0020). The Money Advice Trust made a similar call
[Evidence submitted by the Money Advice Trust (HHF0042)].55 Evidence submitted by UK Finance (HHF0028)
Household financess income, saving and debt 18
HMRC has Time to Pay; there is a support service available for people who find themselves in debt. The Cabinet Office has established a Fairness Group to try to give advice on this. We also have the reform to the bailiff law in 2014 to provide protection against aggressive recovery. It is not a universal problem, but I acknowledge that it exists […] I can concede that there is work to be done.56
49. Arrears to local authorities are growing. These debts are often pursued over-zealously, and with routine recourse to bailiffs. In addition to local government, the Committee has heard reports that central government can take an uncompromising approach to debt collection. The public sector should be leading by example in their treatment of the most financially vulnerable; but the current approach risks driving them into further difficulty.
50. The Committee welcomes the Economic Secretary’s acknowledgement of this problem, but it would like to see more evidence that the Government is tackling it as a priority. By bringing central government and local authority debt collection practices consistently into line with industry best practice, the Government has the power to make a significant difference to the burden of problem debt in a short space of time. In its response to this report, the Treasury should set out how it intends to do so.
Remedies: Regulating high-cost credit
51. There is widespread recognition that the provision of unsecured credit is an essential service for many households. Phil Andrew told the Committee that “From a StepChange perspective, we do not see credit in itself as a bad thing”. However, there is also a widespread concern that some existing credit products are not well-designed or suitable for the households that rely on them. Mr Andrew continued “The question is whether it is affordable, appropriate and sustainable” and Matt Upton of Citizens Advice told the Committee “it is the product itself than can often cause the [problem] debt.”57
52. The Financial Services Act 2012 transferred the regulation of consumer credit from the Office of Fair Trading (OFT) to the FCA from 2014 and gave the FCA powers to impose a cost cap on high-cost short-term credit (HCSTC), including payday loans.58 The Financial Services (Banking Reform) Act 2013 then mandated the FCA to introduce such a cap. The series of measures that subsequently came into effect at the start of 2015 included a total cost cap of 100 per cent of the loan principal and a limit of two loan rollovers.59
53. The cap has had a major effect on the HCSTC industry. In evidence to the Committee, Andrew Bailey, the Chief Executive of the FCA, agreed with statements that it has “decimated payday lending” and reduced it by a “factor of more than 10”.60 Moreover, the FCA believes that this shrinkage in the sector has generally been beneficial for consumers. Christopher Woolard (FCA) told the Committee:
56 Oral evidence taken on 8 May 2018, Household financess income, saving & debt, HC 600, Q343, Q34857 Oral evidence taken on 28 February 2018, Household financess income, savings and debt, HC 565, Q7958 The definition of high-cost short-term credit can be found in the FCA Handbook.59 House of Commons Library, High cost consumer credits the new regulatory regime, Briefing paper Number CBP-
07978, 31 May 201860 Oral evidence taken on 31 October 2017, The Work of the FCA, HC 475, Q140–142
19 Household financess income, saving and debt
The work that we did around the review of the effect of the payday cap showed us that there was no real appreciable evidence of people moving into illegal money lending. You have to be careful with that, because clearly, by its nature as an illegal activity, it is very hard to measure … We worked very closely with people like the illegal money lending team, and they have given us good evidence that suggests they are not seeing a significant rise in any of that.
What people actually told us happened was, in about 60 per cent of cases, people found a way of coping when refused credit. Indeed, the evidence from the first time around when we did the payday cap said that people marginally refused credit actually ended up with better economic welfare over time than those who did get the credit in the first place on payday lending. We had around 15 per cent who did look at other high-cost or other credit products. The remainder turned to other sources, including family and so forth. We are seeing a range of coping mechanisms deployed there.
Perhaps most interestingly, for about 64 per cent of people who we surveyed, they said that was the moment where they effectively said, “Right, enough is enough”. They described being refused as actually being beneficial.
54. The HCSTC cap has been generally welcomed by consumer representatives. Matt Upton (Citizens Advice) said that “you will not find any credible voice that argues anything other than the fact that the payday loan cap was a success.”61 Witnesses from other high-cost credit industries agreed that they had not seen an increase in business as a result of the cap, and although some raised concerns about a possible move into illegal lending by consumers, the Committee has not seen corroborating evidence.62
55. Beyond the HCSTC cap, the FCA is seen as having taken a tougher approach to consumer credit regulation than its predecessor, with a focus on its “fair treatment of customers” principles. Hamish Paton, the Chief Executive of rent-to-own lender BrightHouse, told the Committee “we now have a tough regulator in the FCA, with a lot of scrutiny and robust processes.”63 The FCA has a number of reviews and studies into consumer lending ongoing and recently completed, including its Credit Card Market Study, a review of its rules on creditworthiness assessment, and the High-Cost Credit Review. The latter identified arranged and unarranged overdrafts, rent-to-own, home-collected credit and catalogue credit as areas for remedies in July 2017. In July 2018, the FCA launched consultations on remedies in all these industries, but proposals for price controls on overdrafts and rent-to-own were subject to further discussion.64
56. When asked about the time being taken to introduce these remedies, and in particular the possible price controls, Mr Bailey pointed to the legal process the FCA is required to follow:
61 Oral evidence taken on 28 February 2018, Household financess income, savings and debt, HC 565, Q8662 Ibid, Q146–14863 Ibid, Q16664 Financial Conduct Authority, High-cost Credit Reviews Consultation on rent-to-own, home-collected credit,
catalogue credit and store cards, and alternatives to high-cost credit. Discussion on rent-to-own pricing, CP18/12, 31 May 2018
Household financess income, saving and debt 20
[The FCA’s proposals] around fees and charges for overdrafts, and… the cost of rent to own… are economically big interventions. We have to go through the process of getting the evidence and doing a cost-benefit analysis. I would emphasise that, because if you take the case of overdrafts, 10 years ago, the OFT lost this case in the Supreme Court … I have to be very careful to be clear that we have not therefore pre-packed the solution, because we have to do this work; otherwise, we are vulnerable to legal challenge.
Additionally, Mr Bailey suggested that the FCA had been undergoing a change of view more broadly about price controls and caps:
There is an interesting question that we debate quite a bit: is the price cap, which is quite a heavy tool to use, something you use as a last resort when you do not think the other tools that are more directed are going to work; or do you bring it in early? […] I was on the board of the FCA when the payday cap was brought in—it was very much viewed as a last resort. If you cannot design a package of more targeted measures, that is what you do.
Interestingly, what is regarded as the success of the payday cap has probably changed the debate around the price cap… Is it still right to think of it as the tool you use when others do not work, or do you say, “Look, it has worked for one thing; why do you not use it for another thing”?65
57. Debt charities and consumer representatives called for the FCA to go further than it is currently proposing, in some areas. In written and oral evidence, Citizens Advice called for a cap on all forms of high-cost credit, including doorstep lending, and for a full ban on unsolicited credit limit increases on credit cards, rather than the voluntary industry agreement brokered by the FCA.66 However, in other areas, the FCA’s proposals are broadly in line with proposals made in evidence to this inquiry, such as StepChange’s call for a ban on overdraft fees.67 Mr Woolard told the Committee that the setting of standards to be followed throughout the lending industry, which could be taken to include Citizens Advice’s call for a cap on all forms of high-cost credit, would be a task for Government and Parliament rather than the FCA:
Where there are debates that say there should be a minimum level that runs throughout a market, for example, of what good or bad looks like, again, that is very difficult to ask us to do with the powers that we have, when we have to look at each individual market on a case-by-case basis and look at the cost-benefit. If there is a social norm to be set, that is absolutely a matter for Government and absolutely a matter for Parliament to take a view on.
58. The transfer of responsibility for consumer credit regulation to the FCA has led to a change in approach and a shift in the debate around the regulation of high-cost credit. In particular, the evidence that the high-cost short-term credit price cap has been beneficial for consumers suggests that there is not always a trade-off between regulating harmful credit products, and denying access to credit to those who need it.
65 Oral evidence taken on 13 June, The Work of the Financial Conduct Authority, HC 475, Q354, Q36066 Evidence submitted by Citizens Advice, HHF0039 and Oral evidence taken on 28 February 2018, Household
financess income, savings and debt, HC 565, Q86–8867 Evidence submitted by StepChange (HHF0009)
21 Household financess income, saving and debt
59. The Committee encourages the FCA now to move forward with its proposals on other forms of high-cost credit—including overdraft fees—as quickly as it can. When it comes to review the impact of these proposals after they are implemented, it should reconsider whether a wider cap on high-cost credit, and compulsory restrictions on unsolicited credit limit increases, are needed.
60. The HCSTC cap precedent also indicates that Government and Parliament can move more quickly than the regulator acting on its own in cases where there is clear harm to consumers in lending markets, and to enforce consistent standards across the industry.
Remedies: easing the burden of over-indebtedness
61. In October 2017, the Treasury launched a call for evidence about a “breathing space” scheme in England that would make available a period of respite from charges and enforcement for people in serious problem debt, while they arrange a sustainable repayment plan. A similar Debt Arrangement Scheme (DAS) is already available in Scotland. The Government has said it will publish a policy design for consultation this summer, in time for breathing space to be launched in 2019.68
62. The breathing space proposals were widely welcomed in submissions to this inquiry as an important step towards reliving the burden faced by over-indebted households. Phil Andrew of StepChange told the Committee “We fundamentally support it.”69 However, the Committee received numerous calls for two changes in particular to the Government’s current proposals.
63. The first was for a greater period of maximum breathing space than the six weeks the Government is intending. Mr Andrew said “If it is only for six weeks, it is just not enough, because it does not give people time to get themselves on their feet, have sensible conversations with their creditors and work it though.”70 Similar calls for an extension were made in written evidence by the FSCP, the Money Advice Trust, the Children’s Society and the Open University Centre for Public Understanding of Finance.71 However, John Glen told the Committee that the Government was minded to keep to the six-week proposal for most people:
One of the key drivers of the evidence was the conversations with the Scottish Debt Advisory Services, which… have a situation where they keep it at six weeks … Where we did make a concession, very happily, was on the recognition that people with mental health conditions need longer … One of the principles I want to observe is that if you extend it too far, you end up extending the period for which an individual’s life is left on hold … I acknowledge the very well-researched, deep experience of many contributions across the House from all sides on this, and I am sure they will be considered in due course.
68 HM Treasury, Breathing space schemes call for evidence response, 18 June 201869 Oral evidence taken on 28 February 2018, Household financess income, savings and debt, HC 565, Q10270 Ibid71 Evidence submitted by Financial Services Consumer Panel (HHF0023), Evidence submitted by the Money Advice
Trust (HHF0042), Evidence submitted by the Children’s Society (HHF0045), Evidence submitted by the Open University PUFin (HHF0030)
Household financess income, saving and debt 22
64. Secondly, when asked whether breathing space should include non-credit arrears such as utility bills and council tax, Matt Upton of Citizens Advice told the Committee “For us it is the full set … About 50 per cent of people now come to us with those sorts of government priority debts, so it would have to include those to be effective, from our perspective.”72 Similar calls were made in written evidence by industry representatives UK Finances and the Finance & Leasing Association.73
65. The breathing space scheme is an important initiative that should help relieve the burden on severely over-indebted households and give them a better chance of entering sustainable repayment plans. The Government should carefully consider the case for extending the period to be covered beyond six weeks.
66. Given the growing role of non-credit arrears in problem debt, and the aggressive collection practices used by many public sector creditors, the case to include non-credit arrears in the breathing space scheme is overwhelming. The Committee can only offer its support for the scheme if its scope is expanded accordingly.
67. Another important approach to easing the burden of over-indebtedness is the provision of debt advice. The Money Advice Service (MAS) provides financial support for free-to-client debt advice, spending £49 million on its debt advice work in 2016/17.74 However, the Committee has heard that demand for such services greatly exceeds supply. Mr Andrew said:
… the [debt advice] sector overall is fundamentally underfunded. If you take away the approximately £35 million a year that individual debtors pay to organisations for help and advice, the sector gets about £150 million a year to provide debt advice and solutions … Bear in mind that StepChange as a charity has been in demand-suppression mode for four years because, if we advertise, we simply cannot cope with the number of people who want our help. We have to demand-supress down to about 620,000 people a year, when we know that somewhere between 1.3 million and 1.8 million people could really do with our assistance.
68. Citizens Advice echoed this point in written evidence, saying “Currently, debt advice services are overstretched… Tens of thousands people with debt problems each year are currently unable to get through to our AdviceLine because it is over capacity.” It called for the debt advice levy to be extended to non-consumer creditors, in order to improve funding:
Currently, general debt advice is predominantly paid for by a levy on financial services providers. However, more than half of the debt problems seen by Citizens Advice are debts to government and other essential service providers. Those service providers should contribute to the funding of debt advice in the way banks currently do.75
72 Oral evidence taken on 28 February 2018, Household financess income, savings and debt, HC 565, Q10373 Evidence submitted by UK Finance (HHF0028) and Evidence submitted by the Finance & Leasing Association
(HHF0013)74 HM Treasury, Breathing spaces call for evidence, 17 October 201775 Evidence submitted by Citizens Advice (HHF0039)
23 Household financess income, saving and debt
69. The current provision of free-to-client debt advice appears insufficient, despite the support from the MAS. In consultations over how its successor, the Single Financial Guidance Body (SFGB) will allocate its budget, the SFGB and the Government should consider how the resources available for this advice could be increased, based on an assessment of existing and projected demand for these services. The Government should consider the case for making more funds available by extending debt advice levies to non-credit arrears providers.
Remedies: improving the availability of lower-cost credit
70. Andrew Bailey (FCA) told the Committee that “I do not think we have a sustainable means of providing [people who are less well off] with credit at the moment in this country, hence we had payday loans”.76 Christopher Woolard (FCA) has expanded on this point:
The way I put this is, if you have a good credit rating, it is relatively easy to get cheap credit at this moment in time. If you have a poor credit rating, it is less easy, but it is still relatively easy to obtain quite expensive credit. What is missing when you look at the market is effectively the bit in the middle. Where is the mid-cost credit offering? You can see that offering in other countries sometimes.77
71. Some witnesses identified UK lenders’ approach to credit ratings as one reason why this gap in the market exists. Ashwin Kumar, Chief Economist at the Joseph Rowntree Foundation, told the Committee that the market is not functioning properly:
It is a highly constrained market, partly because… credit ratings are not particularly differentiated. As soon as you have got any negativity on your credit file, basically, you are excluded from the mainstream credit market and you are into the highcost credit market. In a normal functioning market, you would not expect to see such a cliff edge; you would expect to see continuity. But because of the way that credit ratings work, there is much more of a cliff edge than there should be.
72. Similarly, in written evidence, the MAS said that “poor creditworthiness assessments… can result in people being… denied credit they could manage, causing them to turn to higher-cost forms of borrowing”.78
73. One approach to reducing the cliff edge in credit ratings suggested to this inquiry would be to widen the data available for creditworthiness assessments. John Montague, Managing Director of the Big Issue Group, spoke to the Committee in support of Lord Bird’s Creditworthiness Assessment Bill, which would require lenders to include rental and council tax payment history into account in credit rating assessments (CRAs):
… there are 12 million renters and growing. The biggest bit of someone’s spending is their household rent … They are being excluded from the credit service market, because they do not have a digital footprint … They do not exist… Our real challenge on creditworthiness is what the right data sets are that we should be recording for calculating someone’s credit rating
76 Oral evidence taken on 31 October 2017, The Work of the FCA, HC 475, Q120–12177 Oral evidence taken on 8 May 2018, Household financess income, saving & debt, HC 600, Q25978 Evidence submitted by the Money Advice Service (HHF0020)
Household financess income, saving and debt 24
and, more importantly, that the data is available to look at affordability and suitability of product … If you have no digital footprint or a very thin file from that credit bureau, you are automatically paying more. That is wrong.79
74. Other witnesses were more cautious on the impact of expanding the criteria for CRAs in this way. Phil Andrew of StepChange said “For some people it would be incredibly helpful, but for a minority of people it could push them further into social exclusion”, while Matt Upton of Citizens Advice said “of the clients we see who struggle to access credit there is a proportion for whom credit referencing is a factor … For a greater proportion it is not the big factor.”80
75. John Glen told the Committee that he agreed with the aims of the Creditworthiness Assessment Bill, but that the Government was developing an alternative approach:
I have also taken forward my predecessor’s initiative on the Rent Recognition Challenge, which will develop a solution so that those people who traditionally have difficulty proving their creditworthiness will be able to use the data derived from their consistent paying of rent to allow them to access more affordable borrowing … Where we would be with that is that we agree with the aims of the Bill, but we think imposing an across-the-board obligation is probably not going to be cost-effective. What I hope will happen is that we will see the Rent Recognition Challenge develop a product that is widely applicable.81
76. The inclusion of rent and other non-credit regular payment commitments in credit rating assessments could improve access to low- and mid-cost credit. There is some concern that an across-the-board obligation could penalise some people, however. The Government says it has an alternative to the Creditworthiness Assessment Bill in the Rent Recognition Challenge: it should set out in its response to this Report how this programme will meet the aim of increasing access to credit more effectively than the Bill, and how soon its chosen alternative will be implemented.
77. A further possibility for expanding the provision of mid-cost credit could be an expansion of the credit union and community development financial institution (CDFI) sector. This possibility has been raised recently by the FCA, as part of its High-Cost Credit Review. However, there is scepticism over whether credit unions have the potential to scale-up to the point where they could collectively make a significant dent in the high-cost credit market. Christopher Woolard told the Committee:
When we are talking about credit unions, we need to remember it is a very broad group of firms. The largest ones are absolutely the same kind of size and scale as the larger building societies, all the way through to two, three, four people running a very small credit union. Certainly for the larger ones, we are seeing some quite encouraging signs of, for example, partnerships with CDFIs, so community finance organisations. They are looking at how they can be quite imaginative about filling the so-called mid-cost gap that
79 Oral evidence taken on 28 February 2018, Household financess income, savings and debt, HC 565, Q8180 Ibid, Q8281 Oral evidence taken on 8 May 2018, Household financess income, saving & debt, HC 600, Q297–298
25 Household financess income, saving and debt
we see in the market. Credit unions will be part of the answer, but they will be part of what will need to be many different solutions to this. I do not think we can pin the whole thing on credit unions.82
78. Among those offering support for increased efforts to boost credit unions were the Money Advice Trust, who said in written evidence:
We believe the government could and should do more to support the growth of credit union lending as part of a strategy to improve access to affordable credit amongst low income households. Building a more sustainable and modernised credit union sector is an important part of tackling financial exclusion, and that increased support… should be a central component of the government’s efforts in this area.83
79. While governments have launched several initiatives over the years to boost credit unions, they have been piecemeal. In answer to a written question in the House of Commons, Guy Opperman, the Minister for Pensions and Financial Inclusion, revealed that the £38 million “Credit Union Expansion Project”, launched in 2013, had closed in February 2018 after creating a digital banking platform currently serving 16,500 members.84 When asked about the Government’s plans on credit unions, John Glen told the Committee about Treasury moves to increase the common bond and capped interest rate over the last few years, and that “we need to look at the number of asks that have come from a call for evidence four years ago.”85
80. Some submissions, including those from StepChange, the FSCP and the End Child Poverty Coalition to the inquiry pointed out that the localisation and scaling back of the Social Fund (the funding for which halved between 2010 and 2016) had reduced the backstop credit options available for less well-off households.86
81. There may be potential for credit unions and community development financial institutions to take a greater role in providing mid-cost credit to households currently relying on high-cost credit. The Committee would like to see the Government take a more strategic approach in coordinating what currently seem like piecemeal efforts across Government, regulators and industry towards promoting the expansion of this sector. It should also set out what it expects a successful credit union sector to look like.
82 Ibid, Q28583 Evidence submitted by the Money Advice Trust (HHF0042)84 Credit Unionss Written question—13322185 Oral evidence taken on 8 May 2018, Household financess income, saving & debt, HC 600, Q34686 Evidence submitted by Financial Services Consumer Panel (HHF0023)
Household financess income, saving and debt 26
4 Saving for a rainy day82. Many of those submitting evidence to this inquiry made the point that a relatively modest pool of readily accessible precautionary savings can make a decisive difference to the stability of a household’s finances, and help it avoid getting into an unsustainable debt spiral. The debt charity StepChange told the Committee if every household in the UK had at least £1,000 in accessible savings, the number of households in problem debt could be reduced by 500,000.87
83. While estimates vary, it appears that millions of UK households do not have this level of savings, or any savings at all. StepChange estimates that over 7 million households (25 per cent) have savings below £1,000. Meanwhile, the Open University Centre for Public Understanding of Finance (PUFin) cited data showing that a third of households have no savings at all. StepChange’s research indicates that low incomes, living in rented accommodation, having dependent children and being younger, were are all risk factors for having a low level of precautionary savings.88
84. In written evidence, the Money Advice Service (MAS) said that “there is an urgent need to help people build up savings buffers… alongside focused attempt to tackle… problem debt”. However, it also acknowledged “there is increasing recognition that there are some groups… for whom building any sort of meaningful buffer is an unrealistic expectation”.89
85. There is widespread evidence that many households are lacking in “rainy day” savings buffers, and that helping households to build precautionary savings could have a significant impact on levels of problem debt. Clearly, that will not be a practical possibility for all households, and does not detract from the need to address problem debt by easing repayment burdens, making more credit available at a more reasonable cost and regulating problematic debt products.
Incentivising cash saving
86. The principal savings incentive provided by the Government takes the form of tax relief on interest, primarily through ISAs. In 2016/17, the cost of tax relief on ISAs was £2.75bn, a figure that is forecast to rise to £2.9bn in 2017/18.90 The generosity of tax relief on cash ISAs increased markedly in 2014, when the amount that could be saved annually rose from less than £6,000 to £15,000. Recent years have also seen increases in the ‘Starting Rate for Savings’, and the introduction of the Personal Saving Allowance (PSA), which offers tax relief on all cash saving on gross interest up to £1,000 and £500 for basic and higher rate tax payers respectively.91 In 2016/17, the PSA added £0.4bn to the tax relief bill.92
87 Evidence submitted by StepChange (HHF0009)88 Ibid, and Evidence submitted by the Open University PUFin (HHF0030). Evidence submitted by Citizens Advice
(HHF0039), and Evidence submitted by the Money Advice Service (HHF0020) cited differing but broadly similar figures for the number of households with low precautionary savings.
89 Evidence submitted by the Money Advice Service (HHF0020)90 Evidence submitted by John Glen (HHF0052) and HMRC, Estimated Costs of Tax Reliefs, 23 January 2018 91 gov.uk, Tax on savings interest, accessed 6 July 201892 HMRC, Estimated Costs of Tax Reliefs, 23 January 2018
27 Household financess income, saving and debt
87. However, in submissions to this inquiry, there was widespread scepticism that tax relief is an effective way of encouraging potentially vulnerable households to save for a rainy day. StepChange said that tax relief “is less of an incentive for lower-income savers”, while Open University PUFin said that “there is a lack of evidence on whether fiscal incentives… increase saving relative to the level that would have occurred in their absence”. It also commented “In 2014, the National Audit Office found that HMRC does not routinely evaluate whether tax reliefs designed to change behaviour are effective.”93
88. There is also a recognition that tax relief is not targeted at low-income families. In oral evidence, Torsten Bell, the Director of the Resolution Foundation, told the Committee:
If you are really rich, we are doing a really good job of tax-relieving all of your savings in very large ISAs and rollover PEPs [Personal Equity Plan]. If you tried really hard, you could have got to £1 million in the tax-relieved savings pot. It is not clear to me that is a good use of Government funds …
We are doing a moderately awful job of encouraging those in lower income families to save. That is because the first suggestion of direct matching for those groups, which evidence does show has some effect, was in 2001. Direct matching has more effect than other forms of incentives, although it is still not as strong as some of us would like and you may be better just to give them the money.94
89. In 2016, the Government announced a new scheme rolling out from 2018 called Help to Save, which is open to those entitled to Working Tax Credit or claiming Universal Credit with a monthly private income of at least £542.88. Participants can save up to £50 and receive a bonus of 50 per cent of the highest balance achieved after two and four years. The maximum bonus is therefore £1,200.95
90. Among submissions to this inquiry, there was more enthusiasm, albeit cautious, for Help to Save than for ISAs. For some witnesses, it goes some way to restoring a gap left when another saving bonus scheme, the Savings Gateway, was abolished before it began in 2010.96 Mr Bell told the Committee “You can imagine policies like Help to Save working [to encourage people to get into the habit of saving], and I would not quibble much with the detail… except that it is more targeted on higher earning families and slightly less generous than Saving Gateway.” Ashwin Kumar, chief economist at the Joseph Rowntree Foundation, said that the bonuses in Help to Save could be more effective than tax relief but warned “the cost of Help to Save will be £70 million by 2021… it is dwarfed by the increases in costs for additional ISA allowances.”97
91. In written evidence, Toynbee Hall praised Help to Save for not predefining the purpose of saving or setting high targets, which its evidence shows can be off-putting to lower income households, but it called for the eligibility criteria to be widened.98 The MAS said:
93 Evidence submitted by StepChange (HHF0009) Evidence submitted by the Open University PUFin (HHF0030).94 Oral evidence taken on 14 November 2017, Household financess income, saving & debt, HC 600, Q795 HMRC, The Help to Save Scheme, updated 21 June 2018, accessed 3 July 201896 BBC news, Budgets Saving Gateway scheme is scrapped, 22 June 201097 Oral evidence taken on 14 November 2017, Household financess income, saving & debt, HC 600, Q60, Q6398 Evidence submitted by Toynbee Hall (HHF0044)
Household financess income, saving and debt 28
We welcome Help to Save, which recognises the need for more targeted incentives to promote saving among particular groups, in this case low-income families. There is a lack of evidence that policy interventions aimed at encouraging saving behaviour manage to get consumers who weren’t previously saving to start… Explicitly targeting groups that are known to have issues with saving is one potential way in which to address this… This might include considering widening eligibility for Help to Save, pending learning from roll out and evaluation …99
92. John Glen, the Economic Secretary to the Treasury, told the Committee that “10 thousand people have signed up to [the Help to Save trial, and] we anticipate that 350,000 will use it”. He also said that he was not aware of a Treasury commitment to provide an annual progress statement on Help to Save, but that “it would be entirely appropriate for you to bring me here to account for the progress”.100 Even if met, the 350,000 forecast would amount to around 10 per cent of the 3.5 million people who are eligible for the scheme.101
93. There is little evidence that tax relief is an effective way to stimulate household saving, especially among lower-income households. There is, however, more evidence that cash bonuses and direct matching can stimulate saving and have the potential to help people build a precautionary savings buffer. The Treasury and HMRC should study the impact that recent increases in the opportunities for tax relief on savings has had on the scale and distribution of household saving. Any future changes should be justified in terms of the expected outcomes for the level and distribution of saving.
94. The Help to Save scheme is a promising approach towards helping lower-income households build precautionary saving. However, at this stage its ambition is limited. The Treasury should make regular written reports to Parliament on the usage of the scheme and its efforts to increase take-up. It should give consideration to widening the eligibility criteria in future.
“Sidecar” savings
95. In 2017, the NEST pension scheme, together with the MAS, announced a trial of “sidecar savings”, a hybrid product which would allow people to put part of their pension savings into a rainy-day fund, which could be accessed in emergencies. Potentially, sidecar savings could be brought into the pensions auto-enrolment system. Previously, the Treasury had concluded that this approach should not be pursued, following a call for evidence in 2011.102
96. The evidence received by this inquiry was mixed on the prospects for a wider rollout of sidecar savings. Matt Upton, Head of Policy for Consumer and Public Services at Citizens Advice, told the Committee that “we would encourage the principle, but not anything that ebbs away at your pension”, while John Montague, Managing Director of the Big Issue
99 Evidence submitted by the Money Advice Service (HHF0020)100 Oral evidence taken on 8 May 2018, Household financess income, saving & debt, HC 600, Q316101 See Evidence submitted by Toynbee Hall (HHF0044)102 NEST Insight, Liquidity and sidecar savings, 2017
29 Household financess income, saving and debt
Group, said “The whole point of auto-enrolment was to try to build something… To rob it now really is Peter and Paul.” However, Phil Andrew, Chief Executive of StepChange, was more positive:
We think there is a place for this, if it is properly policed and done for extremely specific purposes for a small portion of your overall pot. If it is a small, short-term bridging element, we are okay with that.103
97. In oral evidence, the former pensions ministers, Baroness Ros Altmann and Sir Steve Webb, thought that sidecar savings could be suitable, with proper limits. Sir Steve suggested that the limit could be set at the amount eligible for the 25 per cent tax free lump sum.104
98. The evidence on the merits of sidecar savings schemes is mixed. The Government should examine the results of NEST’s trial of sidecar savings, and, if it is a success, assist with a wider trial and rollout, including any necessary legislative changes.
103 Oral evidence taken on 28 February 2018, Household financess income, savings and debt, HC 565, Q75–76104 Oral evidence taken on 13 March 2018, Household financess income, savings and debt, HC 565, Q237
Household financess income, saving and debt 30
5 Saving for retirement99. A number of changes are presenting new challenges to households saving for retirement. In particular, the ongoing shift from defined benefit (DB) to defined contribution (DC) pensions105 is placing more responsibility and risk on individuals in ensuring they have sufficient funds for retirement. Additionally, if forecasts that reduced productivity growth and low real interest rates will persist in the long term prove to be accurate, more income will need to be put aside in savings, in order to reach a given standard of living in retirement.106
100. The UK has a low state pension by the standards of other advanced economies,107 and hence reliance on private savings to bolster the incomes in retirement is greater. Baroness Ros Altmann, the Minister of State for Pensions from 2015 to 2016, told the Committee:
The problem we have here is that we have a very low state pension and it has to be supplemented by private pensions for most people in order to get a decent lifestyle later… Younger people are either going to be very poor in later life, if we do not plan in the longterm future to supplement the state pension, or future generations of taxpayers are going to have to subsidise them.108
The UK savings gap
101. The Government’s Automatic Enrolment Review 2017 reported that 12 million people in the UK are currently not saving enough for their retirement (or 38 per cent of those aged between 22 and the state pension age).109 According to the analysis, many of those under-savers are relatively high earners, but 1.6 million are forecast to have an income at the point they retire of less than £24,500 (in today’s earning terms). 5.7 million of the total 12 million under-savers are forecast to miss their retirement income targets by less than 20 per cent.110
102. The Review did find that there had been a substantial reduction in under-saving recently, due mainly to the introduction of automatic enrolment. As of November 2017, over 9 million employees had been automatically enrolled, while the opt-out rate was 9 per cent. Automatic enrolment had reduced the number of under-savers by an estimated 2 million, and the share of the youngest cohort that is under-saving from 48 per cent to 36 per cent.111 Automatic enrolment is considered in more detail below.
103. Witnesses to this inquiry agreed that the UK faced a long-term household savings gap. Ashwin Kumar, Chief Economist at the Joseph Rowntree Foundation, told the Committee that “it is manifestly the case that so many people simply do not have enough pension savings”. Michael Johnson, a research fellow at the Centre for Policy Studies, agreed and added that there was an especially large savings gap for women:
105 Office for National Statistics, Occupational Pension Schemes Surveys UK, 2016, 28 September 2017106 See Chapter 1 of this report107 CityAM, It’s officials The UK’s state pension is the least generous in the OECD, 6 December 2017108 Oral evidence taken on 13 March 2018, Household financess income, savings and debt, HC 565, Q232–235109 Based on target replacement rates of gross pre-retirement income by gross pensions income ranging from
around 80% for the lowest earners and 50% for the highest earners.110 Department for Work and Pensions, Automatic enrolment review 2017s analytical report, 17 December 2017111 Ibid
31 Household financess income, saving and debt
Yes. Clearly there is a huge savings gap and it is particularly pertinent in respect of women … If we look at the number of women, for example, who are participating in some form of DC savings arrangement, it is roughly 3.5 million; in respect of men, it is nearly double that. If you look at the size of the respective pots, a typical woman’s pot at 60 or 65 is maybe £50,000 to £55,000; for men, it is more than double that.112
104. Nisha Arora, Director of Market Intelligence, Data and Analysis at the Financial Conduct Authority (FCA), told the Committee that its Financial Lives survey broadly confirmed this picture:
The people we spoke to feel that they have relatively little in their pots. Of the people, for example, who accessed a DC pension in the last two years, half agreed the pension income they had was not sufficient to live on … More women than men are relying on the state pension. That is both retirees and those due to retire. Fewer women—60%—have a private pension, compared to 70% of men. Average saving levels for women are less than for men. All this means that women told us they were less happy with the pension arrangements and more likely to worry they will not have enough money to last them into retirement.113
The Automatic Enrolment Review reports that, of the 1.6 million low earners who are under-saving for their retirements, 0.9 million are women and 0.7 million are men.114
105. As part of the Automatic Enrolment Review, the Government proposed a package of changes to automatic enrolment, including the removal of the Lower Earnings Limit that excludes the first £5,876 default pension contributions, and a reduction in the lower age limit from 22 to 18. The analysis found that these measures reduced under-saving, but only by 200,000. When the Committee asked Guy Opperman, the Minister for Pensions and Financial Inclusion, about the savings gap, he focused on the existing plans for automatic enrolment:
… Auto-enrolment and nudge theory have been absolutely a success and have addressed that particular problem of pension savings … it is not the ultimate solution but we are heading in the right direction.
… The [automatic enrolment] review itself, which we have adopted, sets out the particulars whereby it is reducing the age rate from 22 down to 18, changing the LEL, changing the £10,000 limit down to the first pound and addressing things in relation to low earners in particular. We believe those are the next steps… but the serious point is we need to get past 8% [default pension contribution rate]. We need to get to April 2019, get to 8% and review where we are in terms of opt-out. […] We have further to go, but we have a review and we have next steps planned… We cannot go any more quickly right now.115
112 Oral evidence taken on 14 November 2017, Household financess income, saving & debt, HC 600, Q3113 Oral evidence taken on 8 May 2018, Household financess income, saving & debt, HC 600, Q296114 Department for Work and Pensions, Automatic Enrolment Review 2017s Maintaining the Momentum, 17
December 2017115 Oral evidence taken on 8 May 2018, Household financess income, saving & debt, HC 600, Q296
Household financess income, saving and debt 32
106. Submissions to this inquiry recognised the early successes of automatic enrolment, and many agreed that there should be a focus on ensuring the smooth implementation of the planned increases in the default contribution rate.116 Torsten Bell, the Director of the Resolution Foundation, told the Committee that:
The most important thing that can be done right now is to make a success of auto-enrolment and that not going wrong. For all of us who were involved in the late 2000s and into the early 2010s, there are not many public policy triumphs; this is one.
[…]
The risk is that we have been seeing very low opt-out rates from auto-enrolment. That is partly [because] the level of contributions are tiny at the moment and are going to go up a lot over the next few years… For a typical earner, it may well be that all of their earnings growth is taken in increased auto-enrolment contributions, so they will see no take-home pay increase. We all think it is a good thing that they are saving more—we support the policy—but we want to think hard about what that is going to do to the opt-out rates from it, particularly for the groups that we have seen real successes among, the young and women… I would be seriously thinking about whether we are doing everything we can to reduce the chance of opt-out.117
107. Despite the welcome and significant boost to savings rates achieved by automatic enrolment, millions of people are still expected to under-save for their pensions on current policies, many of them to a significant extent. Further reforms to the pensions saving landscape and automatic enrolment will be required to ensure that households have sufficient income in retirement.
108. The Committee is concerned by the evidence it has received that this savings gap is particularly large among women. The Treasury should assess what is driving this gap, and what the consequences could be for both individuals and households.
109. Auto-enrolment has, to date, been enormously successful. The Government is right to focus on ensuring that existing plans for raising the default contribution rate go smoothly. However, looking beyond that, there is little evidence of a plan, or even an ambition, to reduce further the number of under-savers from its current level of 12 million. If the Government has reasons to think that current levels of under-saving are acceptable, then it should say so and explain why.
Tax relief on pensions
110. The main financial incentive that the Government provides for long-term saving is tax relief on pension contributions. In 2016/17, the cost to the taxpayer of income tax and NICs relief on pensions was around £41 billion.118 The tax relief offered has become less
116 Including employee and employer contributions, the rate previously rose from began at 2 per cent, rose to 5 per cent in April 2018, and will rise to 8 per cent from April 2019 (The Pensions Regulator, Increase of automatic enrolment contributions, accessed 3 July 2017)
117 Oral evidence taken on 14 November 2017, Household financess income, saving & debt, HC 600, Q9–10118 Evidence submitted by the Economic Secretary to the Treasury (HHF0052) and HMRC, Estimated Costs of Tax
Reliefs, 23 January 2018
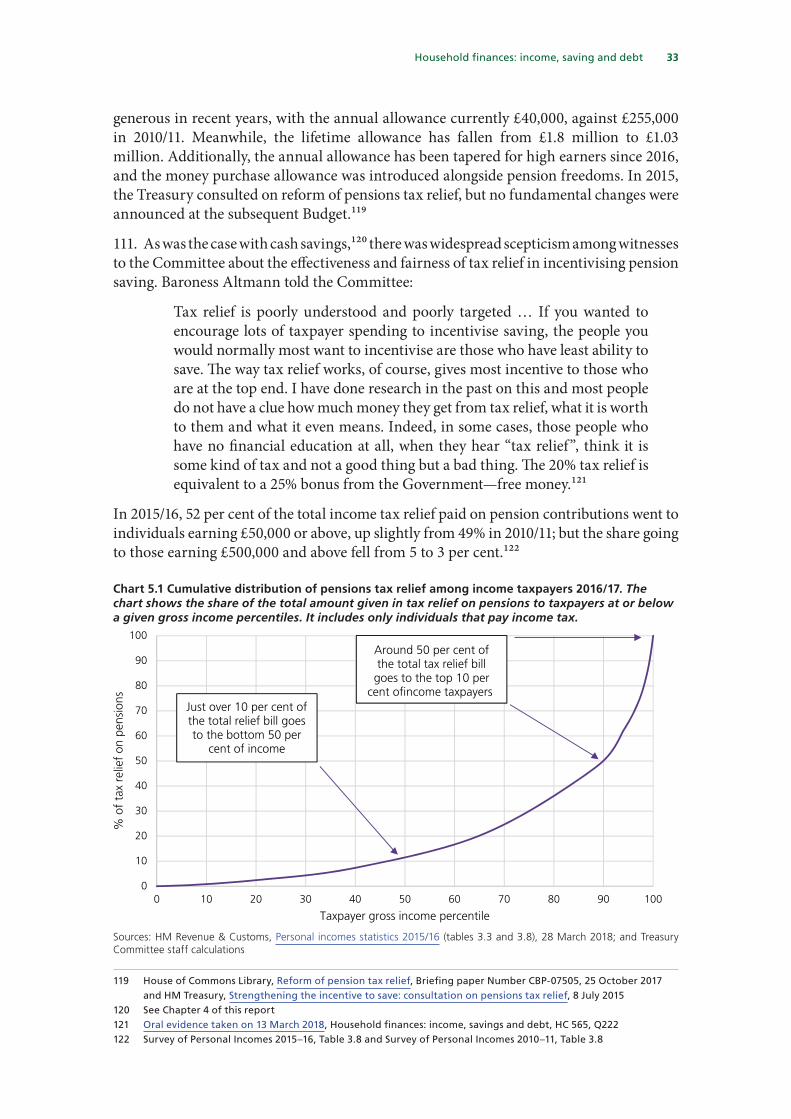
33 Household financess income, saving and debt
generous in recent years, with the annual allowance currently £40,000, against £255,000 in 2010/11. Meanwhile, the lifetime allowance has fallen from £1.8 million to £1.03 million. Additionally, the annual allowance has been tapered for high earners since 2016, and the money purchase allowance was introduced alongside pension freedoms. In 2015, the Treasury consulted on reform of pensions tax relief, but no fundamental changes were announced at the subsequent Budget.119
111. As was the case with cash savings,120 there was widespread scepticism among witnesses to the Committee about the effectiveness and fairness of tax relief in incentivising pension saving. Baroness Altmann told the Committee:
Tax relief is poorly understood and poorly targeted … If you wanted to encourage lots of taxpayer spending to incentivise saving, the people you would normally most want to incentivise are those who have least ability to save. The way tax relief works, of course, gives most incentive to those who are at the top end. I have done research in the past on this and most people do not have a clue how much money they get from tax relief, what it is worth to them and what it even means. Indeed, in some cases, those people who have no financial education at all, when they hear “tax relief”, think it is some kind of tax and not a good thing but a bad thing. The 20% tax relief is equivalent to a 25% bonus from the Government—free money.121
In 2015/16, 52 per cent of the total income tax relief paid on pension contributions went to individuals earning £50,000 or above, up slightly from 49% in 2010/11; but the share going to those earning £500,000 and above fell from 5 to 3 per cent.122
Chart 5.1 Cumulative distribution of pensions tax relief among income taxpayers 2016/17. The chart shows the share of the total amount given in tax relief on pensions to taxpayers at or below a given gross income percentiles. It includes only individuals that pay income tax.
IN CONFIDENCE – FOR COMMITTEE USE 44
Sources: HM Revenue & Customs, Personal incomes sta�s�cs 2015/16 (tables 3.3 and 3.8), 28 March 2018; and Treasury Commi�ee staff calcula�ons
Michelle Cracknell, the Chief Executive of the Pensions Advisory Service told the Committee that, even among the relatively engaged pool of people that 5 contact her organisation, tax relief and other bene�its of pension saving are poorly understood:
When people contact us, they are aware that they need to do something in respect of their pension, but they �ind the barriers too high and it is a combination of lack of knowledge and lack of 10 con�idence. We �ind that a lot of people miss out on opportunities and so do not get the most out of the tax reliefs or they do not get the bene�it from employer contributions because of misunderstandings.
[…]
Looking at the automatic enrolment population or where we do 15 outreach work, it is fair to say that tax relief has very little meaning to people, although they do get the concept that if you put one in, the
0
10
20
30
40
50
60
70
80
90
100
0 10 20 30 40 50 60 70 80 90 100
% o
f ta
x re
lief
on p
ensi
ons
Taxpayer gross income percentile
Chart 5.1 Cumulative distribution of pensions tax relief among income taxpayers 2016/17
The chart shows the share of the total amount given in tax relief on pensions to taxpayers at or below a given gross
income percentiles. It includes only individuals th
Just over 10 per cent of the total relief bill goesto the bottom 50 per
cent of income
Around 50 per cent of the total tax relief bill
goes to the top 10 per cent ofincome taxpayers
Sources: HM Revenue & Customs, Personal incomes statistics 2015/16 (tables 3.3 and 3.8), 28 March 2018; and Treasury Committee staff calculations
119 House of Commons Library, Reform of pension tax relief, Briefing paper Number CBP-07505, 25 October 2017 and HM Treasury, Strengthening the incentive to saves consultation on pensions tax relief, 8 July 2015
120 See Chapter 4 of this report121 Oral evidence taken on 13 March 2018, Household financess income, savings and debt, HC 565, Q222122 Survey of Personal Incomes 2015–16, Table 3.8 and Survey of Personal Incomes 2010–11, Table 3.8
Household financess income, saving and debt 34
112. Michelle Cracknell, the Chief Executive of the Pensions Advisory Service told the Committee that, even among the relatively engaged pool of people that contact her organisation, tax relief and other benefits of pension saving are poorly understood:
When people contact us, they are aware that they need to do something in respect of their pension, but they find the barriers too high and it is a combination of lack of knowledge and lack of confidence. We find that a lot of people miss out on opportunities and so do not get the most out of the tax reliefs or they do not get the benefit from employer contributions because of misunderstandings.
[…]
Looking at the automatic enrolment population or where we do outreach work, it is fair to say that tax relief has very little meaning to people, although they do get the concept that if you put one in, the employer will put in one as well and you will get a bit from the Government.123
113. Michael Johnson strongly criticised the cost and effectiveness of tax relief and advocated its abolition:
[There] is a fundamental question that countries around the globe are struggling with, which is: do financial incentives actually work? I am coming round to the idea, having done a fair amount of research on this, that the answer is no. […]
I would scrap all pensions tax relief, including employer NICs rebates. That creates a cash flow of about £46 billion a year. I would introduce a bonus structure that is an incentive disconnected from your tax-paying status … I would also bring down the annual allowance from today’s £40,000, which is irrelevant to virtually everybody in the country, to a number between £8,000 and £10,000. I would abandon the lifetime allowance as a quid pro quo, because it is essentially manna from heaven for consultants and does not do a great deal for everybody else. […]124
114. However, other witnesses were more cautious about the feasibility of reform at this scale, and advocated more incremental steps.125 For Sir Steve Webb, the Minister of State for Pensions from 2010–15 and now Director of Policy at Royal London, such steps could include a reduction in the annual allowance and abolition of the lifetime allowance:
In terms of incremental reform, it has become hideously complicated… so simplification would be the most important thing. Instead of having an annual allowance, a tapered annual allowance, a lifetime allowance, have a simple, perhaps lower, if necessary, annual allowance. Having an annual allowance and a lifetime allowance seems odd; you are capped on the way in and on the way out, and the lifetime allowance is a cap on success …
123 Oral evidence taken on 13 March 2018, Household financess income, savings and debt, HC 565, Q180, Q202124 Oral evidence taken on 14 November 2017, Household financess income, saving & debt, HC 600, Q4, Q9125 These included Torsten Bell (“We all can agree that pension tax relief is an expensive, inefficient way
of subsidising savings. The most important thing that can be done right now is to make a success of auto-enrolment and that not going wrong.”) and Ashwin Kumar (“we have not necessarily advocated specifically the abolition of tax relief”). Ibid.
35 Household financess income, saving and debt
[You should also] stop tinkering. We have had six cuts to limits on tax relief in seven years. That keeps financial advisers up all night trying to keep up with everything, and it means the public have no idea what the rules are, which keep changing… In terms of big-bang reform, it would be very difficult to do because of huge numbers of gainers and losers.126
Written submissions to the inquiry from the pensions industry also called for a period of stability in the pensions tax relief system.127
115. Other witnesses advocated replacing the current system with a flat rate of tax relief for all incomes. Ashwin Kumar said that “I cannot see any justification for it being higher than the basic rate of tax”128 while Baroness Altman told the Committee “my preference would be for everybody to get the same incentive for the same contribution”. Baroness Altmann also suggested that “It would be really helpful and more effective if we were able to badge tax relief as a Government bonus on your pension or the Government contribution to your pension”.129
116. John Glen, the Economic Secretary to the Treasury, acknowledged the debate around further reform of tax relief, but did not commit to going further:
[Reductions to the annual and lifetime allowances has been] a significant journey to change the whole incentives and tax relief. I recognise that there are a range of opinions about how much further that could go and what the appropriate contribution is that the state should be making to incentivise, but we have to see it against that starting point.
You are right to say that there are other ways of looking at this in terms of whether it should go further or whether it should be a flat rate. These debates have been out there for a long time. There is, however, also an issue around stability, and we have got to a place now where we are saving, I think, £6 billion from the changes that we have made and, arguably, a lot of that was going to subsidise wealthy people’s pensions.130
117. There is widespread acknowledgement that tax relief is not an effective or well-targeted way of incentivising saving into pensions. Ultimately, the Government may want to return to the question of whether there should be fundamental reform. However, the existing state of affairs could be improved through further, incremental changes. In particular, the Government should give serious consideration to replacing the lifetime allowance with a lower annual allowance, introducing a flat rate of relief, and promoting understanding of tax relief as a bonus or additional contribution.
126 Oral evidence taken on 13 March 2018, Household financess income, savings and debt, HC 565, Q222127 Evidence submitted by Hargreaves Lansdowne (HHF0015), Evidence submitted by UK Finance (HHF0028) and
Evidence submitted by Zurich Insurance (HHF0031)128 Oral evidence taken on 14 November 2017, Household financess income, saving & debt, HC 600, Q4, Q9129 Oral evidence taken on 13 March 2018, Household financess income, savings and debt, HC 565, Q222130 Oral evidence taken on 8 May 2018, Household financess income, saving & debt, HC 600, Q311
Household financess income, saving and debt 36
The Lifetime ISA
118. At Budget 2016, a new long-term savings product, the Lifetime ISA (LISA), was announced. Although it borrows the long-established label “ISA”, the LISA is effectively a combination of a long-term pensions saving vehicle and the Right to Buy ISA, which it is due to replace.131 As implemented, it allows participants to save up to £4,000 each year until they are 50, in stocks and shares or cash, with the Government awarding a 25% bonus each year. The investment can be withdrawn without charge for the purposes of buying a first home costing no more than £450,000, or after the age of 60. If it is withdrawn early, there is a 25 per cent charge on the entire investment.
119. The LISA represents a step towards replacing tax relief with matching bonus incentives. However, it was strongly criticised by many witnesses to this inquiry for its complexity and its inconsistency with the other parts of the long-term savings landscape. Sir Steve (former minister and now Royal London) said:
When the lifetime ISA was announced, it felt like snatching defeat from the jaws of victory. We had autoenrolment, where the 20somethings and the 30somethings are the most likely to stay in; there are well over 2 million under-40s now in workplace pensions who were not before. We already had Help to Buy ISAs, so if you think that those sorts of schemes help and do not just ramp up house prices, we had one of those already. We had workplace pensions finally getting young people into pension-saving, albeit at a modest level and then, suddenly, we get this strange hybrid.
The original worry was people would choose lifetime ISAs and opt out of the workplace pension, giving up employer contributions and tax relief and so on. In fact, it has been a bit of a flop … The market for the providers that provided the stocks and shares ISA was the children of rich parents. You have a rich parent who cannot use up all their pension tax limits any more, has some cash, gives it to junior, junior gets £1,000 off the Government. That does not seem, to me, to be the priority group for Government spending, so that did not really work …
Perhaps for the selfemployed, who are not getting an employer contribution, you might think this might be relevant, but what we know about the selfemployed is they quite like the idea of accessing their cash. Of course, in a LISA, yes, they can, sort of, but there is a hefty penalty, so it is not quite clear what question the LISA is the answer to.132
Baroness Altmann advocated the LISA’s abolition:
… I would urge the Committee to recommend abolishing the lifetime ISA; just scrap it. It is, in my view—and I have seen this for so many decades—another mis-selling scandal waiting to happen. That is why a lot of providers did not offer it …
131 In evidence to this Committee, the Economic Secretary to the Treasury described it as “a complement to the pension system”. Ibid, Q318
132 Oral evidence taken on 13 March 2018, Household financess income, savings and debt, HC 565, Q224
37 Household financess income, saving and debt
First, the lifetime ISA confuses house purchase with pension in a very unhelpful way. Secondly, lifetime ISAs have the wrong behavioural incentives. First of all, the contributions stop at age 50. Actually, most people can start affording a bit more than that, but if you are in the lifetime ISA as a retirement-savings vehicle, come age 50 you will think, “I have done that. That is me sorted,” so you will not do any more. [Secondly], unlike the lifetime ISA, where you can get your hands on the money tax-free at age 60, the pension has built-in disincentives for you to spend it too early; you face big tax penalties… If people start relying on ISAs and LISAs for retirement, they are bound to be pretty poor in their 80s.133
120. The written evidence received by the Committee indicated that the Lifetime ISA was also unpopular in the financial services industry. UK Finance wrote that it “has yet to prove popular with providers and has therefore seen limited take up by customers … we also have concerns on where LISA fits in the overall savings landscape… [and] would encourage the Government to consider extending the Help to Buy”.134 As further evidence of the LISA’s limited take up among pensions savers, the Pensions Advisory Service told the Committee that they have received no questions where the substantial part was about LISAs, and only three online queries since April 2017 (of 25,000) that mentioned the LISA at all.135
121. At a hearing for this inquiry, the Committee raised the specific problem of the charging structure for the LISA with John Glen. It was put to him that, since the Government awards a 25 per cent bonus to LISA savings, it may seem to investors the 25 per cent charge would only amount to the loss of the bonus. In fact, the charge applies to the total investment, including the principal and any growth. This means that the investment principal is at risk, since if there were no growth, an early withdrawal would result both in the loss of the investment, and 6.25 per cent of the principal. This had not been explained on the LISA pages on the gov.uk website. In a subsequent letter, Mr Glenn agreed that this was a valid point, and said that appropriate changes to the website would be made. As of 18 July 2018, these changes had not been made. The Committee welcomes this commitment, and would like to see it fulfilled as soon as possible.136
122. This inquiry has received strong criticism of the Lifetime ISA (LISA) over its complexity, its perverse incentives, its lack of complementarity with the pensions saving landscape and its apparent lack of popularity with the industry and pension savers. The Government should abolish it.
123. In promoting the LISA to retail investors, the Government has not been clear enough that those withdrawing their money early lose not only the 25 per cent bonus, but also a fraction of their capital. In this respect, the standards of disclosure on the gov.uk website fall far below those expected of regulated firms. The Committee welcomes the Minister’s commitment to clarifying the website, but it is deeply disappointed that it has not yet been done, two months after the Minister promised to do so.
133 Ibid134 Evidence submitted by UK Finance (HHF0028)135 Evidence submitted by the Pensions Advisory Service (HHF0049)136 Evidence submitted by the Economic Secretary to the Treasury (HHF0052)
Household financess income, saving and debt 38
Increasing savings under automatic enrolment—auto-escalation and self-employment
124. As outlined above, many of those who gave evidence to the Committee on automatic enrolment emphasised the need to consolidate its early success, and ensure the smooth implementation of the planned increases in the default contribution rate. Nonetheless, two main areas of reform were highlighted that could make a contribution to closing further the saving gap.
125. The first of these was automatic escalation, which expands on the “nudge” principle by linking future rises in the default contribution rate above 8 per cent to individuals’ increases in pay. Sir Steve told the Committee:
… if you are on a low wage and you get a state pension, [8 per cent] is enough, but it is not enough for people much beyond that. […] I believe we should keep the 8 per cent where it is, but in behavioural economics there is the “save more tomorrow” idea. Every time you get a pay rise, that 8 per cent becomes 8.5 per cent, then 9 per cent. It just steps up, because the most painless time to put more in a pension is when you have had a pay rise—money you have never had… Any other things we might come up with, such as incentives, advertising, education and so on, are tiny compared with auto-enrolment, defaults and nudges. It works.
Baroness Altmann agreed that automatic escalation with pay rises makes sense but added “there is nothing to stop the pensions industry recommending people to do that and talking to employers about doing that now … it does not need legislation.”137
126. While maintaining its focus on keeping opt-outs from automatic enrolment low during the rise in the contribution rate to 8 per cent, the Government should start considering the options for raising contribution rates for at least some people beyond that point, potentially by automatically escalating individual contribution rates in line with pay rises. This option and any alternatives should be analysed at the next automatic enrolment review.
127. The second area of reform concerns the growing numbers of self-employed, including “gig economy” workers, who are not covered by auto-enrolment. Witnesses to this inquiry widely agreed that there is a need to address this issue. Michelle Cracknell said she was concerned about the lack of engagement among the self-employed with pension saving:
[The Pensions Advisory Service] are currently doing some work on trying to understand how to reach the self-employed. The reason for that is the number of people who contact us who are self-employed, out of our 205,000, is only 8 per cent, which is incredibly low when you think that those people have no other support mechanism … At the moment, the majority of the self-employed people who contact us have previously had an employment experience, so they have in their mind already an idea that they do need to provide something out of their pay that covers benefits and pension,
137 Oral evidence taken on 13 March 2018, Household financess income, savings and debt, HC 565, Q224
39 Household financess income, saving and debt
etcetera. Again, it is quite worrying that with an increasing number of people going into self-employment, in the broadest definition of the word, they do not have any grounding as to how they should apportion their pay.138
128. Ashwin Kumar and Torsten Bell also argued that the exclusion of the self-employed from automatic enrolment system had exacerbated the incentives for employers to create pseudo-self-employment roles, without the degree of autonomy normally associated with self-employment, in order to benefit from lower taxes.139
129. When asked whether the Government should get on with moving the self-employed into automatic enrolment, Sir Steve answered:
Absolutely, yes. We do not have an exact parallel with the employer, but we have something pretty close… In the order of 2 million self-employed people fill in a tax return. There is no reason why you could not use the tax return as, effectively, a default into pension saving … Early on in the tax-return process, when you are still feeling confident… you are asked, “If you were to put money in a pension, where would you put it?” You nominate a pension. At the end of the calculation, HMRC says, “We have done your tax calculation. We have included in this a 4% or 5% contribution. You do not have to do this. You can opt out.”
Sir Steve added that the Government “are just being too timid about it” following the attempt to raise class 4 NICs at the Spring Budget 2017.140 Michael Johnson (Centre for Policy Studies) suggested that the difference between class 1 and class 4 NICs could be used to create an automatic enrolment system for the self-employed, but similarly acknowledged that the Government may be reluctant to be seen to raise NICs for the self-employed.141
130. The Government’s response to the 2017 Automatic Enrolment Review was criticised for concluding that “there is no single or simple and straightforward mechanism to bring self-employed people into workplace pension saving” and only promising to test unspecified “targeted interventions” without a timescale.142 Guy Opperman told the Committee “we have not ducked the opportunity… there is no one solution to the individual self-employed.” He also suggested that developments in fintech would help provide a solution. When asked whether the Treasury was considering using self-assessment or NICs to bring the self-employed into automatic enrolment, John Glen said “that is not something that we are minded to do.”143
131. There is an urgent need to bring the self-employed into the automatic enrolment system, but it is not clear that the Government has a clear strategy or timetable for doing so. According to the evidence received by this inquiry, the most straightforward solution would make use of self-assessment and national insurance contributions. The Treasury should keep an open mind towards doing so, and the possibility should be analysed as part of the next automatic enrolment review.138 Ibid, Q214139 Oral evidence taken on 14 November 2017, Household financess income, saving & debt, HC 600, Q69–70140 Oral evidence taken on 13 March 2018, Household financess income, savings and debt, HC 565, Q227–228141 Oral evidence taken on 14 November 2017, Household financess income, saving & debt, HC 600, Q69142 Department for Work and Pensions, Automatic Enrolment Review 2017s Maintaining the Momentum, 17
December 2017 and Financial Times, UK risks lost pension generation as critics attack reforms, 17 December 2017143 Oral evidence taken on 8 May 2018, Household financess income, saving & debt, HC 600, Q296
Household financess income, saving and debt 40
The state pension triple lock
132. The “triple lock”, which raises the state pension annually by the highest of either CPI price inflation, average earnings growth or 2.5 per cent, was implemented in 2012 and has remained in place since. Earnings growth has frequently been below either 2.5 per cent or inflation and, as a result, the state pension has increased sharply relative to earnings.144 In the long term, the triple lock would be expected to exert what the Institute for Fiscal Studies has called a “ratchet effect” on the state pension: because it will always rise with the fastest of earnings, inflation or 2.5 per cent, it will grow faster than each of them.145
133. The Committee received mixed evidence on the role of the (new) state pension and triple lock. Following the implementation of pension freedoms, the state pension is seen as having an important role in providing a backstop minimum income for retirees. It is also noted that the triple lock had reduced pensioner poverty and that the UK state pension remains low by the standards of OECD economies. However, the triple lock is not seen as sustainable in the long run.146
134. Steve Webb told the Committee that he thought that the state pension was now roughly at the appropriate level, relative to earnings:
The state pension is £8,300 a year. The auto-enrolment threshold is £10,000 for a reason. There are two sorts of folk. For the folk who always earn £8,000 or £9,000 a year for their entire lives, a state pension of £8,000 or £9,000 is exactly what is right and appropriate. […] The public sector is on the hook for bucket loads of longevity risk across health, social care, public services and pensions.147
135. Nonetheless, according to the Automatic Enrolment Review, moving from the triple lock to an earnings-uprated state pension would increase the number of under-savers by 1.8 million people.148
136. The Government has committed to maintaining the triple lock on the state pension to the end of this Parliament. If it is maintained in the longer term, the state pension will rise relative to earnings indefinitely. This is clearly unsustainable. However, according to the Government’s analysis, replacing it with earnings-uprating could result in a large rise in the number of under-savers. The next auto-enrolment review should explore the options for making up with private savings the shortfall that could result if the triple lock were abandoned in future.
144 House of Commons Work and Pensions Committee, Intergenerational fairness, Third Report of Session 2016–17, 28 February 2018
145 Institute for Fiscal Studies, Andrew Hoods ‘A ‘double lock’ on the state pension would still be a bad idea’, 27 April 2017
146 See Evidence submitted by the Open University PUFin (HHF0030), Evidence submitted by the Institute and Faculty of Actuaries (HHF0014) and Evidence submitted by the International Longevity Centre UK (HHF0037)
147 Oral evidence taken on 13 March 2018, Household financess income, savings and debt, HC 565, Q227–228 Q235, Q239
148 Department for Work and Pensions, Automatic enrolment review 2017s analytical report, 17 December 2017
41 Household financess income, saving and debt
6 Planning for retirement after pension freedoms
137. The advent of pension freedoms, and the associated removal of the powerful tax incentive to use pension pots to purchase annuities, has fundamentally transformed the retirement market. According to the Financial Conduct Authority (FCA) Retirement Outcomes Review, from the introduction of pension freedoms in April 2015 to September 2017, 1.5 million defined contribution pension pots were accessed. Of these, 72 per cent were accessed by customers below the age of 65, and 55 per cent of pots were fully withdrawn. Of those pots not fully withdrawn, twice as many were used for drawdown products as annuity products, the market for which has shrunk sharply. Around 30 per cent of drawdown purchases, and 65 per cent of annuity purchases, were made without advice, and there has been a bias toward entering drawdown with the existing pension pot provider.149
138. In these early days, the overall impact of pension freedoms on the welfare of pensioners is unclear. Drawing on the FCA’s Review, the main features seem to be high levels of early access and complete withdrawal of pots, a shunning of annuities and many decisions being taken without advice. However, witnesses to the inquiry emphasised that the early days were likely not representative, since the vast majority of pots withdrawn have been small.150 The Committee did not receive evidence to suggest that a significant number of pots accessed through pension freedoms had been spent immediately on high-value consumer items such as sports cars.
139. This chapter discusses the main themes that have emerged from the early days of pension freedoms, and indicates the future directions that policy ought to take, including some specific steps the Government could take soon.
Advice, guidance and consumer engagement
140. Michelle Cracknell, the Chief Executive of the Pensions Advisory Service (TPAS), painted a worrying picture to the Committee in which people approaching retirement have not understood the nature of pension freedoms, lack a sense of ownership over their pension pots and are making decisions without knowing the full implications:
The pensions landscape has changed dramatically, and the responsibility that now sits with the individual to provide their own retirement income has happened in the law but it has not happened in people’s heads. A 50-year-old’s only reference point today will be to look at their parents, who pretty much had it all done for them. […]
Relative to pension freedoms, there have been a number of people who have said, “I just want to move my money out of the pension pot into my bank account,” with no specific reason for needing the cash. There is a very low level of ownership of pensions. If you trawl our database, people very rarely talk about “my pension”; they always talk about it in the third person: “Tesco
149 Financial Conduct Authority, Retirement Outcomes Review Final Report, MS16/1.3, 28 June 2018150 Ibid, and Oral evidence taken on 13 March 2018, Household financess income, savings and debt, HC 565, Q186
and Q192
Household financess income, saving and debt 42
pension” or “Scottish Widows pension”. People do not see it as their asset… when it is obviously so important for them to take personal responsibility for their retirement income. […]
[W]e worry about… the amount of non-advised drawdown activity… people who are ending up in drawdown lack a huge amount of knowledge about what that entails, and the decision has been driven by two things. It is either, “I just want to get hold of my tax-free cash,” and therefore the provider has said, “You have to move it into a drawdown product,” or the second reason is, “I have been told annuities are bad value, so I will buy the alternative,” not really understanding what the alternative is.
One outcome of that is people end up in a drawdown product not understanding the risks they are taking. Certainly we talk to people about going into drawdown and say, “Where are you going to invest the money? Have you thought about how to take the income and, potentially, issues when the market goes down?” and they do not even realise the money has to be invested.151
141. Ms Cracknell emphasised the need to prevent these bad habits from becoming social norms, by intervening to create virtuous new social norms. These interventions would include a “mid-life MOT”, whereby people are invited for a financial check-up around the age of 50, and default guidance, whereby people will have to actively opt-out of an appointment with the future Single Financial Guidance Body (SFGB) if they want to access their pension pot without guidance:
We are strong believers that we need to create a society where it is normal to be thinking about your retirement income, and the only way we can create that new social norm is by introducing some interventions; otherwise, why would a 50-year-old think to go and get some help on their pension? They have no reference site to say, “That is what my parents did.”
We are strong supporters of the introduction of a mid-life MOT as a concept. We are also very strong supporters of default guidance, so that when somebody is making a very big and irrevocable decision about their pension, they are sent to go and have a guidance session. They can turn around and say, “No, I do not want it,” but look at the inertia impact that has been so successful with automatic enrolment. Let us book them in and get them to turn it down, because I think then you will find that most people will say, “Now I am here I might as well have one.”152
Ms Cracknell also suggested that prompts to seek to financial guidance could be linked to a range of interactions with the public sector that occur during “life events”:
For example, when you go through a divorce process there is no nudge or intervention to say… “Have you done any budget planning, because these things are likely to have affected your financial position?” If we looked at the life events of divorce, death, birth of a child, etc., we could do a lot more,
151 Oral evidence taken on 13 March 2018, Household financess income, savings and debt, HC 565, Q181, Q187, Q193152 Ibid, Q181. See also Evidence submitted by the Pensions Advisory Service (HHF 0046)
43 Household financess income, saving and debt
very cost-effectively, to nudge people to think about their finances. The evidence suggests that people are attuned to thinking about their finances at the time of a life event and they will pick it up at that point.153
142. Several written submissions to the inquiry also expressed support for default guidance.154 The Financial Guidance and Claims Act 2018 requires the FCA to make rules requiring providers to ensure that consumers have either taken guidance, or made a decision not to, before they are allowed to access their pensions. The Act gives the FCA some latitude in how the consumer is required to indicate their opt-out. For example, they could be required to contact the SFGB to opt-out, rather than opting-out with their provider immediately before accessing their pension pot.155
143. Ms Cracknell also told the Committee the TPAS had only a limited budget for outreach.156 When asked about whether this would change for the SFGB, John Glen, the Economic Secretary to the Treasury, said “I am very sympathetic to it but the specific way it is applied will be a matter for the body to examine.” Charlotte Clark, Director of Private Pensions and arm’s length bodies at the Department for Work and Pensions (DWP), told the Committee that the Department would be “really interested in looking at [a proposal]”.157
144. The present level of many people’s engagement with and understanding of the choices available to them as a result of pension freedoms is inadequate. One approach to improving this situation is to encourage more people to take up the advice or, at a minimum, free guidance options available to them.
145. In consultations over how it will allocate its budget and priorities, the Single Financial Guidance Body (SFGB), together with the Government, should consider how a mid-life MOT could be introduced, and develop proposals for increased outreach work to engage people with pensions planning. The FCA should consider the case for introducing a strong form of default guidance before people are allowed to access their pension pots. Finally, the Government should make a cross-departmental effort to identify opportunities to “nudge” people towards pension guidance at life events where they interact with the public sector.
146. The Committee also raised with John Glen and Guy Opperman, the Minister for Pensions and Financial Inclusion, the issue of departmental sponsorship for the SFGB, which is currently given to the DWP. This followed an exchange of letters on the matter between the Chair of the Committee and Mr Glen. The Chair set out a number of concerns over whether the DWP was the relevant department to sponsor the SFGB, including: the trend away from defined benefit to defined contribution meaning that increasing numbers of pension schemes would be regulated by the FCA rather than The Pensions Regulator;
153 Ibid, Q213154 Evidence submitted by NOWs Pensions (HHF0024), Evidence submitted by Just Group (HHF0029), Evidence
submitted by LEBC Group Ltd (HHF0032), and Evidence submitted by the International Longevity Centre UK (HHF0037)
155 Financial Conduct Authority, Retirement Outcomes Review Final Report, MS16/1.3, 28 June 2018156 Oral evidence taken on 13 March 2018, Household financess income, savings and debt, HC 565, Q219157 Oral evidence taken on 8 May 2018, Household financess income, saving & debt, HC 600, Q316
Household financess income, saving and debt 44
and the need for the SFGB to work closely with the financial services industry.158 Mr Glen’s response referred to the DWP’s experience in sponsoring “similar arm’s length bodies”, but added:
DWP will be responsible for the day-to-day operational delivery of money guidance and debt advice by the body and its partners, but the Treasury will retain responsibility for the development of a national strategy to improve financial capability, people’s ability to manage debt, and financial education for children and young people, as described in the body’s strategic function. […]
I want to reassure you that we expect the Treasury Select Committee to examine Treasury Ministers on those policy matters which remain the Treasury’s responsibility. If this on occasion includes an interest in the SFGB’s delivery, we would expect DWP Ministers and the body’s chair and CEO would also be asked to provide evidence.159
At the hearing, Mr Glen declined to commit to keeping the sponsorship of the SFGB under review.160
147. The Committee remains to be convinced that the SFGB should not be under Treasury lead sponsorship in future, particularly given the continuing shift from defined benefit to defined contribution pensions. The Government should keep the SFGB’s sponsorship under review. In the meantime, the Committee intends to take a close interest in the SFGB and scrutinise it in a similar way as it does Treasury-sponsored bodies.
Default options and consumer protection
148. Increasing the take-up of pensions guidance and advice should empower people approaching retirement to make better decisions about how to use their pension pots. Nonetheless, evidence submitted to this inquiry argued that this needed to be balanced with realism about people’s appetite for guidance and advice, the intrinsic difficulty of assessing longevity risk, even for the most engaged and well-advised investors, and the prevalence of behavioural biases that can lead people to make poor decisions. That could lead both to people drawing down their pensions too quickly, or conversely to excessive caution and unnecessary frugality.161 In written evidence, the Open University Centre for Public Understanding of Finance (PUFin) said:
[S]ecure pensions are necessarily poor value for money. Our research suggests that open-market annuity rates prior to ‘freedom and choice’ offered fair value. However, in a further example of how behavioural biases influence decision-making, households tend to perceive annuities
158 Letter from the Chair of the Treasury Committee to the Economic Secretary to the Treasury, Departmental responsibility for the Single Financial Guidance Body, 7 March 2018
159 Letter from the Economic Secretary to the Treasury to the Chair of the Treasury Committee, Departmental responsibility for the Single Financial Guidance Body, 15 March 2018
160 Oral evidence taken on 8 May 2018, Household financess income, saving & debt, HC 600, Q301161 Sir Steve Webb told the Committee “Ironically, far from the notorious sports car, the biggest worry is reckless
caution; it is actually people not consuming fast enough.” Oral evidence taken on 13 March 2018, Household financess income, savings and debt, HC 565, Q239
45 Household financess income, saving and debt
as an investment (offering a poor return) as opposed to insurance against longevity risk and investment risk (for which it is reasonable to pay some kind of insurance premium).
In further research, we have found that UK individuals are generally bad at estimating their chances of surviving to later old age … Evidence from other countries suggests that people trying to live off their investments in retirement either run out of income early or live in excessive frugality …
It is also important to consider the limitations of financial advice. Even with advice, households may accept higher or, more often, lower risk than would be compatible with their situation and needs. Defaults can be an effective way of achieving broadly sensible solutions for the majority, in addition to increasing the quality and availability of financial advice.162
149. Despite the apparent preference for drawdown over annuities revealed during the early days of pension freedoms, the International Longevity Centre UK told the Committee about their survey of 5,000 55–70 year olds in which “75 per cent of people agreed with the statement: I would prefer a secure guaranteed income in retirement over an income that might rise or fall depending on returns in financial markets”.163
150. An additional limitation of advice (as opposed to guidance) is its prohibitive cost for many people. It is not clear how solvable this is. Andrew Bailey, the Chief Executive of the FCA, has said to the Committee:
What is the answer to the question of how you get low cost advice for relatively small transactions? A lot of innovation is taking place there in the so-called robo-advice market. It is still early days to conclude where that is all going to lead to. Another route will be to have a stable of more highly standardised, relatively cheap investment products, for which you do not need great advice.164
151. Several witnesses to this inquiry argued that greater levels of default investment pathways and consumer protection were required alongside pension freedoms. Michael Johnson, a research fellow at the Centre for Policy Studies, told the Committee:
[W]e cannot row back on freedom and choice [but we can] eliminate or tackle the substantial part of the risk … I proposed the idea of what I call auto-protection. The idea is that when you reach 55, which is, by the way, too early—it should be 60 or even later—if you do not take any action, some form of auto-drawdown starts to occur. You can opt out. Then, later in life, when you are in your late-70s, phase two is what I call auto-annuitisation and, again, you can opt out.165
152. Baroness Ros Altmann, the Minister of State for Pensions from 2015 to 2016, focused on enhancing consumer protection, for example, from scams:
162 Evidence submitted by the Open University PUFin (HHF0030)163 Evidence submitted by the International Longevity Centre UK (HHF0037)164 Oral evidence taken on 13 June 2018, The Work of the Financial Conduct Authority, HC 475, Q341165 Oral evidence taken on 14 November 2017, Household financess income, saving & debt, HC 600, Q11
Household financess income, saving and debt 46
I think pension freedoms are absolutely the right way forward. What we have failed to do, unfortunately, is put in adequate consumer protection alongside them at the same time … The FCA has talked about consumer protection, but it has not actually done it as well as it could in practice.166
Michelle Cracknell (TPAS) emphasised that protecting consumers against scams would require agility, and that the ban on cold-calling legislated for in the Financial Guidance and Claims Act 2018 would only go so far:
We absolutely welcome the ban on cold-calling. […] Will it be enough? No, absolutely not. We already have evidence that scammers have found other ways of contacting people. The pension is just too rich pickings, because you have people with low levels of knowledge and very big pots of money, so scammers will continue to find ways to contact people.167
153. In its Retirement Outcomes Review, the FCA appears to be moving in the direction of default pathways and greater consumer protection. In particular, the FCA is proposing that providers should offer drawdown investment pathways, based on a simple set of choices from the consumer, which it will review in a year’s time. It has also advised that the Government should consider reforming the pension freedoms regime so that people can access their 25 per cent tax-free cash without having to access the rest of their pension pots.168
154. The level and quality of consumer protection and default investment pathways associated with pension freedoms do not appear sufficient at present. There are associated concerns that scams are appearing and evolving faster than regulators and guidance bodies can adapt. The Government should be actively involved in working with the FCA and the guidance bodies to identify opportunities to enhance consumer protection and introducing default pathways to ensure that people do not make poor choices in retirement. It can start by responding to the FCA’s suggestion that it consider allowing people to access their tax-free cash separately from the rest of their pensions.
Annuities and longevity risk
155. Some witnesses to the inquiry were concerned that the sharp decline in demand for annuities since the introduction of pension freedoms may have impaired the quality of longevity risk pooling in the retirement market. Torsten Bell, the Director of the Resolution Foundation, told the Committee that:
Even if you think it is optimal from the micro perspective, clearly, from a macro perspective, one of our objectives is risk pooling. As longevity rises and the distribution of longevity remains big, pooling some of that risk is a very desirable thing, as a society as a whole. That is what the annuities market should do, but for that to happen in an inexpensive way it needs to be a big market. It needs to be liquid, it needs to be large and… we are doing the exact opposite of that.169
166 Oral evidence taken on 13 March 2018, Household financess income, savings and debt, HC 565, Q246167 Ibid, Q189168 Financial Conduct Authority, Retirement Outcomes Review Final Report, MS16/1.3, 28 June 2018169 Oral evidence taken on 14 November 2017, Household financess income, saving & debt, HC 600, Q11
47 Household financess income, saving and debt
Andrew Bailey acknowledged concerns that pension freedoms had impaired the pooling of longevity risk, telling the Committee “Arguably, you can say it has. […] if you think that there has been too great a switch towards drawdown products, your point about pooling longevity risk is correct.”170
156. Former pensions ministers Baroness Ros Altmann and Sir Steve Webb were more sanguine about the falls in annuity sales, arguing that they will pick up as people now entering retirement buy them in later life. Sir Steve said:
We are already starting to see a bit of a pick-up in annuity sales. We [used to buy] them too young… Actually, what we may see is people buying annuities later in retirement. You might buy an annuity at 75, not 55 … We may see hybrid products where you are in drawdown and the drawdown starts looking much more like an annuity later on. I am not too worried about what is happening in the annuity market.
Baroness Altmann added “Waiting until lots of life events have happened to you before you buy an annuity rather than locking in forever would make much more sense and could be part of later-life planning.”171
157. Both also said there would need to be more innovation in product design in the pensions decumulation market in order to improve longevity risk pooling.172 The FCA identified a lack of product innovation for mass market customers in its Retirement Outcomes Review, but decided to give the market more time to develop before proposing remedies.173
158. It is desirable for individuals to be able to insure against risks over which they have little control, including longevity risk. The introduction of pension freedoms—and the associated sharp decline in demand for annuities—may have reduced the extent and effectiveness of collective longevity risk pooling in the retirement market. It has been suggested that retirees will instead choose to purchase annuities at later points in their lives than they did before pension freedoms, which could offset some of the reduction in risk pooling. If this is correct, we can expect to see a partial recovery in annuity sales going forward. The Government should monitor this situation as it evolves, and may need to intervene in future if evidence of sufficient risk pooling does not emerge.
170 Oral evidence taken on 13 June 2018, The Work of the Financial Conduct Authority, HC 475, Q339171 Oral evidence taken on 13 March 2018, Household financess income, savings and debt, HC 565, Q238172 Ibid, Q241173 Financial Conduct Authority, Retirement Outcomes Review Final Report, MS16/1.3, 28 June 2018
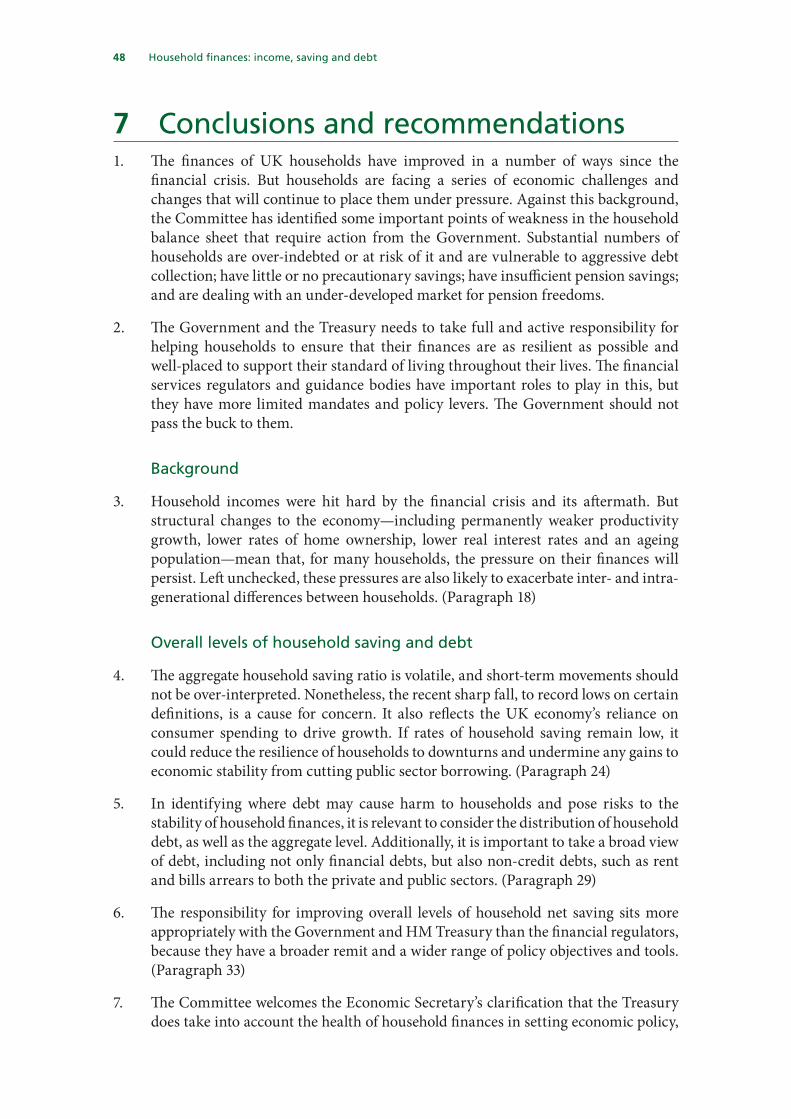
Household financess income, saving and debt 48
7 Conclusions and recommendations1. The finances of UK households have improved in a number of ways since the
financial crisis. But households are facing a series of economic challenges and changes that will continue to place them under pressure. Against this background, the Committee has identified some important points of weakness in the household balance sheet that require action from the Government. Substantial numbers of households are over-indebted or at risk of it and are vulnerable to aggressive debt collection; have little or no precautionary savings; have insufficient pension savings; and are dealing with an under-developed market for pension freedoms.
2. The Government and the Treasury needs to take full and active responsibility for helping households to ensure that their finances are as resilient as possible and well-placed to support their standard of living throughout their lives. The financial services regulators and guidance bodies have important roles to play in this, but they have more limited mandates and policy levers. The Government should not pass the buck to them.
Background
3. Household incomes were hit hard by the financial crisis and its aftermath. But structural changes to the economy—including permanently weaker productivity growth, lower rates of home ownership, lower real interest rates and an ageing population—mean that, for many households, the pressure on their finances will persist. Left unchecked, these pressures are also likely to exacerbate inter- and intra-generational differences between households. (Paragraph 18)
Overall levels of household saving and debt
4. The aggregate household saving ratio is volatile, and short-term movements should not be over-interpreted. Nonetheless, the recent sharp fall, to record lows on certain definitions, is a cause for concern. It also reflects the UK economy’s reliance on consumer spending to drive growth. If rates of household saving remain low, it could reduce the resilience of households to downturns and undermine any gains to economic stability from cutting public sector borrowing. (Paragraph 24)
5. In identifying where debt may cause harm to households and pose risks to the stability of household finances, it is relevant to consider the distribution of household debt, as well as the aggregate level. Additionally, it is important to take a broad view of debt, including not only financial debts, but also non-credit debts, such as rent and bills arrears to both the private and public sectors. (Paragraph 29)
6. The responsibility for improving overall levels of household net saving sits more appropriately with the Government and HM Treasury than the financial regulators, because they have a broader remit and a wider range of policy objectives and tools. (Paragraph 33)
7. The Committee welcomes the Economic Secretary’s clarification that the Treasury does take into account the health of household finances in setting economic policy,
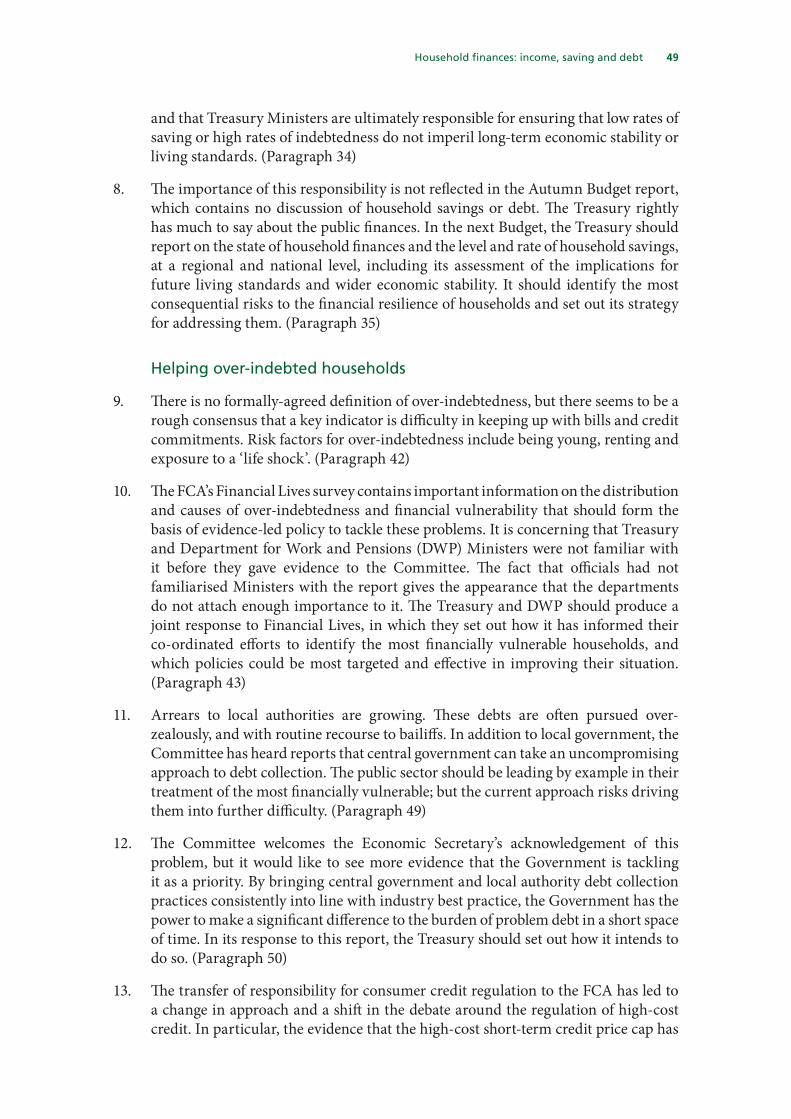
49 Household financess income, saving and debt
and that Treasury Ministers are ultimately responsible for ensuring that low rates of saving or high rates of indebtedness do not imperil long-term economic stability or living standards. (Paragraph 34)
8. The importance of this responsibility is not reflected in the Autumn Budget report, which contains no discussion of household savings or debt. The Treasury rightly has much to say about the public finances. In the next Budget, the Treasury should report on the state of household finances and the level and rate of household savings, at a regional and national level, including its assessment of the implications for future living standards and wider economic stability. It should identify the most consequential risks to the financial resilience of households and set out its strategy for addressing them. (Paragraph 35)
Helping over-indebted households
9. There is no formally-agreed definition of over-indebtedness, but there seems to be a rough consensus that a key indicator is difficulty in keeping up with bills and credit commitments. Risk factors for over-indebtedness include being young, renting and exposure to a ‘life shock’. (Paragraph 42)
10. The FCA’s Financial Lives survey contains important information on the distribution and causes of over-indebtedness and financial vulnerability that should form the basis of evidence-led policy to tackle these problems. It is concerning that Treasury and Department for Work and Pensions (DWP) Ministers were not familiar with it before they gave evidence to the Committee. The fact that officials had not familiarised Ministers with the report gives the appearance that the departments do not attach enough importance to it. The Treasury and DWP should produce a joint response to Financial Lives, in which they set out how it has informed their co-ordinated efforts to identify the most financially vulnerable households, and which policies could be most targeted and effective in improving their situation. (Paragraph 43)
11. Arrears to local authorities are growing. These debts are often pursued over-zealously, and with routine recourse to bailiffs. In addition to local government, the Committee has heard reports that central government can take an uncompromising approach to debt collection. The public sector should be leading by example in their treatment of the most financially vulnerable; but the current approach risks driving them into further difficulty. (Paragraph 49)
12. The Committee welcomes the Economic Secretary’s acknowledgement of this problem, but it would like to see more evidence that the Government is tackling it as a priority. By bringing central government and local authority debt collection practices consistently into line with industry best practice, the Government has the power to make a significant difference to the burden of problem debt in a short space of time. In its response to this report, the Treasury should set out how it intends to do so. (Paragraph 50)
13. The transfer of responsibility for consumer credit regulation to the FCA has led to a change in approach and a shift in the debate around the regulation of high-cost credit. In particular, the evidence that the high-cost short-term credit price cap has
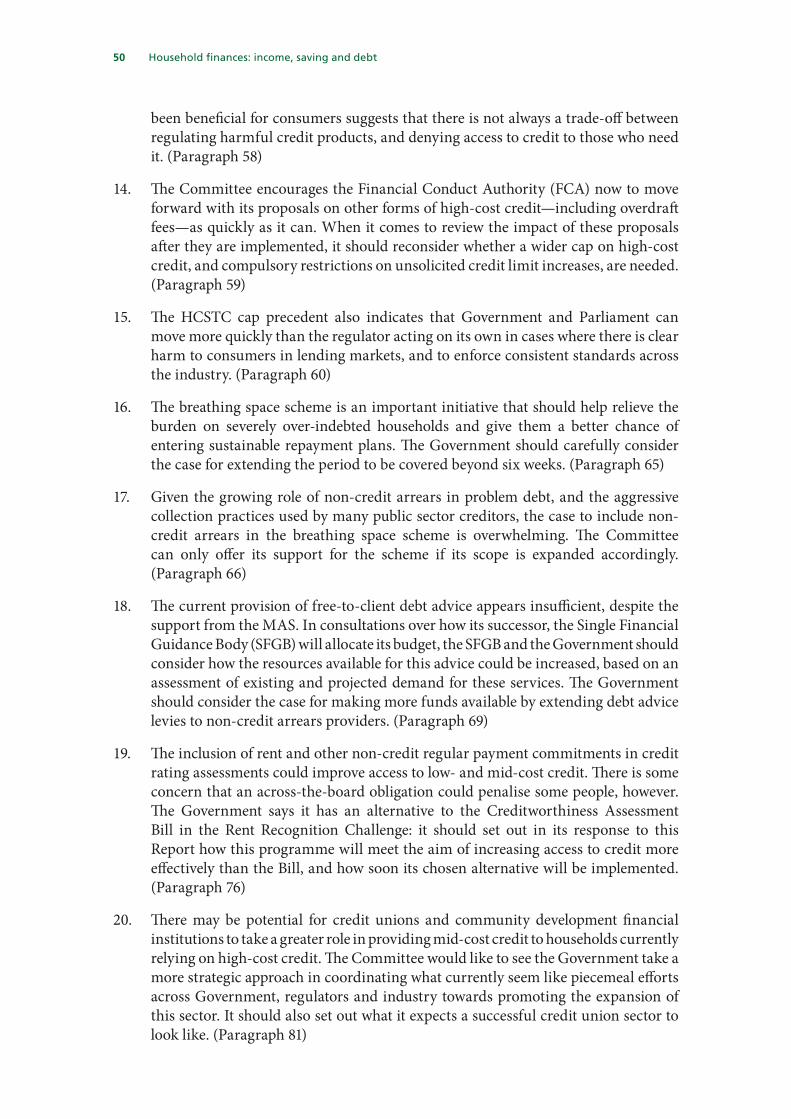
Household financess income, saving and debt 50
been beneficial for consumers suggests that there is not always a trade-off between regulating harmful credit products, and denying access to credit to those who need it. (Paragraph 58)
14. The Committee encourages the Financial Conduct Authority (FCA) now to move forward with its proposals on other forms of high-cost credit—including overdraft fees—as quickly as it can. When it comes to review the impact of these proposals after they are implemented, it should reconsider whether a wider cap on high-cost credit, and compulsory restrictions on unsolicited credit limit increases, are needed. (Paragraph 59)
15. The HCSTC cap precedent also indicates that Government and Parliament can move more quickly than the regulator acting on its own in cases where there is clear harm to consumers in lending markets, and to enforce consistent standards across the industry. (Paragraph 60)
16. The breathing space scheme is an important initiative that should help relieve the burden on severely over-indebted households and give them a better chance of entering sustainable repayment plans. The Government should carefully consider the case for extending the period to be covered beyond six weeks. (Paragraph 65)
17. Given the growing role of non-credit arrears in problem debt, and the aggressive collection practices used by many public sector creditors, the case to include non-credit arrears in the breathing space scheme is overwhelming. The Committee can only offer its support for the scheme if its scope is expanded accordingly. (Paragraph 66)
18. The current provision of free-to-client debt advice appears insufficient, despite the support from the MAS. In consultations over how its successor, the Single Financial Guidance Body (SFGB) will allocate its budget, the SFGB and the Government should consider how the resources available for this advice could be increased, based on an assessment of existing and projected demand for these services. The Government should consider the case for making more funds available by extending debt advice levies to non-credit arrears providers. (Paragraph 69)
19. The inclusion of rent and other non-credit regular payment commitments in credit rating assessments could improve access to low- and mid-cost credit. There is some concern that an across-the-board obligation could penalise some people, however. The Government says it has an alternative to the Creditworthiness Assessment Bill in the Rent Recognition Challenge: it should set out in its response to this Report how this programme will meet the aim of increasing access to credit more effectively than the Bill, and how soon its chosen alternative will be implemented. (Paragraph 76)
20. There may be potential for credit unions and community development financial institutions to take a greater role in providing mid-cost credit to households currently relying on high-cost credit. The Committee would like to see the Government take a more strategic approach in coordinating what currently seem like piecemeal efforts across Government, regulators and industry towards promoting the expansion of this sector. It should also set out what it expects a successful credit union sector to look like. (Paragraph 81)
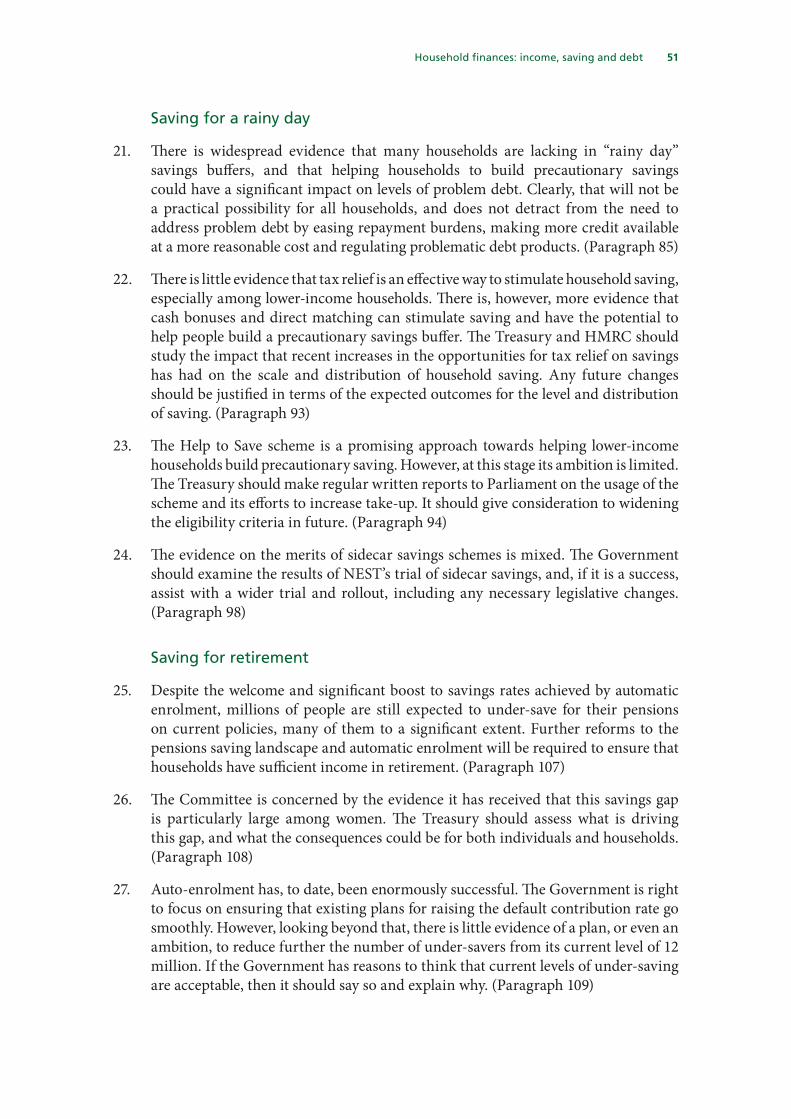
51 Household financess income, saving and debt
Saving for a rainy day
21. There is widespread evidence that many households are lacking in “rainy day” savings buffers, and that helping households to build precautionary savings could have a significant impact on levels of problem debt. Clearly, that will not be a practical possibility for all households, and does not detract from the need to address problem debt by easing repayment burdens, making more credit available at a more reasonable cost and regulating problematic debt products. (Paragraph 85)
22. There is little evidence that tax relief is an effective way to stimulate household saving, especially among lower-income households. There is, however, more evidence that cash bonuses and direct matching can stimulate saving and have the potential to help people build a precautionary savings buffer. The Treasury and HMRC should study the impact that recent increases in the opportunities for tax relief on savings has had on the scale and distribution of household saving. Any future changes should be justified in terms of the expected outcomes for the level and distribution of saving. (Paragraph 93)
23. The Help to Save scheme is a promising approach towards helping lower-income households build precautionary saving. However, at this stage its ambition is limited. The Treasury should make regular written reports to Parliament on the usage of the scheme and its efforts to increase take-up. It should give consideration to widening the eligibility criteria in future. (Paragraph 94)
24. The evidence on the merits of sidecar savings schemes is mixed. The Government should examine the results of NEST’s trial of sidecar savings, and, if it is a success, assist with a wider trial and rollout, including any necessary legislative changes. (Paragraph 98)
Saving for retirement
25. Despite the welcome and significant boost to savings rates achieved by automatic enrolment, millions of people are still expected to under-save for their pensions on current policies, many of them to a significant extent. Further reforms to the pensions saving landscape and automatic enrolment will be required to ensure that households have sufficient income in retirement. (Paragraph 107)
26. The Committee is concerned by the evidence it has received that this savings gap is particularly large among women. The Treasury should assess what is driving this gap, and what the consequences could be for both individuals and households. (Paragraph 108)
27. Auto-enrolment has, to date, been enormously successful. The Government is right to focus on ensuring that existing plans for raising the default contribution rate go smoothly. However, looking beyond that, there is little evidence of a plan, or even an ambition, to reduce further the number of under-savers from its current level of 12 million. If the Government has reasons to think that current levels of under-saving are acceptable, then it should say so and explain why. (Paragraph 109)
Household financess income, saving and debt 52
28. There is widespread acknowledgement that tax relief is not an effective or well-targeted way of incentivising saving into pensions. Ultimately, the Government may want to return to the question of whether there should be fundamental reform. However, the existing state of affairs could be improved through further, incremental changes. In particular, the Government should give serious consideration to replacing the lifetime allowance with a lower annual allowance, introducing a flat rate of relief, and promoting understanding of tax relief as a bonus or additional contribution. (Paragraph 117)
29. This inquiry has received strong criticism of the Lifetime ISA (LISA) over its complexity, its perverse incentives, its lack of complementarity with the pensions saving landscape and its apparent lack of popularity with the industry and pension savers. The Government should abolish it. (Paragraph 122)
30. In promoting the LISA to retail investors, the Government has not been clear enough that those withdrawing their money early lose not only the 25 per cent bonus, but also a fraction of their capital. In this respect, the standards of disclosure on the gov.uk website fall far below those expected of regulated firms. The Committee welcomes the Minister’s commitment to clarifying the website, but it is deeply disappointed that it has not yet been done, two months after the Minister promised to do so. (Paragraph 123)
31. While maintaining its focus on keeping opt-outs from automatic enrolment low during the rise in the contribution rate to 8 per cent, the Government should start considering the options for raising contribution rates for at least some people beyond that point, potentially by automatically escalating individual contribution rates in line with pay rises. This option and any alternatives should be analysed at the next automatic enrolment review. (Paragraph 126)
32. There is an urgent need to bring the self-employed into the automatic enrolment system, but it is not clear that the Government has a clear strategy or timetable for doing so. According to the evidence received by this inquiry, the most straightforward solution would make use of self-assessment and national insurance contributions. The Treasury should keep an open mind towards doing so, and the possibility should be analysed as part of the next automatic enrolment review. (Paragraph 131)
33. The Government has committed to maintaining the triple lock on the state pension to the end of this Parliament. If it is maintained in the longer term, the state pension will rise relative to earnings indefinitely. This is clearly unsustainable. However, according to the Government’s analysis, replacing it with earnings-uprating could result in a large rise in the number of under-savers. The next auto-enrolment review should explore the options for making up with private savings the shortfall that could result if the triple lock were abandoned in future. (Paragraph 136)
Planning for retirement after pension freedoms
34. The present level of many people’s engagement with and understanding of the choices available to them as a result of pension freedoms is inadequate. One approach to improving this situation is to encourage more people to take up the advice or, at a minimum, free guidance options available to them. (Paragraph 144)
53 Household financess income, saving and debt
35. In consultations over how it will allocate its budget and priorities, the Single Financial Guidance Body (SFGB), together with the Government, should consider how a mid-life MOT could be introduced, and develop proposals for increased outreach work to engage people with pensions planning. The FCA should consider the case for introducing a strong form of default guidance before people are allowed to access their pension pots. Finally, the Government should make a cross-departmental effort to identify opportunities to “nudge” people towards pension guidance at life events where they interact with the public sector. (Paragraph 145)
36. The Committee remains to be convinced that the SFGB should not be under Treasury lead sponsorship in future, particularly given the continuing shift from defined benefit to defined contribution pensions. The Government should keep the SFGB’s sponsorship under review. In the meantime, the Committee intends to take a close interest in the SFGB and scrutinise it in a similar way as it does Treasury-sponsored bodies. (Paragraph 147)
37. The level and quality of consumer protection and default investment pathways associated with pension freedoms do not appear sufficient at present. There are associated concerns that scams are appearing and evolving faster than regulators and guidance bodies can adapt. The Government should be actively involved in working with the FCA and the guidance bodies to identify opportunities to enhance consumer protection and introducing default pathways to ensure that people do not make poor choices in retirement. It can start by responding to the FCA’s suggestion that it consider allowing people to access their tax-free cash separately from the rest of their pensions. (Paragraph 154)
38. It is desirable for individuals to be able to insure against risks over which they have little control, including longevity risk. The introduction of pension freedoms—and the associated sharp decline in demand for annuities—may have reduced the extent and effectiveness of collective longevity risk pooling in the retirement market. It has been suggested that retirees will instead choose to purchase annuities at later points in their lives than they did before pension freedoms, which could offset some of the reduction in risk pooling. If this is correct, we can expect to see a partial recovery in annuity sales going forward. The Government should monitor this situation as it evolves, and may need to intervene in future if evidence of sufficient risk pooling does not emerge. (Paragraph 158)

Household financess income, saving and debt 54
Formal minutesWednesday 19 July 2018
Members present:
Nicky Morgan, in the Chair
Rushanara AliCharlie ElphickeStewart Hosie
Mr Alister JackJohn MannWes Streeting
Draft Report (Household finances: income, saving and debt), proposed by the Chair, brought up and read.
Ordered, That the draft Report be read a second time, paragraph by paragraph.
Paragraphs 1 to 158 read and agreed to.
Resolved, That the Report be the Nineteenth Report of the Committee to the House.
Ordered, That the Chair make the Report to the House.
Ordered, That embargoed copies of the Report be made available, in accordance with the provisions of Standing Order No. 134.
[Adjourned till Tuesday 4 September at 1.00 p.m.
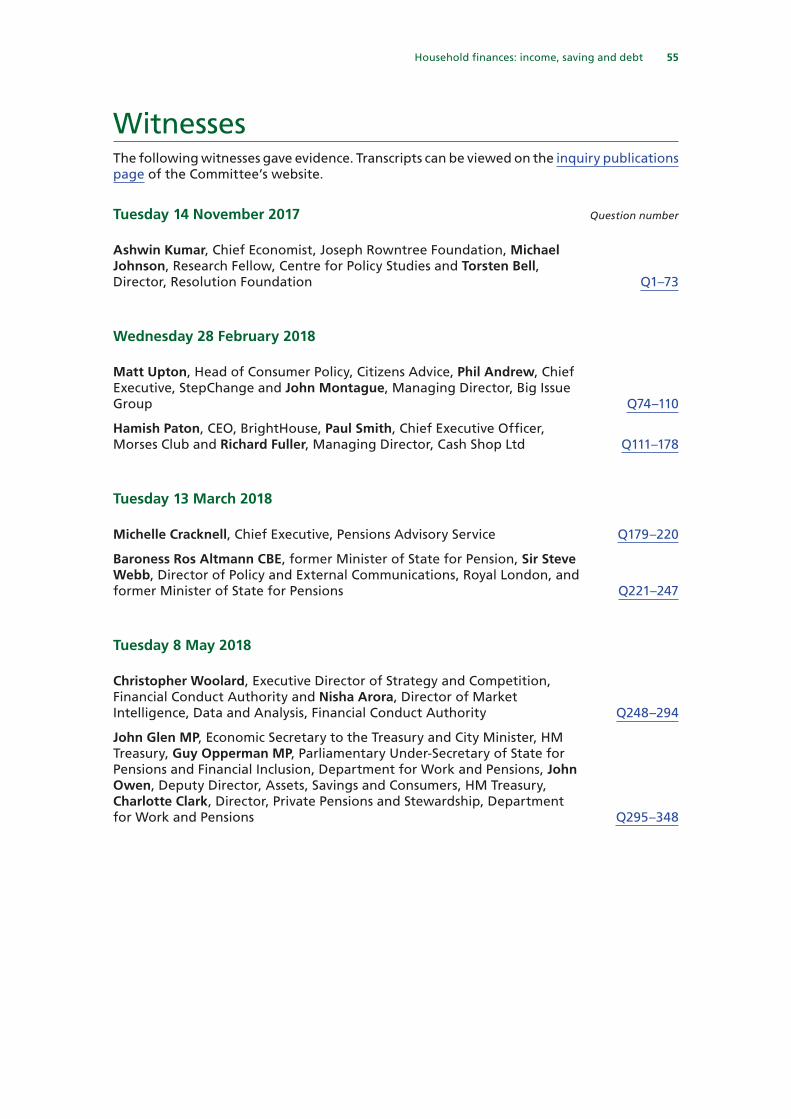
55 Household financess income, saving and debt
WitnessesThe following witnesses gave evidence. Transcripts can be viewed on the inquiry publications page of the Committee’s website.
Tuesday 14 November 2017 Question number
Ashwin Kumar, Chief Economist, Joseph Rowntree Foundation, Michael Johnson, Research Fellow, Centre for Policy Studies and Torsten Bell, Director, Resolution Foundation Q1–73
Wednesday 28 February 2018
Matt Upton, Head of Consumer Policy, Citizens Advice, Phil Andrew, Chief Executive, StepChange and John Montague, Managing Director, Big Issue Group Q74–110
Hamish Paton, CEO, BrightHouse, Paul Smith, Chief Executive Officer, Morses Club and Richard Fuller, Managing Director, Cash Shop Ltd Q111–178
Tuesday 13 March 2018
Michelle Cracknell, Chief Executive, Pensions Advisory Service Q179–220
Baroness Ros Altmann CBE, former Minister of State for Pension, Sir Steve Webb, Director of Policy and External Communications, Royal London, and former Minister of State for Pensions Q221–247
Tuesday 8 May 2018
Christopher Woolard, Executive Director of Strategy and Competition, Financial Conduct Authority and Nisha Arora, Director of Market Intelligence, Data and Analysis, Financial Conduct Authority Q248–294
John Glen MP, Economic Secretary to the Treasury and City Minister, HM Treasury, Guy Opperman MP, Parliamentary Under-Secretary of State for Pensions and Financial Inclusion, Department for Work and Pensions, John Owen, Deputy Director, Assets, Savings and Consumers, HM Treasury, Charlotte Clark, Director, Private Pensions and Stewardship, Department for Work and Pensions Q295–348
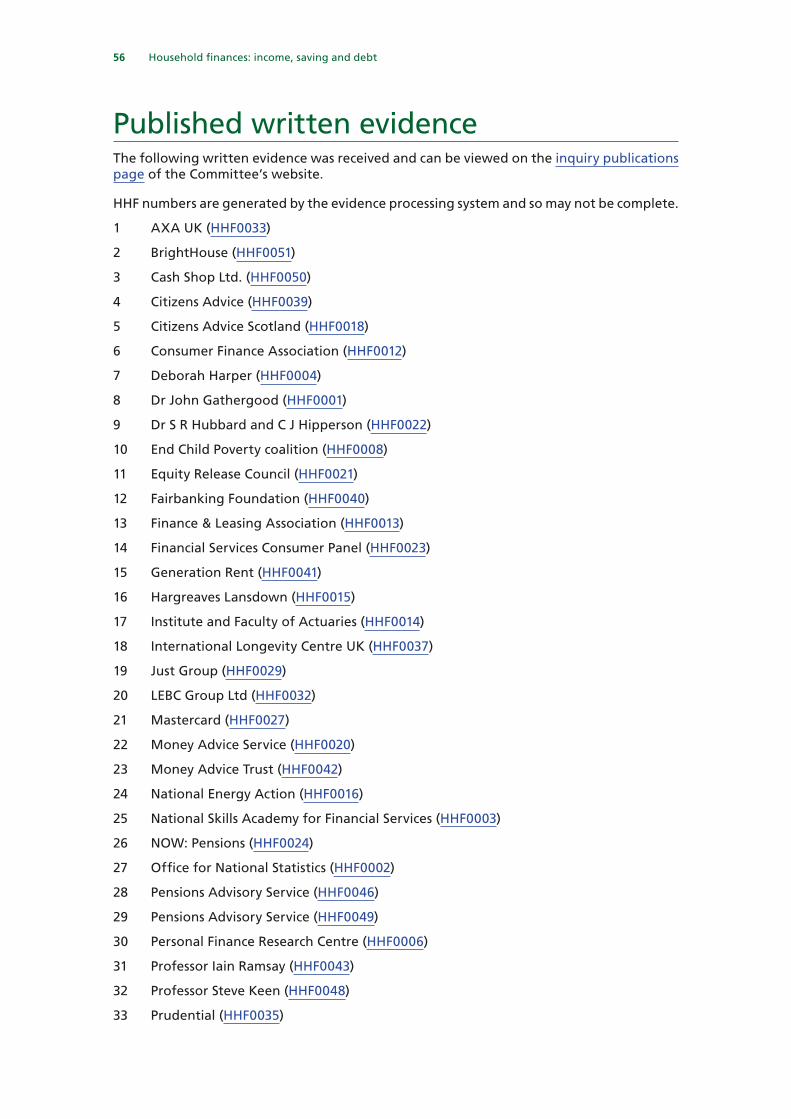
Household financess income, saving and debt 56
Published written evidenceThe following written evidence was received and can be viewed on the inquiry publications page of the Committee’s website.
HHF numbers are generated by the evidence processing system and so may not be complete.
1 AXA UK (HHF0033)
2 BrightHouse (HHF0051)
3 Cash Shop Ltd. (HHF0050)
4 Citizens Advice (HHF0039)
5 Citizens Advice Scotland (HHF0018)
6 Consumer Finance Association (HHF0012)
7 Deborah Harper (HHF0004)
8 Dr John Gathergood (HHF0001)
9 Dr S R Hubbard and C J Hipperson (HHF0022)
10 End Child Poverty coalition (HHF0008)
11 Equity Release Council (HHF0021)
12 Fairbanking Foundation (HHF0040)
13 Finance & Leasing Association (HHF0013)
14 Financial Services Consumer Panel (HHF0023)
15 Generation Rent (HHF0041)
16 Hargreaves Lansdown (HHF0015)
17 Institute and Faculty of Actuaries (HHF0014)
18 International Longevity Centre UK (HHF0037)
19 Just Group (HHF0029)
20 LEBC Group Ltd (HHF0032)
21 Mastercard (HHF0027)
22 Money Advice Service (HHF0020)
23 Money Advice Trust (HHF0042)
24 National Energy Action (HHF0016)
25 National Skills Academy for Financial Services (HHF0003)
26 NOWs Pensions (HHF0024)
27 Office for National Statistics (HHF0002)
28 Pensions Advisory Service (HHF0046)
29 Pensions Advisory Service (HHF0049)
30 Personal Finance Research Centre (HHF0006)
31 Professor Iain Ramsay (HHF0043)
32 Professor Steve Keen (HHF0048)
33 Prudential (HHF0035)

57 Household financess income, saving and debt
34 Relate (HHF0011)
35 Responsible Finance (HHF0010)
36 Scope (HHF0047)
37 StepChange Debt Charity (HHF0009)
38 The Children’s Society (HHF0045)
39 The Low Incomes Tax Reform Group (HHF0036)
40 The Open University (HHF0030)
41 TISA (HHF0034)
42 Toynbee Hall (HHF0044)
43 Trades Union Congress (HHF0038)
44 True Potential LLP (HHF0017)
45 UK Finance (HHF0028)
46 Young Money (HHF0007)
47 Zurich Insurance (HHF0031)
Household financess income, saving and debt 58
List of Reports from the Committee during the current ParliamentAll publications from the Committee are available on the publications page of the Committee’s website. The reference number of the Government’s response to each Report is printed in brackets after the HC printing number.
Session 2017–19
First Report Appointment of Sir Dave Ramsden as Deputy Governor for Markets and Banking at the Bank of England
HC 472
Second Report Appointment of Professor Silvana Tenreyro to the Bank of England Monetary Policy Committee
HC 471
Third Report The Solvency II Directive and its impact on the UK Insurance Industry
HC 324 (HC 863)
Fourth Report Transitional arrangements for exiting the European Union
HC 473 (HC 850)
Fifth Report Autumn Budget 2017 HC 600 (HC 757)
Sixth Report Appointment of Elisabeth Stheeman to the Financial Policy Committee
HC 758
Seventh Report Student Loans HC 478 (HC 995)
Eighth Report Appointment of Charles Randell as Chair of the Financial Conduct Authority and the Payment Systems Regulator
HC 838
Ninth Report Childcare HC 757 (HC 1196)
Tenth Report Re-appointment of Alex Brazier to the Financial Policy Committee
HC 936
Eleventh Report Re-appointment of Donald Kohn to the Financial Policy Committee
HC 937
Twelth Report Re-appointment of Martin Taylor to the Financial Policy Committee
HC 938
Thirteenth Report The Motability Scheme HC 847
Fourteenth Report Re-appointment for Gertjan Vlieghe to the Monetary Policy Committee
HC 1056
Fifteenth Report Women in finance HC 477
Sixteenth Report Appointment of Bradley Fried as Chair of Court, Bank of England
HC 1319
Seventeenth Report Appointment of Professor Jonathan Haskel to the Monetary Policy Committee
HC 1318
Eighteenth Report Appointment of Andy King to the Budget Responsibility Committee of the OBR
HC 1340
59 Household financess income, saving and debt
First Special Report Transitional arrangements for exiting the European Unions Government Response to the Treasury Committee’s Fourth Report
HC 850
Second Special Report The Solvency II Directive and its impact on the UK Insurance Industrys Bank of England Response to the Committee’s Third Report of session 2017–19
HC 863
Third Special Report Autumn Budget 2017s Government and Office for Budget Responsibility responses to the Treasury Committee’s Fifth Report
HC 757
Fourth Special Report Student Loanss Government and Office for National Statistics responses to the Committee’s Seventh Report
HC 995
Fifth Special Report Childcares Government Response to the Committee’s Ninth Report
HC 1196