Embed Size (px)
Citation preview
8/6/2019 Low Income Household Improvement
http://slidepdf.com/reader/full/low-income-household-improvement 1/46
EARD Special Studies
Low-Income Households’
Access to Financial Services
International Experience, Measures forImprovement, and the Future
Nimal A. Fernando
8/6/2019 Low Income Household Improvement
http://slidepdf.com/reader/full/low-income-household-improvement 2/46
Nimal A. Fernando
Low-Income Households’ Access to Financial Services
International Experience, Measures forImprovement, and the Future
EARD Special Studies
October 2007
8/6/2019 Low Income Household Improvement
http://slidepdf.com/reader/full/low-income-household-improvement 3/46
ii
© 2007 Asian Development Bank
All rights reserved. Published 2007.
Printed in the Philippines.
Publication Stock No. 080907
Cataloging-In-Publication Data
ADB study on the access to nancial services or low-income households.
1. Access to nance 2. Low-income households
The views expressed in this paper are those o the author and do not necessarily refect the views and policies
o the Asian Development Bank, or its Board o Governors or the governments they represent.
The Asian Development Bank does not guarantee the accuracy o the data included in this publication and
accepts no responsibility or any consequences o their use.
Use o the term “country” does not imply any judgment by the author or the Asian Development Bank as to
the legal or other status o any territorial entity.
This publication is available on the Asian Develoment Bank’s micronance web site:
http://www.adb.org/micronance
Nimal A. Fernando is Practice Leader (Micronance) in the East Asia Department
o the Asian Development Bank
8/6/2019 Low Income Household Improvement
http://slidepdf.com/reader/full/low-income-household-improvement 4/46
iii
CONTENTS
Page
Abbreviations
Foreword v
Abstract
I. Introduction 1
II. Low-Income Households’ Demand or Financial Services 3
III. Dimensions o the Access Problem 4
IV. Factors Underlying Low Access 11
V. Overview o Cross-Country Experience 15
VI. Measures to Improve Access to Finance 26
VII. The Future o Access to Finance 30
VIII. Conclusions
Reerences and Websites 34

8/6/2019 Low Income Household Improvement
http://slidepdf.com/reader/full/low-income-household-improvement 5/46
iv
ABBREVIATIONS
ADB – Asian Development Bank
ASA – Association or Social Advancement
BRI – Bank Rakyat Indonesia
IRDA Insurance Regulatory and Development Authority (India)
MFI – micronance institution
NGO – nongovernment organization
PRC – People’s Republic o China
RFAS – Rural Finance Access Survey
ROA – return on assets
ROE – return on equity
SHG – sel-help group
SMEs – small and medium-size enterprises
WOCCU – World Council o Credit Unions
8/6/2019 Low Income Household Improvement
http://slidepdf.com/reader/full/low-income-household-improvement 6/46
v
FOREWORD
A
ccess to nancial services plays an important role
in inclusive development. Broader access makes
it possible or low-income households to not only
make use o economic opportunities but also improve
their health, education, and other social indicators
thus signiicantly improving their socioeconomic
well-being. However, in most developing countries,
a majority o the population, low-income people in
particular, do not have access to nancial services
rom ormal and semiormal sources. Even those who
have gained access owing to recent developments in
nancial services or the low-income people are oten
underserved. In the Asia and Pacic region alone, more
than 300 million households suer rom lack o access
to nancial services rom the ormal and semiormal
sectors. As a result, many o these households are
compelled to rely on inormal sources o nance. I
inclusive development is to become a reality, this
problem must be addressed head-on and as early as
possible.
This paper discusses dierent dimensions o the
problem o access to nance o low-income people
and provides cross-country experience in improving
access to highlight the diversity o approaches that
dierent countries ollow. In addition, the paper
proposes a number o measures to trigger a more
powerul process toward improved access.
The Asian Development Bank hopes that the
paper will help not only policy makers but also
practitioners to gain a better understanding o the
gravity o the problem o access to nance o low-
income households, and ormulate and implement
policies and other measures to make a signicant dent
in the problem, thus enabling millions o unserved
and underserved low-income households to actively
participate in, and benet rom, the development
process.
H. Satish Rao
Director General
East Asia Department
Asian Development Bank
8/6/2019 Low Income Household Improvement
http://slidepdf.com/reader/full/low-income-household-improvement 7/46
vi
ABSTRACT
Formal inancial sectors in most developing
economies serve only a minority, oten no more
than 20–30% o the population. Most households
do not have access to even basic nancial services.
A majority o those who do not have access are
concentrated in low-income categories. Even
those low-income households who have access to
nance are underserved both in terms o quantity
and quality o products and services. Access to
nance is not a magic bullet capable o liting poor
people out o poverty. However, there is consensus
that better access can play a potentially key role
in inclusive growth and development. Hence, the
problem o lack o access to nance or a majority
o the people deserves a great deal o attention and
must be addressed head-on. This paper discusses
dierent dimensions o the access problem and
provides global experience in improving access or
low-income households. The paper highlights the
diversity o approaches adopted and the institutional
modalities used by dierent countries. It concludes
that the global experience provides useul insights or
policy makers and practitioners who are committed
to address the issue. While many stakeholders have
to participate in the eorts to improve access to
nance in quantitative and qualitative terms, the
cross-country experience and the gravity o the access
problem suggest that governments have a major role
to play. Government role, however, must be ocused
on promoting the important role that private sector
nancial institutions could play in this task.
8/6/2019 Low Income Household Improvement
http://slidepdf.com/reader/full/low-income-household-improvement 8/46
vii
“The biggest challenge or developing economies
is to get the banks to the unbanked, rather thanto get the unbanked to the banks.”
Brian Richardson
Managing Director
Wizzit (cellphone-based banking acility)
South Arica
“Poorly unctioning banks that simply unnel credit
to connected parties and elites slow growth and
exert a disproportionately negative infuence on the
poor and small businesses by depriving them o thecapital they need to succeed. Unortunately, billions
o people live in countries with poorly unctioning
banks. Thus, banking policies matter because banks
infuence the ability o people, rich and poor, to
improve their living standards”.
James R. Barth, Gerard Caprio, Jr., and Ross Levine. 2006.
Rethinking Bank Regulation: Till Angels Govern. New York:
Cambridge University Press. 2.

8/6/2019 Low Income Household Improvement
http://slidepdf.com/reader/full/low-income-household-improvement 9/46
viii
8/6/2019 Low Income Household Improvement
http://slidepdf.com/reader/full/low-income-household-improvement 10/46
I. INTRODUCTION1
I
n developed economies, ormal nancial sectors
serve a majority. For example, 99% o the population
o Denmark, 96% o the population o Germany, 91%
o the population o the Unites States o America, and
96% o the population o France has a bank account
(Peachy and Roe. 2004, 31). The opposite is true,
unortunately, or developing countries. According
to the World Savings Banks Institute (2004), only 20%
o the population in most developing economies
has access to ormal nancial services. In a typical
developing economy in the Asia and Pacic region, the
ormal nancial system at best serves no more than
20–30% o the population, and excludes 70–80%, the
vast majority o whom are low-income households in
rural areas. With rapid urbanization, rural-to-urban
migration, and increasing urban poverty, the share o
low-income people without access to nance in urban
areas is also increasing in many countries.
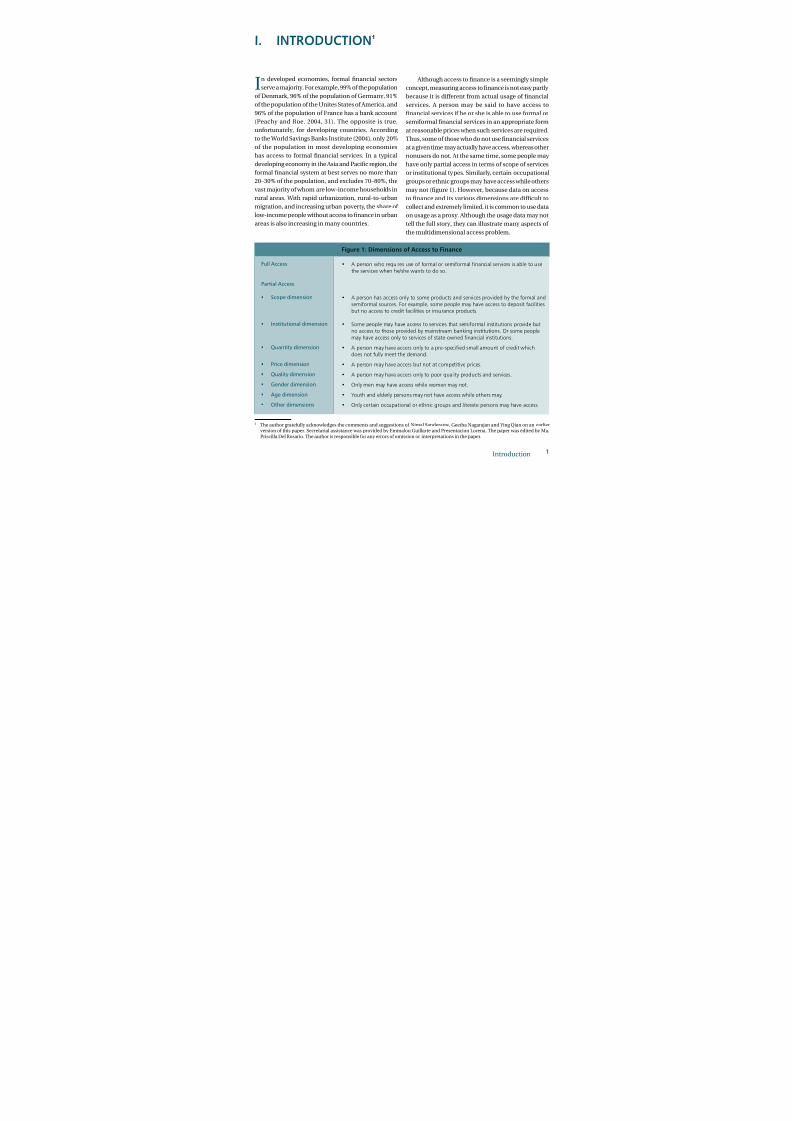
Although access to nance is a seemingly simple
concept, measuring access to nance is not easy partly
because it is dierent rom actual usage o nancial
services. A person may be said to have access to
nancial services i he or she is able to use ormal or
semiormal nancial services in an appropriate orm
at reasonable prices when such services are required.
Thus, some o those who do not use nancial services
at a given time may actually have access, whereas other
nonusers do not. At the same time, some people may
have only partial access in terms o scope o services
or institutional types. Similarly, certain occupational
groups or ethnic groups may have access while others
may not (gure 1). However, because data on access
to nance and its various dimensions are dicult to
collect and extremely limited, it is common to use data
on usage as a proxy. Although the usage data may not
tell the ull story, they can illustrate many aspects o
the multidimensional access problem.
Introduction
1 The author grateully acknowledges the comments and suggestions o Nimal Sanderatne, Geetha Nagarajan and Ying Qian on an earlierversion o this paper. Secretarial assistance was provided by Emmalou Guillarte and Presentacion Lorena. The paper was edited by Ma.Priscilla Del Rosario. The author is responsible or any errors o omission or interpretations in the paper.
• Apersonwhorequiresuseofformalorsemiformalfinancialservicesisabletousetheserviceswhenhe/shewantstodoso.
• Apersonhasaccessonlytosomeproductsandservicesprovidedbytheformalandsemiformalsources.Forexample,somepeoplemayhaveaccesstodepositfacilitiesbutnoaccesstocreditfacilitiesorinsuranceproducts.
• Somepeoplemayhaveaccesstoservicesthatsemiformalinstitutionsprovidebutnoaccesstothoseprovidedbymainstreambankinginstitutions.Orsomepeoplemayhaveaccessonlytoservicesofstate-ownedfinancialinstitutions.
• Apersonmayhaveaccessonlytoapre-specifiedsmallamountofcreditwhichdoesnotfullymeetthedemand.
• Apersonmayhaveaccessbutnotatcompetitiveprices.
• Apersonmayhaveaccessonlytopoorqualityproductsandservices.
• Onlymenmayhaveaccesswhilewomenmaynot.
• Youthandelderlypersonsmaynothaveaccesswhileothersmay.
• Onlycertainoccupationalorethnicgroupsandliteratepersonsmayhaveaccess
Full Access
Partial Access
Scope dimension
Institutional dimension
Quantity dimension
Price dimension
Quality dimension
Gender dimension
Age dimension
Other dimensions
Figure 1: Dimensions of Access to Finance
8/6/2019 Low Income Household Improvement
http://slidepdf.com/reader/full/low-income-household-improvement 11/46
Given that inclusive development is a widely
accepted development objective, the lack o access
to nance or a majority o the population o these
countries must be considered a undamental faw in
the ormal nancial systems because it reinorces the
vicious circle o both income and non-income poverty.
Access to nance, though
not a magic bullet by any
measure, could play a
potentially signiicant
role in eorts to reduce
poverty. Like the rich,
poor households can
ben e it r o m c r edit ,
savings, payment and
insurance services, and
money transer acilities. Rutherord (2000) in his
excellent book, The Poor and Their Money, even
argues that the poor need access to nancial services
much more than the rich simply because the poor
have little money. Such services help the poor manage
their risks, smoothen consumption, take advantage
o protable economic opportunities, build income-
earning and other assets, and improve their standards
o living (ADB 2005; Helms 2006; United Nations
2006). Thus, access to ormal nancial services can
prooundly impact on
the quality o lie o low-
income households. AsRajan and Zingales (2004,
28) noted, “the limited
access to nance severely
r edu c es the c ho ic es
citizens have in determining the way they work and
live.” Without broader access to nance, only the rich
and connected people are able to take advantage o
economic opportunities. Also, when a majority o
the population is excluded rom access to nancial
services, it can signicantly and adversely impact
on the ecient allocation o nancial and physical
resources, economic growth, income and non-income
inequalities, and the distribution o benets in an
economy. Households rom Indian villages without
access to credit markets tend to reduce their children’s
schooling when they receive transitory shocks
more than households
with greater access to
nancial services ( Jacoby
and Skouias1997). The
adverse eects o lack
o access to inancial
s e r v i c e s c o u l d a l s o
s p i l l o v e r t o u t u r e
generations. In general,
lack o access to nancial
services imposes signicant direct and indirect costs
on low-income households and the economy.
The twin purposes o this paper are to briefy
discuss international experience on eorts to expand
the access to nance or low-income households and
draw some lessons rom that experience. Section 2 o
this paper describes the demand or nancial services
by the poor and low-income households. Section
3 ocuses on dierent dimensions o the access
problem. Section 4 discusses actors underlying low
access. Section 5 looks at
cross-country experience
on expanding inancialservices or low-income
households and explain
c o u n tr ies tha t ha ve
signicantly progressed
on this ront and the strategies they have adopted.
The section also discusses why some other countries
have ailed to make signicant progress. Section 6
discusses measures to improve access while section
7 looks into the uture o access to nance. Section 8
presents conclusions.
Access to nance, though not a magic bullet by
any measure, could play a potentially signicant
role in eorts to reduce poverty. Like the rich,
poor households can beneit rom credit,
savings, payment and insurance services, and
money transer acilities.
As Rajan and Zingales (2004, 28) noted, “the
limited access to nance severely reduces the
choices citizens have in determining the way
they work and live.”
8/6/2019 Low Income Household Improvement
http://slidepdf.com/reader/full/low-income-household-improvement 12/46
Low-Income Households’ Demand or Financial Services
II. LOW-INCOME HOUSEHOLDS’ DEMAND
FOR FINANCIAL SERVICES
Since the early 1980s, the conventional ormalinancial sectors have experienced a dramatic
growth. But the growth has been highly uneven and
occurred mainly at the middle and upper ends o the
nancial markets. This lop-sided growth, however,
has not been a result o lack o demand or nancial
services at the low end
o the markets. In the
Asia and Paciic region
alone, about 1.9 billion
are poor, near-poor, and
vulnerable in about 380
mil l io n ho u seho l ds,
mostly concentrated in
rural areas. The demand
or nancial services rom
these low-income households is substantial, and their
demand covers a wide range o products and services.
First, these households demand access to sae,
convenient, and appropriate deposit acilities. Second,
they demand access to credit at minimum transaction
costs and at reasonable prices or a wide range o
purposes. Third, they demand access to payment and
money transer services. In many countries, rural-to-
urban migration has resulted in signicant remittance
fows rom urban to rural areas. This is true or large
countries such as the People’s Republic o China (PRC)
and India as well as or relatively small countries
such as Cambodia and Viet Nam. Fourth, emerging
evidence suggests that demand or microinsurance
products and services is signicant. A recent study
(United Nations Development Programme [UNDP]
2007, 1), or example, estimated that the potential
market or microinsurance in India could exceed $1.4
billion in value terms. Fith, the demand or nancial
literacy services among low-income households is
also vast.
A signiicant part o the demand or depositservices and credit is generally directed at the inormal
markets. Lacking access to the kind o products
and convenient services they require rom ormal
sources, many households keep their cash at home,
with inormal savings clubs or in the orm o various
nonnancial assets such
as livestock as most rural
households do in the
Lao People’s Democratic
Republic (Lao PDR).
Similarly, households
also rely on sel-savings
or inormal sources to
nance investments and
smooth consumption.
For insurance, they rely on inormal arrangements
which rest on reciprocity in many cases. For money
transers also, they use inormal mechanisms. In
general, the eective prices that the poor and low-
income households pay in inormal markets or these
services tend to be high. Many people who save cash in
inormal markets suer signicant losses. Those who
borrow rom inormal commercial credit markets oten
have to pay very high interest rates and are unable to
get medium- to long-term loans. In addition, inormal
markets are inecient in nancial intermediation.
While many admit the drawbacks o inormal
sources o nancial services, their extensive nature
and persistent role in meeting the demand or nancial
services among low-income households conirm
beyond any doubt the importance o nancial services
in the lives o these households. Also, the widespread
existence o inormal markets conrms the act that
there are important supply-side constraints in the
ormal nancial system on the access to nancial
services or those at the low end o the market.
In the Asia and Pacic region alone, about 1.9
billion are poor, near-poor, and vulnerable
in about 380 million households, mostly
concentrated in rural areas. The demand orinancial services rom these low-income
households is substantial, and their demand
covers a wide range o products and services.
8/6/2019 Low Income Household Improvement
http://slidepdf.com/reader/full/low-income-household-improvement 13/46
III. DIMENSIONS OF THE ACCESS PROBLEM
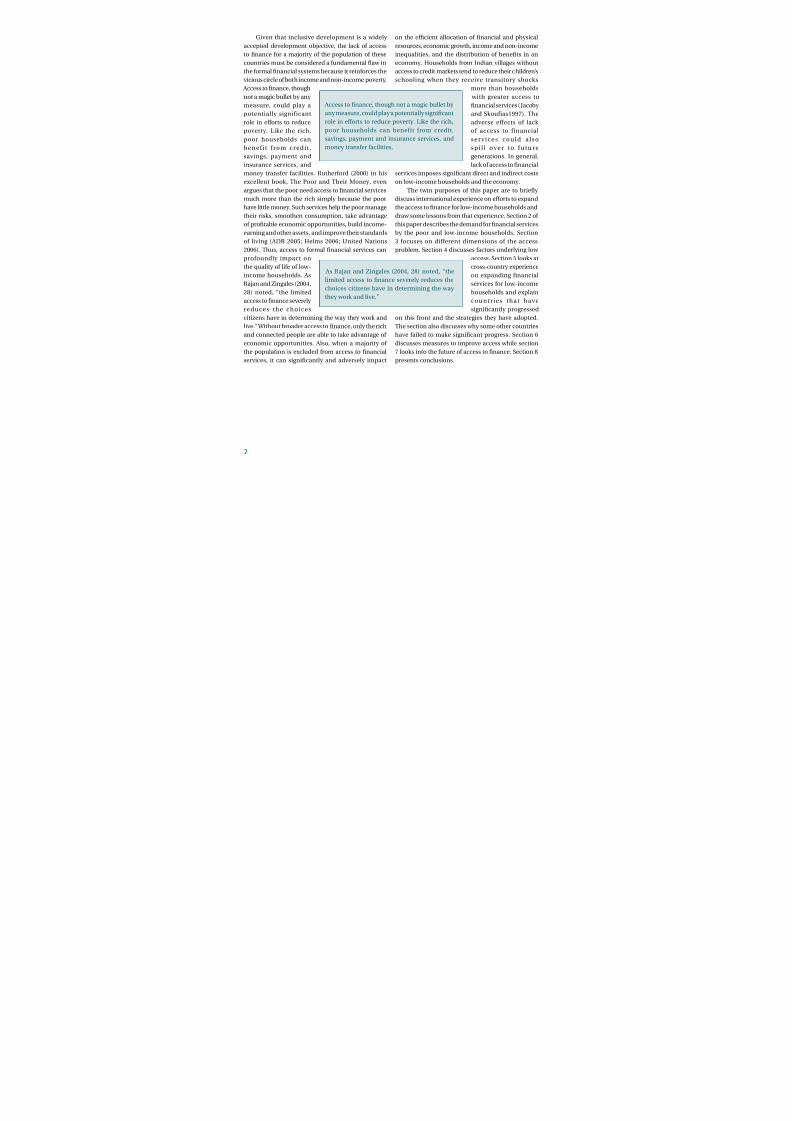
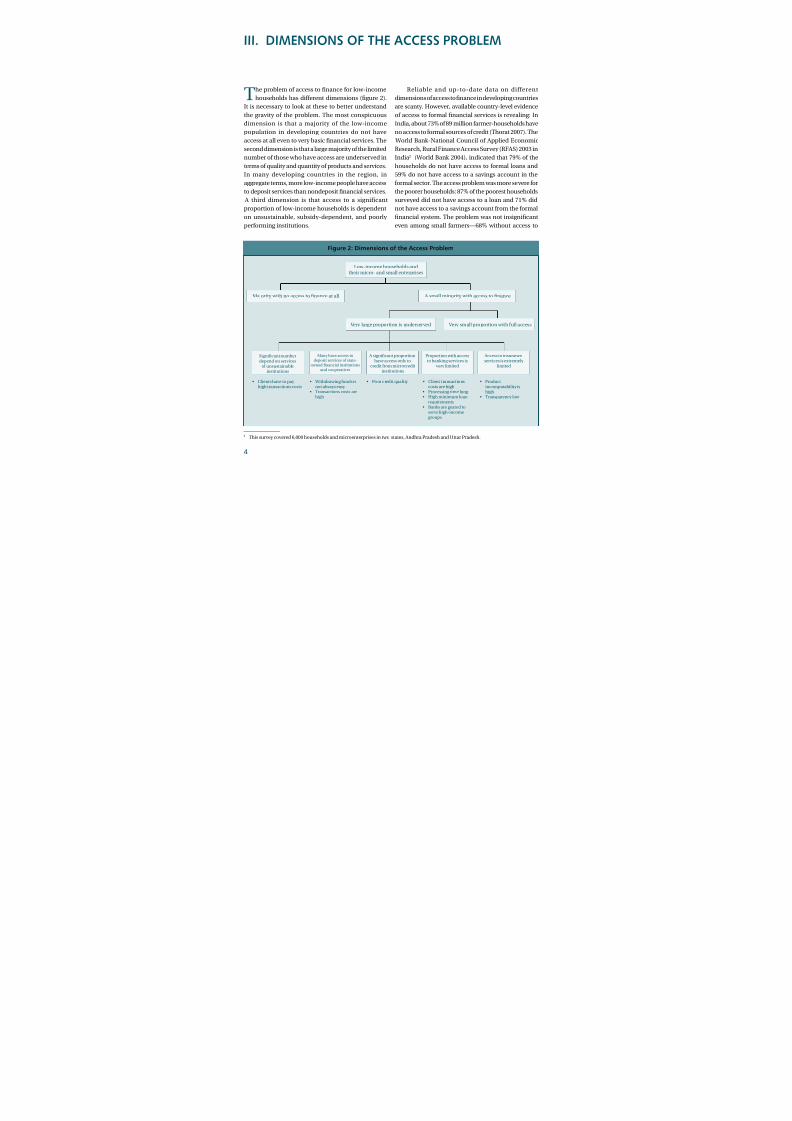
The problem o access to nance or low-incomehouseholds has dierent dimensions (gure 2).
It is necessary to look at these to better understand
the gravity o the problem. The most conspicuous
dimension is that a majority o the low-income
population in developing countries do not have
access at all even to very basic nancial services. The
second dimension is that a large majority o the limited
number o those who have access are underserved in
terms o quality and quantity o products and services.
In many developing countries in the region, in
aggregate terms, more low-income people have accessto deposit services than nondeposit nancial services.
A third dimension is that access to a signiicant
proportion o low-income households is dependent
on unsustainable, subsidy-dependent, and poorly
perorming institutions.
Reliable and up-to-date data on dierentdimensions o access to nance in developing countries
are scanty. However, available country-level evidence
o access to ormal nancial services is revealing: In
India, about 73% o 89 million armer-households have
no access to ormal sources o credit (Thorat 2007). The
World Bank-National Council o Applied Economic
Research, Rural Finance Access Survey (RFAS) 2003 in
India2 (World Bank 2004), indicated that 79% o the
households do not have access to ormal loans and
59% do not have access to a savings account in the
ormal sector. The access problem was more severe orthe poorer households: 87% o the poorest households
surveyed did not have access to a loan and 71% did
not have access to a savings account rom the ormal
nancial system. The problem was not insignicant
even among small armers—68% without access to
2 This survey covered 6,000 households and microenterprises in two states, Andhra Pradesh and Uttar Pradesh.
Figure 2: Dimensions of the Access Problem
Low-income households andtheir micro- and small enterprises
Majority with no access to nance at all A small minority with access to nance
Very large proportion is underserved Very small proportion with ull access
Many have access todeposit services o state-
owned fnancial institutions
and cooperatives
A signicant proportionhave access only to
credit rom microcredit
institutions
Signicant numberdepend on services
o unsustainable
institutions
Proportion with accessto banking services is
very limited
Access to insuranceservices is extremely
limited
• Clients have to pay high transactions costs
• Withdrawing unds isnot always easy
• Transactions costs arehigh
• Poor credit quality • Client transactionscosts are high
• Processing time long • High minimum loan
requirements• Banks are geared to
serve high-incomegroups
• Productincompatability ishigh
• Transparency low
8/6/2019 Low Income Household Improvement
http://slidepdf.com/reader/full/low-income-household-improvement 14/46
Dimensions o the Access Problem
a loan and 45% without access to a savings account.
Over 82% o the households surveyed in RFAS 2003
also did not have any insurance. Another study by
Diamond Management and Technology Consultants
(2006) concluded that less than 20% o rural Indians
have access to ormal nancial services, and about 185
million “potentially bankable” people in rural India
do not have a bank account. However, the problem
o access to nance is not conned to rural areas.
According to the Banking Ombudsman o Karnataka
State (Business Line 2006), 63% o the people in the
country do not have the benet o banking acilities.
The nancially excluded sections largely comprise
marginal armers, landless laborers, sel-employed and
unorganized sector enterprises, urban slum dwellers,
ethnic minorities, migrants, and women. Most o the
excluded people are concentrated in the North East,
Eastern, and Central regions (Thorat 2007). Access to nance is no better in Pakistan. Only
about 30% o adults have bank accounts and the
total number o borrowers rom banking institutions
constitutes only 3% o the population. There are only
171 deposit accounts and 30 loan accounts per 1,000
people. Agriculture and small and medium enterprise
credit reaches only 1.6 million and 0.3 million
borrowers, respectively (Akhtar 2007, 36). Formal
and semiormal nancial institutions reach no more
than 10% o the potential market at the low end. The
number o active borrowers served by micronanceinstitutions at the end o 2005 was estimated at 6% o
the potential market o 10 million people (Burki and
Chen 2006, 7). Rural people suer the most rom the
lack o access to nance.
According to Akhtar (2007,
36) who is the Governor o
the State Bank o Pakistan
(central bank), 67% o
the rural population
is underserved by the
ormal banking systembecause only 6% o bank branch networks reach into
rural areas.
Nepal is another country with acute problems
in access to nance. A recent survey (2006) on access
to inancial services estimated that only 52.3% o
Nepalese households are served by a ormal or
semiormal nancial institution while about 27.6%
are served by inormal sources. An estimated 19.6%
remained nancially excluded, with no service rom
the ormal or inormal inancial sector. The same
survey ound that only 26% o households have a
bank account. However, banks ocus on urban areas
and the wealthiest. In rural Nepal, only 16% o the
households have a bank account, or example. Again
this is heavily concentrated in the upper income
groups. Only 49% o the households have a deposit
account with any nancial institution. An estimated
69% o oreign remittances come through inormal
channels—usually amily and riends—even among
households with a bank account. Despite government
eorts, ormal nancial institutions do not serve the
needs o most o the Nepalese population, particularly
the low-income people (Ferrari et. al. 2007).
A large number o rural people in the PRC also do
not have access to banking services. The Organisation
or Economic Co-operation and Development (2004)reports the results o a recent national survey showing
that only 16% o armers in the PRC have access to
ormal or inormal credit. The People’s Bank o China
(the central bank) estimates (www.undp.org.cn)
that 36% (82 million) o Chinese rural households
currently have access to nancial services, primarily
through Rural Credit Cooperatives (RCCs). However,
according to the members o the agriculture and
rural development task orce at the China Council
or International Cooperation on Environment and
Development (CCICED), although RCCs cover a vastarea o the countryside with an extensive network, their
provision o loans to small-arm households is limited.
Only 25% o smallholders nationwide have obtained
a RCC loan (CCICED
Agriculture and Rural
Development Task Force
Members 2005. 356). The
small and medium-sized
enterprises (SMEs) in
the PRC also receive less
than 10% o bank creditthough their share in gross domestic product is about
50%, and 40% o SMEs have no debt mainly because
they have no easy access to ormal sources (OECD
2005).
A recent national survey showed that more than
90% o the rural population in the Lao PDR do not have
access to ormal nancial services. The main service
provider, the state-owned Agricultural Promotion
According to the Governor o the State Bank
o Pakistan, 67% o the rural population is
underserved by the ormal banking system
because only 6% o bank branch networks reach
into rural areas.
8/6/2019 Low Income Household Improvement
http://slidepdf.com/reader/full/low-income-household-improvement 15/46
Bank, serves about 5% o rural households while
another 5% are served by semiormal institutions.
With little access to reliable ormal sector acilities,
most people in rural areas o the Lao PDR continue to
hold cash at home or save in nonnancial assets. In
early 2004, rural households held an estimated $216
million equivalent in cash savings, and cash in hand
accounted or about 40% o this amount. The estimated
total noncash savings o rural households—savings in
the orm o livestock, gold, jewelry, housing materials,
etc.—were much higher, exceeding the cash savings
by a actor o 2.75 (Coleman and Wynne-Williams
2006, 46–50).
Surprisingly, even in such countries as Indonesia
where nancial services
o r t h e p o o r h a v e
expanded because o
successul institutions,the access problems
remain signiicant. A
household survey that the
Bank Rakyat Indonesia
(BRI) and a group o
researchers rom Harvard
University carried out in
October 2000 concluded
that 68% o the sample
h o u s e h o l d s d i d n o t
have credit rom any ormal or inormal inancialinstitutions, and that 62% o the sample households
did not have savings accounts in any ormal or
inormal nancial institutions. The same survey also
showed that the proportions were high even or the
group o households with viable enterprises: 58% had
no loans rom nancial institutions and 52% had no
savings in a nancial institution (BRI 2001, 36–37).
While the proportion o the sel-excluded among these
is not clear, the data tend to show that the number o
households without access to nancial services could
be large.The other dimension o the access problem is
that a large majority o the low-income households
with access are simply underserved both in terms
o quality and quantity o products and services.
The underserved category suers rom a number o
problems.
A signiicant proportion o those with access
depend on the services provided by inancially
unsustainable, heavily subsidy-dependent, and poorly
perorming institutions. Whether these institutions
can maintain, let alone increase, their outreach and
the quality o the services they provide in the uture
remains uncertain. Perhaps one o the best examples
or this is provided by the state-owned agricultural
development bank in Bangladesh.3 This bank claims
to reach over 3 million borrowers. However, the bank
relies excessively on resources provided by the central
bank to continue its operations and is saddled with
too many operational
p r o b l e m s . T h e
nonperorming assets
o the bank amountedto 50% o total assets at
the end o June 2006.
Similarly, the Bangladesh
R u r a l D e v e l o p m e n t
Board (BRDB) claims
to reach over 4 million
clients. However, the
nancial and operational
perormance o BRDB is
extremely unsatisactory:
its operations lack transparency; are characterized by poor loan recovery rates; and involve large government
subsidies, being a state agency. In addition, rent seeking
is widespread among its eld-level employees.
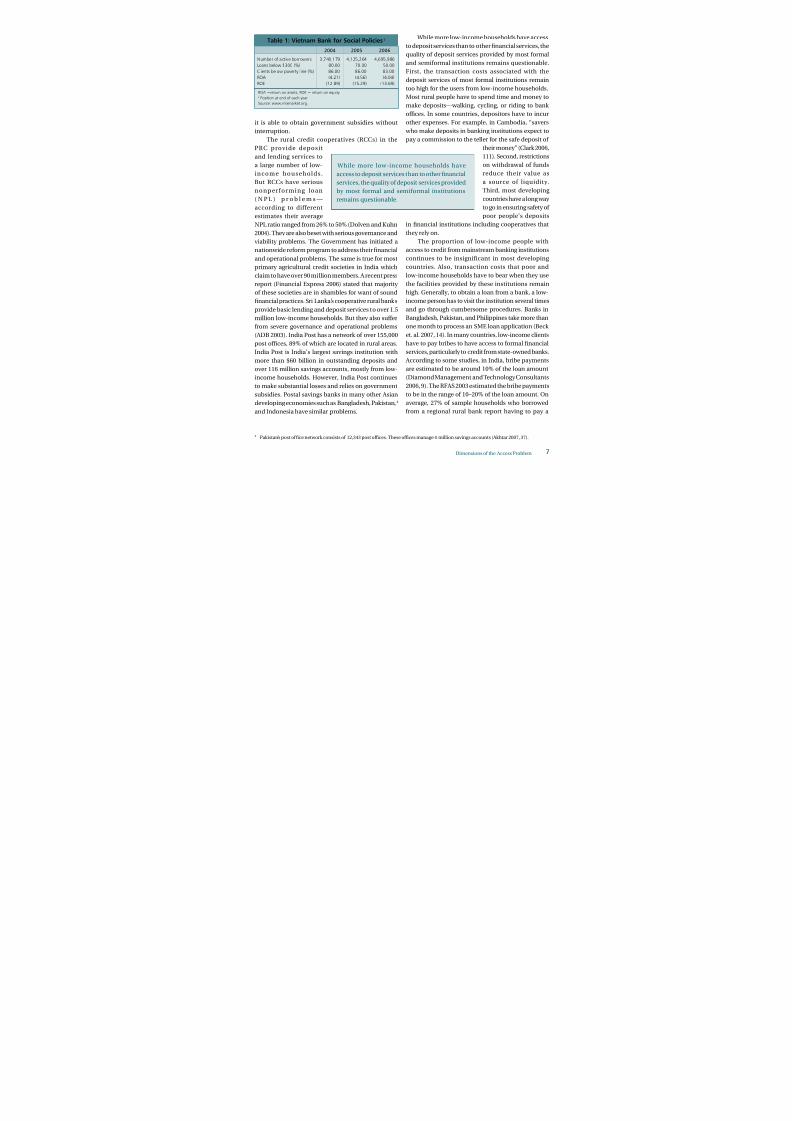
Viet Nam also has a large-scale state-owned
institution—Vietnam Bank or Social Policies (VBSP)—
that provides access to credit or low-income
households at highly subsidized interest rates. VBSP
reported 4.195 million active borrowers with a total o
$1.149 billion in gross loans outstanding at the end o
2006. However, its return on assets (ROA) and return
on equity (ROE) have continued to be signicantly negative in the last 3 years or which data are available
(table 1). At the end o 2006, ROA and ROE were –4.04%
and –13.69%. The continued operations o VBSP as a
large-scale credit agency is thus dependent on whether
3 The bank started commercial operations in 1973. In 2007, it had 948 branches, 818 o which are in rural areas. According to its proft andloss account (unadjusted or subsidies, etc.), its losses amounted to about $26 million equivalent or the fnancial year ended 30 June 2006.Its gross loans outstanding amounted to about $1.1 billion.
Surprisingly, even in such countries as Indonesia
where inancial services or the poor have
expanded because o successul institutions, the
access problems remain signicant.
A signicant proportion o those with access
depend on the services provided by nancially
unsustainable, heavily subsidy-dependent, and
poorly perorming institutions.
8/6/2019 Low Income Household Improvement
http://slidepdf.com/reader/full/low-income-household-improvement 16/46
Dimensions o the Access Problem
it is able to obtain government subsidies without
interruption.
The rural credit cooperatives (RCCs) in the
PRC provide deposit
and lending services to
a large number o low-
in c o me ho u seho l ds.
But RCCs have seriousn o n per o r min g l o a n
( N P L ) p r o b l e m s —
according to dierent
estimates their average
NPL ratio ranged rom 26% to 50% (Dolven and Kuhn
2004). They are also beset with serious governance and
viability problems. The Government has initiated a
nationwide reorm program to address their nancial
and operational problems. The same is true or most
primary agricultural credit societies in India which
claim to have over 90 million members. A recent pressreport (Financial Express 2006) stated that majority
o these societies are in shambles or want o sound
nancial practices. Sri Lanka’s cooperative rural banks
provide basic lending and deposit services to over 1.5
million low-income households. But they also suer
rom severe governance and operational problems
(ADB 2003). India Post has a network o over 155,000
post oces, 89% o which are located in rural areas.
India Post is India’s largest savings institution with
more than $60 billion in outstanding deposits and
over 116 million savings accounts, mostly rom low-income households. However, India Post continues
to make substantial losses and relies on government
subsidies. Postal savings banks in many other Asian
developing economies such as Bangladesh, Pakistan,4
and Indonesia have similar problems.
4 Pakistan’s post ofce network consists o 12,343 post ofces. These ofces manage 4 million savings accounts (Akhtar 2007, 37).
While more low-income households have access
to deposit services than to other nancial services, the
quality o deposit services provided by most ormal
and semiormal institutions remains questionable.
First, the transaction costs associated with the
deposit services o most ormal institutions remain
too high or the users rom low-income households.
Most rural people have to spend time and money to
make deposits—walking, cycling, or riding to bank
oces. In some countries, depositors have to incur
other expenses. For example, in Cambodia, “savers
who make deposits in banking institutions expect to
pay a commission to the teller or the sae deposit o
their money” (Clark 2006,
111). Second, restrictions
on withdrawal o unds
reduce their value as
a source o liquidity.Third, most developing
countries have a long way
to go in ensuring saety o
poor people’s deposits
in nancial institutions including cooperatives that
they rely on.
The proportion o low-income people with
access to credit rom mainstream banking institutions
continues to be insigniicant in most developing
countries. Also, transaction costs that poor and
low-income households have to bear when they usethe acilities provided by these institutions remain
high. Generally, to obtain a loan rom a bank, a low-
income person has to visit the institution several times
and go through cumbersome procedures. Banks in
Bangladesh, Pakistan, and Philippines take more than
one month to process an SME loan application (Beck
et. al. 2007, 14). In many countries, low-income clients
have to pay bribes to have access to ormal nancial
services, particularly to credit rom state-owned banks.
According to some studies, in India, bribe payments
are estimated to be around 10% o the loan amount(Diamond Management and Technology Consultants
2006, 9). The RFAS 2003 estimated the bribe payments
to be in the range o 10–20% o the loan amount. On
average, 27% o sample households who borrowed
rom a regional rural bank report having to pay a
00 00 00
Numberofactiveborrowers 3,740,179 4,125,264 4,695,986
Loansbelow$300(%) 80.00 70.00 50.00
Clientsbelowpovertyline(%) 86.00 86.00 83.00
ROA (4.21) (4.56) (4.04)
ROE (12.89) (15.29) (13.69)
Table 1: Vietnam Bank for Social Policiesa
ROA=returnonassets,ROE=returnonequity.aPositionatendofeachyear.
Source:www.mixmarket.org.
While more low-income households have
access to deposit services than to other nancial
services, the quality o deposit services providedby most ormal and semiormal institutions
remains questionable.
8/6/2019 Low Income Household Improvement
http://slidepdf.com/reader/full/low-income-household-improvement 17/46
bribe to get the loan; a little under 27% o households
who borrowed rom a commercial bank paid a bribe,
and 10% o households who borrowed rom a credit
cooperative paid a bribe (World Bank 2004, 15). In
Azerbaijan, “corruption in the banking sector has been
observed to be signicant. Bankers charge ees as a
bribe that can sometimes account or 20–30% o the
loans” (Lamberte and Fitchett 2006, 110). Although
data are not available, one should not assume that this
problem does not exist or low-income households in
other developing countries.
Low-income people with access to credit are too
heavily dependent on the services that specialized
microinance institutions (MFIs) provide. While
MFIs have signiicantly
improved access to credit
or low-income people,
women in particular, withew exceptions, much
o the credit provided
by MFIs is or short-
term income-generating
activities. Little is provided or housing improvements,
education, health, consumption smoothing, and
emergencies. Credit quality remains generally low.
Beyond credit, other basic inancial services such
as deposit and domestic money transer services
remain peripheral in the case o most MFIs, although
there are exceptions such as the unit desas o the BRI,Grameen Bank, and ACLEDA Bank, which have made
signiicant progress in broadening their inancial
services (Rutherord 2006; Clark 2006).
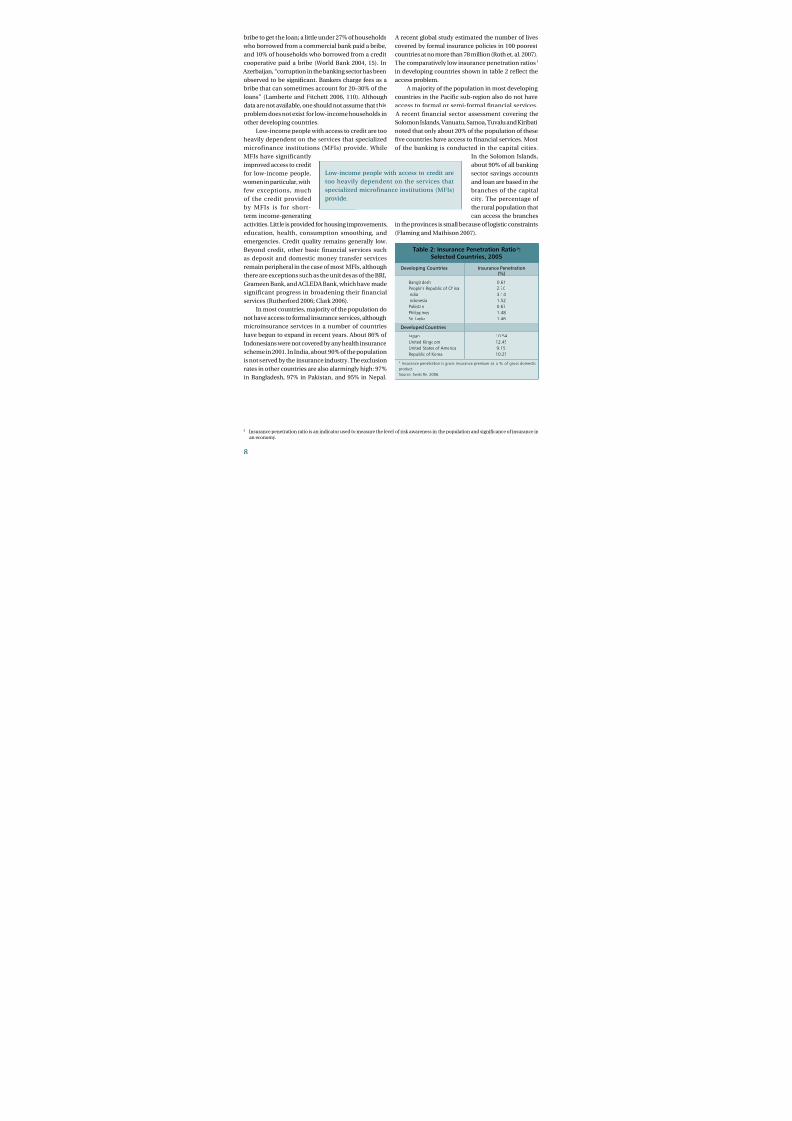
In most countries, majority o the population do
not have access to ormal insurance services, although
microinsurance services in a number o countries
have begun to expand in recent years. About 86% o
Indonesians were not covered by any health insurance
scheme in 2001. In India, about 90% o the population
is not served by the insurance industry. The exclusion
rates in other countries are also alarmingly high: 97%in Bangladesh, 97% in Pakistan, and 95% in Nepal.
5 Insurance penetration ratio is an indicator used to measure the level o risk awareness in the population and signifcance o insurance inan economy.
A recent global study estimated the number o lives
covered by ormal insurance policies in 100 poorest
countries at no more than 78 million (Roth et. al. 2007).
The comparatively low insurance penetration ratios5
in developing countries shown in table 2 refect the
access problem.
A majority o the population in most developing
countries in the Pacic sub-region also do not have
access to ormal or semi-ormal nancial services.
A recent inancial sector assessment covering the
Solomon Islands, Vanuatu, Samoa, Tuvalu and Kiribati
noted that only about 20% o the population o these
ve countries have access to nancial services. Most
o the banking is conducted in the capital cities.
In the Solomon Islands,
about 90% o all banking
sector savings accounts
and loan are based in thebranches o the capital
city. The percentage o
the rural population that
can access the branches
in the provinces is small because o logistic constraints
(Flaming and Mathison 2007).
aInsurancepenetrationisgrossinsurance premiumas a% ofgrossdomestic
product.Source:SwissRe.2006.
Table 2: Insurance Penetration Ratioa:Selected Countries, 2005
Developing Countries Insurance Penetration(%)
Bangladesh 0.61
People’sRepublicofChina 2.70
India 3.14
Indonesia 1.52
Pakistan 0.67
Philippines 1.48
SriLanka 1.46
Developed Countries
Japan 10.54
UnitedKingdom 12.45
UnitedStatesofAmerica 9.15
RepublicofKorea 10.25
Low-income people with access to credit are
too heavily dependent on the services that
specialized microinance institutions (MFIs)
provide.
8/6/2019 Low Income Household Improvement
http://slidepdf.com/reader/full/low-income-household-improvement 18/46
Dimensions o the Access Problem
Thus, developing Asia clearly suers rom a
massive nancial access problem quantitatively and
qualitatively. The problem
is more acute in large
countries such as the
PRC, India, and Pakistan.
As a result, vast numbers
o poor and low-income
people in the region are
unable to take advantage
o economic opportunities and gainully employ
themselves and their amily members, and create
employment opportunities or others; unable to build
assets that increase their income-earning capacity and
quality o lie; unable to ensure that their children get
basic primary and secondary education; and unable
to manage the risks o vulnerabilities resulting rom
various types o external shocks that adversely aecttheir already low living standards. Many small armers
and small nonarm enterprise operators who are just
above the poverty line also suer rom lack o access
to nancial services. Faced with credit constraints
many small armers use ewer cash inputs leading
to lower incomes. They are also compelled to rely on
sel-nance6 and inormal markets. Many o these
people are orced by the circumstances to pay a
“poverty premium” when they access the services o
commercial inormal markets. Although it is not the
only cause, lack o access to nancial services lies at
the root o the persistent
poverty and inequality
p r o b l e m s i n m o s t
developing societies.
Given the severity o
the problem, widespread
a n d a r - r e a c h i n g
economic and social
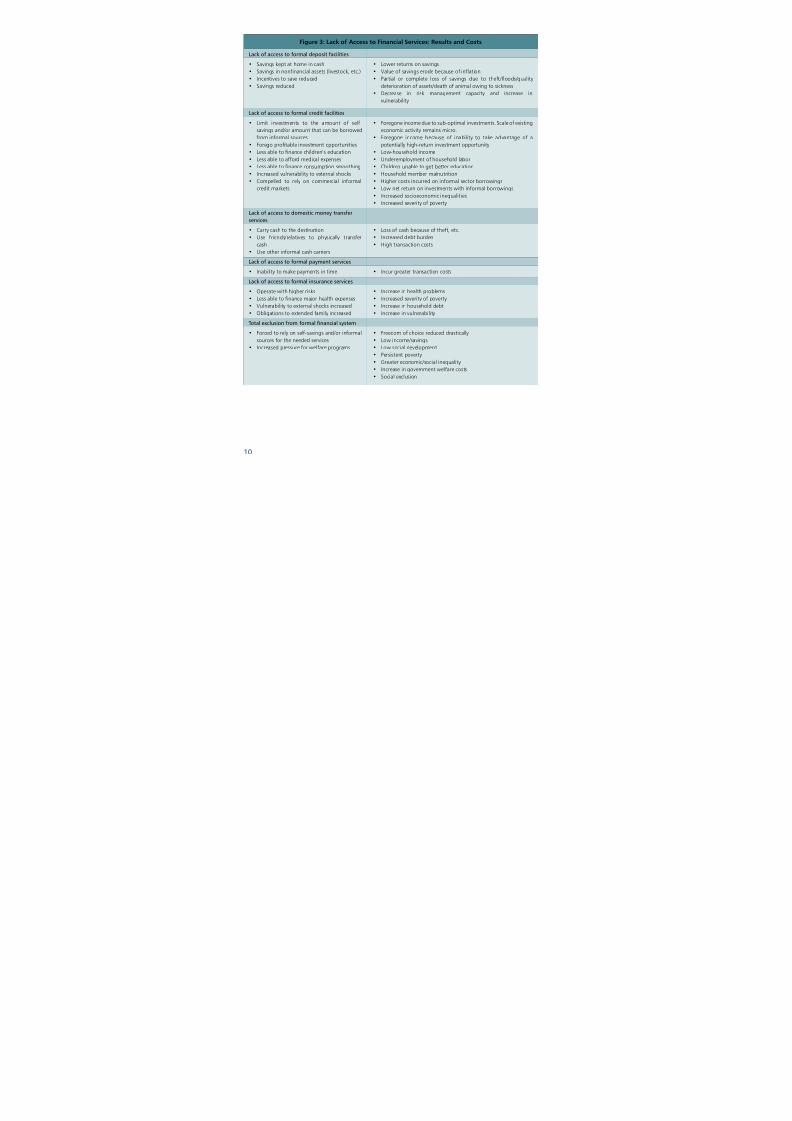
implications o lack o access to nancial services
(gure 3) and the potentially critical role that nance
can play in inclusive development, closing the huge
gap between the demand or nancial services rom
low-income households and its supply rom the
ormal and semiormal sources in both quantitative
and qualitative terms may be considered one o
the biggest development challenges acing mostdeveloping countries in Asia and other regions. The
international experience provides that some countries
have remarkably progressed in improving access to
nance or low-income households while some others
have not been able to achieve relatively successul
results. An examination o these dierent experiences
suggests insights and lessons or the policy makers
and practitioners who are serious about addressing
this important development issue.
Developing Asia clearly suers rom a massive
inancial access problem quantitatively and
qualitatively. The problem is more acute in large
countries such as the PRC, India, and Pakistan.
6 McKinnon (1973, 30) defnes sel-fnance “as the investment within a particular enterprise (or economic unit) o savings accumulated inthat enterprise.” Sel-fnance takes place in all types o households and enterprises, rom rich to poor people, and rom microenterprisesto the very large-scale multinational frms. The main disadvantage o sel-fnance is that a household’s or enterprise’s resources may notmatch those required to harness an investment opportunity within a reasonable time rame. Thus, a household or an enterprise may not
be able to take advantage o a high-productivity investment opportunity. The scale o an economic activity or an enterprise will have to belimited by the amount o sel-fnance. The shortcomings o sel-fnance will be more pronounced when investments are characterized by indivisibilities. A poor household may require unds to buy cattle, a sewing machine, or a bag o ertilizer. The amount o unds required may be large relative to the income o a household living at subsistence level. Hence, the household may not be able to fnance the investment inone lump sum but may be able to do so in installments. A poor household that is not able to sel-fnance discrete increases in investments
will be compelled to use traditional technology and continue with low-productivity activities. Thus, McKinnon (1973, 13) noted that “poverty and the inability to borrow can be ormidable barriers to the adoption o even the simplest and most productive innovations. The importantpoint, however, is the virtual impossibility o a poor armer’s fnancing rom his current savings the whole o the balanced investmentneeded to adopt the new technology. Access to external fnancial resources is likely to be necessary over the one or two years when thechanges take place. Without this access, the constraint o sel-fnance sharply biases investment strategy toward marginal variations withinthe traditional technology.” Sel-fnance limits specialization, adoption o better technology, growth in productivity, and thus economicgrowth and development (ADB 2000, 44–45). Conversely, access to fnance promotes these.
8/6/2019 Low Income Household Improvement
http://slidepdf.com/reader/full/low-income-household-improvement 19/46
0
Figure 3: Lack of Access to Financial Services: Results and Costs
• Lowerreturnsonsavings
• Valueofsavingserodebecauseofinflation
• Partial or complete loss of savings due to theft/floods/quality
deteriorationofassets/deathofanimalowingtosickness
• Decrease in risk management capacity and increase invulnerability
• Foregoneincomeduetosub-optimalinvestments.Scaleofexisting
economicactivityremainsmicro.
• Foregone income because of inability to take advantage of a
potentiallyhigh-returninvestmentopportunity
• Low-householdincome
• Underemploymentofhouseholdlabor
• Childrenunabletogetbettereducation
• Householdmembermalnutrition
• Highercostsincurredoninformalsectorborrowings
• Lownetreturnoninvestmentswithinformalborrowings
• Increasedsocioeconomicinequalities
• Increasedseverityofpoverty
• Lossofcashbecauseoftheft,etc.
• Increaseddebtburden
• Hightransactioncosts
• Incurgreatertransactioncosts
• Increaseinhealthproblems
• Increasedseverityofpoverty
• Increaseinhouseholddebt
• Increaseinvulnerability
• Freedomofchoicereduceddrastically
• Lowincome/savings
• Lowsocialdevelopment
• Persistentpoverty
• Greatereconomic/socialinequality
• Increaseingovernmentwelfarecosts• Socialexclusion
Lack of access to formal deposit facilities
• Savingskeptathomeincash
• Savingsinnonfinancialassets(livestock,etc.)
• Incentivestosavereduced
• Savingsreduced
Lack of access to formal credit facilities
• Limit investments to the amount of self-
savingsand/oramountthatcanbeborrowed
frominformalsources
• Foregoprofitableinvestmentopportunities
• Lessabletofinancechildren’seducation
• Lessabletoaffordmedicalexpenses
• Lessabletofinanceconsumptionsmoothing
• Increasedvulnerabilitytoexternalshocks
• Compelled to rely on commercial informal
creditmarkets
Lack of access to domestic money transfer
services
• Carrycashtothedestination
• Use friends/relatives to physically transfer
cash
• Useotherinformalcashcarriers
Lack of access to formal payment services
• Inabilitytomakepaymentsintime
Lack of access to formal insurance services
• Operatewithhigherrisks
• Lessabletofinancemajorhealthexpenses
• Vulnerabilitytoexternalshocksincreased
• Obligationstoextendedfamilyincreased
Total exclusion from formal financial system
• Forcedtorelyonself-savingsand/orinformal
sourcesfortheneededservices
• Increasedpressureforwelfareprograms
8/6/2019 Low Income Household Improvement
http://slidepdf.com/reader/full/low-income-household-improvement 20/46
Factors Underlying Low Access
IV. FACTORS UNDERLYING LOW ACCESS
A signicant proportion o people excluded romthe ormal nancial system have access to and use
nancial services o the inormal sector. This indicates
that the limited access to ormal or semiormal sources
o inance cannot be solely explained in terms o
market ailure. The persistence o the inormal markets
not only suggests the
importance o inancial
services rom the demand
side, but also reveals
undamental supply-side
constraints in the ormalinancial system. These
constraints vary across countries and are infuenced
by a host o actors such as the stage o nancial sector
development, perceptions o dominant inancial
institutions regarding the business case or providing
nancial services or the excluded, nancial policy and
regulatory system, and the institutional composition
o the nancial system.
A root cause o supply-side constraints is the
conventional view o the potential market consisting
o poor and low-income people. Two interrelated ideasdominate the conventional view. First is that given low-
income levels and lagging social development, there
is little prot potential in the low end o the nancial
markets; hence, the conclusion that market-based
solutions cannot lead to improved nancial services or
low-income people and that the private sector has no
signicant role in this market segment. Second is that
because this market consists o low-income people,
it must be served through government programs and
programs o charitable institutions including social-
mission-oriented nongovernment organizations.Most ormal-sector-established nancial institutions,
international development agencies, and government
policy makers including those working in ministries
o nance, central banks, and national planning andimplementing agencies share these views. Even low-
income people hold similar views, with their deep
suspicion o the intentions and the role o the private
sector. Most o the supply-side actors that contribute to
low access to nance nd their roots in these conventional,
deep-rooted, and widely
held views. This dominant
thinking has contributed
to a “business ailure”
in serving this market,
although much o thelimited access to ormal
inancial services or low-income households is
generally described as “market ailure.”
Perhaps, the most obvious supply-side actor is
the absence o ormal nancial institutions in close
proximity. Thus, many low-income people in remote
rural areas where such acilities are not available
within a reasonable distance tend to rely more on
inormal markets than those in other areas. However,
availability o retail outlets in close proximity does
not oten help i these institutions are not seriously committed to serve the low-end market taking it as a
business proposition, and their core business does not
include products and services that low-income people
demand at reasonable prices. The geographic (spatial)
access does not necessarily mean economic access
in such cases. India seems to provide an example o
this. Over 95 commercial banks operating in India
have some 47,000 branches located in semiurban
and rural areas while 196 regional rural banks also
have over 14,372 branches in rural areas. In addition,
there are 105,000 primary agricultural credit societies.Despite this extensive retail network, access to nance
continues to be dismally low in rural India, particularly
or low-income households, as noted earlier.7 Similarly,
7 However, it is important to note that some studies have highlighted major banking inrastructure defciencies in rural India. For example,according to Diamond Management and Technology Consultants (2006), only 7% o villages have a bank branch and 67% do not even havea post ofce. Availability o brick and mortar acilities may be important, although its signifcance or access to fnance is likely to decreasesignifcantly with new inormation and communication technology that would connect remote rural areas to semiurban or urban-basedacilities.
The persistence o the inormal markets not
only suggests the importance o inancial
services rom the demand side, but also reveals
undamental supply-side constraints in the
ormal nancial system.
8/6/2019 Low Income Household Improvement
http://slidepdf.com/reader/full/low-income-household-improvement 21/46
in all developing countries, urban areas have much
better banking inrastructure but the majority o low-
income households do not have access to the services
provided by these institutions.
Another major reason or the limited supply is that
established medium- and large-scale conventional
nancial institutions have not yet become major players
in the low end o the nancial markets. First, these
institutions have not been established and organized
to serve the low-end markets. They do not have access
to low-cost inormation on the potential clients at
the low-end markets. Their organizational structures,
cost structures, and products are geared to serve
up-market clients. Given
the higher costs generally
associated with serving
low-income clients, these
nancial institutions ndthat the impetus to move
urther up market is more
powerul than that or
moving down-market. Hence, established, large-scale
conventional nancial institutions seldom attempt
to serve low-income households because the relative
contribution that such a move can make to prot is
smaller.8 The long-held, deep-rooted presumption
that prot is small at the
bottom o the pyramid
market and meeting theirdemand or inancial
(and other) services is the
primary responsibility
o the governments and
charitable organizations
seems to have reinorced this incentive asymmetry.
Managers o conventional medium- and large-scale
institutions who would like to introduce innovative
technology and processes to serve poor clients or
prot will oten nd it dicult to get their proposals
through the resource allocation processes and systems within their institutions.
The incompatibility o services and products
oered by the suppliers with the product and service
requirements o those in the low-end markets has
aggravated the access problem. Oten even low-
income people living in close proximity to ormal
nancial institutions do not have access to products
and services or this reason. The incompatibility may
stem rom a number o actors. The products may have
eatures that are not in line with the socioeconomic
characteristics o clients. A loan product requiring
weekly repayments may not be suitable or a
household whose cash fow does not enable such
repayments. An insurance product whose terms and
conditions are not readily transparent and simple may
not be suitable or people with limited literacy skills.
I having an account with
the bank is required to use
its payment services, some
people may not be able to
actually use those services.The eective price o a
product including client
transaction costs may be
too high. Most migrant workers have been using
inormal money transer services to remit money
because they are relatively cheaper and more
convenient than most ormal mechanisms. Most banks
require high minimum balances or savings accounts,
do not accept savings in
small amounts, and have
restrictions on requency o withdrawals. These
actors have kept millions
o small savers rom using
their deposit acilities
(Rutherord 2000), driving
them to save under the mattress despite the risks such
practices entail. In Nepal, the high required minimum
balance and the cumbersome documentation
requirements to open a savings account limit many
low-income people’s access to deposit services o
banks.In most developing countries procedures
associated with transactions are too complex,
cumbersome, and intimidating or most low-income
8 As Christensen et. al. (2004, 36) noted, “an opportunity that is attractive to a frm that has $50 million in sales and seeks 10 percent top-linegrowth would be unattractive to a frm that has $5 billion in sales and seeks 10 percent top-line growth. A $2.5 million opportunity meets50 percent o the frst frm’s growth needs but only 0.5 percent o the second frm’s growth needs. Which company do you think will placea higher priority on going ater a $2.5 million market?”
The incompatibility o services and products
oered by the suppliers with the product and
service requirements o those in the low-end
markets has aggravated the access problem.
In most developing countries procedures
associated with transactions are too complex,
cumbersome, and intimidating or most low-
income clients, particularly those with low
literacy levels and or poor women.
8/6/2019 Low Income Household Improvement
http://slidepdf.com/reader/full/low-income-household-improvement 22/46
Factors Underlying Low Access
clients, particularly those with low literacy levels and
or poor women. Most institutions do not have simple,
low-end-market-riendly systems and procedures. In
Bangladesh, more than three documents are required
to open a savings account in a bank and minimum
loan requirements o banks are too high in relation to
the typical requirements o low-income households.
Banks also take more than a month to process a
small enterprise loan application. In some states
o India, a commercial bank takes, on average, 33
weeks to approve a loan (World Bank 2004, 15). More
importantly, banks require marketable collateral or
loans which most low-
income households are
unable to provide. In some
countries, the collateral
requirements are so high
that even middle-classclients are unable to meet
them. In Azerbaijan, or
example, banks usually
require 125–200% collateral as guarantees or loans
and accept only real estate properties in Baku city
as collateral (Lamberte and Fitchett 2006, 110). Most
nancial institutions, including MFIs, do not provide
emergency loans and loans or lie-cycle events or
which eective demand at
the base o the economic
pyramid is substantial. Although poor and low-
income clients demand
simple, no-nonsense, easy
to understand inancial
products and services,
most conventional nancial institutions do not oer
such products and services.
Most supply-side constraints have been reinorced
by, i they are not rooted in, what may be described as
“government ailure.” The global experience provides
ample support to this hypothesis. In general, accessis much lower in countries where governments have
not adopted market-riendly policies toward access
to inance. Where governments have signiicantly
restricted the potential role o the private sector
including NGOs, and restricted the operational
autonomy o nancial services providers (including
that o state-owned inancial institutions with a
social mission to serve the poor) through interest rate
ceilings and other measures, the growth in supply o
services has been sluggish. Also, in countries where
governments have imposed regulatory barriers on,
or not provided adequate legal space to acilitate,
integration o nancial services or the poor into the
mainstream o nance, the growth in supply has been
lackluster. Restrictive government policies on oreign
investments in nancial services or the poor have also
retarded the supply.
Demand-side actors
also explain the limited
access to nance or low-
income people. First, many
poor and low-incomepeople cannot aord to
bear the high eective
costs involved in using
ormal nancial services. In Nepal, an estimated 34%
o the population cannot aord the ees and charges
associated with a bank savings account (Beck et. al.
2007). While a signicant proportion o the excluded
people use services provided by a range o inormal
sources o nance, some
people are even excluded
rom inormal commercialmarkets.9 Many experts
i n m i c r o e n t e r p r i s e
development tend to
assume that millions and
millions o high-return
economic activities in which poor people can invest
their loan proceeds exist. This is ar rom reality. A
closer look at dierent segments o the market or
nancial services or the poor suggests that many
poor households do not have viable economic
opportunities that can generate high enough real rateso return to repay loans at interest rates that enable
nancial institutions to cover their costs, make an
adequate prot, and save some money or a rainy day.
In a typical developing economy in the region, the
9 Inormal fnancial markets consist o two subtypes: noncommercial and commercial. Friends and relatives who provide fnancial serviceson reciprocal arrangements without a proft motive are noncommercial while those who provide loans or proft are commercial.
More importantly, banks require marketable
collateral or loans which most low-income
households are unable to provide. In some
countries, the collateral requirements are so
high that even middle-class clients are unable
to meet them.
Many experts in microenterprise development
tend to assume that millions and millions o high-return economic activities in which poor
people can invest their loan proceeds exist. This
is ar rom reality.
8/6/2019 Low Income Household Improvement
http://slidepdf.com/reader/full/low-income-household-improvement 23/46
best available investments or many poor households
involve those with moderate real returns (Fernando
2006, 8). Thus, many people who belong to this
category tend to sel-exclude
rom ormal nancial markets
and rely on sel-savings or
reciprocal arrangements to
meet their demand or credit.
Most small and marginal
armers, particularly those in
what is generally described
as less-avored areas all into
this category. As Rajan and Zingales (2004, 113) noted,
“nance cannot create opportunities. It only makes it
easier to exploit them.”
High transaction costs o using ormal nancial
services severely limit the access o low-income people
to ormal nancial services because the incidence o transaction costs is too high on small value transactions.
Transaction costs are the costs o establishing and
conducting nancial relationships: hence, they are
admission tickets to nancial markets (Von Pischke
1991, 11). High transaction costs arise rom a variety
o actors such as lack o retail outlets in close
proximity, complex and cumbersome requirements
and procedures o the ormal institutions, and corrupt
practices adopted by
sta o some ormal
institutions, as noted
earlier.
L o w i n a n c i a l
l i t e r a c y o p o o r
a n d l o w - i n c o m e
people signiicantly
contributes to nancial
exclusion in general and sel-exclusion in particular.
Many low-income households do not access insurance
services and deposit acilities, among many other
nancial services, because o this actor. The impact
o this is reinorced by the complex procedures and
requirements o ormal nancial institutions. In mosto the Pacic developing countries, nancial illiteracy
is considered a major actor limiting access to nance
because most o the population have conducted
transactions without using nancial institutions or
generations (Flaming and Mathison 2007, 4).
Overview o Cross-Country Experience
High transaction costs o using ormal nancial
services severely limit the access o low-income
people to ormal nancial services because the
incidence o transaction costs is too high on
small value transactions.
8/6/2019 Low Income Household Improvement
http://slidepdf.com/reader/full/low-income-household-improvement 24/46
Overview o Cross-Country Experience
10 India began nationalization o banks in 1969. The regional rural banks were established in 1976 to service the rural poor, small and marginalarmers, rural artisans, landless workers, and small entrepreneurs. The Integrated Rural Development Program (IRDP) provided highly subsidized credit to rural households in the 1980s and 1990s.
11 According to the World Bank (2006, 15) “the two decades o IRDP experience in the 1980s and 1990s aected the credibility o microborrowersin the view o bankers and ultimately hindered the access o low-income clients to banking services.”
12 In October 2002, ADBP was incorporated as Zarai Taraqiati Bank Ltd. as an initial step o a government-initiated restructuring programsupported by ADB. However, implementation o the program has been patchy, and much o its deep-rooted problems remain.
V. OVERVIEW OF CROSS-COUNTRY EXPERIENCE
Historically governments in many Asian andother countries have intervened on the supply
side to address access to nancial services in various
ways. These measures include nationalizing private
banks; establishing and promoting specialized banks
including national savings banks and postal banks,
branching regulations or directives, directives on
portolio composition, interest rate ceilings on credit
to low-income households, and provision o credit
at subsidized interest rates to what was considered
priority sectors o the economy or priority segments
o the society. For example, India, Sri Lanka, andPakistan nationalized private-owned banks to expand
banking services to the excluded and established new
state-owned banks to serve low-income segments.10
India’s social banking program and priority sector
lending program meant to increas e banking services
to the poor and low-income households and rural
people. While an evaluation o the eectiveness o
these measures is beyond the scope o this paper, it is
correct to say that some o these did produce positive
results (Burgess and Pande 2005) while some did, in
eect, urther curtail the supply contrary to the policy makers’ expectations.11
In most cases, newly established state-owned
inancial institutions
a i l e d t o m a k e a
sustainable dent in the
problem despite the large
amount o unds used or
the purpose. Pakistan’s
Agricultural Development
Bank (ADBP)12 is one o
many examples. These institutions have also createdtheir own constituency o supporters making their
reorms a politically more daunting task and ensuring their persistence despite continuing nancial bleeding,
ineciency, dismally low outreach, and poor quality
o services. More importantly, these institutions have
ailed to serve their stated target groups. Similarly,
nationalized nancial institutions have ailed to live up
to the stated objectives o policy makers and inficted
signicant costs on the society. The operations o
both categories o institutions have promoted rent-
seeking behavior among their sta and clients and
damaged development o a disciplined credit culture.
There is general agreement that in most countriesthe conventional supply-side measures contributed
to the weakening o nancial institutions and their
implementation involved huge nancial costs (Meyer
and Nagarajan 2000). Whether they produced benets
proportional to the costs remain controversial. Many
people who are keen to improve access to nance
agree that the old approach o direct interventions
to provide the services by government-owned or
controlled institutions and to orce the private sector
institutions to provide the services is no longer relevant
and eective, even i it has worked to some extent inthe past. A new, more market-riendly and market-
supportive demand-driven approach has gained
increasing support at
global, regional, and
national levels.
The countries that
adopted a more market-
riendly approach to
access to inance have
achieved sustainable
results. These countries have essentially taken anumber o bold initiatives to implement such an
The countries that adopted a more market-
riendly approach to access to inance have
achieved sustainable results. These countries
have essentially taken a number o bold
initiatives to implement such an approach.
8/6/2019 Low Income Household Improvement
http://slidepdf.com/reader/full/low-income-household-improvement 25/46
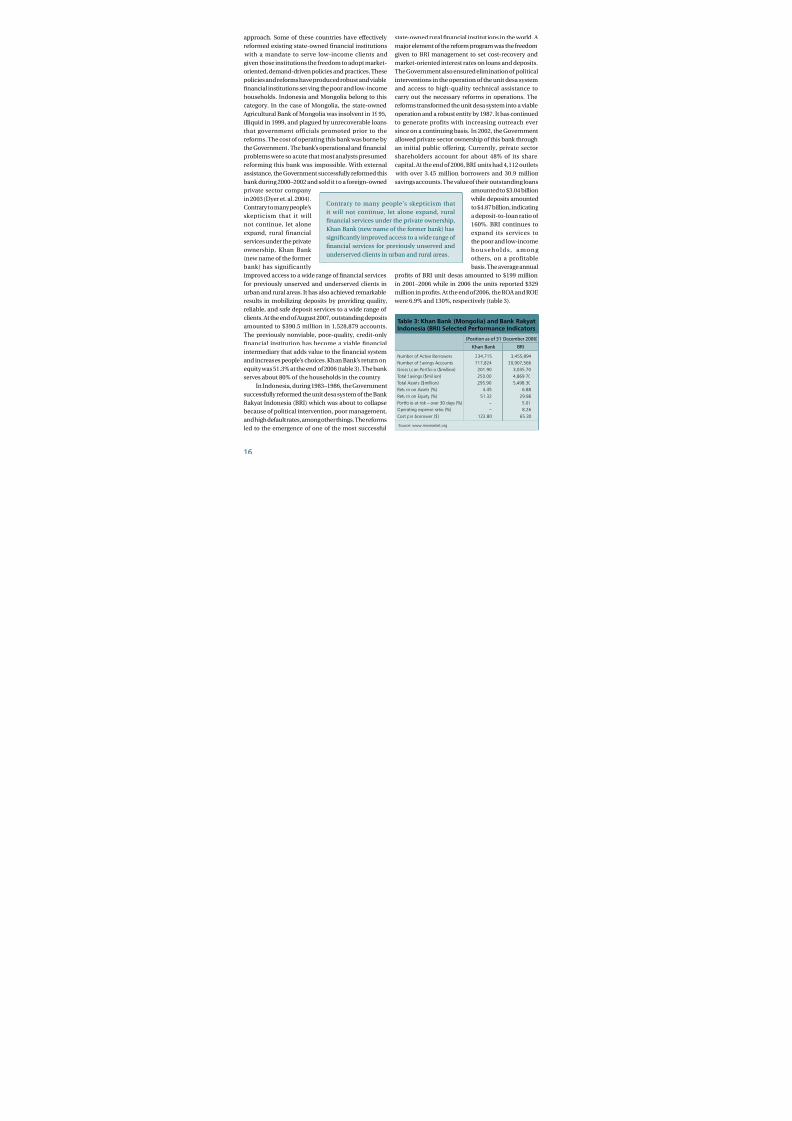
(Position as of December 00)
Khan Bank BRI
NumberofActiveBorrowers 234,715 3,455,894
NumberofSavingsAccounts 717,824 30,907,566
GrossLoanPortfolio($million) 201.90 3,035.70TotalSavings($million) 250.00 4,869.70
TotalAssets($million) 295.90 5,498.30
ReturnonAssets(%) 4.45 6.88
ReturnonEquity(%) 51.32 129.86
Portfolioatrisk–over30days(%) – 5.07
Operatingexpenseratio(%) – 8.26
Costperborrower($) 123.80 65.30
Table 3: Khan Bank (Mongolia) and Bank RakyatIndonesia (BRI) Selected Performance Indicators
Source:www.mixmarket.org
approach. Some o these countries have eectively
reormed existing state-owned nancial institutions
with a mandate to serve low-income clients and
given those institutions the reedom to adopt market-
oriented, demand-driven policies and practices. These
policies and reorms have produced robust and viable
nancial institutions serving the poor and low-income
households. Indonesia and Mongolia belong to this
category. In the case o Mongolia, the state-owned
Agricultural Bank o Mongolia was insolvent in 1995,
illiquid in 1999, and plagued by unrecoverable loans
that government oicials promoted prior to the
reorms. The cost o operating this bank was borne by
the Government. The bank’s operational and nancial
problems were so acute that most analysts presumed
reorming this bank was impossible. With external
assistance, the Government successully reormed this
bank during 2000–2002 and sold it to a oreign-ownedprivate sector company
in 2003 (Dyer et. al. 2004).
Contrary to many people’s
skepticism that it will
not continue, let alone
expand, rural inancial
services under the private
ownership, Khan Bank
(new name o the ormer
bank) has signiicantly
improved access to a wide range o nancial servicesor previously unserved and underserved clients in
urban and rural areas. It has also achieved remarkable
results in mobilizing deposits by providing quality,
reliable, and sae deposit services to a wide range o
clients. At the end o August 2007, outstanding deposits
amounted to $390.5 million in 1,528,879 accounts.
The previously nonviable, poor-quality, credit-only
nancial institution has become a viable nancial
intermediary that adds value to the nancial system
and increases people’s choices. Khan Bank’s return on
equity was 51.3% at the end o 2006 (table 3). The bank serves about 80% o the households in the country.
In Indonesia, during 1983–1986, the Government
successully reormed the unit desa system o the Bank
Rakyat Indonesia (BRI) which was about to collapse
because o political intervention, poor management,
and high deault rates, among other things. The reorms
led to the emergence o one o the most successul
state-owned rural nancial institutions in the world. A
major element o the reorm program was the reedom
given to BRI management to set cost-recovery and
market-oriented interest rates on loans and deposits.
The Government also ensured elimination o political
interventions in the operation o the unit desa system
and access to high-quality technical assistance to
carry out the necessary reorms in operations. The
reorms transormed the unit desa system into a viable
operation and a robust entity by 1987. It has continued
to generate proits with increasing outreach ever
since on a continuing basis. In 2002, the Government
allowed private sector ownership o this bank through
an initial public oering. Currently, private sector
shareholders account or about 48% o its share
capital. At the end o 2006, BRI units had 4,112 outlets
with over 3.45 million borrowers and 30.9 million
savings accounts. The value o their outstanding loansamounted to $3.04 billion
while deposits amounted
to $4.87 billion, indicating
a deposit-to-loan ratio o
160%. BRI continues to
expand its services to
the poor and low-income
h o u s e h o l d s , a m o n g
others, on a proitable
basis. The average annual
prots o BRI unit desas amounted to $199 millionin 2001–2006 while in 2006 the units reported $329
million in prots. At the end o 2006, the ROA and ROE
were 6.9% and 130%, respectively (table 3).
Contrary to many people’s skepticism that
it will not continue, let alone expand, rural
nancial services under the private ownership,
Khan Bank (new name o the ormer bank) has
signicantly improved access to a wide range o
nancial services or previously unserved and
underserved clients in urban and rural areas.
8/6/2019 Low Income Household Improvement
http://slidepdf.com/reader/full/low-income-household-improvement 26/46
Overview o Cross-Country Experience
Indonesia’s market-oriented and liberal approach
to nancial services is urther refected in its policy
toward the operations o the state-owned pawning
company, Perum Pegadaian. Again the Government
has given operational and management autonomy
to this institution to adopt market-oriented pricing
policies. The company provides services throughout
the country to a wide range o clients through its branch
network o 840 branches and 13 regional oces. In
2003, it provided over $1.0 billion in 21 million loans
and was the major supplier o microcredit in terms o
the number o clients served (ADB 2005, 9).
Another country which has achieved a remarkably
improved access to nance
is Cambodia. The war-
torn Cambodia did not
have existing inancial
institutions to reorm in thelate 1980s. But Cambodia
allowed new microcredit
institutions to emerge
and nurtured their growth
through liberal policies.
The Government allowed
oreign investments to the
microinance sector and
micronance institutions
(MFIs) to adopt cost-
recovery interest rates without restrictions. These
two policy measures laid
the oundation or a solid
microinance sector to
emerge and grow. Two o the many such institutions
have become major players in the sector in recent
years.
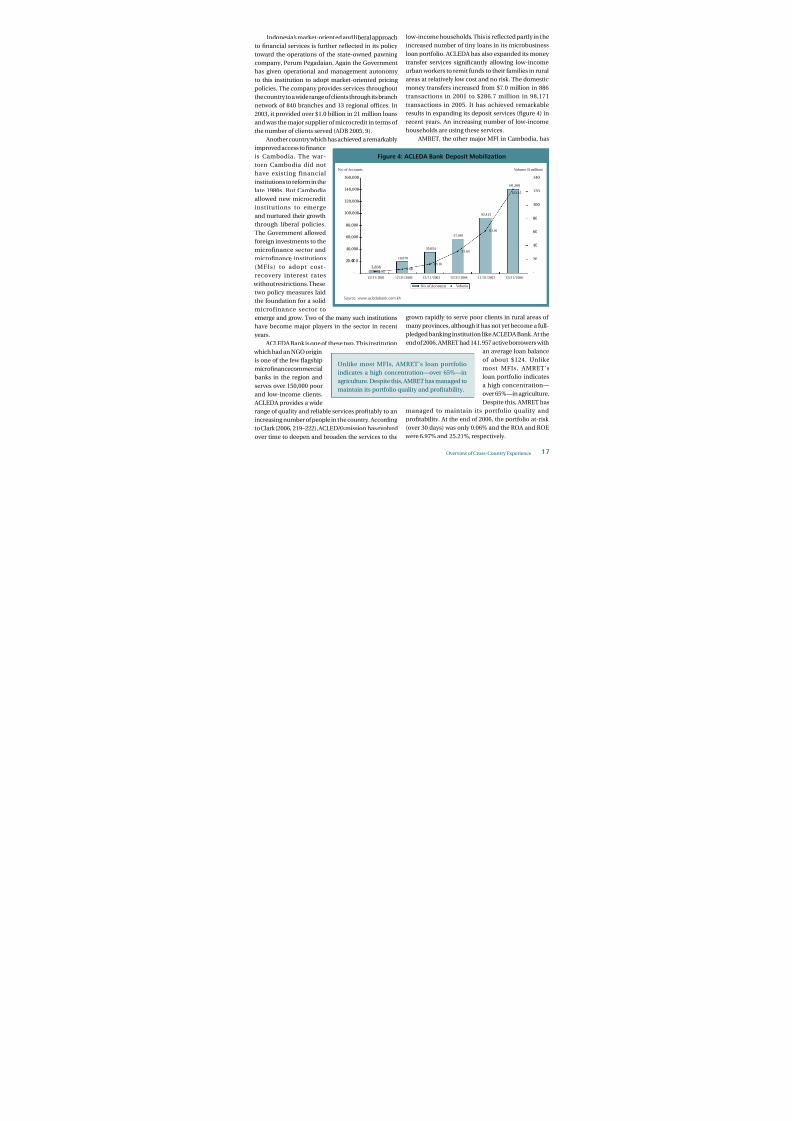
ACLEDA Bank is one o these two. This institution
which had an NGO origin
is one o the ew fagship
micronance commercialbanks in the region and
serves over 150,000 poor
and low-income clients.
ACLEDA provides a wide
range o quality and reliable services protably to an
increasing number o people in the country. According
to Clark (2006, 219–222), ACLEDA’s mission has evolved
over time to deepen and broaden the services to the
low-income households. This is refected partly in the
increased number o tiny loans in its microbusiness
loan portolio. ACLEDA has also expanded its money
transer services signicantly allowing low-income
urban workers to remit unds to their amilies in rural
areas at relatively low cost and no risk. The domestic
money transers increased rom $7.0 million in 886
transactions in 2001 to $286.7 million in 98,171
transactions in 2005. It has achieved remarkable
results in expanding its deposit services (gure 4) in
recent years. An increasing number o low-income
households are using these services.
AMRET, the other major MFI in Cambodia, has
grown rapidly to serve poor clients in rural areas o
many provinces, although it has not yet become a ull-
pledged banking institution like ACLEDA Bank. At the
end o 2006, AMRET had 141,957 active borrowers with
an average loan balance
o about $124. Unlike
most MFIs, AMRET’sloan portolio indicates
a high concentration—
over 65%—in agriculture.
Despite this, AMRET has
managed to maintain its portolio quality and
protability. At the end o 2006, the portolio at-risk
(over 30 days) was only 0.06% and the ROA and ROE
were 6.97% and 25.21%, respectively.
Unlike most MFIs, AMRET’s loan portolio
indicates a high concentration—over 65%—in
agriculture. Despite this, AMRET has managed to
maintain its portolio quality and protability.
Figure 4: ACLEDA Bank Deposit Mobilization
3,836
19,070
35,054
57,091
92,413
141,368
1.955.68
13.16
31.64
61.90
-
20,0000
40,000
60,000
80,000
100,000
120,000
140,000
160,000
12/31/2001 12/31/2002 12/31/2003 12/31/2004 12/31/2005 12/31/2006
No. o Accounts
-
20
40
60
80
100
120
140
Volume ($ million)
Volume
123.15
Source:www.acledabank.com.kh
No. o Accounts
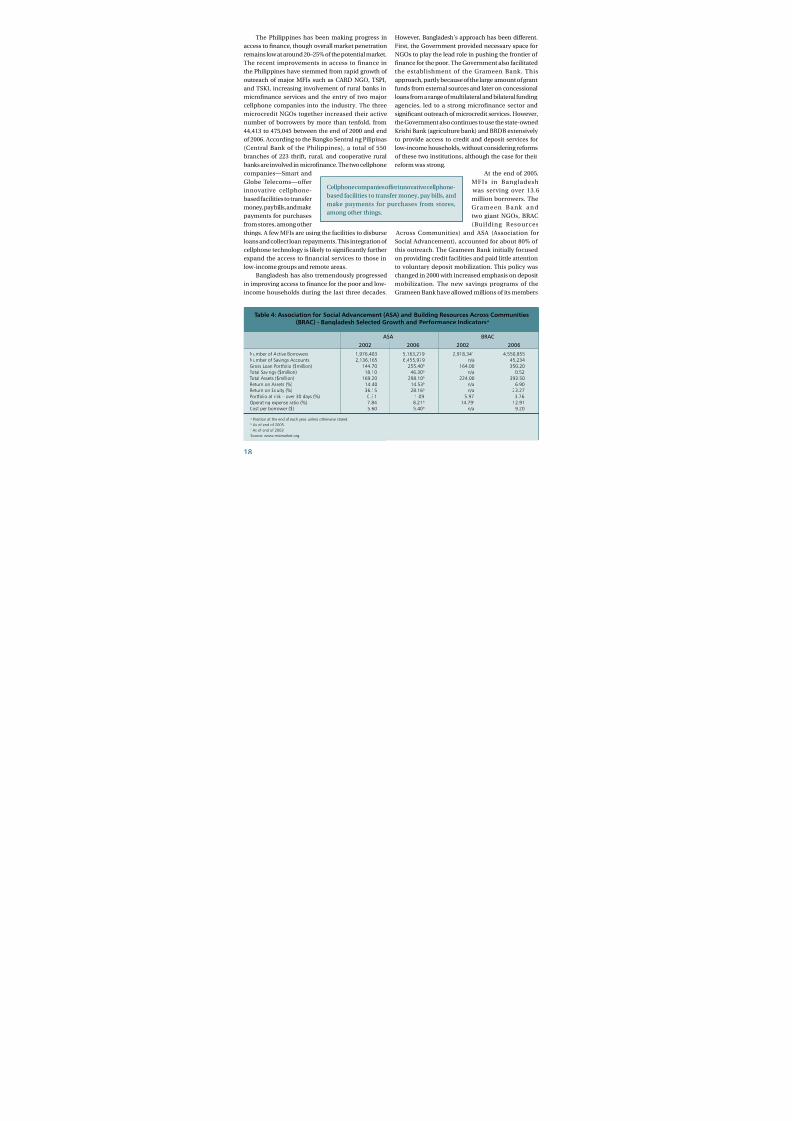
8/6/2019 Low Income Household Improvement
http://slidepdf.com/reader/full/low-income-household-improvement 27/46
The Philippines has been making progress in
access to nance, though overall market penetration
remains low at around 20–25% o the potential market.
The recent improvements in access to inance in
the Philippines have stemmed rom rapid growth o
outreach o major MFIs such as CARD NGO, TSPI,
and TSKI, increasing involvement o rural banks in
micronance services and the entry o two major
cellphone companies into the industry. The three
microcredit NGOs together increased their active
number o borrowers by more than tenold, rom
44,413 to 475,045 between the end o 2000 and end
o 2006. According to the Bangko Sentral ng Pilipinas
(Central Bank o the Philippines), a total o 550
branches o 223 thrit, rural, and cooperative rural
banks are involved in micronance. The two cellphone
companies—Smart and
Globe Telecoms—oerinnovative cellphone-
based acilities to transer
money, pay bills, and make
payments or purchases
rom stores, among other
things. A ew MFIs are using the acilities to disburse
loans and collect loan repayments. This integration o
cellphone technology is likely to signicantly urther
expand the access to nancial services to those in
low-income groups and remote areas.
Bangladesh has also tremendously progressedin improving access to nance or the poor and low-
income households during the last three decades.
However, Bangladesh’s approach has been dierent.
First, the Government provided necessary space or
NGOs to play the lead role in pushing the rontier o
nance or the poor. The Government also acilitated
the establishment o the Grameen Bank. This
approach, partly because o the large amount o grant
unds rom external sources and later on concessional
loans rom a range o multilateral and bilateral unding
agencies, led to a strong microinance sector and
signicant outreach o microcredit services. However,
the Government also continues to use the state-owned
Krishi Bank (agriculture bank) and BRDB extensively
to provide access to credit and deposit services or
low-income households, without considering reorms
o these two institutions, although the case or their
reorm was strong.
At the end o 2005,
MFIs in Bangladesh was serving over 13.6
million borrowers. The
G r a m e e n B a n k a n d
two giant NGOs, BRAC
(Building Resources
Across Communities) and ASA (Association or
Social Advancement), accounted or about 80% o
this outreach. The Grameen Bank initially ocused
on providing credit acilities and paid little attention
to voluntary deposit mobilization. This policy was
changed in 2000 with increased emphasis on depositmobilization. The new savings programs o the
Grameen Bank have allowed millions o its members
Table 4: Association for Social Advancement (ASA) and Building Resources Across Communities(BRAC) - Bangladesh Selected Growth and Performance Indicatorsa
ASA BRAC
00 00 00 00
NumberofActiveBorrowers 1,976,403 5,163,279 2,918,341 4,550,855NumberofSavingsAccounts 2,136,165 6,455,979 n/a 45,234GrossLoanPortfolio($million) 144.70 255.40b 164.00 350.20
TotalSavings($million) 18.10 46.30b n/a 0.52TotalAssets($million) 169.20 298.10b 224.00 393.50ReturnonAssets(%) 14.40 14.53b n/a 6.90ReturnonEquity(%) 36.15 28.16b n/a 23.27Portfolioatrisk–over30days(%) 0.31 1.09 5.97 3.76Operatingexpenseratio(%) 7.84 8.21b 14.79c 12.91Costperborrower($) 5.60 5.40b n/a 9.20
aPositionattheendofeachyear,unlessotherwisestated.bAsofendof2005.cAsofendof2003.
Source:www.mixmarket.org.
Cellphone companies oer innovative cellphone-
based acilities to transer money, pay bills, and
make payments or purchases rom stores,
among other things.
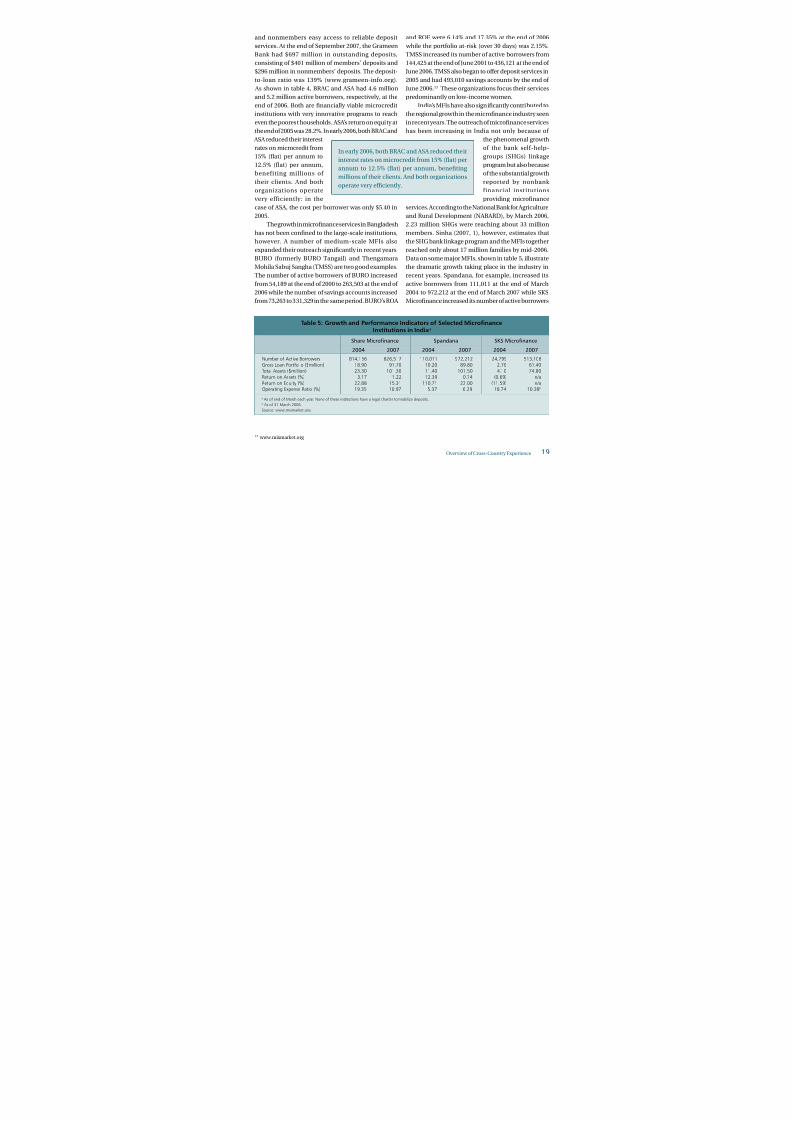
8/6/2019 Low Income Household Improvement
http://slidepdf.com/reader/full/low-income-household-improvement 28/46
Overview o Cross-Country Experience
and nonmembers easy access to reliable deposit
services. At the end o September 2007, the Grameen
Bank had $697 million in outstanding deposits,
consisting o $401 million o members’ deposits and
$296 million in nonmembers’ deposits. The deposit-
to-loan ratio was 139% (www.grameen-ino.org).
As shown in table 4, BRAC and ASA had 4.6 million
and 5.2 million active borrowers, respectively, at the
end o 2006. Both are nancially viable microcredit
institutions with very innovative programs to reach
even the poorest households. ASA’s return on equity at
the end o 2005 was 28.2%. In early 2006, both BRAC and
ASA reduced their interest
rates on microcredit rom
15% (fat) per annum to
12.5% (lat) per annum,
beneiting millions o
their clients. And bothorganizations operate
very eiciently: in the
case o ASA, the cost per borrower was only $5.40 in
2005.
The growth in micronance services in Bangladesh
has not been conned to the large-scale institutions,
however. A number o medium-scale MFIs also
expanded their outreach signicantly in recent years.
BURO (ormerly BURO Tangail) and Thengamara
Mohila Sabuj Sangha (TMSS) are two good examples.
The number o active borrowers o BURO increasedrom 54,189 at the end o 2000 to 263,503 at the end o
2006 while the number o savings accounts increased
rom 73,263 to 331,329 in the same period. BURO’s ROA
Share Microfinance Spandana SKS Microfinance
00 00 00 00 00 00
NumberofActiveBorrowers 814,156 826,517 110,011 972,212 24,799 513,108GrossLoanPortfolio($million) 18.90 91.70 10.20 89.80 2.70 61.40
TotalAssets($million) 23.30 101.30 11.40 101.50 4.10 74.80ReturnonAssets(%) 3.17 1.22 12.39 0.74 (0.69) n/aReturnonEquity(%) 22.88 15.31 110.71 22.00 (11.59) n/aOperatingExpenseRatio(%) 19.35 10.97 5.37 6.29 18.74 10.38b
Table 5: Growth and Performance Indicators of Selected MicrofinanceInstitutions in Indiaa
aAsofendofMarcheachyear.Noneoftheseinstitutionshavealegalchartertomobilizedeposits.bAsof31March2006.
Source:www.mixmarket.org
and ROE were 6.14% and 17.35% at the end o 2006
while the portolio at-risk (over 30 days) was 2.15%.
TMSS increased its number o active borrowers rom
144,425 at the end o June 2001 to 436,121 at the end o
June 2006. TMSS also began to oer deposit services in
2005 and had 493,010 savings accounts by the end o
June 2006.13 These organizations ocus their services
predominantly on low-income women.
India’s MFIs have also signicantly contributed to
the regional growth in the micronance industry seen
in recent years. The outreach o micronance services
has been increasing in India not only because o
the phenomenal growth
o the bank sel-help-
groups (SHGs) linkage
program but also because
o the substantial growth
reported by nonbank inancial institutions
providing micronance
services. According to the National Bank or Agriculture
and Rural Development (NABARD), by March 2006,
2.23 million SHGs were reaching about 33 million
members. Sinha (2007, 1), however, estimates that
the SHG bank linkage program and the MFIs together
reached only about 17 million amilies by mid-2006.
Data on some major MFIs, shown in table 5, illustrate
the dramatic growth taking place in the industry in
recent years. Spandana, or example, increased itsactive borrowers rom 111,011 at the end o March
2004 to 972,212 at the end o March 2007 while SKS
Micronance increased its number o active borrowers
13 www.mixmarket.org
In early 2006, both BRAC and ASA reduced their
interest rates on microcredit rom 15% (fat) per
annum to 12.5% (fat) per annum, beneting
millions o their clients. And both organizations
operate very eciently.
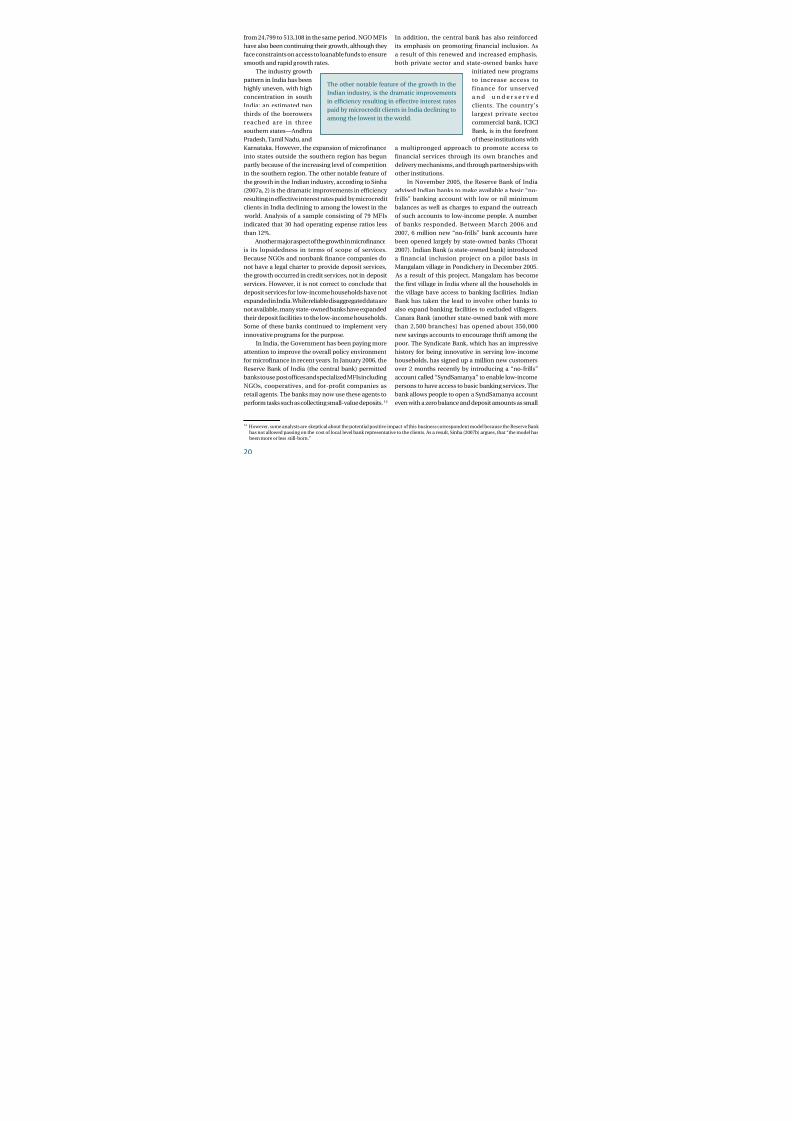
8/6/2019 Low Income Household Improvement
http://slidepdf.com/reader/full/low-income-household-improvement 29/46
0
rom 24,799 to 513,108 in the same period. NGO MFIs
have also been continuing their growth, although they
ace constraints on access to loanable unds to ensure
smooth and rapid growth rates.
The industry growth
pattern in India has been
highly uneven, with high
concentration in south
India: an estimated two
thirds o the borrowers
reached are in three
southern states—Andhra
Pradesh, Tamil Nadu, and
Karnataka. However, the expansion o micronance
into states outside the southern region has begun
partly because o the increasing level o competition
in the southern region. The other notable eature o
the growth in the Indian industry, according to Sinha(2007a, 2) is the dramatic improvements in eciency
resulting in eective interest rates paid by microcredit
clients in India declining to among the lowest in the
world. Analysis o a sample consisting o 79 MFIs
indicated that 30 had operating expense ratios less
than 12%.
Another major aspect o the growth in micronance
is its lopsidedness in terms o scope o services.
Because NGOs and nonbank nance companies do
not have a legal charter to provide deposit services,
the growth occurred in credit services, not in depositservices. However, it is not correct to conclude that
deposit services or low-income households have not
expanded in India. While reliable disaggregated data are
not available, many state-owned banks have expanded
their deposit acilities to the low-income households.
Some o these banks continued to implement very
innovative programs or the purpose.
In India, the Government has been paying more
attention to improve the overall policy environment
or micronance in recent years. In January 2006, the
Reserve Bank o India (the central bank) permittedbanks to use post oces and specialized MFIs including
NGOs, cooperatives, and or-proit companies as
retail agents. The banks may now use these agents to
perorm tasks such as collecting small-value deposits.14
In addition, the central bank has also reinorced
its emphasis on promoting nancial inclusion. As
a result o this renewed and increased emphasis,
both private sector and state-owned banks have
initiated new programs
to increase access to
inance or unserved
a n d u n d e r s e r v e d
clients. The country’s
largest private sector
commercial bank, ICICI
Bank, is in the oreront
o these institutions with
a multipronged approach to promote access to
inancial services through its own branches and
delivery mechanisms, and through partnerships with
other institutions.
In November 2005, the Reserve Bank o Indiaadvised Indian banks to make available a basic “no-
rills” banking account with low or nil minimum
balances as well as charges to expand the outreach
o such accounts to low-income people. A number
o banks responded. Between March 2006 and
2007, 6 million new “no-rills” bank accounts have
been opened largely by state-owned banks (Thorat
2007). Indian Bank (a state-owned bank) introduced
a inancial inclusion project on a pilot basis in
Mangalam village in Pondichery in December 2005.
As a result o this project, Mangalam has becomethe rst village in India where all the households in
the village have access to banking acilities. Indian
Bank has taken the lead to involve other banks to
also expand banking acilities to excluded villagers.
Canara Bank (another state-owned bank with more
than 2,500 branches) has opened about 350,000
new savings accounts to encourage thrit among the
poor. The Syndicate Bank, which has an impressive
history or being innovative in serving low-income
households, has signed up a million new customers
over 2 months recently by introducing a “no-rills”account called “SyndSamanya” to enable low-income
persons to have access to basic banking services. The
bank allows people to open a SyndSamanya account
even with a zero balance and deposit amounts as small
The other notable eature o the growth in the
Indian industry, is the dramatic improvementsin eciency resulting in eective interest rates
paid by microcredit clients in India declining to
among the lowest in the world.
14 However, some analysts are skeptical about the potential positive impact o this business correspondent model because the Reserve Bank has not allowed passing on the cost o local level bank representative to the clients. As a result, Sinha (2007b) argues, that “the model hasbeen more or less still-born.”
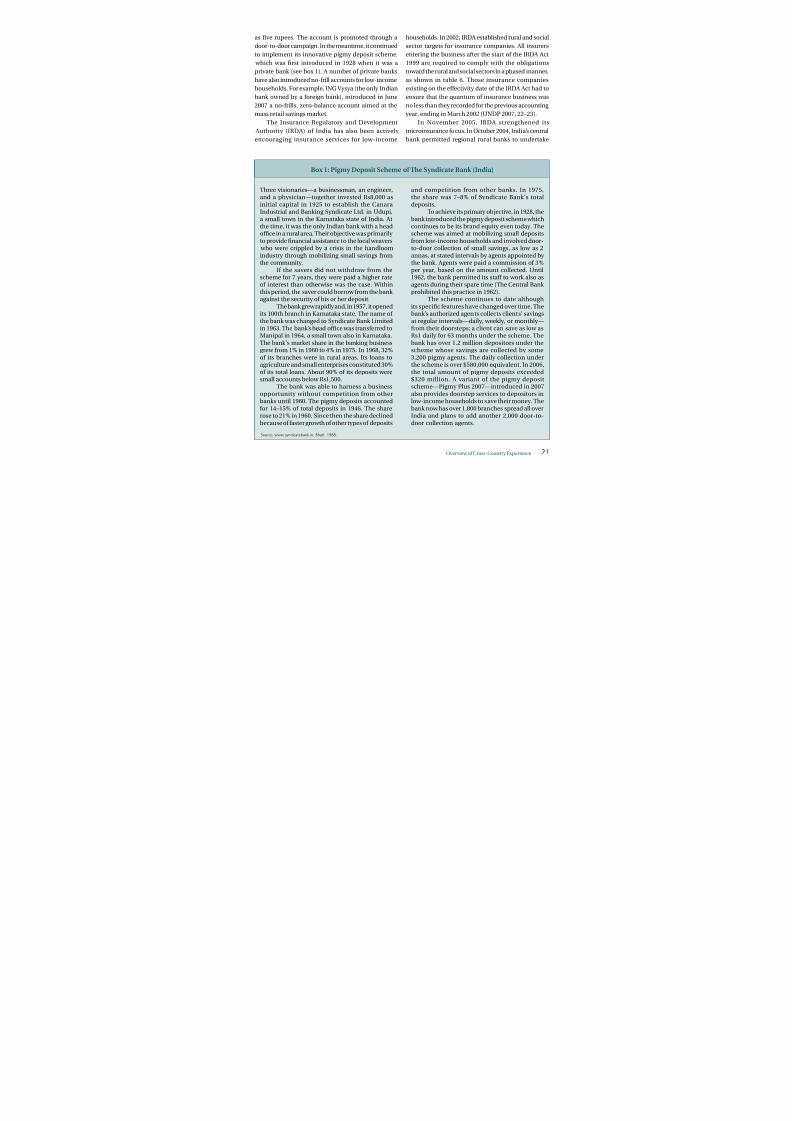
8/6/2019 Low Income Household Improvement
http://slidepdf.com/reader/full/low-income-household-improvement 30/46
Overview o Cross-Country Experience
Three visionaries—a businessman, an engineer,and a physician—together invested Rs8,000 asinitial capital in 1925 to establish the CanaraIndustrial and Banking Syndicate Ltd. in Udupi,a small town in the Karnataka state o India. Atthe time, it was the only Indian bank with a headoce in a rural area. Their objective was primarily to provide nancial assistance to the local weavers
who were crippled by a crisis in the handloomindustry through mobilizing small savings romthe community.
I the savers did not withdraw rom the
scheme or 7 years, they were paid a higher rateo interest than otherwise was the case. Withinthis period, the saver could borrow rom the bank against the security o his or her deposit.
The bank grew rapidly and, in 1957, it openedits 100th branch in Karnataka state. The name o the bank was changed to Syndicate Bank Limitedin 1963. The bank’s head oce was transerred toManipal in 1964, a small town also in Karnataka.The bank’s market share in the banking businessgrew rom 1% in 1960 to 4% in 1975. In 1968, 32%o its branches were in rural areas. Its loans toagriculture and small enterprises constituted 30%
o its total loans. About 90% o its deposits weresmall accounts below Rs1,500.
The bank was able to harness a businessopportunity without competition rom otherbanks until 1960. The pigmy deposits accountedor 14–15% o total deposits in 1946. The sharerose to 21% in 1960. Since then the share declinedbecause o aster growth o other types o deposits
and competition rom other banks. In 1975,the share was 7–8% o Syndicate Bank’s totaldeposits.
To achieve its primary objective, in 1928, thebank introduced the pigmy deposit scheme whichcontinues to be its brand equity even today. Thescheme was aimed at mobilizing small depositsrom low-income households and involved door-to-door collection o small savings, as low as 2annas, at stated intervals by agents appointed by the bank. Agents were paid a commission o 3%per year, based on the amount collected. Until
1962, the bank permitted its sta to work also asagents during their spare time (The Central Bank prohibited this practice in 1962).
The scheme continues to date althoughits specic eatures have changed over time. Thebank’s authorized agents collects clients’ savingsat regular intervals—daily, weekly, or monthly—rom their doorsteps; a client can save as low asRs1 daily or 63 months under the scheme. Thebank has over 1.2 million depositors under thescheme whose savings are collected by some3,200 pigmy agents. The daily collection underthe scheme is over $580,000 equivalent. In 2006,
the total amount o pigmy deposits exceeded$320 million. A variant o the pigmy depositscheme—Pigmy Plus 2007—introduced in 2007also provides doorstep services to depositors inlow-income households to save their money. Thebank now has over 1,800 branches spread all overIndia and plans to add another 2,000 door-to-door collection agents.
Source:www.syndicatebank.in;Bhatt.1988.
Box 1: Pigmy Deposit Scheme of The Syndicate Bank (India)
as ve rupees. The account is promoted through a
door-to-door campaign. In the meantime, it continued
to implement its innovative pigmy deposit scheme,
which was irst introduced in 1928 when it was a
private bank (see box 1). A number o private banks
have also introduced no-rill accounts or low-income
households. For example, ING Vysya (the only Indian
bank owned by a oreign bank), introduced in June
2007 a no-rills, zero-balance account aimed at the
mass retail savings market.
The Insurance Regulatory and Development
Authority (IRDA) o India has also been actively
encouraging insurance services or low-income
households. In 2002, IRDA established rural and social
sector targets or insurance companies. All insurers
entering the business ater the start o the IRDA Act
1999 are required to comply with the obligations
toward the rural and social sectors in a phased manner,
as shown in table 6. Those insurance companies
existing on the eectivity date o the IRDA Act had to
ensure that the quantum o insurance business was
no less than they recorded or the previous accounting
year, ending in March 2002 (UNDP 2007, 22–23).
In November 2005, IRDA strengthened its
microinsurance ocus. In October 2004, India’s central
bank permitted regional rural banks to undertake
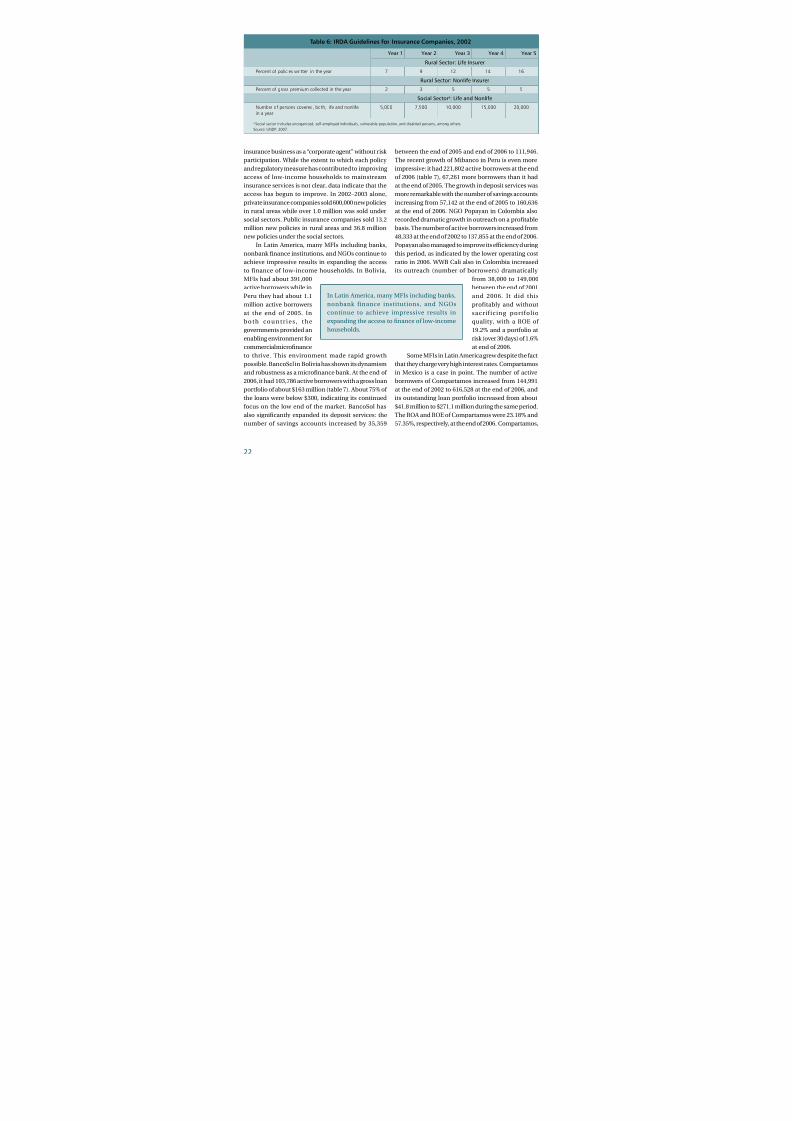
8/6/2019 Low Income Household Improvement
http://slidepdf.com/reader/full/low-income-household-improvement 31/46
insurance business as a “corporate agent” without risk
participation. While the extent to which each policy
and regulatory measure has contributed to improving
access o low-income households to mainstream
insurance services is not clear, data indicate that theaccess has begun to improve. In 2002–2003 alone,
private insurance companies sold 600,000 new policies
in rural areas while over 1.0 million was sold under
social sectors. Public insurance companies sold 13.2
million new policies in rural areas and 36.8 million
new policies under the social sectors.
In Latin America, many MFIs including banks,
nonbank nance institutions, and NGOs continue to
achieve impressive results in expanding the access
to inance o low-income households. In Bolivia,
MFIs had about 391,000active borrowers while in
Peru they had about 1.1
million active borrowers
at the end o 2005. In
b o t h c o u n t r i e s , t h e
governments provided an
enabling environment or
commercial micronance
to thrive. This environment made rapid growth
possible. BancoSol in Bolivia has shown its dynamism
and robustness as a micronance bank. At the end o
2006, it had 103,786 active borrowers with a gross loan
portolio o about $163 million (table 7). About 75% o
the loans were below $300, indicating its continued
ocus on the low end o the market. BancoSol has
also signicantly expanded its deposit services: the
number o savings accounts increased by 35,359
between the end o 2005 and end o 2006 to 111,946.
The recent growth o Mibanco in Peru is even more
impressive: it had 221,802 active borrowers at the end
o 2006 (table 7), 67,261 more borrowers than it had
at the end o 2005. The growth in deposit services wasmore remarkable with the number o savings accounts
increasing rom 57,142 at the end o 2005 to 160,636
at the end o 2006. NGO Popayan in Colombia also
recorded dramatic growth in outreach on a protable
basis. The number o active borrowers increased rom
48,333 at the end o 2002 to 137,855 at the end o 2006.
Popayan also managed to improve its eciency during
this period, as indicated by the lower operating cost
ratio in 2006. WWB Cali also in Colombia increased
its outreach (number o borrowers) dramatically
rom 38,000 to 149,000between the end o 2001
and 2006. It did this
proitably and without
sacri icing portol io
quality, with a ROE o
19.2% and a portolio at
risk (over 30 days) o 1.6%
at end o 2006.
Some MFIs in Latin America grew despite the act
that they charge very high interest rates. Compartamos
in Mexico is a case in point. The number o active
borrowers o Compartamos increased rom 144,991
at the end o 2002 to 616,528 at the end o 2006, and
its outstanding loan portolio increased rom about
$41.8 million to $271.1 million during the same period.
The ROA and ROE o Compartamos were 23.18% and
57.35%, respectively, at the end o 2006. Compartamos,
Year Year Year Year Year
Rural Sector: Life Insurer
Percentofpolicieswrittenintheyear 7 9 12 14 16
Rural Sector: Nonlife Insurer
Percentofgrosspremiumcollectedintheyear 2 3 5 5 5
Social Sectora: Life and Nonlife
Numberofpersonscovered,both,lifeandnonlife 5,000 7,500 10,000 15,000 20,000inayear
Table 6: IRDA Guidelines for Insurance Companies, 2002
aSocialsectorincludesunorganized,self-employedindividuals,vulnerablepopulation,anddisabledpersons,amongothers.
Source:UNDP.2007.
In Latin America, many MFIs including banks,
nonbank inance institutions, and NGOs
continue to achieve impressive results in
expanding the access to nance o low-income
households.
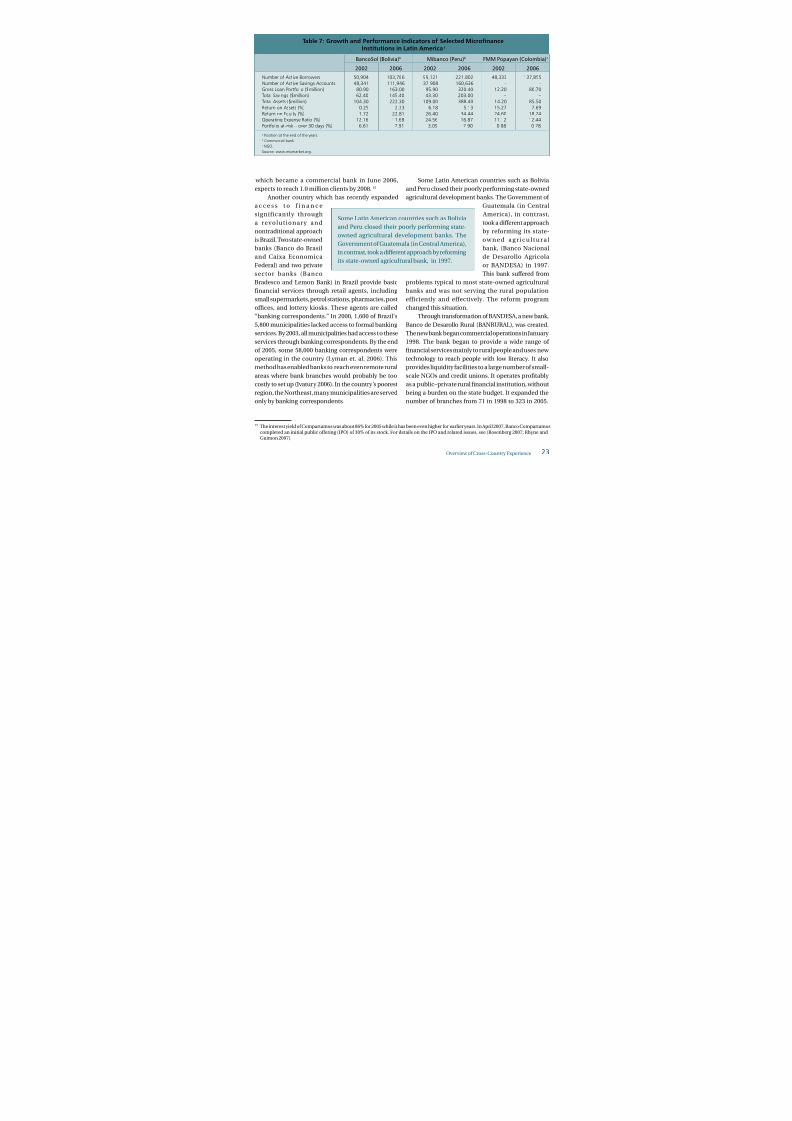
8/6/2019 Low Income Household Improvement
http://slidepdf.com/reader/full/low-income-household-improvement 32/46
Overview o Cross-Country Experience
15 The interest yield o Compartamos was about 86% or 2005 while it has been even higher or earlier years. In April 2007, Banco Compartamoscompleted an initial public oering (IPO) o 30% o its stock. For details on the IPO and related issues, see (Rosenberg 2007; Rhyne andGuimon 2007).
Table 7: Growth and Performance Indicators of Selected MicrofinanceInstitutions in Latin Americaa
aPositionattheendoftheyears.bCommercialbank.cNGO.
Source:www.mixmarket.org.
BancoSol (Bolivia)b Mibanco (Peru)b FMM Popayan (Colombia)c
00 00 00 00 00 00
NumberofActiveBorrowers 50,904 103,786 99,121 221,802 48,333 137,855NumberofActiveSavingsAccounts 48,341 111,946 37,908 160,636 – –GrossLoanPortfolio($million) 80.90 163.00 95.90 320.40 12.20 80.70TotalSavings($million) 62.40 145.40 43.30 203.00 – –TotalAssets($million) 104.30 222.30 109.00 388.40 14.20 85.50ReturnonAssets(%) 0.25 2.33 6.18 5.13 15.27 7.69ReturnonEquity(%) 1.72 22.81 26.40 34.44 24.60 18.24OperatingExpenseRatio(%) 12.16 11.68 24.56 16.87 11.12 12.44Portfolioat-risk–over30days(%) 6.61 2.91 3.09 2.90 0.88 0.78
which became a commercial bank in June 2006,
expects to reach 1.0 million clients by 2008.15
Another country which has recently expanded
a c c e s s t o i n a n c e
signiicantly through
a r evo l u tio n a r y a n d
nontraditional approach
is Brazil. Two state-owned
banks (Banco do Brasil
and Caixa Economica
Federal) and two private
sector banks (Banco
Bradesco and Lemon Bank) in Brazil provide basic
inancial services through retail agents, including
small supermarkets, petrol stations, pharmacies, post
oces, and lottery kiosks. These agents are called
“banking correspondents.” In 2000, 1,600 o Brazil’s
5,800 municipalities lacked access to ormal banking
services. By 2003, all municipalities had access to these
services through banking correspondents. By the end
o 2005, some 58,000 banking correspondents were
operating in the country (Lyman et. al. 2006). This
method has enabled banks to reach even remote rural
areas where bank branches would probably be too
costly to set up (Ivatury 2006). In the country’s poorest
region, the Northeast, many municipalities are served
only by banking correspondents.
Some Latin American countries such as Bolivia
and Peru closed their poorly perorming state-owned
agricultural development banks. The Government o
Guatemala (in Central
America), in contrast,
took a dierent approach
by reorming its state-
o w n e d a g r i c u l t u r a l
bank, (Banco Nacional
de Desarollo Agricola
or BANDESA) in 1997.
This bank suered rom
problems typical to most state-owned agricultural
banks and was not serving the rural population
eiciently and eectively. The reorm program
changed this situation.
Through transormation o BANDESA, a new bank,
Banco de Desarollo Rural (BANRURAL), was created.
The new bank began commercial operations in January
1998. The bank began to provide a wide range o
nancial services mainly to rural people and uses new
technology to reach people with low literacy. It also
provides liquidity acilities to a large number o small-
scale NGOs and credit unions. It operates protably
as a public–private rural nancial institution, without
being a burden on the state budget. It expanded the
number o branches rom 71 in 1998 to 323 in 2005.
Some Latin American countries such as Bolivia
and Peru closed their poorly perorming state-
owned agricultural development banks. The
Government o Guatemala (in Central America),
in contrast, took a dierent approach by reorming
its state-owned agricultural bank, in 1997.
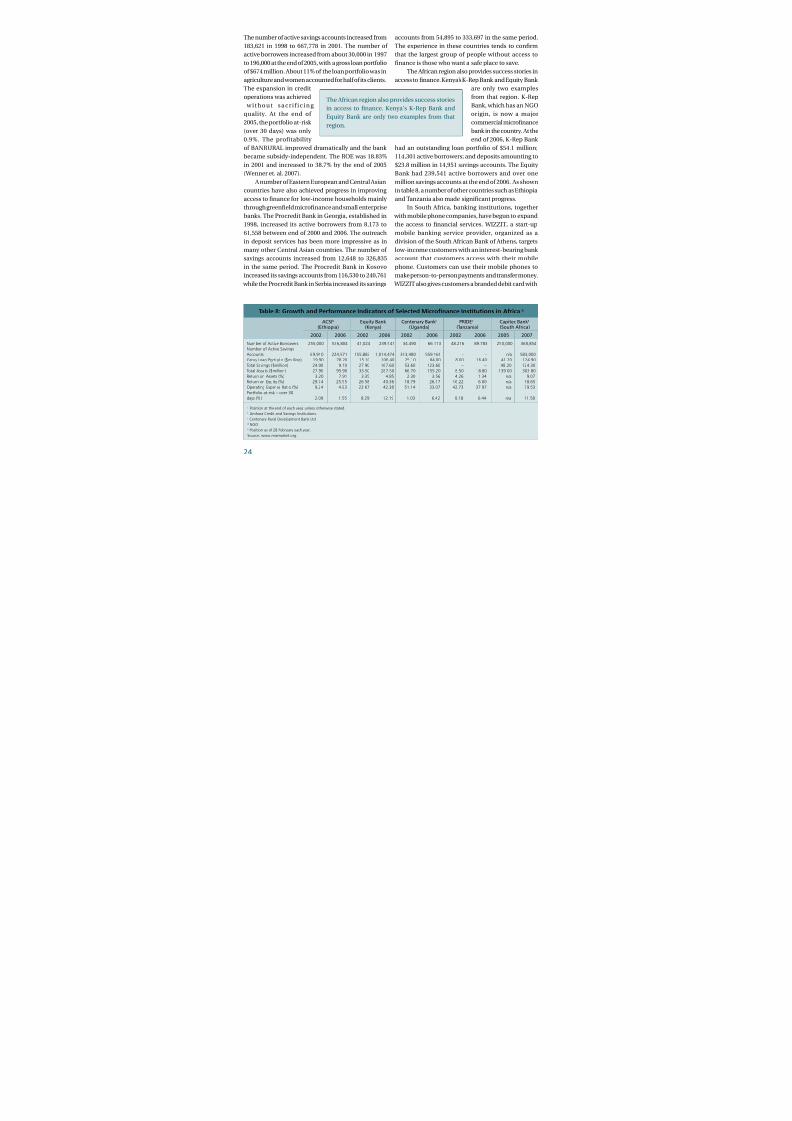
8/6/2019 Low Income Household Improvement
http://slidepdf.com/reader/full/low-income-household-improvement 33/46
The number o active savings accounts increased rom
183,621 in 1998 to 667,778 in 2001. The number o
active borrowers increased rom about 30,000 in 1997
to 196,000 at the end o 2005, with a gross loan portolio
o $674 million. About 11% o the loan portolio was in
agriculture and women accounted or hal o its clients.
The expansion in credit
operations was achieved
w i t h o u t s a c r i i c i n g
quality. At the end o
2005, the portolio at-risk
(over 30 days) was only
0.9%. The proitability
o BANRURAL improved dramatically and the bank
became subsidy-independent. The ROE was 18.83%
in 2001 and increased to 38.7% by the end o 2005
(Wenner et. al. 2007).
A number o Eastern European and Central Asiancountries have also achieved progress in improving
access to nance or low-income households mainly
through greeneld micronance and small enterprise
banks. The Procredit Bank in Georgia, established in
1998, increased its active borrowers rom 8,173 to
61,558 between end o 2000 and 2006. The outreach
in deposit services has been more impressive as in
many other Central Asian countries. The number o
savings accounts increased rom 12,648 to 326,835
in the same period. The Procredit Bank in Kosovo
increased its savings accounts rom 116,530 to 240,761 while the Procredit Bank in Serbia increased its savings
accounts rom 54,895 to 333,697 in the same period.
The experience in these countries tends to conrm
that the largest group o people without access to
nance is those who want a sae place to save.
The Arican region also provides success stories in
access to nance. Kenya’s K-Rep Bank and Equity Bank
are only two examples
rom that region. K-Rep
Bank, which has an NGO
origin, is now a major
commercial micronance
bank in the country. At the
end o 2006, K-Rep Bank
had an outstanding loan portolio o $54.1 million;
114,301 active borrowers; and deposits amounting to
$23.8 million in 14,951 savings accounts. The Equity
Bank had 239,541 active borrowers and over one
million savings accounts at the end o 2006. As shownin table 8, a number o other countries such as Ethiopia
and Tanzania also made signicant progress.
In South Arica, banking institutions, together
with mobile phone companies, have begun to expand
the access to nancial services. WIZZIT, a start-up
mobile banking service provider, organized as a
division o the South Arican Bank o Athens, targets
low-income customers with an interest-bearing bank
account that customers access with their mobile
phone. Customers can use their mobile phones to
make person-to-person payments and transer money. WIZZIT also gives customers a branded debit card with
ACSIb Equity Bank Centenary Bank c PRIDEd Capitec Bank e
(Ethiopia) (Kenya) (Uganda) (Tanzania) (South Africa)
00 00 00 00 00 00 00 00 00 00
NumberofActiveBorrowers 255,000 536,804 41,024 239,541 34,490 66,113 48,216 89,783 250,000 368,854NumberofActiveSavingsAccounts 69,910 224,571 155,883 1,014,474 313,480 559,161 – – n/a 583,000
GrossLoanPortfolio($million) 19.90 78.20 15.10 106.40 25.10 84.00 8.00 16.40 41.20 124.90TotalSavings($million) 24.90 9.10 27.90 167.60 53.60 123.60 – – 48.20 124.30
TotalAssets($million) 27.90 95.90 33.50 287.50 66.70 155.20 8.50 18.80 139.00 303.80ReturnonAssets(%) 3.20 7.91 3.35 4.85 2.30 3.56 4.26 1.34 n/a 9.07ReturnonEquity(%) 29.74 25.55 26.58 40.36 18.79 26.17 16.22 6.00 n/a 18.65OperatingExpenseRatio(%) 9.24 4.93 23.67 42.38 51.14 33.07 42.73 37.97 n/a 79.53
Portfolioat-risk–over30days(%) 2.09 1.55 8.29 12.19 1.03 6.42 0.18 0.44 n/a 11.58
Table 8: Growth and Performance Indicators of Selected Microfinance Institutions in Africaa
aPositionattheendofeachyear,unlessotherwisestated.bAmharaCreditandSavingsInstitutions.cCentenaryRuralDevelopmentBankLtd.dNGOePositionasof28Februaryeachyear.
Source:www.mixmarket.org.
The Arican region also provides success stories
in access to nance. Kenya’s K-Rep Bank and
Equity Bank are only two examples rom that
region.
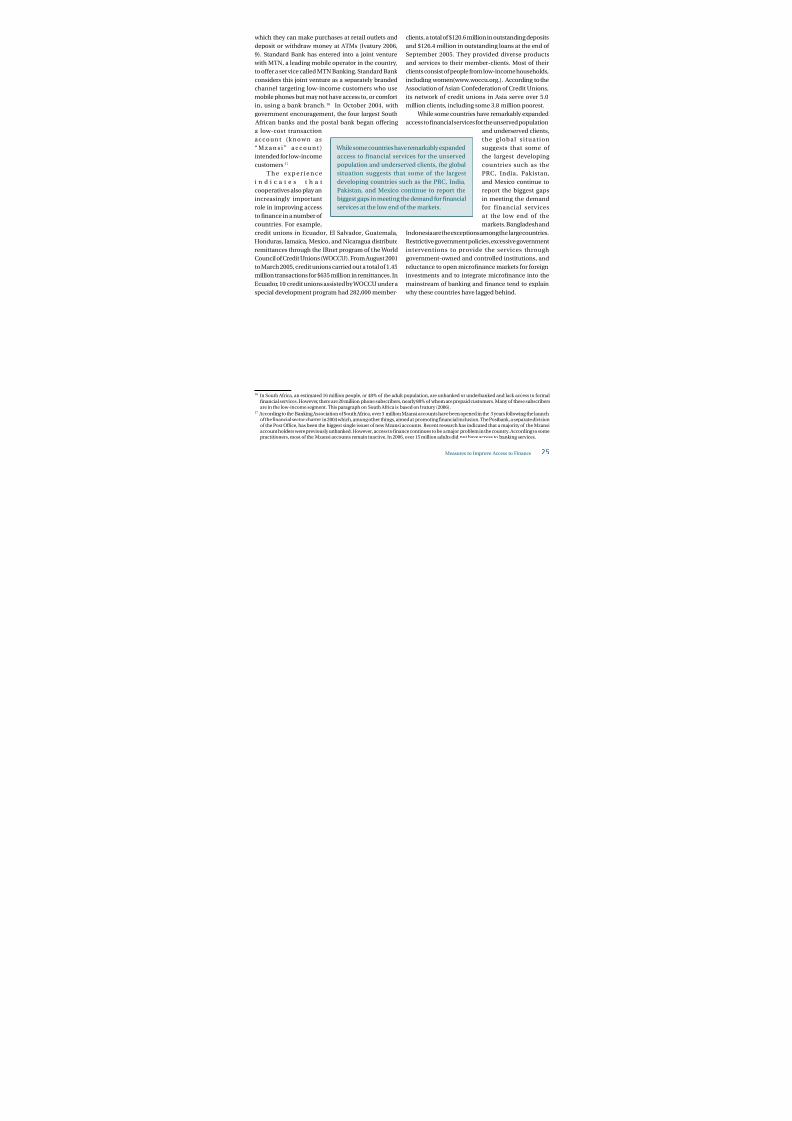
8/6/2019 Low Income Household Improvement
http://slidepdf.com/reader/full/low-income-household-improvement 34/46
Measures to Improve Access to Finance
16 In South Arica, an estimated 16 million people, or 48% o the adult population, are unbanked or underbanked and lack access to ormalfnancial services. However, there are 20 million phone subscribers, nearly 80% o whom are prepaid customers. Many o these subscribersare in the low-income segment. This paragraph on South Arica is based on Ivatury (2006).
17 According to the Banking Association o South Arica, over 3 million Mzansi accounts have been opened in the 3 years ollowing the launcho the fnancial sector charter in 2004 which, among other things, aimed at promoting fnancial inclusion. The Postbank, a separate divisiono the Post Ofce, has been the biggest single issuer o new Mzansi accounts. Recent research has indicated that a majority o the Mzansiaccount holders were previously unbanked. However, access to fnance continues to be a major problem in the country. According to somepractitioners, most o the Mzansi accounts remain inactive. In 2006, over 15 million adults did not have access to banking services.
which they can make purchases at retail outlets and
deposit or withdraw money at ATMs (Ivatury 2006,
9). Standard Bank has entered into a joint venture
with MTN, a leading mobile operator in the country,
to oer a service called MTN Banking. Standard Bank
considers this joint venture as a separately branded
channel targeting low-income customers who use
mobile phones but may not have access to, or comort
in, using a bank branch.16 In October 2004, with
government encouragement, the our largest South
Arican banks and the postal bank began oering
a low-cost transaction
a c c o u n t ( k n o w n a s
“ M z a n s i ” a c c o u n t )
intended or low-income
customers.17
T h e e x p e r i e n c e
i n d i c a t e s t h a tcooperatives also play an
increasingly important
role in improving access
to nance in a number o
countries. For example,
credit unions in Ecuador, El Salvador, Guatemala,
Honduras, Jamaica, Mexico, and Nicaragua distribute
remittances through the IRnet program o the World
Council o Credit Unions (WOCCU). From August 2001
to March 2005, credit unions carried out a total o 1.45
million transactions or $635 million in remittances. InEcuador, 10 credit unions assisted by WOCCU under a
special development program had 282,000 member-
clients, a total o $120.6 million in outstanding deposits
and $126.4 million in outstanding loans at the end o
September 2005. They provided diverse products
and services to their member-clients. Most o their
clients consist o people rom low-income households,
including women(www.woccu.org.). According to the
Association o Asian Conederation o Credit Unions,
its network o credit unions in Asia serve over 5.0
million clients, including some 3.8 million poorest.
While some countries have remarkably expanded
access to nancial services or the unserved population
and underserved clients,
the gl o ba l s i tu a tio n
suggests that some o
the largest developing
countries such as the
PRC, India, Pakistan,
and Mexico continue toreport the biggest gaps
in meeting the demand
or inancial services
at the low end o the
markets. Bangladesh and
Indonesia are the exceptions among the large countries.
Restrictive government policies, excessive government
interventions to provide the services through
government-owned and controlled institutions, and
reluctance to open micronance markets or oreign
investments and to integrate micronance into themainstream o banking and nance tend to explain
why these countries have lagged behind.
While some countries have remarkably expanded
access to inancial services or the unserved
population and underserved clients, the global
situation suggests that some o the largest
developing countries such as the PRC, India,
Pakistan, and Mexico continue to report the
biggest gaps in meeting the demand or nancial
services at the low end o the markets.
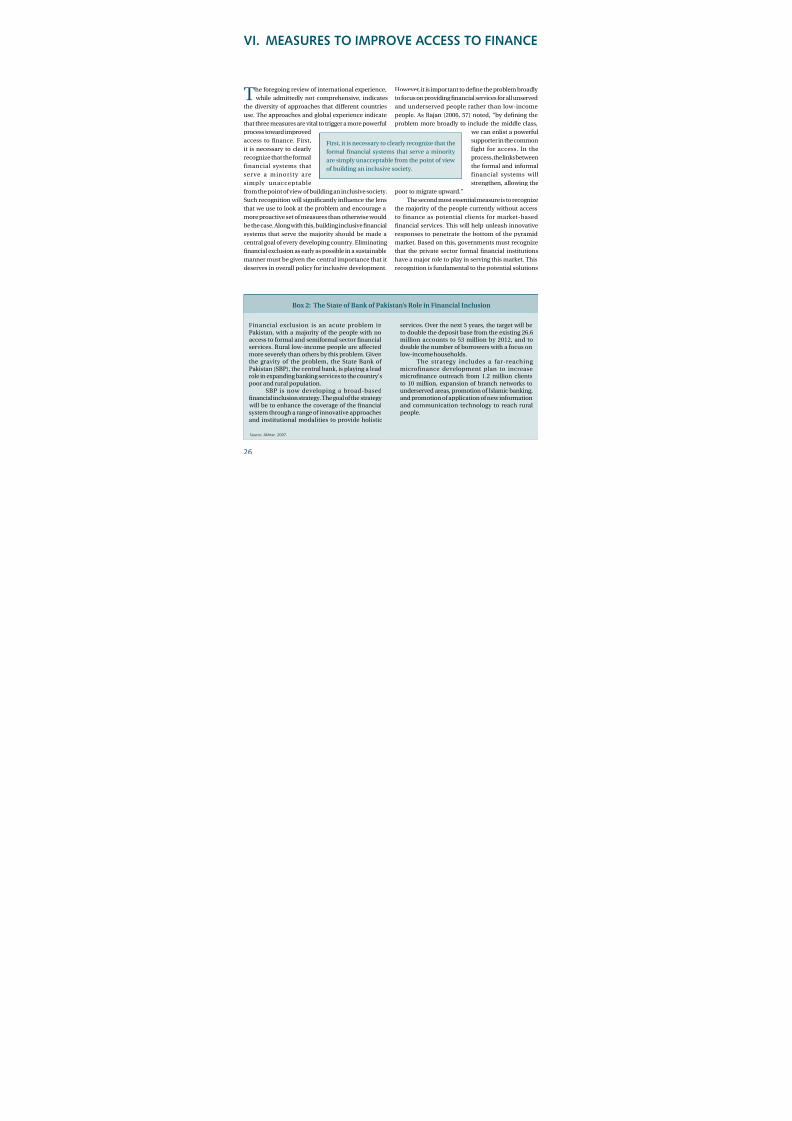
8/6/2019 Low Income Household Improvement
http://slidepdf.com/reader/full/low-income-household-improvement 35/46
VI. MEASURES TO IMPROVE ACCESS TO FINANCE
The oregoing review o international experience, while admittedly not comprehensive, indicates
the diversity o approaches that dierent countries
use. The approaches and global experience indicate
that three measures are vital to trigger a more powerul
process toward improved
access to nance. First,
it is necessary to clearly
recognize that the ormal
inancial systems that
serve a minority are
simply unacceptablerom the point o view o building an inclusive society.
Such recognition will signicantly infuence the lens
that we use to look at the problem and encourage a
more proactive set o measures than otherwise would
be the case. Along with this, building inclusive nancial
systems that serve the majority should be made a
central goal o every developing country. Eliminating
nancial exclusion as early as possible in a sustainable
manner must be given the central importance that it
deserves in overall policy or inclusive development.
However, it is important to dene the problem broadly to ocus on providing nancial services or all unserved
and underserved people rather than low-income
people. As Rajan (2006, 57) noted, “by dening the
problem more broadly to include the middle class,
we can enlist a powerul
supporter in the common
ight or access. In the
process, the links between
the ormal and inormal
inancial systems will
strengthen, allowing thepoor to migrate upward.”
The second most essential measure is to recognize
the majority o the people currently without access
to inance as potential clients or market-based
nancial services. This will help unleash innovative
responses to penetrate the bottom o the pyramid
market. Based on this, governments must recognize
that the private sector ormal nancial institutions
have a major role to play in serving this market. This
recognition is undamental to the potential solutions
Financial exclusion is an acute problem inPakistan, with a majority o the people with noaccess to ormal and semiormal sector nancialservices. Rural low-income people are aectedmore severely than others by this problem. Giventhe gravity o the problem, the State Bank o
Pakistan (SBP), the central bank, is playing a leadrole in expanding banking services to the country’spoor and rural population.
SBP is now developing a broad-basednancial inclusion strategy. The goal o the strategy
will be to enhance the coverage o the nancialsystem through a range o innovative approachesand institutional modalities to provide holistic
services. Over the next 5 years, the target will beto double the deposit base rom the existing 26.6million accounts to 53 million by 2012, and todouble the number o borrowers with a ocus onlow-income households.
The strategy includes a ar-reaching
microinance development plan to increasemicronance outreach rom 1.2 million clientsto 10 million, expansion o branch networks tounderserved areas, promotion o Islamic banking,and promotion o application o new inormationand communication technology to reach ruralpeople.
Source:Akhtar.2007.
Box 2: The State of Bank of Pakistan’s Role in Financial Inclusion
First, it is necessary to clearly recognize that the
ormal nancial systems that serve a minority
are simply unacceptable rom the point o view
o building an inclusive society.
8/6/2019 Low Income Household Improvement
http://slidepdf.com/reader/full/low-income-household-improvement 36/46
Measures to Improve Access to Finance
and the seriousness with which they are likely to be
executed.
Third, within government bureaucracy, improving
access to inance should be made an explicit
responsibility o the central bank o each country. This
is particularly important because nancial inclusion
can best be achieved when it is mainstreamed into
the broader inancial system under competitive
conditions. Central banks in most developing
countries used to treat access to nance problems with
benign neglect.18 This has begun to change. A number
o central banks now show more interest in nancial
inclusion. The case o the State Bank o Pakistan (box
2) is an illustration.
Setting goals are necessary but not sucient.
The governments, including central banks, have to
take a number o concrete actions to translate the
goal o nancial inclusioninto a reality (United
N a t i o n s 2 0 0 6 , 1 5 2 ;
Claessens 2005; Kumar
2005) . Go ver n men ts
have to dene their role
and execute it in such a
way that it will provide
space and incentives or
private sector institutions
including social investors to play an increasing role in
providing the services. Essentially, the governmentsneed to ocus on a number o key areas.
First, the governments need to collect hard
data on the extent o the inancial exclusion and
such eorts need to be repeated periodically.19 This
would provide a basis or selecting priority areas,
ormulating a coherent set o activities to address
the problem, ne-tuning those programs in place,
and monitoring the progress over time. Second,
18 There are some exceptions. A case in point is the Reserve Bank o India (RBI). For many years, RBI has shown interest in reducing fnancialexclusion. This continues to date. For example, the Governor o RBI in his Annual Policy Statement or both 2005–2006 and 2006–2007 madereerence to fnancial exclusion and urged the banks to align themselves with its objectives.
19 Most policy makers do not even know the extent o the problem because such statistics are not collected systematically. As the AdvisorsGroup to the United Nations International Year o Microcredit (UNCDF 2005) noted: “the lack o good data has made it hard or governmentsand others to make well-designed policy, hard or potential providers o fnancial services to poor people to accurately judge the need/opportunity, hard or multilaterals and donors to judge i their actions are helping or hindering the fnancial sectors in which they intervene,hard or investors to assess the market opportunities, and hard even to reach empirically sound conclusions about the relationship betweenfnancial access, poverty, and economic growth.”
20 Financial inrastructure includes prudential regulation and supervision o fnancial institutions; accounting policies and fnancial inormationdisclosure required o fnancial institutions; ramework o laws governing fnancial transactions and the legal procedures to enorce them;and dissemination o fnancial and legal inormation.
governments need to create an enabling environment
or the private sector service providers, including
NGOs, and allow them operational autonomy to make
sound business decisions and adopt commercial
practices. Third, governments have to develop
nancial inrastructure.20 Financial inrastructure will
signicantly reduce both risks and transaction costs
o providing a range o nancial services in various
ways. Financial inrastructure, or example, will
reduce inormation barriers and asymmetries, induce
entry o new institutions into the industry, induce
inancial technological innovations, and promote
greater competition. Financial inrastructure will have
a positive impact particularly on access to credit or
people with little or no marketable collateral and poor
people’s demand or nancial assets in the ormal
sector. In many countries, poor physical inrastructure
discourages extensiono more fexible delivery
mechanisms such as use
o ATMs in rural areas.
The governments
also have to initiate
serious reorm programs
to transorm state-owned
inancial institutions
with a mandate to serve
low-income groups into viable and dynamic service
providers. In most countries, these institutions havelow outreach, provide poor quality services, are ull
o rent seekers, and consume large amounts o public
unds to sustain their operations. However, they do
oer potential to become demand-driven, sustainable
institutions providing access to an increasing segment
o the underserved and unserved population. This
potential must be ully harnessed through appropriate
reorm programs. Such eorts should encompass
Governments have to deine their role and
execute it in such a way that it will provide space
and incentives or private sector institutions
including social investors to play an increasing
role in providing the services. Essentially, the
governments need to ocus on a number o key
areas.
8/6/2019 Low Income Household Improvement
http://slidepdf.com/reader/full/low-income-household-improvement 37/46
postal savings institutions and other savings banks,
in addition to agricultural and rural development
banks which do not unction eectively and eciently
or operate sustainably. Reorms in these institutions
may pave a better way or their eventual partial or ull
privatization as shown by the cases o BRI in Indonesia,
Agricultural Bank o
Mongolia, and BANDESA
in Guatemala.
To ease constraints
on expanding supply o
services, central banks
should examine how regulatory systems impede
nancial inclusion. Providing legal and regulatory
space or new institutional modalities to emerge
and thrive needs to be given greater attention than
in the past. Improvements to regulatory systems
need to be done within a orward-looking ramework where technological innovations in inormation
and communication tend to increasingly dismantle
the industry boundaries and make it possible or
nonnancial institutions to become major players
in providing a range o nancial services which are
traditionally considered to be the domain o pure
nancial institutions.
The governments can also take measures
to address demand-side constraints. Two types
o measures appear to
be important. The irsttype in c l u des tho se
necessary to improve the
environment or more
protable investments at
the low end o the nancial
market. Greater attention
is needed to improve rural
inrastructure, markets,
and pro-poor technology.
In most developing countries, people in rural areas
ace high risks and transaction costs because o lack o basic inrastructure. The potential service providers
also ace similarly high risks and transaction costs in
reaching rural people. A strategy aimed at opening
up new economic opportunities in these areas will
reduce clients’ transaction costs and risks associated
not only with investments but also with using nancial
services provided by ormal sources which, in turn,
will increase incentives
to seek nancial services
o o r m a l s o u r c e s .
In addition, the same
strategy will improve
suppliers’ incentives to
expand the services because it will reduce their risks
and transaction costs. The second set o measures
ocuses on programs to increase nancial literacy
among dierent categories o excluded people. 21
Central banks can play a lead role in this task.
The governments also must ensure an adequatelevel o competition in the nancial system. Competition
could infuence the inherently asymmetric incentive
structure o the established conventional incumbents
in regard to moving up market and encouraging their
penetration into low-end markets. This process is
already in motion in some countries and it is likely
to gather urther strength and momentum in the
medium-term primarily because o the increasing
role o oreign banks and other nancial institutions
i n m o s t d e v e l o p i n g
countries. For example,India’s domestic banks
seem to be coming under
increasing pressure to
strengthen their eorts
to move down-market
owing to the increasing
role o oreign banks in
the nancial system.
The private-sector-
established nancial institutions will have to develop
more robust business models to deliver nancial servicesto the low-end markets. They may increasingly require
21 Some developed countries have established dedicated unds to promote fnancial inclusion. For example, the Government o UnitedKingdom established a £120 million Financial Inclusion Fund in 2005. Barclays Bank also launched a Financial Inclusion Fund in 2005 tosupport programs aimed at reducing fnancial exclusion. Both unds support, among other things, fnancial literacy improvement programs.The Royal Bank o Scotland Group has set up a Financial Inclusion Innovation Fund which provides grants to organizations to test out new approaches and activities to promote fnancial inclusion (HM Treasury 2004). Developing countries have begun to ollow this. The FinanceMinster o the Government o India in his budget or 2007–2008 announced the setting up o two unds or fnancial inclusion: the frstcalled Financial Inclusion Fund or developmental and promotional interventions and other called Financial Inclusion Technology Fundto meet cost o technology adoption. Each und will have $125 million.
The governments can also take measures to
address demand-side constraints. Two types o
measures appear to be important.
The private-sector-established inancial
institutions will have to develop more robust
business models to deliver nancial services
to the low-end markets. They may increasingly
require partnerships and alliances with a range
o inancial and noninancial institutions,
including limited service nongovernment
MFIs.

8/6/2019 Low Income Household Improvement
http://slidepdf.com/reader/full/low-income-household-improvement 38/46
The Future o Access to Finance
partnerships and alliances with a range o nancial and
nonnancial institutions, including limited service
nongovernment MFIs. They need to gure out how
emerging new technology can be integrated into their
service delivery models to penetrate this market and
stay competitive. Banks like ICICI in India has already
begun this process by establishing new partnerships
with regulated MFIs and NGOs providing nancial
and other services to the poor and exploring how new
technology such as low-cost ATMs can be eectively
used to expand their services.
Other countries also provide promising examples.
The ANZ Bank’s eorts in the Fiji Islands is one such
example. ANZ Bank carried out a systematic program
in the Fiji Islands to serve excluded people in rural
areas and oered two simple products to suit their
requirements—a savings account and an everyday
account. The savings account has a zero opening
balance, is operated with a passbook, pays interest on
every dollar saved, and is charged a ee only when the
customer withdraws. The everyday account has also
been designed to suit low-income clients including
microenterprise operators. From October 2004 to
end o March 2005, 25,800 previously unbanked rural
Fijians opened accounts and amassed more than
$500,000 as a result o this eort (Blacklock 2005).
8/6/2019 Low Income Household Improvement
http://slidepdf.com/reader/full/low-income-household-improvement 39/46
0
VII. THE FUTURE OF ACCESS TO FINANCE
A ccess to nance is poised or signicant growthglobally. The uture growth in nancial services
or low-income households will be driven by
more enabling policy
environment, integration
o technology into this
segment o the nancial
markets, and increasing
c o m p e t i t i o n . T h e
countries in which these
dierent drivers converge
would most likely see anexponential growth in access to nance or those at
the low-end o the markets.
In most countries, the government role is crucial
or the continued growth in access to nance. The
access to nance will grow at higher rates in countries
where governments acilitate rather than undermine
private sector’s role. The countries that allow diverse
institutions to enter the industry and play an active
role will see much higher growth rates than the others.
The countries that continue to have serious doubts
about the need or more commercial approachesa n d in ter ven e in the
markets through interest
rate restrictions and other
tr a dit io n a l mea su r es
such as directed credit in
particular will continue to
see only sluggish growth.
Similarly, the countries that do not adopt more proactive
and orward-looking policies to address regulatory
and other issues arising as a result o increasing
application o new inormation and communicationtechnology are likely to all behind those that address
such issues eectively. Also, countries that continue
restrictions on oreign investments in micronance
and do not make adequate eorts to make their
broader inancial systems more competitive are
likely to experience persistent problems in access to
nance. In countries where technological integration
is rapid and the sector is likely to expand rapidly, thegovernment will have to pay much greater attention
than in the past to strengthen supervisory and
regulatory systems and
inancial inrastructure
that would acilitate risk
management and access
to client inormation.
The other major
dr iver o gr o w th in
access to nance will be
increased competition.Competition will help in many dierent ways. First,
it will drive the prices (including transaction costs)
down and allow those who are currently excluded or
price-related reasons to enter the market and access
the services. This is particularly true in respect o credit
and money transer services. In Bolivia, microcredit
interest rates have declined rom an average o about
30% in 1998 to 24% in 2002 and 21.2% in 2005. The
competitive markets will produce similar results in
other countries. Second, competition will motivate
incumbents to reexamine and improve their businessmodels to provide better
quality services and a
wider range o services to
ensure their institutional
viability. In Bangladesh,
some MFIs reduced the
c o m p u l s o r y s a v i n g s
requirements because o increasing competition. A
number o MFIs, including BRAC and ASA, have also
reduced their nominal interest rates. The competition
will lead to a substantial growth in lending orhousing improvements, education, emergencies,
and consumer durables. Microinsurance services will
also dramatically grow in the next decade because
mainstream insurance companies have begun to
penetrate this market through their own delivery
networks and through partner-agency arrangements
with institutions such as MFIs and post oces having
The uture growth in nancial services or the
low-income households will be driven by more
enabling policy environment, integration o
technology into this segment o the nancial
markets, and increasing competition.
Competition will motivate incumbents to
reexamine and improve their business models to
provide better quality services and a wider range
o services to ensure their institutional viability.
8/6/2019 Low Income Household Improvement
http://slidepdf.com/reader/full/low-income-household-improvement 40/46
The Future o Access to Finance
wider networks. Third, competition at the upper
end o the markets will reinorce the incentives or
incumbents, particularly the domestic commercial
banks with currently no or minimal micronance
market penetration, to go down–market, thus leading
to an expansion o the supply with consequent
positive eects on the clients. I the current trends
in countries such as the Philippines and South
Arica are an indication,
the uture competition
may also come rom
nonnancial institutions
such as mobile phone
companies owing to the
increasingly blurring
industry boundaries in
the nancial service industry.
The other key driver o uture growth will betechnology. Three broad types o technology will
drive this growth: rst is pro-poor new inormation
and communication technology, primarily low-cost
cellphones; second is advances in ATMs and other
point o sales devices; and third is smart plastic cards.
Technology will positively impact on both demand or
and supply o a variety o nancial services. Technology
will reduce operating costs, improve eciency, and
lead to new delivery mechanisms and business
models. For example, technology will allow branchless
banking and establishment o new partnerships
between nancial service providers and a range o
other service providers
that were not easible
beore to provide services
to clients in remote areas
a n d l o w -po pu l a tio n
density areas. Mobile-
phone-based services
a r e r e v o l u t i o n i z i n g
micronance services in a number o countries such
as South Arica, Philippines, and India. However, theextent to which technology will be integrated into the
nancial service industry at the low end will depend
on supportive government policies and the quality o
the inrastructure, particularly in rural areas.
Technology will positively impact on both
demand or and supply o a variety o nancial
services. Technology will reduce operating costs,
improve eciency, and lead to new delivery
mechanisms and business models.
8/6/2019 Low Income Household Improvement
http://slidepdf.com/reader/full/low-income-household-improvement 41/46
VIII. CONCLUSIONS
Access to nance is a central issue in developmentrom the view points o growth, reduction o income
poverty, social development, and equity. In most
developing countries, only a minority o the population
has access to nance, adversely aecting both growth
and inclusive development. For equitable growth and
inclusive development, this issue must be addressed
head-on particularly because in absolute terms low-
income people account
or the largest number
o people without access
to inancial services.Providing better access to
a wider range o nancial
services or this segment
o the population will
have a ar-reaching impact on the welare o their
amilies and contribute toward creating a more
egalitarian society than otherwise would be the
case.
The global experience on improving access
to inance or larger numbers o the population
suggests that there is no universally applicable model.Countries have achieved impressive results through a
range o approaches. However, the experience suggests
that countries that allow diversity in approaches and
institutional modalities
are most likely to achieve
better results and create
more competitive markets
that would immensely
b e n e i t l o w - i n c o m e
households than others.
The need or diversity in approaches and institutions is justied not only
by the diversity in demand or nancial services and
multidimensional nature o poverty but also by the
need to reduce systemic risks, increase competition,
and improve eciency.
The global experience provides useul insightsor policy makers in improving access to nance. The
governments need to recognize not only that private
sector institutions have a potentially major role to play
but also the central role o the governments themselves.
The governments have to dene their role and execute
it in such a way that it will provide space and incentives
or the private sector to play an increasing role in
providing services.
E s s e n t i a l l y , t h e
governments need to ocus
on a number o key areas.First, governments need
to explicitly recognize
access to nance or all
unserved and underserved
people as an important goal to pursue. Second, the
responsibility or improving access to nance must
be assigned to central banks. Third, systematic
eorts must be initiated and pursued to collect
data on dierent dimensions o the access problem.
Fourth, governments need to create an enabling
environment or the private sector service providersand allow them operational autonomy to make
sound business decisions. Fith, governments must
initiate reorm programs to transorm state-owned
inancial institutions
with a mandate to serve
low-income people into
via bl e a n d dyn a mic
service providers. Sixth,
governments should
create legal space and
improve the inancialregulatory system to acilitate integration o nancial
services or the poor into the mainstream o nance.
In Brazil, banking regulators allowed banks to open
basic transaction accounts or poor people with
no proo o address or income. The countries such
The global experience on improving access to
nance or larger numbers o the population
suggests that there is no universally applicable
model. Countries have achieved impressive
results through a range o approaches.
Access to nance is a central issue in development
rom the view points o growth, reduction
o income poverty, social development,
and equity... this issue must be addressed
head-on.
8/6/2019 Low Income Household Improvement
http://slidepdf.com/reader/full/low-income-household-improvement 42/46
Reerences
as Bolivia and Peru not only provided an enabling
policy environment but also necessary legal space
or regulated MFIs to emerge and thrive. Seventh,
governments have to develop nancial inrastructure
to reduce risks and transaction costs o providing
inancial services by
ormal sector institutions.
Eight, governments have
to adopt more liberal
p o l i c i e s o n o r e i g n
investments in nancial
services or the poor to
benet rom the vast amount o human and nancial
resources seeking investment opportunities in
nancial services or the poor. The important role
played by oreign investments in countries such as
Cambodia and Mongolia should not be overlooked.
Ninth, governments have to make signiicant
investments to improve economic and social
inrastructure in countries where underinvestments
in these constitute a major issue. Improvements in
economic and social inrastructure will reduce risks
and transaction costs
o providing inancial
services to the poor. In
addition, they will reduce
clients’ transaction costs
o accessing the services
and risks that they may
have to ace in their investment activities. In summary,
government eorts must be ocused on promoting,
rather than replacing, private nancial institutions to
provide nancial services or all.
In summary, government eorts must beocused on promoting, rather than replacing,
private nancial institutions to provide nancial
services or all.
8/6/2019 Low Income Household Improvement
http://slidepdf.com/reader/full/low-income-household-improvement 43/46
REFERENCES AND WEBSITES
Akhtar, Shamshad. 2007. A New Paradigm. Banker 57 (979): 36–37. Asian Development Bank (ADB). 2000. Finance or the Poor: Micronance Development Strategy. Manila:
ADB.
. 2003. Report and Recommendation o the President to the Board o Directors on a Proposed Loan to
Sri Lanka or the Rural Finance Sector Development Program. Manila.
. 2005. The Changing Face o the Micronance Industry: Building Financial Systems or the Poor. Theme
Paper No. 14. Manila: ADB.
Bank Rakyat Indonesia (BRI). 2001. BRI Microbanking Services: Development Impact and Future Growth
Potential. Jakarta: BRI and the Center or Business and Government, John F. Kennedy School o
Government, Harvard University.
Barth, James, R. et. al. 2006. Rethinking Bank Regulation: Till Angels Govern. New York: Cambridge University
Press.
Beck, Thorsten, et. al. 2007. Banking Services or Everyone? Barriers to Bank Access and Use Around the World.
Paper presented at the World Bank Conerence on Access to Finance, 15–17 March 2007, World Bank,
Washington, DC, USA.
Bhatt, V. V. 1988. On Financial Innovations and Credit Market Evolution. World Development 16(2):281–292.
Blacklock, Carolyn. 2005. Big Banks, Small Customers: ANZ Bank’s Micronance Experience in the Fiji Islands.
Finance or the Poor 6(2): 6–8.
Burgess, Robin, and Rohini Pande. 2005. Do Rural Banks Matter? Evidence rom the Indian Social Banking
Experiment. The American Economic Review 95(3):780–795.Burki, H., and G. Chen. 2006. Micronance Perormance in Pakistan 1999–2005: Growth, But a Structural Flaw
Persists. Islamabad: Pakistan Micronance Network.
Business Line. 2006. Promote No-rills Accounts. 26 September.
China Council or International Cooperation on Environment and Development (CCICED), Agriculture and
Rural Development Task Force (ARDTF). 2005. Expanding Finance Options or Rural Development. In
China’s Agricultural and Rural Development in the Early 21st Century, edited by Sonntag, et. al. 2005.
Canberra, Australia: Australian Centre or International Agricultural Research.
Claessens, Stijn. 2005. Access to Financial Services: A Review o the Issues and Public Policy Objectives. World
Bank Research Working Paper 3589. Washington, DC: World Bank.
Clark, Heather. 2006. When There Was No Money: Building ACLEDA Bank in Cambodia’s Evolving Financial
Sector. Berlin: Springer.
Christensen, Clayton M, et.al. 2004. Seeing What’s Next: Using the Theories o Innovation to Predict Industry
Change. Boston, Massachusetts: Harvard Business School Press.
Coleman, Brett, and Jon Wynne-Williams. 2006. Rural Finance in the Lao People’s Democratic Republic:
Demand, Supply, and Sustainability. Manila: ADB.
8/6/2019 Low Income Household Improvement
http://slidepdf.com/reader/full/low-income-household-improvement 44/46
Reerences
Diamond Management and Technology Consultants (DMTC). 2006. Building a More Inclusive Financial System
in India. Mumbai: DMTC.
Dolven, Ben, and Anthony Kuhn. 2004. China’s Other Big Banking Mess. Far Eastern Economic Review. 29
April.
Dyer, Jay, et. al. 2004. The Agricultural Bank o Mongolia. In World Bank/Consultative Group to Assist the Poor,
Scaling Up Poverty Reduction: Case Studies in Micronance. Washington, DC: CGAP.
Fernando, Nimal A. 2006. Understanding and Dealing with High Interest Rates on Microcredit. Manila: ADB.
Ferrari, Aurora, et. al. 2007. Access to Financial Services in Nepal. Washington, DC: World Bank.
Financial Express. 2006. MOF to tie up $1 billion ADB unds or co-ops. 26 September.
Flaming, Mark W. and Stuart Mathison. 2007. Financial Services Sector Assessment: Kiribati, Tuvalu, Samoa,
Solomon Islands, Vanuatu. New York: United Nations Development Program and United Nations Capital
Development Fund.
Helms, Brigit. 2006. Access or All: Building Inclusive Financial Systems. Washington, DC: World Bank.
HM Treasury. 2004. Promoting Financial Inclusion. London: HM Treasury.
Ivatury, Gautam. 2006. Using Technology to Build Inclusive Financial Systems. Focus Note 32. Washington,
DC: CGAP.
Jacoby, Hanan G., and Emmanuel Skouas, 1997. Risk, Financial Markets, and Human Capital in a Developing
Country. Review o Economic Studies 64(3): 311–335.
Kumar, Anjali. 2005. Access to Financial Services in Brazil. Washington, DC: World Bank.
Lamberte, Mario B., and Delbert Fitchett. Rural Finance in Azerbaijan: Executive Summary. In Beyond
Micronance: Building Inclusive Rural Financial Markets in Central Asia, edited by Mario B. Lamberte,
et. al. Manila: ADB.
Lyman, Timothy R., et. al. 2006. Use o Agents in Branchless Banking or the Poor: Rewards, Risks, and Regulation.
Focus Note 38. Washington, DC: CGAP.
McKinnon, Ronald. 1973. Money and Capital in Economic Development. Washington, DC: The BrookingsInstitution.
Meyer, Richard, and Geetha Nagaranjan. 2000. Rural Financial Markets in Asia: Policies, Paradigms, and
Perormance. Hong Kong: Oxord University Press.
Organisation or Economic Co-operation and Development (OECD). 2004. Rural Finance and Credit
Inrastructure in China. Paris: OECD.
. 2005. Economic Surveys: China. Paris: OECD.
Peachy, Stephen, and Alan Roe. 2004. Access to Finance–What Does it Mean and How Do Savings Banks Foster
Access? Brussels: World Savings Bank Institute.
Rajan, Raghuram, and Luigi Zingales. 2004. Saving Capitalism rom the Capitalists. New Jersey: Princeton
University Press.
Rajan, Raghuram. 2006. Separate and Unequal. Finance and Development 43(1): 56-57.
Rhyne, Elizabeth, and Andres Guimon. 2007. The Banco Compartamos Initial Public Oering. Insight No. 23.
Accion International.
Roth, J., et. al. 2007. The Landscape o Microinsurance in the World’s 100 Poorest Countries. Microinsurance
Center. www.microinsurance.org.
8/6/2019 Low Income Household Improvement
http://slidepdf.com/reader/full/low-income-household-improvement 45/46
Rosenberg, Richard. 2007. CGAP Refections on the Compartamos Initial Public Oering. Focus Note No. 42.
Washington, DC: CGAP.
Rutherord, Stuart. 2000. The Poor and Their Money. New Delhi: Oxord University Press.
. 2006. The Grameen Pension Savings Scheme. Finance or the Poor 7(3): 1–10.
Sinha, Sanjay. 2007a. Eciency with Growth: The Emerging Face o Indian Micronance. Finance or the Poor
8(3): 1–11.
. 2007b. The Financial Exclusion Bill. The Economic Times. 1 June.
Swiss Reinsurance Company. 2006. Sigma Report 5/2006. Zurich: Swiss Re.
Thorat, Usha. 2007. Financial Inclusion – The Indian Experience. Speech made at the HMT-DFID Financial
Inclusion Conerence 2007, 19 June 2007, Whitehall Place, London, UK. Available: www.rbi.org.in/
scripts/speeches.
United Nations Capital Development Fund. 2005. Statement o the Advisors Group to the United Nations
International Year o Microcredit. Available:
www.yearomicrocredit.org/docs/Advisors_Group_UN_IYOM_8Nov2005.pd
United Nations. 2006. Building Inclusive Financial Sectors or Development. New York: United Nations.
United Nations Development Programme (UNDP). 2007. Building Security or the Poor: Potential and Prospects
or Microinsurance in India. Colombo: UNDP Regional Centre.
Von Pischke, J. D. 1991. Finance at the Frontier. Washington, DC: World Bank.
World Bank. 2004. India Scaling-Up Access to Finance or India’s Rural Poor. Washington, DC: World Bank.
. 2006. Micronance in South Asia: Towards Financial Inclusion or the Poor. Washington, DC: World
Bank.
Wenner, Mark, et. al. 2007. Managing Credit-Risk in Rural Financial Institutions in Latin America. Washington,
DC: Inter-American Development Bank.
World Savings Bank Institute (WSBI). 2004. WSBI Access to Finance Resolution. Brussels: WSBI.
Websites
www.acledabank.com.kh
www.grameen-ino.org
www.mixmarket.org
www.syndicatebank.in
www.undp.org
www.woccu.org
8/6/2019 Low Income Household Improvement
http://slidepdf.com/reader/full/low-income-household-improvement 46/46
Low-Income Households’ Access to Financial Services:International Experience, Measures for Improvement, and the Future
In developed countries, formal financial sectors serve a majority. In contrast, in most developingeconomies, the formal financial sectors serve only a minority, often no more than 20–30% of thepopulation. Most households who do not have access to financial services are concentrated inlow-income categories. Even those low-income households who have access to finance areunderserved both in terms of quantity and quality of products and services. Although it is not apanacea, access to finance can play a potentially key role in inclusive growth and development.Hence, the problem of lack of access to finance for a majority of the people deserves a great dealof attention and must be addressed head-on. The global experience suggests that there are manyways to improve access to finance for low-income households. Many countries have madeprogress through diverse approaches and different institutional modalities. The global experienceprovides useful insights for policy makers and practitioners who are committed to address theissue. While many stakeholders have to participate in this effort, cross-country experience over timeindicates that the governments have a major and multiple roles to play. The government role,however, must be focused on promoting rather than replacing the important role that privatesector financial institutions could play in this task.
About the Asian Development Bank
ADB aims to improve the welfare of the people in the Asia and Pacific region, particularly thenearly 1.9 billion who live on less than $2 a day. Despite many success stories, the region remainshome to two thirds of the world’s poor. ADB is a multilateral development finance institutionowned by 67 members, 48 from the region and 19 from other parts of the globe. ADB’s vision is aregion free of poverty. Its mission is to help its developing member countries reduce poverty andimprove their quality of life.
ADB’s main instruments for helping its developing member countries are policy dialogue, loans,equity investments, guarantees, grants, and technical assistance. ADB’s annual lending volume istypically about $6 billion, with technical assistance usually totaling about $180 million a year.
ADB’s headquarters is in Manila. It has 26 offices around the world and more than 2,000employees from over 50 countries.
Asian Development Bank 6 ADB Avenue Mandaluyong City