Embed Size (px)
Citation preview
8/14/2019 Health and Human Services: Miller-MDRC-02
http://slidepdf.com/reader/full/health-and-human-services-miller-mdrc-02 1/68

8/14/2019 Health and Human Services: Miller-MDRC-02
http://slidepdf.com/reader/full/health-and-human-services-miller-mdrc-02 2/68
8/14/2019 Health and Human Services: Miller-MDRC-02
http://slidepdf.com/reader/full/health-and-human-services-miller-mdrc-02 3/68
-iii-
Contents
List of Tables and Figures vAcknowledgments vii
Summary Sum-1
Introduction 1Findings In Brief 3
Background 5
Leavers 6Stayers 8
Data and Methods 9
Data 9Samples 13Defining Leavers, Stayers, and Cyclers 14
Leavers, Stayers, and Cyclers 17
Characteristics 17Economic Status 19Results for Individual Programs 23Time Limits 28
Nonworking Leavers 31
Characteristics 32Economic Status 34
Results for Individual Programs 34
How Have Welfare Programs Affected the Composition of the Caseload? 36Characteristics 40Economic Status 40Results for Individual Programs 40
Conclusions 47
Appendix A 49
References 53

8/14/2019 Health and Human Services: Miller-MDRC-02
http://slidepdf.com/reader/full/health-and-human-services-miller-mdrc-02 4/68
8/14/2019 Health and Human Services: Miller-MDRC-02
http://slidepdf.com/reader/full/health-and-human-services-miller-mdrc-02 5/68
-v-
List of Tables and Figures
Table
S1 Characteristics of Stayers, Leavers, and Cyclers Sum-3
S2 Characteristics of Working and Nonworking Leavers Sum-3
S3 Characteristics of Stayers in the Program Versus Control Groups Sum-4
1 Sample Sizes, by Program 14
2 Patterns of Receipt, by Program 16
3 Stayers, Cyclers, and Leavers: Demographic Characteristics and Barriers toEmployment 18
4 Stayers, Cyclers, and Leavers: Household Income and Material Hardship 205 Stayers, Time Limit Leavers, and Non-Time Limit Leavers (FTP and Jobs First projects)
Demographic Characteristics and Barriers to Employment 29
6 Stayers, Time Limit Leavers, and Non-Time Limit Leavers(FTP): Household Income and Material Hardship 30
7 Patterns of Work Among Welfare Leavers 32
8 Working Leavers Versus Nonworking Leavers: Demographic Characteristicsand Barriers to Employment 33
9 Working Leavers Versus Nonworking Leavers: Household Incomeand Material Hardship 35
10 How Programs Have Affected Stayers: Demographic Characteristicsand Barriers to Employment 41
11 How Programs Have Affected Stayers: Household Income and Material Hardship 42
12 The Percent of Recipients Defined as Stayers by Program 43
A1 Stayers and Leavers: Demographic Characteristics and Barriers to Employment 50
A2 Stayers and Leavers: Household Income and Material Hardship 51
Figure
1A Stayers, Cyclers, and Leavers, by Program: Demographic Characteristics 25
1B Stayers, Cyclers and Leavers, by Program: Barriers to Employment 26
1C Stayers, Cyclers and Leavers, by Program: Household Income and Material Hardship 27
2A Working and Nonworking Leavers, by Program: Demographic Characteristics 37
2B Working and Nonworking Leavers, by Program: Barriers to Employment 38
8/14/2019 Health and Human Services: Miller-MDRC-02
http://slidepdf.com/reader/full/health-and-human-services-miller-mdrc-02 6/68
2C Working and Nonworking Leavers, by Program: Household Incomeand Material Hardship 39
3A Control and Program Group Stayers, by Program: Demographic Characteristics 44
3B Control and Program Group Stayers, by Program: Barriers to Employment 45
3C Control and Program Group Stayers, by Program: Household Income andMaterial Hardship 46
-vi-

8/14/2019 Health and Human Services: Miller-MDRC-02
http://slidepdf.com/reader/full/health-and-human-services-miller-mdrc-02 7/68
Acknowledgments
This report benefited from the input of many people. At ASPE, Susan Hauan providedsuggestions on the analysis plan and an earlier draft of the report. At MDRC, Barbara Goldman
and Charles Michalopoulos provided helpful comments on an earlier draft. Vanessa Martin
provided programming assistance and help with report production.
-vii-

8/14/2019 Health and Human Services: Miller-MDRC-02
http://slidepdf.com/reader/full/health-and-human-services-miller-mdrc-02 8/68
8/14/2019 Health and Human Services: Miller-MDRC-02
http://slidepdf.com/reader/full/health-and-human-services-miller-mdrc-02 9/68
Sum-1
Summary
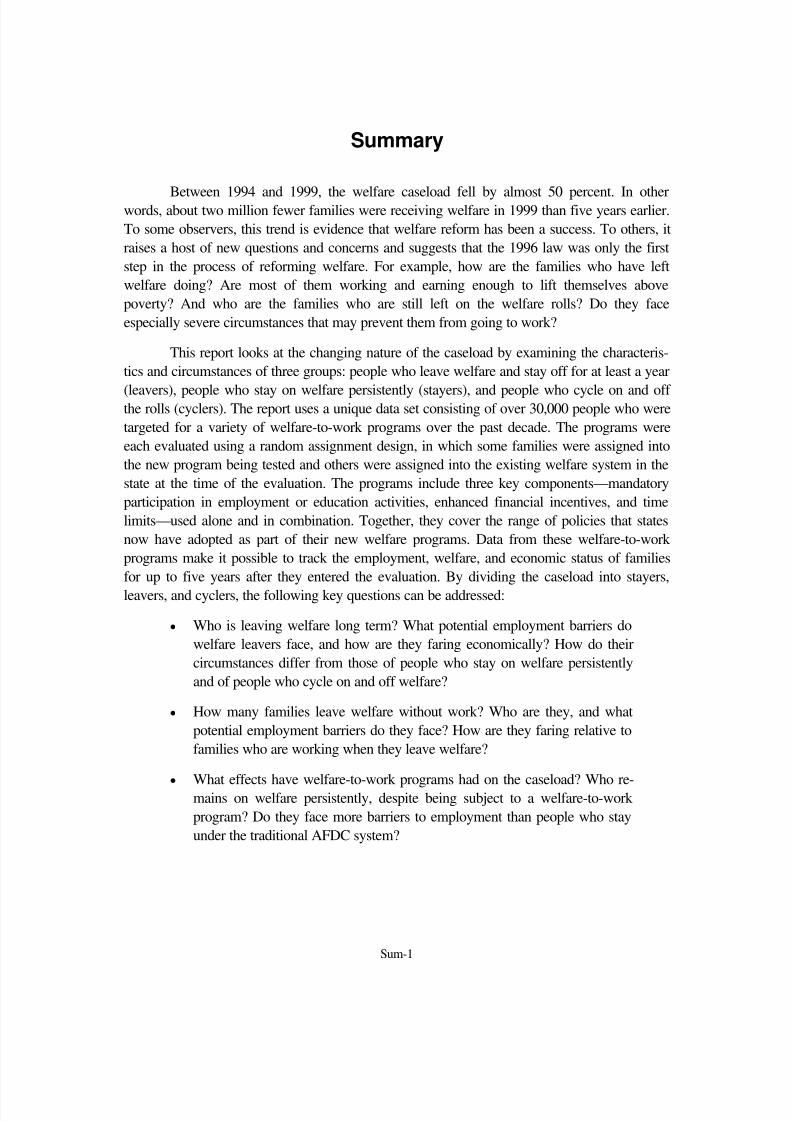
Between 1994 and 1999, the welfare caseload fell by almost 50 percent. In otherwords, about two million fewer families were receiving welfare in 1999 than five years earlier.
To some observers, this trend is evidence that welfare reform has been a success. To others, it
raises a host of new questions and concerns and suggests that the 1996 law was only the first
step in the process of reforming welfare. For example, how are the families who have left
welfare doing? Are most of them working and earning enough to lift themselves above
poverty? And who are the families who are still left on the welfare rolls? Do they face
especially severe circumstances that may prevent them from going to work?
This report looks at the changing nature of the caseload by examining the characteris-
tics and circumstances of three groups: people who leave welfare and stay off for at least a year
(leavers), people who stay on welfare persistently (stayers), and people who cycle on and off the rolls (cyclers). The report uses a unique data set consisting of over 30,000 people who were
targeted for a variety of welfare-to-work programs over the past decade. The programs were
each evaluated using a random assignment design, in which some families were assigned into
the new program being tested and others were assigned into the existing welfare system in the
state at the time of the evaluation. The programs include three key components—mandatory
participation in employment or education activities, enhanced financial incentives, and time
limits—used alone and in combination. Together, they cover the range of policies that states
now have adopted as part of their new welfare programs. Data from these welfare-to-work
programs make it possible to track the employment, welfare, and economic status of families
for up to five years after they entered the evaluation. By dividing the caseload into stayers,
leavers, and cyclers, the following key questions can be addressed:
• Who is leaving welfare long term? What potential employment barriers do
welfare leavers face, and how are they faring economically? How do their
circumstances differ from those of people who stay on welfare persistently
and of people who cycle on and off welfare?
• How many families leave welfare without work? Who are they, and what
potential employment barriers do they face? How are they faring relative to
families who are working when they leave welfare?
•
What effects have welfare-to-work programs had on the caseload? Who re-mains on welfare persistently, despite being subject to a welfare-to-work
program? Do they face more barriers to employment than people who stay
under the traditional AFDC system?
8/14/2019 Health and Human Services: Miller-MDRC-02
http://slidepdf.com/reader/full/health-and-human-services-miller-mdrc-02 10/68
Sum-2
Understanding the circumstances of families who leave welfare long term is important to
designing effective programs for welfare recipients and for low-income families in general. If
many who do work are still poor, for example, more effort might be devoted to post-employment
services that help low-wage workers increase their earnings. It is equally important to find outabout the families who stay on welfare. If many of the families receiving welfare today face
severe employment barriers, then welfare policies that have been used in the past may not work
for this new type of caseload. Finding new policies for the hard-to-employ may have also gained
added urgency if welfare reform, by encouraging more and more families to leave welfare, has left
a caseload that is even harder to employ than in the past. Examining the effects of several welfare-
to-work programs on the composition of the caseload provides hints as to the effects of welfare
reform more broadly. Finally, there has been little research on cyclers, or people who return to
welfare intermittently but do not stay on it persistently. It is not clear, for example, whether cyclers
face more dire economic circumstances than stayers and leavers or whether they possess fewer or
more barriers to employment.
Findings
• Long-term welfare leavers face fewer barriers to employment than
long-term stayers and generally fare better economically. People who
cycle on and off the welfare rolls look more similar to leavers than to
stayers.
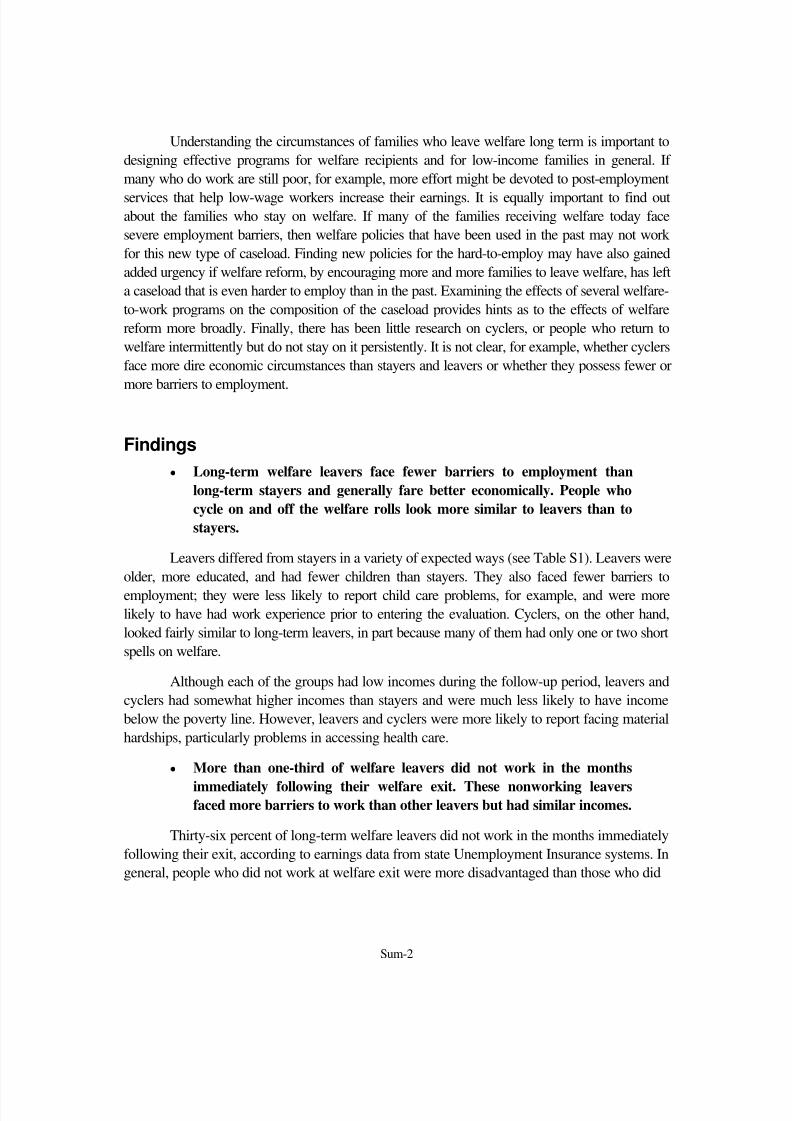
Leavers differed from stayers in a variety of expected ways (see Table S1). Leavers were
older, more educated, and had fewer children than stayers. They also faced fewer barriers to
employment; they were less likely to report child care problems, for example, and were more
likely to have had work experience prior to entering the evaluation. Cyclers, on the other hand,
looked fairly similar to long-term leavers, in part because many of them had only one or two short
spells on welfare.
Although each of the groups had low incomes during the follow-up period, leavers and
cyclers had somewhat higher incomes than stayers and were much less likely to have income
below the poverty line. However, leavers and cyclers were more likely to report facing material
hardships, particularly problems in accessing health care.
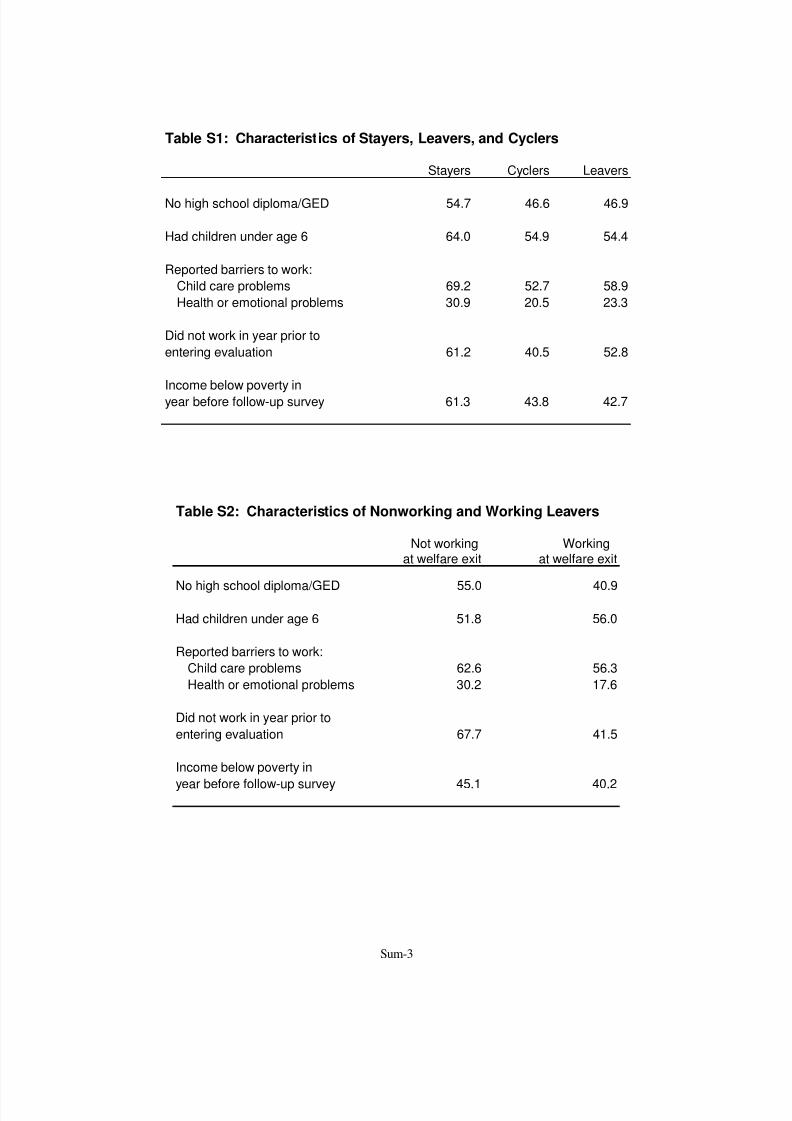
• More than one-third of welfare leavers did not work in the months
immediately following their welfare exit. These nonworking leaversfaced more barriers to work than other leavers but had similar incomes.
Thirty-six percent of long-term welfare leavers did not work in the months immediately
following their exit, according to earnings data from state Unemployment Insurance systems. In
general, people who did not work at welfare exit were more disadvantaged than those who did
8/14/2019 Health and Human Services: Miller-MDRC-02
http://slidepdf.com/reader/full/health-and-human-services-miller-mdrc-02 11/68
Sum-3
Table S1: Characteristics of Stayers, Leavers, and Cyclers
Stayers Cyclers Leavers
No high school diploma/GED 54.7 46.6 46.9
Had children under age 6 64.0 54.9 54.4
Reported barriers to work:
Child care problems 69.2 52.7 58.9
Health or emotional problems 30.9 20.5 23.3
Did not work in year prior to
entering evaluation 61.2 40.5 52.8
Income below poverty in
year before follow-up survey 61.3 43.8 42.7
Table S2: Characteristics of Nonworking and Working Leavers
Not working Workingat welfare exit at welfare exit
No high school diploma/GED 55.0 40.9
Had children under age 6 51.8 56.0
Reported barriers to work:
Child care problems 62.6 56.3
Health or emotional problems 30.2 17.6
Did not work in year prior to
entering evaluation 67.7 41.5
Income below poverty in
year before follow-up survey 45.1 40.2
8/14/2019 Health and Human Services: Miller-MDRC-02
http://slidepdf.com/reader/full/health-and-human-services-miller-mdrc-02 12/68
Sum-4
work (see Table S2). They were less educated, more likely to report other barriers to work, and
much less likely to have had recent work experience. On average, however, they had similar
incomes as working leavers by the time of the follow-up survey. Although they had lower
earnings, they were more likely to rely on other sources of income and more likely toeventually return to welfare, Food Stamps, or both. There is little evidence that many
nonworking leavers left welfare for marriage or cohabitation.
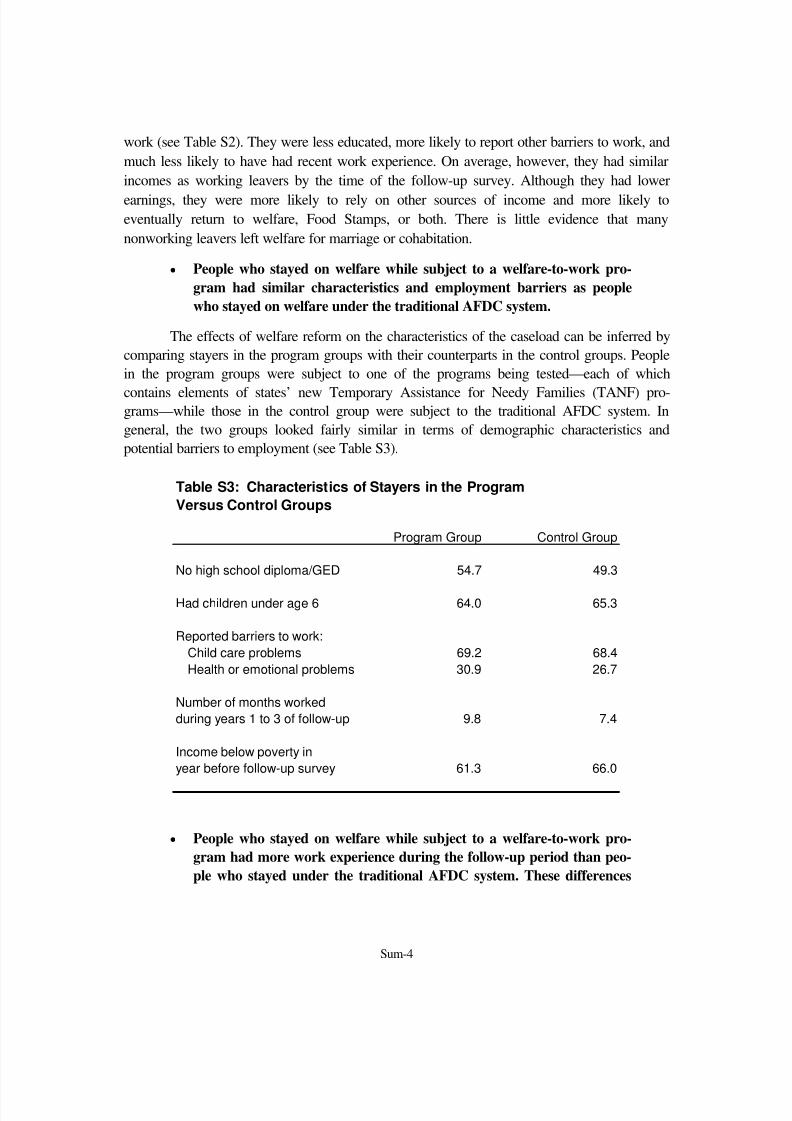
• People who stayed on welfare while subject to a welfare-to-work pro-
gram had similar characteristics and employment barriers as people
who stayed on welfare under the traditional AFDC system.
The effects of welfare reform on the characteristics of the caseload can be inferred by
comparing stayers in the program groups with their counterparts in the control groups. People
in the program groups were subject to one of the programs being tested—each of which
contains elements of states’ new Temporary Assistance for Needy Families (TANF) pro-grams—while those in the control group were subject to the traditional AFDC system. In
general, the two groups looked fairly similar in terms of demographic characteristics and
potential barriers to employment (see Table S3).
• People who stayed on welfare while subject to a welfare-to-work pro-
gram had more work experience during the follow-up period than peo-
ple who stayed under the traditional AFDC system. These differences
Table S3: Characteristics of Stayers in the Program
Versus Control Groups
Program Group Control Group
No high school diploma/GED 54.7 49.3
Had children under age 6 64.0 65.3
Reported barriers to work:
Child care problems 69.2 68.4
Health or emotional problems 30.9 26.7
Number of months worked
during years 1 to 3 of follow-up 9.8 7.4
Income below poverty in
year before follow-up survey 61.3 66.0
8/14/2019 Health and Human Services: Miller-MDRC-02
http://slidepdf.com/reader/full/health-and-human-services-miller-mdrc-02 13/68
Sum-5
were found only for the two welfare-to-work programs with the most
generous financial incentives.
Although several programs included financial incentives to work, in the form of enhancedearnings disregards, stayers in the two programs with the most generous incentives differed in two
key ways from their control group counterparts. First, stayers in the program groups were more
likely to have worked while on welfare, because the earnings disregards allowed more of them to
work and still qualify for benefits. Second, because stayers in the program groups were more
likely to have worked and because they received more generous welfare benefits when they did
work, they had higher incomes than stayers in the control groups.
*****
The findings show that many families continue to need assistance after they leave wel-
fare. Many families who leave and stay off long term remain poor after they leave, and manylack access to important benefits, such as Food Stamps and health insurance, for which they are
probably still eligible. People who leave welfare without work have always been a group of
special concern, and the findings indicate that they did not leave welfare without work because
they got married. Rather, they were unable to overcome a range of potential barriers to work,
such as low education and little prior work experience. These leavers need services to help
them find and keep jobs. It is encouraging that people who cycle on and off welfare do not face
more severe employment barriers than other groups in the caseload. Nonetheless, many of them
obviously need assistance to avoid returning to welfare, which may not be an option in the era
of time limits. Finally, although welfare-to-work programs were found to have few effects on
the characteristics of the caseload, they do affect stayers’ economic status. Enhanced
incentives, in particular, increase both the employment rates and the incomes of stayers.
Although the fact that most states now use enhanced incentives is encouraging, most states also
impose time limits. Time-limit policies could be designed so that the “leavers” who are forced
off the welfare rolls by these programs would have adequate incomes. Time limits could also
be combined with post-exit services that would be available to all leavers.

8/14/2019 Health and Human Services: Miller-MDRC-02
http://slidepdf.com/reader/full/health-and-human-services-miller-mdrc-02 14/68
8/14/2019 Health and Human Services: Miller-MDRC-02
http://slidepdf.com/reader/full/health-and-human-services-miller-mdrc-02 15/68

8/14/2019 Health and Human Services: Miller-MDRC-02
http://slidepdf.com/reader/full/health-and-human-services-miller-mdrc-02 16/68
-2-
at a point in time, since they are the ones who will be left on the rolls in the long run. There has
also been little research on the people who cycle on and off welfare.
This report uses a unique data set consisting of over 30,000 people who were targeted fora variety of welfare-to-work programs over the past decade. The programs were each evaluated
using a random assignment design, in which some families were assigned into the new program
being tested and others were assigned into the existing welfare system in the state at the time of
the evaluation. The programs include three key components—mandatory participation in
employment or education activities, enhanced financial incentives, and time limits—used alone
and in combination. Together, they cover the range of policies that states now have adopted as
part of their new welfare programs. By using data from these welfare-to-work programs and
dividing the caseload into stayers, leavers, and cyclers, the following key questions can be
addressed:
Leavers, stayers, and cyclers • What are the characteristics and potential employment barriers of people
who leave welfare long term? How do they differ from people who stay per-
sistently on welfare and from people who cycle on and off?
• What is the economic status of people who leave welfare long term? How do
they fare relative to stayers and cyclers?
Nonworking leavers
• What are the characteristics and potential employment barriers of people
who leave welfare without apparent work? How do nonworking leavers
compare with leavers who work?
• What is the economic status of nonworking leavers relative to working leav-
ers?
The effects of welfare-to-work programs on the caseload
• Who are the people who stay on welfare persistently, despite being subject to
a welfare-to-work program? Compared with people who stayed on welfare
under the old system, are they more disadvantaged, and do they face more
barriers to employment?
8/14/2019 Health and Human Services: Miller-MDRC-02
http://slidepdf.com/reader/full/health-and-human-services-miller-mdrc-02 17/68
-3-
Understanding the circumstances of families who leave welfare long term is important
to designing effective programs for welfare recipients and for low-income families in general.
If many who do work are still poor, for example, more effort might be devoted to post-
employment services that help low-wage workers increase their earnings. It is equallyimportant to find out about the families who stay on welfare. If many of the families receiving
welfare today face severe employment barriers, then welfare policies that have been used in the
past may not work for this new type of caseload. Finding new policies for the hard-to-employ
may have also gained added urgency if welfare reform, by encouraging more and more families
to leave welfare, has left a caseload that is even harder to employ than in the past. By
examining the effects of several welfare-to-work programs on the composition of the caseload,
we can glimpse the effects of welfare more broadly. Finally, there has been little research on
cyclers, or people who return to welfare intermittently but do not stay on it persistently. It is not
clear, for example, whether cyclers face more dire economic circumstances than stayers and
leavers or whether they possess fewer or more barriers to employment.
Findings in Brief
Leavers, Stayers, and Cyclers
• Leavers differed from stayers in a variety of expected ways: They were
older, more educated, and had fewer children than stayers. They also faced
fewer barriers to employment; they were less likely to report child care prob-
lems and were more likely to have had recent work experience.
• Cyclers looked very similar to leavers in terms of demographic characteristics
and, on average, faced fewer potential barriers to employment. Part of the rea-
son for this finding is that many of the people who are defined as cyclers had
only one or two very short spells of welfare during the observation period.
• Although each of the groups had low incomes, leavers and cyclers had some-
what higher incomes than stayers and were much less likely to have income
below the poverty line. However, leavers and cyclers were more likely to re-
port facing material hardships, particularly problems in accessing health care.
• The results were consistent across each of the welfare-to-work programs.The time-limit programs, however, had two types of leavers: people who left
welfare before reaching their time limit and people who left welfare because
of reaching their time limit. In one program, time-limit leavers were rela-
tively more disadvantaged and had lower incomes than other leavers. This
8/14/2019 Health and Human Services: Miller-MDRC-02
http://slidepdf.com/reader/full/health-and-human-services-miller-mdrc-02 18/68
-4-
pattern did not occur in the other time-limit program, because extensions
were granted to families who had reached their time limit and did not have
sufficient earnings. Thus, the way in which the time limit is administered af-
fects who leaves welfare and how they fare.
Nonworking Leavers
• About one-third of welfare leavers in these programs did not work in the
months immediately following their welfare exit. Compared with people
who did work, nonworkers had lower education levels, reported more barri-
ers to employment, and were much less likely to have had recent work ex-
perience.
•
At the time of the follow-up surveys, nonworking leavers had similar in-comes as working leavers. Although fewer nonworkers reported income
from earnings, more of them had income from other sources, and more had
returned to welfare and Food Stamps. There is little evidence that many
nonworking leavers left welfare for marriage or cohabitation.
• The results were consistent across each of the welfare-to-work programs. In
the programs with the most generous financial incentives, however, there
were significant income differences between nonworkers and workers,
largely because of the relatively high incomes of the working leavers. The
reason for this difference is the generous earned income disregards, under
which recipients could earn higher amounts before becoming ineligible forbenefits.
The Effects of Welfare-to-Work Programs on the Caseload
• With respect to demographic characteristics, stayers in each of the welfare-
to-work programs (or the program group) looked fairly similar to stayers un-
der the traditional AFDC system (or the control group). Stayers in the pro-
gram groups faced fewer potential employment barriers than stayers in the
control groups, although these differences were fairly small.
• In the programs with the most generous financial incentives, the program
and control groups differed in two ways. First, stayers in the program groups
were more likely to have worked while on welfare, because the earnings dis-
regards allowed more of them to work and still qualify for benefits. Second,
because stayers in the program groups were more likely to have worked and
8/14/2019 Health and Human Services: Miller-MDRC-02
http://slidepdf.com/reader/full/health-and-human-services-miller-mdrc-02 19/68
-5-
because they received more generous welfare benefits when they did work,
they had higher incomes than stayers in the control groups.
*****
One implication of these results is that many families continue to need assistance after
they leave welfare, and this applies to all types of leavers. Many families who leave and stay
off welfare long term, for example, are still poor after they leave, and many lack access to
important benefits for which they are probably still eligible, such as Food Stamps and health
insurance. People who leave welfare without work are probably without jobs because of a
range of potential barriers to work, such as low education and little prior work experience, and
not because they left welfare for marriage. These leavers need services to help them find and
keep jobs. It is encouraging that cyclers—at least as defined here—do not face more severe
employment barriers than other groups in the caseload. Nonetheless, many obviously need
assistance to avoid returning to welfare, especially since they will not have the option of doingso if they are subject to time limits. Thus, for policymakers and low-income families alike,
welfare reform was just the first step in a longer process.
Finally, although welfare-to-work programs have been found to have few effects on the
characteristics of the caseload, they do affect stayers’ economic status. Enhanced incentives, in
particular, increase both the employment rates and the incomes of stayers. Although most states
now use enhanced incentives, most states also impose time limits. Time-limit policies could be
designed so that the “leavers” who are forced off the welfare rolls by these programs would
have adequate incomes. Time limits could also be combined with post-exit services that would
be available to all leavers.
The next section reviews the existing research in this area and is followed by a discus-
sion of the data and methods used for the analysis. The subsequent three sections present the
results, beginning with a comparison of leavers, stayers, and cyclers; then examining results for
nonworking leavers; and finally presenting the effects of the welfare-to-work programs on the
characteristics of the caseload, or stayers. Each of these sections presents results first for the
combined sample and then for each welfare-to-work program separately. The report concludes
with a summary and some suggestions for ensuring that people will, in fact, be better off when
they leave welfare.
Background
One of the first steps in understanding how leavers are faring and how the caseload has
changed is figuring out why the caseload declined so dramatically since the early 1990s. Did
most families leave because they found jobs in the expanding economy, or did they leave
8/14/2019 Health and Human Services: Miller-MDRC-02
http://slidepdf.com/reader/full/health-and-human-services-miller-mdrc-02 20/68
-6-
because of welfare reform? Caseload declines that are driven by the economy should result in
fewer negative effects on family income or well being, since many families presumably left as
they got jobs or increased their earnings and became ineligible for benefits. In this case, those
who leave welfare will probably be the most employable segment of the caseload. Caseloaddeclines that are driven by welfare policies, on the other hand, may encourage both more and
less employable recipients to leave welfare and, by doing so, may make some families worse
off, if they were encouraged to leave before making a solid transition to work. In addition,
different welfare policies may have different effects. Time limits have generated the most
concern in terms of their potential for negatively affecting families. There is some debate about
what factor played the major role in the caseload decline, but all generally agree that both the
expanding economy and welfare reform had important effects (Wallace and Blank, 1999;
Council of Economic Advisors, 1999).
Leavers
The most direct way to assess how the caseload decline has affected families is to track
the economic status of welfare leavers. This task has been the focus of a substantial amount of
research over the past several years (Office of the Assistant Secretary for Planning and
Evaluation, 2001; Cancian, Haveman, Meyer, and Wolfe, 2000; Brauner and Loprest, 1999). In
1998, for example, the U.S. Department of Health and Human Services (HHS) funded a series
of “leaver” studies in 11 states and three counties. The studies follow recipients who left
welfare for at least two consecutive months during a given period, tracking their post-exit
outcomes, such as employment, earnings, welfare recidivism, and family income (Office of the
Assistant Secretary for Planning and Evaluation, 2001). Employment, earnings, and benefitreceipt are typically tracked using state administrative records data, while data on family
income and well-being are obtained from follow-up surveys, administered anywhere from six
months to three years after the welfare exit. Another source of information on leavers is the
National Survey of America’s Families (NSAF) conducted by the Urban Institute (Brauner and
Loprest, 1999). The NSAF was administered in 1997 and again in 1999 to a nationally
representative sample of the civilian population under age 65.
Both the HHS-sponsored studies and those using the NSAF data have provided evi-
dence on who leaves welfare and how they fare. Leavers are typically defined in this research
as people who left welfare at some point in the two years prior to the survey and were not
receiving welfare at the time of the survey. The findings from all the studies are fairly
consistent in that leavers look less disadvantaged and more employable than stayers. Leavers
are more educated; they have fewer children; they are less likely to have young children; and
they are more likely to have prior work experience (Verma and Colton, 2001; Acs, Loprest, and
Roberts, 2001; Loprest and Zedlewski, 1999).
8/14/2019 Health and Human Services: Miller-MDRC-02
http://slidepdf.com/reader/full/health-and-human-services-miller-mdrc-02 21/68
-7-
In terms of how families fare after leaving welfare, the research focuses on three types
of outcomes: work, welfare, and income (Isaacs and Lyon, 2000; Brauner and Loprest, 1999;
Loprest, 1999).
Employment and Earnings. The majority of leavers are working, with employment
rates in the first quarter after exit ranging from 50 percent to 75 percent. Continuous leavers, or
those who were still off welfare by the time of the follow-up survey, had somewhat higher
employment rates than the full group of leavers. Although most were employed, their average
earnings were fairly low—about $1,000 per month.
Benefit Receipt. About a third of the leavers had returned to welfare at some point
within the first year after exit. Among all leavers, the use of non-welfare benefits is generally
lower than would be expected, given that most of them probably remain eligible for benefits.
Medicaid enrollment falls after exit; in the quarter after exit, enrollment rates in most studies
ranged from 35 percent to 60 percent. Only about 40 percent to 60 percent of leavers stayed onFood Stamps after exit.
Income/Material Hardship. Most families are still struggling economically after they
leave welfare, and a fair number report facing various hardships, such as problems providing
enough food or paying rent. Average household income, as measured on the surveys, ranged
from $1,050 to $1,400. In the two studies that calculated a poverty rate, 58 percent of leavers
had incomes below the poverty level. On the other hand, a few state studies asked leavers to
compare their well-being before and after welfare, and the majority of respondents reported that
they were better off after having left welfare. Some of the studies also compare the leavers with
current recipients in order to put their economic status into context. The results are mixed: Insome states, leavers were worse off than current recipients; in other states, they were better off
(Isaacs and Lyon, 2000). Using the NSAF data, Loprest and Zedlewski (1999) found few
differences between leavers and stayers in terms of economic hardship. Finally, Loprest (1999)
compared leavers with low-income single mothers who had not received welfare in the two
years prior to the survey; the leavers faced consistently higher rates of hardship than these other
low-income women.
Outcomes also differ depending on the reason the family leaves welfare. People who
leave because they receive a sanction, for example, generally have lower employment rates
than other leavers (Brauner and Loprest, 1999). People who leave because of reaching a time
limit have also been compared with other leavers (see Bloom et al., 2002, for a review). Thetwo groups tend to have similar post-exit employment rates, and time-limit leavers are more
likely to receive non-welfare benefits, such as Medicaid and Food Stamps. The evidence from
several state studies does not tell a consistent story about whether time-limit leavers fare worse
economically than other leavers.
8/14/2019 Health and Human Services: Miller-MDRC-02
http://slidepdf.com/reader/full/health-and-human-services-miller-mdrc-02 22/68
-8-
It is important to note that these studies do not show causation. People who leave wel-
fare may be better or worse off than those who stay, or better or worse off than other low-
income women, but this does not prove that leaving welfare led to that outcome. Gauging the
effects of leaving welfare requires knowing the counterfactual, or how these families wouldhave fared had they stayed on welfare.
Another line of research examines whether people who left more recently are worse off
economically than those who left several years ago. If the “get tough” message and practice of
welfare reform pushed more and more families off welfare who are less equipped to work, then
leavers in recent years may be worse off and more disadvantaged than the leavers of the mid- or
early 1990s. Although most leavers at a given point in time are struggling economically, there
is little evidence to suggest that more recent leavers are worse off. The study in Cuyahoga
County, for example, found that people who left welfare in 1998 were more likely to work and
more likely to work consistently than those who left in 1996 (Verma and Colton, 2001). Therewere also few differences in their demographic characteristics. Loprest (2001) compared
leavers from the two waves of the NSAF and found that the two groups look fairly similar in
terms of demographic characteristics and employment rates. The picture in terms of economic
well-being was less clear. Although fewer of the recent leavers were below poverty, more of
them reported economic struggles with respect to buying food and paying rent.
Stayers
The other side of the caseload decline concerns stayers, or those who are left on the
welfare rolls. As mentioned earlier, the research consistently finds that people who stay onwelfare are more disadvantaged, on average, than people who leave. They are less educated, for
example, and have less work experience. An important question with respect to stayers is
whether they have become increasingly harder-to-employ in recent years. The dramatic decline
in the caseload may have been driven by the people who can leave welfare most easily, or those
who are the most employable. In this case, the current caseload, or people receiving welfare
today, is likely to be more disadvantaged and to face more barriers to work than the caseload in
1994, for example. On the other hand, if the caseload decline occurred among all types of
recipients, not just the most employable, the current caseload may not be more disadvantaged
than the caseload several years earlier. There is less research on this question, but the evidence
does not point to big differences between current and past recipients. Zedlewski and Anderson
(2001) compare people who were receiving welfare in 1997 with those who were receiving
welfare in 1999. Although the two groups look different in some ways (the more recent
caseload, for example, has a higher percentage of women living with a partner and a higher
percentage of black women), the recent caseload did not look more disadvantaged. In fact,
more parents in the recent caseload were working at the time of the survey. Oellerich (2001)
8/14/2019 Health and Human Services: Miller-MDRC-02
http://slidepdf.com/reader/full/health-and-human-services-miller-mdrc-02 23/68
-9-
uses AFDC quality control data from 1988 to 1999 and also finds little evidence that the
caseload has become harder-to-employ.
In sum, people who leave welfare are less disadvantaged and face fewer barriers towork than people who stay. Most leavers work after they leave welfare, although not
necessarily consistently. Many leavers do not receive other benefits for which they are probably
eligible, and most are still poor. Finally, the caseload does not seem to have changed in a
substantial way; recent leavers are not more disadvantaged than earlier leavers, and the
caseload has not become filled with the ranks of the hardest-to-employ. The last finding
suggests that, although leavers are more employable than stayers on average, a fairly broad
cross-section of the caseload left welfare over the past several years and also that a broad cross-
section—including new entrants to welfare—continues to receive benefits.
This study adds to the research in several ways. First, it offers administrative records
data on welfare receipt for between three and five years for each sample member. It uses thesedata to track patterns of receipt over time and to identify long-term leavers, long-term stayers,
and others who cycle on and off welfare. In the existing research, leavers are defined very
broadly to include people who may come back on the rolls fairly quickly. Would the results
differ if the definition were changed to include only people who have left for a longer time? For
example, the research shows that leavers are less disadvantaged than stayers. Are these
differences bigger when long-term stayers and long-term leavers are compared? And would the
same conclusions be reached about how leavers are faring if this long-term definition were
used? This study also examines the characteristics and circumstances of cyclers, a group that
has received less attention in the research.
Second, this study uses administrative data on employment and earnings to track em-
ployment at the point of exit and beyond for welfare leavers. These data identify a key group of
interest to policymakers—nonworking welfare leavers—and examine their characteristics and
circumstances after exiting welfare. Who are the people who left welfare with no apparent
work? What income sources do they rely on and how do the fare relative to workers?
Finally, this study takes advantage of the variation in welfare-to-work programs to ex-
amine whether the characteristics and circumstances of welfare leavers and stayers differ by
program type. For example, do time-limit programs result in different types of people leaving
welfare than other programs, thus affecting how leavers look and fare relative to stayers?
8/14/2019 Health and Human Services: Miller-MDRC-02
http://slidepdf.com/reader/full/health-and-human-services-miller-mdrc-02 24/68
-10-
Data and Methods
DataThe data used in this report come from several programs that have been evaluated by
MDRC. Each of the programs was evaluated using a random assignment design, in which
ongoing recipients or new applicants to welfare were assigned to either an experimental group
that received the new treatment or a control group that was subject to the existing welfare
system in the state at the time of the evaluation. New applicants for welfare were randomly
assigned at the time they were applying for welfare, whereas ongoing recipients were randomly
assigned at their redetermination interviews.1
Each evaluation provides three data sources. First, demographic data—including age,
race, and education level—were collected for all sample members at the point of randomassignment, or baseline. Second, state administrative records data provide information on
quarterly earnings, monthly welfare receipt, and monthly Food Stamp receipt. The earnings
data come from each state’s Unemployment Insurance (UI) system, to which most employers
must report employee earnings. The welfare and Food Stamp data come from each state’s
welfare records. One limitation of these data is that they do not capture earnings or benefit
receipt for recipients who have moved out of state. Third, each evaluation administered a
survey to a subset of the sample about two to three years after random assignment. The surveys
capture employment and earnings not reported to the UI system, and they also provide more
detailed information on family well-being, including household composition, income, income
sources, material hardship, and barriers to employment.
Data from the following programs are used in the report:
Vermont’s Welfare Restructuring Project (WRP). Vermont’s Welfare Restructur-
ing Project was one of the first statewide welfare reform programs initiated under waivers of
federal welfare rules. WRP was implemented in July 1994 and ran through June 2001. The
program consisted of a 30-month work trigger that required most single parents to work once
they had received welfare for 30 cumulative months. The program also included financial
incentives in the form of an enhanced disregard that was somewhat more generous than under
Vermont’s old AFDC program. A three-group research design, in which some individuals
received only the enhanced incentives without the work trigger, was included as part of the
evaluation to compare the effects of incentives alone with the effects of incentives combined
1About 10 percent of the sample used in this report were in a two-parent family when they entered the
evaluation. The results did not differ when these sample members were excluded from the analysis.
8/14/2019 Health and Human Services: Miller-MDRC-02
http://slidepdf.com/reader/full/health-and-human-services-miller-mdrc-02 25/68
8/14/2019 Health and Human Services: Miller-MDRC-02
http://slidepdf.com/reader/full/health-and-human-services-miller-mdrc-02 26/68
-12-
impacts among the NEWWS programs. Most programs also reduced welfare receipt, and the
size of the welfare impacts tended to mirror the size of the employment and earnings impacts.
The education-focused programs generally had smaller impacts on employment than the
employment-focused programs, with two sites (Oklahoma and Detroit) showing very small orno impacts. Although the programs increased employment and earnings, they did not increase
incomes, since for most recipients the increase in earnings was offset by a reduction in benefits.
See Hamilton (2002) for more information on the effects of NEWWS programs.
Florida’s Family Transition Program (FTP). FTP tested the effects of 24- and 36-
month time limits on welfare receipt for a sample of 2,800 single-parent families in Escambia
County, Florida. The program, which started in 1994, offered financial incentives as well as
enhanced services designed to help recipients find jobs. Administrative records data are
available for each sample member from 1992 through 1999. A subset of the sample was given a
survey four years after program entry. Families were randomly assigned into the programbetween 1994 and 1995.
FTP increased employment and reduced welfare receipt, and the majority of those in
the program group left welfare before reaching their time limit. Most of the recipients who did
reach a time limit were not given extensions: About 40 percent had adequate earnings levels
that did not warrant an extension, while most of the rest were deemed noncompliant. The
leavers whose benefits were cancelled because they had reached a time limit were somewhat
more disadvantaged than other leavers, but they did not, on average, experience more hardship,
partly because they relied more on other sources of support. See Bloom et al. (2000) for the
final report on FTP’s effects.
Connecticut’s Jobs First Program. Jobs First evaluated the effects of a 21-month
time limit on welfare receipt in the offices of Manchester and New Haven (although the
program was run statewide). The program also included very generous financial incentives to
encourage work: All of a recipient’s earnings were disregarded when calculating her grant level
and Food Stamp benefits until her earnings reached the poverty line. The sample includes about
4,800 people randomly assigned in 1996 and early 1997. A subset of the full sample also
responded to a 36-month survey. Administrative records data for this evaluation cover the
period 1994 through 1999.
Jobs First increased employment and earnings throughout the four-year follow-up pe-
riod. During the early part of follow-up—before recipients began reaching time limits—theprogram also increased welfare receipt and, because of the generous disregards, increased
incomes. About half the recipients in the program group reached the time limit during the
period, and two-thirds of them subsequently received a six-month extension. Those who left
welfare because of a time limit had higher earnings than those who left earlier, most likely
because of the extension policy. See Bloom et al. (2002) for more information about Jobs First.
8/14/2019 Health and Human Services: Miller-MDRC-02
http://slidepdf.com/reader/full/health-and-human-services-miller-mdrc-02 27/68
-13-
Samples
For the analysis in this report, the samples in each program are restricted to people for
whom data were available for at least 36 months but no more than 60 months after they were
randomly assigned into a program. The evaluations have varying lengths of follow-up, and this
restriction is imposed so that “staying on welfare” and “leaving welfare” mean something
similar across programs. Some people in NEWWS, for example, are followed for up to six
years after random assignment, while people in MFIP are tracked only for four years.
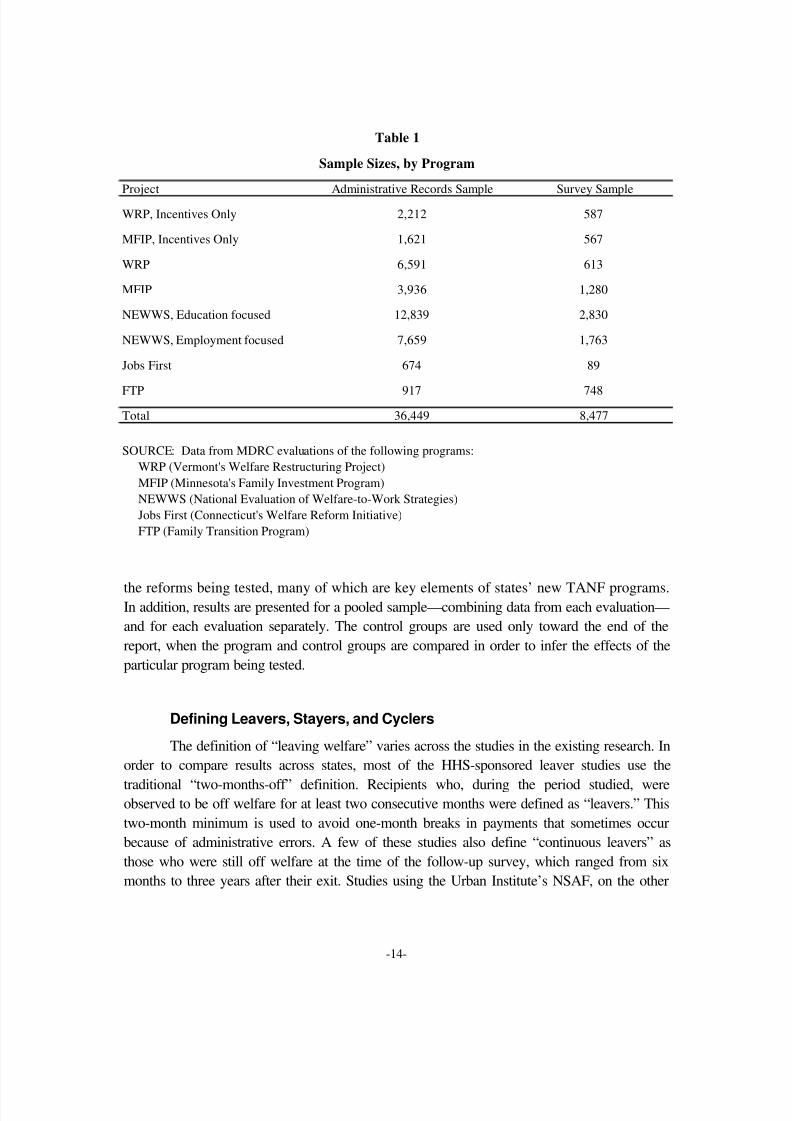
Table 1 presents the sample sizes, by project, for the full administrative records sample
and the smaller survey sample. The full sample is used for analyses of demographic characteris-
tics and potential barriers to work, and the survey sample is used for analyses of survey
outcomes, including household income, household composition, and material hardship.2 Each
analysis was run for the pooled sample and then for each program separately, and the pooled
analyses were weighted to reflect the size of the state’s welfare caseload in the mid-1990s.
Although the data are weighted, the sample should not be considered a representative sample of
the recipient population in these states, owing to the idiosyncrasies of the evaluations. Some
programs, for example, oversampled new applicants relative to ongoing recipients, while others
screened out exempt individuals prior to random assignment. In addition, each of the
evaluations operated in selected counties within the state involved.
When the programs are analyzed individually, they are presented in an order that
roughly corresponds with the strength of their mandate to leave welfare. The first group is
incentives only and includes the two programs that used enhanced financial incentives relative
to the traditional AFDC program but did not impose any work requirements (WRP Incentives
Only and MFIP Incentives Only). The second group includes programs that combined financialincentives with a work requirement (the full WRP program and the full MFIP program). The
third group includes traditional welfare-to-work programs that did not use financial incentives
but that encouraged recipients to leave welfare either by offering them education-focused
services (NEWWS, education-focused) or employment-focused services (NEWWS, employ-
ment-focused). The final group includes the two time-limit programs, both of which also
offered enhanced financial incentives (Jobs First and FTP).
Most analyses in the report are restricted to people in the program (or experimental)
groups in each evaluation. These are the most relevant groups, since members were subject to
2The results using the full sample to compare demographic characteristics and barriers to work were
similar when restricted to the smaller survey sample.
8/14/2019 Health and Human Services: Miller-MDRC-02
http://slidepdf.com/reader/full/health-and-human-services-miller-mdrc-02 28/68
-14-
the reforms being tested, many of which are key elements of states’ new TANF programs.In addition, results are presented for a pooled sample—combining data from each evaluation—
and for each evaluation separately. The control groups are used only toward the end of the
report, when the program and control groups are compared in order to infer the effects of the
particular program being tested.
Defining Leavers, Stayers, and Cyclers
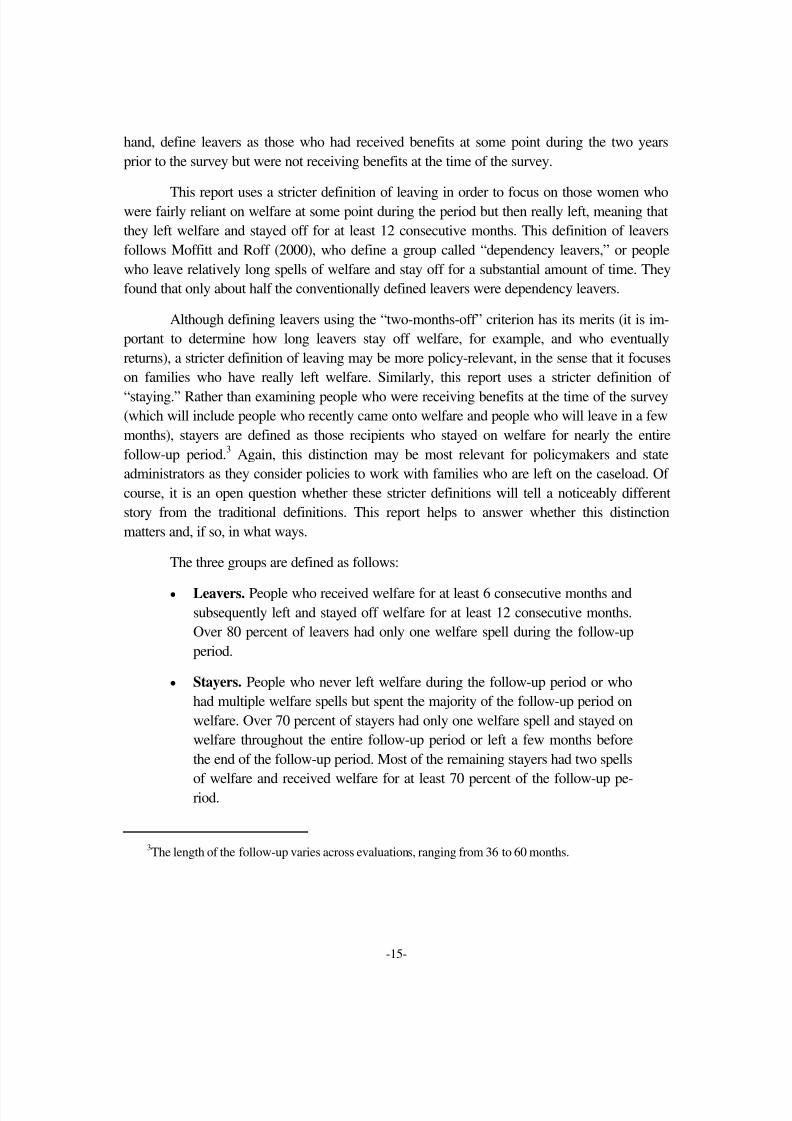
The definition of “leaving welfare” varies across the studies in the existing research. In
order to compare results across states, most of the HHS-sponsored leaver studies use the
traditional “two-months-off” definition. Recipients who, during the period studied, wereobserved to be off welfare for at least two consecutive months were defined as “leavers.” This
two-month minimum is used to avoid one-month breaks in payments that sometimes occur
because of administrative errors. A few of these studies also define “continuous leavers” as
those who were still off welfare at the time of the follow-up survey, which ranged from six
months to three years after their exit. Studies using the Urban Institute’s NSAF, on the other
Project
WRP, Incentives Only
MFIP, Incentives Only
WRP
MFIP
NEWWS, Education focused
NEWWS, Employment focused
Jobs First
FTP
Total
Table 1
Sample Sizes, by Program
Administrative Records Sample Survey Sample
2,212
1,621
6,591
3,936
587
567
613
1,280
36,449 8,477
2,830
1,763
89
748
12,839
7,659
674
917
SOURCE: Data from MDRC evaluations of the following programs:
WRP (Vermont's Welfare Restructuring Project)
MFIP (Minnesota's Family Investment Program)
NEWWS (National Evaluation of Welfare-to-Work Strategies)
Jobs First (Connecticut's Welfare Reform Initiative)
FTP (Family Transition Program)
8/14/2019 Health and Human Services: Miller-MDRC-02
http://slidepdf.com/reader/full/health-and-human-services-miller-mdrc-02 29/68
-15-
hand, define leavers as those who had received benefits at some point during the two years
prior to the survey but were not receiving benefits at the time of the survey.
This report uses a stricter definition of leaving in order to focus on those women whowere fairly reliant on welfare at some point during the period but then really left, meaning that
they left welfare and stayed off for at least 12 consecutive months. This definition of leavers
follows Moffitt and Roff (2000), who define a group called “dependency leavers,” or people
who leave relatively long spells of welfare and stay off for a substantial amount of time. They
found that only about half the conventionally defined leavers were dependency leavers.
Although defining leavers using the “two-months-off” criterion has its merits (it is im-
portant to determine how long leavers stay off welfare, for example, and who eventually
returns), a stricter definition of leaving may be more policy-relevant, in the sense that it focuses
on families who have really left welfare. Similarly, this report uses a stricter definition of
“staying.” Rather than examining people who were receiving benefits at the time of the survey(which will include people who recently came onto welfare and people who will leave in a few
months), stayers are defined as those recipients who stayed on welfare for nearly the entire
follow-up period.3 Again, this distinction may be most relevant for policymakers and state
administrators as they consider policies to work with families who are left on the caseload. Of
course, it is an open question whether these stricter definitions will tell a noticeably different
story from the traditional definitions. This report helps to answer whether this distinction
matters and, if so, in what ways.
The three groups are defined as follows:
• Leavers. People who received welfare for at least 6 consecutive months andsubsequently left and stayed off welfare for at least 12 consecutive months.
Over 80 percent of leavers had only one welfare spell during the follow-up
period.
• Stayers. People who never left welfare during the follow-up period or who
had multiple welfare spells but spent the majority of the follow-up period on
welfare. Over 70 percent of stayers had only one welfare spell and stayed on
welfare throughout the entire follow-up period or left a few months before
the end of the follow-up period. Most of the remaining stayers had two spells
of welfare and received welfare for at least 70 percent of the follow-up pe-riod.
3The length of the follow-up varies across evaluations, ranging from 36 to 60 months.
8/14/2019 Health and Human Services: Miller-MDRC-02
http://slidepdf.com/reader/full/health-and-human-services-miller-mdrc-02 30/68
-16-
• Cyclers. People who had only one spell on welfare that was six months or
less or who had multiple spells but did not spend the majority of the follow-
up period on welfare. One-third of cyclers had only one spell that lasted less
than six months. The remainder had two or more spells of welfare but spentless than 70 percent of the follow-up period on welfare.
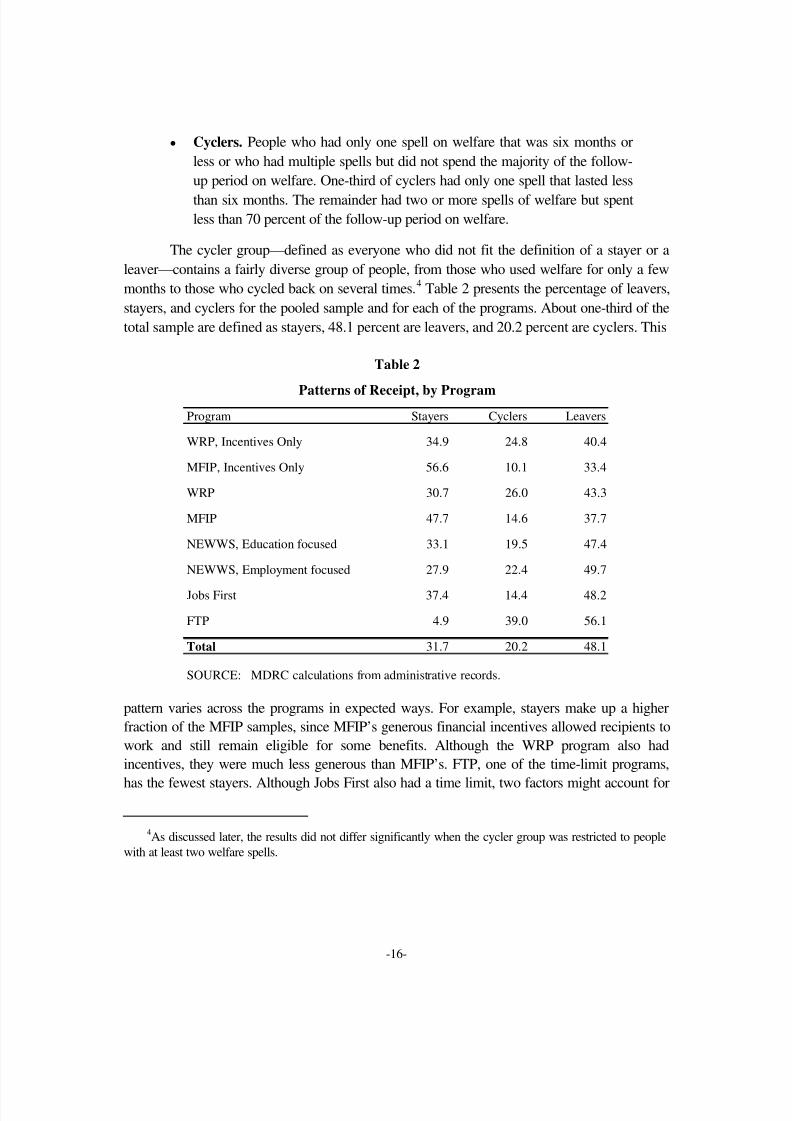
The cycler group—defined as everyone who did not fit the definition of a stayer or a
leaver—contains a fairly diverse group of people, from those who used welfare for only a few
months to those who cycled back on several times.4 Table 2 presents the percentage of leavers,
stayers, and cyclers for the pooled sample and for each of the programs. About one-third of the
total sample are defined as stayers, 48.1 percent are leavers, and 20.2 percent are cyclers. This
pattern varies across the programs in expected ways. For example, stayers make up a higher
fraction of the MFIP samples, since MFIP’s generous financial incentives allowed recipients to
work and still remain eligible for some benefits. Although the WRP program also had
incentives, they were much less generous than MFIP’s. FTP, one of the time-limit programs,
has the fewest stayers. Although Jobs First also had a time limit, two factors might account for
4As discussed later, the results did not differ significantly when the cycler group was restricted to people
with at least two welfare spells.
Program Stayers Cyclers Leavers
WRP, Incentives Only 34.9 24.8 40.4
MFIP, Incentives Only 56.6 10.1 33.4
WRP 30.7 26.0 43.3
MFIP 47.7 14.6 37.7
NEWWS, Education focused 33.1 19.5 47.4
NEWWS, Employment focused 27.9 22.4 49.7
Jobs First 37.4 14.4 48.2
FTP 4.9 39.0 56.1
Total 31.7 20.2 48.1
Table 2
Patterns of Receipt, by Program
SOURCE: MDRC calculations from administrative records.
8/14/2019 Health and Human Services: Miller-MDRC-02
http://slidepdf.com/reader/full/health-and-human-services-miller-mdrc-02 31/68
-17-
the relatively high fraction of stayers in the sample. First, extensions to the time limit were
typically granted to recipients who were not earning above a certain amount. Second, although
the sample in all evaluations is restricted to people with between 36 and 60 months of follow-
up data, the follow-up period for the Jobs First sample is on the short end of this range,meaning that there were fewer months to observe recipients leaving welfare. Many recipients in
the NEWWS sample, in contrast, were followed for up to 60 months, which may partly explain
why there are fewer stayers in NEWWS than in Jobs First.
Leavers, Stayers, and Cyclers
Characteristics
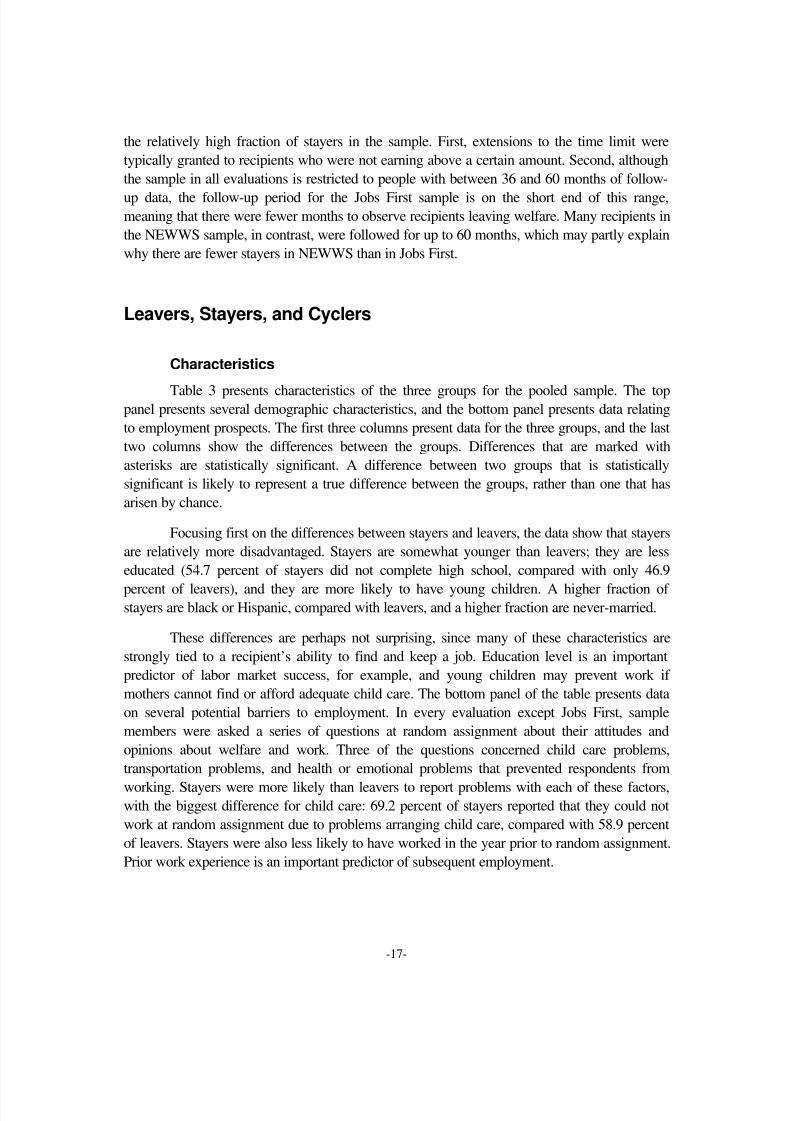
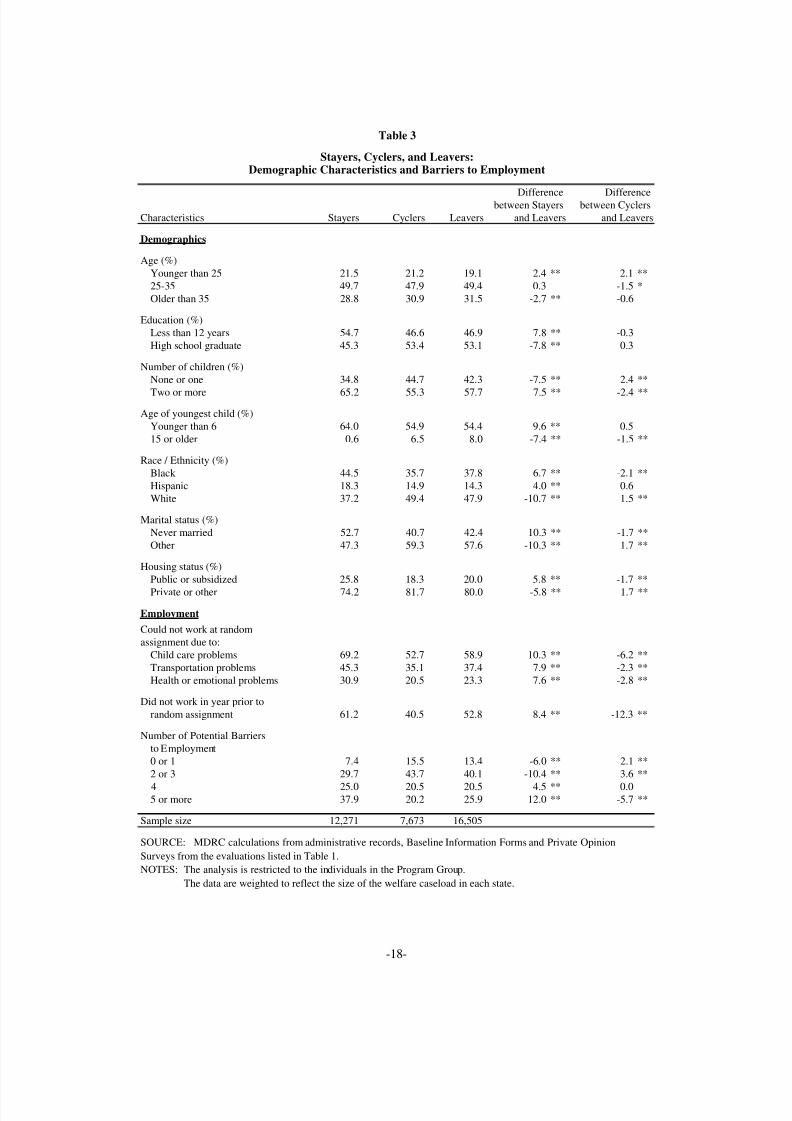
Table 3 presents characteristics of the three groups for the pooled sample. The toppanel presents several demographic characteristics, and the bottom panel presents data relating
to employment prospects. The first three columns present data for the three groups, and the last
two columns show the differences between the groups. Differences that are marked with
asterisks are statistically significant. A difference between two groups that is statistically
significant is likely to represent a true difference between the groups, rather than one that has
arisen by chance.
Focusing first on the differences between stayers and leavers, the data show that stayers
are relatively more disadvantaged. Stayers are somewhat younger than leavers; they are less
educated (54.7 percent of stayers did not complete high school, compared with only 46.9
percent of leavers), and they are more likely to have young children. A higher fraction of stayers are black or Hispanic, compared with leavers, and a higher fraction are never-married.
These differences are perhaps not surprising, since many of these characteristics are
strongly tied to a recipient’s ability to find and keep a job. Education level is an important
predictor of labor market success, for example, and young children may prevent work if
mothers cannot find or afford adequate child care. The bottom panel of the table presents data
on several potential barriers to employment. In every evaluation except Jobs First, sample
members were asked a series of questions at random assignment about their attitudes and
opinions about welfare and work. Three of the questions concerned child care problems,
transportation problems, and health or emotional problems that prevented respondents from
working. Stayers were more likely than leavers to report problems with each of these factors,with the biggest difference for child care: 69.2 percent of stayers reported that they could not
work at random assignment due to problems arranging child care, compared with 58.9 percent
of leavers. Stayers were also less likely to have worked in the year prior to random assignment.
Prior work experience is an important predictor of subsequent employment.
8/14/2019 Health and Human Services: Miller-MDRC-02
http://slidepdf.com/reader/full/health-and-human-services-miller-mdrc-02 32/68
-18-
Characteristics Stayers Cyclers Leavers
Demographics
Age (%)
Younger than 25 21.5 21.2 19.1 2.4 ** 2.1 **
25-35 49.7 47.9 49.4 0.3 -1.5 *
Older than 35 28.8 30.9 31.5 -2.7 ** -0.6
Education (%)
Less than 12 years 54.7 46.6 46.9 7.8 ** -0.3
High school graduate 45.3 53.4 53.1 -7.8 ** 0.3
Number of children (%)
None or one 34.8 44.7 42.3 -7.5 ** 2.4 **
Two or more 65.2 55.3 57.7 7.5 ** -2.4 **
Age of youngest child (%)
Younger than 6 64.0 54.9 54.4 9.6 ** 0.5
15 or older 0.6 6.5 8.0 -7.4 ** -1.5 **
Race / Ethnicity (%)
Black 44.5 35.7 37.8 6.7 ** -2.1 **
Hispanic 18.3 14.9 14.3 4.0 ** 0.6
White 37.2 49.4 47.9 -10.7 ** 1.5 **
Marital status (%)
Never married 52.7 40.7 42.4 10.3 ** -1.7 **
Other 47.3 59.3 57.6 -10.3 ** 1.7 **
Housing status (%)
Public or subsidized 25.8 18.3 20.0 5.8 ** -1.7 **
Private or other 74.2 81.7 80.0 -5.8 ** 1.7 **
Employment
Could not work at random
assignment due to:
Child care problems 69.2 52.7 58.9 10.3 ** -6.2 **
Transportation problems 45.3 35.1 37.4 7.9 ** -2.3 **
Health or emotional problems 30.9 20.5 23.3 7.6 ** -2.8 **
Did not work in year prior to
random assignment 61.2 40.5 52.8 8.4 ** -12.3 **
Number of Potential Barriers
to Employment
0 or 1 7.4 15.5 13.4 -6.0 ** 2.1 **
2 or 3 29.7 43.7 40.1 -10.4 ** 3.6 **
4 25.0 20.5 20.5 4.5 ** 0.05 or more 37.9 20.2 25.9 12.0 ** -5.7 **
Sample size 12,271 7,673 16,505
between Stayers
and Leavers
Differencebetween Cyclers
and Leavers
Table 3
Stayers, Cyclers, and Leavers:Demographic Characteristics and Barriers to Employment
Difference
SOURCE: MDRC calculations from administrative records, Baseline Information Forms and Private Opinion
Surveys from the evaluations listed in Table 1.
NOTES: The analysis is restricted to the individuals in the Program Group.
The data are weighted to reflect the size of the welfare caseload in each state.
8/14/2019 Health and Human Services: Miller-MDRC-02
http://slidepdf.com/reader/full/health-and-human-services-miller-mdrc-02 33/68
-19-
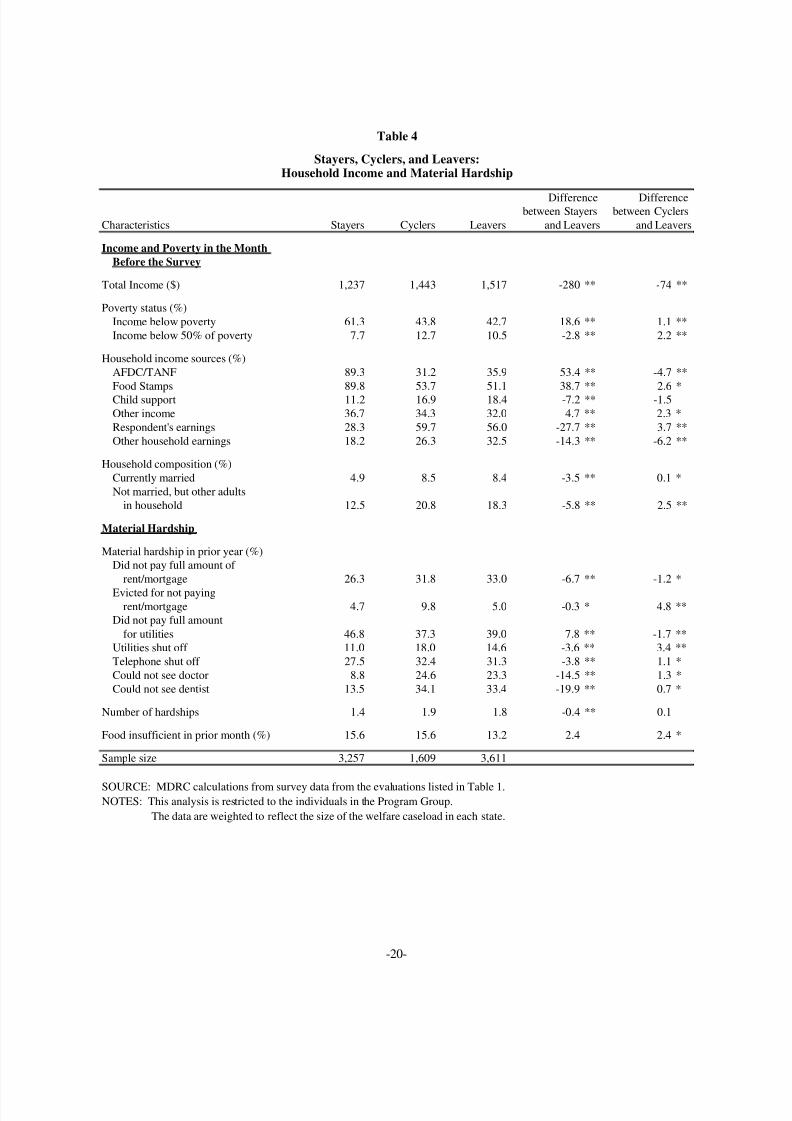
Although the existence of any one of these barriers hinders the ability to find work, pre-
vious research has found that the total number of barriers is also important (Danziger et al.,
1999). In other words, barriers add up, in the sense that facing several of them (such as low
education combined with child care problems) severely limits employment prospects. Thebottom several rows of Table 3 present data on the sum of seven potential barriers to work:
child care problems, transportation problems, health or emotional problems,5 lack of work in
the year prior to random assignment, lack of a high school diploma, the presence of children
under age 6, and the presence of two or more children. Not surprisingly, stayers are much more
likely to have several barriers; 37.9 percent of stayers had five or more of these barriers,
compared with 25.9 percent of leavers. What is striking, however, is the high number of stayers
and leavers with multiple barriers; 62.0 percent of stayers and 46.0 percent of leavers faced four
or more potential barriers to work.
The second column of Table 3 presents data for cyclers, and the last column presents
differences between cyclers and leavers. Although most of the differences in demographiccharacteristics between cyclers and leavers are statically significant, few of them are big. In
other words, cyclers look fairly similar to leavers. For example, there is virtually no difference
in education levels and marital status between the two groups. However, there are more
noticeable differences in potential barriers to work. Cyclers are less likely than leavers and
stayers to report each of the barriers, particularly the lack of prior work experience. This is not
surprising, given the way in which the groups are defined. As noted above, about a third of the
cyclers had only one short spell of welfare. In contrast, leavers were defined as people who
spent at least six months on welfare before exiting.
Separate analyses examined the characteristics of a cycler group, referred to as “long-
term cyclers,” that did not include people who had only one short spell on welfare. The results
are fairly similar to those presented in Table 3. The long-term cyclers were slightly more likely
than all cyclers to report certain barriers to employment, but, on average, they still looked much
more like leavers than stayers.
Economic Status
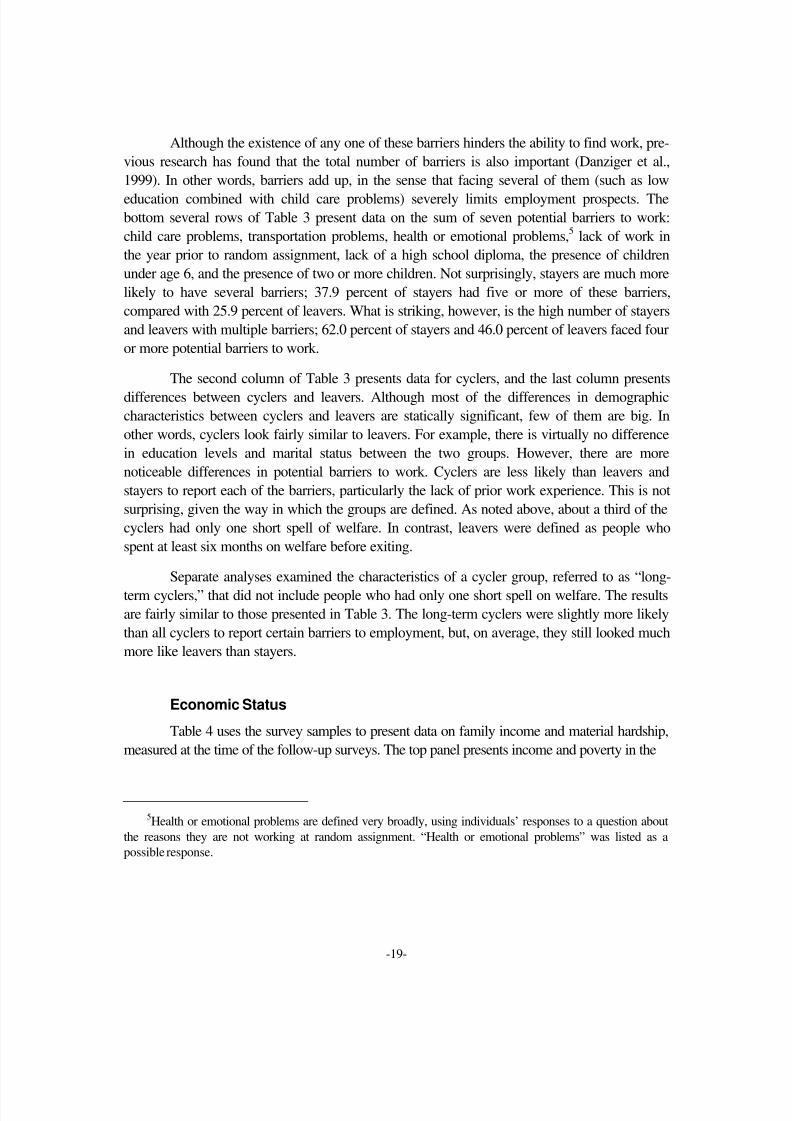
Table 4 uses the survey samples to present data on family income and material hardship,
measured at the time of the follow-up surveys. The top panel presents income and poverty in the
5Health or emotional problems are defined very broadly, using individuals’ responses to a question about
the reasons they are not working at random assignment. “Health or emotional problems” was listed as a
possible response.
8/14/2019 Health and Human Services: Miller-MDRC-02
http://slidepdf.com/reader/full/health-and-human-services-miller-mdrc-02 34/68
-20-
Characteristics Stayers Cyclers Leavers
Income and Poverty in the Month
Before the Survey
Total Income ($) 1,237 1,443 1,517 -280 ** -74 **
Poverty status (%)
Income below poverty 61.3 43.8 42.7 18.6 ** 1.1 **
Income below 50% of poverty 7.7 12.7 10.5 -2.8 ** 2.2 **
Household income sources (%)
AFDC/TANF 89.3 31.2 35.9 53.4 ** -4.7 **
Food Stamps 89.8 53.7 51.1 38.7 ** 2.6 *Child support 11.2 16.9 18.4 -7.2 ** -1.5
Other income 36.7 34.3 32.0 4.7 ** 2.3 *
Respondent's earnings 28.3 59.7 56.0 -27.7 ** 3.7 **
Other household earnings 18.2 26.3 32.5 -14.3 ** -6.2 **
Household composition (%)
Currently married 4.9 8.5 8.4 -3.5 ** 0.1 *
Not married, but other adultsin household 12.5 20.8 18.3 -5.8 ** 2.5 **
Material Hardship
Material hardship in prior year (%)Did not pay full amount of
rent/mortgage 26.3 31.8 33.0 -6.7 ** -1.2 *
Evicted for not payingrent/mortgage 4.7 9.8 5.0 -0.3 * 4.8 **
Did not pay full amount
for utilities 46.8 37.3 39.0 7.8 ** -1.7 **Utilities shut off 11.0 18.0 14.6 -3.6 ** 3.4 **
Telephone shut off 27.5 32.4 31.3 -3.8 ** 1.1 *
Could not see doctor 8.8 24.6 23.3 -14.5 ** 1.3 *
Could not see dentist 13.5 34.1 33.4 -19.9 ** 0.7 *
Number of hardships 1.4 1.9 1.8 -0.4 ** 0.1
Food insufficient in prior month (%) 15.6 15.6 13.2 2.4 2.4 *
Sample size 3,257 1,609 3,611
between Stayers
and Leavers
between Cyclers
and Leavers
Table 4
Stayers, Cyclers, and Leavers:Household Income and Material Hardship
Difference Difference
SOURCE: MDRC calculations from survey data from the evaluations listed in Table 1.NOTES: This analysis is restricted to the individuals in the Program Group.
The data are weighted to reflect the size of the welfare caseload in each state.
8/14/2019 Health and Human Services: Miller-MDRC-02
http://slidepdf.com/reader/full/health-and-human-services-miller-mdrc-02 35/68
8/14/2019 Health and Human Services: Miller-MDRC-02
http://slidepdf.com/reader/full/health-and-human-services-miller-mdrc-02 36/68
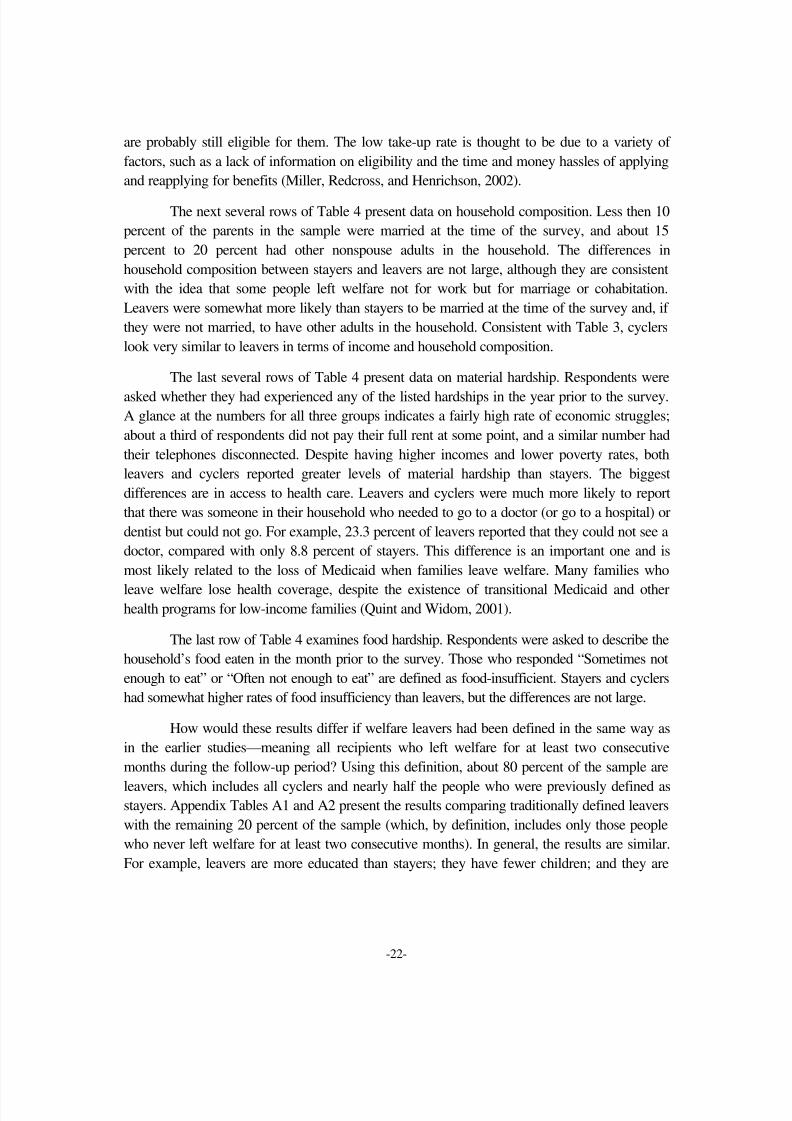
-22-
are probably still eligible for them. The low take-up rate is thought to be due to a variety of
factors, such as a lack of information on eligibility and the time and money hassles of applying
and reapplying for benefits (Miller, Redcross, and Henrichson, 2002).
The next several rows of Table 4 present data on household composition. Less then 10
percent of the parents in the sample were married at the time of the survey, and about 15
percent to 20 percent had other nonspouse adults in the household. The differences in
household composition between stayers and leavers are not large, although they are consistent
with the idea that some people left welfare not for work but for marriage or cohabitation.
Leavers were somewhat more likely than stayers to be married at the time of the survey and, if
they were not married, to have other adults in the household. Consistent with Table 3, cyclers
look very similar to leavers in terms of income and household composition.
The last several rows of Table 4 present data on material hardship. Respondents were
asked whether they had experienced any of the listed hardships in the year prior to the survey.A glance at the numbers for all three groups indicates a fairly high rate of economic struggles;
about a third of respondents did not pay their full rent at some point, and a similar number had
their telephones disconnected. Despite having higher incomes and lower poverty rates, both
leavers and cyclers reported greater levels of material hardship than stayers. The biggest
differences are in access to health care. Leavers and cyclers were much more likely to report
that there was someone in their household who needed to go to a doctor (or go to a hospital) or
dentist but could not go. For example, 23.3 percent of leavers reported that they could not see a
doctor, compared with only 8.8 percent of stayers. This difference is an important one and is
most likely related to the loss of Medicaid when families leave welfare. Many families who
leave welfare lose health coverage, despite the existence of transitional Medicaid and otherhealth programs for low-income families (Quint and Widom, 2001).
The last row of Table 4 examines food hardship. Respondents were asked to describe the
household’s food eaten in the month prior to the survey. Those who responded “Sometimes not
enough to eat” or “Often not enough to eat” are defined as food-insufficient. Stayers and cyclers
had somewhat higher rates of food insufficiency than leavers, but the differences are not large.
How would these results differ if welfare leavers had been defined in the same way as
in the earlier studies—meaning all recipients who left welfare for at least two consecutive
months during the follow-up period? Using this definition, about 80 percent of the sample are
leavers, which includes all cyclers and nearly half the people who were previously defined asstayers. Appendix Tables A1 and A2 present the results comparing traditionally defined leavers
with the remaining 20 percent of the sample (which, by definition, includes only those people
who never left welfare for at least two consecutive months). In general, the results are similar.
For example, leavers are more educated than stayers; they have fewer children; and they are
8/14/2019 Health and Human Services: Miller-MDRC-02
http://slidepdf.com/reader/full/health-and-human-services-miller-mdrc-02 37/68
-23-
less likely to be black. The results are also similar for prior work experience and employment
barriers. Table A2 presents income and material hardship. Leavers have higher incomes than
stayers and are much less likely to be poor. The group of traditionally defined leavers has a
somewhat higher poverty rate than the long-term leavers (see Table 4), but the difference is notlarge. Thus, although the longer-term definitions may be theoretically more precise in
identifying groups of interest, in practice they seem to have few implications for describing the
average characteristics of various groups in the caseload. Part of the reason for this finding is
that cyclers look, on average, very similar to leavers.
Results for Individual Programs
The results for the pooled sample show that leavers are less disadvantaged than stayers,
which is consistent with other research. Leavers are more educated, face fewer barriers to work,
and have somewhat higher incomes. All the leavers left welfare as part of a welfare-to-work program, but some left under a program with financial incentives, and others left under time
limits. Does the type of welfare program affect who leaves versus who stays and how leavers
fare relative to stayers?
The extent to which leavers differ from stayers in any given program depends on who
is encouraged to leave or stay. If the program moves a fairly broad cross-section of recipients
off the rolls, then leavers may be fairly similar to stayers. On the other hand, if only the most
employable recipients leave, then the leavers might look very different from the average stayer.
In programs with incentives (but without time limits), most of the people who leave welfare
may be those whose earnings are high enough that they lose eligibility. In this case, leaversmay look very different from stayers. At the other extreme is time limits, which may encourage
a broader group of recipients to leave welfare, depending on how the time limit is administered.
In FTP, for example, few extensions were granted to people who reached the limit, whereas in
Jobs First extensions were typically granted if the recipient’s earnings were not high enough.
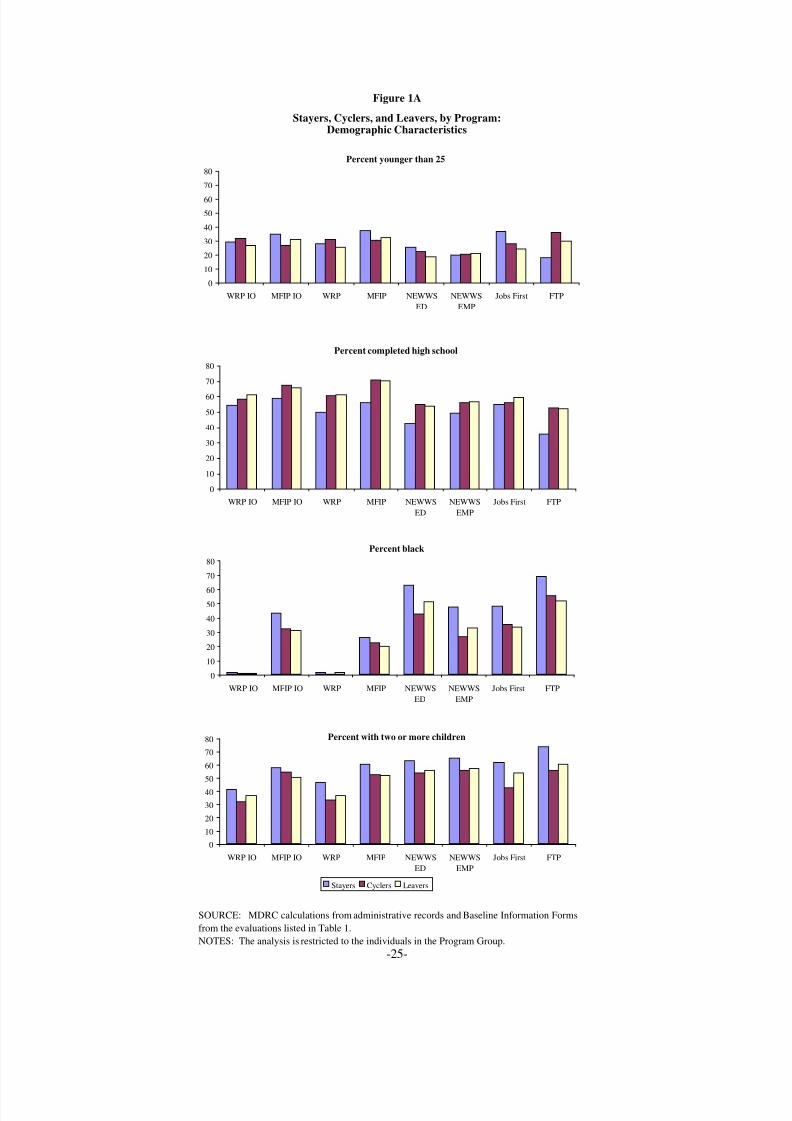
Figure 1A presents selected characteristics of the three groups for each program. The
programs are ordered by type: incentives only (WRP IO, MFIP IO); incentives plus mandates
(WRP, MFIP); education-focused without incentives (NEWWS ED); employment-focused
without incentives (NEWWS EMP); and time limits with incentives (Jobs First and FTP). With
a few exceptions, the patterns found for the full sample hold for each individual program. For
example, stayers across each program are less likely than their leaver counterparts to havecompleted high school, with the biggest differences being found in MFIP and FTP. Stayers are
also more likely than leavers in each program to have two or more children. The differences by
race also hold up across each program; a higher fraction of stayers than leavers are black, with
8/14/2019 Health and Human Services: Miller-MDRC-02
http://slidepdf.com/reader/full/health-and-human-services-miller-mdrc-02 38/68
-24-
the biggest difference appearing in FTP. In general, cyclers look more like leavers than stayers
in each program, particularly in terms of education levels.
Figure 1B shows several potential barriers to employment. (Data on several key barri-ers are not available for Connecticut’s Jobs First program.) Again, the overall pattern found for
the pooled sample is also found for each program. Stayers in each program are more likely than
leavers to report problems with child care and with transportation. The relatively high levels of
reported child care problems for the NEWWS sample may be due to the fact that the evaluation
took place several years earlier than the other programs. Funding for child care assistance has
greatly increased since the early 1990s. Stayers are also less likely to have worked in the year
prior to random assignment, except in the MFIP Incentives Only and the two time-limit
programs. Finally, in all programs except FTP, stayers are more likely to have four or more
barriers to work.
Figure 1C presents data on income and material hardship. (Not all hardship measuresare available from every survey.) For these outcomes, there is more variation across programs
in terms of overall levels and in terms of differences between stayers and leavers. For example,
stayers had the highest monthly incomes and the lowest poverty rates in the two MFIP
programs and Jobs First—the programs with the most generous financial incentives. Although
FTP included enhanced incentives along with time limits, welfare benefits are relatively low in
Florida, so that a fairly high fraction of stayers were below poverty.
Stayers in all programs had lower incomes than leavers, and the differences were larg-
est in the two MFIP programs. This pattern is consistent with the idea that people who left
welfare in these programs were those whose earnings were high enough to make themineligible. The results are different for poverty rates. Although the biggest income differences
between leavers and stayers were found in MFIP, this program, along with Jobs First, had the
smallest differences in poverty. Although this seems counterintuitive, the incentives in both
these programs allowed recipients to combine work and welfare until their income was above
the poverty line. Thus, many stayers in these programs were already above the poverty line.
Figures 1B and 1C present material hardship and food sufficiency. Leavers and cyclers
report higher numbers of hardships in three of the four programs with available data, and the
biggest differences are for the time-limit programs. In most of the programs, stayers are more
likely to report being food-insufficient, although the differences are generally small.
8/14/2019 Health and Human Services: Miller-MDRC-02
http://slidepdf.com/reader/full/health-and-human-services-miller-mdrc-02 39/68
-25-
Figure 1A
Stayers, Cyclers, and Leavers, by Program:Demographic Characteristics
Percent younger than 25
0
10
20
30
40
50
60
70
80
WRP IO MFIP IO WRP MFIP NEWWS
ED
NEWWS
EMP
Jobs First FTP
Percent completed high school
0
10
20
30
40
50
60
70
80
WRP IO MFIP IO WRP MFIP NEWWS
ED
NEWWS
EMP
Jobs First FTP
Percent black
0
10
20
30
40
50
60
70
80
WRP IO MFIP IO WRP MFIP NEWWS
ED
NEWWS
EMP
Jobs First FTP
Percent with two or more children
0
10
20
30
40
50
60
70
80
WRP IO MFIP IO WRP MFIP NEWWS
ED
NEWWS
EMP
Jobs First FTP
Stayers Cyclers Leavers
SOURCE: MDRC calculations from administrative records and Baseline Information Forms
from the evaluations listed in Table 1.
NOTES: The analysis is restricted to the individuals in the Program Group.
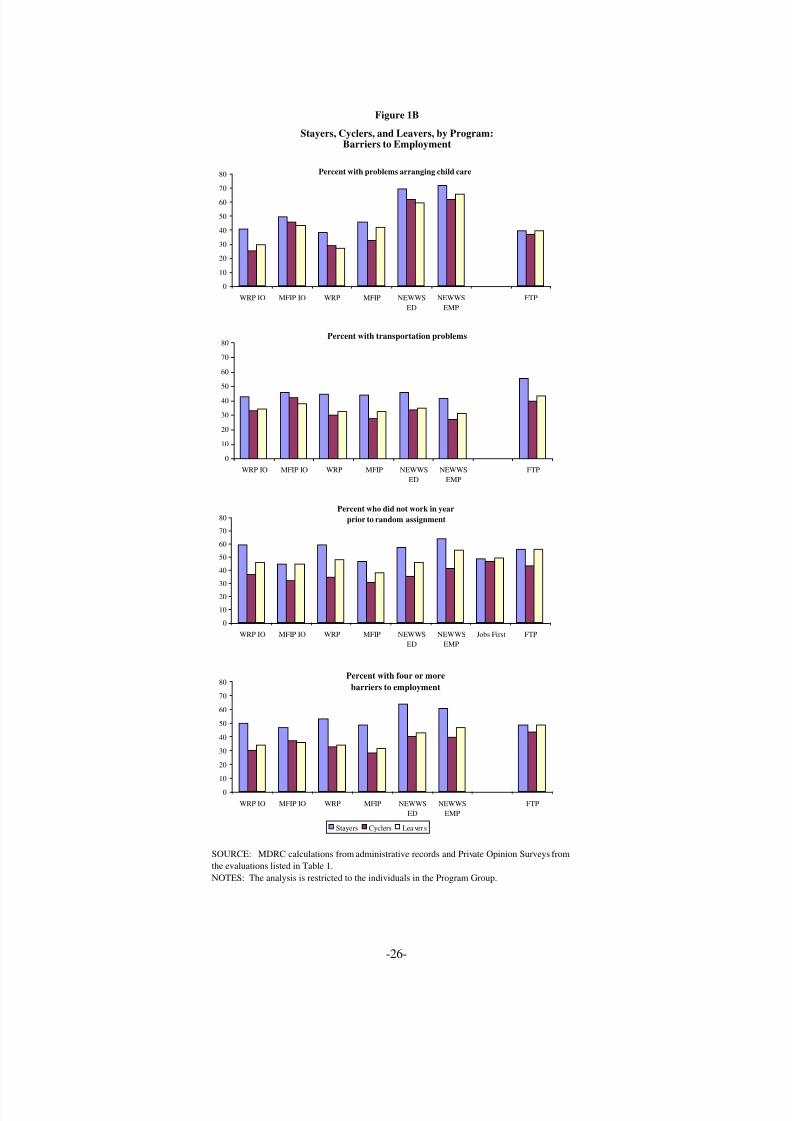
8/14/2019 Health and Human Services: Miller-MDRC-02
http://slidepdf.com/reader/full/health-and-human-services-miller-mdrc-02 40/68
-26-
Figure 1B
Stayers, Cyclers, and Leavers, by Program:Barriers to Employment
Percent with problems arranging child care
0
10
20
30
40
50
60
70
80
WRP IO MFIP IO WRP MFIP NEWWS
ED
NEWWS
EMP
FTP
Percent with transportation problems
0
10
20
30
40
50
60
70
80
WRP IO MFIP IO WRP MFIP NEWWS
ED
NEWWS
EMP
FTP
Percent who did not work in year
prior to random assignment
0
10
20
30
40
50
60
70
80
WRP IO MFIP IO WRP MFIP NEWWS
ED
NEWWS
EMP
Jobs First FTP
Percent with four or more
barriers to employment
0
10
20
30
40
50
60
70
80
WRP IO MFIP IO WRP MFIP NEWWS
ED
NEWWS
EMP
FTP
Stayers Cyclers Lea ver s
SOURCE: MDRC calculations from administrative records and Private Opinion Surveys from
the evaluations listed in Table 1.
NOTES: The analysis is restricted to the individuals in the Program Group.
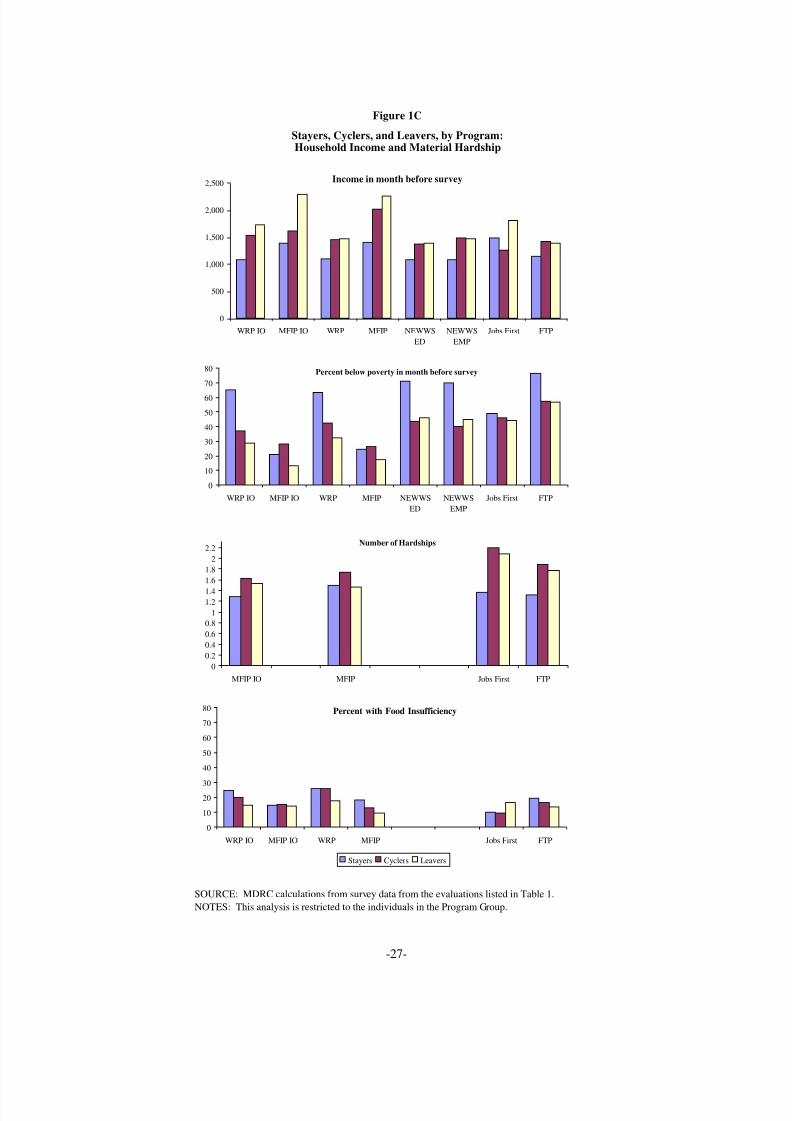
8/14/2019 Health and Human Services: Miller-MDRC-02
http://slidepdf.com/reader/full/health-and-human-services-miller-mdrc-02 41/68
-27-
Figure 1C
Stayers, Cyclers, and Leavers, by Program:Household Income and Material Hardship
Income in month before survey
0
500
1,000
1,500
2,000
2,500
WRP IO MFIP IO WRP MFIP NEWWS
ED
NEWWS
EMP
Jobs First FTP
Percent below poverty in month before survey
0
10
20
30
40
50
60
70
80
WRP IO MFIP IO WRP MFIP NEWWS
ED
NEWWS
EMP
Jobs First FTP
Number of Hardships
0
0.2
0.4
0.6
0.8
1
1.21.4
1.6
1.8
2
2.2
MFIP IO MFIP Jobs First FTP
Percent with Food Insufficiency
0
10
2030
40
50
60
70
80
WRP IO MFIP IO WRP MFIP Jobs First FTP
Stayers Cyclers Leavers
SOURCE: MDRC calculations from survey data from the evaluations listed in Table 1.
NOTES: This analysis is restricted to the individuals in the Program Group.
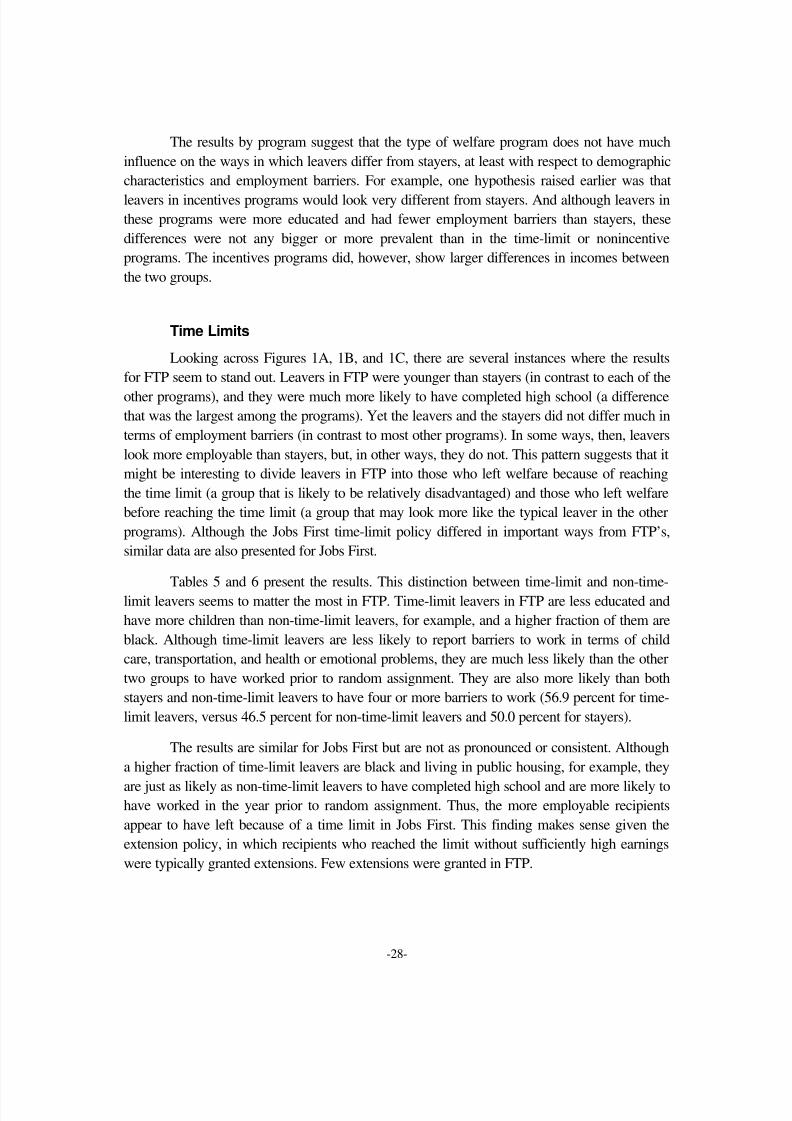
8/14/2019 Health and Human Services: Miller-MDRC-02
http://slidepdf.com/reader/full/health-and-human-services-miller-mdrc-02 42/68
-28-
The results by program suggest that the type of welfare program does not have much
influence on the ways in which leavers differ from stayers, at least with respect to demographic
characteristics and employment barriers. For example, one hypothesis raised earlier was that
leavers in incentives programs would look very different from stayers. And although leavers inthese programs were more educated and had fewer employment barriers than stayers, these
differences were not any bigger or more prevalent than in the time-limit or nonincentive
programs. The incentives programs did, however, show larger differences in incomes between
the two groups.
Time Limits
Looking across Figures 1A, 1B, and 1C, there are several instances where the results
for FTP seem to stand out. Leavers in FTP were younger than stayers (in contrast to each of the
other programs), and they were much more likely to have completed high school (a differencethat was the largest among the programs). Yet the leavers and the stayers did not differ much in
terms of employment barriers (in contrast to most other programs). In some ways, then, leavers
look more employable than stayers, but, in other ways, they do not. This pattern suggests that it
might be interesting to divide leavers in FTP into those who left welfare because of reaching
the time limit (a group that is likely to be relatively disadvantaged) and those who left welfare
before reaching the time limit (a group that may look more like the typical leaver in the other
programs). Although the Jobs First time-limit policy differed in important ways from FTP’s,
similar data are also presented for Jobs First.
Tables 5 and 6 present the results. This distinction between time-limit and non-time-limit leavers seems to matter the most in FTP. Time-limit leavers in FTP are less educated and
have more children than non-time-limit leavers, for example, and a higher fraction of them are
black. Although time-limit leavers are less likely to report barriers to work in terms of child
care, transportation, and health or emotional problems, they are much less likely than the other
two groups to have worked prior to random assignment. They are also more likely than both
stayers and non-time-limit leavers to have four or more barriers to work (56.9 percent for time-
limit leavers, versus 46.5 percent for non-time-limit leavers and 50.0 percent for stayers).
The results are similar for Jobs First but are not as pronounced or consistent. Although
a higher fraction of time-limit leavers are black and living in public housing, for example, they
are just as likely as non-time-limit leavers to have completed high school and are more likely tohave worked in the year prior to random assignment. Thus, the more employable recipients
appear to have left because of a time limit in Jobs First. This finding makes sense given the
extension policy, in which recipients who reached the limit without sufficiently high earnings
were typically granted extensions. Few extensions were granted in FTP.
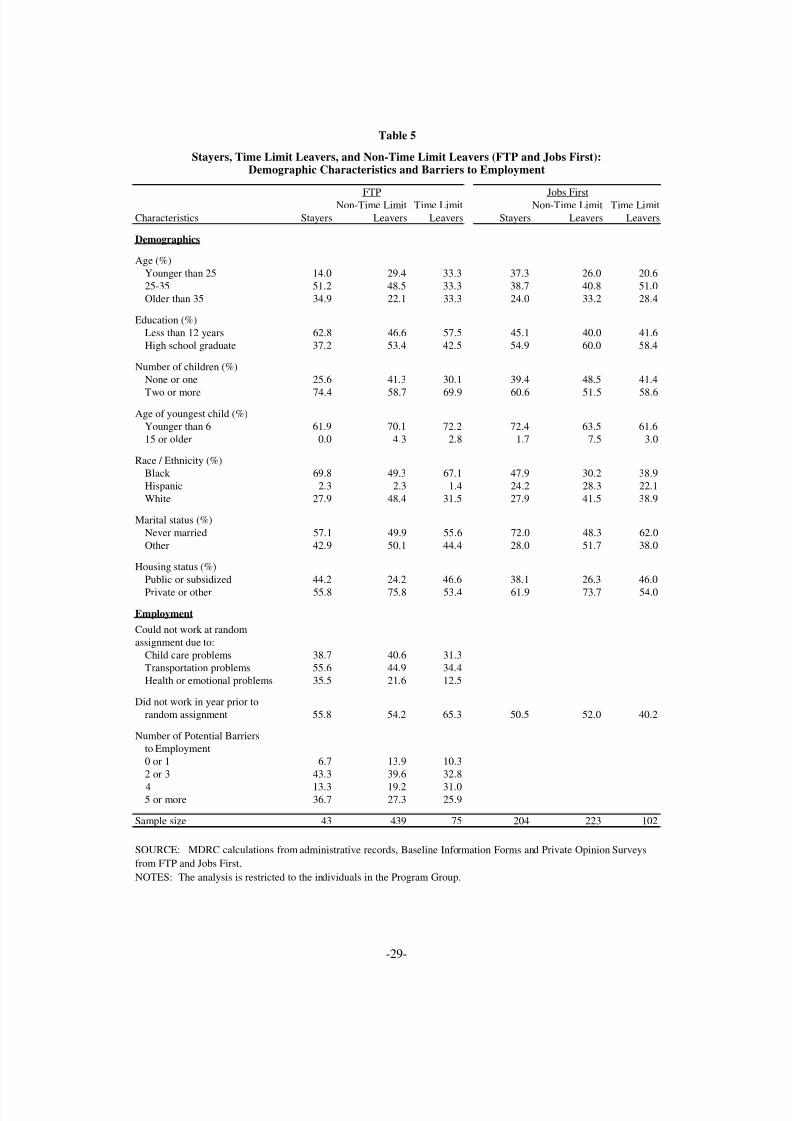
8/14/2019 Health and Human Services: Miller-MDRC-02
http://slidepdf.com/reader/full/health-and-human-services-miller-mdrc-02 43/68
-29-
Non-Time Limit Time Limit Non-Time Limit Time Limit
Characteristics Stayers Leavers Leavers Stayers Leavers Leavers
Demographics
Age (%)
Younger than 25 14.0 29.4 33.3 37.3 26.0 20.6
25-35 51.2 48.5 33.3 38.7 40.8 51.0
Older than 35 34.9 22.1 33.3 24.0 33.2 28.4
Education (%)
Less than 12 years 62.8 46.6 57.5 45.1 40.0 41.6
High school graduate 37.2 53.4 42.5 54.9 60.0 58.4
Number of children (%)
None or one 25.6 41.3 30.1 39.4 48.5 41.4
Two or more 74.4 58.7 69.9 60.6 51.5 58.6
Age of youngest child (%)
Younger than 6 61.9 70.1 72.2 72.4 63.5 61.6
15 or older 0.0 4.3 2.8 1.7 7.5 3.0
Race / Ethnicity (%)
Black 69.8 49.3 67.1 47.9 30.2 38.9
Hispanic 2.3 2.3 1.4 24.2 28.3 22.1
White 27.9 48.4 31.5 27.9 41.5 38.9
Marital status (%)
Never married 57.1 49.9 55.6 72.0 48.3 62.0
Other 42.9 50.1 44.4 28.0 51.7 38.0
Housing status (%)
Public or subsidized 44.2 24.2 46.6 38.1 26.3 46.0
Private or other 55.8 75.8 53.4 61.9 73.7 54.0
Employment
Could not work at random
assignment due to:
Child care problems 38.7 40.6 31.3
Transportation problems 55.6 44.9 34.4
Health or emotional problems 35.5 21.6 12.5
Did not work in year prior to
random assignment 55.8 54.2 65.3 50.5 52.0 40.2
Number of Potential Barriers
to Employment
0 or 1 6.7 13.9 10.3
2 or 3 43.3 39.6 32.8
4 13.3 19.2 31.05 or more 36.7 27.3 25.9
Sample size 43 439 75 204 223 102
Jobs First
Table 5
Stayers, Time Limit Leavers, and Non-Time Limit Leavers (FTP and Jobs First):Demographic Characteristics and Barriers to Employment
FTP
SOURCE: MDRC calculations from administrative records, Baseline Information Forms and Private Opinion Surveys
from FTP and Jobs First.
NOTES: The analysis is restricted to the individuals in the Program Group.
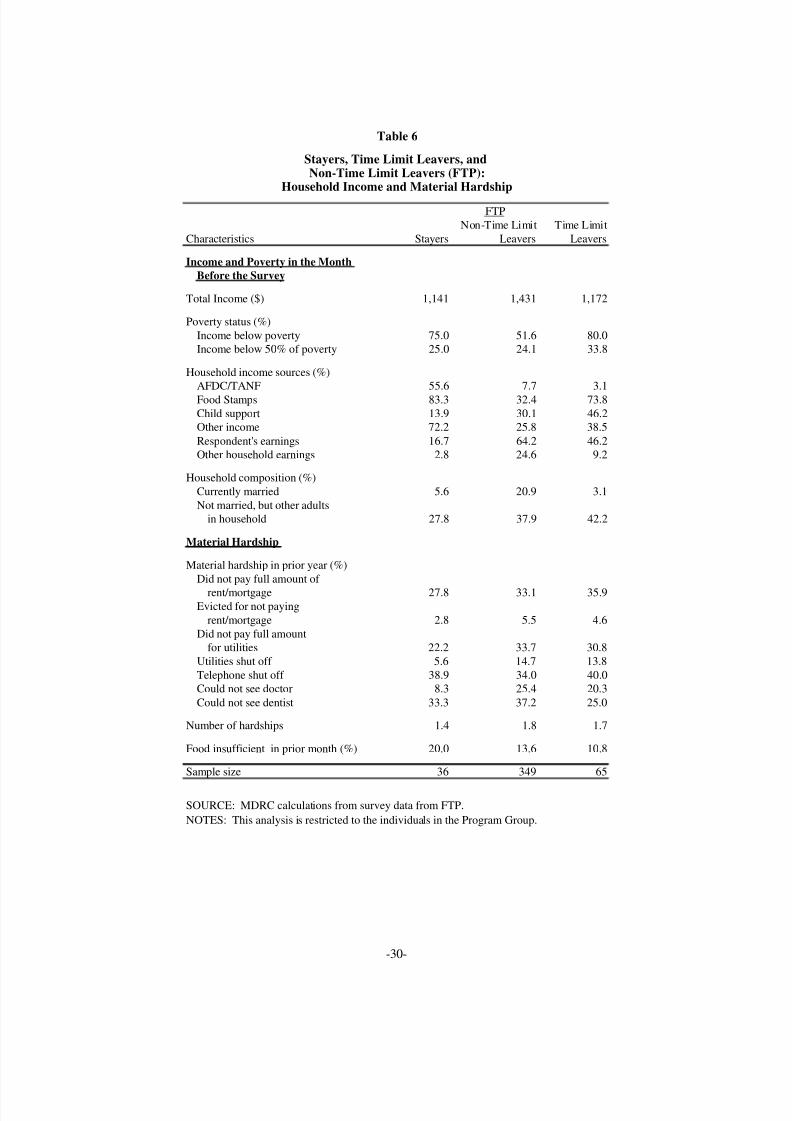
8/14/2019 Health and Human Services: Miller-MDRC-02
http://slidepdf.com/reader/full/health-and-human-services-miller-mdrc-02 44/68
-30-
Non-Time Limit Time Limit
Characteristics Stayers Leavers Leavers
Income and Poverty in the Month
Before the Survey
Total Income ($) 1,141 1,431 1,172
Poverty status (%)
Income below poverty 75.0 51.6 80.0Income below 50% of poverty 25.0 24.1 33.8
Household income sources (%)AFDC/TANF 55.6 7.7 3.1
Food Stamps 83.3 32.4 73.8
Child support 13.9 30.1 46.2Other income 72.2 25.8 38.5
Respondent's earnings 16.7 64.2 46.2Other household earnings 2.8 24.6 9.2
Household composition (%)
Currently married 5.6 20.9 3.1
Not married, but other adultsin household 27.8 37.9 42.2
Material Hardship
Material hardship in prior year (%)
Did not pay full amount of
rent/mortgage 27.8 33.1 35.9Evicted for not paying
rent/mortgage 2.8 5.5 4.6
Did not pay full amountfor utilities 22.2 33.7 30.8
Utilities shut off 5.6 14.7 13.8
Telephone shut off 38.9 34.0 40.0Could not see doctor 8.3 25.4 20.3
Could not see dentist 33.3 37.2 25.0
Number of hardships 1.4 1.8 1.7
Food insufficient in prior month (%) 20.0 13.6 10.8
Sample size 36 349 65
FTP
Table 6
Stayers, Time Limit Leavers, and
Household Income and Material HardshipNon-Time Limit Leavers (FTP):
SOURCE: MDRC calculations from survey data from FTP.
NOTES: This analysis is restricted to the individuals in the Program Group.
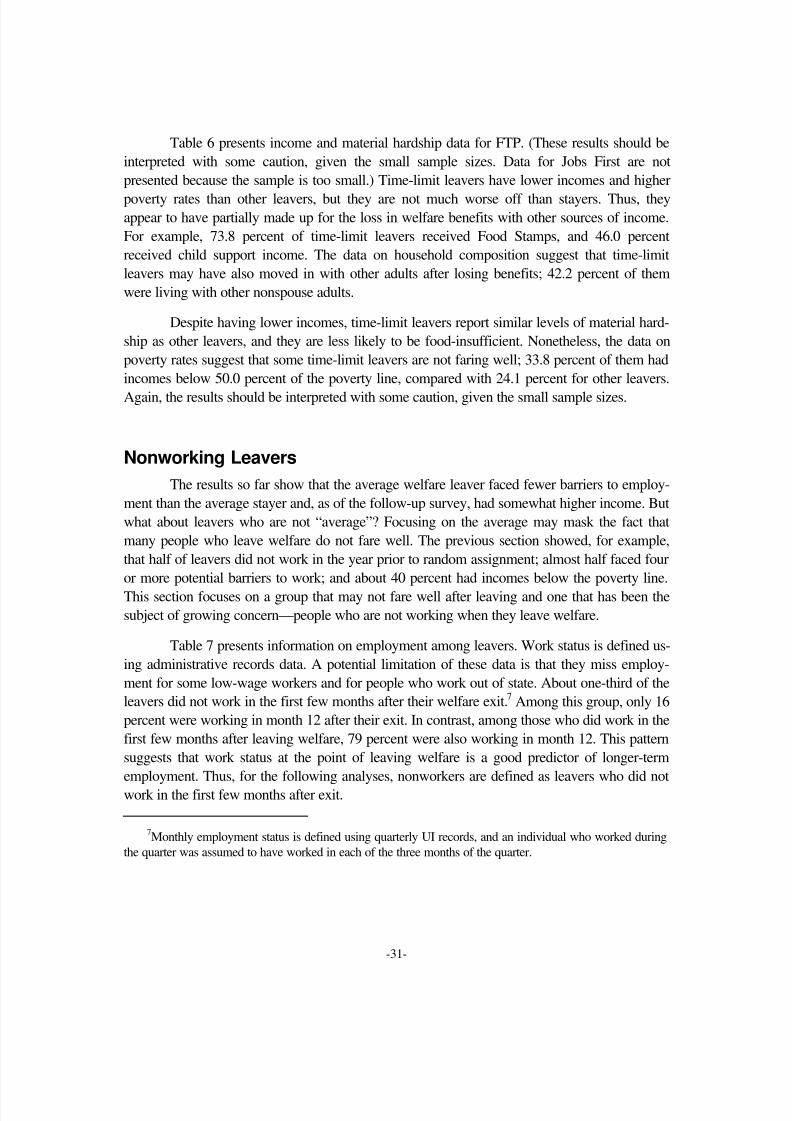
8/14/2019 Health and Human Services: Miller-MDRC-02
http://slidepdf.com/reader/full/health-and-human-services-miller-mdrc-02 45/68
-31-
Table 6 presents income and material hardship data for FTP. (These results should be
interpreted with some caution, given the small sample sizes. Data for Jobs First are not
presented because the sample is too small.) Time-limit leavers have lower incomes and higher
poverty rates than other leavers, but they are not much worse off than stayers. Thus, theyappear to have partially made up for the loss in welfare benefits with other sources of income.
For example, 73.8 percent of time-limit leavers received Food Stamps, and 46.0 percent
received child support income. The data on household composition suggest that time-limit
leavers may have also moved in with other adults after losing benefits; 42.2 percent of them
were living with other nonspouse adults.
Despite having lower incomes, time-limit leavers report similar levels of material hard-
ship as other leavers, and they are less likely to be food-insufficient. Nonetheless, the data on
poverty rates suggest that some time-limit leavers are not faring well; 33.8 percent of them had
incomes below 50.0 percent of the poverty line, compared with 24.1 percent for other leavers.
Again, the results should be interpreted with some caution, given the small sample sizes.
Nonworking Leavers
The results so far show that the average welfare leaver faced fewer barriers to employ-
ment than the average stayer and, as of the follow-up survey, had somewhat higher income. But
what about leavers who are not “average”? Focusing on the average may mask the fact that
many people who leave welfare do not fare well. The previous section showed, for example,
that half of leavers did not work in the year prior to random assignment; almost half faced four
or more potential barriers to work; and about 40 percent had incomes below the poverty line.
This section focuses on a group that may not fare well after leaving and one that has been the
subject of growing concern—people who are not working when they leave welfare.
Table 7 presents information on employment among leavers. Work status is defined us-
ing administrative records data. A potential limitation of these data is that they miss employ-
ment for some low-wage workers and for people who work out of state. About one-third of the
leavers did not work in the first few months after their welfare exit.7 Among this group, only 16
percent were working in month 12 after their exit. In contrast, among those who did work in the
first few months after leaving welfare, 79 percent were also working in month 12. This pattern
suggests that work status at the point of leaving welfare is a good predictor of longer-term
employment. Thus, for the following analyses, nonworkers are defined as leavers who did not
work in the first few months after exit.
7Monthly employment status is defined using quarterly UI records, and an individual who worked during
the quarter was assumed to have worked in each of the three months of the quarter.
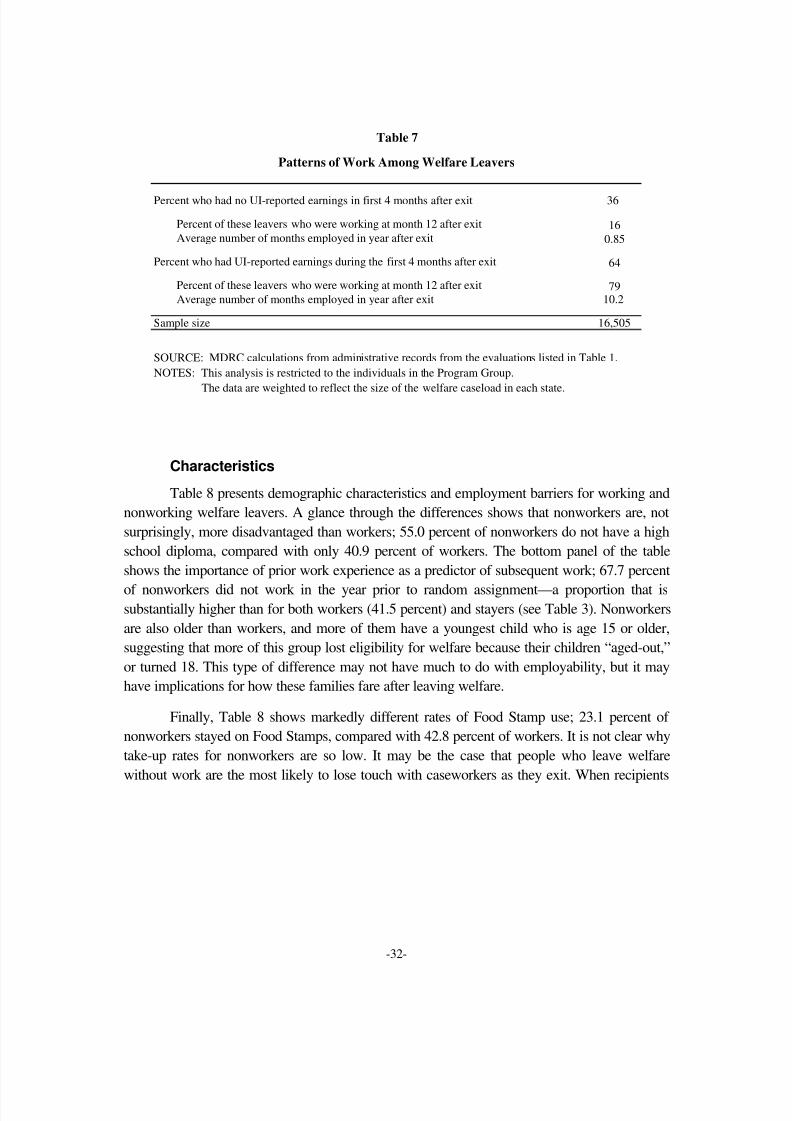
8/14/2019 Health and Human Services: Miller-MDRC-02
http://slidepdf.com/reader/full/health-and-human-services-miller-mdrc-02 46/68
-32-
Characteristics
Table 8 presents demographic characteristics and employment barriers for working and
nonworking welfare leavers. A glance through the differences shows that nonworkers are, not
surprisingly, more disadvantaged than workers; 55.0 percent of nonworkers do not have a high
school diploma, compared with only 40.9 percent of workers. The bottom panel of the table
shows the importance of prior work experience as a predictor of subsequent work; 67.7 percent
of nonworkers did not work in the year prior to random assignment—a proportion that issubstantially higher than for both workers (41.5 percent) and stayers (see Table 3). Nonworkers
are also older than workers, and more of them have a youngest child who is age 15 or older,
suggesting that more of this group lost eligibility for welfare because their children “aged-out,”
or turned 18. This type of difference may not have much to do with employability, but it may
have implications for how these families fare after leaving welfare.
Finally, Table 8 shows markedly different rates of Food Stamp use; 23.1 percent of
nonworkers stayed on Food Stamps, compared with 42.8 percent of workers. It is not clear why
take-up rates for nonworkers are so low. It may be the case that people who leave welfare
without work are the most likely to lose touch with caseworkers as they exit. When recipients
Table 7
Patterns of Work Among Welfare Leavers
Percent who had no UI-reported earnings in first 4 months after exit 36
Percent of these leavers who were working at month 12 after exit 16Average number of months employed in year after exit 0.85
Percent who had UI-reported earnings during the first 4 months after exit 64
Percent of these leavers who were working at month 12 after exit 79Average number of months employed in year after exit 10.2
Sample size 16,505
SOURCE: MDRC calculations from administrative records from the evaluations listed in Table 1.
NOTES: This analysis is restricted to the individuals in the Program Group.
The data are weighted to reflect the size of the welfare caseload in each state.
8/14/2019 Health and Human Services: Miller-MDRC-02
http://slidepdf.com/reader/full/health-and-human-services-miller-mdrc-02 47/68
-33-
Worked after Did not work after
Characteristics welfare exit welfare exit
Demographics
Age (%)
Younger than 25 21.4 15.6 5.8 **
25-35 49.8 49.2 0.6Older than 35 28.8 35.2 -6.4 **
Education (%)
Less than 12 years 40.9 55.0 -14.1 **
High school graduate 59.1 45.0 14.1 **
Number of children (%)
None or one 43.8 40.6 3.2 **
Two or more 56.2 59.4 -3.2 **
Age of youngest child (%)Younger than 6 56.0 51.8 4.2 **
15 or older 6.5 10.4 -3.9 **
Race / Ethnicity (%)
Black 42.4 31.4 11.0 **
Hispanic 11.9 17.0 -5.1 **White 45.7 51.6 -5.9 **
Marital status (%)
Never married 46.1 36.8 9.3 **
Other 53.9 63.2 -9.3 **
Housing status (%)
Public or subsidized 23.0 15.8 7.2 **
Private or other 77.0 84.2 -7.2 **
Stayed on Food Stamps after exit 42.8 23.1 19.7
Employment
Could not work at random
assignment due to:Child care problems 56.3 62.6 -6.3 **
Transportation problems 31.5 45.4 -13.9 **Health or emotional problems 17.6 30.2 -12.6 **
Did not work in year prior to
random assignment 41.5 67.7 -26.2 **
Number of Potential Barriers
to Employment
0 or 1 17.0 8.9 8.1 **2 or 3 43.7 35.9 7.8 **
4 19.8 21.6 -1.8 *
5 or more 19.5 33.6 -14.1 **
Sample size 10,358 5,880
working and non-
working leavers
Working Leavers Versus Nonworking Leavers:
Table 8
Demographic Characteristics and Barriers to Employment
Difference between
SOURCE: MDRC calculations from administrative records, Baseline Information Forms and
Private Opinion Surveys from the evaluations listed in Table 1.
NOTES: The analysis is restricted to the individuals in the Program Group.
The data are weighted to reflect the size of the welfare caseload in each state.
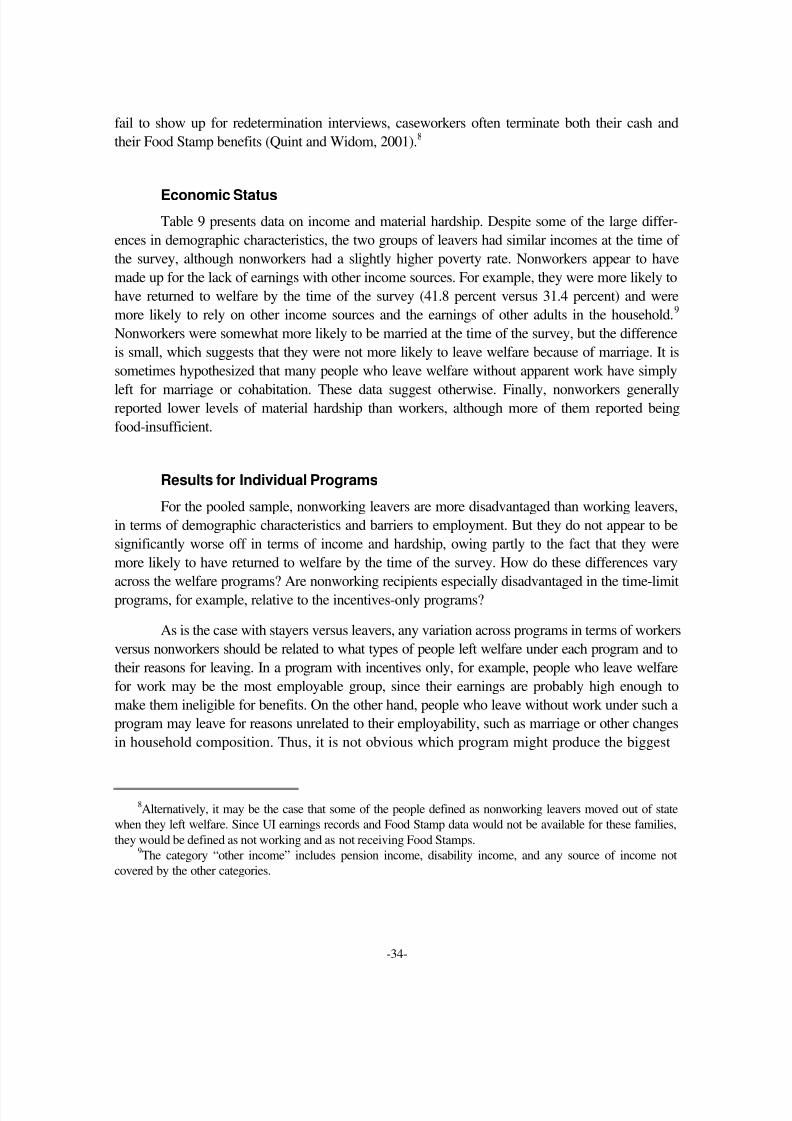
8/14/2019 Health and Human Services: Miller-MDRC-02
http://slidepdf.com/reader/full/health-and-human-services-miller-mdrc-02 48/68
-34-
fail to show up for redetermination interviews, caseworkers often terminate both their cash and
their Food Stamp benefits (Quint and Widom, 2001).8
Economic Status
Table 9 presents data on income and material hardship. Despite some of the large differ-
ences in demographic characteristics, the two groups of leavers had similar incomes at the time of
the survey, although nonworkers had a slightly higher poverty rate. Nonworkers appear to have
made up for the lack of earnings with other income sources. For example, they were more likely to
have returned to welfare by the time of the survey (41.8 percent versus 31.4 percent) and were
more likely to rely on other income sources and the earnings of other adults in the household.9
Nonworkers were somewhat more likely to be married at the time of the survey, but the difference
is small, which suggests that they were not more likely to leave welfare because of marriage. It is
sometimes hypothesized that many people who leave welfare without apparent work have simply
left for marriage or cohabitation. These data suggest otherwise. Finally, nonworkers generallyreported lower levels of material hardship than workers, although more of them reported being
food-insufficient.
Results for Individual Programs
For the pooled sample, nonworking leavers are more disadvantaged than working leavers,
in terms of demographic characteristics and barriers to employment. But they do not appear to be
significantly worse off in terms of income and hardship, owing partly to the fact that they were
more likely to have returned to welfare by the time of the survey. How do these differences vary
across the welfare programs? Are nonworking recipients especially disadvantaged in the time-limit
programs, for example, relative to the incentives-only programs?
As is the case with stayers versus leavers, any variation across programs in terms of workers
versus nonworkers should be related to what types of people left welfare under each program and to
their reasons for leaving. In a program with incentives only, for example, people who leave welfare
for work may be the most employable group, since their earnings are probably high enough to
make them ineligible for benefits. On the other hand, people who leave without work under such a
program may leave for reasons unrelated to their employability, such as marriage or other changes
in household composition. Thus, it is not obvious which program might produce the biggest
8Alternatively, it may be the case that some of the people defined as nonworking leavers moved out of state
when they left welfare. Since UI earnings records and Food Stamp data would not be available for these families,
they would be defined as not working and as not receiving Food Stamps.9The category “other income” includes pension income, disability income, and any source of income not
covered by the other categories.
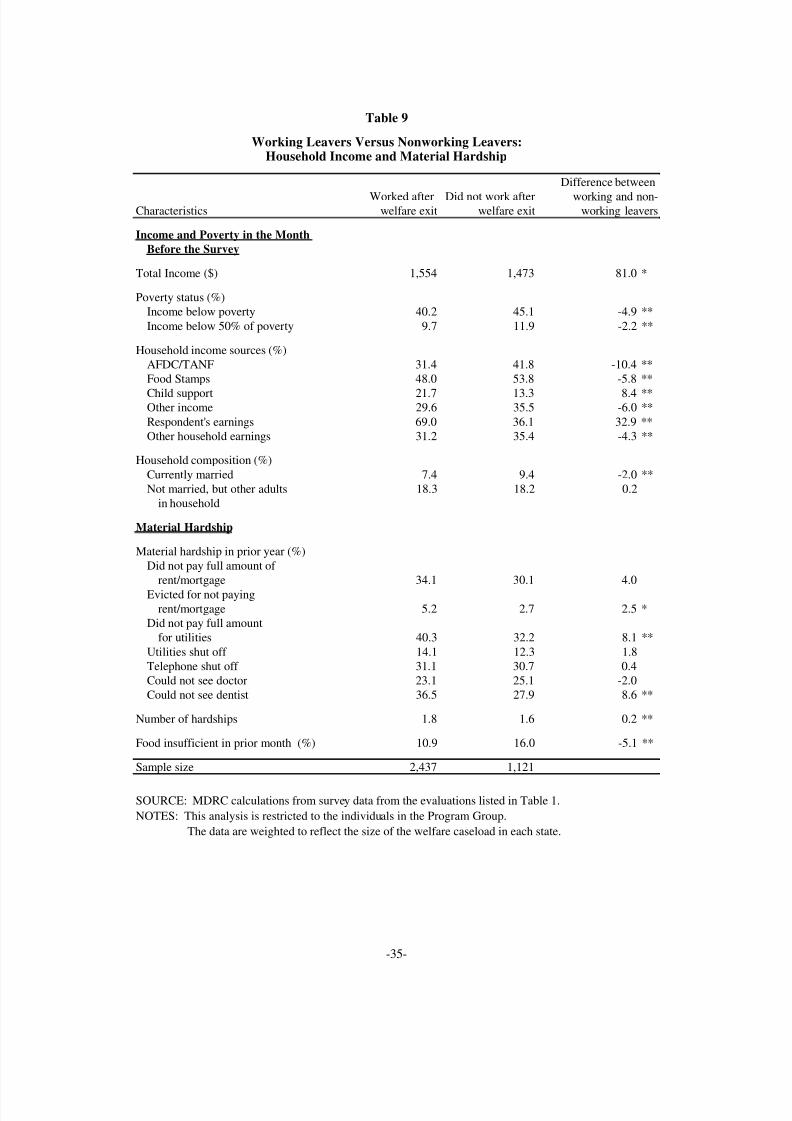
8/14/2019 Health and Human Services: Miller-MDRC-02
http://slidepdf.com/reader/full/health-and-human-services-miller-mdrc-02 49/68
-35-
Worked after Did not work afterCharacteristics welfare exit welfare exit
Income and Poverty in the Month
Before the Survey
Total Income ($) 1,554 1,473 81.0 *
Poverty status (%)Income below poverty 40.2 45.1 -4.9 **
Income below 50% of poverty 9.7 11.9 -2.2 **
Household income sources (%)AFDC/TANF 31.4 41.8 -10.4 **Food Stamps 48.0 53.8 -5.8 **
Child support 21.7 13.3 8.4 **Other income 29.6 35.5 -6.0 **
Respondent's earnings 69.0 36.1 32.9 **Other household earnings 31.2 35.4 -4.3 **
Household composition (%)
Currently married 7.4 9.4 -2.0 **Not married, but other adults 18.3 18.2 0.2
in household
Material Hardship
Material hardship in prior year (%)Did not pay full amount of
rent/mortgage 34.1 30.1 4.0
Evicted for not payingrent/mortgage 5.2 2.7 2.5 *
Did not pay full amountfor utilities 40.3 32.2 8.1 **
Utilities shut off 14.1 12.3 1.8Telephone shut off 31.1 30.7 0.4Could not see doctor 23.1 25.1 -2.0Could not see dentist 36.5 27.9 8.6 **
Number of hardships 1.8 1.6 0.2 **
Food insufficient in prior month (%) 10.9 16.0 -5.1 **
Sample size 2,437 1,121
working and non-working leavers
Working Leavers Versus Nonworking Leavers:
Table 9
Household Income and Material Hardship
Difference between
SOURCE: MDRC calculations from survey data from the evaluations listed in Table 1.
NOTES: This analysis is restricted to the individuals in the Program Group.
The data are weighted to reflect the size of the welfare caseload in each state.
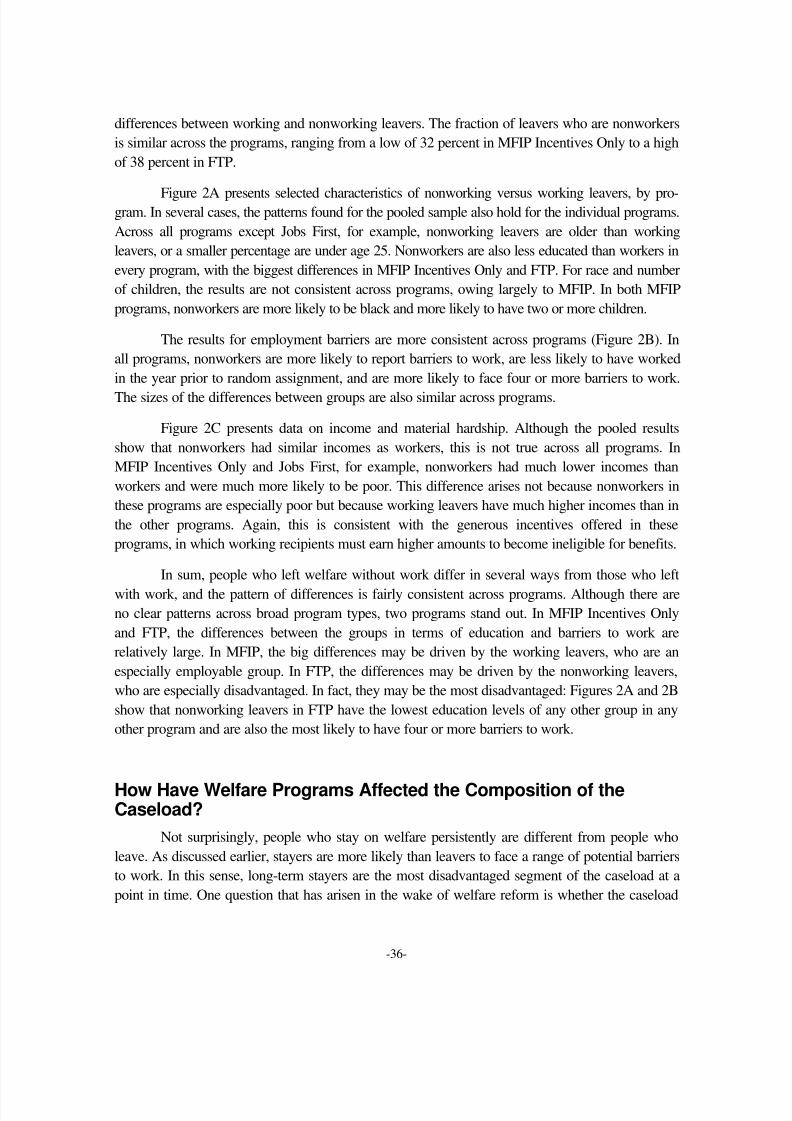
8/14/2019 Health and Human Services: Miller-MDRC-02
http://slidepdf.com/reader/full/health-and-human-services-miller-mdrc-02 50/68
-36-
differences between working and nonworking leavers. The fraction of leavers who are nonworkers
is similar across the programs, ranging from a low of 32 percent in MFIP Incentives Only to a high
of 38 percent in FTP.
Figure 2A presents selected characteristics of nonworking versus working leavers, by pro-gram. In several cases, the patterns found for the pooled sample also hold for the individual programs.
Across all programs except Jobs First, for example, nonworking leavers are older than working
leavers, or a smaller percentage are under age 25. Nonworkers are also less educated than workers in
every program, with the biggest differences in MFIP Incentives Only and FTP. For race and number
of children, the results are not consistent across programs, owing largely to MFIP. In both MFIP
programs, nonworkers are more likely to be black and more likely to have two or more children.
The results for employment barriers are more consistent across programs (Figure 2B). In
all programs, nonworkers are more likely to report barriers to work, are less likely to have worked
in the year prior to random assignment, and are more likely to face four or more barriers to work.
The sizes of the differences between groups are also similar across programs.
Figure 2C presents data on income and material hardship. Although the pooled results
show that nonworkers had similar incomes as workers, this is not true across all programs. In
MFIP Incentives Only and Jobs First, for example, nonworkers had much lower incomes than
workers and were much more likely to be poor. This difference arises not because nonworkers in
these programs are especially poor but because working leavers have much higher incomes than in
the other programs. Again, this is consistent with the generous incentives offered in these
programs, in which working recipients must earn higher amounts to become ineligible for benefits.
In sum, people who left welfare without work differ in several ways from those who left
with work, and the pattern of differences is fairly consistent across programs. Although there are
no clear patterns across broad program types, two programs stand out. In MFIP Incentives Only
and FTP, the differences between the groups in terms of education and barriers to work are
relatively large. In MFIP, the big differences may be driven by the working leavers, who are an
especially employable group. In FTP, the differences may be driven by the nonworking leavers,
who are especially disadvantaged. In fact, they may be the most disadvantaged: Figures 2A and 2B
show that nonworking leavers in FTP have the lowest education levels of any other group in any
other program and are also the most likely to have four or more barriers to work.
How Have Welfare Programs Affected the Composition of theCaseload?
Not surprisingly, people who stay on welfare persistently are different from people who
leave. As discussed earlier, stayers are more likely than leavers to face a range of potential barriers
to work. In this sense, long-term stayers are the most disadvantaged segment of the caseload at a
point in time. One question that has arisen in the wake of welfare reform is whether the caseload
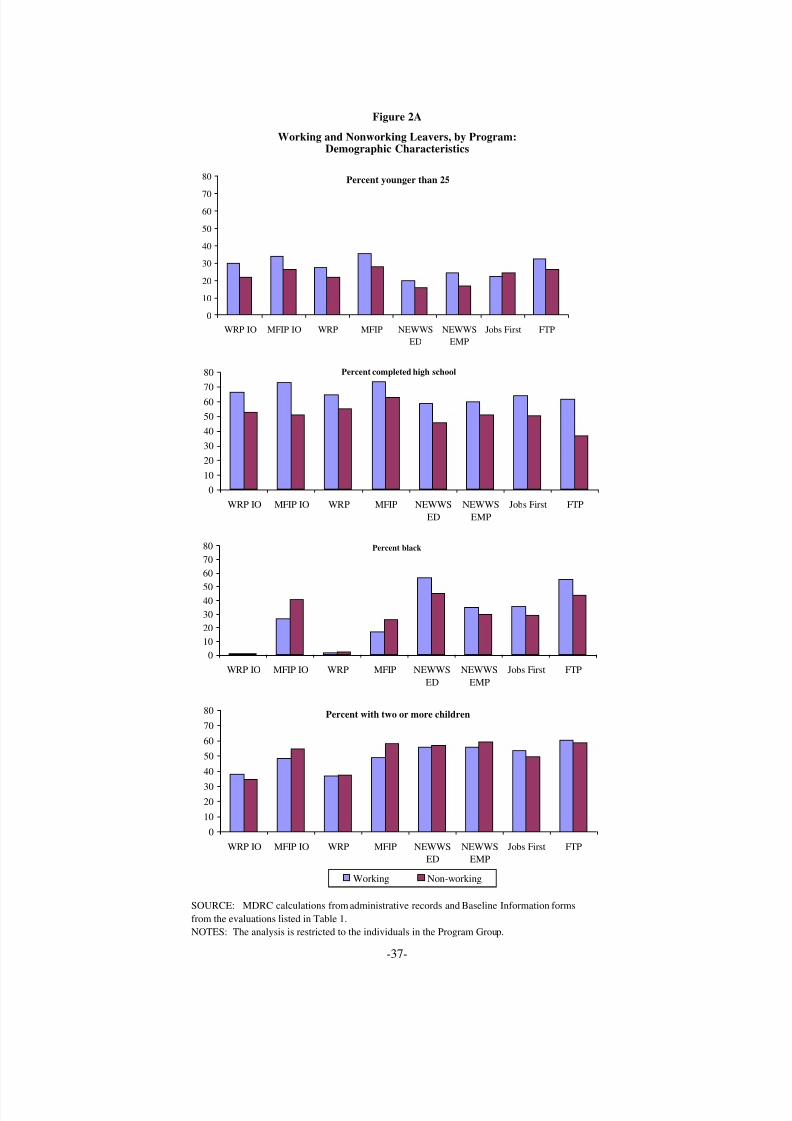
8/14/2019 Health and Human Services: Miller-MDRC-02
http://slidepdf.com/reader/full/health-and-human-services-miller-mdrc-02 51/68
-37-
Figure 2A
Working and Nonworking Leavers, by Program:Demographic Characteristics
Percent younger than 25
0
10
20
30
40
50
60
70
80
WRP IO MFIP IO WRP MFIP NEWWS
ED
NEWWS
EMP
Jobs First FTP
Percent completed high school
0
10
20
30
40
50
60
70
80
WRP IO MFIP IO WRP MFIP NEWWS
ED
NEWWS
EMP
Jobs First FTP
Percent black
0
10
20
30
4050
60
70
80
WRP IO MFIP IO WRP MFIP NEWWS
ED
NEWWS
EMP
Jobs First FTP
Percent with two or more children
0
10
20
30
40
50
60
70
80
WRP IO MFIP IO WRP MFIP NEWWS
ED
NEWWS
EMP
Jobs First FTP
Working Non-working
SOURCE: MDRC calculations from administrative records and Baseline Information forms
from the evaluations listed in Table 1.
NOTES: The analysis is restricted to the individuals in the Program Group.
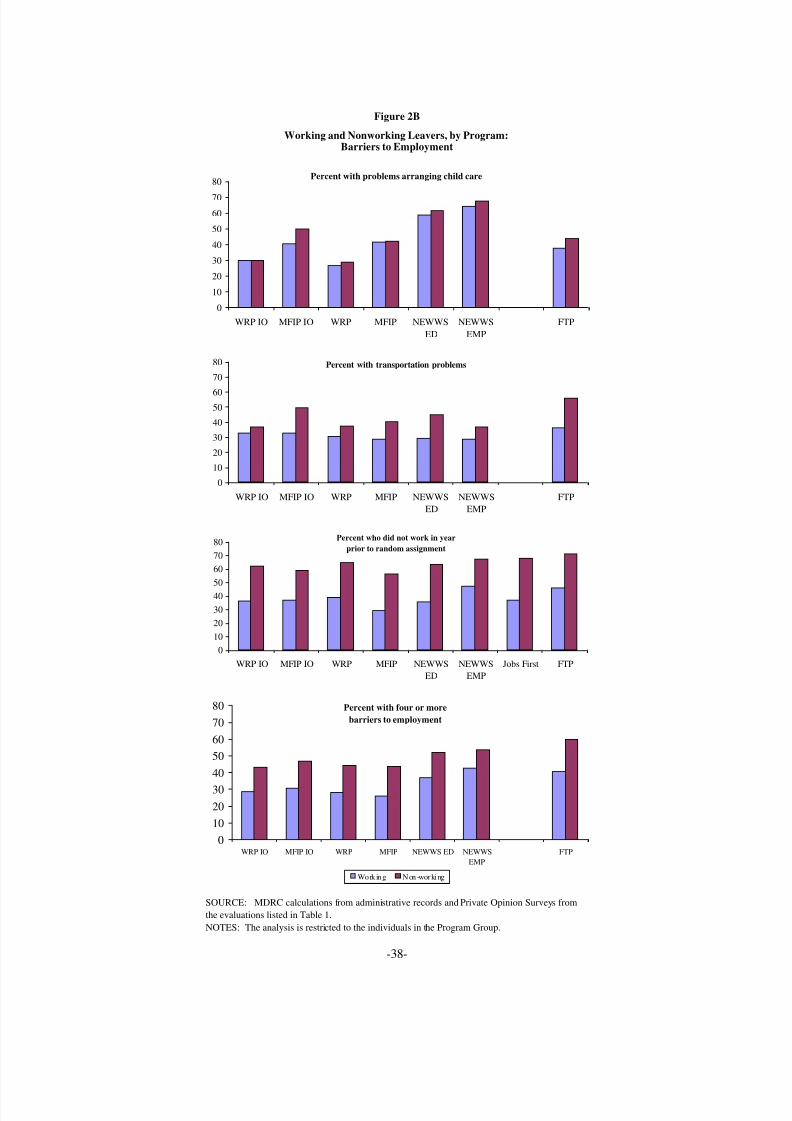
8/14/2019 Health and Human Services: Miller-MDRC-02
http://slidepdf.com/reader/full/health-and-human-services-miller-mdrc-02 52/68
-38-
Figure 2B
Working and Nonworking Leavers, by Program:Barriers to Employment
Percent with problems arranging child care
0
10
20
30
40
50
60
70
80
WRP IO MFIP IO WRP MFIP NEWWS
ED
NEWWS
EMP
FTP
Percent with transportation problems
0
10
20
30
40
5060
70
80
WRP IO MFIP IO WRP MFIP NEWWS
ED
NEWWS
EMP
FTP
Percent who did not work in year
prior to random assignment
0
10
20
30
40
50
60
70
80
WRP IO MFIP IO WRP MFIP NEWWS
ED
NEWWS
EMP
Jobs First FTP
Percent with four or more
barriers to employment
0
10
20
30
40
50
60
70
80
WRP IO MFIP IO WRP MFIP NEWWS ED NEWWS
EMP
FTP
Work ing Non-working
SOURCE: MDRC calculations from administrative records and Private Opinion Surveys from
the evaluations listed in Table 1.
NOTES: The analysis is restricted to the individuals in the Program Group.
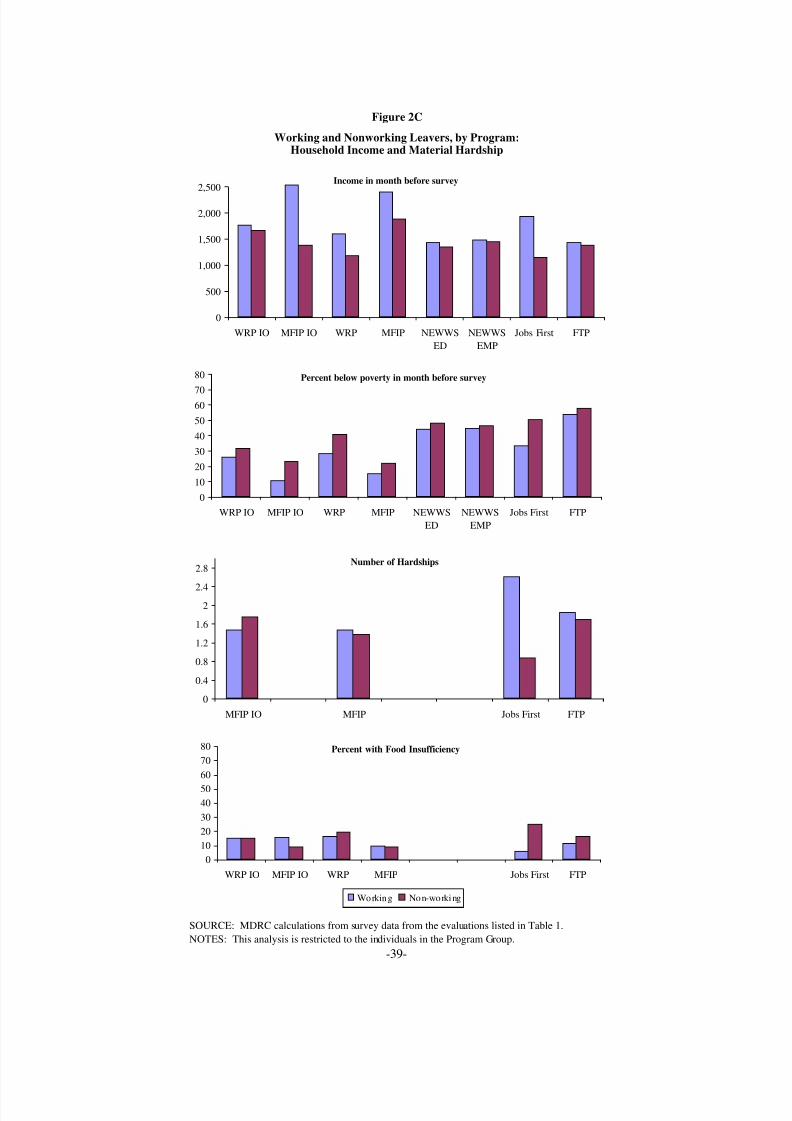
8/14/2019 Health and Human Services: Miller-MDRC-02
http://slidepdf.com/reader/full/health-and-human-services-miller-mdrc-02 53/68
-39-
Figure 2C
Working and Nonworking Leavers, by Program:Household Income and Material Hardship
Income in month before survey
0
500
1,000
1,500
2,000
2,500
WRP IO MFIP IO WRP MFIP NEWWS
ED
NEWWS
EMP
Jobs First FTP
Percent below poverty in month before survey
0
10
20
30
40
50
6070
80
WRP IO MFIP IO WRP MFIP NEWWS
ED
NEWWS
EMP
Jobs First FTP
Number of Hardships
0
0.4
0.8
1.2
1.6
2
2.4
2.8
MFIP IO MFIP Jobs First FTP
Percent with Food Insufficiency
0
10
20
30
40
50
60
70
80
WRP IO MFIP IO WRP MFIP Jobs First FTP
Working Non-working
SOURCE: MDRC calculations from survey data from the evaluations listed in Table 1.
NOTES: This analysis is restricted to the individuals in the Program Group.
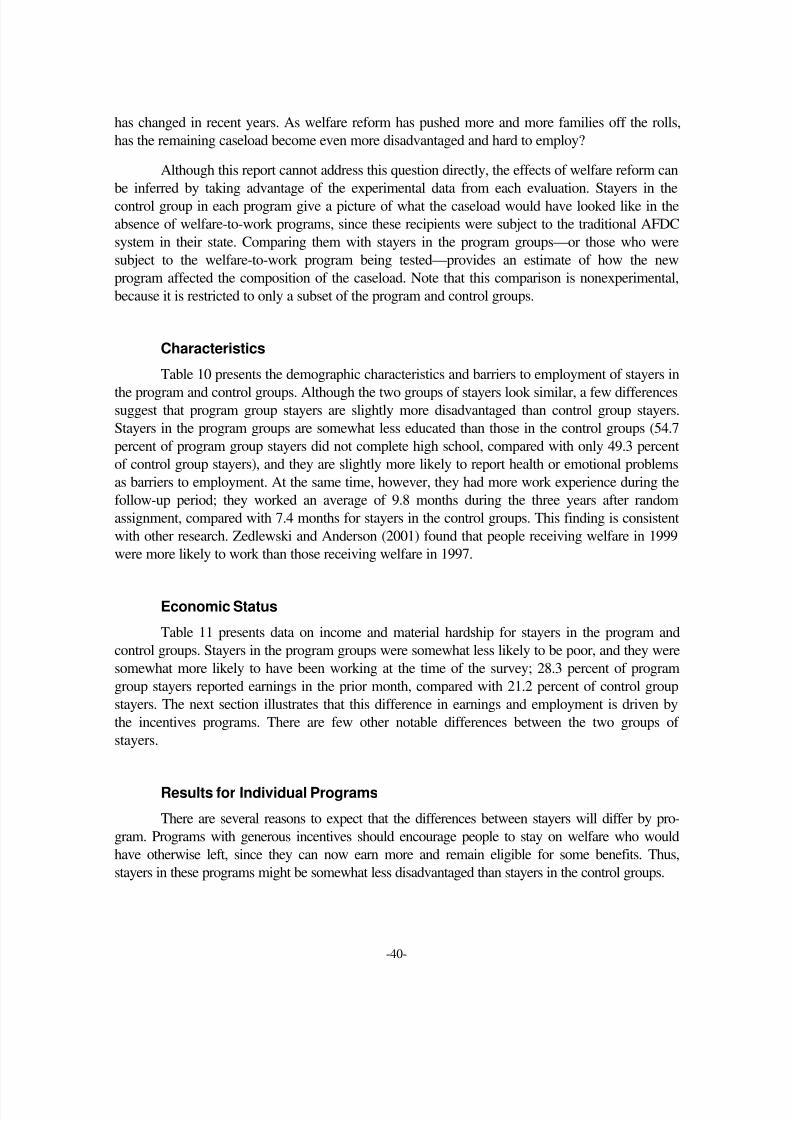
8/14/2019 Health and Human Services: Miller-MDRC-02
http://slidepdf.com/reader/full/health-and-human-services-miller-mdrc-02 54/68
-40-
has changed in recent years. As welfare reform has pushed more and more families off the rolls,
has the remaining caseload become even more disadvantaged and hard to employ?
Although this report cannot address this question directly, the effects of welfare reform can
be inferred by taking advantage of the experimental data from each evaluation. Stayers in the
control group in each program give a picture of what the caseload would have looked like in the
absence of welfare-to-work programs, since these recipients were subject to the traditional AFDC
system in their state. Comparing them with stayers in the program groups—or those who were
subject to the welfare-to-work program being tested—provides an estimate of how the new
program affected the composition of the caseload. Note that this comparison is nonexperimental,
because it is restricted to only a subset of the program and control groups.
Characteristics
Table 10 presents the demographic characteristics and barriers to employment of stayers in
the program and control groups. Although the two groups of stayers look similar, a few differencessuggest that program group stayers are slightly more disadvantaged than control group stayers.
Stayers in the program groups are somewhat less educated than those in the control groups (54.7
percent of program group stayers did not complete high school, compared with only 49.3 percent
of control group stayers), and they are slightly more likely to report health or emotional problems
as barriers to employment. At the same time, however, they had more work experience during the
follow-up period; they worked an average of 9.8 months during the three years after random
assignment, compared with 7.4 months for stayers in the control groups. This finding is consistent
with other research. Zedlewski and Anderson (2001) found that people receiving welfare in 1999
were more likely to work than those receiving welfare in 1997.
Economic Status
Table 11 presents data on income and material hardship for stayers in the program and
control groups. Stayers in the program groups were somewhat less likely to be poor, and they were
somewhat more likely to have been working at the time of the survey; 28.3 percent of program
group stayers reported earnings in the prior month, compared with 21.2 percent of control group
stayers. The next section illustrates that this difference in earnings and employment is driven by
the incentives programs. There are few other notable differences between the two groups of
stayers.
Results for Individual Programs
There are several reasons to expect that the differences between stayers will differ by pro-
gram. Programs with generous incentives should encourage people to stay on welfare who would
have otherwise left, since they can now earn more and remain eligible for some benefits. Thus,
stayers in these programs might be somewhat less disadvantaged than stayers in the control groups.
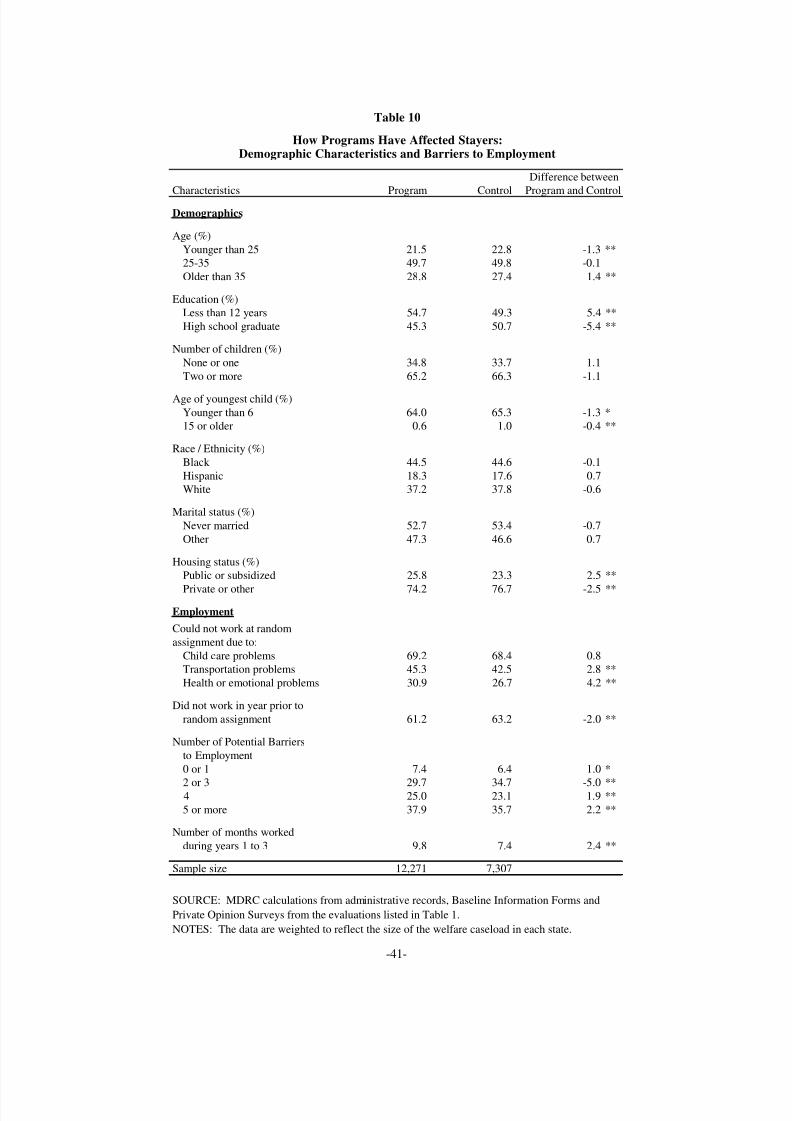
8/14/2019 Health and Human Services: Miller-MDRC-02
http://slidepdf.com/reader/full/health-and-human-services-miller-mdrc-02 55/68
-41-
Characteristics Program ControlDemographics
Age (%)
Younger than 25 21.5 22.8 -1.3 **25-35 49.7 49.8 -0.1
Older than 35 28.8 27.4 1.4 **
Education (%)Less than 12 years 54.7 49.3 5.4 **
High school graduate 45.3 50.7 -5.4 **
Number of children (%)
None or one 34.8 33.7 1.1
Two or more 65.2 66.3 -1.1
Age of youngest child (%)
Younger than 6 64.0 65.3 -1.3 *15 or older 0.6 1.0 -0.4 **
Race / Ethnicity (%)
Black 44.5 44.6 -0.1
Hispanic 18.3 17.6 0.7White 37.2 37.8 -0.6
Marital status (%)
Never married 52.7 53.4 -0.7
Other 47.3 46.6 0.7
Housing status (%)Public or subsidized 25.8 23.3 2.5 **
Private or other 74.2 76.7 -2.5 **
Employment
Could not work at random
assignment due to:
Child care problems 69.2 68.4 0.8Transportation problems 45.3 42.5 2.8 **
Health or emotional problems 30.9 26.7 4.2 **
Did not work in year prior to
random assignment 61.2 63.2 -2.0 **
Number of Potential Barriers
to Employment
0 or 1 7.4 6.4 1.0 *
2 or 3 29.7 34.7 -5.0 **4 25.0 23.1 1.9 **
5 or more 37.9 35.7 2.2 **
Number of months worked
during years 1 to 3 9.8 7.4 2.4 **
Sample size 12,271 7,307
Program and Control
How Programs Have Affected Stayers:
Table 10
Demographic Characteristics and Barriers to Employment
Difference between
SOURCE: MDRC calculations from administrative records, Baseline Information Forms and
Private Opinion Surveys from the evaluations listed in Table 1.
NOTES: The data are weighted to reflect the size of the welfare caseload in each state.
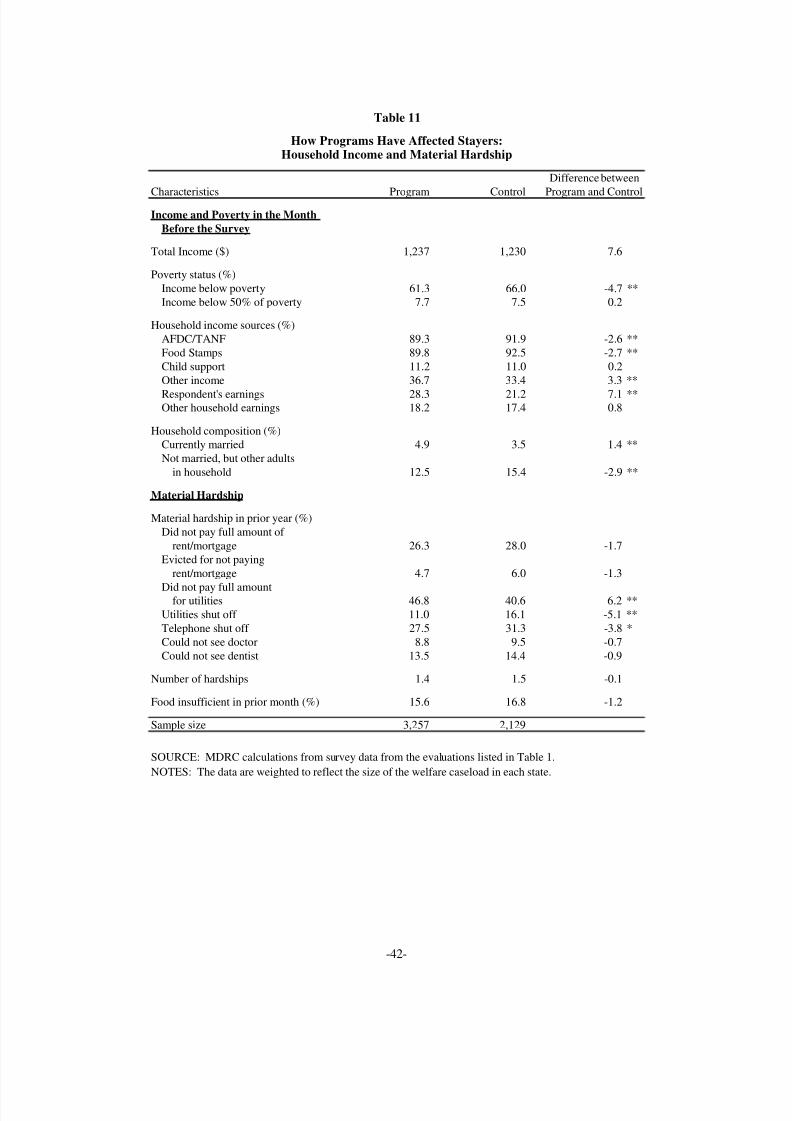
8/14/2019 Health and Human Services: Miller-MDRC-02
http://slidepdf.com/reader/full/health-and-human-services-miller-mdrc-02 56/68
-42-
Characteristics Program Control
Income and Poverty in the Month
Before the Survey
Total Income ($) 1,237 1,230 7.6
Poverty status (%)
Income below poverty 61.3 66.0 -4.7 **Income below 50% of poverty 7.7 7.5 0.2
Household income sources (%)
AFDC/TANF 89.3 91.9 -2.6 **
Food Stamps 89.8 92.5 -2.7 **
Child support 11.2 11.0 0.2
Other income 36.7 33.4 3.3 **
Respondent's earnings 28.3 21.2 7.1 **Other household earnings 18.2 17.4 0.8
Household composition (%)Currently married 4.9 3.5 1.4 **
Not married, but other adults
in household 12.5 15.4 -2.9 **
Material Hardship
Material hardship in prior year (%)
Did not pay full amount of
rent/mortgage 26.3 28.0 -1.7
Evicted for not paying
rent/mortgage 4.7 6.0 -1.3
Did not pay full amountfor utilities 46.8 40.6 6.2 **
Utilities shut off 11.0 16.1 -5.1 **
Telephone shut off 27.5 31.3 -3.8 *
Could not see doctor 8.8 9.5 -0.7
Could not see dentist 13.5 14.4 -0.9
Number of hardships 1.4 1.5 -0.1
Food insufficient in prior month (%) 15.6 16.8 -1.2
Sample size 3,257 2,129
Difference between
Program and Control
Table 11
How Programs Have Affected Stayers:Household Income and Material Hardship
SOURCE: MDRC calculations from survey data from the evaluations listed in Table 1.
NOTES: The data are weighted to reflect the size of the welfare caseload in each state.
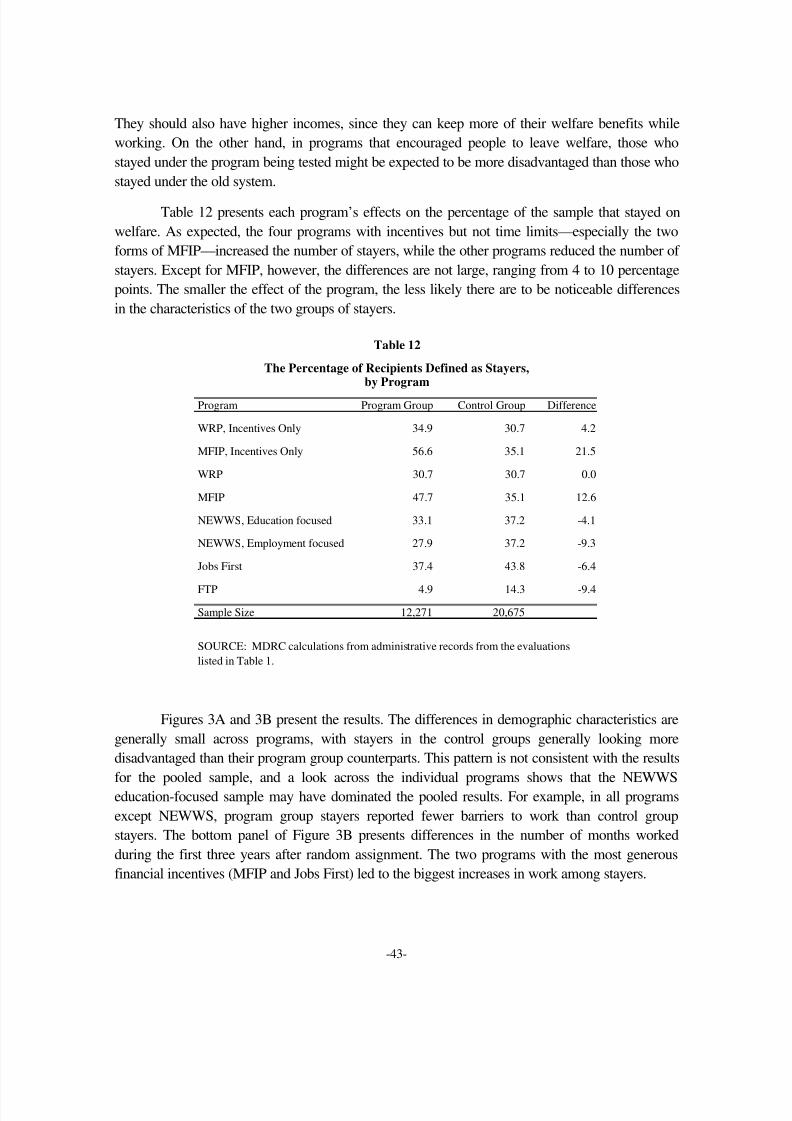
8/14/2019 Health and Human Services: Miller-MDRC-02
http://slidepdf.com/reader/full/health-and-human-services-miller-mdrc-02 57/68
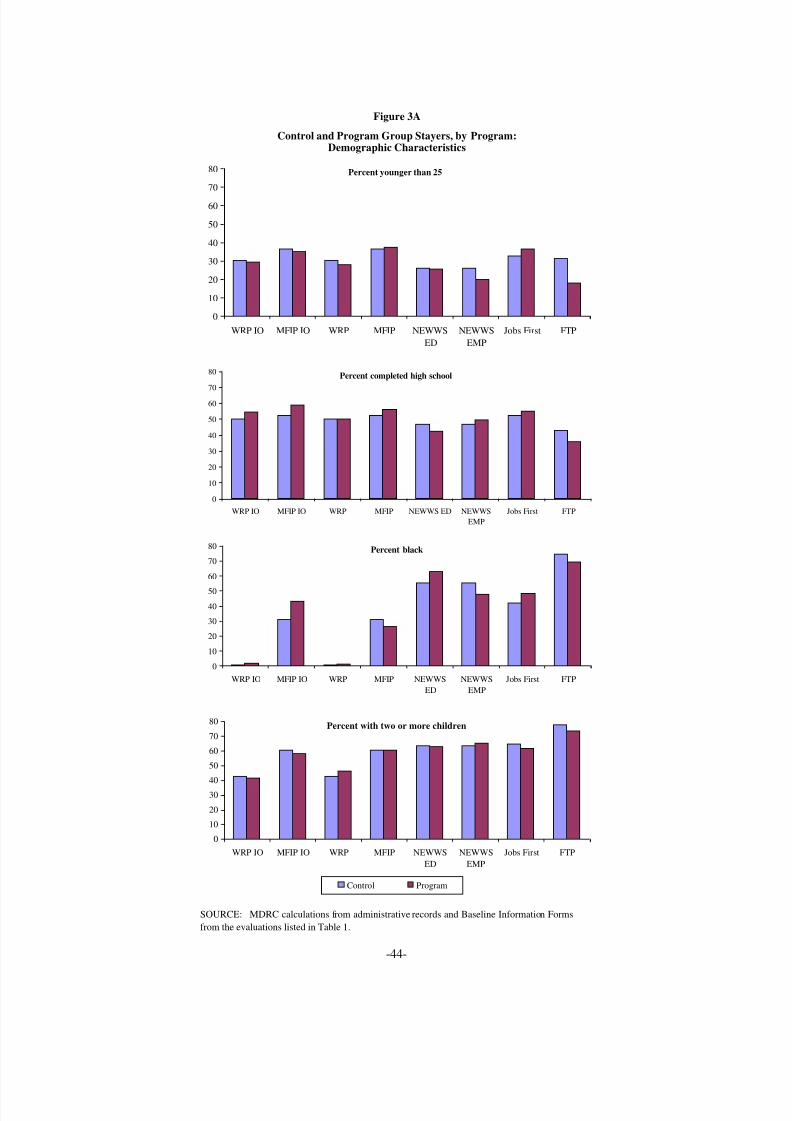
8/14/2019 Health and Human Services: Miller-MDRC-02
http://slidepdf.com/reader/full/health-and-human-services-miller-mdrc-02 58/68
-44-
Figure 3A
Control and Program Group Stayers, by Program:Demographic Characteristics
Percent younger than 25
0
10
20
30
40
50
60
70
80
WRP IO MFIP IO WRP MFIP NEWWS
ED
NEWWS
EMP
Jobs First FTP
Percent completed high school
0
10
20
30
40
50
60
70
80
WRP IO MFIP IO WRP MFIP NEWWS ED NEWWS
EMP
Jobs First FTP
Percent black
0
10
20
30
40
50
60
70
80
WRP IO MFIP IO WRP MFIP NEWWS
ED
NEWWS
EMP
Jobs First FTP
Percent with two or more children
0
10
20
30
40
50
60
70
80
WRP IO MFIP IO WRP MFIP NEWWS
ED
NEWWS
EMP
Jobs First FTP
Control Program
SOURCE: MDRC calculations from administrative records and Baseline Information Forms
from the evaluations listed in Table 1.
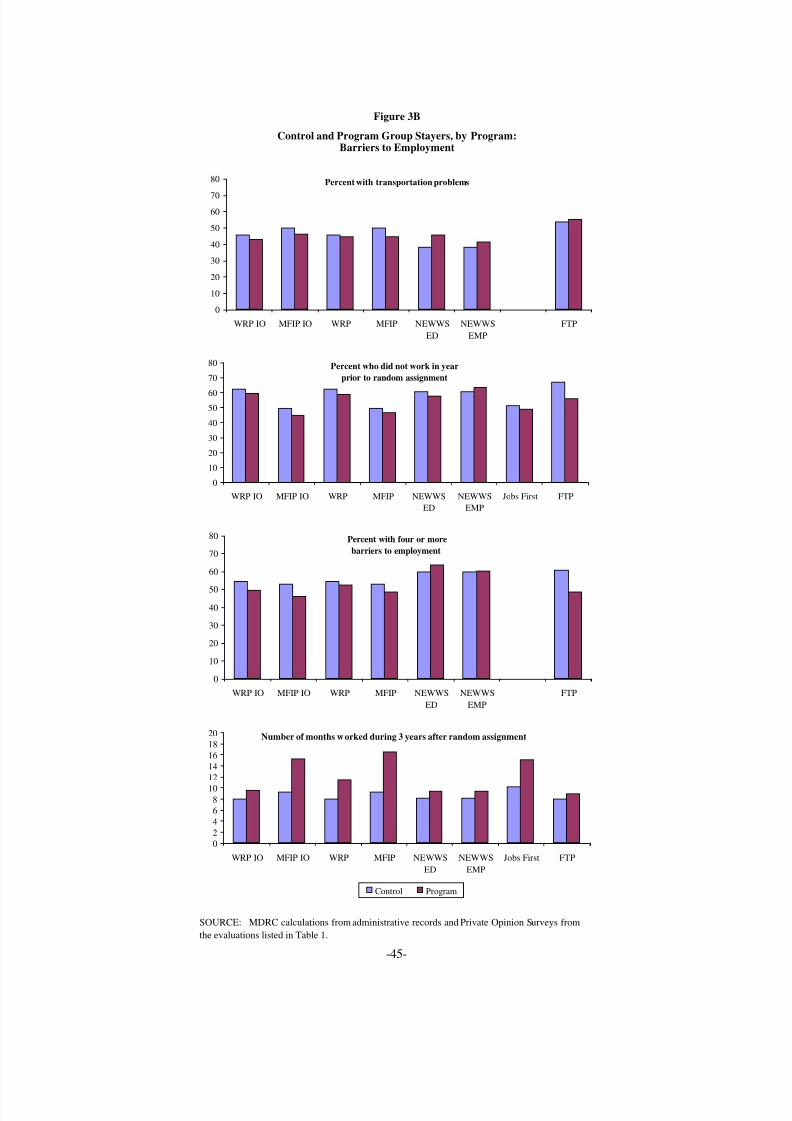
8/14/2019 Health and Human Services: Miller-MDRC-02
http://slidepdf.com/reader/full/health-and-human-services-miller-mdrc-02 59/68
-45-
Figure 3B
Control and Program Group Stayers, by Program:Barriers to Employment
Percent with transportation problems
0
10
20
30
40
50
60
70
80
WRP IO MFIP IO WRP MFIP NEWWS
ED
NEWWS
EMP
FTP
Percent who did not work in year
prior to random assignment
0
10
20
30
40
50
60
70
80
WRP IO MFIP IO WRP MFIP NEWWS
ED
NEWWS
EMP
Jobs First FTP
Percent with four or more
barriers to employment
0
10
20
30
40
50
60
70
80
WRP IO MFIP IO WRP MFIP NEWWS
ED
NEWWS
EMP
FTP
Number of months worked during 3 years after random assignment
0
2
4
6
810
12
14
16
18
20
WRP IO MFIP IO WRP MFIP NEWWS
ED
NEWWS
EMP
Jobs First FTP
Control Program
SOURCE: MDRC calculations from administrative records and Private Opinion Surveys from
the evaluations listed in Table 1.
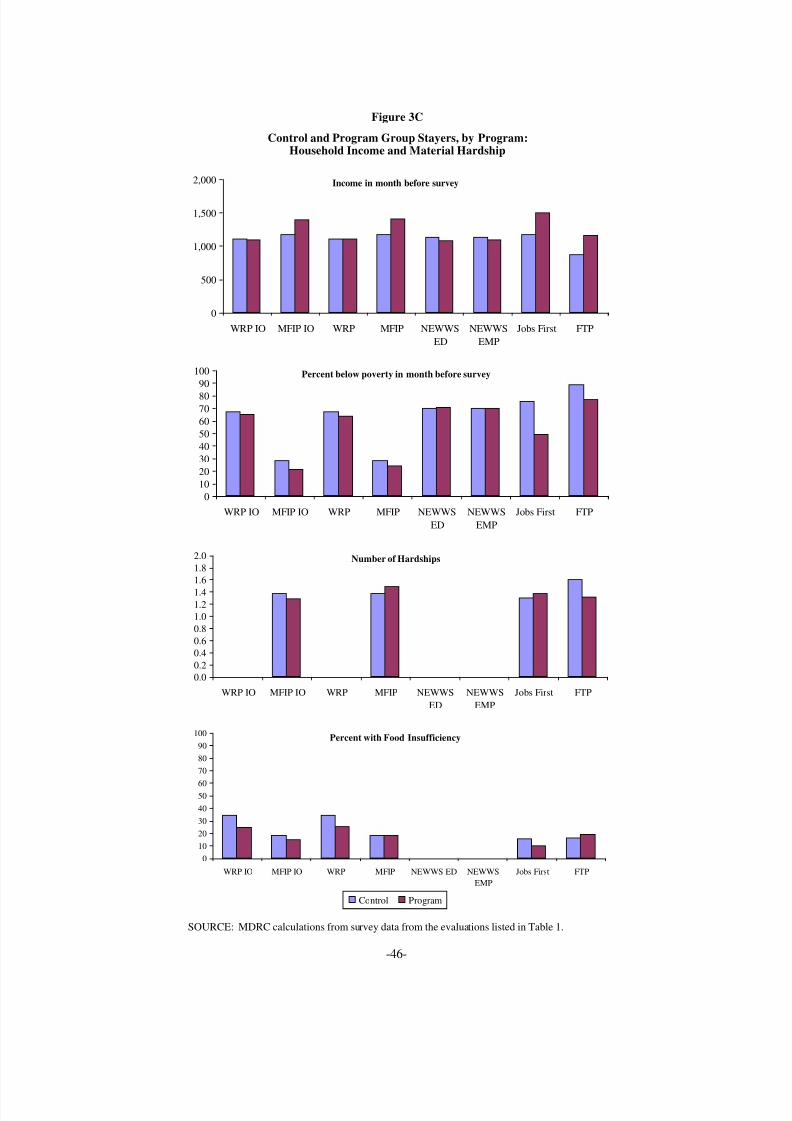
8/14/2019 Health and Human Services: Miller-MDRC-02
http://slidepdf.com/reader/full/health-and-human-services-miller-mdrc-02 60/68
-46-
Figure 3C
Control and Program Group Stayers, by Program:Household Income and Material Hardship
Income in month before survey
0
500
1,000
1,500
2,000
WRP IO MFIP IO WRP MFIP NEWWS
ED
NEWWS
EMP
Jobs First FTP
Percent below poverty in month before survey
0
10
20
30
40
50
60
7080
90
100
WRP IO MFIP IO WRP MFIP NEWWS
ED
NEWWS
EMP
Jobs First FTP
Number of Hardships
0.0
0.2
0.4
0.6
0.8
1.0
1.21.4
1.6
1.8
2.0
WRP IO MFIP IO WRP MFIP NEWWS
ED
NEWWS
EMP
Jobs First FTP
Percent with Food Insufficiency
0
10
20
30
40
5060
70
80
90
100
WRP IO MFIP IO WRP MFIP NEWWS ED NEWWS
EMP
Jobs First FTP
Control Program
SOURCE: MDRC calculations from survey data from the evaluations listed in Table 1.
8/14/2019 Health and Human Services: Miller-MDRC-02
http://slidepdf.com/reader/full/health-and-human-services-miller-mdrc-02 61/68
-47-
Figure 3C presents data on stayers’ income and material hardship. The generally low pov-
erty rates in Minnesota (MFIP) and the high rates in Florida (FTP) reflect the differences in
welfare benefit levels in these two states. In terms of program-control differences, incomes will
differ between the two groups if one is more likely to work than the other or if one receives more
generous welfare benefits. The biggest differences in income and poverty are for MFIP, FTP, and
Jobs First, where the welfare disregards were the most generous. Program group stayers in Jobs
First—with the most generous incentives—were significantly less likely to be poor than their
control group counterparts.
In sum, the results show that the welfare-to-work programs in general have not left a group
of recipients on the caseload that is more disadvantaged than the group that would have stayed in
the absence of the reforms. This may not be very surprising, given that the programs did not
produce dramatic increases or decreases in welfare receipt. If anything, the stayers in the incentives
programs may have better employment prospects, since they worked more during the follow-up
period. The incentives programs also left stayers better off economically than their control groupcounterparts. Although this may not be related to the ability to eventually leave welfare, increasing
incomes for low-income families can have a range of other positive benefits (Knox, Miller, and
Gennetian, 2000).
Conclusions
This report uses data from several evaluations of welfare-to-work programs to divide the
caseload into three groups: leavers, stayers, and cyclers. The study finds that people who leave
welfare and stay off long term differ in a range of expected ways from people who stay on welfare
persistently. These leavers are more educated, for example, and they face fewer other potentialbarriers to work. They had somewhat higher incomes than stayers, but most were still poor or
near-poor. They were also more likely to have problems with access to health care. The results
highlight the importance of access to post-welfare services, particularly (1) skill-building and
retention services to help former recipients move into better-paying jobs over time and (2) help in
obtaining other benefits for which they are eligible, such as Food Stamps and health insurance.
These types of services may be especially helpful for people who leave welfare because of
reaching a time limit.
Somewhat surprisingly, the group defined as cyclers looks similar to the leaver group in
terms of demographic characteristics and barriers to employment. One-third of the people in the
cycler group had only one short welfare spell during the period. Nonetheless, the remaining cyclers,
who had multiple welfare spells, also look more like leavers than stayers. It is encouraging that these
cyclers do not face more barriers to work than other groups, but the results also highlight the need to
provide families with services after they leave welfare, so that fewer of them need to return.
8/14/2019 Health and Human Services: Miller-MDRC-02
http://slidepdf.com/reader/full/health-and-human-services-miller-mdrc-02 62/68
-48-
About one-third of the people who left welfare were not working when they left, and few of
these people went to work in the subsequent year. One caveat to this finding is that work status is
defined using administrative records from the Unemployment Insurance system, which misses
employment for some workers. Although it is not clear why these people left welfare without work,
most of them did not leave for marriage, and many eventually returned to the rolls. Their lack of work appears to be more closely related to the higher number of employment barriers they face. This is
another group that needs assistance after leaving welfare—assistance finding and keeping jobs.
Finally, consistent with other recent research, there is little evidence that welfare-to-work
programs have affected the composition of the caseload. Stayers in these programs were not more
disadvantaged than stayers who were not in the programs. In fact, stayers in the programs with
generous financial incentives were better off than other stayers; the incentives allowed more of
them to work and still receive benefits, with the result that they had higher incomes. Thus,
enhanced financial incentives, which many states now use, can positively affect the caseload by
increasing incomes and increasing work experience. However, most state programs also includetime limits, which will eventually turn many stayers into leavers. The findings here show that
granting extensions to families who reach a time limit but who have low earnings is one way to
ensure that people are, in fact, better off when they leave welfare.

8/14/2019 Health and Human Services: Miller-MDRC-02
http://slidepdf.com/reader/full/health-and-human-services-miller-mdrc-02 63/68
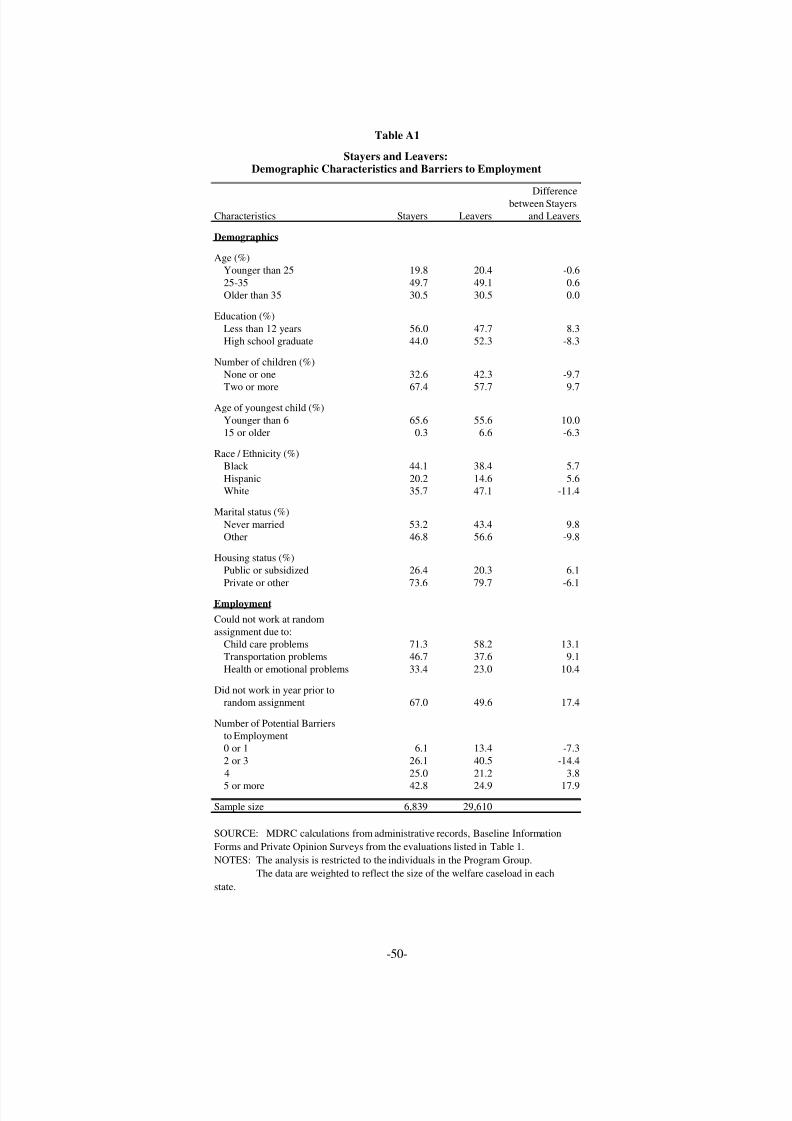
8/14/2019 Health and Human Services: Miller-MDRC-02
http://slidepdf.com/reader/full/health-and-human-services-miller-mdrc-02 64/68
-50-
Differencebetween StayersCharacteristics Stayers Leavers and Leavers
Demographics
Age (%)Younger than 25 19.8 20.4 -0.6
25-35 49.7 49.1 0.6Older than 35 30.5 30.5 0.0
Education (%)
Less than 12 years 56.0 47.7 8.3High school graduate 44.0 52.3 -8.3
Number of children (%)None or one 32.6 42.3 -9.7Two or more 67.4 57.7 9.7
Age of youngest child (%)
Younger than 6 65.6 55.6 10.015 or older 0.3 6.6 -6.3
Race / Ethnicity (%)Black 44.1 38.4 5.7
Hispanic 20.2 14.6 5.6White 35.7 47.1 -11.4
Marital status (%)
Never married 53.2 43.4 9.8Other 46.8 56.6 -9.8
Housing status (%)Public or subsidized 26.4 20.3 6.1
Private or other 73.6 79.7 -6.1
Employment
Could not work at random
assignment due to:Child care problems 71.3 58.2 13.1Transportation problems 46.7 37.6 9.1
Health or emotional problems 33.4 23.0 10.4
Did not work in year prior torandom assignment 67.0 49.6 17.4
Number of Potential Barriersto Employment0 or 1 6.1 13.4 -7.3
2 or 3 26.1 40.5 -14.4
4 25.0 21.2 3.8
5 or more 42.8 24.9 17.9
Sample size 6,839 29,610
Stayers and Leavers:
Table A1
Demographic Characteristics and Barriers to Employment
SOURCE: MDRC calculations from administrative records, Baseline Information
Forms and Private Opinion Surveys from the evaluations listed in Table 1.
NOTES: The analysis is restricted to the individuals in the Program Group.
The data are weighted to reflect the size of the welfare caseload in each
state.
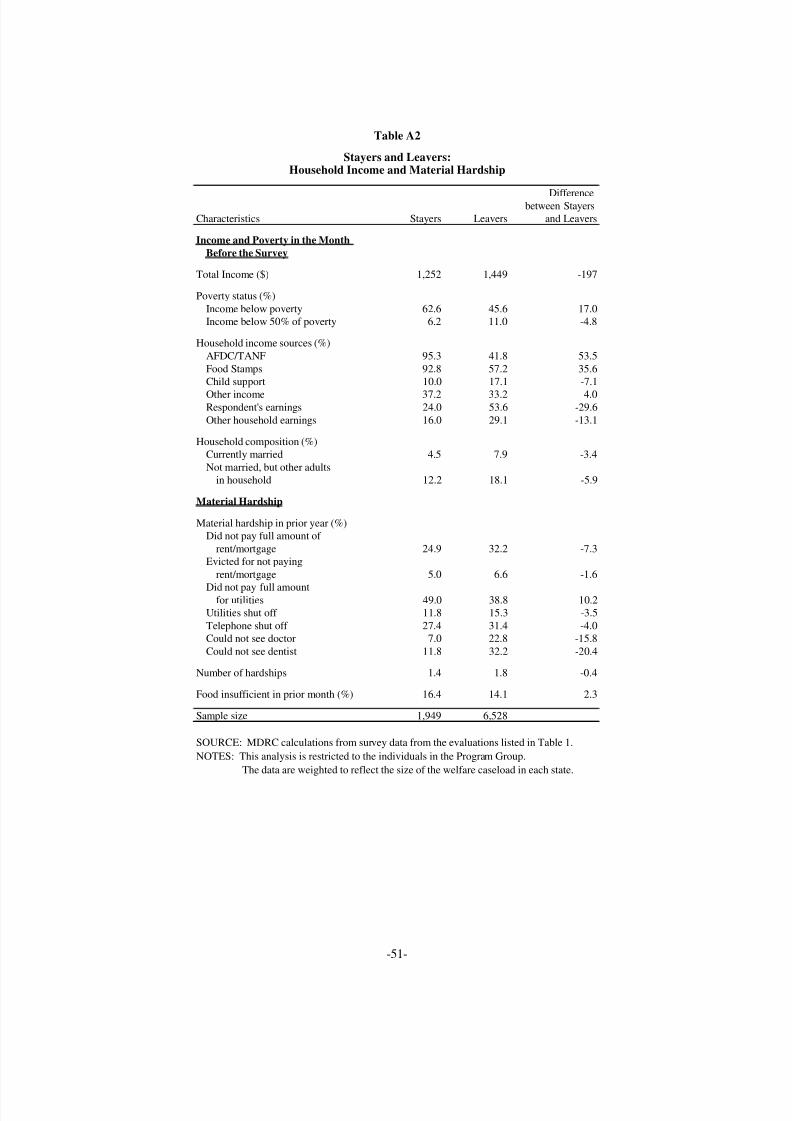
8/14/2019 Health and Human Services: Miller-MDRC-02
http://slidepdf.com/reader/full/health-and-human-services-miller-mdrc-02 65/68
-51-
Table A2
Stayers and Leavers:Household Income and Material Hardship
Differencebetween StayersCharacteristics Stayers Leavers and Leavers
Income and Poverty in the Month
Before the Survey
Total Income ($) 1,252 1,449 -197
Poverty status (%)
Income below poverty 62.6 45.6 17.0Income below 50% of poverty 6.2 11.0 -4.8
Household income sources (%)
AFDC/TANF 95.3 41.8 53.5
Food Stamps 92.8 57.2 35.6Child support 10.0 17.1 -7.1
Other income 37.2 33.2 4.0Respondent's earnings 24.0 53.6 -29.6
Other household earnings 16.0 29.1 -13.1
Household composition (%)Currently married 4.5 7.9 -3.4
Not married, but other adultsin household 12.2 18.1 -5.9
Material Hardship
Material hardship in prior year (%)Did not pay full amount of
rent/mortgage 24.9 32.2 -7.3Evicted for not paying
rent/mortgage 5.0 6.6 -1.6
Did not pay full amountfor utilities 49.0 38.8 10.2
Utilities shut off 11.8 15.3 -3.5
Telephone shut off 27.4 31.4 -4.0Could not see doctor 7.0 22.8 -15.8
Could not see dentist 11.8 32.2 -20.4
Number of hardships 1.4 1.8 -0.4
Food insufficient in prior month (%) 16.4 14.1 2.3
Sample size 1,949 6,528
SOURCE: MDRC calculations from survey data from the evaluations listed in Table 1.
NOTES: This analysis is restricted to the individuals in the Program Group.
The data are weighted to reflect the size of the welfare caseload in each state.

8/14/2019 Health and Human Services: Miller-MDRC-02
http://slidepdf.com/reader/full/health-and-human-services-miller-mdrc-02 66/68
-52-
8/14/2019 Health and Human Services: Miller-MDRC-02
http://slidepdf.com/reader/full/health-and-human-services-miller-mdrc-02 67/68
-53-
References
Acs, Gregory, Pamela Loprest, and Tracy Roberts. 2001. Final Synthesis Report of Findings from ASPE “Leavers” Grants. Washington, DC: The Urban Institute.
Bloom, Dan, Mary Farrell, and Barbara Fink. 2002. Welfare Time Limits: State Policies, Implemen-
tation, and Effects on Families. New York: Manpower Demonstration Research Corporation.
Bloom, Dan, James Kemple, Pamela Morris, Susan Scrivener, Nandita Verma, and Richard Hendra.2000. The Family Transition Program: Final Report on Florida’s Initial Time-Limited Welfare
Program. New York: Manpower Demonstration Research Corporation.
Bloom, Dan, Charles Michalopoulos, Johanna Walter, and Patricia Auspos. 1998. WRP: Implemen-
tation and Early Impacts of Vermont’s Welfare Restructuring Project . New York: ManpowerDemonstration Research Corporation.
Bloom, Dan, Susan Scrivener, Charles Michalopoulos, Pamela Morris, Richard Hendra, DianeAdams-Ciardullo, and Johanna Walter. 2002. Jobs First: Final Report on Connecticut’s Wel-
fare Reform Initiative. New York: Manpower Demonstration Research Corporation.
Brauner, Sarah, and Pamela Loprest. 1999. “Where Are They Now? What States’ Studies of PeopleWho Left Welfare Tell Us.” Assessing the New Federalism. Series A, No. A-32. Washington,DC: The Urban Institute.
Cancian, Maria, Robert Haveman, Daniel Meyer, and Barbara Wolfe. 2000. Before and After
TANF: The Economic Well-Being of Women Leaving Welfare. IRP Special Report #77. Madi-son: University of Wisconsin, Institute for Research on Poverty.
Council of Economic Advisors. 1999. The Effects of Welfare Policy and the Economic Expansion
on Welfare Caseloads: An Update. Washington, DC: Council of Economic Advisors.
Danziger, Sandra, Mary Corcoran, Sheldon Danziger, Colleen Heflin, Ariel Kalil, Judith Levine,Daniel Rosen, Kristin Seefeldt, Kristine Siefert, and Richard Tolman. 1999. Barriers to the
Employment of Welfare Recipients. Ann Arbor: University of Michigan, Poverty Research andTraining Center.
Hamilton, Gayle. 2002. Moving People from Welfare to Work: Lessons from the National
Evaluation of Welfare-to-Work Strategies. New York: Manpower Demonstration ResearchCorporation.
Isaacs, Julia, and Matthew Lyon. 2000. A Cross-State Examination of Families Leaving Welfare:
Findings from the ASPE-Funded Leavers Studies. Washington, DC: U.S. Department of Health and Human Services, Office of the Assistant Secretary for Planning and Evaluation,
Division of Data and Technical Analysis.
Knox, Virginia, Cynthia Miller, and Lisa Gennetian. 2000. Reforming Welfare and Rewarding
Work: A Summary of the Final Report on the Minnesota Family Investment Program. NewYork: Manpower Demonstration Research Corporation.
8/14/2019 Health and Human Services: Miller-MDRC-02
http://slidepdf.com/reader/full/health-and-human-services-miller-mdrc-02 68/68
Loprest, Pamela. 1999. “Families Who Left Welfare: Who Are They and How Are They Doing?”Assessing the New Federalism. Discussion Paper 99-02. Washington, DC: The Urban Institute.
Loprest, Pamela. 2001. “How Are Families That Left Welfare Doing? A Comparison of Early and
Recent Welfare Leavers.” Assessing the New Federalism. Series B, No. B-36. Washington,DC: The Urban Institute,
Loprest, Pamela, and Sheila Zedlewski. 1999. “Current and Former Welfare Recipients: How DoThey Differ?” Assessing the New Federalism. Discussion Paper 99-17. Washington, DC: TheUrban Institute.
Miller, Cynthia, Cindy Redcross, and Christian Henrichson. 2002. Food Stamp Use Among Former
Welfare Recipients. New York: Manpower Demonstration Research Corporation.
Moffitt, Robert, and Jennifer Roff. 2000. “The Diversity of Welfare Leavers.” Welfare, Children &Families: A Three City Study. Policy Brief 00-2. Baltimore: Johns Hopkins University.
Oellerich, Donald. 2001. Welfare Reform: Caseload Trends, Program Entrants and Recipients.
Washington, DC: U.S. Department of Health and Human Services.
Office of the Assistant Secretary for Planning and Evaluation, U.S. Department of Health andHuman Services. 2001. Status Report on Research on the Outcomes of Welfare Reform. Wash-ington, DC: U.S. Department of Health and Human Services. Available athttp://aspe.hhs.gov/hsp/welf-ref-outcomes01/index.htm.
Quint, Janet, and Rebecca Widom. 2001. Post-TANF Food Stamp and Medicaid Benefits: Factors
That Aid or Impede Their Receipt . New York: Manpower Demonstration Research Corporation.
Verma, Nandita, and Claudia Colton. 2001. Monitoring Outcomes for Cuyahoga County’s Welfare
Leavers: How Are They Faring? New York: Manpower Demonstration Research Corporation.Also available at http://www.aspe.hhs.gov/hsp/leavers99/reports.htm#oh.
Wallace, Goeffrey, and Rebecca Blank. 1999. “What Goes Up Must Come Down? ExplainingRecent Changes in Public Assistance Caseloads.” In Sheldon Danziger, ed., Economic Condi-
tions and Welfare Reform. Kalamazoo, MI: Upjohn Institute.
Zedlewski, Sheila, and Donald Anderson. 2001. “Before and After Reform: How Have Families onWelfare Changed?” Assessing the New Federalism. Series B, No. B-32. Washington, DC: TheUrban Institute.