Embed Size (px)
Citation preview

T e x t i l e M i l l s L i m i t e d
Half Yearly Report
Condensed Interim Financial Information For The Half Year Ended December 31, 2011

Company Information
BOARD OF DIRECTORS BASHIR ALI MOHOMMAD - Chairman & Chief ExecutiveZAIN BASHIR - Non Executive DirectorZIAD BASHIR - Executive DirectorMOHAMMED ZAKI BASHIR - Executive DirectorABDUL AZIZ YOUSUF - Executive DirectorS.M. NADIM SHAFIQULLAH - Independent Non Executive DirectorABDUL RAZAK BRAMCHARI - Non Executive DirectorDR. AMJAD WAHEED - Independent Non Executive DirectorADNAN AFRIDI - Independent Non Executive Director
CHIEF FINANCIAL OFFICER MOHAMMED SALEEM SATTAR
COMPANY SECRETARY MOHAMMED SALIM GHAFFAR
AUDIT COMMITTEE S.M. NADIM SHAFIQULLAH - Chairman & MemberZAIN BASHIR - MemberMOHAMMED ZAKI BASHIR - MemberABDUL AZIZ YOUSUF - Secretary
BANKERS ALLIED BANK LIMITEDBANK AL HABIB LIMITEDBARCLAYS BANK PLC PAKISTANBANK ALFALAH LIMITED - ISLAMIC BANKINGBANKISLAMI PAKISTAN LIMITEDCITIBANK, N.A.DUBAI ISLAMIC BANK PAKISTAN LIMITEDFAYSAL BANK LIMITEDHABIB BANK LIMITEDHABIB METROPOLITAN BANK LIMITEDHSBC BANK MIDDLE EAST LIMITEDMCB BANK LIMITEDMEEZAN BANK LIMITEDNATIONAL BANK OF PAKISTANNATIONAL BANK OF PAKISTANNIB BANK LIMITEDSAMBA BANK LIMITEDSILKBANK LIMITEDSTANDARD CHARTERED BANK (PAKISTAN) LIMITEDUNITED BANK LIMITED
AUDITORS HYDER BHIMJI & CO.Chartered Accountants
INTERNAL AUDITORS ANJUM ASIM SHAHID RAHMANChartered Accountants
LEGAL ADVISORS A.K. BROHI & COADVOCATES
REGISTERED OFFICE PLOT NO.82MAIN NATIONAL HIGHWAYLANDHI, KARACHI-75120
SHARE REGISTRAR FAMCO ASSOCIATES (PRIVATE) LIMITED1ST FLOOR, STATE LIFE BUILDING NO. 1-AOFF: I.I. CHUNDRIGAR ROAD, KARACHI-74000PHONE NO. (021)32427012,32426597 & 32425467FAX NO. (021)32426752
MILLS LANDHI INDUSTRIAL AREAKARACHI-75120
E-MAIL [email protected]
URL www.gulahmed.comHalf Yearly Report 2011 1

Directors’ Review
Directors of Gul Ahmed Textile Mills Limited are pleased to present review of the affairs of the Company for the half year ended December 31, 2011. Industrial overview We see no improvement in the domestic economic conditions due to stubborn high inflation, revenue slippage, energy shortage, security and law and order problems, etc. These are compounded by continuing economic slowdown in Europe and America which is adversely impacting the country’s exports. Textile industry is also passing through a very tough phase. There is energy crises – shortage as well as price increase. Even before the industry could absorb the 13.6% % gas price increase in August 2011 another price increases of 17.0% has been thrust upon from January 2012. Cumulative increase since August 2011 works out to 32.8%. Despite the substantial increase in gas price there is gas load shedding due to which production has also suffered. Due to adverse economic conditions in the Company’s export destination countries, Customers have been deferring shipments even on running contracts and as well as offering lower prices for new orders. Competition from Bangladesh due to its lower input costs, government’s support as well as duty free access in Europe (whereas exports to Europe from Pakistan attract 9.6% duty) is also hurting the industry. India is also increasing its capacity by giving a high subsidy to its textile industry. As against the governments support to Bangladesh industry, our Government has withheld the benefits allowed to the industry in its Textile Policy 2009‐2014. Finance cost has also increased due to higher Export Refinance (ERF) rate as compared to the corresponding previous period. Unfortunately the State Bank which fixes both the RRF rate and discount rate has increased the ERF rate and has reduced the discount rate. Moreover the Government has not paid the ERF rate subsidy allowed in the textile policy. Financial Performance Due to reasons explained above sales for the second quarter October – December 2012 have decreased slightly by 1.4% (Rs. 85 million) compared to the previous corresponding quarter, however during the first half of the FY 2011‐12 ended December 2011, sales have increased by Rs. 982 million which is an increase of 9.2% as compared to the corresponding period. Financial performance during the quarter is given below:

December 2011
December 2010
Rupees in millions Sales 11,658 10,677 Gross profit 1,512 1,846 (Loss) / Profit before tax after providing
depreciation / amortization of Rs 363 million (2010: Rs. 328 million) (122) 588
(Loss) / Profit after tax (237) 453 Future Prospects Your Company is facing the challenges enumerated above and is taking steps to overcome the same. Retail business is being expanded by increasing sales outlets on franchise, without incurring further capital expenditure. Products line is also being increased. New embellished units are being established to move away from basic commodities. These measures will change the sales mix to more profitable products and also cater to the niche market. We are in the midst of the lawn season. Our lawn has been launched and initial response is highly encouraging. Forward booking of the lawn production is also very robust. We expect that with our strong brand image and creativity the lawn season will be very successful and will have a very positive impact on our overall performance. Efficiencies in production, various cost reduction measure and electricity production from steam turbine expected to be on line from March 2012 will help neautralise the inflationary impact on costs. We expect that with the recent approval of the European Union (EU) textile package by World Trade Organisation (WTO), price cut demand by the export customers will reduce to a large extent as the cost differential between Bangladesh and Pakistan will narrow down. These measures coupled with the Government reactivating the textile policy benefits will help improve Company’s profitability. Consolidated Financial Statements Consolidated financial statements for the half year ended December 31, 2011 of FY 2011‐12 of the Company and its subsidiaries Gul Ahmed International Limited (FZC), UAE and GTM (Europe) Limited, UK are attached.
Acknowledgement Directors acknowledge and appreciate the efforts of the employees and valuable support of the various Government Departments, Financial Institutions and our customers.
For and on behalf of the Board
Karachi Bashir Ali Mohommad February 27, 2012 Chairman and Chief Executive

AUDITORS’ REPORT TO THE MEMBERS ON REVIEW OF CONDENSED INTERIM FINANCIAL INFORMATION INTRODUCTION:
We have reviewed the accompanying condensed interim balance sheet of Gul Ahmed Textile Mills Limited as at December 31, 2011 and the related condensed interim profit and loss account, condensed interim statement of comprehensive income, condensed interim cash flow statement and condensed interim statement of changes in equity, together with the notes forming part thereof (here-in-after referred to as the “condensed interim financial information”) for the half year then ended. Management is responsible for the preparation and presentation of this condensed interim financial information in accordance with approved accounting standards as applicable in Pakistan for interim financial reporting. Our responsibility is to express a conclusion on this condensed interim financial information based on our review. The figures of the condensed interim profit and loss account and condensed interim statement of comprehensive income for the quarters ended December 31, 2011 and 2010 have not been reviewed, as we are required to review only the cumulative figures for the half year ended December 31, 2011. SCOPE OF REVIEW:
We conducted our review in accordance with the International Standard on Review Engagements 2410, “Review of Interim Financial Information Performed by the Independent Auditor of the Entity.” A review of condensed interim financial information consists of making inquiries, primarily of persons responsible for financial and accounting matters, and applying analytical and other review procedures. A review is substantially less in scope than an audit conducted in accordance with International Standards on Auditing and consequently does not enable us to obtain assurance that we would become aware of all significant matters that might be identified in an audit. Accordingly, we do not express an audit opinion. CONCLUSION:
Based on our review, nothing has come to our attention that causes us to believe that the accompanying condensed interim financial information as of and for the half year ended December 31, 2011 is not prepared, in all material respects, in accordance with approved accounting standards as applicable in Pakistan for interim financial reporting. HYDER BHIMJI & CO. CHARTERED ACCOUNTANTS Karachi: ENGAGEMENT PARTNER: HYDER ALI BHIMJI February 27, 2012

Condensed Interim Balance Sheet As at December 31, 2011
December June2011 2011
SHARE CAPITAL AND RESERVES Authorised capital 150,000,000 ordinary shares of Rs.10 each 1,500,000 1,500,000
Issued, subscribed and paid-up capital 1,269,570 634,785 Reserves 3,430,000 2,880,446 Unappropriated (loss)/profit (223,815) 1,197,642
4,475,755 4,712,873
NON-CURRENT LIABILITIES Long term financing 2,025,527 2,198,591 Deferred Liabilities
Deferred taxation 283,336 284,563 Staff Retirement benefits 12,586 14,106
295,922 298,669
CURRENT LIABILITIES Trade and other payables 3,061,511 2,586,514 Accrued Mark-up 232,799 216,798 Short term borrowings 9,451,128 9,759,190 Current maturity of long term financing 665,465 632,044 Provision for Income tax - net of payment 8,792 -
13,419,695 13,194,54620,216,899 20,404,679
ASSETSNON-CURRENT ASSETS
Rs. 000s
Property, plant and equipment 6,657,882 6,653,725 Intangible assets 33,832 38,630 Long term investment 58,450 58,450 Long term loans and advances 4,838 4,241 Long term deposits 40,848 33,057
6,795,850 6,788,103
CURRENT ASSETS Stores,spares and loose tools 720,353 706,350 Stock-in-trade 9,472,003 10,334,360 Trade debts 2,430,462 2,030,723 Loans and advances 322,790 159,830 Short term prepayments 97,414 40,486 Other receivables 250,152 212,546 Tax refunds due from government 52,735 48,926 Cash and bank balances 75,140 83,355
13,421,049 13,616,576
20,216,899 20,404,679
The annexed notes form an integral part of these condensed interim financial information.
BASHIR ALI MOHOMMADChairman and Chief Executive
ZAIN BASHIRDirector
Half Yearly Report 2011 5

Condensed Interim Profit and Loss AccountFor The Half Year Ended December 31, 2011
Oct-Dec Oct-Dec July-Dec July-Dec2011 2010 2011 2010
Sales 5,962,807 6,047,447 11,658,362 10,676,732
Cost of sales Opening stock of finished goods 6,356,139 3,668,896 6,216,883 3,158,863 Cost of goods manufactured 4,263,158 4,378,923 8,883,660 7,668,319 Purchases and processing charges 414,466 1,919,010 907,166 3,035,676 Closing stock of finished goods (5,861,624) (5,031,823) (5,861,624) (5,031,823)
5,172,139 4,935,006 10,146,085 8,831,035
Gross profit 790,668 1,112,441 1,512,277 1,845,697
Distribution cost 299,745 209,444 536,579 423,393 Administrative expenses 225,635 237,161 439,304 382,395 Other operating expenses - 32,023 - 43,611
525,380 478,628 975,883 849,399
265,288 633,813 536,394 996,298
Other operating income 4,049 6,419 9,764 11,060
Operating profit 269,337 640,232 546,158 1,007,358
Finance cost 338,031 208,161 667,822 418,938
(Loss)/profit before taxation (68,694) 432,071 (121,664) 588,420
Provision for Taxation 58,441 89,859 115,454 135,859
(Loss)/profit after taxation (127 135) 342 212 (237 118) 452 561
FOR THE QUARTER FOR THE HALF YEAR
Rs. 000s
Rs. 000s
(Loss)/profit after taxation (127,135) 342,212 (237,118) 452,561
(Loss)/earnings per share - basic and diluted (Rs.) (1.00) 2.70 (1.87) 3.56
The annexed notes form an integral part of these condensed interim financial information.
BASHIR ALI MOHOMMADChairman and Chief Executive Director
ZAIN BASHIR
Half Yearly Report 2011 6

Condensed Interim Statement Of Comprehensive IncomeFor The Half Year Ended December 31, 2011
Oct-Dec Oct-Dec July-Dec July-Dec2011 2010 2011 2010
(Loss)/profit after taxation (127,135) 342,212 (237,118) 452,561
Other comprehensive income - net of tax - - - -
Total comprehensive income (127,135) 342,212 (237,118) 452,561
The annexed notes form an integral part of these condensed interim financial information.
BASHIR ALI MOHOMMAD ZAIN BASHIRChairman and Chief Executive Director
FOR THE QUARTER FOR THE HALF YEAR
Rs. 000s Rs. 000s
Half Yearly Report 2011 7

Condensed Interim Cash Flow StatementFor The Half Year Ended December 31, 2011
December December
2011 2010
CASH FLOWS FROM OPERATING ACTIVITIES
(Loss)/profit before taxation (121,664) 588,420
Adjustments for: Depreciation 355,861 323,123 Amortisation 6,818 4,583 Provision for gratuity 1,503 657 Finance cost 667,822 418,938 Provision for slow moving/obsolete items 5,152 3,900 Provision for doubtful debts 14,600 9,600 Profit on sale of property, plant and equipment (5,690) (5,440)
924,402 1,343,781 Changes in working capital: (Increase)/decrease in current assets Stores, spares and loose tools (19,155) (225,621) Stock-in-trade 862,357 (4,035,700) Trade debts (414,339) (825,930) Loans and advances (185,088) (390,791) Prepayments (56,928) (16,050) Other receivables (37,606) (175,841) Tax refunds due from government (3,809) (12,808) 145,432 (5,682,741) Increase in current liabilities Trade and other payables 474,997 928,043
620,429 (4,754,698)
Rs. 000s
Cash generated from/(used in) operations 1,544,831 (3,410,917)
Payments for: Gratuity (3,023) (2,660) Finance cost (651,821) (381,186) Income tax paid (85,761) (101,315) Long term loans and advances (597) (758) Net cash generated from/(used in) operating activities 803,629 (3,896,836)
CASH FLOWS FROM INVESTING ACTIVITIES
Addition to property, plant and equipment (369,386) (712,871) Addition to intangible assets (2,020) - Proceeds from sale of property, plant and equipment 15,058 10,589 Long term deposits (7,791) (635) Net cash used in investing activities (364,139) (702,917)
Half Yearly Report 2011 8

December December2011 2010
CASH FLOWS FROM FINANCING ACTIVITIES Long term loans acquired 166,909 308,372 Repayments of long term loans (306,552) (317,502) Dividend paid - (79,349)
Net cash used in financing activities (139,643) (88,479)
Net increase/(decrease) in cash and cash equivalents 299,847 (4,688,232)
Cash and cash equivalents - at the beginning of the period (9,675,835) (5,659,761)
Cash and cash equivalents - at the end of the period (9,375,988) (10,347,993)
CASH AND CASH EQUIVALENTS
Cash and cash equivalents include:
Cash and bank balances 75,140 93,193 Short term borrowings (9,451,128) (10,441,186)
(9,375,988) (10,347,993)
The annexed notes form an integral part of these condensed interim financial information.
Rs. 000s
BASHIR ALI MOHOMMAD ZAIN BASHIRChairman and Chief Executive Director
Half Yearly Report 2011 9

Condensed Interim Statement of Changes in EquityFor the Half Year Ended December 31, 2011
Share Revenue Capital Reserve for Issue Unappropriatedcapital reserve reserve of Bonus Shares profit Total
Balance as at June 30, 2010 634,785 2,030,000 450,446 - 480,534 3,595,765 Transfer to revenue reserve - 400,000 - - (400,000) - Transaction with owners Final Dividend for the year ended June 30, 2010 - - - - (79,349) (79,349) Total comprehensive income Profit for the half year ended December 31, 2010 - - - 452,561 452,561 Other comprehensive income - - - - - - Total comprehensive income for the period - - - - 452,561 452,561 Balance as at December 31, 2010 634,785 2,430,000 450,446 - 453,746 3,968,977
- - - - 743,896 743,896
Other comprehensive income - - - - - - Total comprehensive income for the period - - - - 743,896 743,896 Balance as at June 30, 2011 634,785 2,430,000 450,446 - 1,197,642 4,712,873 Transfer to revenue reserve 1,000,000 (1,000,000) - Transfer to reserve for issue of bonus shares - - (450,446) 634,785 (184,339) -
Rs. 000s
Total comprehensive income
Profit for the period ended June 30, 2011
Transaction with owners Issuance of bonus shares for the year ended June 30, 2011 634,785 - - (634,785) - -
Total comprehensive income Loss for the half year ended December 31, 2011 - - - (237,118) (237,118) Other comprehensive income - - - - - - Total comprehensive income for the period - - - - (237,118) (237,118) Balance as at December 31, 2011 1,269,570 3,430,000 - - (223,815) 4,475,755
The annexed notes form an integral part of these condensed interim financial information.
BASHIR ALI MOHOMMADChairman and Chief Executive
ZAIN BASHIRDirector
Half Yearly Report 2011 10

Notes To The Condensed Interim Financial Information For The Half Year Ended December 31, 2011
1. THE COMPANY AND ITS OPERATIONSGul Ahmed Textile Mills Limited was incorporated in 1953 in Pakistan as a private limited company, converted into publiclimited company in 1955 and was listed on Karachi and Lahore Stock Exchanges in 1970 and 1971 respectively. Gul Ahmedis a composite textile mill and is engaged in the manufacture and sale of textile products.
The Company’s registered office is situated at Plot No. 82, Main National Highway, Landhi, Karachi.
2. BASIS OF PREPARATIONThese condensed interim financial information of the Company for the half year ended December 31, 2011 have beenprepared in accordance with the requirements of the International Accounting Standards 34 - Interim Financial Reporting andprovisions of and directives issued under the Companies Ordinance, 1984. In case where requirements differ, the provisions ofor directives issued under the Companies Ordinance, 1984 have been followed.
These condensed interim financial information comprise of the condensed interim balance sheet as at December 31, 2011 andthe condensed interim profit and loss account, condensed interim statement of comprehensive income, condensed interimcash flow statement and condensed interim statement of changes in equity for the half year ended December 31, 2011 whichhave been subjected to a review in accordance with the listing regulations but not audited. These condensed interim financialinformation also include the condensed interim profit and loss account and condensed interim statement of comprehensiveincome for the quarter ended December 31, 2011 which is not subjected to review.
The comparatives balance sheet, presented in these condensed interim financial information, as at June 30, 2011 has beenextracted from the audited financial statements of the Company for the year ended June 30, 2011 whereas the comparativecondensed interim profit and loss account, condensed interim statement of comprehensive income, condensed interim cashflow statement and condensed interim statement of changes in equity are for the half year ended December 31, 2010 havebeen extracted from the condensed interim financial information of the Company for the half year then ended, which weresubjected to a review but not audited. The comparative condensed interim profit and loss account and condensed interimstatement of comprehensive income for the quarter ended December 31, 2010 is also included in these condensed interimfinancial information.
3. ACCOUNTING POLICIESAccounting policies and the methods of computation adopted in the preparation of these condensed interim financialinformation are the same as those applied in the preparation of financial statements for the year ended June 30, 2011.
4. CONTINGENCIES AND COMMITMENTS
ContingenciesThe status of contingencies, as reported in the annual financial statements for the year ended June 30,2011 except as statedbelow, remained unchanged during the current period.
(a) Post dated cheques Rs. 109 million (June-2011: Rs. 71 million) issued to various Government Agencies.
(b) Bills discounted Rs. 707 million (June-2011: Rs. 1,306 million)
(d) Corporate guarantee of Rs. 93.123 million (June-2011: Rs. 96.965) has been issued to a bank in favour of subsidiarycompany.
Half Yearly Report 2011 11

CommitmentsCompany is committed for certain expenditures which are stated as follows:
(Rs. 000s)December 2011 June 2011
- Capital expenditure 449,299 340,196 - Non capital expenditure items under letters of credits 349,396 580,658
798,695 920,854
5. Property, plant and equipment
Operating assets
Opening book value 6,582,082 6,088,782
Additions during the period: Buildings and structures on leasehold land 59,724 88,692 Plant and machinery 146,242 975,122 Office equipment 30,941 40,641 Furniture and fixtures 4,217 33,169 Vehicles 48,778 84,425
289,902 1,222,049
Book values of assets disposed-off during the period (9,368) (20,494)
Depreciation charge for the period (355,861) (708,255)
Book value of operating fixed assets 6,506,755 6,582,082
Capital work in progress
Opening 71,643 51,332
Addition - Machinery 249,749 877,148 - Building 25,089 77,281
- Store items held for capitalization 18,468 44,340 - Others 5,562 27,220
298,868 1,025,989
Transferred - Machinery (140,685) (854,058) - Building (48,524) (60,990)
- Store items held for capitalization (16,013) (43,881) - Others (14,162) (46,749)
(219,384) (1,005,678)
Closing 151,127 71,643
Book Value of property, plant and equipment 6,657,882 6,653,725
6. Intangible assets
Opening book value 38,630 16,349 Additions during the period (at Cost) 2,020 38,006 Amortisation charge for the period (6,818) (15,725) Closing net book value 33,832 38,630
Half Yearly Report 2011 12
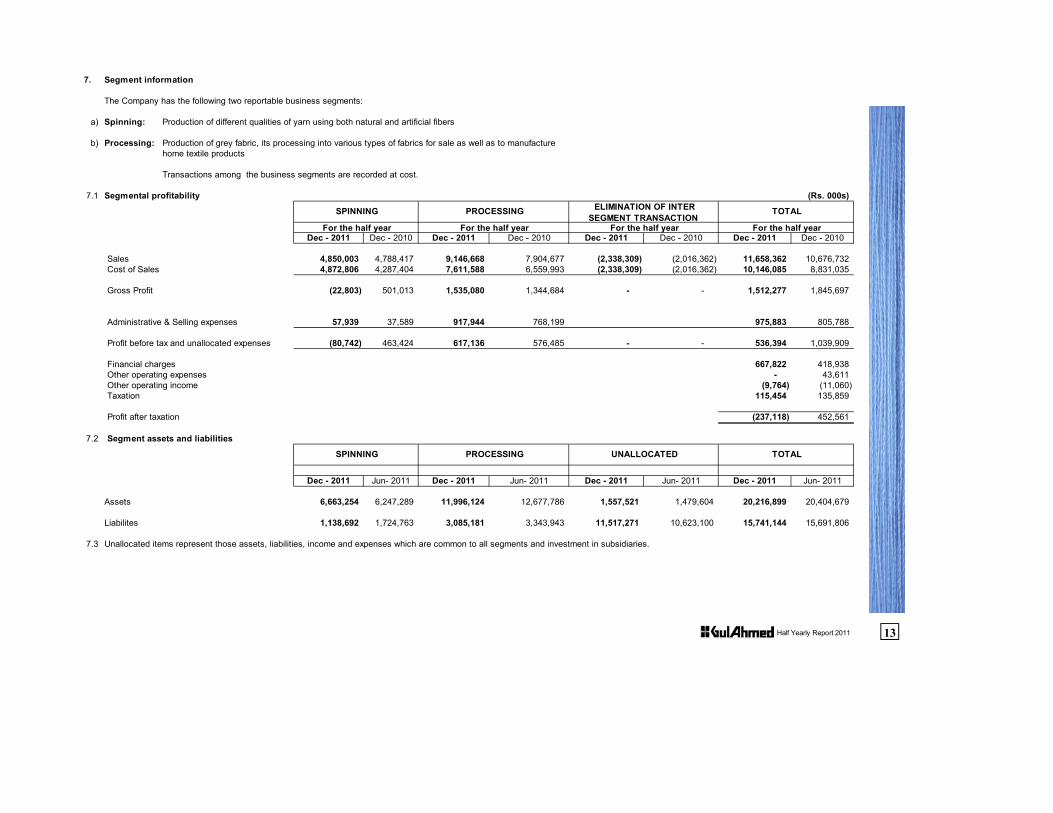
7. Segment information
The Company has the following two reportable business segments:
a) Spinning: Production of different qualities of yarn using both natural and artificial fibers
b) Processing: Production of grey fabric, its processing into various types of fabrics for sale as well as to manufacturehome textile products
Transactions among the business segments are recorded at cost.
7.1 Segmental profitability (Rs. 000s)
Dec - 2011 Dec - 2010 Dec - 2011 Dec - 2010 Dec - 2011 Dec - 2010 Dec - 2011 Dec - 2010
Sales 4,850,003 4,788,417 9,146,668 7,904,677 (2,338,309) (2,016,362) 11,658,362 10,676,732 Cost of Sales 4,872,806 4,287,404 7,611,588 6,559,993 (2,338,309) (2,016,362) 10,146,085 8,831,035
Gross Profit (22,803) 501,013 1,535,080 1,344,684 - - 1,512,277 1,845,697
Administrative & Selling expenses 57,939 37,589 917,944 768,199 975,883 805,788
Profit before tax and unallocated expenses (80,742) 463,424 617,136 576,485 - - 536,394 1,039,909
Financial charges 667,822 418,938 Other operating expenses - 43,611 Other operating income (9,764) (11,060) Taxation 115,454 135,859
Profit after taxation (237,118) 452,561
7.2 Segment assets and liabilities
Dec - 2011 Jun- 2011 Dec - 2011 Jun- 2011 Dec - 2011 Jun- 2011 Dec - 2011 Jun- 2011
Assets 6,663,254 6,247,289 11,996,124 12,677,786 1,557,521 1,479,604 20,216,899 20,404,679
Liabilites 1,138,692 1,724,763 3,085,181 3,343,943 11,517,271 10,623,100 15,741,144 15,691,806
7.3 Unallocated items represent those assets, liabilities, income and expenses which are common to all segments and investment in subsidiaries.
SPINNING PROCESSING UNALLOCATED TOTAL
TOTAL
For the half year For the half year
SPINNING PROCESSING ELIMINATION OF INTER SEGMENT TRANSACTION
For the half year For the half year
Half Yearly Report 2011 13

7.4 Information by geographical area
Dec-11 Dec-10 Dec-11 Jun-11
Pakistan 4,561,305 3,341,186 6,737,400 6,729,653 United Kingdom 1,469,234 1,895,984 China 841,446 1,304,362 Germany 1,270,521 1,190,545 Netherland 496,989 667,520 France 447,560 500,653 United States 802,136 355,961 United Arab Emirates 242,117 136,191 58,450 58,450 Other Countries 1,527,054 1,284,330
11,658,362 10,676,732 6,795,850 6,788,103
8. Transaction With Related PartiesThe related parties comprise subsidiaries, associated companies, companies where directors also hold directorship,directors of the company and key management personnel. The Company in the normal course of business carried outtransaction with various related parties.
Dec-11 Dec-10Relationship withthe Company Nature of transaction
Subsidiaries Purchase of goods 381 308 Sales of goods 802,943 1,097,347 Corporate guarantee issued in favourof Subsidiary Company (at period end) 93,123 90,235
Associated Companies Purchase of goods 22,153 14,467 and other related parties Sales of goods 1,283 747
Rent paid 2,910 2,265 Fees paid 1,000 750 Commission / Rebate 1,688 - Deposit with bank (at period end) 21,419 71,321 Borrowing from bank (at period end) 1,107,957 1,526,305 Bank Guarantee (at period end) 203,472 179,103
Bills discounted 367,813 508,799 Commission / Bank charges paid 11,719 20,219 Mark up / interest charged 57,626 43,699 Provident fund contribution 24,699 20,695
There are no transactions with directors of the Company and key management personnel other than those underthe terms of employment amounting to Rs. 191 million (Dec 2010: Rs. 139 million) on account of remuneration andloans to key management personnel amounting to Rs. 8 million (Dec 2010: Rs. 5 million)
9. Date Of AuthorisationThese condensed interim financial information were authorised for issue on February 27, 2012 by the Board ofDirectors of the Company.
10. GeneralAllocations for the workers' profit participation fund, workers' welfare fund and taxation are provisional and final liabilityincluding liability for deferred taxation will be determined on the basis of annual results.
Figures have been rounded off to the nearest thousand rupees.
ZAIN BASHIRDirector
BASHIR ALI MOHOMMAD Chairman and Chief Executive
Rs. 000s
Revenue Non-current assetsRs. 000s
Half Yearly Report 2011 14

T e x t i l e M i l l s L i m i t e d
Consolidated Accounts
Consolidated Condensed Interim Financial Information For The Half Year Ended December 31, 2011

Consolidated Condensed Interim Balance Sheet As At December 31, 2011
December June 2011 2011
SHARE CAPITAL AND RESERVES Authorised capital 150,000,000 ordinary shares of Rs.10 each 1,500,000 1,500,000
Share capital 1,269,570 634,785 Reserves 3,498,125 2,933,524 Unappropriated (loss)/profit (131,829) 1,278,023
4,635,866 4,846,332
NON-CURRENT LIABILITIES
Long term financing 2,025,527 2,198,591 Deferred Liabilities
Deferred taxation - net 291,525 292,752 Staff retirement benefits 16,804 17,717
308,329 310,469
CURRENT LIABILITIES Trade and other payables 3,087,770 2,648,510 Accrued interest 232,799 216,798 Short term borrowings 9,492,596 9,818,355 Current maturity of long term loans 665,465 632,044 Provision for Income tax - net of payment 12,788 -
Rs. 000s
13,491,418 13,315,707 20,461,140 20,671,099
ASSETSNON-CURRENT ASSETS Property, plant and equipment 6,665,639 6,661,512 Intangible assets 36,635 42,322 Long term loans and advances 4,838 4,241 Long term deposits 40,848 33,057 6,747,960 6,741,132
CURRENT ASSETS Stores, spares and loose tools 720,353 706,350 Stock-in-trade 9,550,380 10,430,214 Trade debts 2,612,145 2,236,402 Loans and advances 328,995 160,263 Short term prepayments 103,009 45,827 Other receivables 250,152 212,546 Tax refunds due from government 54,746 51,727 Cash and bank balances 93,400 86,638
13,713,180 13,929,967
20,461,140 20,671,099
The annexed notes form an integral part of these consolidated condensed interim financial information.
BASHIR ALI MOHOMMADChairman and Chief Executive Director
ZAIN BASHIR
Half Yearly Report 2011 15

Consolidated Condensed Interim Profit And Loss AccountFor The Half Year Ended December 31, 2011
Oct-Dec Oct-Dec July-Dec July-Dec2011 2010 2011 2010
Sales 6,117,234 6,144,963 11,865,878 10,751,251
Cost of sales Opening stock of finished goods 6,475,378 3,780,077 6,312,737 3,206,770 Cost of goods manufactured 4,263,158 4,378,923 8,883,660 7,668,319 Purchases and processing charges 474,017 1,959,962 1,005,530 3,093,204 Closing stock of finished goods (5,939,949) (5,121,179) (5,939,949) (5,121,179)
5,272,604 4,997,783 10,261,978 8,847,114 Gross profit 844,630 1,147,180 1,603,900 1,904,137 Distribution cost 304,383 213,501 545,403 428,989 Administrative expenses 252,378 250,886 488,735 426,032 Other operating expenses - 32,023 - 43,611 556,761 496,410 1,034,138 898,632
287,869 650,770 569,762 1,005,505
Other operating income 4,045 6,296 10,270 11,534
Operating profit 291,914 657,066 580,032 1,017,039
Finance cost 347,552 209,699 687,779 415,744
FOR THE QUARTER FOR THE HALF YEAR
Rs. 000sRs. 000s
(Loss)/profit before taxation (55,638) 447,367 (107,747) 601,295
Provision for taxation 60,360 92,611 117,766 139,484
(Loss)/profit after taxation (115,998) 354,756 (225,513) 461,811
(Loss)/earnings per share - basic and diluted (Rs.) (0.91) 2.79 (1.78) 3.64
The annexed notes form an integral part of these consolidated condensed interim financial information.
BASHIR ALI MOHOMMAD ZAIN BASHIRChairman and Chief Executive Director
Half Yearly Report 2011 16

Consolidated Condensed Interim Statement Of Comprehensive IncomeFor The Half Year Ended December 31, 2011
Oct-Dec Oct-Dec July-Dec July-Dec2011 2010 2011 2010
(Loss)/profit after taxation (115,998) 354,756 (225,513) 461,811
Foreign currency translation differences - Foreign operations 3,812 1,575 15,047 7,078
Total comprehensive income (112,186) 356,331 (210,466) 468,889
The annexed notes form an integral part of these consolidated condensed interim financial information.
BASHIR ALI MOHOMMADChairman and Chief Executive
FOR THE HALF YEAR
Rs. 000s
ZAIN BASHIRDirector
Rs. 000s
FOR THE QUARTER
Half Yearly Report 2011 17

Consolidated Condensed Interim Cash Flow StatementFor The Half Year Ended December 31, 2011
December December
2011 2010
CASH FLOW FROM OPERATING ACTIVITIES
(Loss)/profit after taxation (107,747) 601,295
Adjustments for: Depreciation 357,354 324,837 Amortisation 7,707 5,419 Provision for gratuity 2,110 525 Finance cost 687,779 415,744 Provision for slow moving/obsolete items 5,152 3,900 Provision for doubtful debts 14,600 9,600 Profit on sale of property, plant and equipment (6,196) (5,750)
960,759 1,355,570 Changes in working capital:
(Increase)/decrease in current assets Stores, spares and loose tools (19,155) (225,621) Stock-in-trade 879,834 (4,077,149) Trade debts (390,342) (599,516) Loans and advances (189,210) (398,992) Prepayments (57,182) (12,715) Other receivables (37,606) (175,841) Tax refunds due from government (3,019) (11,388)
183,320 (5,501,222) Decrease in current liabilities
Rs. 000s
Decrease in current liabilities Trade and other payables 439,260 985,383
622,580 (4,515,839) Cash generated from/(used in) operations 1,583,339 (3,160,269)
Payments for: Gratuity (3,023) (2,660) Finance cost (671,778) (377,992) Income tax paid (85,728) (101,315) Long term loans and advances (597) (758) Net cash generated from/(used in) operating activities 822,213 (3,642,994)
CASH FLOW FROM INVESTING ACTIVITIES
Addition to property, plant and equipment (372,456) (714,937) Addition to intangible assets (2,020) - Proceeds from sale of property, plant and equipment 17,171 10,590 Long term deposits (7,791) (635)
Net cash used in investing activities (365,096) (704,982)
Half Yearly Report 2011 18

December December2011 2010
CASH FLOW FROM FINANCING ACTIVITIES
Long term loans acquired 166,909 308,372 Repayments of long term loans (306,552) (317,502) Dividend Paid - (79,349)
Net cash used in financing activities (139,643) (88,479) Exchange difference on translation of foreign subsidiaries 15,047 7,078
Net increase/(decrease) in cash and cash equivalents 332,521 (4,429,377)
Cash and cash equivalents - at the beginning of the period (9,731,717) (5,667,371)
Cash and cash equivalents - at the end of the period (9,399,196) (10,096,748)
CASH AND CASH EQUIVALENTS
Cash and cash equivalents include:
Cash and bank balances 93,400 365,404 Short term borrowings (9,492,596) (10,462,152)
(9,399,196) (10,096,748)
The annexed notes form an integral part of these consolidated condensed interim financial information.
Rs. 000s
BASHIR ALI MOHOMMAD ZAIN BASHIRChairman and Chief Executive Director
Half Yearly Report 2011 19

Consolidated Statement Of Changes In EquityFor The Half Year Ended December 31, 2011
Rs. 000sShare Revenue Exchange Capital Statutory Reserve for Issue Unappropriated Totalcapital reserve difference reserve reserve of Bonus Shares profit
on translation of foreign
subsidiaries
Balance as at June 30, 2010 634,785 2,030,000 37,310 450,446 6,735 - 550,752 3,710,028
Transfer to revenue reserve - 400,000 - - - - (400,000) -
Transaction with owners
Final Dividend for the year ended June 30, 2010 - - - - - - (79,349) (79,349)
Total comprehensive income
Profit for the half year ended December 31, 2010 - - - - - - 461,811 461,811
Other comprehensive income - - 7,078 - - - 7,078
Total comprehensive income for the period - - 7,078 - - - 461,811 468,889
Balance as at December 31, 2010 634,785 2,430,000 44,388 450,446 6,735 - 533,214 4,099,568
Transfer to statutory reserve - - - - 1,555 - (1,555) -
Total comprehensive income
Profit for the period ended June 30, 2011 - - - - - 746,364 746,364
Other comprehensive income - - 400 - - - 400
Total comprehensive income for the period - - 400 - - - 746,364 746,764
Balance as at June 30, 2011 634,785 2,430,000 44,788 450,446 8,290 - 1,278,023 4,846,332
Transfer to revenue reserve - 1,000,000 - - - - (1,000,000) -
Transfer to reserve for issue of bonus shares - - - (450,446) - 634,785 (184,339) -
Transaction with owners
Issuance of bonus shares for the year ended June 30, 2011 634,785 (634,785) -
Total comprehensive income
Loss for the half year ended December 31, 2011 - - - - - - (225,513) (225,513)
Other comprehensive income - - 15,047 - - - 15,047
- - 15,047 - - - (225,513) (210,466)
Balance as at December 31, 2011 1,269,570 3,430,000 59,835 - 8,290 - (131,829) 4,635,866
The annexed notes form an integral part of these consolidated condensed interim financial information.
BASHIR ALI MOHOMMADChairman and Chief Executive Director
ZAIN BASHIR
Half Yearly Report 2011 20

Consolidated Condensed Interim Notes To The AccountsFor The Half Year Ended December 31, 2011
1 THE GROUP AND ITS OPERATIONS 1.1 Gul Ahmed Group comprises the following:
-Gul Ahmed Textile Mills Limited -Gul Ahmed International Limited (FZC)- UAE -GTM (Europe) Limited -UK Gul Ahmed International Limited (FZC) -UAE is a wholly owned subsidiary of Gul Ahmed Textile Mills Limited and GTM (Europe) Limited is a wholly owned subsidiary of Gul Ahmed International Limited (FZC) - UAE. Gul Ahmed Textile Mills Limited was incorporated in 1953 in Pakistan as a private limited company, converted into public limited company in 1955 and was listed on Karachi and Lahore Stock Exchanges in 1970 and 1971 respectively. Gul Ahmed is a composite textile mill and is engaged in the manufacture and sale of textile products. The Group’s registered office is situated at Plot No. 82, Main National Highway, Landhi, Karachi. Both subsidiaries are engaged in trading of textile related products.
1.2 Basis of consolidation The consolidated financial statements include the financial statements of the Holding Company and its subsidiaries - "the Group". Subsidiary companies are consolidated from the date on which more than 50% voting rights are transferred to the Holding Company or power to govern the financial and operating policies over the subsidiary and is excluded from consolidation from the date of disposal or cessation of control. The financial statements of the subsidiaries are prepared for the same reporting period as the Holding Company, using consistent accounting policies. The assets and liabilities of the subsidiary company have been consolidated on a line-by-line basis and the carrying value of investment held by the Holding Company is eliminated against the subsidiary's share capital. Material intra-group balances and transactions are eliminated.
2. BASIS OF PREPARATION The consolidated accounts comprise the consolidated balance sheet of Gul Ahmed Textile Mills Limited, its wholly owned subsidiary company Gul Ahmed International Limited (FZC) and GTM (Europe) Limited which is the wholly owned subsidiary of Gul Ahmed International Limited (FZC), as at December 31, 2011 and the related consolidated profit and loss account, consolidated cash flow
statement and statement of changes in equity together with the notes forming part thereof for the period then ended. The financial statements of the subsidiary companies have been consolidated on a line by line basis.
These consolidated condensed interim financial information of the Group for the half year ended December 31, 2011 have been prepared in accordance with the requirements of the International Accounting Standards 34 - Interim Financial Reporting and provisions of and directives issued under the Companies Ordinance, 1984. In case where requirements differ, the provisions of or directives issued under the Companies Ordinance, 1984 have been followed. These consolidated condensed interim financial information comprise of the consolidated condensed interim balance sheet as at December 31, 2011 and the consolidated condensed interim profit and loss account, consolidated condensed interim statement of comprehensive income, consolidated condensed interim cash flow statement and consolidated condensed interim statement of changes in equity for the half year ended December 31, 2011 which have been subjected to a review in accordance with the listing regulations but not audited. These consolidated condensed interim financial information also include the consolidated condensed interim profit and loss account and consolidated condensed interim statement of comprehensive income for the quarter ended December 31, 2011 which is not subjected to review. The comparatives balance sheet, presented in these consolidated condensed interim financial information, as at June 30, 2011 has been extracted from the audited financial statements of the Group for the year ended June 30, 2011 whereas the comparative consolidated condensed interim profit and loss account, consolidated condensed interim statement of comprehensive income, consolidated condensed interim cash flow statement and consolidated condensed interim statement of changes in equity are for the half year ended December 31, 2010 have been extracted from the consolidated condensed interim financial information of the Group for the half year then ended, which were subjected to a review but not audited. The comparative consolidated condensed interim profit and loss account and consolidated condensed interim statement of comprehensive income for the quarter ended December 31, 2010 is also included in these consolidated condensed interim financial information.
Half Yearly Report 2011 21

3. ACCOUNTING POLICIES Accounting policies and the methods of computation adopted in the preparation of these consolidated condensed interim financial information are the same as those applied in the preparation of consolidated financial statements for the year ended June 30, 2011.
4. CONTINGENCIES AND COMMITMENTS The status of contingencies, as reported in the annual financial statements for the year ended June 30,2011 except as stated below, remained unchanged during the current period.
(a) Post dated cheques Rs. 109 million (June-2011: Rs. 71 million) issued to various Government Agencies.
(b) Bills discounted Rs. 707 million (June-2011: Rs. 1,306 million)
(c) Corporate guarantee of Rs. 93.123 million (June-2011: Rs. 96.965) has been issued to a bank in favour of subsidiary company. Commitments Company is committed for certain expenditures which are stated as follows:
(Rs. 000s)December 2011 June 2011
- Capital expenditure 449,299 340,196 - Non capital expenditure items under letters of credits 349,396 580,658
798,695 920,854
5. Property, plant and equipment
Operating Assets
Opening book value 6,589,869 6,097,378
Additions during the period: Building on leasehold land 59,724 88,692 Plant and machinery 146,242 975,122 Office equipment 30,977 40,747 Furniture and fixtures 4,217 33,169 Transport equipment 51,812 87,721
292,972 1,225,451
Book values of assets disposed-off during the period (10,975) (21,223)
Depreciation charge for the period (357,354) (711,737)
Book value of operating fixed assets 6,514,512 6,589,869
Capital work in progress
Opening 71,643 51,332
Addition - Machinery 249,749 877,148 - Building 25,089 77,281
- Store items held for capitalization 18,468 44,340 - Others 5,562 27,220
298,868 1,025,989
Transferred - Machinery (140,685) (854,058) - Building (48,524) (60,990)
- Store items held for capitalization (16,013) (43,881) - Others (14,162) (46,749)
(219,384) (1,005,678)
Closing 151,127 71,643
Total 6,665,639 6,661,512
6. Intangible assetsOpening book value 42,322 21,253 Additions during the period (at Cost) 2,020 38,471 Amortisation charge for the period (7,707) (17,402) Closing net book value 36,635 42,322
Half Yearly Report 2011 22

7. Segment Information
The Group has the following three reportable business segments:
a) Spinning: Production of different qualities of yarn using both natural and artificial fibers
b) Processing: Production of grey fabric, its processing into various types of fabrics for sale as well as to manufacturehome textile products
c) Overseas subsidiaries: These subsidiaries are also in the textile business reselling product to the ultimate customers, imported from Parent Company
Transactions among the business segments are recorded at cost.
7.1 Segmental Profitability
Dec - 2011 Dec - 2010 Dec - 2011 Dec - 2010 Dec - 2011 Dec - 2010 Dec - 2011 Dec - 2010 Dec - 2011 Dec - 2010 Dec - 2011 Dec - 2010
Sales 4,850,004 4,788,417 9,146,668 7,904,677 230,085 170,467 776,126 1,015,164 (3,137,005) (3,127,474) 11,865,878 10,751,251 Cost of Sales 4,872,806 4,287,404 7,611,588 6,559,993 185,988 136,770 737,035 969,907 (3,145,439) (3,106,960) 10,261,978 8,847,114
Gross Profit (22,802) 501,013 1,535,080 1,344,684 44,097 33,697 39,091 45,257 8,434 (20,514) 1,603,900 1,904,137
Administrative & Selling expenses 57,939 37,589 917,944 768,199 31,391 24,602 26,864 24,631 - - 1,034,138 855,021
Profit before tax and unallocated expenses (80,741) 463,424 617,136 576,485 12,706 9,095 12,227 20,626 8,434 (20,514) 569,762 1,049,116
Financial charges 687,779 415,744 Other operating expenses - 43,611 Other operating income (10,270) (11,534) Taxation 117,766 139,484
Profit after taxation (225,513) 461,811
7.2 Segment assets and liabilities
Dec - 2011 Jun- 2011 Dec - 2011 Jun- 2011 Dec - 2011 Jun- 2011 Dec - 2011 Jun- 2011 Dec - 2011 Jun- 2011 Dec - 2011 Jun- 2011
Assets 6,663,254 6,247,289 11,829,860 12,476,215 196,342 185,009 214,163 282,984 1,557,521 1,479,602 20,461,140 20,671,099
Liabilites 1,138,690 1,724,763 3,078,944 3,343,943 12,745 17,051 77,622 115,910 11,517,273 10,623,100 15,825,274 15,824,767
7.3 Unallocated items represent those assets, liabilities income and expenses which are common to all segments and investment in subsidiaries.
Gul Ahmed International Limited FZC- UAE
GTM (Europe) Limited UK ELIMINATION OF INTER SEGMENT TRANSACTION
Total
For the half year For the half year
Gul Ahmed International Limited FZC- UAE
TOTAL
For the half year For the half year
SPINNING PROCESSING
For the half year For the half year
Unallocated GTM (Europe) Limited UK Spinning Processing
Half Yearly Report 2011 23

7.4 Information by geographical area
Dec-11 Dec-10 Dec-11 Jun-11
Pakistan 4,561,692 3,341,186 6,737,400 6,729,653 United Kingdom 1,302,912 1,936,233 4,410 4,235 China 841,446 1,304,362 Netherland 496,989 667,520 France 550,302 500,653 United State 802,136 355,961 Germany 1,270,521 1,190,545 United Arab Emirates 391,418 170,461 6,150 7,244 Other Countries 1,648,462 1,284,330
11,865,878 10,751,251 6,747,960 6,741,132
8. Transaction With Related PartiesThe related parties comprise subsidiaries, associated companies, companies where directors also holddirectorship, directors of the Group and key management personnel. The Group in the normal course of businesscarried out transaction with various related parties.
Dec-11 Dec-10Relationship withthe Company Nature of transaction
Associated Companies Purchase of goods 22,153 14,467 and Other related parties Sales of goods - net 1,283 747
Rent paid 2,910 2,265 Fees paid 1,000 750 Commission / Rebate 1,688 - Deposit with bank (at period end) 21,419 71,321 Borrowing from bank (at period end) 1,107,957 1,526,305 Bank guarantee (at period end) 203,472 179,103 Bills discounted 367,813 508,799 Commission / bank charges paid 11,719 20,219 Mark up / interest charged 57,626 43,699 Provident fund contribution 24,699 20,695
There are no transactions with directors of the Group and key management personnel other than those under theterms of employment amounting to Rs. 191 million (Dec 2010: Rs. 139 million) on account of remuneration andloans to key management personnel amounting to Rs. 8 million (Dec 2010: Rs. 5 million)
9. Date Of AuthorisationThese consolidated condensed interim financial information were authorised for issue on February 27, 2012 bythe Board of Directors of the Group.
10. GeneralAllocations for the workers' profit participation fund, workers' welfare fund and taxation are provisional and finalliability including liability for deferred taxation will be determined on the basis of annual results.
Figures have been rounded off to the nearest thousand rupees.
ZAIN BASHIRDirector
Revenue Non-current assetsRs. 000s
Rs. 000s
BASHIR ALI MOHOMMADChairman and Chief Executive
Half Yearly Report 2011 24