Embed Size (px)
Citation preview
FINANCIAL LITERACY
GUIDE TO
Connecting Money, Policy and Priorities
A SUPPLEMENT TO GOVERNING
© 2014 E.REPUBLIC. ALL RIGHTS RESERVED 1100 CONNECTICUT AVE. N.W., SUITE 1300, WASHINGTON, D.C. 20036GOVERNING.COM
A DIVISION OF e.REPUBLIC
About this GuideThe Governing Guide to Financial Literacy is the go-to resource for newly elected public officials, budget officers,
government leaders and department heads. This Guide provides relevant knowledge to public leaders, which helps
them to better understand and tell their jurisdiction’s financial story. Inside you’ll find everything from budget basics
to legacy costs to reporting. For additional information on public finance, visit www.governing.com/finance101.
ACKNOWLEDGEMENTSJustin Marlowe, writer, is the Endowed Professor of Public Finance and Civic Engagement at the Daniel J. Evans School of Public Affairs at the University of Washington. He is a Certified Government Financial Manager and is the author of more than 50 books and articles on state and local public finance. The GOVERNING INSTITUTE advances better government by focusing on improved outcomes through research, decision support and executive education to help public-sector leaders govern more effectively. With an emphasis on state and local government performance, innovation, leadership and citizen engagement, the Institute oversees Governing’s research efforts, the Governing Public Official of the Year Program and a wide range of events to further advance the goals of good governance. The Governing Institute is led by former Kansas City, Mo., Mayor Mark Funkhouser, who was city auditor of Kansas City for 18 years prior to being elected mayor and who is an internationally recognized auditing expert, author and teacher in public administration.
A special thank you to the following individuals who contributed their expertise in the creation of this Guide:
Ray Elwell, Deputy Chief Financial Officer, City of Orlando, FloridaDr. W. Bartley Hildreth, Georgia State UniversityShirley Hughes, CPFO, CGFM, ICMA-CM, Chief Financial Officer, Boulder City, NevadaKil Huh, Director of State and Local Fiscal Health, Pew Charitable Trusts
Scott Pattison, Executive Director, National Association of State Budget OfficersRebecca Sutton, Chief Financial Officer, City of Orlando, Florida
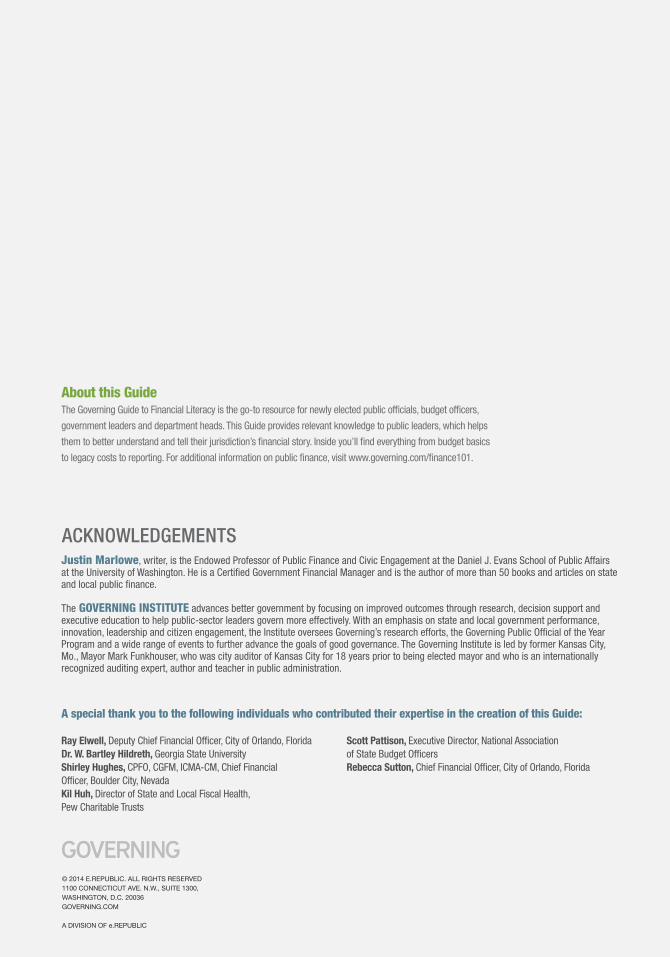
Where the Money Comes From Take a deep dive into the five main sources of state and local revenue: property tax, income tax, sales tax, intergovernmental revenue and “other” revenues.
Where the Money Goes How to think about costs and how state and local budgets are made.
Investing for the Long Haul Which projects can we afford? Which financing tool is best? How do we get the money?
Legacy Costs All you need to know about defined contribution pensions, defined benefit pensions and other post-employment benefits.
Telling the Financial Story The core principles of governmental accounting, basic financial statements and external audits.
Conclusion
Public Finance DefinedA glossary of terms critical to understanding your jurisdiction’s financial story.
Introduction
6
11
12
18
24
28
3233
4
3
CONTENTS
Public Finance Acronym Acumen A breakdown of commonly used public finance acronyms and abbreviations.
GOVERNING Guide to Financial Literacy
GOVERNING Guide to Financial Literacy4
INTRODUCTION
You’re involved in government because you want to accomplish something.
Maybe you want to fight poverty or reform public schools. Maybe you want to cut taxes or privatize government services. Maybe you think government mostly gets it right, so you want to protect policies or programs.
Regardless of why you got involved, by now you’ve realized you can’t accomplish much if you can’t speak the language of public finance. In fact, many policymakers lament that they spend more time than ever on budgets and tax policy, and less time on the policies and programs they care about most.
The goal of this Guide is to help you speak that language. Or, put differently, to help you become financially literate. You’re financially literate if you understand your jurisdiction’s “financial story.” That story has several parts, and those parts are the major sections of this Guide: How does your jurisdiction get and spend its money? How does it finance big ticket items like infrastructure improvements? Is it in sound financial shape?
To that end, this Guide covers three main types of information related to each part of the financial story:
Technical knowledge: Once you’ve read this Guide you will have a much clearer sense of how governments collect taxes, analyze costs, borrow money and prepare financial statements.
Essential questions: As a leader in your government, you have two main responsibilities with respect to money. The first is your fiduciary duty, the second is ensuring that public resources are put to their best possible use. This Guide will outline the questions that every state and local official should know to ask.
What not to do: There are many splashy examples of financial illiteracy. More often than not, these misunderstandings follow from some flawed, but widely held ideas about how public finance works. This Guide tries to identify and clear up some of those misconceptions. G
GOVERNING Guide to Financial Literacy 5
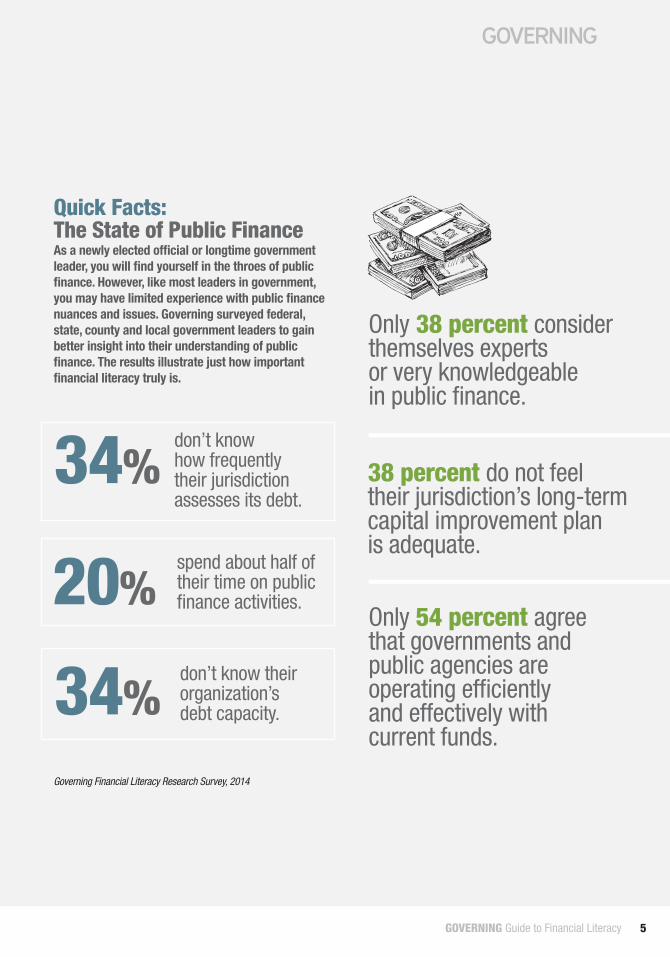
Quick Facts: The State of Public FinanceAs a newly elected official or longtime government leader, you will find yourself in the throes of public finance. However, like most leaders in government, you may have limited experience with public finance nuances and issues. Governing surveyed federal, state, county and local government leaders to gain better insight into their understanding of public finance. The results illustrate just how important financial literacy truly is.
20%
34%
34%
spend about half of their time on public finance activities.
don’t know how frequently their jurisdiction assesses its debt.
don’t know their organization’s debt capacity.
38 percent do not feel their jurisdiction’s long-term capital improvement plan is adequate.
Only 54 percent agree that governments and public agencies are operating efficiently and effectively with current funds.
Only 38 percent consider themselves experts or very knowledgeable in public finance.
Governing Financial Literacy Research Survey, 2014
GOVERNING Guide to Financial Literacy6 GOVERNING Guide to Financial Literacy6
WHERE THE
MONEY COMES FROM
GUIDE TO FINANCIAL LITERACY
GOVERNING Guide to Financial Literacy 7
That quote nicely captures your main chal-lenge as a financial policymaker. Citizens embrace the idea that they should pay for government, but they’re looking to you for a better, fairer or cheaper way to do it.
This section covers the five main sources of state and local revenue: property tax, in-come tax, sales tax, intergovernmental revenue and a category of “other” revenues. It’s cru-cial that you know these sources, how much your jurisdiction depends on them and why.
Property TaxesProperty taxes are the local revenue workhorse.
According to the U.S. Census,1 they account for about 30 percent of all local government revenues. Many state governments also collect property taxes for education, infrastructure improvements and other purposes.
There’s much to like about the property tax. It’s simple to predict how much of it you’ll col-lect, and it’s easy for citizens to comply. The county assessor determines how much a prop-erty owner owes, and that owner need only pay the property tax bill when it arrives.
And yet, property taxes are wildly unpopu-lar. Taxpayers get angry when their property tax bill increases but their income does not, and they struggle to understand how the government determines their property value. That’s why the property tax is often called the “necessary evil” of local revenue systems.
The amount of property taxes a jurisdiction collects is called the tax levy. The tax levy is determined by three factors: the tax base, the tax rate and any preferential tax treatment for certain types of taxpayers. Note that most taxes follow this same basic formula of base-rate-exceptions.
The property tax base is the value of all private land and buildings, and all business-related land
Arthur Godfrey, the famous 1950s TV and radio personality, once said, “I’m proud to pay taxes in America, but I could be just as proud for half the money.”
1SECTION
Property taxes are the local revenue workhorse. According to the U.S. Census, they account for about 30 percent of all local government revenues.
PROPERTY TAX: Tax on the value of real estate; most local governments levy property taxes to fund public safety, parks and other basic public services.
finance defined
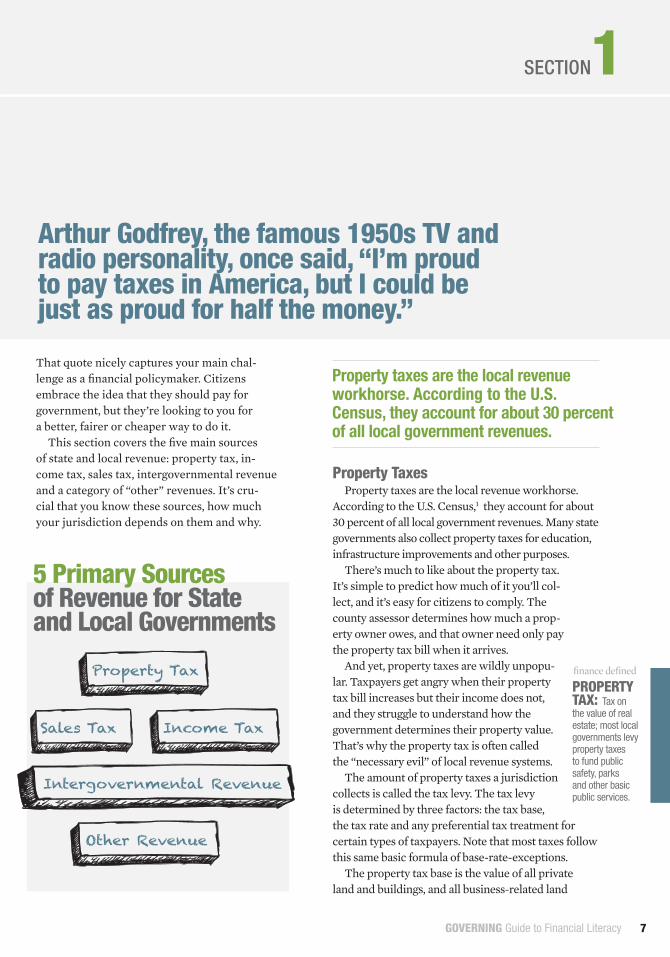
5 Primary Sources of Revenue for State and Local Governments
Property Tax
Intergovernmental Revenue
Income Tax
Other Revenue
Sales Tax
GOVERNING Guide to Financial Literacy8
and buildings within a jurisdiction. The local tax assessor determines that value. The assessor’s job
is to determine the price someone would pay for a property and/or building in the current real estate market. This is broadly known as a property’s market value. It’s difficult to determine market value because real estate is not bought or sold that often. Assessors solve this problem by using statistical models to infer the market price
of properties from the prices of similar proper-ties that were recently sold. Policymakers decide what percentage of the market value is subject to
taxation. This is known as the assessed value. They must also decide the amount of the tax as a percent of the assessed value. This is called the tax rate.
Tax rates are important, but some of the most crucial decisions about property taxes are about when to make exceptions to the base-rate relation-ship. For example, nonprofit organizations like hospitals, universities, churches, synagogues and museums, among others, are not required to pay property taxes. Many senior citizens and others on fixed incomes pay reduced property taxes. The goal here is to keep home ownership affordable even if property values increase. Many jurisdic-tions offer property tax abatements, or temporary property tax reductions or exemptions, to encour-age businesses to locate, stay or grow within their borders. It’s difficult, but essential, to understand the benefits and costs of these exemptions.
If a property’s assessed value increases, but the tax rate stays constant, the tax levy will still increase. In fact, if a property is subject to special assessments, or property taxes that ap-ply only to certain properties, its levy can in-crease even if its assessed value decreases.
Income TaxesApproximately 18 percent of state revenues
are from taxes on the incomes of individuals and businesses. For states that have them, income taxes are the largest or the second largest revenue source. Local income taxes are a tiny portion of the total local government revenue, but they are a crucial component of the local revenue sys-tems for many large cities like New York City, the District of Columbia, Cleveland and Kansas City.2
Like with the property tax, the income tax a person or corporation pays is determined by the tax base, the tax rate and any applicable exceptions.
Tax Preferences: Spending by Another NameTax preferences — sometimes called tax expenditures — are provisions in tax law that allow preferential treatment for certain taxpayers. They include credits, waivers, exemptions, deductions, differential rates and anything else to reduce a person’s or entity’s tax liability. Many are quite specific. For example, some states have reduced tax rates that apply only to particular employers, industries or geographic areas. Tax expenditures are, in effect, a form of spending. They require the government to collect less revenue than it would otherwise collect. Some think they’re unfair because they offer targeted benefits but without the transparency of the traditional budget process. Proponents say that despite these drawbacks, tax expenditures are essential to attract and retain business in today’s competitive economic development environment.
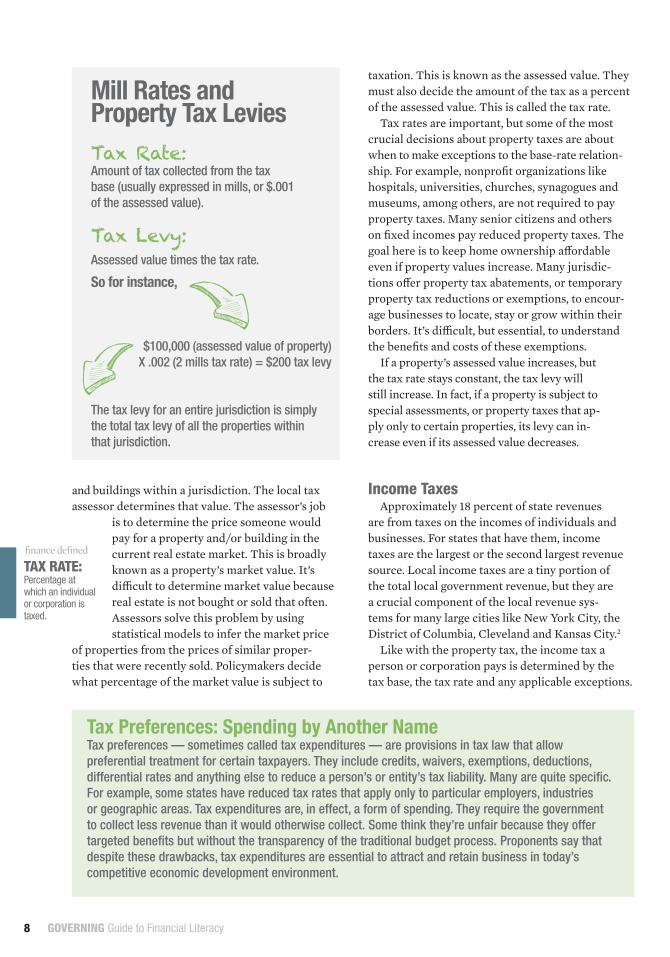
Mill Rates and Property Tax LeviesTax Rate: Amount of tax collected from the tax base (usually expressed in mills, or $.001 of the assessed value). Tax Levy: Assessed value times the tax rate.
So for instance,
$100,000 (assessed value of property) X .002 (2 mills tax rate) = $200 tax levy
The tax levy for an entire jurisdiction is simply the total tax levy of all the properties within that jurisdiction.
TAX RATE:Percentage at which an individual or corporation is taxed.
finance defined
GOVERNING Guide to Financial Literacy 9
In this case, the tax base is taxable income, or total income minus any tax preferences. Most state and local income tax systems offer a standard exemption, or a reduction of taxable income due to certain expenses, which all taxpayers can claim. Every system offers different types of exemptions and other tax benefits related to retirement savings, health insurance, investments in equipment and technology, and dozens of other areas. That’s why taxable income can mean very different things in different jurisdictions.
Most state and local income tax systems are composed of graduated rates and income brackets. For example, for taxpayers in the state of Louisiana in 2013, the tax rate for individuals with taxable incomes less than $12,500 was 2 percent, for taxable incomes greater than $12,500 it was 4 percent, and for taxable incomes greater than $50,000 it was 6 percent.3 In this case, 2, 4 and 6 percent were Louisiana’s marginal tax rates, and the categories of $0-12,499, $12,500-$50,000 and greater than $50,000 were the state’s income tax brackets.
We usually express the income tax that a tax-payer pays in terms of their effective tax rate, or the taxes paid per dollar of total taxable income. Income taxes are progressive because in general, higher income taxpayers pay a higher effective rate. Proponents say this is fair because those with higher incomes should contribute more to the public. Critics say this tax structure discour-ages individuals and businesses from investing. For that reason, many systems tax capital gains, or income related to investments, at a lower rate.
Sales TaxesMost state and local governments in the U.S. col-
lect some form of sales tax. About one-third of state revenues are from sales taxes. For states without an income tax, including Florida, Texas and Washing-ton, most revenues are from sales taxes. Local sales taxes are about 6 percent of total local revenues.4
Sales taxes fund everything from basic state services like education and public health to special-ized local amenities like emergency med-ical services, school buildings and mental health care. A jurisdiction’s sales tax base is composed of all the retail sales of personal property that happen within its borders.
The challenge is that it’s not always clear what is included in that base. For instance, a business pays state sales tax only if it has a substantial portion of its business, known as a sales tax nexus, in that state. When a company does business in multiple states it must use complicated calculations, known as tax apportionment formulas, to determine the sales tax it owes in each state. Online retailers like Amazon.com have argued they should not pay state sales tax because they do not have a nexus in any one state. Some states require consumers to pay a use tax if they purchase a good without paying sales tax. Some states tax construction, personal trainers, catering and other professional services, while many don’t. Sales tax administra-tion is quite complex and costly for this reason.
Once the sales tax base is established, sales tax collections are simple to calculate. A jurisdiction’s
REGRESSIVE TAX: Tax in which people with lower income pay a higher per-centage of their income; sales tax is the most often discussed regressive tax.
finance defined
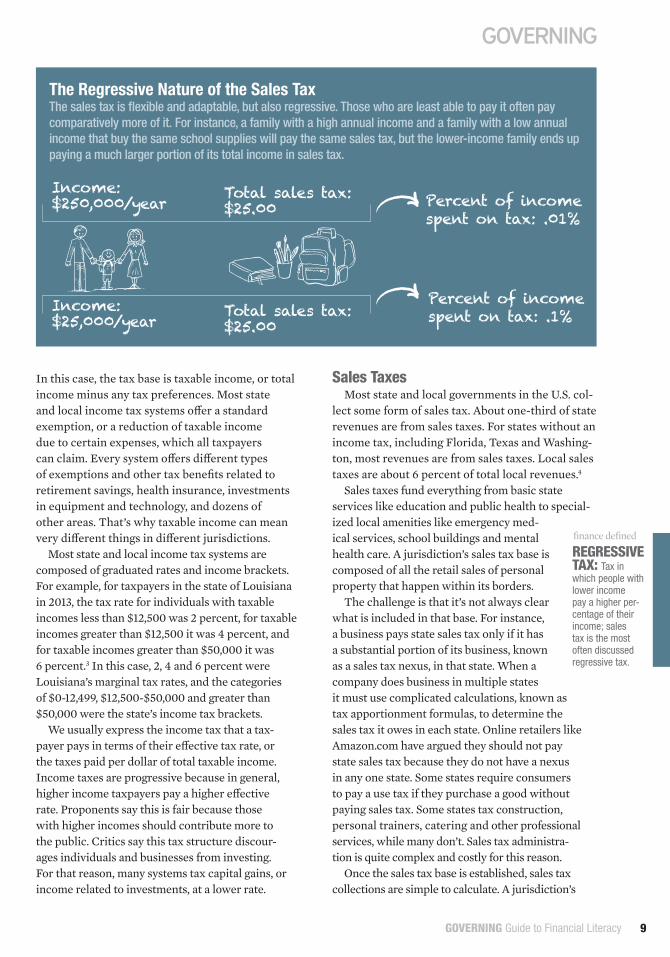
The Regressive Nature of the Sales TaxThe sales tax is flexible and adaptable, but also regressive. Those who are least able to pay it often pay comparatively more of it. For instance, a family with a high annual income and a family with a low annual income that buy the same school supplies will pay the same sales tax, but the lower-income family ends up paying a much larger portion of its total income in sales tax.
Income: $250,000/year
Income: $25,000/year
Total sales tax: $25.00
Total sales tax: $25.00
Percent of income spent on tax: .01%
Percent of income spent on tax: .1%
GOVERNING Guide to Financial Literacy10
sales tax collections are simply the sales tax base, however defined, multiplied by its sales tax rate.
The sales tax is flexible and adaptable, but also regressive. That is, those who are least able to pay it often pay comparatively more of it. Consider, for instance, an item like children’s school supplies. Most families need to buy them and they’re usually not sales tax exempt. If a family with an annual income of $25,000 buys the same supplies as a family with an annual income of $250,000, and both pay $25 in sales taxes for these same essential items, then the lower-income family is paying a much larger portion
of its total income in sales tax. Opponents say this makes the sales tax inherently unfair.
Intergovernmental RevenuesAbout one-third of state and local
revenues come from other units of government. For local governments, most of this is support from their state. For state governments, most of this is support from the federal govern-ment’s Medicaid program.6
Many states offer this support, oddly enough, to counteract the effects of state laws that limit how much revenue local governments can collect. These limits are broadly known as tax and expenditure limitations, or “tells.”
Intergovernmental revenue is the proverbial double-edged sword. Because of it, state and local
governments are able to deliver many services they could not afford otherwise. It also allows higher levels of government to equalize local revenue collections, often through formulas that distribute aid to poorer jurisdictions. And yet, these revenues also introduce enormous uncertainty. During the Great Recession, many state governments slashed local aid programs. The federal government has reduced or eliminated many sources of support for states and municipalities. A recent Govern-ment Accountability Office (GAO) study found the potential for cuts to intergovernmental revenues are one of the most significant threats to state and local governments’ long-term fiscal health.7
“Other” RevenuesThe final category of revenues includes dozens
of much smaller sources. About 10 percent of local revenues are from taxes on utilities, such as water, electricity, wireless communications and cable tele-vision. Tuition revenues from state universities are technically a user charge. Many states and municipal-ities now charge fees for everything from pet licenses to state parks, and local governments have started to collect impact fees from real estate developers to offset the costs of infrastructure improvements. Some nonprofits make payments in lieu of taxes, or PILOTs, to backfill some of what they don’t pay in other taxes. In 1990 these other revenues accounted for less than 5 percent of local revenues. Today they account for 20 percent. Other revenues, especially charges and fees, are generally more politically acceptable, but also more difficult to forecast and plan.8 G
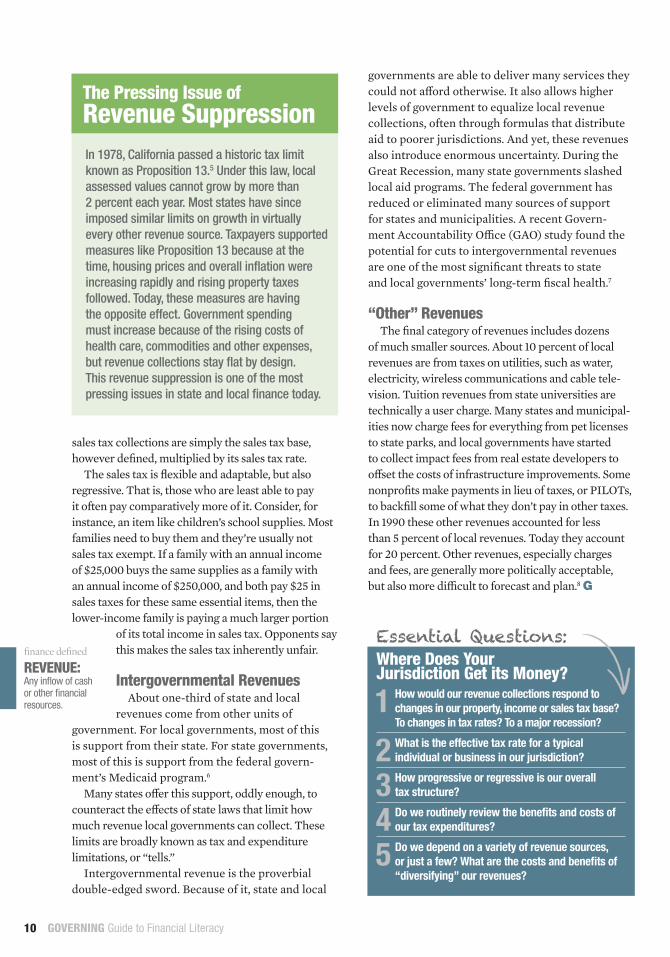
The Pressing Issue of Revenue SuppressionIn 1978, California passed a historic tax limit known as Proposition 13.5 Under this law, local assessed values cannot grow by more than 2 percent each year. Most states have since imposed similar limits on growth in virtually every other revenue source. Taxpayers supported measures like Proposition 13 because at the time, housing prices and overall inflation were increasing rapidly and rising property taxes followed. Today, these measures are having the opposite effect. Government spending must increase because of the rising costs of health care, commodities and other expenses, but revenue collections stay flat by design. This revenue suppression is one of the most pressing issues in state and local finance today.
1 How would our revenue collections respond to changes in our property, income or sales tax base?
To changes in tax rates? To a major recession?
2 What is the effective tax rate for a typical individual or business in our jurisdiction?
3 How progressive or regressive is our overall tax structure?
4 Do we routinely review the benefits and costs of our tax expenditures?
5 Do we depend on a variety of revenue sources, or just a few? What are the costs and benefits of
“diversifying” our revenues?
Essential Questions: Where Does Your Jurisdiction Get its Money?REVENUE:
Any inflow of cash or other financial resources.
finance defined
GOVERNING Guide to Financial Literacy 11
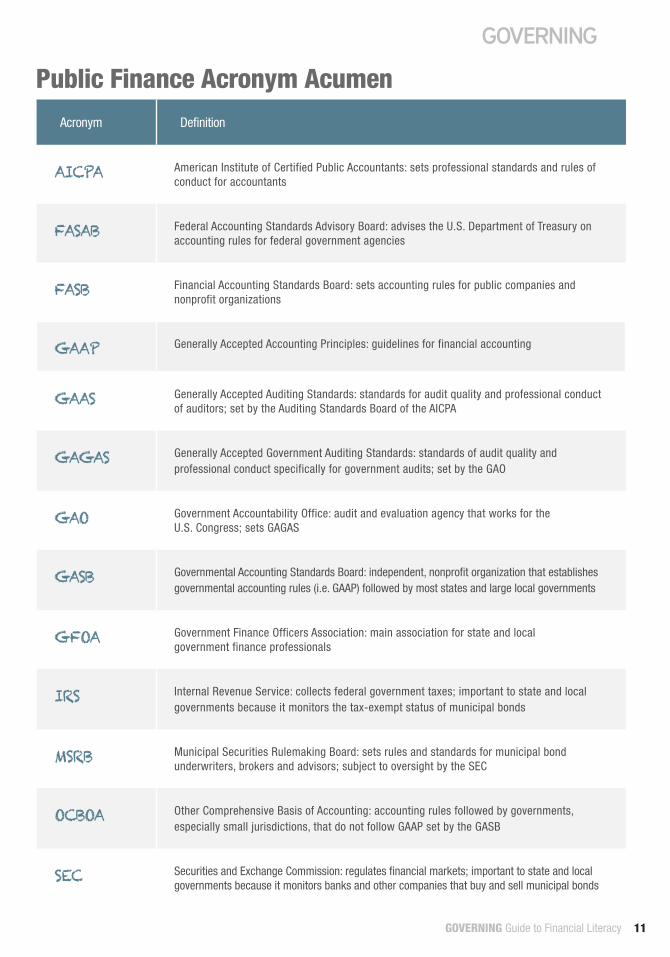
Acronym Definition
AICPA American Institute of Certified Public Accountants: sets professional standards and rules of conduct for accountants
FASAB Federal Accounting Standards Advisory Board: advises the U.S. Department of Treasury on accounting rules for federal government agencies
FASB Financial Accounting Standards Board: sets accounting rules for public companies and nonprofit organizations
GAAP Generally Accepted Accounting Principles: guidelines for financial accounting
GAAS Generally Accepted Auditing Standards: standards for audit quality and professional conduct of auditors; set by the Auditing Standards Board of the AICPA
GAGAS Generally Accepted Government Auditing Standards: standards of audit quality and professional conduct specifically for government audits; set by the GAO
GAO Government Accountability Office: audit and evaluation agency that works for the U.S. Congress; sets GAGAS
GASB Governmental Accounting Standards Board: independent, nonprofit organization that establishes governmental accounting rules (i.e. GAAP) followed by most states and large local governments
GFOA Government Finance Officers Association: main association for state and local government finance professionals
IRS Internal Revenue Service: collects federal government taxes; important to state and local governments because it monitors the tax-exempt status of municipal bonds
MSRB Municipal Securities Rulemaking Board: sets rules and standards for municipal bond underwriters, brokers and advisors; subject to oversight by the SEC
OCBOA Other Comprehensive Basis of Accounting: accounting rules followed by governments, especially small jurisdictions, that do not follow GAAP set by the GASB
SEC Securities and Exchange Commission: regulates financial markets; important to state and local governments because it monitors banks and other companies that buy and sell municipal bonds
Public Finance Acronym Acumen
GOVERNING Guide to Financial LiteracyGOVERNING Guide to Financial Literacy
GUIDE TO FINANCIAL LITERACY
WHERE THE MONEY GOES
12
GOVERNING Guide to Financial Literacy 13
For state governments, it’s hundreds of millions. You are responsible for how your jurisdiction spends this money.
But don’t confuse being responsible for money with keeping track of every penny. That’s the job of your dedicated finance and accounting staff. Your job is to set priorities, and to make sure your juris-diction’s money stays connected to those priorities. To help you better understand this role, this section covers two main topics:
1. How to think about costs.2. How state and local budgets are made.
How to Think About CostsThe budget is your center of financial gravity.
It’s where your jurisdiction translates its priorities into a plan to spend its limited resources. Unlike the federal government, state and local govern-ments can’t spend more money than they collect. As a state or local policymaker you can have any-thing you want, but you can’t have everything you want. That’s why it’s imperative to know what your programs and services cost, and what they might cost if you change your policies and priorities.
To be clear, you don’t need to know every detail of every cost. That would overwhelm even the most sophisticated financial analyst. Instead, you can get almost all the information you need if you remember two simple principles:
1. Get to full cost.2. Always question “average” costs.
For example, imagine a city government’s commu-nity development department is making its copying budget for the coming year. Its three divisions share a copy machine. The code compliance division uses the copier occasionally, however, the planning division uses it more frequently and the business licensing division uses it the most. How much of each division’s budget should be allocated to copying costs?
The department leases the copier so it should plan to pay a vendor a set lease payment each month. It should also budget for repairs, and for commodities like toner and paper. The lease, maintenance and commodities are all direct costs, or costs related only to making copies.
Direct costs are just the start. The copier needs electricity and space within the office. Additionally, the department office manag-er will spend some of his or her time paying the lease, coordinating the repairs and order-ing supplies. These are indirect costs, or costs that apply both to copying and to other parts of the department’s operations. Indirect costs are often called overhead or administrative costs.
Indirect costs are more difficult to measure. The department needs to know how much of the total electricity the copier uses, how much
A typical local government spends tens of millions of dollars each year on dozens of different programs and services.
2SECTION
Your job is to set priorities, and to make sure your jurisdiction’s money stays connected to those priorities.
GOVERNING Guide to Financial Literacy14
space the copier occupies and how much time the office manager spends “managing” the copier. This information isn’t always available, so analysts and accountants usually have to estimate these costs. With those estimates in place the department can calculate the full cost, or the direct costs plus the indirect costs, of copying. More complicated programs and ser-vices can have dozens of indirect cost items.
How much should each division cover? The department could simply assign each division one-third of the full costs. In this case, code
compliance and planning will need to find other money or cut other services to allow business licensing to contribute less than its share of the full cost. This is not wrong or bad, per se. And in fact, these types of “subsidies” can be part of a clear policy priority. For services like licenses, the re-cipient, or in this case a business, must pay the license fees. Most local governments set the license fee equal to the full cost of issuing the license. The city might deliber-ately set its business license fee well below
full cost to issue it as a way of supporting local businesses. The trade-off is that code compliance and planning service users will likely pay high-er costs or experience lower-quality service.
The problem with subsidies is that we often don’t known about them. Many states and municipalities don’t collect or analyze the information needed to get to full cost. Instead, they use simple cost allo-cation rules like the “one-third” rule mentioned above. Or even worse, they ignore indirect costs altogether. In the simple copier example, a better cost allocation method would be to track the number of copies each department makes and assign each department a share of the total cost equal to its share of the total number of copies. That sort of direct measurement and allocation is quite difficult for more complex services, especially when indirect costs are shared across multiple programs, services or jurisdictions. Once you understand full costs and subsidies, you also realize that across-the-board
cuts, hiring freezes and other similar budgeting strategies rarely affect all programs equally.
The copier example also illustrates the second crucial principle: Always question “average costs.” Some of the costs like the lease payment are fixed costs, meaning they’re the same regardless of the number of copies made. Paper is a variable cost, meaning it increases exactly in proportion to the number of copies made. Other costs, like main-tenance, have both a fixed and a variable compo-nent. Every program or service has a different cost behavior, or blend of fixed and variable costs.
Fixed costs are a key part of the cost behavior for the copier. As the department makes more copies, those fixed costs are distributed across a larger number of copies. In other words, there’s an econo-my of scale in copying. The cost per copy for 1,000 copies will be much more than the cost per copy for 10,000 copies.
That takes us back to average costs. When someone quotes an “average” cost per unit of a program or service, the obvious next ques-tion is, “Average of what?” At what level of service or output? Under what assumptions about fixed and variable costs? Does “average” include both the direct and indirect costs?
So what do these cost concepts mean for policy decisions? Say the community development depart-ment is facing a large budget shortfall and is consid-ering changing its copying practices to save money. It might consider outsourcing its copying to a local printer. But without detailed knowledge of the full cost per copy at different quantities, it’s not possible to know if outsourcing will save money. It might allow other departments to use the copier for a small fee. This would require accurate information about the full cost to set a fee that covers the full costs plus an additional “profit.” It might try to reduce copying costs by spending less on maintenance or repairs. This might not matter to code compliance or to en-forcement, but a prolonged copier breakdown might mean longer business license turnaround times. It’s important to weigh the full cost of business licens-ing’s copying needs against the saved money and the potential risk of a decline in service quality.
How State and Local Budgets are MadeBudget making is an obligation. And like other
things we’re bound to do, most of us politely avoid it if we can. This is unfortunate because financial-ly literate policymakers think of budgeting as an opportunity — it’s an invitation to tell a story about
GENERAL FUND: Main operating fund for a local or state government; assets, liabilities, revenues and expenditures are recognized in the general fund unless recognized in a different fund.
finance defined
Across-the-board cuts, hiring freezes and other similar budgeting strategies rarely affect all programs equally.
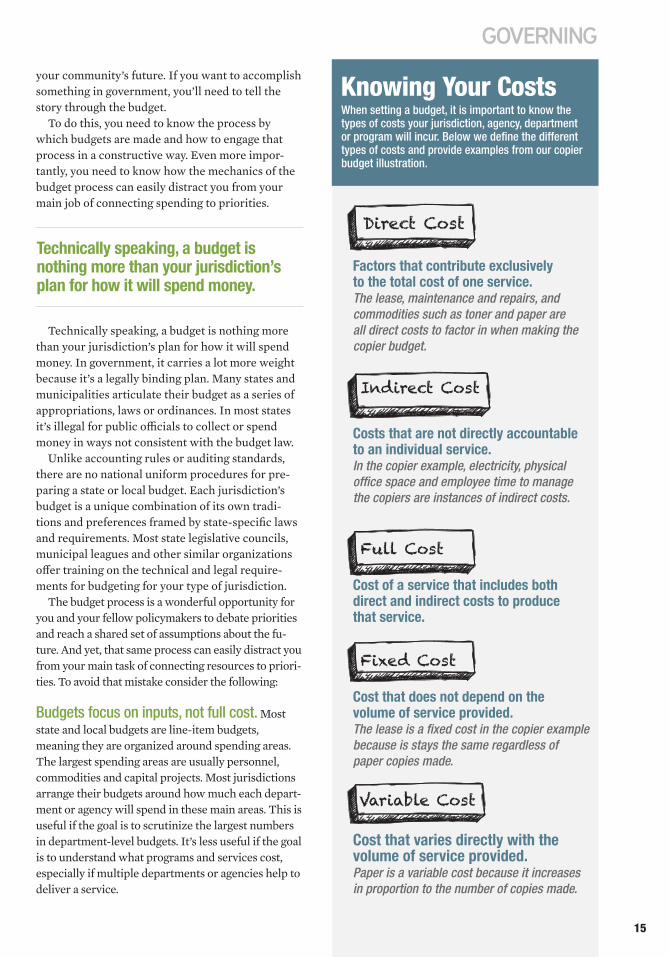
Factors that contribute exclusively to the total cost of one service.The lease, maintenance and repairs, and commodities such as toner and paper are all direct costs to factor in when making the copier budget.
Indirect Cost
Costs that are not directly accountable to an individual service.In the copier example, electricity, physical office space and employee time to manage the copiers are instances of indirect costs.
Full Cost
Cost of a service that includes both direct and indirect costs to produce that service.
Fixed Cost
Cost that does not depend on the volume of service provided.The lease is a fixed cost in the copier example because is stays the same regardless of paper copies made.
Variable Cost
Cost that varies directly with the volume of service provided.Paper is a variable cost because it increases in proportion to the number of copies made.
When setting a budget, it is important to know the types of costs your jurisdiction, agency, department or program will incur. Below we define the different types of costs and provide examples from our copier budget illustration.
Knowing Your Costsyour community’s future. If you want to accomplish something in government, you’ll need to tell the story through the budget.
To do this, you need to know the process by which budgets are made and how to engage that process in a constructive way. Even more impor-tantly, you need to know how the mechanics of the budget process can easily distract you from your main job of connecting spending to priorities.
Technically speaking, a budget is nothing more than your jurisdiction’s plan for how it will spend money. In government, it carries a lot more weight because it’s a legally binding plan. Many states and municipalities articulate their budget as a series of appropriations, laws or ordinances. In most states it’s illegal for public officials to collect or spend money in ways not consistent with the budget law.
Unlike accounting rules or auditing standards, there are no national uniform procedures for pre-paring a state or local budget. Each jurisdiction’s budget is a unique combination of its own tradi-tions and preferences framed by state-specific laws and requirements. Most state legislative councils, municipal leagues and other similar organizations offer training on the technical and legal require-ments for budgeting for your type of jurisdiction.
The budget process is a wonderful opportunity for you and your fellow policymakers to debate priorities and reach a shared set of assumptions about the fu-ture. And yet, that same process can easily distract you from your main task of connecting resources to priori-ties. To avoid that mistake consider the following:
Budgets focus on inputs, not full cost. Most state and local budgets are line-item budgets, meaning they are organized around spending areas. The largest spending areas are usually personnel, commodities and capital projects. Most jurisdictions arrange their budgets around how much each depart-ment or agency will spend in these main areas. This is useful if the goal is to scrutinize the largest numbers in department-level budgets. It’s less useful if the goal is to understand what programs and services cost, especially if multiple departments or agencies help to deliver a service.
Technically speaking, a budget is nothing more than your jurisdiction’s plan for how it will spend money.
Direct Cost
15
GOVERNING Guide to Financial Literacy16
Budget balance does not ensure long-term financial health. The budget process is a success if the budget is passed on time. That often means making spending decisions on short notice and without carefully considering the long-term consequences. In many jurisdictions, it’s possible to “balance” the budget with accounting gim-micks, one-time revenues, inter-fund transfers and other tricks that can mask a large mismatch be-tween revenues and spending. Short-sighted tricks like these can seriously damage your jurisdiction’s ability to achieve its long-term goals.
It’s not a priority just because it’s in the budget. A lot of the spending in state and local budgets started as political favors, policy exper-iments, demonstration projects and many other temporary, targeted types of spending. But these temporary items often morph into permanent spending, mostly because we rarely take the time to ask how all of our spending connects to larger policy priorities. This is especially true of entitlements, or programs where spending levels are determined by laws outside the budget. More than half of state spending is on entitlements like Medicaid and education, where small changes in policies can have big fiscal implications. Howev-er, most of these decisions are made outside of the budget process.9 G
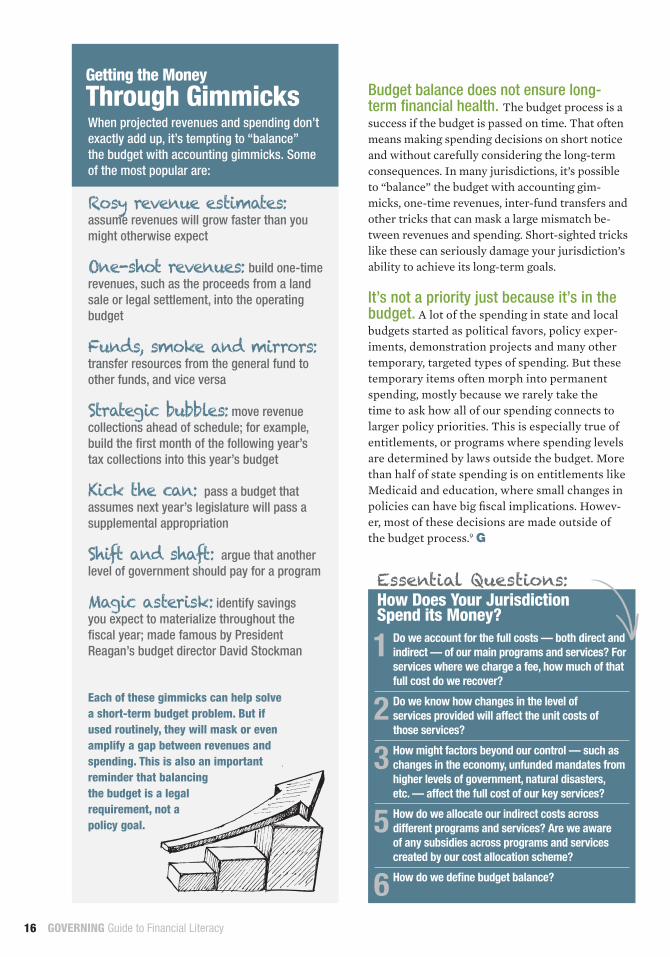
1 Do we account for the full costs — both direct and indirect — of our main programs and services? For
services where we charge a fee, how much of that full cost do we recover?
2 Do we know how changes in the level of services provided will affect the unit costs of
those services?
3 How might factors beyond our control — such as changes in the economy, unfunded mandates from
higher levels of government, natural disasters, etc. — affect the full cost of our key services?
5 How do we allocate our indirect costs across different programs and services? Are we aware
of any subsidies across programs and services created by our cost allocation scheme?
6 How do we define budget balance?
Essential Questions: How Does Your Jurisdiction Spend its Money?
Getting the Money Through GimmicksWhen projected revenues and spending don’t exactly add up, it’s tempting to “balance” the budget with accounting gimmicks. Some of the most popular are: Rosy revenue estimates: assume revenues will grow faster than you might otherwise expect One-shot revenues: build one-time revenues, such as the proceeds from a land sale or legal settlement, into the operating budget Funds, smoke and mirrors: transfer resources from the general fund to other funds, and vice versa Strategic bubbles: move revenue collections ahead of schedule; for example, build the first month of the following year’s tax collections into this year’s budget Kick the can: pass a budget that assumes next year’s legislature will pass a supplemental appropriation Shift and shaft: argue that another level of government should pay for a program Magic asterisk: identify savings you expect to materialize throughout the fiscal year; made famous by President Reagan’s budget director David Stockman
Each of these gimmicks can help solve a short-term budget problem. But if used routinely, they will mask or even amplify a gap between revenues and spending. This is also an important reminder that balancing the budget is a legal requirement, not a policy goal.
GOVERNING Guide to Financial Literacy 17
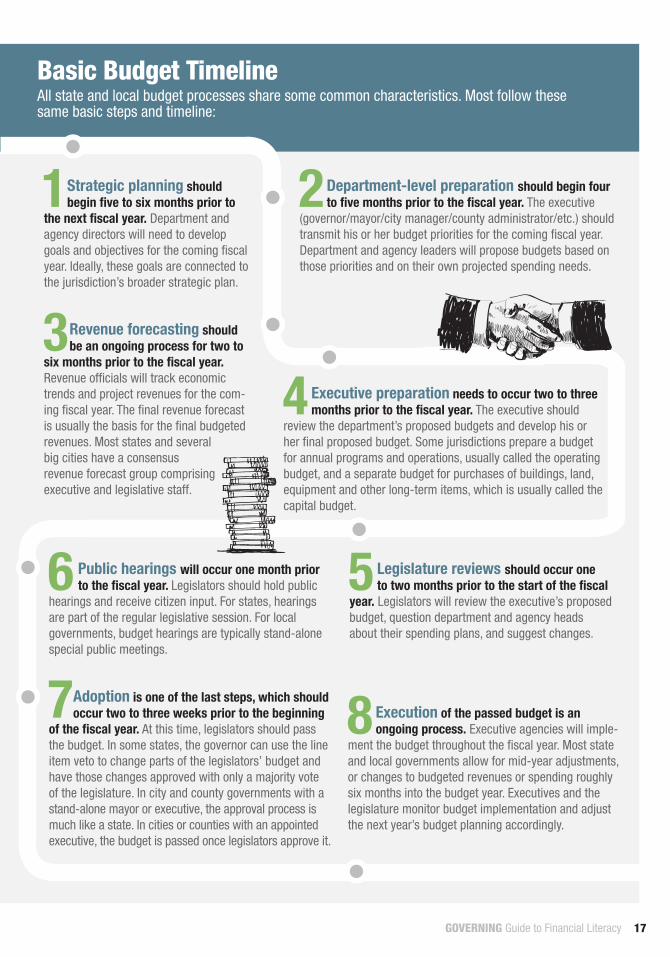
Basic Budget TimelineAll state and local budget processes share some common characteristics. Most follow these same basic steps and timeline:
8Execution of the passed budget is an ongoing process. Executive agencies will imple-
ment the budget throughout the fiscal year. Most state and local governments allow for mid-year adjustments, or changes to budgeted revenues or spending roughly six months into the budget year. Executives and the legislature monitor budget implementation and adjust the next year’s budget planning accordingly.
1 Strategic planning should begin five to six months prior to
the next fiscal year. Department and agency directors will need to develop goals and objectives for the coming fiscal year. Ideally, these goals are connected to the jurisdiction’s broader strategic plan.
5Legislature reviews should occur one to two months prior to the start of the fiscal
year. Legislators will review the executive’s proposed budget, question department and agency heads about their spending plans, and suggest changes.
6 Public hearings will occur one month prior to the fiscal year. Legislators should hold public
hearings and receive citizen input. For states, hearings are part of the regular legislative session. For local governments, budget hearings are typically stand-alone special public meetings.
7 Adoption is one of the last steps, which should occur two to three weeks prior to the beginning
of the fiscal year. At this time, legislators should pass the budget. In some states, the governor can use the line item veto to change parts of the legislators’ budget and have those changes approved with only a majority vote of the legislature. In city and county governments with a stand-alone mayor or executive, the approval process is much like a state. In cities or counties with an appointed executive, the budget is passed once legislators approve it.
3 Revenue forecasting should be an ongoing process for two to
six months prior to the fiscal year. Revenue officials will track economic trends and project revenues for the com-ing fiscal year. The final revenue forecast is usually the basis for the final budgeted revenues. Most states and several big cities have a consensus revenue forecast group comprising executive and legislative staff.
2 Department-level preparation should begin four to five months prior to the fiscal year. The executive
(governor/mayor/city manager/county administrator/etc.) should transmit his or her budget priorities for the coming fiscal year. Department and agency leaders will propose budgets based on those priorities and on their own projected spending needs.
4 Executive preparation needs to occur two to three months prior to the fiscal year. The executive should
review the department’s proposed budgets and develop his or her final proposed budget. Some jurisdictions prepare a budget for annual programs and operations, usually called the operating budget, and a separate budget for purchases of buildings, land, equipment and other long-term items, which is usually called the capital budget.
GUIDE TO FINANCIAL LITERACY
INVESTING FOR THE LONG HAUL
GOVERNING Guide to Financial Literacy18
Infrastructure systems, such as public transit, educa-tion, water and telecommunications systems, are the backbone of your community’s long-term social and economic health. You must carefully invest public money to preserve, maintain and extend these systems.
This section focuses on three questions about how you invest in big ticket items:
1. Which projects can we afford? 2. Which financing tool is best? 3. How do we get the money? Which Projects Can We Afford?
State and local governments devote a consider-able portion of their spending to items designed to last more than one year. These are called capital assets. They include vehicles, buildings, land, roads and water treatment facilities, among many oth-ers. Governments also invest in expensive intangi-ble items like information technology systems or licenses to use certain products and services. These investments don’t result in a physical item, but they are an essential part of delivering services.
Demands for capital investments are endless, but resources are limited. Like budgeting for operations, the main challenge with capital investments is to set priorities. Priority-setting tends to happen two ways:
Capital budget: This is where your jurisdiction identifies the capital investments it plans to make in the near future, usually in the next three to five years. Most state and local governments also develop a capi-tal improvement plan. This is a document that identifies
all long-term capital spending needs, usually 10 to 20 years in the future. Think of the capital budget as the highest priority projects from the capital improve-ment plan. Each jurisdiction follows a different path to identify projects, evaluate the benefits and costs, and connect projects to broader strategic goals. Take the time to learn what path your jurisdiction follows.
Debt capacity: Most state and local governments finance the bulk of their major capital projects with debt. To finance a project with debt simply means someone lends you the money, you do the project, then you pay back the borrowed money, plus some interest, over the next several years. Debt capacity has two components:
Debt limits are state or local laws that restrict the amount of money a jurisdiction can borrow. Some-times they apply to certain types of debt but not to others, and sometimes a government can exceed them if voters approve. Regardless of the details, debt limits make it more difficult to finance cap-ital projects, and that forces priority-setting. Debt affordability is a jurisdiction’s future ability to pay down debt. It’s difficult to evaluate because future financial resources are closely linked to growth in a jurisdiction’s tax base, its population growth and other factors. At the same time, debt affordability is a crucial part of priority-setting because it’s entirely possible for a government to take on debt it can’t repay while staying well below its legal debt limit. If your juris-diction does not have a formal policy on debt afford-ability or has not studied it, encourage staff to do so.
State and local governments are in the business of long-term stability. Infrastructure is a crucial ingredient of that stability.
3SECTION
GOVERNING Guide to Financial Literacy 19
GOVERNING Guide to Financial Literacy20
Which Financing Tool is Best?There are three main ways to finance state and
local capital investments: pay-as-you-go, munic-ipal bonds and public-private partnerships.
Many capital investments are financed pay-as-you-go. This means the jurisdiction pays for the project with existing financial resources. (Pay-as-you-go should not be confused with the federal government’s version of PAYGO, which means new federal spending must be paid for by cutting existing federal spending.) Sources of pay-as-you-go financing include savings from previous budgets and special capital project funds where the jurisdic-tion “saves up” money for projects over time.
However, most state and local governments can-not “save up” enough to finance multimillion dollar capital improvements. So instead, they issue munic-ipal bonds. A bond is like a mortgage. The borrower takes money from a lender and agrees to pay it back over time with interest. A municipal bond is any bond issued by a state or local government.
The vast majority of “munis” — as investors call municipal bonds — are tax exempt. Investors who buy them receive interest payments from the issuing government, but do not pay federal income taxes on those interest payments. Those interest proceeds are also exempt from most state and local income taxes. This tax exemption makes munis an attractive option for investors who want to earn stable, predictable income for retirement, college savings or other long-term investments. More than half of the $4 trillion in municipal bonds currently in circulation are held by individual investors.10
In a public-private partnership (PPP or P3) an outside investor finances and builds a project on behalf of the government. In exchange, that investor(s) takes some or all of the future revenues generated by the project. The private partner can make money if it can properly manage the financing and construction risks, and the government can save money and preserve debt
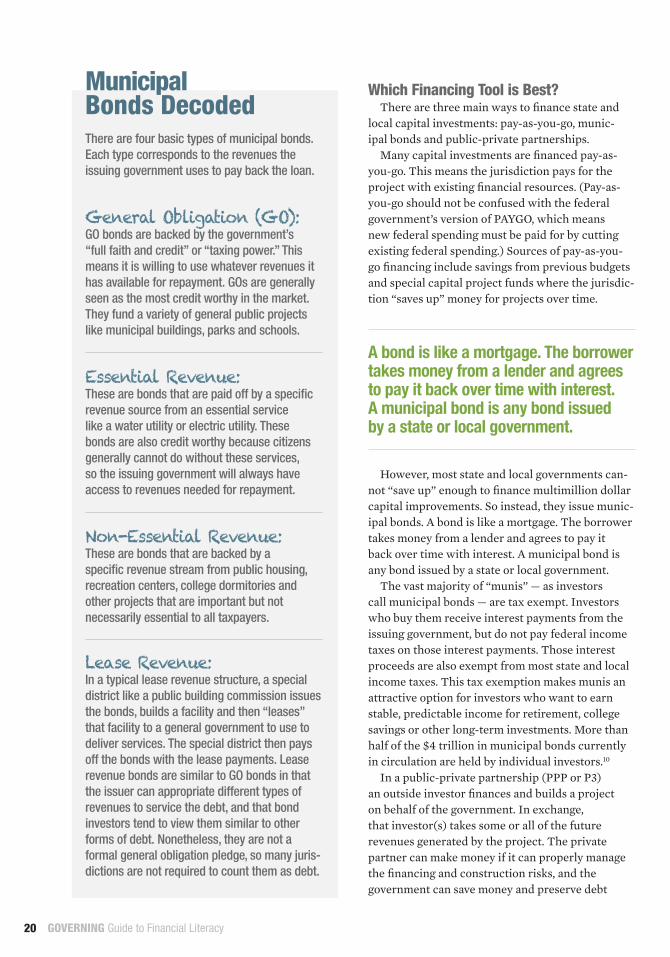
Municipal Bonds DecodedThere are four basic types of municipal bonds. Each type corresponds to the revenues the issuing government uses to pay back the loan.
General Obligation (GO): GO bonds are backed by the government’s “full faith and credit” or “taxing power.” This means it is willing to use whatever revenues it has available for repayment. GOs are generally seen as the most credit worthy in the market. They fund a variety of general public projects like municipal buildings, parks and schools.
Essential Revenue: These are bonds that are paid off by a specific revenue source from an essential service like a water utility or electric utility. These bonds are also credit worthy because citizens generally cannot do without these services, so the issuing government will always have access to revenues needed for repayment.
Non-Essential Revenue: These are bonds that are backed by a specific revenue stream from public housing, recreation centers, college dormitories and other projects that are important but not necessarily essential to all taxpayers.
Lease Revenue: In a typical lease revenue structure, a special district like a public building commission issues the bonds, builds a facility and then “leases” that facility to a general government to use to deliver services. The special district then pays off the bonds with the lease payments. Lease revenue bonds are similar to GO bonds in that the issuer can appropriate different types of revenues to service the debt, and that bond investors tend to view them similar to other forms of debt. Nonetheless, they are not a formal general obligation pledge, so many juris-dictions are not required to count them as debt.
A bond is like a mortgage. The borrower takes money from a lender and agrees to pay it back over time with interest. A municipal bond is any bond issued by a state or local government.
GOVERNING Guide to Financial Literacy 21
capacity for other projects. PPPs have worked well for projects that have a clear user charge, such as toll roads, water filtration facilities and port infrastructure. Many state governments and federal government agencies offer tools to facilitate PPPs.
A recent PPP example is the Cedar Water Treat-ment facility, which is operated by Seattle Public Utilities (SPU). About 15 years ago, SPU drafted plans for a new water treatment facility to serve its rapidly growing customer base. Given that growth, and SPU’s customers’ desire to use the most en-vironmentally friendly technology available, SPU kept the option to modify the technology used to treat water and expand the capacity of the facility, if necessary. This would not have been possible with a traditional bond-financed structure. SPU part-nered with an engineering firm, which financed,
designed, built and currently operates this facility on behalf of SPU. In exchange, the engineering firm receives a portion of the water-use charges the facility generates.11
How Do We Get the Money?Once you’ve decided to access the capital
markets, you must confront a number of policy and strategy questions.
1. Should we seek a bond rating? A bond rating is an outside expert’s opinion
on whether your jurisdiction will repay a bond. Or put differently, ratings agencies assess the likelihood an issuer will default, or fail to repay a bond. Three major companies issue most of the ratings on municipal bonds. Each applies its own
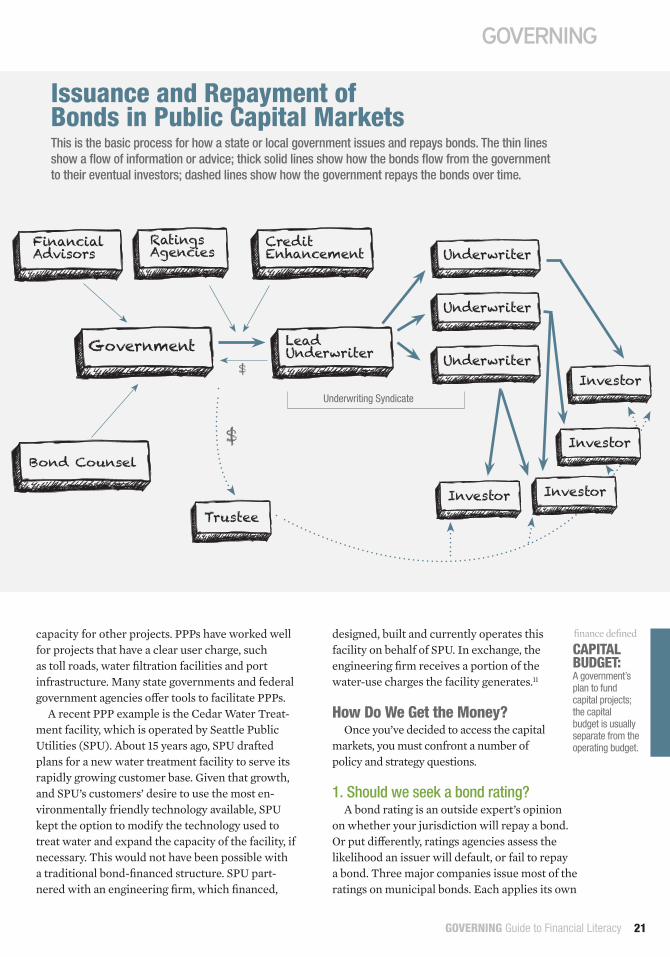
Issuance and Repayment of Bonds in Public Capital MarketsThis is the basic process for how a state or local government issues and repays bonds. The thin lines show a flow of information or advice; thick solid lines show how the bonds flow from the government to their eventual investors; dashed lines show how the government repays the bonds over time.
Ratings Agencies
Government$
$
Underwriting Syndicate
Financial Advisors
Credit Enhancement
Lead Underwriter
Underwriter
Investor
Underwriter
Underwriter
Trustee
Bond Counsel
CAPITAL BUDGET: A government’s plan to fund capital projects; the capital budget is usually separate from the operating budget.
finance defined
Investor Investor
Investor
GOVERNING Guide to Financial Literacy22
criteria when rating a jurisdiction, but all three pay careful attention to some of the same factors:
Stable revenue streams. Bonds backed by robust, predictable revenue streams (e.g., property taxes) earn better ratings than bonds backed by revenues from more specula-tive projects (e.g., convention centers).
Demographics. Jurisdictions with grow-ing populations and wealthy residents
earn better ratings than those with stagnant populations or below average incomes.
Financial management and governance. A juris-diction will be better rated if it produces financial reports on time, maintains a rainy day fund or other budget stabilization tools, effectively manages
its cash flows, has a clear capital budgeting plan and has policies to prepare for contingencies.
Bond ratings matter. Improving your rating even by one notch can save money — perhaps hundreds of thousands of dollars — in borrowing costs. That said, some policymakers treat their jurisdiction’s bond rating as a grade on the quality of life in their community or on their effectiveness as a leader. Leadership and quality of life are only indirectly related to ratings. Fundamentally, a bond rating is nothing more than a statement about wheth-er you will make good on a bond obligation.
2. Should we hire a financial adviser? Most state and local governments do not have
the staff expertise to navigate the municipal bond market. A financial adviser is an outside expert,
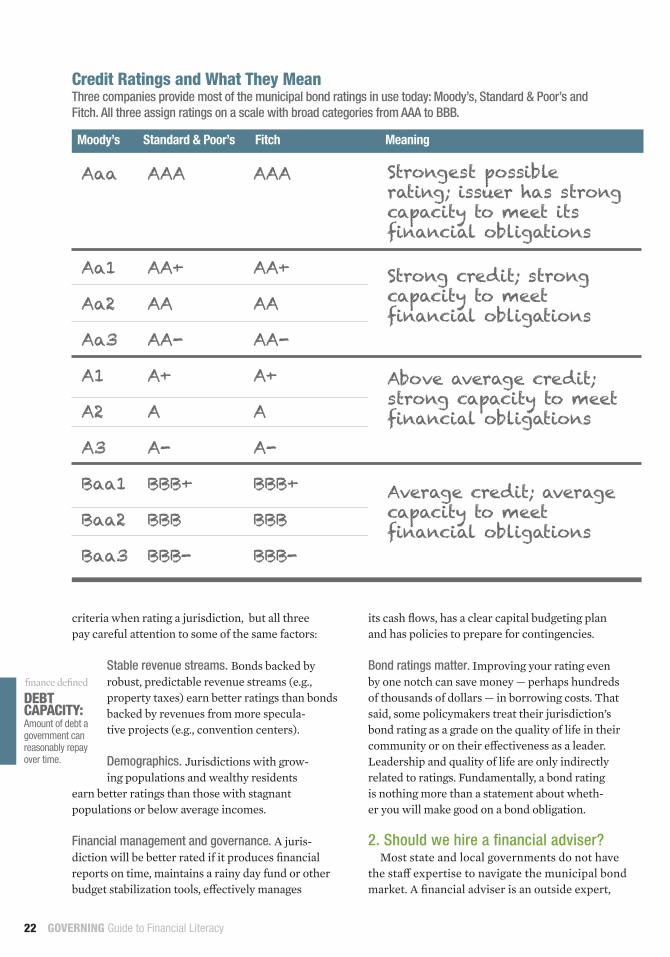
Moody’s Standard & Poor’s Fitch Meaning
Aaa AAA AAA
Aa1 AA+ AA+
Aa2 AA AA
Aa3 AA- AA-
A1 A+ A+
A2 A A
A3 A- A-
Baa1 BBB+ BBB+
Baa2 BBB BBB
Baa3 BBB- BBB-
Credit Ratings and What They MeanThree companies provide most of the municipal bond ratings in use today: Moody’s, Standard & Poor’s and Fitch. All three assign ratings on a scale with broad categories from AAA to BBB.
DEBT CAPACITY: Amount of debt a government can reasonably repay over time.
finance defined
Average credit; average capacity to meet financial obligations
Above average credit; strong capacity to meet financial obligations
Strong credit; strong capacity to meet financial obligations
Strongest possible rating; issuer has strong capacity to meet its financial obligations
GOVERNING Guide to Financial Literacy 23
sometimes connected to an investment bank, who can help your jurisdiction manage the risks of accessing the public capital markets. Financial advisers can add tremendous value to your debt management process. At the same time, the municipal bond market’s regulators have begun to carefully scrutinize relation-ships among issuers and financial advisers. If you employ one, be sure to understand the types of advice they can and cannot offer.
3. Competitive or negotiated sale? An underwriter is a “middle man” between
you and investors. Underwriters make money by lending you money, charging you a fee and then selling your bonds to investors at a higher price than what they paid you. When the underwriting process is complete, you have the money to begin your project. When an underwriter or other broker sells the bonds to an investor they notify the paying agent for the bonds. Later on you pay your principal and interest on the bonds to the paying agent, and they distribute those payments to the investors.
There are two ways to engage an underwrit-er. One is a competitive sale. In this model, you develop the basic terms of the sale — how much money to borrow, what revenues to pledge for repayment, etc. — and then select an underwrit-er through an auction. The underwriter who offers to loan you money at the stated terms for the lowest interest rate wins the auction.
The alternative is a negotiated sale. Here you select the underwriter in advance and negotiate the terms. Negotiated sales typi-cally happen through teams of underwrit-ers known as an underwriting syndicate.
There are advantages and disadvantages to each method of sale. Competitive sales are
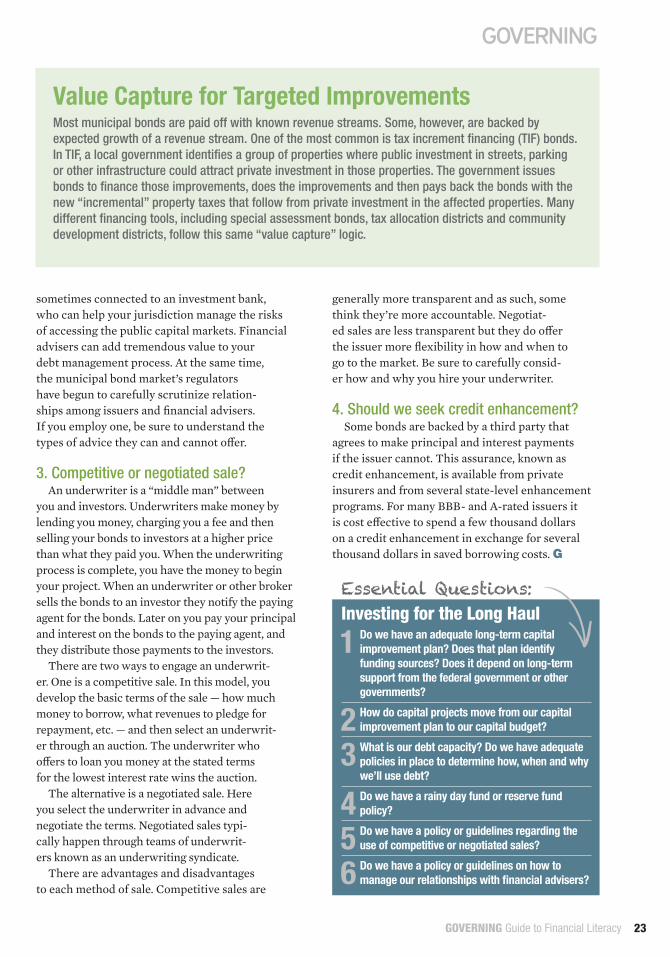
1 Do we have an adequate long-term capital improvement plan? Does that plan identify
funding sources? Does it depend on long-term support from the federal government or other governments?
2 How do capital projects move from our capital improvement plan to our capital budget?
3 What is our debt capacity? Do we have adequate policies in place to determine how, when and why
we’ll use debt?
4 Do we have a rainy day fund or reserve fund policy?
5 Do we have a policy or guidelines regarding the use of competitive or negotiated sales?
6 Do we have a policy or guidelines on how to manage our relationships with financial advisers?
Essential Questions: Investing for the Long Haul
Value Capture for Targeted ImprovementsMost municipal bonds are paid off with known revenue streams. Some, however, are backed by expected growth of a revenue stream. One of the most common is tax increment financing (TIF) bonds. In TIF, a local government identifies a group of properties where public investment in streets, parking or other infrastructure could attract private investment in those properties. The government issues bonds to finance those improvements, does the improvements and then pays back the bonds with the new “incremental” property taxes that follow from private investment in the affected properties. Many different financing tools, including special assessment bonds, tax allocation districts and community development districts, follow this same “value capture” logic.
generally more transparent and as such, some think they’re more accountable. Negotiat-ed sales are less transparent but they do offer the issuer more flexibility in how and when to go to the market. Be sure to carefully consid-er how and why you hire your underwriter.
4. Should we seek credit enhancement? Some bonds are backed by a third party that
agrees to make principal and interest payments if the issuer cannot. This assurance, known as credit enhancement, is available from private insurers and from several state-level enhancement programs. For many BBB- and A-rated issuers it is cost effective to spend a few thousand dollars on a credit enhancement in exchange for several thousand dollars in saved borrowing costs. G
GUIDE TO FINANCIAL LITERACY
LEGACY COSTS
GOVERNING Guide to Financial Literacy24
GOVERNING Guide to Financial Literacy 25GOVERNING Guide to Financial Literacy
Pensions are front and center in the ongoing fiscal dramas of Detroit, Stockton, Calif., and many other jurisdictions. And pensions are only part of the story. Many governments also offer their retirees subsidized health insurance, life insurance and other benefits. But unlike pensions, most jurisdictions have not set aside resources to cover those other post-employment ben-efits (OPEB). Add to that a nearly $3.5 trillion backlog of maintenance on state and local infrastructure, and we see an estimated $6 trillion in unfunded long-term costs for state and local governments.12 This is roughly equivalent to the total amount of money state and local governments now spend every two years. Policymakers need to understand how these costs are incurred and measured, and what, if anything, to do about them.
PensionsA pension is a regular payment, or annuity, to
a retiree that’s funded in part by his or her for-mer employer. There are approximately 4,000 state and local government pension plans in the U.S. and they hold roughly $3 trillion in assets.13 These plans fall into two basic categories: defined contribution plans and defined benefit plans.
Defined contribution plans are, in effect, an em-ployer-sponsored retirement savings account. Many state and local governments contribute to and man-age these accounts on behalf of employees. By pool-ing many employees’ savings together, a government plan can generate a better investment return for re-tirees. Defined contribution means the government’s input into the retirement system is known, even if the employee’s eventual retirement benefit is not.
About 80 percent of state and local government employees have access to a defined benefit pension plan.14 The mechanics of a defined benefit pension are straightforward. Employees earn a guaranteed pension benefit during their years of active service to the government. While the employee is working, the govern-ment sets aside money in a pension plan to pay those future benefits. Pension plan managers invest that money. Em-ployees start to receive their benefits when they retire. The pension plan pays those benefits with the proceeds earned from its investments. Employees, or their depen-dents, stop receiving that benefit when they die.
For a government that offers a defined benefit plan, the central financial question is: How much money must it set aside while an employee is active to pay that employee’s future pension benefits? To estimate that number, several questions must be answered.
Are pension benefits protected by state or local law? Or by the state constitution? These restrictions limit the government’s ability to change pension benefits later.
For decades, no one except pension actuaries and a few public finance geeks cared much about pensions. How things have changed.
4SECTION
There is an estimated $6 trillion in unfunded long-term costs for state and local governments. This is roughly equivalent to the total amount of money state and local governments now spend every two years.
DEFINED CONTRIBUTION: Pension arrangement where payments to retirees depend on the value of their retirement savings.
finance defined
GOVERNING Guide to Financial Literacy26
Do pension benefits automatically increase over time? Do retirees receive periodic cost of living adjustments (COLAs)? Do active employees receive a COLA, either through state law or through collective bargaining agreements?
How many years must an employee work to earn a guaranteed benefit? This is called vesting. Most state and local plans require at least 10 years of service to become fully vested.15
How does the pension plan invest its assets? Some plans are subject to strict rules about the types of stocks, bonds and other assets they can pursue. This can limit the plan’s expected investment returns. By contrast, some plans have aggressively moved assets into alternative investments like hedge funds and private equity funds. These are large pools of money that require up-front investment and are managed according to a sophisticated investment strategy. Compared to traditional investments, they usually carry greater risk, greater return and higher fees paid to investment advisers.
An individual employee’s pension benefit is based on three main factors:
• Final average salary (FAS) over the final three to five years before retirement.
• Years of service.• A percent of FAS attributable to each year.
This is also known as units of service. Units of service multiplied by years of service is often called
the replacement rate because it indicates how much pre-retirement income is re-placed by the defined pension benefit.
A government’s pension liability is simply the projected total cost of pension benefits for retirees and active employees who will eventually retire and draw benefits. There are two technical challenges to determine that liability. For one, the government must assume when retirees will die and when
current employees will retire. Actuaries supply these assumptions. An actuary is a professional who uses sophisticated statistical analysis to pre-dict life expectancy, risks in financial markets and other factors relevant to pensions. The total cost to provide pension benefits for the foreseeable future is known as the actuarial accrued liability (AAL).
Second, the actuarial liability must reflect differ-ences in the time value of money. That is, the actuary must adjust the estimate to account for the fact that money the government will spend on these benefits
Recent Changes to State and Local Defined Benefit PensionsThe Great Recession was a difficult time for public pensions. Pension plan assets lost billions of dollars when the financial markets crashed. State and local governments that consistently made their annu-al required contributions still fell behind on their pension obligations. Some have tried to make up for those losses through larger annual contributions, by changing pension benefits or both. Some of the more common recent changes to benefits include:
Scaling back. This includes slowing or ending automatic cost of living adjustments, demanding higher contributions from employees and reducing benefits to spouses and other dependents. These changes are controversial and often prohibited by law.
Limiting or ending eligibility for new employees. Many newly hired government employees have shifted to defined contribution plans.
Changing the definition of “salary” to exclude overtime and compensated absences. This was designed to curb “spiking” when computing annual average salary.
Changing the assumed rate of return on pension assets. In 2012, the California Pub-lic Employees Retirement System (CalPERS) reduced its rate of return on investments from 7.75 percent to 7.5 percent. This change is expected to cost California $200 million to $300 million in pension contributions, but it is designed to make the plan more sustainable going forward.16
in the future has less buying power — due to inflation and other factors — than money it will spend today. The number used to adjust the liability is known as the discount rate. Discount rates have emerged as one of the most controversial dimensions of public pension management. Critics believe state and local governments use discount rates that are too high, and therefore understate their pension liabilities. Proponents say those rates are appropriate given long-term trends in financial markets and funding risks.
Of the many numbers discussed in the pension context, the most important to policymakers is the
DEFINED BENEFIT: Pension arrangement where payments to retirees are pre-determined and fixed.
finance defined
GOVERNING Guide to Financial Literacy 27
annual required contribution, or ARC. The ARC has two components. The first is the normal cost. This is the portion of the AAL the government must cover in a given year. The second is called the supplemental cost. If the plan’s AAL exceeds its assets, it accrues an unfunded actuarial liability (UAL). Supplemental cost is the por-tion of the UAL the government must also cover in the current year. The ARC is highly sensitive to the actuarial assumptions on which it’s based. Many jurisdictions pay into multiple pension plans, each with its own ARC.
Other Post-Employment Benefits Many government employees, especially those in the
police and fire service, are able to retire several years before they are eligible for Medicare at age 65. Many governments offer these retirees a way to offset the costs of health and life insurance during this interim period. Some offer access to the group health insurance plan that’s available to active employees. Others go a step further and pay the insurance premiums on group health insurance on behalf of retirees. These benefits are known as other post-employment benefits (OPEB).
OPEB is similar to a defined benefit pension in that retirees earn a benefit that is known when an em-ployee retires. The benefit is not a pension, but rather access to health insurance at a pre-determined price. And like defined benefit pensions, we can estimate the future cost of these benefits as a function of employ-ees’ demographics, health care cost inflation and other actuarial information.
But OPEB is different from pensions in two crucial ways. First, most state and local governments have not set aside assets to cover future OPEB payments. Put differently, most OPEB has been funded on a pay-as-you-go basis. By some estimates, most jurisdictions have set aside less than 5 percent of the money they’ll need to cover OPEB. That’s quite low compared to pensions, where most have set aside 60 to 70 percent of the money they’ll need.17
However, unlike pensions, OPEBs are typically not guaranteed or protected by state law. State and local governments have much more latitude to scale back OPEBs and share OPEB-related costs with retirees. Many have implemented several changes to that effect. G
1 What is our annual required pension contribution? How sensitive is that required contribution to our
actuarial assumptions?
2 What policy options are available to contain the growth in pension and OPEB costs?
3 What is the assumed rate of return, or discount rate, on our pension liability? What is the basis for
that assumed rate?
4 How do our policies around pensions and OPEB affect our ability to recruit and retain
good employees?
Essential Questions: Legacy Costs
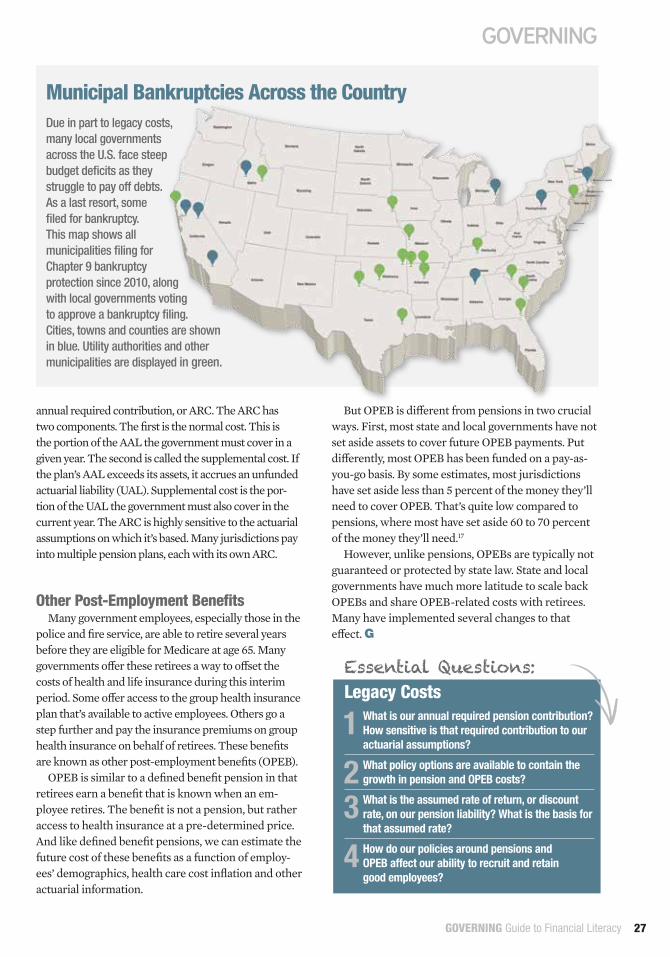
Municipal Bankruptcies Across the CountryDue in part to legacy costs, many local governments across the U.S. face steep budget deficits as they struggle to pay off debts. As a last resort, some filed for bankruptcy. This map shows all municipalities filing for Chapter 9 bankruptcy protection since 2010, along with local governments voting to approve a bankruptcy filing. Cities, towns and counties are shown in blue. Utility authorities and other municipalities are displayed in green.
TELLING THE
FINANCIAL STORY
GUIDE TO FINANCIAL LITERACY
GOVERNING Guide to Financial Literacy28
When the fiscal year is over, you will need to tell your financial story to taxpayers, investors and other stakeholders by explaining how your jurisdiction connected its financial resources to its broader priorities.
5SECTION
Accounting and auditing standards are the rules of the game for how to tell that story.
This section covers the core principles of govern-mental accounting, the three basic financial statements that most state and local governments prepare, and how those financial statements are subjected to external audits.
Bases of AccountingThe rules and concepts that guide accounting
are known as generally accepted accounting prin-ciples (GAAP). Most state and large local govern-ments follow the version of GAAP promulgated by a nonprofit organization called the Governmental Accounting Standards Board (GASB). Smaller local governments tend to follow any one of several al-ternative versions of GAAP known broadly as other comprehensive basis of accounting (OCBOA).
The GASB version of GAAP dictates a set of principles for when and how to recognize that a transaction has affected a government’s finances. There are three distinct bases of accounting:
Cash basis recognizes revenue when cash is received and expenses when a resource is paid for in cash. Cash basis accounting is helpful if the goal is to know exactly how much money is available to cover expenses in the near future.
Accrual basis recognizes revenue when the jurisdiction delivers a good or service, even if it does not receive cash, and expenses when a resource is used to deliver those goods or services, even if it does
not pay cash. Accrual accounting is ideal when the goal is to understand the government’s long-term financial condition.
Modified accrual basis recognizes revenues when they become available and measurable, and expenses when they are incurred. This basis is unique to state and local governments. It is designed to reflect the cash flows related to government revenues.
Fund accounting is also designed to acknowledge that many state and local government revenues are for specific purposes, and cannot be mixed with other revenues. Or, as some euphemistically say, government money is different shades of green. Governments create funds to ensure that resources are applied to their appropriate purposes. A fund is a self-balancing account where the government recognizes all the transactions related to a certain type of revenue. Most have a series of special revenue funds for earmarked revenues, enterprise funds to account for business-type activities like utilities or golf courses, and a general fund that covers general sales, income and property taxes. Each fund is reported separately in the basic financial statements.
Basic Financial StatementsOnce the government has completed its fiscal
year(s), it prepares a set of financial statements that report on its financial activity during that most recent fiscal year. Most produce a set of annual financial statements known as a comprehensive annual financial report (CAFR). A CAFR contains two financial
GOVERNING Guide to Financial Literacy 29
GOVERNING Guide to Financial Literacy30
statements that speak to the government’s overall finances, and several fund statements that report on the finances of specific funds or groups of funds.
The two main government-wide financial statements are:
Statement of net position: This statement shows the relationship between the government’s assets and liabilities. An asset is anything that has long-term value, such as cash, property and equipment. A liability is any outside claim on an asset. A key indicator of a government’s financial condition is net assets, or the difference between assets and liabilities. The statement of net position is akin to the balance sheet for a nonprofit or for-profit company. It is prepared on the accrual basis.
Statement of activities: This statement is similar to the income statement for a nonprofit or for-profit company. It identifies the government’s revenues and expenses. However, unlike nonprofits and corporations, where we expect revenues to exceed expenses, expenses for governmental activities often exceed revenues. This is because general government services that do not charge a fee will incur more expenses than revenues. This statement is prepared on the accrual basis.
A typical CAFR also contains three additional financial statements for each of the government’s major funds or group of funds. For governmental funds,
these statements are prepared on the modified basis of accounting. For enterprise funds, they are prepared on the full accrual basis.
Balance sheet: This statement covers assets and liabilities within the fund. At the fund level, the difference between assets and liabil-ities is known as fund balance. Fund balance in the general fund is one of the most closely watched indicators of financial condition.
Statement of revenues, expenditures and changes in fund balance: Identifies the revenues and expendi-tures within the fund, and how the difference between revenues and expenditures affected fund balance.
Reconciliations: This is akin to the cash flow state-ment for a nonprofit or corporation. It shows how changes in revenues and expenditures within the fund added or subtracted to the government-wide net position.
The Governmental Accounting Standards Board (GASB) is the independent, nonprofit organization that establishes accounting and financial report-ing standards for state and local governments. It does not have actual regulatory authority, but it is recognized by governments and investors as the de facto official source of GAAP in this area.
The Governmental Accounting Standards Board
The Audit ProcessOnce a government has prepared its financial
statements, or hired an outside accountant to prepare its statements, it calls in an external auditor to review those statements. Some governments are required to engage an auditor from their state government, while others are expected to hire an outside auditor.
The auditor’s main task is to offer a professional opinion on whether the financial statements fairly represent the government’s actual financial posi-tion. To reach this conclusion, the auditor reviews the government’s financial records and processes according to national generally accepted auditing standards (GAAS). This includes testing a sample of the government’s financial records to ensure that financial staff process transactions in similar ways, and interviewing staff to better understand the policies and procedures for how to interpret certain types of transactions, among other procedures. The ideal outcome for the financial audit is an unqual-ified — or clean — audit opinion. This means there was no evidence the government’s financial state-ments misrepresent its actual financial position.
The point of a financial audit is to ensure your jurisdiction has the accounting systems, manage-ment policies and trained staff in place to make sure resources are used as they should be. There is a misnomer that financial audits are designed to uncover fraud, waste and abuse. Audits occasionally identify these problems, but most cases of identified fraud are from whistleblowers and self-reporters, not audits.
Governments that receive a lot of federal money are also required to undergo an annual Single Audit.
SINGLE AUDIT: Review of whether a state or local govern-ment is using federal resources, usually grants, in accordance with federal rules and guidelines.
finance defined
Audits occasionally identify fraud, waste and abuse, but most of these problems are identified through whistleblowers and self-reporters, not audits.
GOVERNING Guide to Financial Literacy 31
The Single Audit is a program audit, meaning its purpose is to provide assurance that the government is using federal money according to its intended purpose. Most outside auditors can perform the Single Audit as part of the overall financial audit process. Many auditors will perform a review of internal controls as part of their audit planning. This report, sometimes called “the management letter,” notes any weaknesses in internal controls that came to the auditor’s attention. The termi-nology has shifted over time; these are findings, which used to be called “material weaknesses” in internal control, and are real red flags. Offi-cials should always ask for this document, which may not be otherwise routinely forthcoming. G
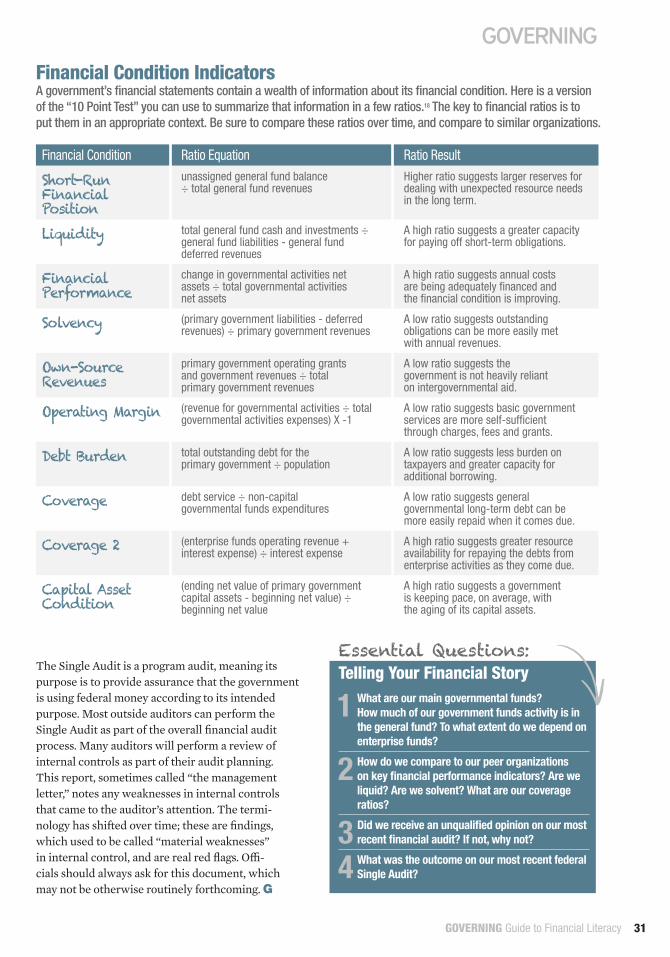
Financial Condition Ratio Equation Ratio Result
Short-Run Financial Position
unassigned general fund balance ÷ total general fund revenues
Higher ratio suggests larger reserves for dealing with unexpected resource needs in the long term.
Liquidity total general fund cash and investments ÷ general fund liabilities - general fund deferred revenues
A high ratio suggests a greater capacity for paying off short-term obligations.
Financial Performance
change in governmental activities net assets ÷ total governmental activities net assets
A high ratio suggests annual costs are being adequately financed and the financial condition is improving.
Solvency (primary government liabilities - deferred revenues) ÷ primary government revenues
A low ratio suggests outstanding obligations can be more easily met with annual revenues.
Own-Source Revenues
primary government operating grants and government revenues ÷ total primary government revenues
A low ratio suggests the government is not heavily reliant on intergovernmental aid.
Operating Margin (revenue for governmental activities ÷ total governmental activities expenses) X -1
A low ratio suggests basic government services are more self-sufficient through charges, fees and grants.
Debt Burden total outstanding debt for the primary government ÷ population
A low ratio suggests less burden on taxpayers and greater capacity for additional borrowing.
Coverage debt service ÷ non-capital governmental funds expenditures
A low ratio suggests general governmental long-term debt can be more easily repaid when it comes due.
Coverage 2 (enterprise funds operating revenue + interest expense) ÷ interest expense
A high ratio suggests greater resource availability for repaying the debts from enterprise activities as they come due.
Capital Asset Condition
(ending net value of primary government capital assets - beginning net value) ÷ beginning net value
A high ratio suggests a government is keeping pace, on average, with the aging of its capital assets.
Financial Condition IndicatorsA government’s financial statements contain a wealth of information about its financial condition. Here is a version of the “10 Point Test” you can use to summarize that information in a few ratios.18 The key to financial ratios is to put them in an appropriate context. Be sure to compare these ratios over time, and compare to similar organizations.
1 What are our main governmental funds? How much of our government funds activity is in
the general fund? To what extent do we depend on enterprise funds?
2 How do we compare to our peer organizations on key financial performance indicators? Are we
liquid? Are we solvent? What are our coverage ratios?
3 Did we receive an unqualified opinion on our most recent financial audit? If not, why not?
4 What was the outcome on our most recent federal Single Audit?
Essential Questions: Telling Your Financial Story
Audits occasionally identify fraud, waste and abuse, but most of these problems are identified through whistleblowers and self-reporters, not audits.
The first and most important step toward public financial literacy is to “know what you don’t know.” That is, knowing how to get informed about things you don’t know, and knowing where to focus the limited time you can devote to becoming informed, is just as important as what you already know. This Guide was designed to show you the key parts of your jurisdiction’s financial story, how to think about that story, and how to connect that story to your own priorities and objectives. If you can’t
Financial Literacy is a Process
CONCLUSION
Governing: Finance 101 Special SeriesVisit Governing’s special series on public finance at www.governing.com/finance101 for additional information, including:
4 Ongoing coverage of public finance4 Videos explaining key concepts in public finance4 Public finance data curated, explained and mapped4 Key terms and acronyms4 Links to organizations important to public finance4 Finance 101 quiz
explain parts of that story, then you know where to go from here.
One final point: Always keep in mind that financial literacy is a process. It takes a long time to master these concepts. This Guide gives you a base of knowledge that you need to continue to grow. True financial literacy is a commitment to keep learning, asking questions, and constantly and constructively revisiting financial assumptions. G
GOVERNING Guide to Financial Literacy32
1 Jeffrey L. Barnett and Phillip M. Vidal (2013), “State and Local Finances Summary: 2011,” U.S. Census Bureau, www2.census.gov/govs/local/ summary_report.pdf
2 Barnett and Vidal, ibid
3 State income tax brackets and rates are available at the Tax Foundation: http://taxfoundation.org/article/state-individual-income-tax-rates
4 Barnett and Vidal, ibid
5 For more on Proposition 13, its origins and its implications, see http://taxfoundation.org/blog/prop-13-california-35-years-later
6 Barnett and Vidal, ibid
7 U.S. Government Accountability Office (2012), “State and Local Governments Fiscal Outlook: April 2012 Update,” www.gao.gov/assets/590/589908.pdf
8 Barnett and Vidal, ibid
9 National Association of State Budget Officers (2013), Fiscal Survey of the States, Fall 2013, www.nasbo.org/sites/default/files/NASBO%20Fall%202013% 20Fiscal%20Survey%20of%20States.pdf
10 Board of Governors of the Federal Reserve System, Financial Accounts of the United States, March 6, 2014, p. 98, www.federalreserve.gov/RELEASES/z1/Current/z1r-4.pdf
11 The National Council for Public-Private Partnerships, “CH2M HILL Seattle Cedar Water Treatment Facility,” www.ncppp.org/resources/case-studies/water-wastewater-infrastructure/ch2m-hill-seattle-cedar-water-treatment-facility/
12 American Society of Civil Engineers (2013), Report Card for America’s Infrastructure, www.infrastructurereportcard.org/a/#p/home
13 U.S. Census Bureau (2012), Survey of Public Pensions, http://factfinder2.census.gov/faces/tableservices/jsf/pages/productview.xhtml?src=bkmk
14 U.S. Census Bureau, ibid
15 Alicia Munnell, Jean-Pierre Aubry, Joshua Hurwitz, and Laura Quinby (2012), “The Impact of Long Vesting Periods on State and Local Workers,” Center for Retirement Research at Boston College, http://crr.bc.edu/wp-content/ uploads/2012/11/slp26.pdf
16 Michael Corkery (2012), “Calpers May Cut Target Return,” Wall Street Journal, http://online.wsj.com/news/articles/SB10001424052702304537904577279572284025222
17 Pew Charitable Trusts (2013), “A Widening Gap in Cities: Shortfalls in Funding for Pensions and Retiree Health Care,” http://online.wsj.com/news/articles/SB10001424052702304537904577279572284025222; Pew Center on the States (2012), “The Widening Gap Update,” www.pewstates.org/uploadedFiles/PCS_ Assets/2012/Pew_Pensions_Update.pdf
18 This framework is adapted from Dean Michael Mead (2005), “A Manageable System of Economic Condition Analysis for Local Governments” in Public Financial Management, edited by Howard A. Frank (New York: CRC Press)
ENDNOTES
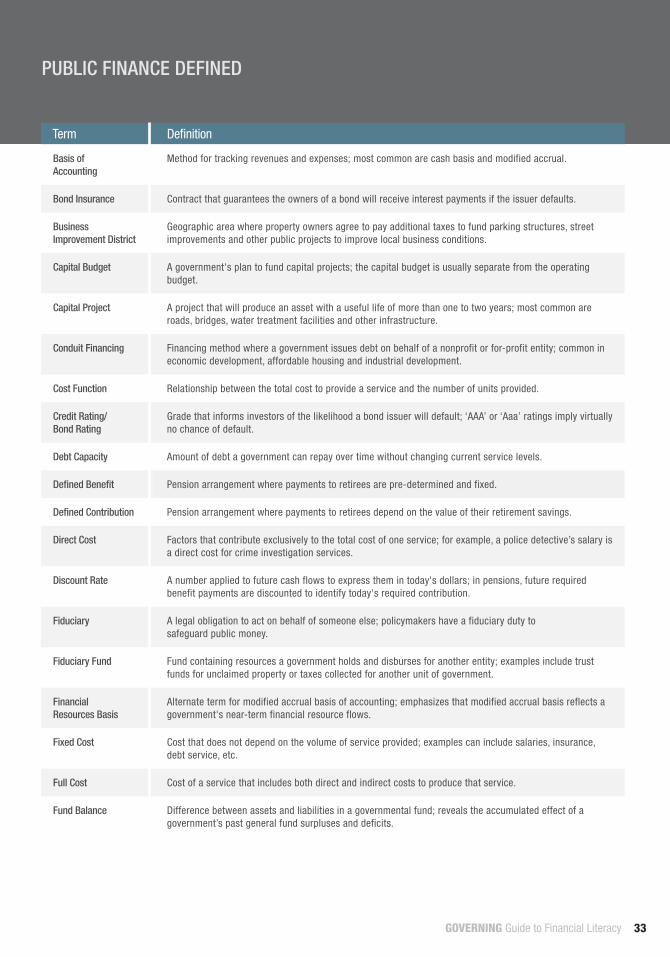
GOVERNING Guide to Financial Literacy 33
Term Definition
Basis of Accounting
Method for tracking revenues and expenses; most common are cash basis and modified accrual.
Bond Insurance Contract that guarantees the owners of a bond will receive interest payments if the issuer defaults.
Business Improvement District
Geographic area where property owners agree to pay additional taxes to fund parking structures, street improvements and other public projects to improve local business conditions.
Capital Budget A government's plan to fund capital projects; the capital budget is usually separate from the operating budget.
Capital Project A project that will produce an asset with a useful life of more than one to two years; most common are roads, bridges, water treatment facilities and other infrastructure.
Conduit Financing Financing method where a government issues debt on behalf of a nonprofit or for-profit entity; common in economic development, affordable housing and industrial development.
Cost Function Relationship between the total cost to provide a service and the number of units provided.
Credit Rating/Bond Rating
Grade that informs investors of the likelihood a bond issuer will default; ‘AAA’ or ‘Aaa’ ratings imply virtually no chance of default.
Debt Capacity Amount of debt a government can repay over time without changing current service levels.
Defined Benefit Pension arrangement where payments to retirees are pre-determined and fixed.
Defined Contribution Pension arrangement where payments to retirees depend on the value of their retirement savings.
Direct Cost Factors that contribute exclusively to the total cost of one service; for example, a police detective’s salary is a direct cost for crime investigation services.
Discount Rate A number applied to future cash flows to express them in today's dollars; in pensions, future required benefit payments are discounted to identify today's required contribution.
Fiduciary A legal obligation to act on behalf of someone else; policymakers have a fiduciary duty to safeguard public money.
Fiduciary Fund Fund containing resources a government holds and disburses for another entity; examples include trust funds for unclaimed property or taxes collected for another unit of government.
Financial Resources Basis
Alternate term for modified accrual basis of accounting; emphasizes that modified accrual basis reflects a government's near-term financial resource flows.
Fixed Cost Cost that does not depend on the volume of service provided; examples can include salaries, insurance, debt service, etc.
Full Cost Cost of a service that includes both direct and indirect costs to produce that service.
Fund Balance Difference between assets and liabilities in a governmental fund; reveals the accumulated effect of a government’s past general fund surpluses and deficits.
PUBLIC FINANCE DEFINED
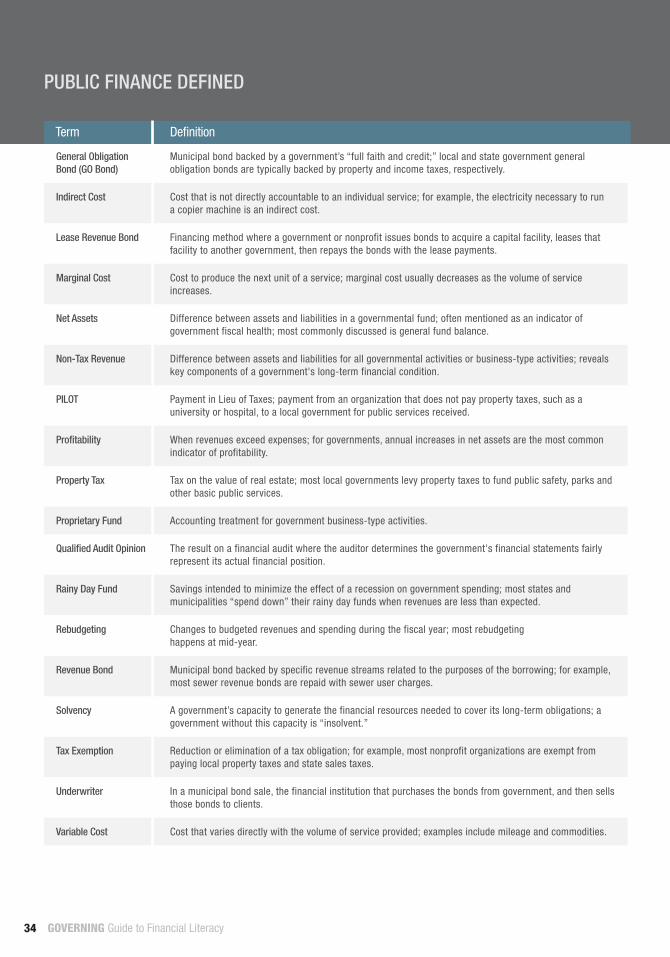
PUBLIC FINANCE DEFINED
GOVERNING Guide to Financial Literacy34
Term Definition
General Obligation Bond (GO Bond)
Municipal bond backed by a government’s “full faith and credit;” local and state government general obligation bonds are typically backed by property and income taxes, respectively.
Indirect Cost Cost that is not directly accountable to an individual service; for example, the electricity necessary to run a copier machine is an indirect cost.
Lease Revenue Bond Financing method where a government or nonprofit issues bonds to acquire a capital facility, leases that facility to another government, then repays the bonds with the lease payments.
Marginal Cost Cost to produce the next unit of a service; marginal cost usually decreases as the volume of service increases.
Net Assets Difference between assets and liabilities in a governmental fund; often mentioned as an indicator of government fiscal health; most commonly discussed is general fund balance.
Non-Tax Revenue Difference between assets and liabilities for all governmental activities or business-type activities; reveals key components of a government's long-term financial condition.
PILOT Payment in Lieu of Taxes; payment from an organization that does not pay property taxes, such as a university or hospital, to a local government for public services received.
Profitability When revenues exceed expenses; for governments, annual increases in net assets are the most common indicator of profitability.
Property Tax Tax on the value of real estate; most local governments levy property taxes to fund public safety, parks and other basic public services.
Proprietary Fund Accounting treatment for government business-type activities.
Qualified Audit Opinion The result on a financial audit where the auditor determines the government's financial statements fairly represent its actual financial position.
Rainy Day Fund Savings intended to minimize the effect of a recession on government spending; most states and municipalities “spend down” their rainy day funds when revenues are less than expected.
Rebudgeting Changes to budgeted revenues and spending during the fiscal year; most rebudgeting happens at mid-year.
Revenue Bond Municipal bond backed by specific revenue streams related to the purposes of the borrowing; for example, most sewer revenue bonds are repaid with sewer user charges.
Solvency A government’s capacity to generate the financial resources needed to cover its long-term obligations; a government without this capacity is “insolvent.”
Tax Exemption Reduction or elimination of a tax obligation; for example, most nonprofit organizations are exempt from paying local property taxes and state sales taxes.
Underwriter In a municipal bond sale, the financial institution that purchases the bonds from government, and then sells those bonds to clients.
Variable Cost Cost that varies directly with the volume of service provided; examples include mileage and commodities.

* Richard J. Palmer & Mahendra Gupta, 2012 Purchasing Card Benchmark Survey Results, RPMG Research Corporation (2012).© 2014 Visa. All rights reserved.
Learn more by visiting visa.com/commercial
Visa Commercial Solutions
Access the Power of Intelligent PaymentsVisa Commercial Solutions, including purchase and travel cards, prepaid disbursement and payroll cards, and e-payables programs, have the power to help you streamline operations, increase accountability, and supply better financial intelligence. And, with unsurpassed acceptance, Visa payment programs deliver exceptional convenience and reliability.
Increase Efficiency
Switching away from paper-based payment processes—which rely on purchase orders and checks— to payment card programs can deliver government agencies an estimated savings of $74 per transaction.* In addition to cost savings, payment card programs can help government agencies reduce labor-intensive activities like manual data entry and reconciliation, so employees can focus on more productive tasks.
Gain Transparency
With Visa Commercial Solutions, public sector administrators can access spend data for easier analysis, integration, and fraud prevention. Our analytics solutions speed up data access and provide powerful tools to harness information for greater control. It adds up to improved cost management, enhanced compliance with government purchasing and travel policies, and more informed financial decisions.
Improve Insight
Insight is vital. It allows government agencies to optimize processes, discover savings opportunities, and find smarter ways to serve their stakeholders. Visa Commercial Solutions help public sector administrators turn payment data into actionable intelligence, so they can monitor spend patterns, negotiate discounts, and make better use of resources.
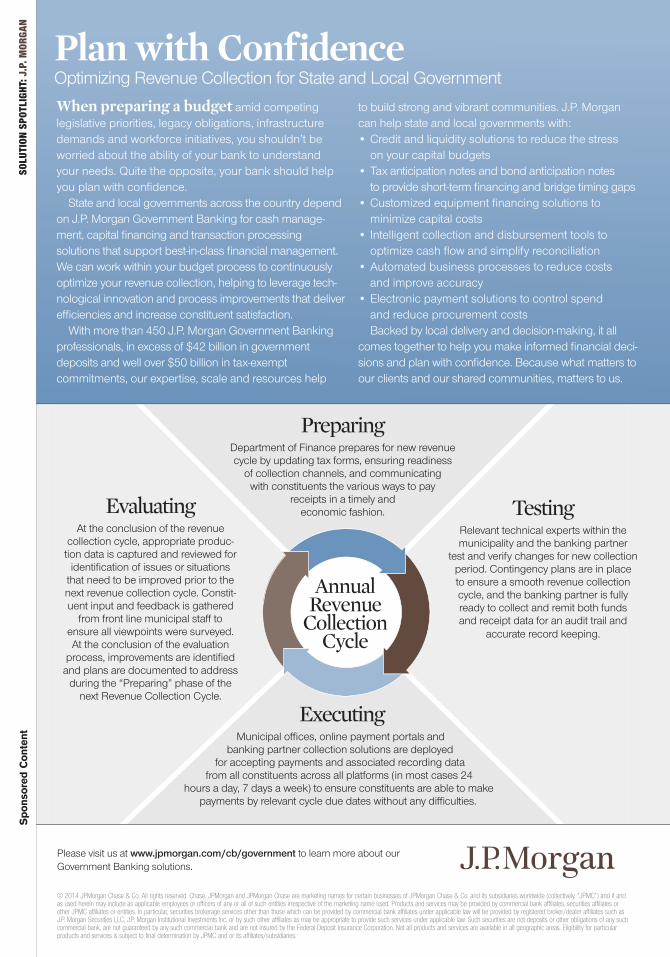
To learn more about Workday’s fi nancial solutions, visit: www.workday.com
Understanding Your Financial Story:One Application, Complete Access for Decision-Makers
Government leaders have been entrusted with public funds and are expected to be good stewards of taxpayer dollars by making
informed decisions. Unfortunately, many public agencies keep data, personnel and fi nances siloed, which means that no individual decision-maker has all of the information necessary to understand the agency’s complete fi nancial story.
Workday Financial Management helps to eliminate silos and ensure all appropriate personnel have access to the same information. Developed to ensure industry relevance and functionality, Workday Financial Management unifi es seamlessly with the Workday suite of cloud applications, allowing accounting, reporting and governance information to be available through a single application.
Workday’s solution enables public agencies to capture the unique details of every fi nancial transaction to better serve all departments.
The Whole PictureThe Workday Financial Management applica-
tion provides insight into all transactions such as budget, revenue, procurement, expenses, fi nance, grants and payroll. The application uses analytics, embedded in business processes, to show any level of summary or information relevant to the user. This allows all managers and executives to eff ectively make informed decisions about funding, paying and collecting money, from one “source of truth.” This broad illustration of the infl ow and outfl ow of funds helps to forecast cash fl ow and funding.
Benefi ts of Workday Financial Management• Offers a complete picture of your agency’s fi nances• Provides access to relevant fi nancial
information for all agency decision makers• Increases internal governance and reduces risk
• Encourages internal and external change, without disrupting business operations
• Provides a consistent, user-friendly interface, mobile access and powerful analytics
SOLUTION SPOTLIGH
T: WORKDAY
Sponsored C
ontent
FLGSR_SS_Workday_Q1.indd 2 6/10/14 4:03 PM
100 Blue Ravine RoadFolsom, CA 95630916-932-1300
Page #
__________Designer __________Creative Dir.
__________Editorial __________Prepress
__________Other ____________OK to go
5 25 50 75 95 100 5 25 50 75 95 100 5 25 50 75 95 100 5 25 50 75 95 100
BLACKYELLOW
MAGENTACYAN
PreparingDepartment of Finance prepares for new revenue cycle by updating tax forms, ensuring readiness
of collection channels, and communicating with constituents the various ways to pay
receipts in a timely and economic fashion.
ExecutingMunicipal offi ces, online payment portals and
banking partner collection solutions are deployed for accepting payments and associated recording data
from all constituents across all platforms (in most cases 24 hours a day, 7 days a week) to ensure constituents are able to make
payments by relevant cycle due dates without any diffi culties.
EvaluatingAt the conclusion of the revenue
collection cycle, appropriate produc-tion data is captured and reviewed for
identifi cation of issues or situations that need to be improved prior to the next revenue collection cycle. Constit-uent input and feedback is gathered
from front line municipal staff to ensure all viewpoints were surveyed. At the conclusion of the evaluation
process, improvements are identifi ed and plans are documented to address
during the “Preparing” phase of the next Revenue Collection Cycle.
TestingRelevant technical experts within the municipality and the banking partner
test and verify changes for new collection period. Contingency plans are in place to ensure a smooth revenue collection cycle, and the banking partner is fully ready to collect and remit both funds and receipt data for an audit trail and
accurate record keeping.
Annual Revenue
Collection Cycle
Plan with ConfidenceOptimizing Revenue Collection for State and Local Government
When preparing a budget amid competing legislative priorities, legacy obligations, infrastructure demands and workforce initiatives, you shouldn’t be worried about the ability of your bank to understand your needs. Quite the opposite, your bank should help you plan with confi dence.
State and local governments across the country depend on J.P. Morgan Government Banking for cash manage-ment, capital fi nancing and transaction processing solutions that support best-in-class fi nancial management. We can work within your budget process to continuously optimize your revenue collection, helping to leverage tech-nological innovation and process improvements that deliver effi ciencies and increase constituent satisfaction.
With more than 450 J.P. Morgan Government Banking professionals, in excess of $42 billion in government deposits and well over $50 billion in tax-exempt commitments, our expertise, scale and resources help
to build strong and vibrant communities. J.P. Morgan can help state and local governments with:• Credit and liquidity solutions to reduce the stress
on your capital budgets • Tax anticipation notes and bond anticipation notes
to provide short-term fi nancing and bridge timing gaps• Customized equipment fi nancing solutions to
minimize capital costs • Intelligent collection and disbursement tools to
optimize cash fl ow and simplify reconciliation• Automated business processes to reduce costs
and improve accuracy• Electronic payment solutions to control spend
and reduce procurement costsBacked by local delivery and decision-making, it all
comes together to help you make informed fi nancial deci-sions and plan with confi dence. Because what matters to our clients and our shared communities, matters to us.
Please visit us at www.jpmorgan.com /cb/government to learn more about our Government Banking solutions.
© 2014 JPMorgan Chase & Co. All rights reserved. Chase, JPMorgan and JPMorgan Chase are marketing names for certain businesses of JPMorgan Chase & Co. and its subsidiaries worldwide (collectively, “JPMC”) and if and as used herein may include as applicable employees or offi cers of any or all of such entities irrespective of the marketing name used. Products and services may be provided by commercial bank affi liates, securities affi liates or other JPMC affi liates or entities. In particular, securities brokerage services other than those which can be provided by commercial bank affi liates under applicable law will be provided by registered broker/dealer affi liates such as J.P. Morgan Securities LLC, J.P. Morgan Institutional Investments Inc. or by such other affi liates as may be appropriate to provide such services under applicable law. Such securities are not deposits or other obligations of any such commercial bank, are not guaranteed by any such commercial bank and are not insured by the Federal Deposit Insurance Corporation. Not all products and services are available in all geographic areas. Eligibility for particular products and services is subject to fi nal determination by JPMC and or its affi liates/subsidiaries.
SOLU
TION
SPO
TLIG
HT:
J.P
. MOR
GAN
Spo
nsor
ed C
onte
nt
FLGSR_SS_JP Morgan_Q1.indd 1 6/11/14 1:37 PM
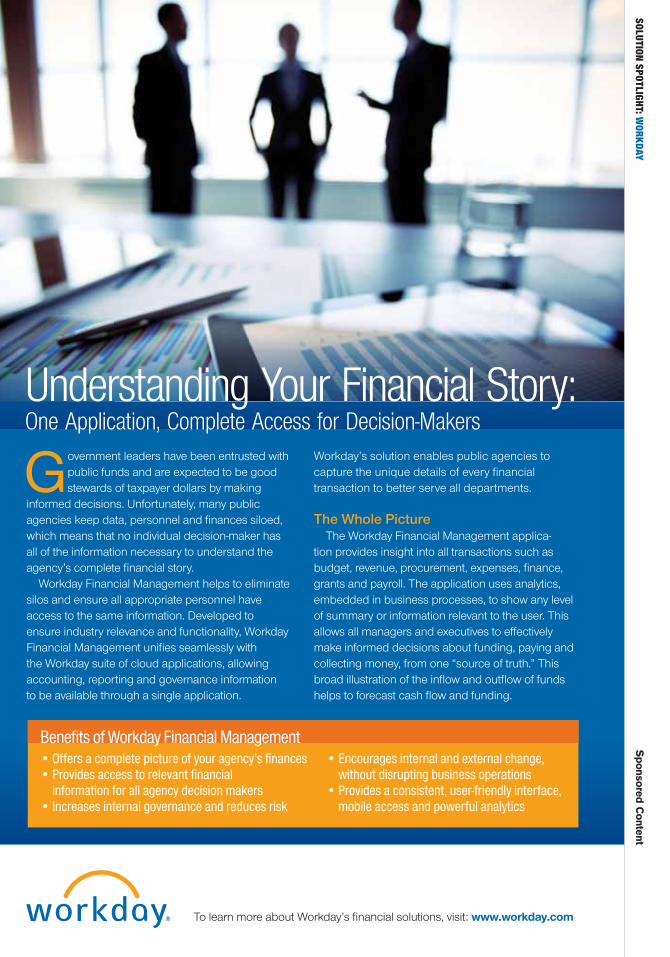
To learn more about Workday’s fi nancial solutions, visit: www.workday.com
Understanding Your Financial Story:One Application, Complete Access for Decision-Makers
Government leaders have been entrusted with public funds and are expected to be good stewards of taxpayer dollars by making
informed decisions. Unfortunately, many public agencies keep data, personnel and fi nances siloed, which means that no individual decision-maker has all of the information necessary to understand the agency’s complete fi nancial story.
Workday Financial Management helps to eliminate silos and ensure all appropriate personnel have access to the same information. Developed to ensure industry relevance and functionality, Workday Financial Management unifi es seamlessly with the Workday suite of cloud applications, allowing accounting, reporting and governance information to be available through a single application.
Workday’s solution enables public agencies to capture the unique details of every fi nancial transaction to better serve all departments.
The Whole PictureThe Workday Financial Management applica-
tion provides insight into all transactions such as budget, revenue, procurement, expenses, fi nance, grants and payroll. The application uses analytics, embedded in business processes, to show any level of summary or information relevant to the user. This allows all managers and executives to eff ectively make informed decisions about funding, paying and collecting money, from one “source of truth.” This broad illustration of the infl ow and outfl ow of funds helps to forecast cash fl ow and funding.
Benefi ts of Workday Financial Management• Offers a complete picture of your agency’s fi nances• Provides access to relevant fi nancial
information for all agency decision makers• Increases internal governance and reduces risk
• Encourages internal and external change, without disrupting business operations
• Provides a consistent, user-friendly interface, mobile access and powerful analytics
SOLUTION SPOTLIGH
T: WORKDAY
Sponsored C
ontent
FLGSR_SS_Workday_Q1.indd 2 6/10/14 4:03 PM
100 Blue Ravine RoadFolsom, CA 95630916-932-1300
Page #
__________Designer __________Creative Dir.
__________Editorial __________Prepress
__________Other ____________OK to go
5 25 50 75 95 100 5 25 50 75 95 100 5 25 50 75 95 100 5 25 50 75 95 100
BLACKYELLOW
MAGENTACYAN
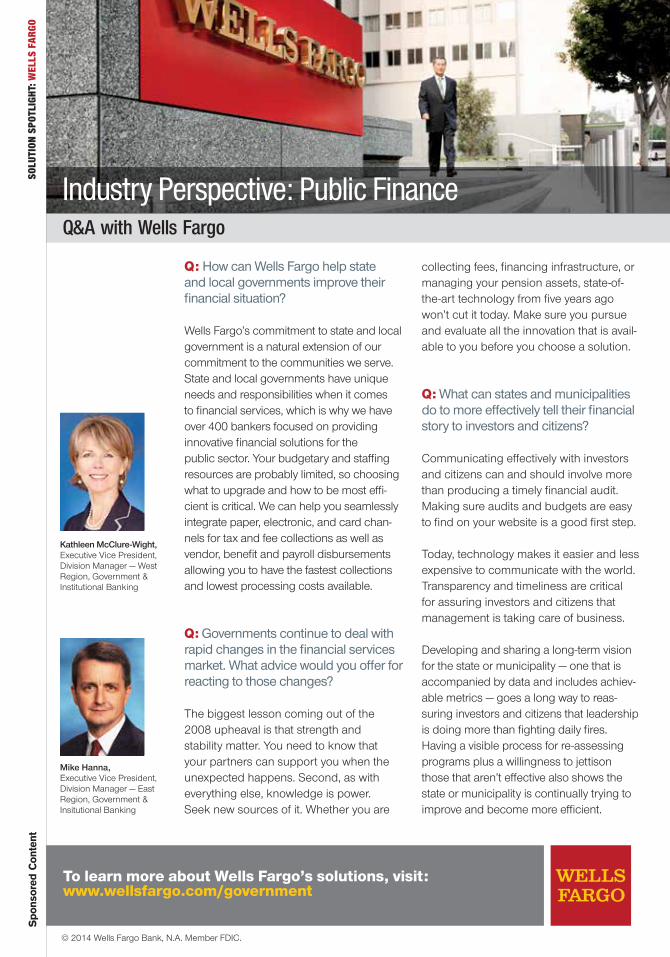
To learn more about Wells Fargo’s solutions, visit: www.wellsfargo.com/government
Q: How can Wells Fargo help state and local governments improve their fi nancial situation?
Wells Fargo’s commitment to state and local government is a natural extension of our commitment to the communities we serve. State and local governments have unique needs and responsibilities when it comes to fi nancial services, which is why we have over 400 bankers focused on providing innovative fi nancial solutions for the public sector. Your budgetary and staffi ng resources are probably limited, so choosing what to upgrade and how to be most effi -cient is critical. We can help you seamlessly integrate paper, electronic, and card chan-nels for tax and fee collections as well as vendor, benefi t and payroll disbursements allowing you to have the fastest collections and lowest processing costs available.
Q: Governments continue to deal with rapid changes in the fi nancial services market. What advice would you off er for reacting to those changes?
The biggest lesson coming out of the 2008 upheaval is that strength and stability matter. You need to know that your partners can support you when the unexpected happens. Second, as with everything else, knowledge is power. Seek new sources of it. Whether you are
collecting fees, fi nancing infrastructure, or managing your pension assets, state-of-the-art technology from fi ve years ago won’t cut it today. Make sure you pursue and evaluate all the innovation that is avail-able to you before you choose a solution.
Q: What can states and municipalities do to more eff ectively tell their fi nancial story to investors and citizens?
Communicating eff ectively with investors and citizens can and should involve more than producing a timely fi nancial audit. Making sure audits and budgets are easy to fi nd on your website is a good fi rst step.
Today, technology makes it easier and less expensive to communicate with the world. Transparency and timeliness are critical for assuring investors and citizens that management is taking care of business.
Developing and sharing a long-term vision for the state or municipality — one that is accompanied by data and includes achiev-able metrics — goes a long way to reas-suring investors and citizens that leadership is doing more than fi ghting daily fi res. Having a visible process for re-assessing programs plus a willingness to jettison those that aren’t eff ective also shows the state or municipality is continually trying to improve and become more effi cient.
Kathleen McClure-Wight, Executive Vice President, Division Manager — West Region, Government & Institutional Banking
Mike Hanna, Executive Vice President, Division Manager — East Region, Government & Insitutional Banking
Industry Perspective: Public Finance Q&A with Wells Fargo
© 2014 Wells Fargo Bank, N.A. Member FDIC.
SOLU
TION
SPO
TLIG
HT:
WEL
LS F
ARGO
Spo
nsor
ed C
onte
nt
FLGSR_SS_Wells Fargo_Q1.indd 1 6/9/14 9:08 AM

At Build America Mutual, we help towns and cities across America build important public infrastructure. As a mutual bond insurer, we provide our members — the issuers of essential public purpose municipal bonds — with a guaranty that leads to signifi cant interest-cost savings on their capital projects. BAM is ratedAA/Stable by Standard & Poor’s and is sponsored by the National League of Cities.
BAM is also committed to enhancing transparency and fi scal literacy in the municipal market — we publish "Obligor Disclosure Briefs" for the issuers we insure and update them annually. These credit summaries help investors and issuers alike gain insights into fi nancial conditions in their communities. Visit buildamerica.com to learn more about BAM’s unique structure and view our ODBs for yourself. Then ask your municipal advisor if municipal bond insurance can save your community money on its next bond issue.
© 2014 Build America Mutual
sponsored by
SECURITY + TRANSPARENCY = SAVINGSBAM SAVED OUR MUNICIPAL MEMBERS MORE THAN $60 MILLION IN 2013. HOW MUCH CAN OUR INSURANCE SAVE YOU ON YOUR NEXT BOND DEAL?
100 Blue Ravine RoadFolsom, CA 95630916-932-1300
Page #
__________Designer __________Creative Dir.
__________Editorial __________Prepress
__________Other ____________OK to go
5 25 50 75 95 100 5 25 50 75 95 100 5 25 50 75 95 100 5 25 50 75 95 100
BLACKYELLOW
MAGENTACYAN
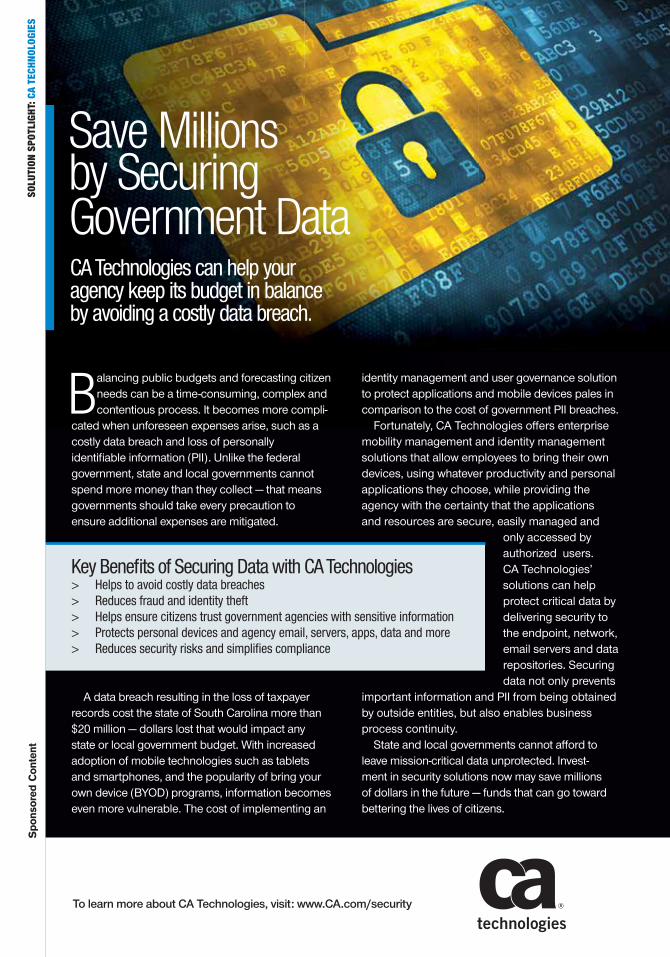
Save Millions by Securing Government DataCA Technologies can help your agency keep its budget in balance by avoiding a costly data breach.
Balancing public budgets and forecasting citizen needs can be a time-consuming, complex and contentious process. It becomes more compli-
cated when unforeseen expenses arise, such as a costly data breach and loss of personally identifi able information (PII). Unlike the federal government, state and local governments cannot spend more money than they collect — that means governments should take every precaution to ensure additional expenses are mitigated.
A data breach resulting in the loss of taxpayer records cost the state of South Carolina more than $20 million — dollars lost that would impact any state or local government budget. With increased adoption of mobile technologies such as tablets and smartphones, and the popularity of bring your own device (BYOD) programs, information becomes even more vulnerable. The cost of implementing an
identity management and user governance solution to protect applications and mobile devices pales in comparison to the cost of government PII breaches.
Fortunately, CA Technologies off ers enterprise mobility management and identity management solutions that allow employees to bring their own devices, using whatever productivity and personal applications they choose, while providing the agency with the certainty that the applications and resources are secure, easily managed and
only accessed by authorized users. CA Technologies’ solutions can help protect critical data by delivering security to the endpoint, network, email servers and data repositories. Securing data not only prevents
important information and PII from being obtained by outside entities, but also enables business process continuity.
State and local governments cannot aff ord to leave mission-critical data unprotected. Invest-ment in security solutions now may save millions of dollars in the future — funds that can go toward bettering the lives of citizens.
Key Benefi ts of Securing Data with CA Technologies > Helps to avoid costly data breaches > Reduces fraud and identity theft > Helps ensure citizens trust government agencies with sensitive information > Protects personal devices and agency email, servers, apps, data and more > Reduces security risks and simplifi es compliance
To learn more about CA Technologies, visit: www.CA.com/security
SOLU
TION
SPO
TLIG
HT:
CA
TECH
NOL
OGIE
SS
pons
ored
Con
tent
FLGSR_SS_CA_Q1.indd 1 6/9/14 2:55 PM
100 Blue Ravine RoadFolsom, CA 95630916-932-1300
Page #
__________Designer __________Creative Dir.
__________Editorial __________Prepress
__________Other ____________OK to go
5 25 50 75 95 100 5 25 50 75 95 100 5 25 50 75 95 100 5 25 50 75 95 100
BLACKYELLOW
MAGENTACYAN
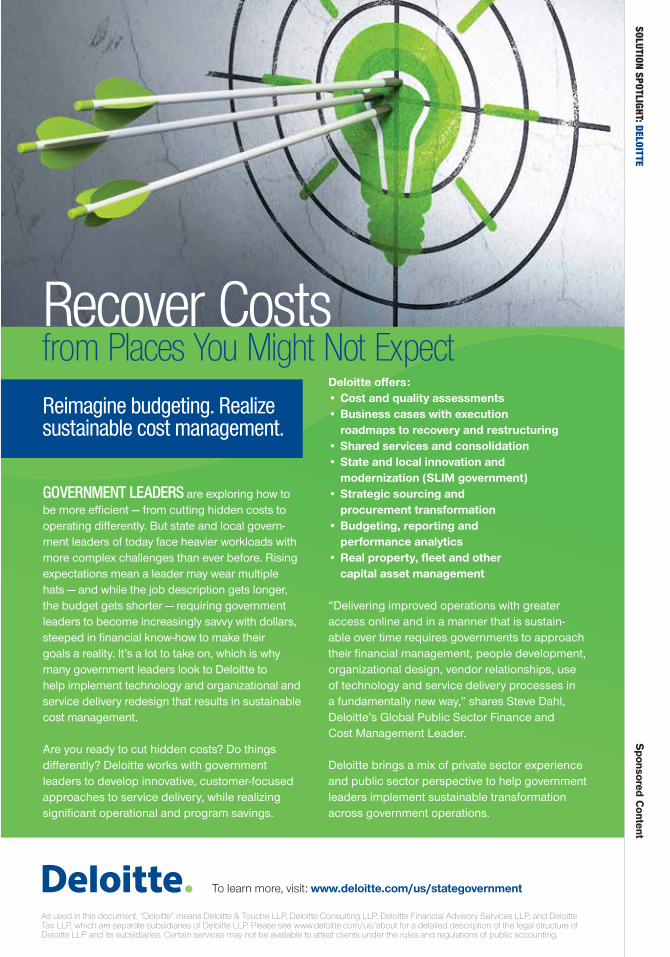
GOVERNMENT LEADERS are exploring how to be more effi cient — from cutting hidden costs to operating diff erently. But state and local govern-ment leaders of today face heavier workloads with more complex challenges than ever before. Rising expectations mean a leader may wear multiple hats — and while the job description gets longer, the budget gets shorter — requiring government leaders to become increasingly savvy with dollars, steeped in fi nancial know-how to make their goals a reality. It’s a lot to take on, which is why many government leaders look to Deloitte to help implement technology and organizational and service delivery redesign that results in sustainable cost management.
Are you ready to cut hidden costs? Do things diff erently? Deloitte works with government leaders to develop innovative, customer-focused approaches to service delivery, while realizing signifi cant operational and program savings.
Deloitte off ers:• Cost and quality assessments• Business cases with execution
roadmaps to recovery and restructuring• Shared services and consolidation• State and local innovation and
modernization (SLIM government)• Strategic sourcing and
procurement transformation• Budgeting, reporting and
performance analytics• Real property, fl eet and other
capital asset management
“Delivering improved operations with greater access online and in a manner that is sustain-able over time requires governments to approach their fi nancial management, people development, organizational design, vendor relationships, use of technology and service delivery processes in a fundamentally new way,” shares Steve Dahl, Deloitte’s Global Public Sector Finance and Cost Management Leader.
Deloitte brings a mix of private sector experience and public sector perspective to help government leaders implement sustainable transformation across government operations.
Reimagine budgeting. Realize sustainable cost management.
Recover Costs from Places You Might Not Expect
To learn more, visit: www.deloitte.com/us/stategovernment
As used in this document, “Deloitte” means Deloitte & Touche LLP, Deloitte Consulting LLP, Deloitte Financial Advisory Services LLP, and Deloitte Tax LLP, which are separate subsidiaries of Deloitte LLP. Please see www.deloitte.com/us/about for a detailed description of the legal structure of Deloitte LLP and its subsidiaries. Certain services may not be available to attest clients under the rules and regulations of public accounting.
SOLUTION SPOTLIGH
T: DELOITTES
ponsored Content
FLGSR_SS_Deloitte_Q1.indd 2 6/9/14 3:14 PM
100 Blue Ravine RoadFolsom, CA 95630916-932-1300
Page #
__________Designer __________Creative Dir.
__________Editorial __________Prepress
__________Other ____________OK to go
5 25 50 75 95 100 5 25 50 75 95 100 5 25 50 75 95 100 5 25 50 75 95 100
BLACKYELLOW
MAGENTACYAN
To learn more about TIAA-CREF, visit: www.tiaa-cref.org/literacy
FINANCIAL LITERACY isn’t just for government leaders. Public sector employees should also be knowledgeable and aware of how public fi nance impacts retire-ment plans. As budgets shrink and the long-term legacy costs of government pensions and other post-employment benefi ts are scrutinized, it’s more important than ever to give your employees the right tools to prepare for the future.
Public leaders are in a unique position to ensure employees receive true fi nancial advice from experts. Investment advice is defi ned as a fi duciary undertaking by the advice provider. Beyond its technical defi nition, the primary role of advice in a retirement plan is to provide specifi c recommendations that help employees make informed decisions about their investments. Advice ought to be prudent, sound and unbiased, which is why plan providers should utilize a third party.
As a national fi nancial services organization, and provider of defi ned contribu-tion and supplemental retirement programs, TIAA-CREF is prepared to help your employees better understand their retirement options. Assisting employees with a plan for tomorrow today can provide a better chance for a secure retirement. The combination of fi nancial education with a strong foundation of true fi nancial advice is essential for employees to achieve retirement readiness. TIAA-CREF works side-by-side with government plan sponsors and their plan’s trusted adviser to ensure that fi nancial education programs and advice are working in tandem to help employees achieve better retirement outcomes. With nearly a century of industry experience, TIAA-CREF is uniquely qualifi ed to advise public policymakers and government leaders on important factors to consider when designing eff ective employee retirement programs.
Retirement ReadinessEnsure retirement readiness while maximizing plan value and effi ciency by examining your plan in light of four drivers:
1. Plan design: Build a strong foundation for your plan’s success by including services such as automatic enrollment.
2. Investment solutions: Ensure participants can achieve lifetime income.
3. Employee engagement: Focus on outcomes-based education and advice for employees.
4. Plan management: Monitor your plan to mitigate fi duciary risk, drive effi ciency and maximize value.
Improving Retirement ReadinessTIAA-CREF Helps Prepare Government Employees for the Future
The material is for informational purposes only and should not be regarded as a recommendation or an offer to buy or sell any product or service to which this information may relate. Certain products and services may not be available to all entities or persons. Past performance does not guarantee future results. TIAA-CREF products may be subject to market and other risk factors. See the applicable product literature, or visit www.tiaa-cref.org for details. TIAA-CREF Individual & Institutional Services, LLC and Teachers Personal Investors Services, Inc., members FINRA, distribute securities products. C17245©2014 Teachers Insurance and Annuity Association-College Retirement Equities Fund, New York, NY 10017
SOLU
TION
SPO
TLIG
HT:
TIA
A-CR
EFS
pons
ored
Con
tent
FLGSR_SS_TIAACREF_Q1.indd 1 6/9/14 2:03 PM
100 Blue Ravine RoadFolsom, CA 95630916-932-1300
Page #
__________Designer __________Creative Dir.
__________Editorial __________Prepress
__________Other ____________OK to go
5 25 50 75 95 100 5 25 50 75 95 100 5 25 50 75 95 100 5 25 50 75 95 100
BLACKYELLOW
MAGENTACYAN
SPONSORS

© 2014 e.REPUBLIC. ALL RIGHTS RESERVED 1100 CONNECTICUT AVE. N.W., SUITE 1300, WASHINGTON, D.C. 20036GOVERNING.COM
A DIVISION OF e.REPUBLIC