Embed Size (px)
Citation preview
ANNUAL FINANCIAL
STATEMENTS
2017 - 2018
Financial Statements 2018
Snowy Valleys Council
General Purpose Financial Statements for the year ended 30 June 2018
Contents
1. Understanding Council’s Financial Statements
2. Statement by Councillors and Management
3. Primary Financial Statements:
– Income Statement– Statement of Comprehensive Income– Statement of Financial Position– Statement of Changes in Equity– Statement of Cash Flows
4. Notes to the Financial Statements
5. Independent Auditor’s Reports:
– On the Financial Statements (Sect 417 [2]) – On the Conduct of the Audit (Sect 417 [3])
Overview
76 Capper St, TumutWinton St, Tumbarumba
Council’s guiding principles are detailed in Chapter 3 of the LGA and includes:
principles applying to the exercise of functions generally by council,principles to be applied when making decisions,principles of community participation,principles of sound financial management, andprinciples for strategic planning relating to the development of an integrated planning and reporting framework.
A description of the nature of Council’s operations and its principal activities are provided in Note 2(b).
Through the use of the internet, we have ensured that our reporting is timely, complete and available at minimumcost. All press releases, financial statements and other information are publicly available on our website:www.svc.nsw.gov.au.
Page
4
67
5
2
3
Snowy Valleys Council is constituted under the Local Government Act 1993 (NSW) and has its principal place of business at:
8
9
8083
page 1
Financial Statements 2018_
Snowy Valleys Council General Purpose Financial Statements for the year ended 30 June 2018 Understanding Council’s financial statements
page 2
Introduction Each year, individual local governments across New South Wales are required to present a set of audited financial statements to their council and community. What you will find in the statements The financial statements set out the financial performance, financial position and cash flows of Council for the financial year ended 30 June 2018. The format of the financial statements is standard across all NSW Councils and complies with both the accounting and reporting requirements of Australian Accounting Standards and requirements as set down by the Office of Local Government. About the Councillor/Management Statement The financial statements must be certified by senior staff as ‘presenting fairly’ the Council’s financial results for the year and are required to be adopted by Council – ensuring both responsibility for and ownership of the financial statements. About the primary financial statements The financial statements incorporate five ‘primary’ financial statements: 1. The Income Statement
Summarises Council's financial performance for the year, listing all income and expenses. This statement also displays Council's original adopted budget to provide a comparison between what was projected and what actually occurred. 2. The Statement of Comprehensive Income
Primarily records changes in the fair value of Council's Infrastructure, Property, Plant and Equipment. 3. The Statement of Financial Position
A 30 June snapshot of Council's financial position indicating its assets, liabilities and “net wealth”. 4. The Statement of Changes in Equity
The overall change for the year (in dollars) of Council’s “net wealth”.
5. The Statement of Cash Flows
Indicates where Council's cash came from and where it was spent. This statement also displays Council's original adopted budget to provide a comparison between what was projected and what actually occurred.
About the Notes to the Financial Statements The Notes to the Financial Statements provide greater detail and additional information on the five primary financial statements. About the Auditor’s Reports Council’s annual financial statements are required to be audited by the NSW Audit Office. In NSW the auditor provides 2 audit reports: 1. an opinion on whether the financial statements
present fairly the Council’s financial performance and position, and
2. their observations on the conduct of the audit, including commentary on the Council’s financial performance and financial position.
Who uses the financial statements? The financial statements are publicly available documents and must be presented at a Council meeting between seven days and five weeks after the date of the Audit Report. The public can make submissions to Council up to seven days subsequent to the public presentation of the financial statements. Council is required to forward an audited set of financial statements to the Office of Local Government.
Financial Statements 2018
Snowy Valleys Council
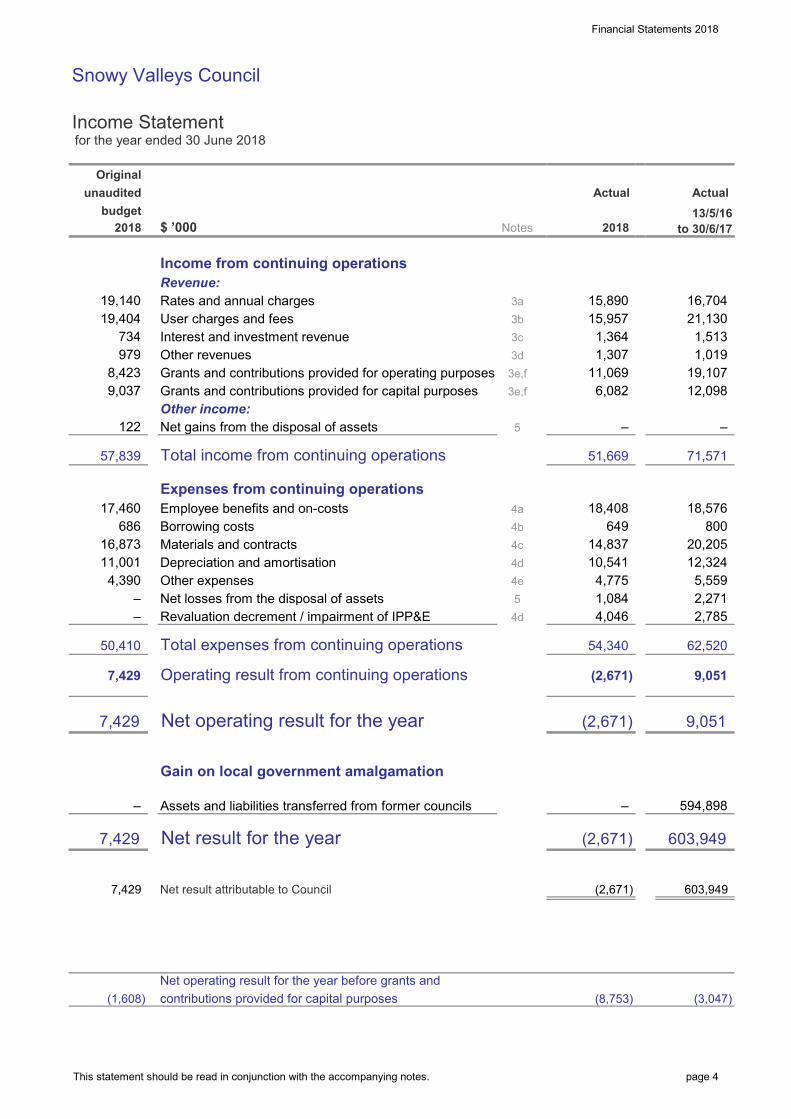
Income Statement for the year ended 30 June 2018
$ ’000
Income from continuing operationsRevenue:Rates and annual chargesUser charges and feesInterest and investment revenueOther revenuesGrants and contributions provided for operating purposesGrants and contributions provided for capital purposesOther income:Net gains from the disposal of assets
Total income from continuing operations
Expenses from continuing operationsEmployee benefits and on-costsBorrowing costsMaterials and contractsDepreciation and amortisationOther expensesNet losses from the disposal of assetsRevaluation decrement / impairment of IPP&E
Total expenses from continuing operations
Operating result from continuing operations
Net operating result for the year
Gain on local government amalgamation
Assets and liabilities transferred from former councils
Net result for the year
Net result attributable to Council
Net operating result for the year before grants andcontributions provided for capital purposes
603,949 (2,671)
51,669
(8,753)
71,571
(3,047)
7,429 (2,671)
7,429 (2,671) 9,051
– – 594,898
603,949
– –
10,541 14,837
54e
1,084
686 17,460
11,001 16,873
unaudited
Notes
3a
3d3c
2018
734
8,423
4d
4b4c
4a
Original
19,404
979
3b
3e,f1,307
19,140
3e,f
5
budget
9,037
122
19,107
18,576 649
18,408
4,775
–
(2,671)
2,271
800 20,205 12,324
2,785
5,559
54,340
4,046
16,704
1,513 1,019
9,051
62,520
21,130
6,082 12,098
–
Actual Actual
11,069
15,890
4,390
4d
57,839
2018
15,957 1,364
7,429
(1,608)
50,410
7,429
13/5/16 to 30/6/17
X3A0T
This statement should be read in conjunction with the accompanying notes. page 4
Financial Statements 2018
Snowy Valleys Council
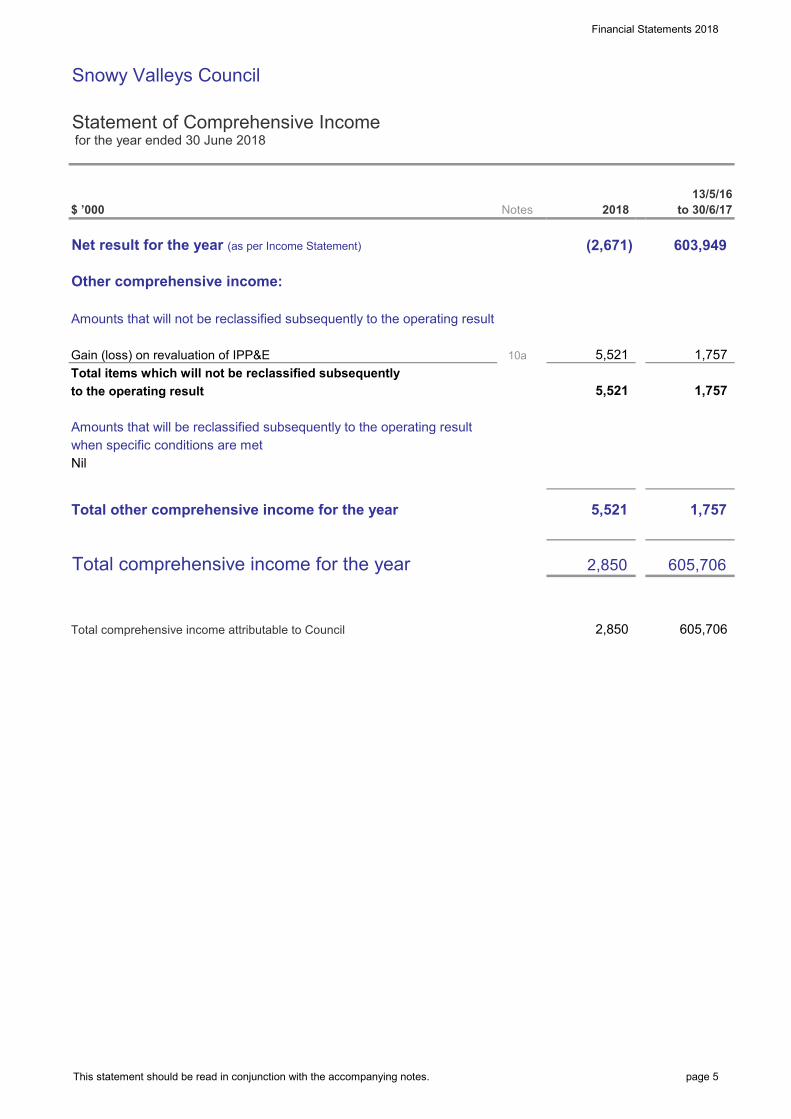
Statement of Comprehensive Income for the year ended 30 June 2018
$ ’000
Net result for the year (as per Income Statement)
Other comprehensive income:
Amounts that will not be reclassified subsequently to the operating result
Gain (loss) on revaluation of IPP&ETotal items which will not be reclassified subsequentlyto the operating result
Amounts that will be reclassified subsequently to the operating resultwhen specific conditions are metNil
Total other comprehensive income for the year
Total comprehensive income for the year
Total comprehensive income attributable to Council
13/5/16 to 30/6/17
1,757
2,850
5,521
603,949
5,521
2018Notes
(2,671)
605,706
2,850 605,706
1,757 10a
1,757 5,521
X3A1T
This statement should be read in conjunction with the accompanying notes. page 5
Financial Statements 2018
Snowy Valleys Council
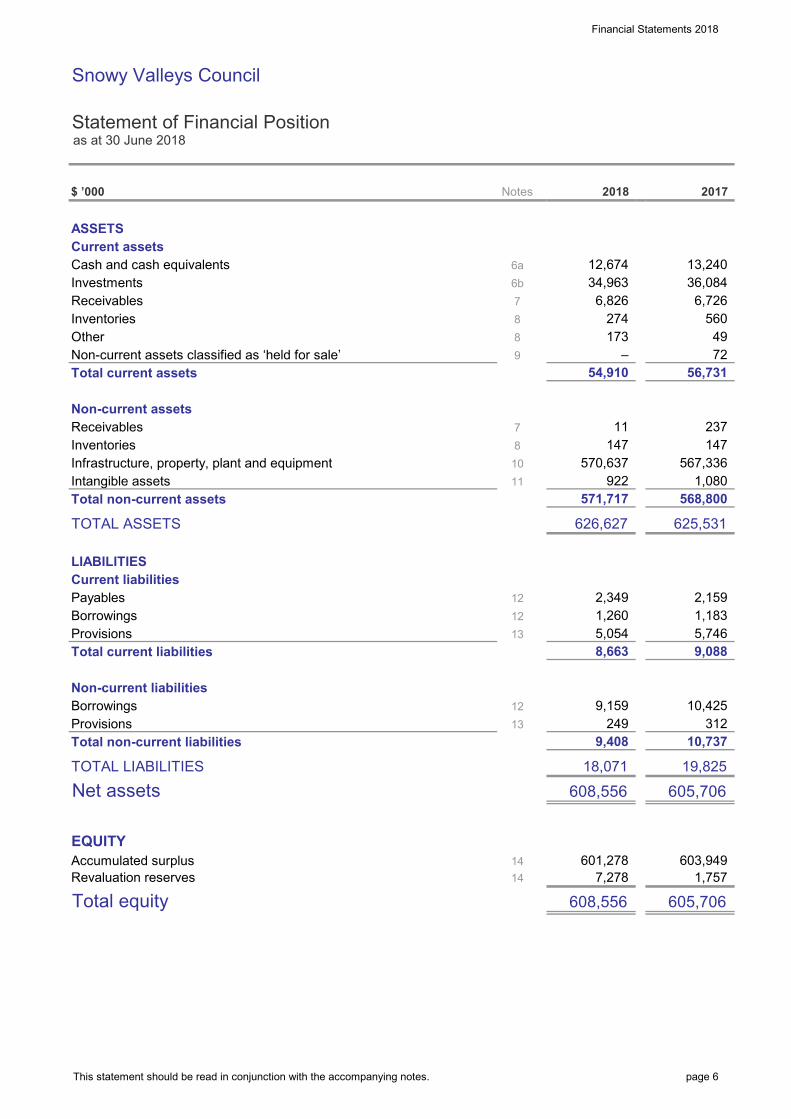
Statement of Financial Position as at 30 June 2018
$ ’000
ASSETSCurrent assetsCash and cash equivalentsInvestmentsReceivablesInventoriesOtherNon-current assets classified as ‘held for sale’Total current assets
Non-current assetsReceivablesInventoriesInfrastructure, property, plant and equipmentIntangible assetsTotal non-current assets
TOTAL ASSETS
LIABILITIESCurrent liabilitiesPayablesBorrowingsProvisionsTotal current liabilities
Non-current liabilitiesBorrowingsProvisionsTotal non-current liabilities
TOTAL LIABILITIES
Net assets
EQUITYAccumulated surplusRevaluation reserves
Total equity
6,726
–
36,084
5,746
147
605,706
601,278
9,408
10,425
603,949
608,556
312 249
49
7
2018
54,910
810
7
567,336
8
7,278
237
568,800
8,663
11 147
9
1414
13
1312
Notes
6a6b
1,260
570,637
5,054
625,531
9,088
605,706 19,825
10,737
1,757
2,159 1,183
56,731 72
922 1,080
34,963
2017
560
13,240
6,826
12,674
274 173
18,071
608,556
9,159
8
12
11
12
571,717
2,349
626,627
X3A2T
This statement should be read in conjunction with the accompanying notes. page 6
Financial Statements 2018
Snowy Valleys Council
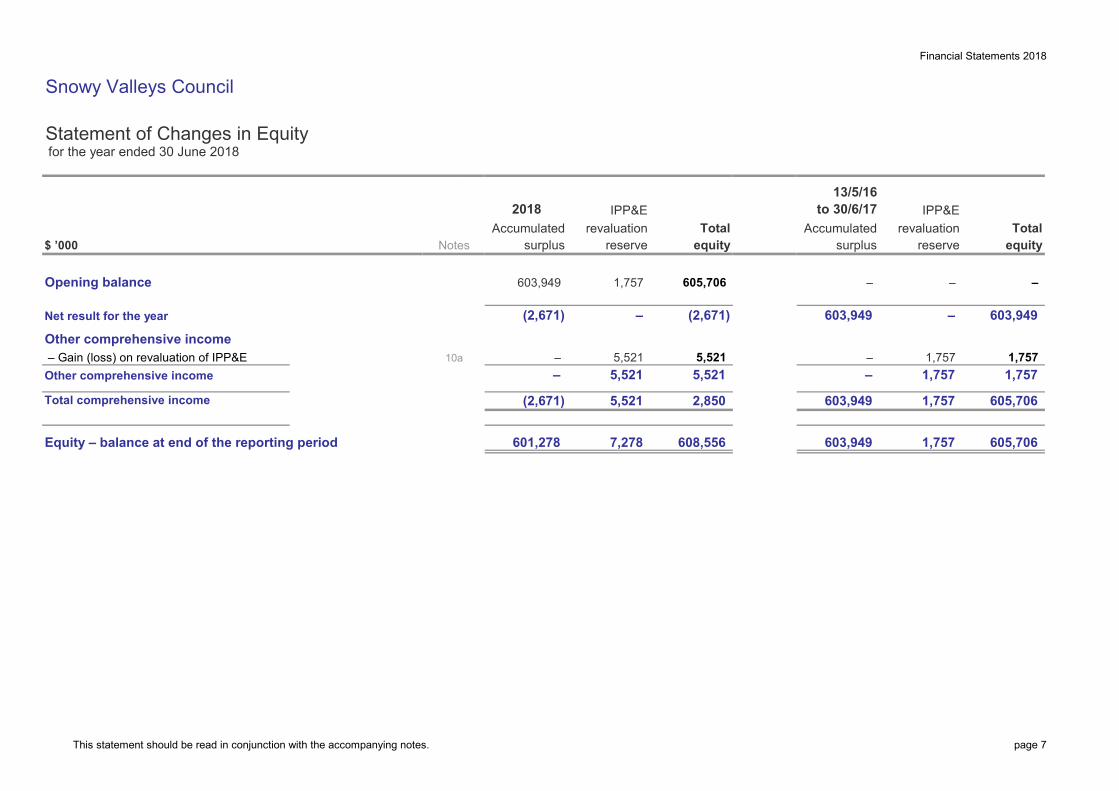
Statement of Changes in Equity for the year ended 30 June 20182018
$ ’000
Opening balance
Net result for the year
Other comprehensive income – Gain (loss) on revaluation of IPP&EOther comprehensive income
Total comprehensive income
Equity – balance at end of the reporting period
Accumulated Accumulated
5,521
(2,671)
5,521
2,850
605,706 1,757 603,949
1,757
603,949 1,757
– 1,757
605,706
– 1,757
603,949
1,757
603,949 –
equity
–
surplus
– –
reserverevaluation Total
IPP&E13/5/16
to 30/6/17
601,278 7,278 608,556
– 5,521
(2,671) 5,521
10a – 5,521
2018
603,949 1,757 605,706
revaluation TotalNotes surplus reserve
IPP&E
equity
(2,671) –
X4A0T
This statement should be read in conjunction with the accompanying notes. page 7
Financial Statements 2018
Snowy Valleys Council
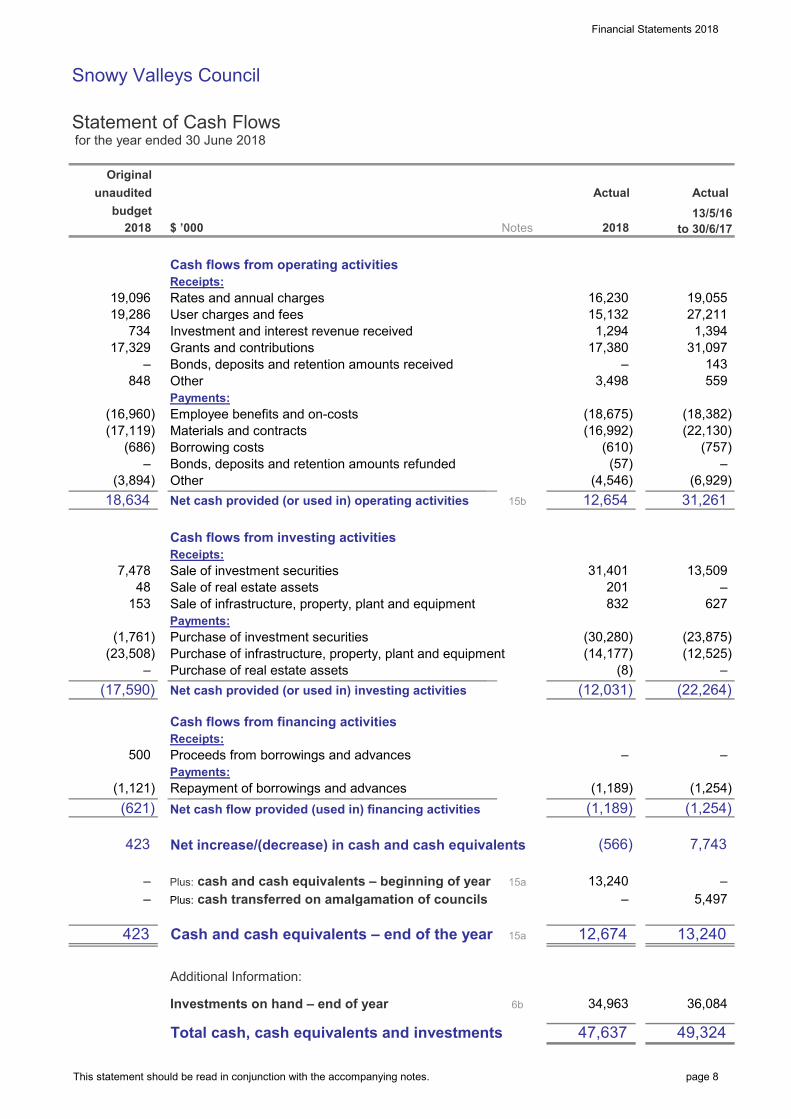
Statement of Cash Flows for the year ended 30 June 2018
$ ’000
Cash flows from operating activitiesReceipts:Rates and annual chargesUser charges and feesInvestment and interest revenue receivedGrants and contributionsBonds, deposits and retention amounts receivedOtherPayments:Employee benefits and on-costsMaterials and contractsBorrowing costsBonds, deposits and retention amounts refundedOtherNet cash provided (or used in) operating activities
Cash flows from investing activitiesReceipts:Sale of investment securitiesSale of real estate assetsSale of infrastructure, property, plant and equipmentPayments:Purchase of investment securitiesPurchase of infrastructure, property, plant and equipmentPurchase of real estate assetsNet cash provided (or used in) investing activities
Cash flows from financing activitiesReceipts:Proceeds from borrowings and advancesPayments:Repayment of borrowings and advancesNet cash flow provided (used in) financing activities
Net increase/(decrease) in cash and cash equivalents
Plus: cash and cash equivalents – beginning of yearPlus: cash transferred on amalgamation of councils
Cash and cash equivalents – end of the year
Additional Information:
Investments on hand – end of year
Total cash, cash equivalents and investments
5,497
1,394 15,132
(8)
848
2018
19,286
– 17,329
734
(3,894)
(16,960)
3,498
2018
500
– (23,508) (1,761)
(17,590)
(18,675)
31,401
15a–
48
423
423
(621)
–
(1,121)
–
Original
budget unaudited
Notes
19,096
15b
153
(17,119)
–
7,478
18,634
(686)
143
19,055
31,097 1,294
16,230 27,211
(22,130) (18,382)
(757)
Actual
(4,546)
–
(610)
559
(57)
17,380
(22,264)
12,654
201 – 627 832
31,261
13,509
49,324
12,674
47,637
(30,280) (14,177)
Actual
(6,929) –
–
(16,992)
36,084
13,240
7,743
(12,031)
(23,875)
(1,254) (1,254)
(12,525)
–
15a
34,963
13,240
(566)
(1,189) (1,189)
–
–
13/5/16 to 30/6/17
6b
X3A3T
This statement should be read in conjunction with the accompanying notes. page 8
Financial Statements 2018
Snowy Valleys Council
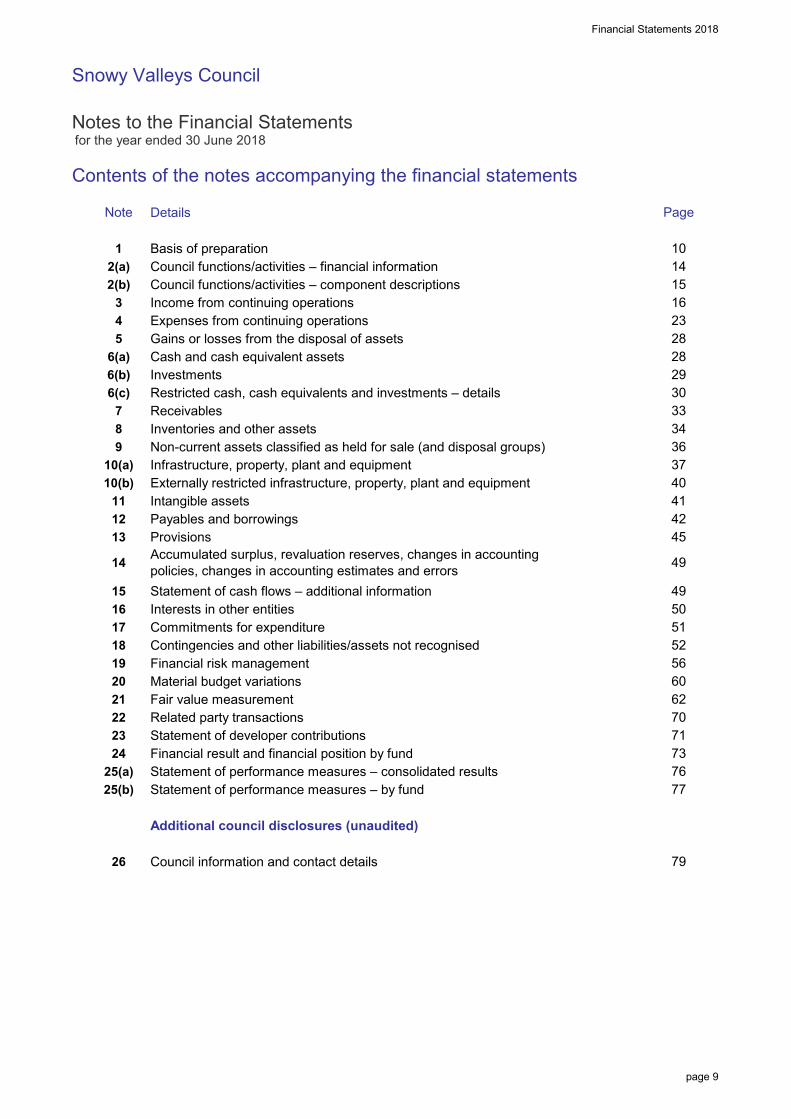
Notes to the Financial Statements for the year ended 30 June 2018
Contents of the notes accompanying the financial statements
Details
Basis of preparationCouncil functions/activities – financial informationCouncil functions/activities – component descriptionsIncome from continuing operationsExpenses from continuing operationsGains or losses from the disposal of assetsCash and cash equivalent assetsInvestmentsRestricted cash, cash equivalents and investments – detailsReceivablesInventories and other assetsNon-current assets classified as held for sale (and disposal groups)Infrastructure, property, plant and equipmentExternally restricted infrastructure, property, plant and equipmentIntangible assetsPayables and borrowingsProvisions
Statement of cash flows – additional informationInterests in other entitiesCommitments for expenditureContingencies and other liabilities/assets not recognisedFinancial risk managementMaterial budget variationsFair value measurementRelated party transactionsStatement of developer contributionsFinancial result and financial position by fundStatement of performance measures – consolidated resultsStatement of performance measures – by fund
Additional council disclosures (unaudited)
Council information and contact details
7725(a)
23
76
6(a)
4
6(c)
25(b)
15
24
22
37
1817
Note
9
12
Page
12(a)
32(b)
6(b)
5
33
42
Accumulated surplus, revaluation reserves, changes in accounting policies, changes in accounting estimates and errors
21
13
6020
5116
19
14
49
5256
28
2930
34
1014151623
28
78
10(a)10(b)
26
11
79
41
36
62
7173
49
45
50
70
40
X5A0T
page 9
Financial Statements 2018_
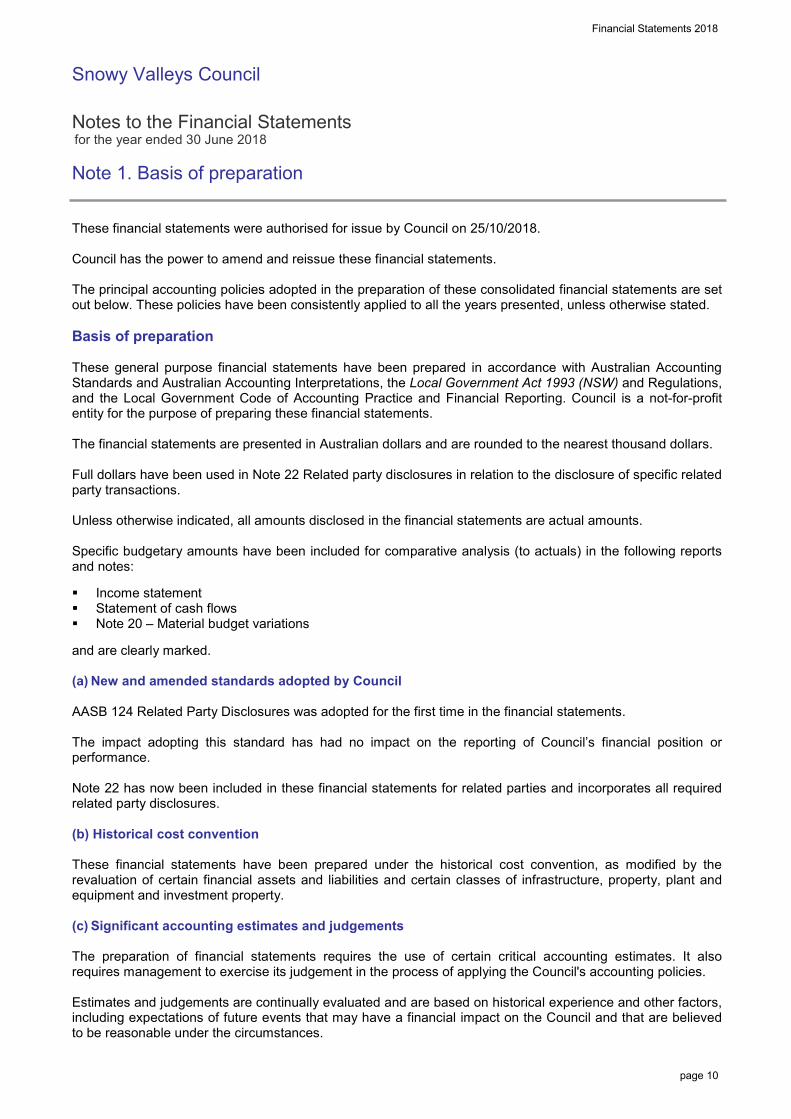
Snowy Valleys Council Notes to the Financial Statements for the year ended 30 June 2018 Note 1. Basis of preparation
page 10
These financial statements were authorised for issue by Council on 25/10/2018. Council has the power to amend and reissue these financial statements. The principal accounting policies adopted in the preparation of these consolidated financial statements are set out below. These policies have been consistently applied to all the years presented, unless otherwise stated. Basis of preparation These general purpose financial statements have been prepared in accordance with Australian Accounting Standards and Australian Accounting Interpretations, the Local Government Act 1993 (NSW) and Regulations, and the Local Government Code of Accounting Practice and Financial Reporting. Council is a not-for-profit entity for the purpose of preparing these financial statements. The financial statements are presented in Australian dollars and are rounded to the nearest thousand dollars. Full dollars have been used in Note 22 Related party disclosures in relation to the disclosure of specific related party transactions. Unless otherwise indicated, all amounts disclosed in the financial statements are actual amounts. Specific budgetary amounts have been included for comparative analysis (to actuals) in the following reports and notes: Income statement Statement of cash flows Note 20 – Material budget variations and are clearly marked. (a) New and amended standards adopted by Council AASB 124 Related Party Disclosures was adopted for the first time in the financial statements. The impact adopting this standard has had no impact on the reporting of Council’s financial position or performance. Note 22 has now been included in these financial statements for related parties and incorporates all required related party disclosures. (b) Historical cost convention These financial statements have been prepared under the historical cost convention, as modified by the revaluation of certain financial assets and liabilities and certain classes of infrastructure, property, plant and equipment and investment property. (c) Significant accounting estimates and judgements The preparation of financial statements requires the use of certain critical accounting estimates. It also requires management to exercise its judgement in the process of applying the Council's accounting policies. Estimates and judgements are continually evaluated and are based on historical experience and other factors, including expectations of future events that may have a financial impact on the Council and that are believed to be reasonable under the circumstances.
Financial Statements 2018_
Snowy Valleys Council Notes to the Financial Statements for the year ended 30 June 2018 Note 1. Basis of preparation (continued)
page 11
Critical accounting estimates and assumptions Council makes estimates and assumptions concerning the future. The resulting accounting estimates will, by definition, seldom equal the related actual results. The estimates and assumptions that have a significant risk of causing a material adjustment to the carrying amounts of assets and liabilities within the next financial year include: (i) estimated fair values of infrastructure, property, plant and equipment – refer Note 10, (ii) estimated tip remediation provisions – refer Note 13, (iii) employee benefit provisions – refer Note 13. Significant judgements in applying the Council's accounting policies (iv) Impairment of receivables Council has made a significant judgement about the impairment of a number of its receivables in Note 7. Monies and other assets received by Council (a) The Consolidated Fund In accordance with the provisions of Section 409(1) of the Local Government Act 1993 (NSW), all money and other assets received by Council is held in the Council’s Consolidated Fund unless it is required to be held in the Council’s Trust Fund. Cash and other assets of the following entities have been included as part of the Consolidated Fund:
• General purpose operations • Water service • Sewerage service • Domestic Waste Management • Private Works Services (consolidated into Council from 1/7/2017 with Assets and Liabilities transferred
as at 30/06/18). Due to their immaterial value and nature the following Committees, Entities and Operations have been excluded from consolidation:
• Batlow Development League • Talbingo Progress Association • Festival of the Falling Leaf and Rock the Turf • Glenroy Recreation Reserve • Khancoban Community Hall • Khancoban Op Shop • Tumbarumba Voices • Tumbarumba Men’s Shed • Tumbarumba Friends of the Library • Pioneer Women Hut • RSL Youth Council • Tooma Recreation Reserve • Tumbarumba Historical Society • Rosewood Community Shed • Khancoban Artisans Gallery
Financial Statements 2018_
Snowy Valleys Council Notes to the Financial Statements for the year ended 30 June 2018 Note 1. Basis of preparation (continued)
page 12
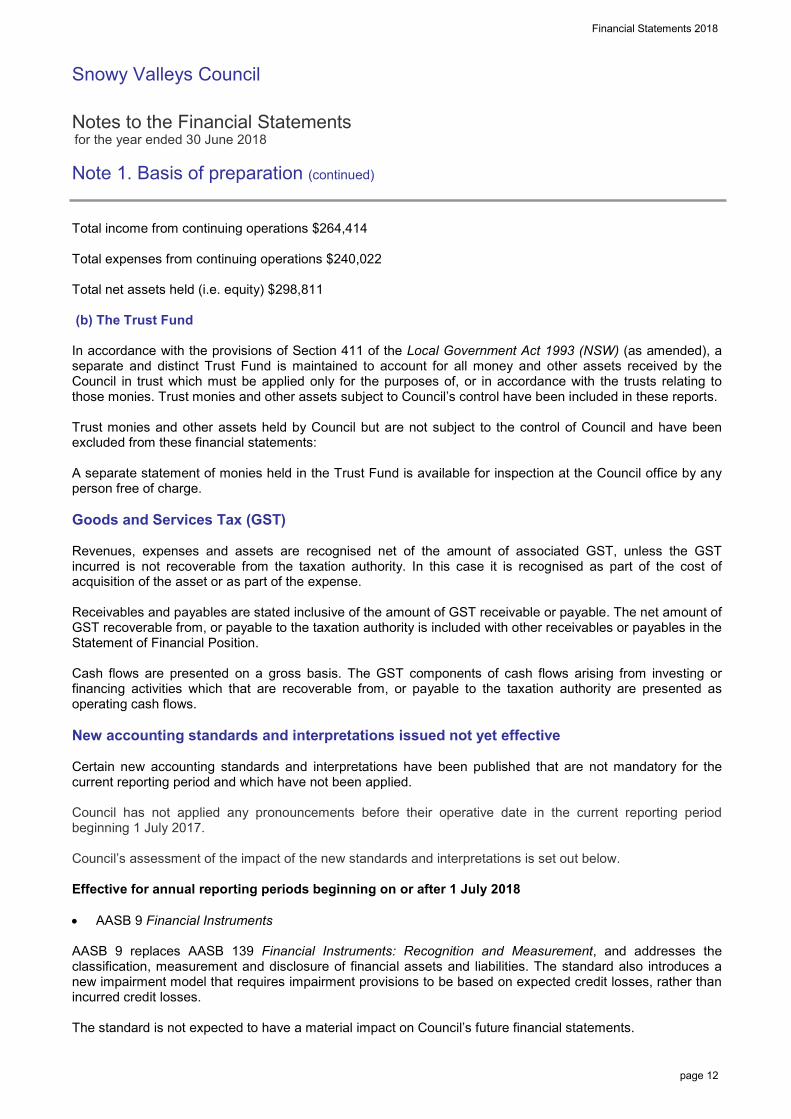
Total income from continuing operations $264,414 Total expenses from continuing operations $240,022 Total net assets held (i.e. equity) $298,811 (b) The Trust Fund In accordance with the provisions of Section 411 of the Local Government Act 1993 (NSW) (as amended), a separate and distinct Trust Fund is maintained to account for all money and other assets received by the Council in trust which must be applied only for the purposes of, or in accordance with the trusts relating to those monies. Trust monies and other assets subject to Council’s control have been included in these reports. Trust monies and other assets held by Council but are not subject to the control of Council and have been excluded from these financial statements: A separate statement of monies held in the Trust Fund is available for inspection at the Council office by any person free of charge. Goods and Services Tax (GST) Revenues, expenses and assets are recognised net of the amount of associated GST, unless the GST incurred is not recoverable from the taxation authority. In this case it is recognised as part of the cost of acquisition of the asset or as part of the expense. Receivables and payables are stated inclusive of the amount of GST receivable or payable. The net amount of GST recoverable from, or payable to the taxation authority is included with other receivables or payables in the Statement of Financial Position. Cash flows are presented on a gross basis. The GST components of cash flows arising from investing or financing activities which that are recoverable from, or payable to the taxation authority are presented as operating cash flows. New accounting standards and interpretations issued not yet effective Certain new accounting standards and interpretations have been published that are not mandatory for the current reporting period and which have not been applied. Council has not applied any pronouncements before their operative date in the current reporting period beginning 1 July 2017. Council’s assessment of the impact of the new standards and interpretations is set out below. Effective for annual reporting periods beginning on or after 1 July 2018 • AASB 9 Financial Instruments AASB 9 replaces AASB 139 Financial Instruments: Recognition and Measurement, and addresses the classification, measurement and disclosure of financial assets and liabilities. The standard also introduces a new impairment model that requires impairment provisions to be based on expected credit losses, rather than incurred credit losses. The standard is not expected to have a material impact on Council’s future financial statements.
Financial Statements 2018_
Snowy Valleys Council Notes to the Financial Statements for the year ended 30 June 2018 Note 1. Basis of preparation (continued)
page 13
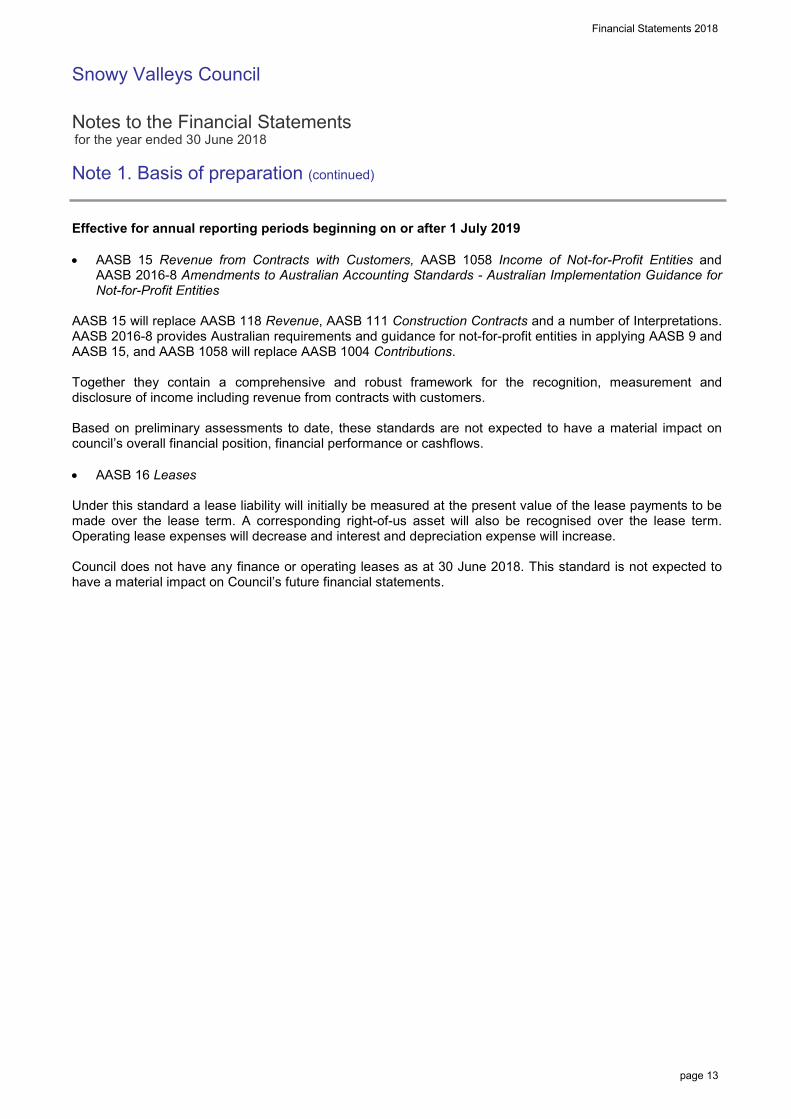
Effective for annual reporting periods beginning on or after 1 July 2019
• AASB 15 Revenue from Contracts with Customers, AASB 1058 Income of Not-for-Profit Entities and AASB 2016-8 Amendments to Australian Accounting Standards - Australian Implementation Guidance for Not-for-Profit Entities
AASB 15 will replace AASB 118 Revenue, AASB 111 Construction Contracts and a number of Interpretations. AASB 2016-8 provides Australian requirements and guidance for not-for-profit entities in applying AASB 9 and AASB 15, and AASB 1058 will replace AASB 1004 Contributions. Together they contain a comprehensive and robust framework for the recognition, measurement and disclosure of income including revenue from contracts with customers. Based on preliminary assessments to date, these standards are not expected to have a material impact on council’s overall financial position, financial performance or cashflows. • AASB 16 Leases Under this standard a lease liability will initially be measured at the present value of the lease payments to be made over the lease term. A corresponding right-of-us asset will also be recognised over the lease term. Operating lease expenses will decrease and interest and depreciation expense will increase. Council does not have any finance or operating leases as at 30 June 2018. This standard is not expected to have a material impact on Council’s future financial statements.
Financial Statements 2018
Snowy Valleys Council
Notes to the Financial Statements for the year ended 30 June 2018
Note 2(a). Council functions/activities – financial information
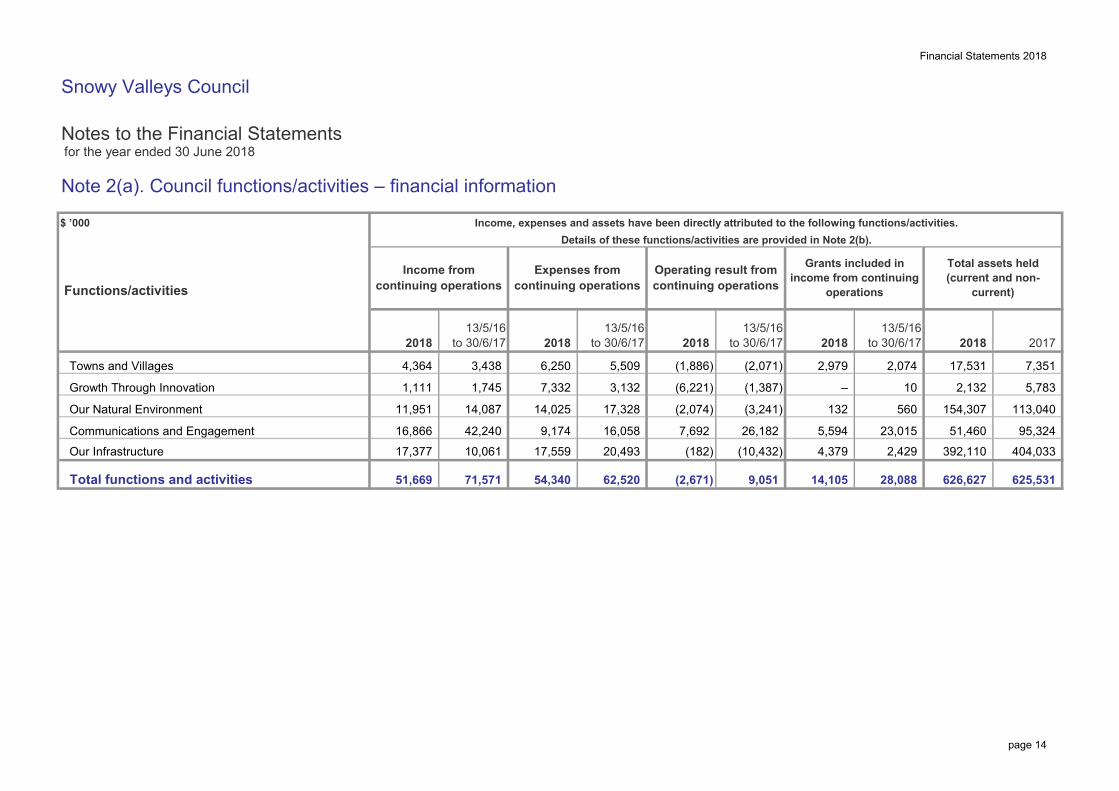
Total functions and activities 71,571 54,340 51,669 625,531 626,627 (2,671) 62,520 14,105 9,051 28,088
17,531 7,351
95,324
113,040
404,033
132
5,783
5,594
154,307
51,460 7,692 26,182
(2,074)
3,132 (1,387)
(2,071)
2018 13/5/16
to 30/6/17
23,015
4,379 392,110
2,132 – 10
2,979 (1,886) 2,074
(182) (10,432)
(6,221)
(3,241) 560
2,429 Our Infrastructure
Our Natural Environment
Communications and Engagement
7,332
11,951
1,745 Growth Through Innovation
Towns and Villages
10,061
42,240 9,174
14,087 14,025
17,559
16,866
4,364 5,509 3,438
17,377
6,250
1,111
20,493
16,058
17,328
Income from continuing operations
Income, expenses and assets have been directly attributed to the following functions/activities.Details of these functions/activities are provided in Note 2(b).
Expenses from continuing operations
Operating result from continuing operations
$ ’000
Total assets held (current and non-
current) Functions/activities
13/5/16 to 30/6/17
Grants included in income from continuing
operations
13/5/16 to 30/6/17 20182018
13/5/16 to 30/6/17 2018 2018 2017
X6A0T
page 14
Financial Statements 2018
Snowy Valleys Council
Notes to the Financial Statements for the year ended 30 June 2018
Note 2(b). Council functions/activities – component descriptions
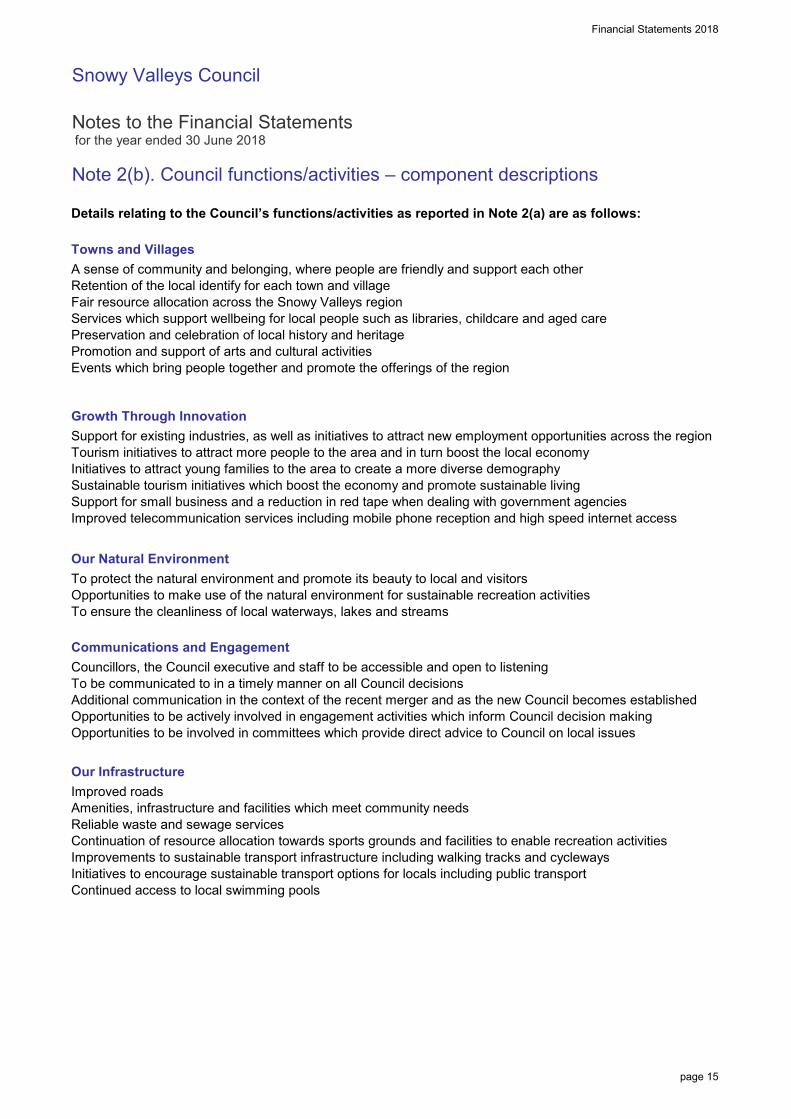
Details relating to the Council’s functions/activities as reported in Note 2(a) are as follows:
Towns and Villages
Growth Through Innovation
Our Natural Environment
Communications and Engagement
Our InfrastructureImproved roadsAmenities, infrastructure and facilities which meet community needsReliable waste and sewage servicesContinuation of resource allocation towards sports grounds and facilities to enable recreation activitiesImprovements to sustainable transport infrastructure including walking tracks and cyclewaysInitiatives to encourage sustainable transport options for locals including public transportContinued access to local swimming pools
A sense of community and belonging, where people are friendly and support each other Retention of the local identify for each town and villageFair resource allocation across the Snowy Valleys regionServices which support wellbeing for local people such as libraries, childcare and aged carePreservation and celebration of local history and heritagePromotion and support of arts and cultural activitiesEvents which bring people together and promote the offerings of the region
Support for existing industries, as well as initiatives to attract new employment opportunities across the regionTourism initiatives to attract more people to the area and in turn boost the local economyInitiatives to attract young families to the area to create a more diverse demographySustainable tourism initiatives which boost the economy and promote sustainable livingSupport for small business and a reduction in red tape when dealing with government agenciesImproved telecommunication services including mobile phone reception and high speed internet access
To protect the natural environment and promote its beauty to local and visitorsOpportunities to make use of the natural environment for sustainable recreation activitiesTo ensure the cleanliness of local waterways, lakes and streams
Councillors, the Council executive and staff to be accessible and open to listeningTo be communicated to in a timely manner on all Council decisionsAdditional communication in the context of the recent merger and as the new Council becomes establishedOpportunities to be actively involved in engagement activities which inform Council decision makingOpportunities to be involved in committees which provide direct advice to Council on local issues
X7A0T
page 15
Financial Statements 2018
Snowy Valleys Council
Notes to the Financial Statements for the year ended 30 June 2018
Note 3. Income from continuing operations
$ ’000
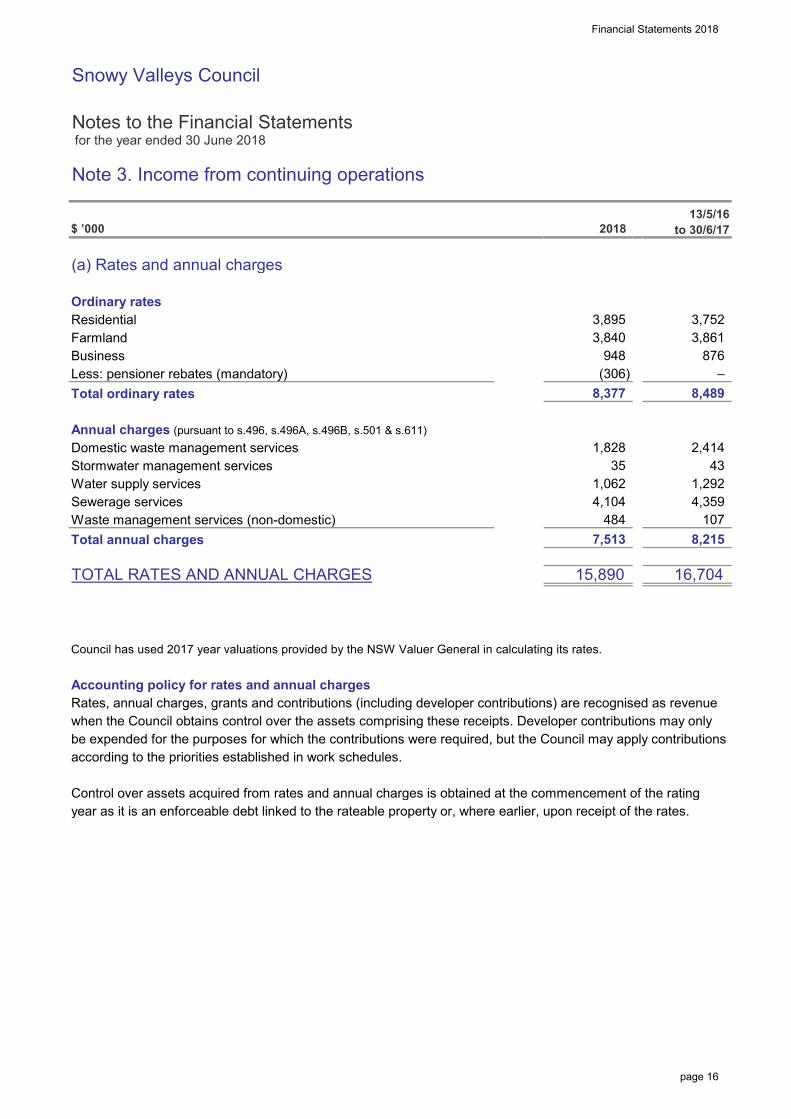
(a) Rates and annual charges
Ordinary ratesResidentialFarmlandBusinessLess: pensioner rebates (mandatory)Total ordinary rates
Annual charges (pursuant to s.496, s.496A, s.496B, s.501 & s.611)Domestic waste management servicesStormwater management servicesWater supply servicesSewerage servicesWaste management services (non-domestic)Total annual charges
TOTAL RATES AND ANNUAL CHARGES
Council has used 2017 year valuations provided by the NSW Valuer General in calculating its rates.
Accounting policy for rates and annual chargesRates, annual charges, grants and contributions (including developer contributions) are recognised as revenuewhen the Council obtains control over the assets comprising these receipts. Developer contributions may onlybe expended for the purposes for which the contributions were required, but the Council may apply contributionsaccording to the priorities established in work schedules.
Control over assets acquired from rates and annual charges is obtained at the commencement of the ratingyear as it is an enforceable debt linked to the rateable property or, where earlier, upon receipt of the rates.
16,704
3,752
876
1,828 35
7,513 8,215
1,062 4,359 4,104
3,895
948 3,840
8,377
3,861
– 8,489
2018 13/5/16
to 30/6/17
(306)
1,292
2,414
484
43
15,890
107
X8A5T
X8A18T
page 16
Financial Statements 2018
Snowy Valleys Council
Notes to the Financial Statements for the year ended 30 June 2018
Note 3. Income from continuing operations (continued)
$ ’000
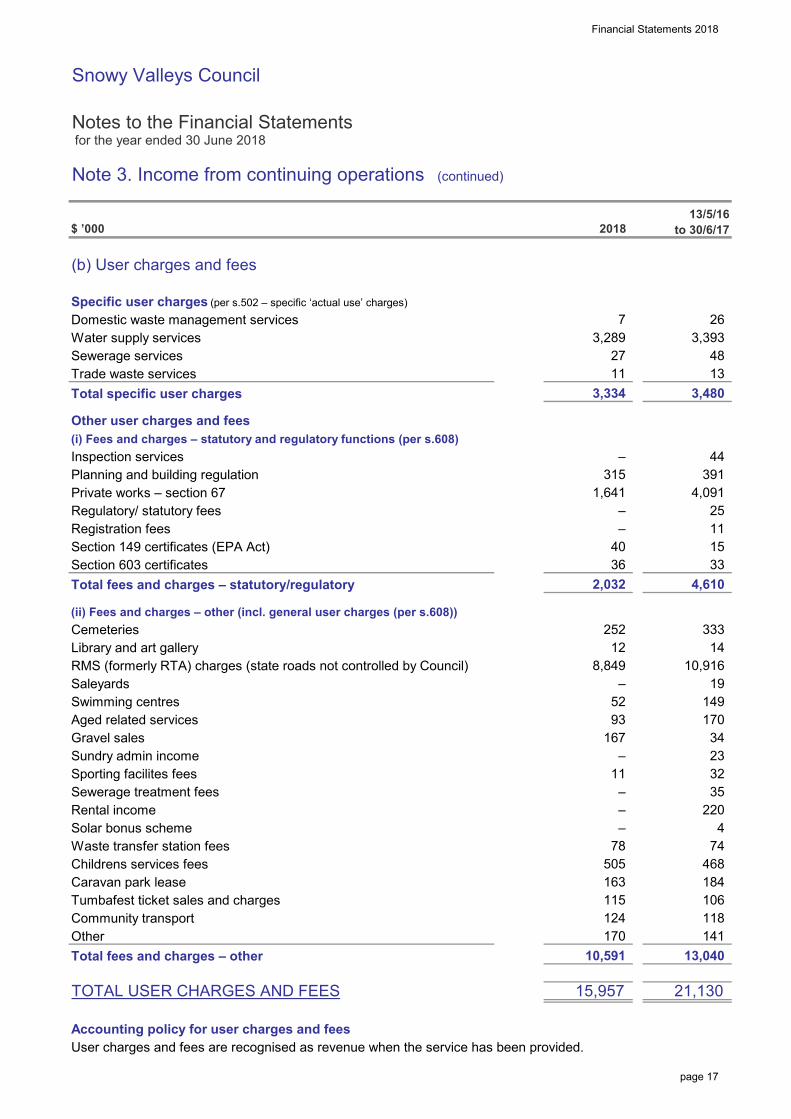
(b) User charges and fees
Specific user charges (per s.502 – specific ‘actual use’ charges)Domestic waste management servicesWater supply servicesSewerage servicesTrade waste servicesTotal specific user charges
Other user charges and fees(i) Fees and charges – statutory and regulatory functions (per s.608)Inspection servicesPlanning and building regulationPrivate works – section 67Regulatory/ statutory feesRegistration feesSection 149 certificates (EPA Act)Section 603 certificatesTotal fees and charges – statutory/regulatory
(ii) Fees and charges – other (incl. general user charges (per s.608))CemeteriesLibrary and art galleryRMS (formerly RTA) charges (state roads not controlled by Council)SaleyardsSwimming centresAged related servicesGravel salesSundry admin incomeSporting facilites feesSewerage treatment feesRental incomeSolar bonus schemeWaste transfer station feesChildrens services feesCaravan park leaseTumbafest ticket sales and chargesCommunity transportOtherTotal fees and charges – other
TOTAL USER CHARGES AND FEES
Accounting policy for user charges and feesUser charges and fees are recognised as revenue when the service has been provided.
184
15
333
13,040
19
4,610
74
10,591
10,916 –
33
25
2,032
44 391
13
170
93 34
11
4,091
3,289
2018 13/5/16
to 30/6/17
11 27
3,334
3,393 26
3,480
48
7
14
23 32 35
220 4
170
124 118
21,130
468
141
149 52
78
11
– –
163
12
–
106
15,957
505
167
–
115
40
–
315
36
–
–
1,641
8,849
252
X8A6T
page 17
Financial Statements 2018
Snowy Valleys Council
Notes to the Financial Statements for the year ended 30 June 2018
Note 3. Income from continuing operations (continued)
$ ’000
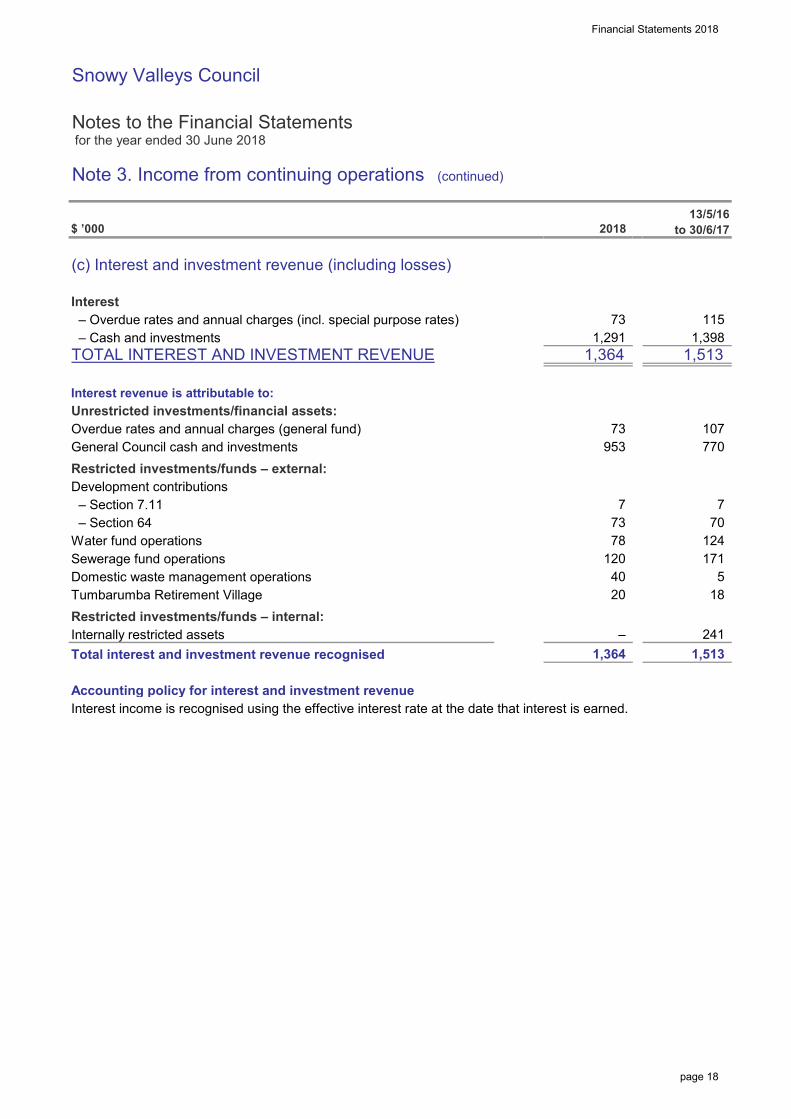
(c) Interest and investment revenue (including losses)
Interest – Overdue rates and annual charges (incl. special purpose rates) – Cash and investmentsTOTAL INTEREST AND INVESTMENT REVENUE
Interest revenue is attributable to:Unrestricted investments/financial assets:Overdue rates and annual charges (general fund)General Council cash and investmentsRestricted investments/funds – external:Development contributions – Section 7.11 – Section 64Water fund operationsSewerage fund operationsDomestic waste management operationsTumbarumba Retirement VillageRestricted investments/funds – internal:Internally restricted assetsTotal interest and investment revenue recognised
Accounting policy for interest and investment revenueInterest income is recognised using the effective interest rate at the date that interest is earned.
241 1,364
5 171
115 1,398
2018 13/5/16
to 30/6/17
1,291
107 770
1,513
–
7 70
1,364
953
7 73
120
1,513
40
73
73
78 124
20 18
X8A7T
page 18
Financial Statements 2018
Snowy Valleys Council
Notes to the Financial Statements for the year ended 30 June 2018
Note 3. Income from continuing operations (continued)
$ ’000
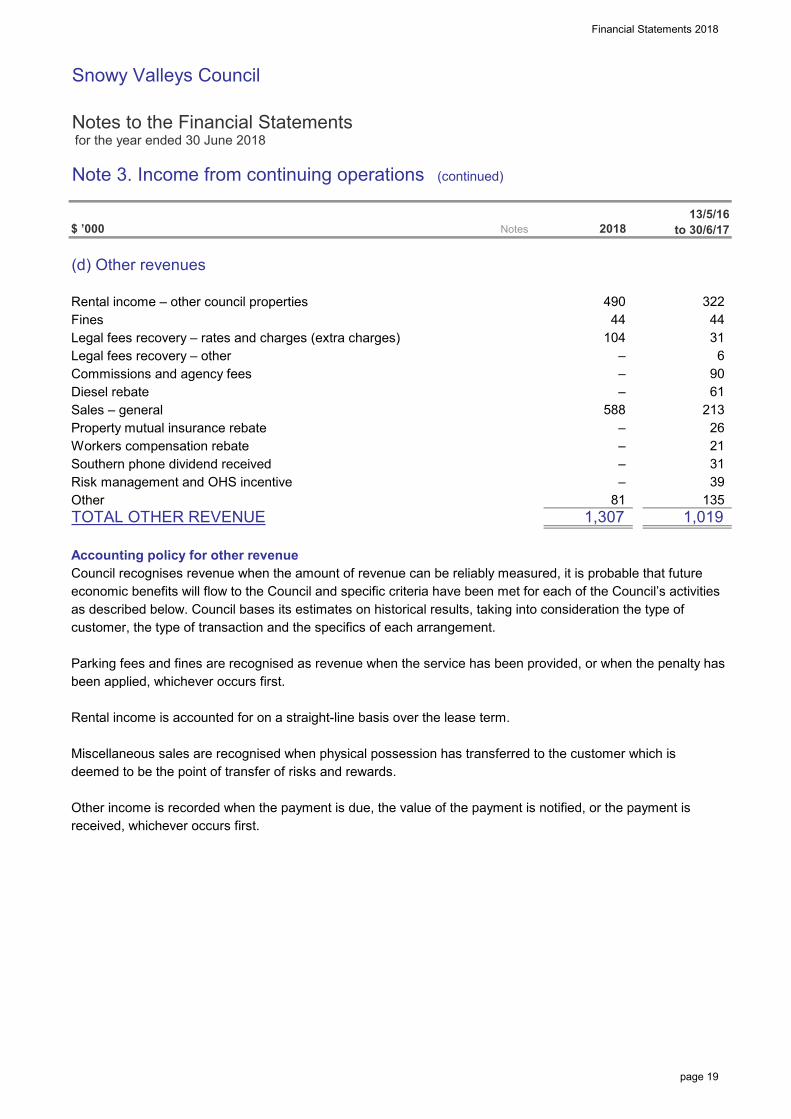
(d) Other revenues
Rental income – other council propertiesFinesLegal fees recovery – rates and charges (extra charges)Legal fees recovery – otherCommissions and agency feesDiesel rebateSales – generalProperty mutual insurance rebateWorkers compensation rebateSouthern phone dividend receivedRisk management and OHS incentiveOtherTOTAL OTHER REVENUE
Accounting policy for other revenueCouncil recognises revenue when the amount of revenue can be reliably measured, it is probable that futureeconomic benefits will flow to the Council and specific criteria have been met for each of the Council’s activitiesas described below. Council bases its estimates on historical results, taking into consideration the type ofcustomer, the type of transaction and the specifics of each arrangement.
Parking fees and fines are recognised as revenue when the service has been provided, or when the penalty hasbeen applied, whichever occurs first.
Rental income is accounted for on a straight-line basis over the lease term.
Miscellaneous sales are recognised when physical possession has transferred to the customer which isdeemed to be the point of transfer of risks and rewards.
Other income is recorded when the payment is due, the value of the payment is notified, or the payment isreceived, whichever occurs first.
– 39
1,019 1,307
21
44 322
13/5/16 to 30/6/17
– 90
81
–
104
Notes
44 490
2018
– 31
6 31
135
–
– –
61 588
26 213
X8A8T
page 19
Financial Statements 2018
Snowy Valleys Council
Notes to the Financial Statements for the year ended 30 June 2018
Note 3. Income from continuing operations (continued)
$ ’000
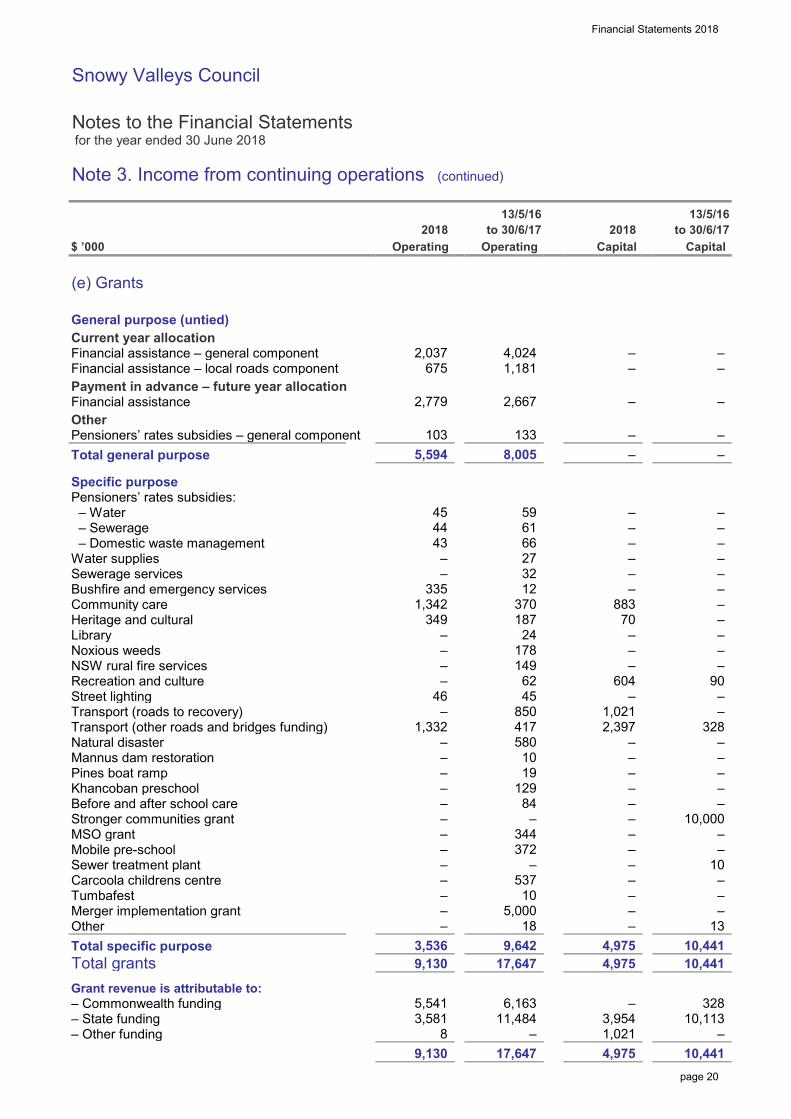
(e) Grants
General purpose (untied)Current year allocationFinancial assistance – general componentFinancial assistance – local roads componentPayment in advance – future year allocationFinancial assistanceOtherPensioners’ rates subsidies – general componentTotal general purpose
Specific purposePensioners’ rates subsidies: – Water – Sewerage – Domestic waste managementWater suppliesSewerage servicesBushfire and emergency servicesCommunity careHeritage and culturalLibraryNoxious weedsNSW rural fire servicesRecreation and cultureStreet lightingTransport (roads to recovery)Transport (other roads and bridges funding)Natural disasterMannus dam restorationPines boat rampKhancoban preschoolBefore and after school careStronger communities grantMSO grantMobile pre-schoolSewer treatment plantCarcoola childrens centreTumbafestMerger implementation grantOtherTotal specific purposeTotal grantsGrant revenue is attributable to:– Commonwealth funding– State funding– Other funding
9,130 8
3,581 –
4,975 10,441
–
– –
–
–
–
–
–
–
–
10,441
13
–
–
4,975
90
–
Capital
–
Capital
–
–
328
–
328
4,975
–
– –
–
10 –
–
3,536
3,954 5,541
–
1,342
–
883
–
62
–
–
Operating
– 2,037
45
675
335
10
–
45
70
2,397
–
–
– 1,332
103
Operating
–
–
–
–
– – –
44
4,024
–
178
5,594
43 – –
–
2,779
13/5/16 to 30/6/17
59
2018
–
24
– –
46
–
19
149
–
349
850
–
–
– –
– 604
– 10,000
10,113
580
–
1,021
– 537
–
11,484
–
9,130 9,642
–
–
187
84 – –
12
417
66 61
2,667
2018
370
133
27 32 –
13/5/16 to 30/6/17
–
18
–
–
8,005
–
10,441
6,163
–
–
344 – 372
–
17,647
–
17,647
–
– 10 –
5,000 –
1,021
–
–
129
–
1,181
X8A17T
page 20
Financial Statements 2018
Snowy Valleys Council
Notes to the Financial Statements for the year ended 30 June 2018
Note 3. Income from continuing operations (continued)
$ ’000
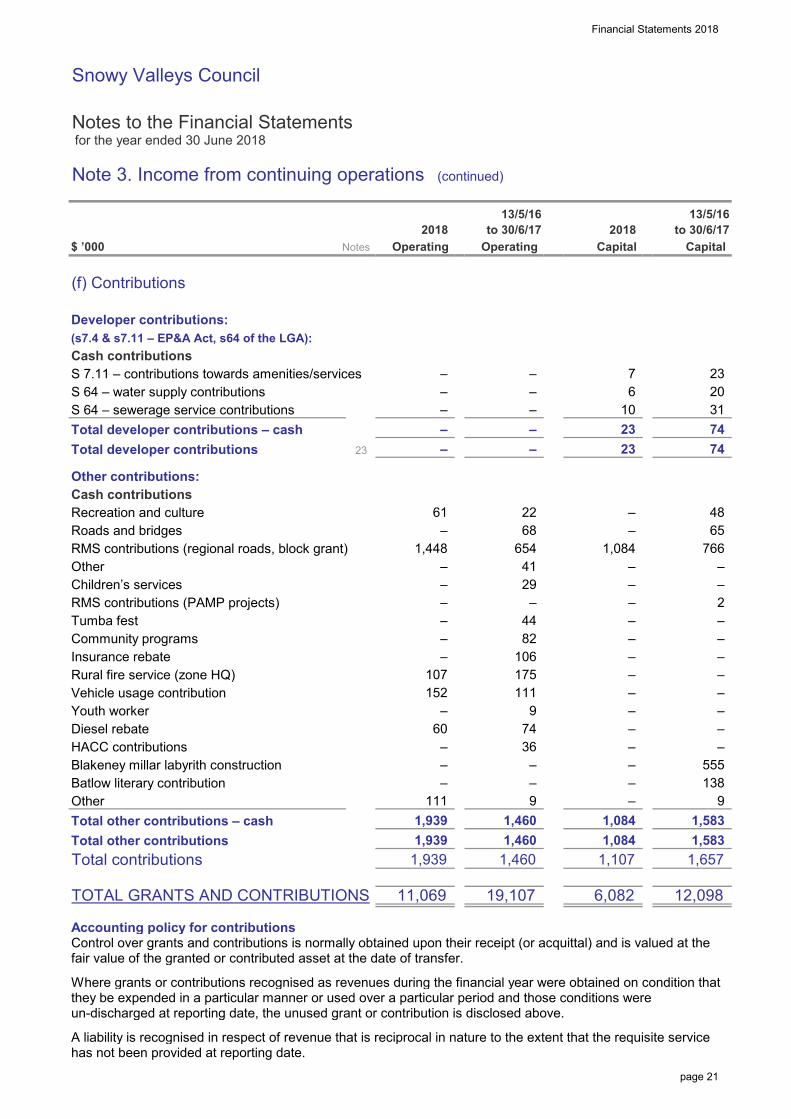
(f) Contributions
Developer contributions:(s7.4 & s7.11 – EP&A Act, s64 of the LGA):Cash contributionsS 7.11 – contributions towards amenities/servicesS 64 – water supply contributionsS 64 – sewerage service contributionsTotal developer contributions – cashTotal developer contributions
Other contributions:Cash contributionsRecreation and cultureRoads and bridgesRMS contributions (regional roads, block grant)OtherChildren’s servicesRMS contributions (PAMP projects)Tumba festCommunity programsInsurance rebateRural fire service (zone HQ)Vehicle usage contributionYouth workerDiesel rebateHACC contributionsBlakeney millar labyrith constructionBatlow literary contributionOtherTotal other contributions – cashTotal other contributionsTotal contributions
TOTAL GRANTS AND CONTRIBUTIONS
Accounting policy for contributionsControl over grants and contributions is normally obtained upon their receipt (or acquittal) and is valued at thefair value of the granted or contributed asset at the date of transfer.
Where grants or contributions recognised as revenues during the financial year were obtained on condition thatthey be expended in a particular manner or used over a particular period and those conditions wereun-discharged at reporting date, the unused grant or contribution is disclosed above.
A liability is recognised in respect of revenue that is reciprocal in nature to the extent that the requisite servicehas not been provided at reporting date.
2018
1,460
–
–
2018
–
13/5/16 to 30/6/17
1,939 1,460 1,084 1,583
– –
111
– 82
– – –
107 175
19,107
74
9
60
Capital
12,098
1,084 1,939
–
29
Notes
13/5/16 to 30/6/17
–
Operating
23
11,069 6,082
–
– 41
1,107 1,657
–
654
–
9
–
Operating
–
– –
–
– –
–
–
1,084
36
–
Capital
–
23
–
74 74
23 20 31 10
23
6
22 61
7
–
–
68
–
– – 766
– 106 –
–
– –
65 1,448
–
–
48
2 –
1,460 1,939 1,583
–
– – – 555
44
–
–
152 111 – –
–
138
– 9
X8A9T
page 21
Financial Statements 2018
Snowy Valleys Council
Notes to the Financial Statements for the year ended 30 June 2018
Note 3. Income from continuing operations (continued)
$ ’000
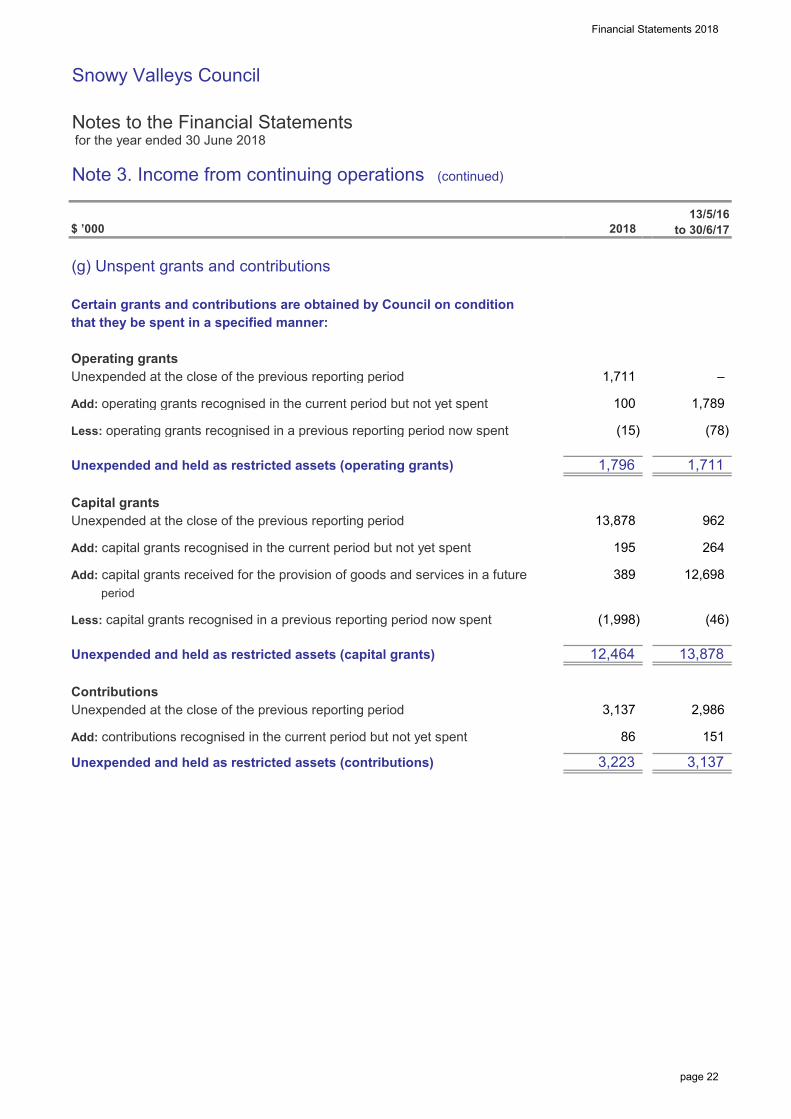
(g) Unspent grants and contributions
Certain grants and contributions are obtained by Council on conditionthat they be spent in a specified manner:
Operating grantsUnexpended at the close of the previous reporting period
Add: operating grants recognised in the current period but not yet spent
Less: operating grants recognised in a previous reporting period now spent
Unexpended and held as restricted assets (operating grants)
Capital grantsUnexpended at the close of the previous reporting period
Add: capital grants recognised in the current period but not yet spent
Add: capital grants received for the provision of goods and services in a future period
Less: capital grants recognised in a previous reporting period now spent
Unexpended and held as restricted assets (capital grants)
ContributionsUnexpended at the close of the previous reporting period
Add: contributions recognised in the current period but not yet spent
Unexpended and held as restricted assets (contributions)
(78)
1,796
151
(1,998)
100
12,464
2018
1,711
2,986
1,711
(46)
–
1,789
389
3,137
12,698
86
3,137
(15)
962 13,878
195
13,878
13/5/16 to 30/6/17
264
3,223
page 22
Financial Statements 2018
Snowy Valleys Council
Notes to the Financial Statements for the year ended 30 June 2018
Note 4. Expenses from continuing operations
$ ’000
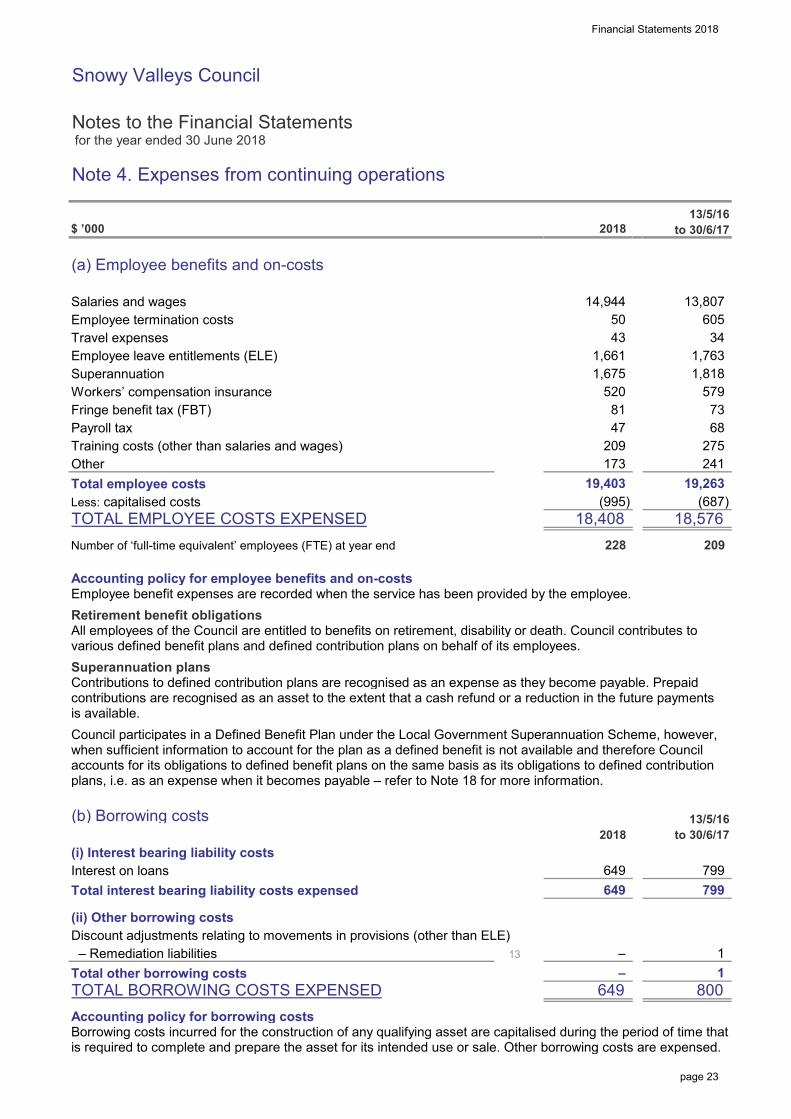
(a) Employee benefits and on-costs
Salaries and wagesEmployee termination costsTravel expensesEmployee leave entitlements (ELE)SuperannuationWorkers’ compensation insuranceFringe benefit tax (FBT)Payroll taxTraining costs (other than salaries and wages)OtherTotal employee costsLess: capitalised costsTOTAL EMPLOYEE COSTS EXPENSEDNumber of ‘full-time equivalent’ employees (FTE) at year end
Accounting policy for employee benefits and on-costsEmployee benefit expenses are recorded when the service has been provided by the employee.Retirement benefit obligationsAll employees of the Council are entitled to benefits on retirement, disability or death. Council contributes tovarious defined benefit plans and defined contribution plans on behalf of its employees.Superannuation plansContributions to defined contribution plans are recognised as an expense as they become payable. Prepaidcontributions are recognised as an asset to the extent that a cash refund or a reduction in the future paymentsis available.Council participates in a Defined Benefit Plan under the Local Government Superannuation Scheme, however,when sufficient information to account for the plan as a defined benefit is not available and therefore Councilaccounts for its obligations to defined benefit plans on the same basis as its obligations to defined contributionplans, i.e. as an expense when it becomes payable – refer to Note 18 for more information.
(b) Borrowing costsNil(i) Interest bearing liability costsInterest on loansTotal interest bearing liability costs expensed
(ii) Other borrowing costsDiscount adjustments relating to movements in provisions (other than ELE) – Remediation liabilitiesTotal other borrowing costsTOTAL BORROWING COSTS EXPENSEDAccounting policy for borrowing costsBorrowing costs incurred for the construction of any qualifying asset are capitalised during the period of time thatis required to complete and prepare the asset for its intended use or sale. Other borrowing costs are expensed.
2018
520 1,818
68 81
50 605
13/5/16 to 30/6/17
1,661
275
13,807
34
18,576
173
47
1,763 1,675
799
1
209
209
14,944
799
19,263
228
2018
241
579
(687)
43
13/5/16 to 30/6/17
73
18,408
–
800
(995) 19,403
1 13
649 –
649
– –
649
X8A11T
X8A12T
X8A19T
page 23
Financial Statements 2018
Snowy Valleys Council
Notes to the Financial Statements for the year ended 30 June 2018
Note 4. Expenses from continuing operations (continued)
$ ’000
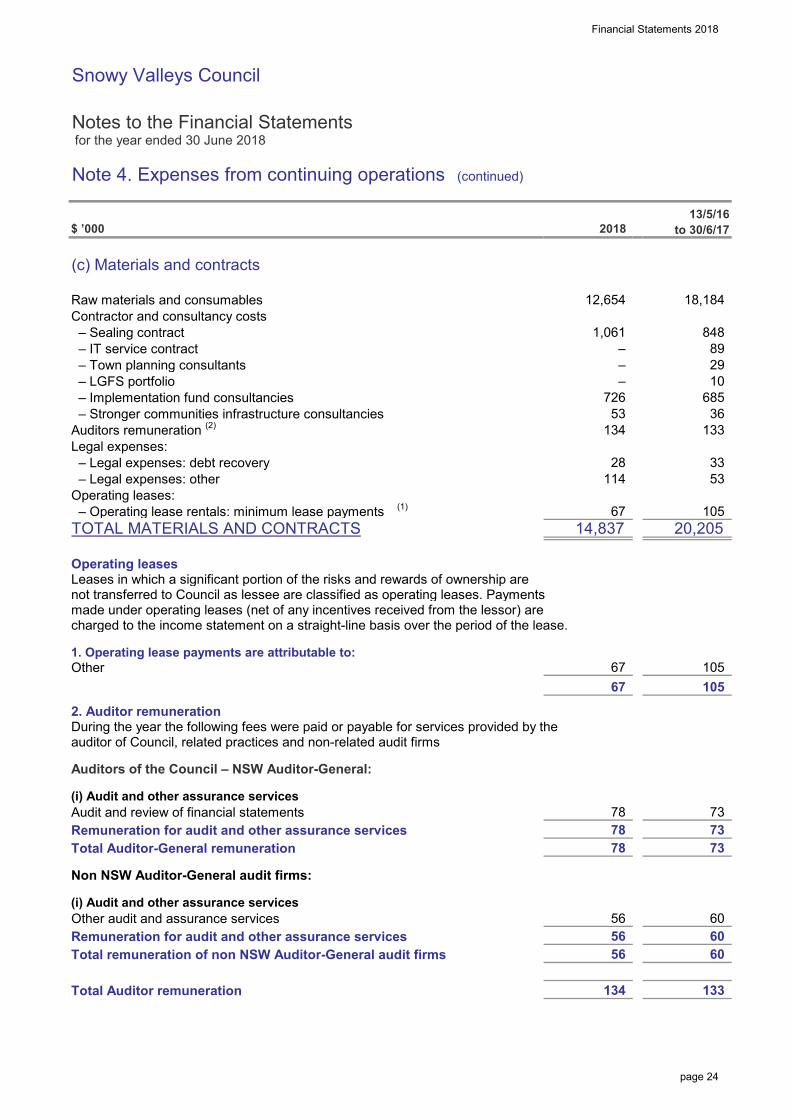
(c) Materials and contracts
Raw materials and consumablesContractor and consultancy costs – Sealing contract – IT service contract – Town planning consultants – LGFS portfolio – Implementation fund consultancies – Stronger communities infrastructure consultanciesAuditors remuneration (2)
Legal expenses: – Legal expenses: debt recovery – Legal expenses: otherOperating leases: – Operating lease rentals: minimum lease payments (1)
TOTAL MATERIALS AND CONTRACTS
Operating leasesLeases in which a significant portion of the risks and rewards of ownership arenot transferred to Council as lessee are classified as operating leases. Paymentsmade under operating leases (net of any incentives received from the lessor) arecharged to the income statement on a straight-line basis over the period of the lease.
1. Operating lease payments are attributable to:Other
2. Auditor remunerationDuring the year the following fees were paid or payable for services provided by theauditor of Council, related practices and non-related audit firms
Auditors of the Council – NSW Auditor-General:
(i) Audit and other assurance servicesAudit and review of financial statementsRemuneration for audit and other assurance servicesTotal Auditor-General remuneration
Non NSW Auditor-General audit firms:
(i) Audit and other assurance servicesOther audit and assurance services Remuneration for audit and other assurance servicesTotal remuneration of non NSW Auditor-General audit firms
Total Auditor remuneration
60
29
56 60
60
13/5/16 to 30/6/17
28
105
56
78
105
12,654
67 67
73 73
105
78
53
133 134 53
20,205 14,837
73
36
33
10 –
133 134
67
685
–
1,061 89
– 18,184
– 848
114
–
2018
726
78
56
X8A13T
page 24
Financial Statements 2018
Snowy Valleys Council
Notes to the Financial Statements for the year ended 30 June 2018
Note 4. Expenses from continuing operations (continued)
$ ’000
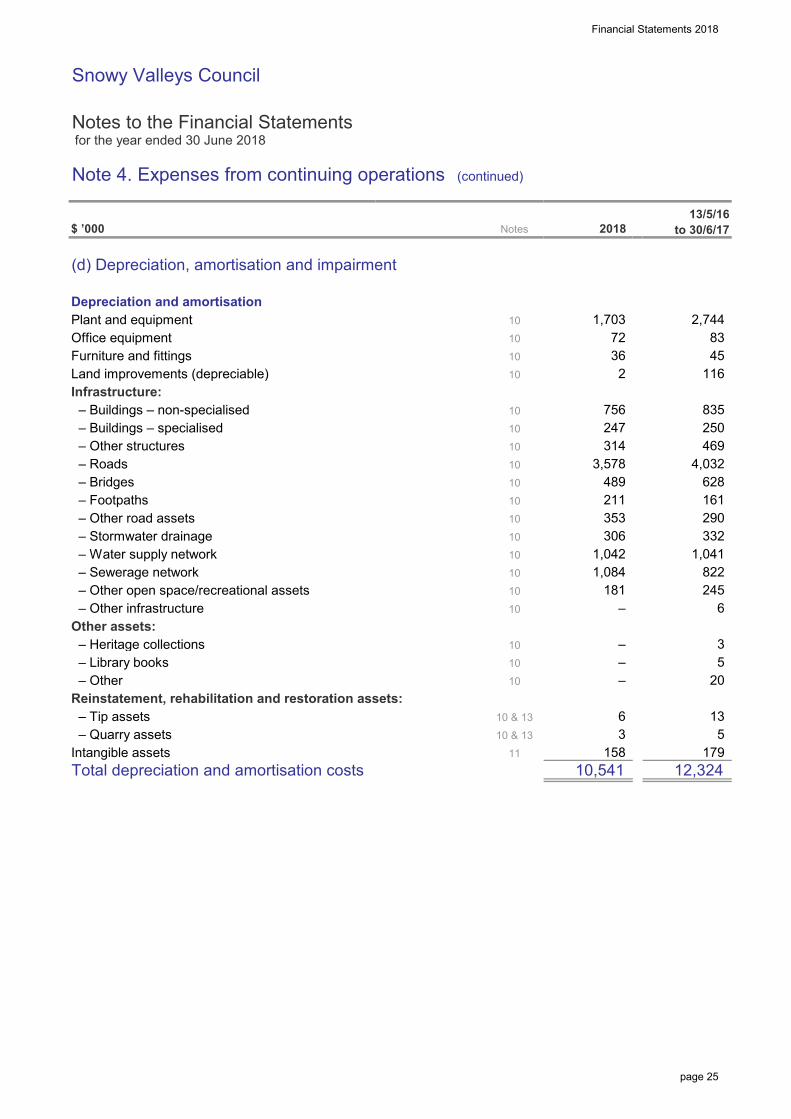
(d) Depreciation, amortisation and impairment
Depreciation and amortisationPlant and equipmentOffice equipmentFurniture and fittingsLand improvements (depreciable)Infrastructure: – Buildings – non-specialised – Buildings – specialised – Other structures – Roads – Bridges – Footpaths – Other road assets – Stormwater drainage – Water supply network – Sewerage network – Other open space/recreational assets – Other infrastructureOther assets: – Heritage collections – Library books – OtherReinstatement, rehabilitation and restoration assets: – Tip assets – Quarry assetsIntangible assetsTotal depreciation and amortisation costs
2,744
13/5/16 to 30/6/17
13
835
4,032
179
83
756
211
250
45
20
822 1,084
12,324
116 36
469
6
Notes
6
10
1010
101010
2
181
–
10,541
314
489
1,041
3
628
332
245
5 –
11
247 1010
1,042
–
158
2018
1010
161
–
10
3,578 101010101010
1,703
290 353
1010
306
72
5 10 & 13 3 10 & 13
X8A14T
page 25
Financial Statements 2018
Snowy Valleys Council
Notes to the Financial Statements for the year ended 30 June 2018
Note 4. Expenses from continuing operations (continued)
$ ’000
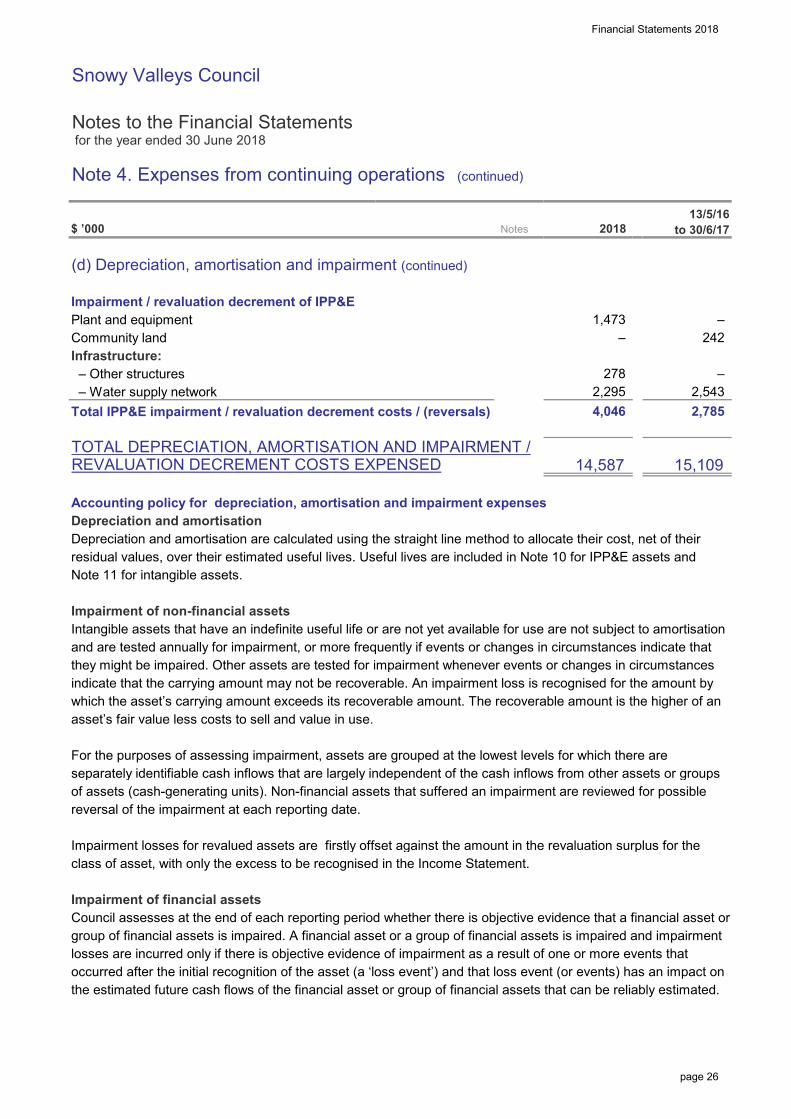
(d) Depreciation, amortisation and impairment (continued)
Impairment / revaluation decrement of IPP&EPlant and equipmentCommunity landInfrastructure: – Other structures – Water supply networkTotal IPP&E impairment / revaluation decrement costs / (reversals)
TOTAL DEPRECIATION, AMORTISATION AND IMPAIRMENT /REVALUATION DECREMENT COSTS EXPENSED
Accounting policy for depreciation, amortisation and impairment expensesDepreciation and amortisationDepreciation and amortisation are calculated using the straight line method to allocate their cost, net of theirresidual values, over their estimated useful lives. Useful lives are included in Note 10 for IPP&E assets andNote 11 for intangible assets.
Impairment of non-financial assetsIntangible assets that have an indefinite useful life or are not yet available for use are not subject to amortisationand are tested annually for impairment, or more frequently if events or changes in circumstances indicate thatthey might be impaired. Other assets are tested for impairment whenever events or changes in circumstancesindicate that the carrying amount may not be recoverable. An impairment loss is recognised for the amount bywhich the asset’s carrying amount exceeds its recoverable amount. The recoverable amount is the higher of anasset’s fair value less costs to sell and value in use.
For the purposes of assessing impairment, assets are grouped at the lowest levels for which there areseparately identifiable cash inflows that are largely independent of the cash inflows from other assets or groupsof assets (cash-generating units). Non-financial assets that suffered an impairment are reviewed for possiblereversal of the impairment at each reporting date.
Impairment losses for revalued assets are firstly offset against the amount in the revaluation surplus for theclass of asset, with only the excess to be recognised in the Income Statement.
Impairment of financial assetsCouncil assesses at the end of each reporting period whether there is objective evidence that a financial asset orgroup of financial assets is impaired. A financial asset or a group of financial assets is impaired and impairmentlosses are incurred only if there is objective evidence of impairment as a result of one or more events thatoccurred after the initial recognition of the asset (a ‘loss event’) and that loss event (or events) has an impact onthe estimated future cash flows of the financial asset or group of financial assets that can be reliably estimated.
2,295
15,109 14,587
2,785 4,046
13/5/16 to 30/6/17 Notes 2018
2,543
–
278
1,473 –
–
242
X8A15T
page 26
Financial Statements 2018
Snowy Valleys Council
Notes to the Financial Statements for the year ended 30 June 2018
Note 4. Expenses from continuing operations (continued)
$ ’000
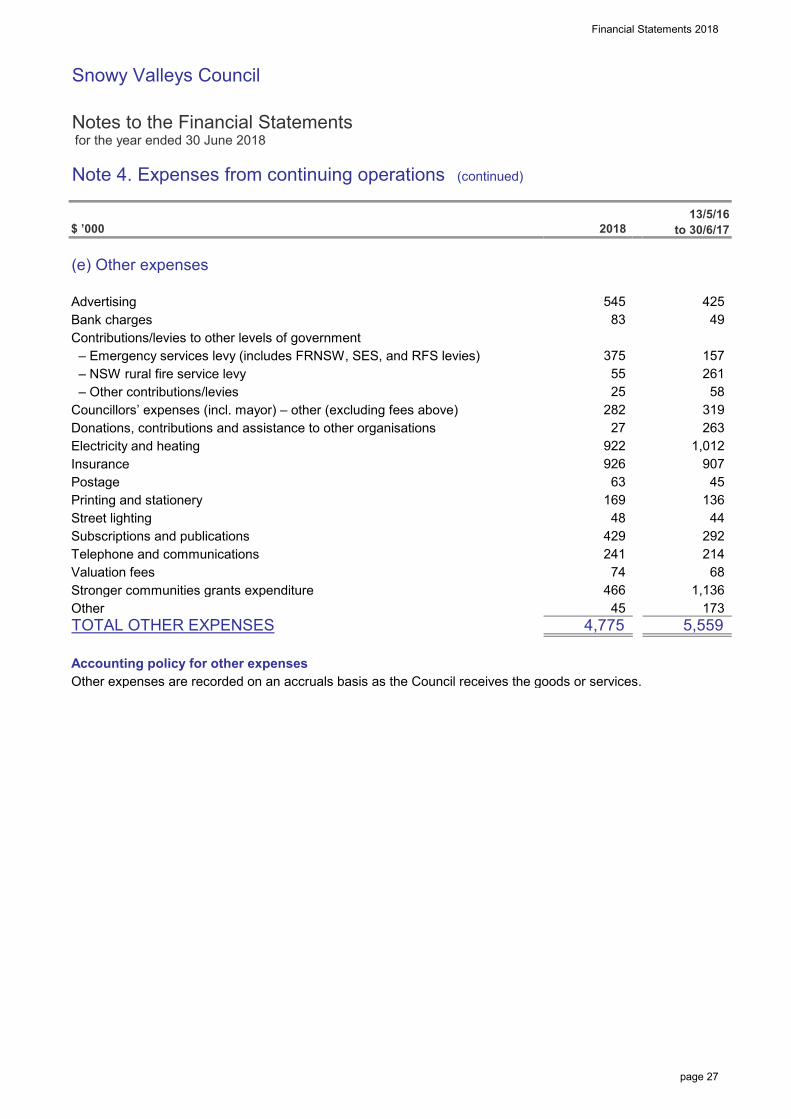
(e) Other expenses
AdvertisingBank chargesContributions/levies to other levels of government – Emergency services levy (includes FRNSW, SES, and RFS levies) – NSW rural fire service levy – Other contributions/leviesCouncillors’ expenses (incl. mayor) – other (excluding fees above)Donations, contributions and assistance to other organisationsElectricity and heatingInsurancePostagePrinting and stationeryStreet lightingSubscriptions and publicationsTelephone and communicationsValuation feesStronger communities grants expenditureOtherTOTAL OTHER EXPENSES
Accounting policy for other expensesOther expenses are recorded on an accruals basis as the Council receives the goods or services.
–
319
214
922
58
74 68
44
926
425
157
49 –
83
261
1,012
466
429
4,775
136
45 173 1,136
169 48
45
292
27
907
5,559
263 282
63
55 375
2018
241
545
Notes
25
13/5/16 to 30/6/17
X8A16T
page 27
Financial Statements 2018
Snowy Valleys Council
Notes to the Financial Statements for the year ended 30 June 2018
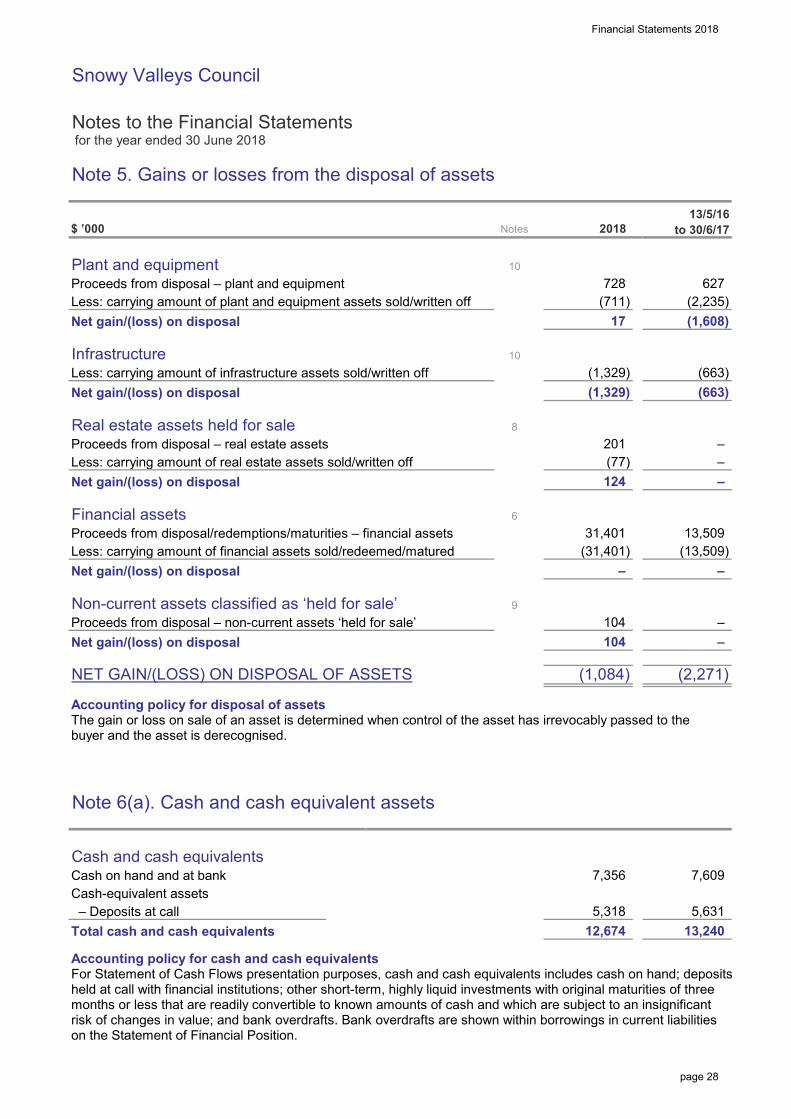
Note 5. Gains or losses from the disposal of assets
$ ’000
Plant and equipmentProceeds from disposal – plant and equipmentLess: carrying amount of plant and equipment assets sold/written offNet gain/(loss) on disposal
InfrastructureLess: carrying amount of infrastructure assets sold/written offNet gain/(loss) on disposal
Real estate assets held for saleProceeds from disposal – real estate assetsLess: carrying amount of real estate assets sold/written offNet gain/(loss) on disposal
Financial assetsProceeds from disposal/redemptions/maturities – financial assetsLess: carrying amount of financial assets sold/redeemed/maturedNet gain/(loss) on disposal
Non-current assets classified as ‘held for sale’Proceeds from disposal – non-current assets ‘held for sale’Net gain/(loss) on disposal
NET GAIN/(LOSS) ON DISPOSAL OF ASSETS
Accounting policy for disposal of assetsThe gain or loss on sale of an asset is determined when control of the asset has irrevocably passed to thebuyer and the asset is derecognised.
Note 6(a). Cash and cash equivalent assets
Cash and cash equivalentsCash on hand and at bankCash-equivalent assets – Deposits at callTotal cash and cash equivalents
Accounting policy for cash and cash equivalentsFor Statement of Cash Flows presentation purposes, cash and cash equivalents includes cash on hand; depositsheld at call with financial institutions; other short-term, highly liquid investments with original maturities of threemonths or less that are readily convertible to known amounts of cash and which are subject to an insignificantrisk of changes in value; and bank overdrafts. Bank overdrafts are shown within borrowings in current liabilitieson the Statement of Financial Position.
(13,509) –
(1,608)
–
–
10
–
(2,235) 627
13/5/16 to 30/6/17 Notes
9
6
2018
(663)
(711)
124
10(663)
–
(1,329) (1,329)
17
104
8
13,509 (31,401)
–
(1,084) (2,271)
12,674 5,318
7,356
13,240
7,609
5,631
104
31,401
–
(77) 201
728
X8A0T
X8A10T
page 28
Financial Statements 2018
Snowy Valleys Council
Notes to the Financial Statements for the year ended 30 June 2018
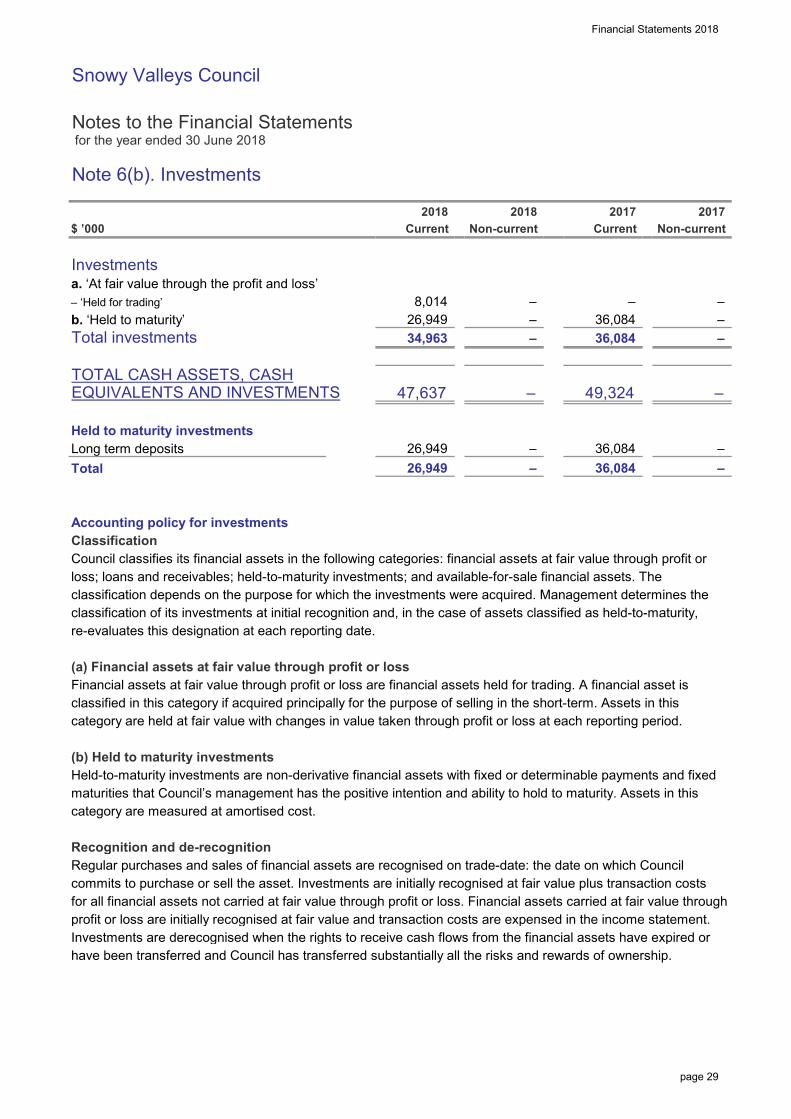
Note 6(b). Investments
$ ’000
Investmentsa. ‘At fair value through the profit and loss’– ‘Held for trading’b. ‘Held to maturity’Total investments
TOTAL CASH ASSETS, CASHEQUIVALENTS AND INVESTMENTS
Held to maturity investmentsLong term depositsTotal
Accounting policy for investmentsClassificationCouncil classifies its financial assets in the following categories: financial assets at fair value through profit orloss; loans and receivables; held-to-maturity investments; and available-for-sale financial assets. Theclassification depends on the purpose for which the investments were acquired. Management determines theclassification of its investments at initial recognition and, in the case of assets classified as held-to-maturity,re-evaluates this designation at each reporting date.
(a) Financial assets at fair value through profit or lossFinancial assets at fair value through profit or loss are financial assets held for trading. A financial asset isclassified in this category if acquired principally for the purpose of selling in the short-term. Assets in thiscategory are held at fair value with changes in value taken through profit or loss at each reporting period.
(b) Held to maturity investmentsHeld-to-maturity investments are non-derivative financial assets with fixed or determinable payments and fixedmaturities that Council’s management has the positive intention and ability to hold to maturity. Assets in thiscategory are measured at amortised cost.
Recognition and de-recognition Regular purchases and sales of financial assets are recognised on trade-date: the date on which Councilcommits to purchase or sell the asset. Investments are initially recognised at fair value plus transaction costsfor all financial assets not carried at fair value through profit or loss. Financial assets carried at fair value throughprofit or loss are initially recognised at fair value and transaction costs are expensed in the income statement.Investments are derecognised when the rights to receive cash flows from the financial assets have expired orhave been transferred and Council has transferred substantially all the risks and rewards of ownership.
20172018Current
– – 26,949 36,084
– 26,949
Current
–
2018
–
– 36,084
–
8,014
2017Non-current Non-current
26,949
34,963
47,637
– –
– 36,084
– 49,324
–
–
36,084
X8A1T
page 29
Financial Statements 2018
Snowy Valleys Council
Notes to the Financial Statements for the year ended 30 June 2018
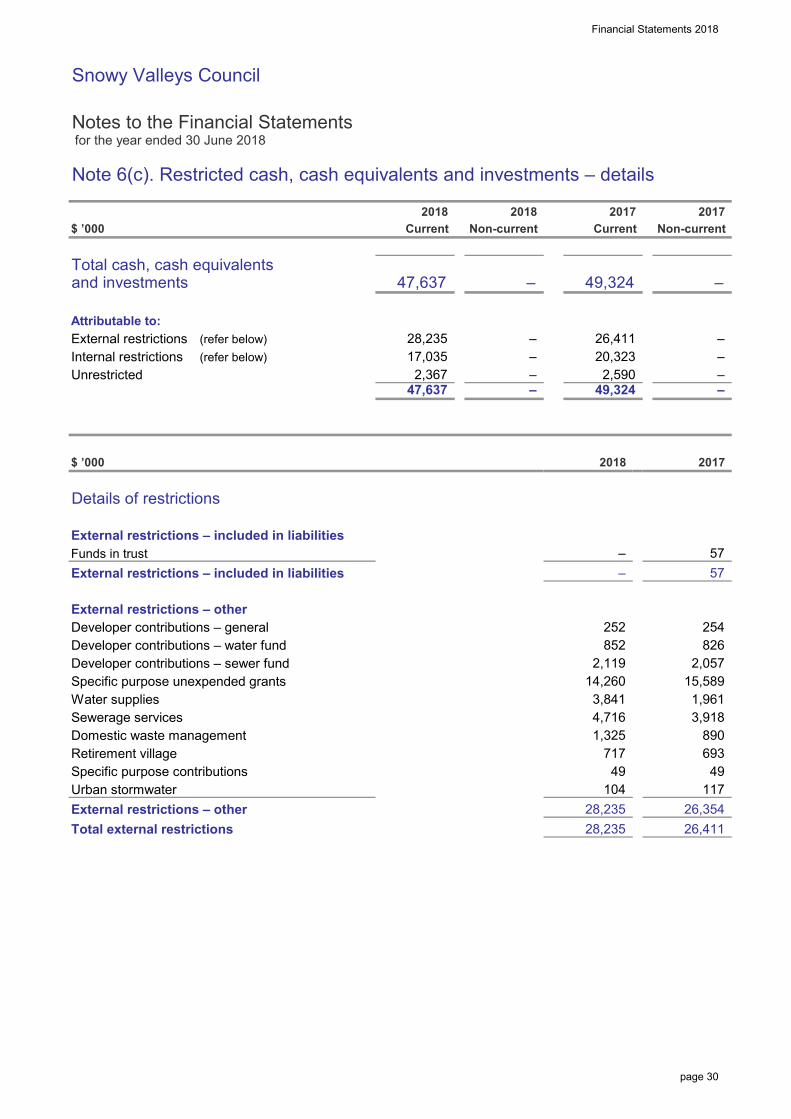
Note 6(c). Restricted cash, cash equivalents and investments – details
$ ’000
Total cash, cash equivalentsand investments
Attributable to:External restrictions (refer below)Internal restrictions (refer below)Unrestricted
$ ’000
Details of restrictions
External restrictions – included in liabilitiesFunds in trustExternal restrictions – included in liabilities
External restrictions – otherDeveloper contributions – generalDeveloper contributions – water fundDeveloper contributions – sewer fundSpecific purpose unexpended grantsWater suppliesSewerage servicesDomestic waste managementRetirement villageSpecific purpose contributionsUrban stormwaterExternal restrictions – otherTotal external restrictions
2018
4,716
Non-current Current
–
47,637
49,324 2,367
17,035
254
49,324
2017
2,590
28,235
2018
–
– –
Current
28,235
–
26,411
3,918
252
26,354
2017
28,235
890
–
2,119
1,961
2017
14,260
26,411
117 49
–
693
57
3,841
20,323
1,325
47,637
–
2018Non-current
–
Notes
104
2,057 852 826
57
717
15,589
49
–
–
–
X8A20T
page 30
Financial Statements 2018
Snowy Valleys Council
Notes to the Financial Statements for the year ended 30 June 2018
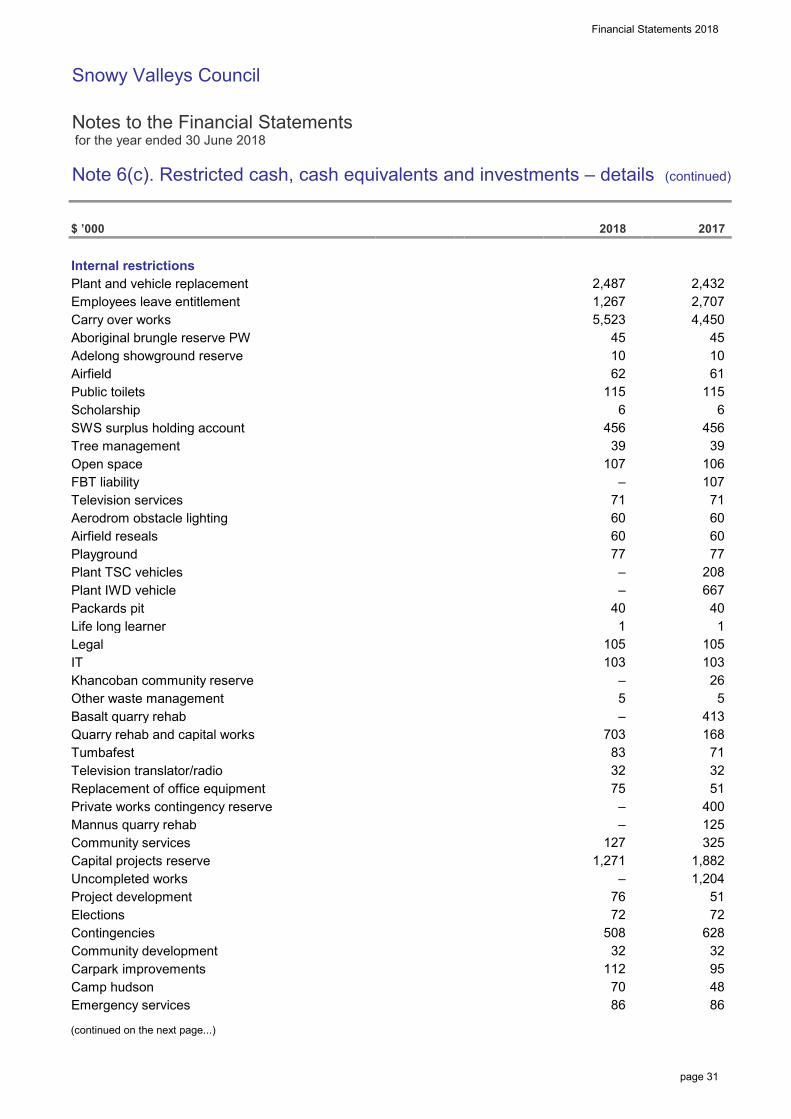
Note 6(c). Restricted cash, cash equivalents and investments – details (continued)
$ ’000
Internal restrictionsPlant and vehicle replacementEmployees leave entitlementCarry over worksAboriginal brungle reserve PWAdelong showground reserveAirfieldPublic toiletsScholarshipSWS surplus holding accountTree managementOpen spaceFBT liabilityTelevision servicesAerodrom obstacle lightingAirfield resealsPlaygroundPlant TSC vehiclesPlant IWD vehiclePackards pitLife long learnerLegalITKhancoban community reserveOther waste managementBasalt quarry rehabQuarry rehab and capital worksTumbafestTelevision translator/radioReplacement of office equipmentPrivate works contingency reserveMannus quarry rehabCommunity servicesCapital projects reserveUncompleted worksProject developmentElectionsContingenciesCommunity developmentCarpark improvementsCamp hudsonEmergency services
(continued on the next page...)
39
71 32
26
77
60
667
125
508 628 32 32
112 95 70 48 86 86
413
–
105
83 32
– 5
1,271
103
–
Notes
71
–
–
45
–
2,487
2018
51
2,707
–
10
2017
1 40
103 105
1,267 5,523
325 1,882
5
1,204 76
107
60
703 168
77
1 40
75 51
39 106
6 456 456
115
72
400
127
72
–
208
107
2,432
71
10
60 60
45 4,450
6 115 62 61
page 31
Financial Statements 2018
Snowy Valleys Council
Notes to the Financial Statements for the year ended 30 June 2018
Note 6(c). Restricted cash, cash equivalents and investments – details (continued)
$ ’000
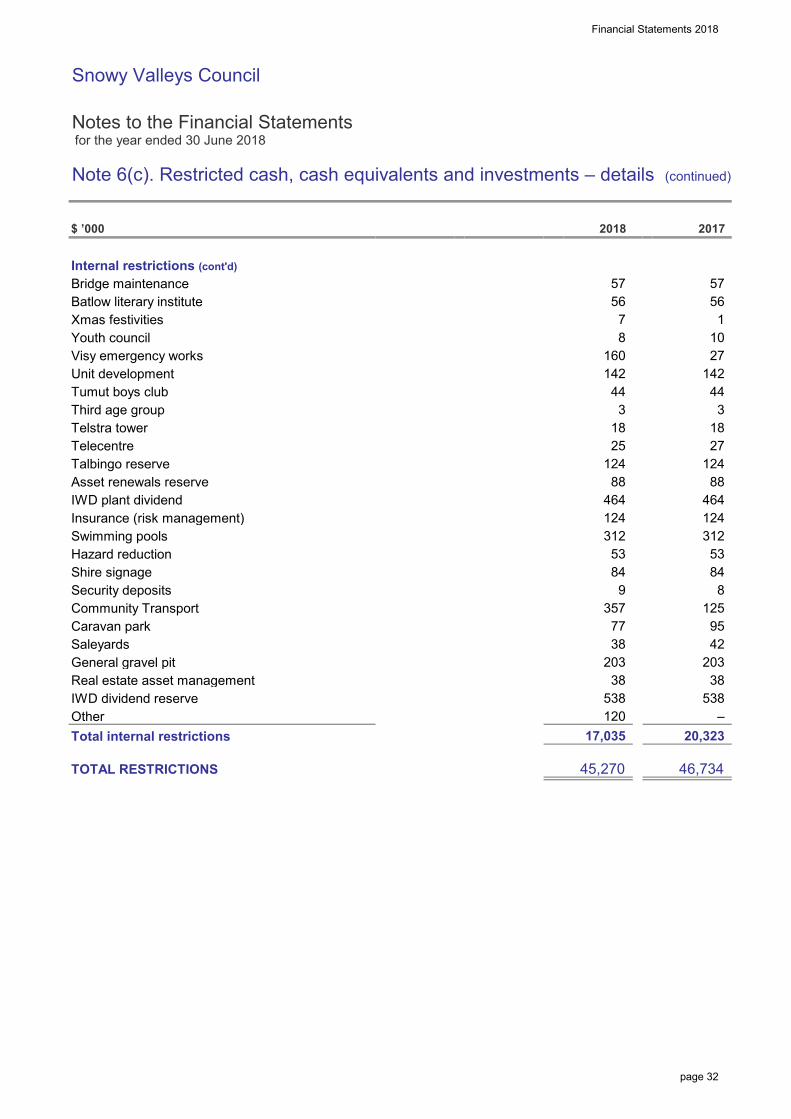
Internal restrictions (cont'd)Bridge maintenanceBatlow literary instituteXmas festivitiesYouth councilVisy emergency worksUnit developmentTumut boys clubThird age groupTelstra towerTelecentreTalbingo reserveAsset renewals reserveIWD plant dividendInsurance (risk management)Swimming poolsHazard reductionShire signageSecurity depositsCommunity TransportCaravan parkSaleyardsGeneral gravel pitReal estate asset managementIWD dividend reserveOtherTotal internal restrictions
TOTAL RESTRICTIONS
Notes 2018
120
57
10 160
45,270
27
3
–
357 125 77 95 38 42
203 203 38 38
124 124
17,035 20,323
56 56 7
2017
53 53 84 84 9 8
18 18 25 27
124 124 88 88
464 464
57
538 538
312 312
46,734
1 8
142 142 44 44 3
page 32
Financial Statements 2018
Snowy Valleys Council
Notes to the Financial Statements for the year ended 30 June 2018
Note 7. Receivables
$ ’000
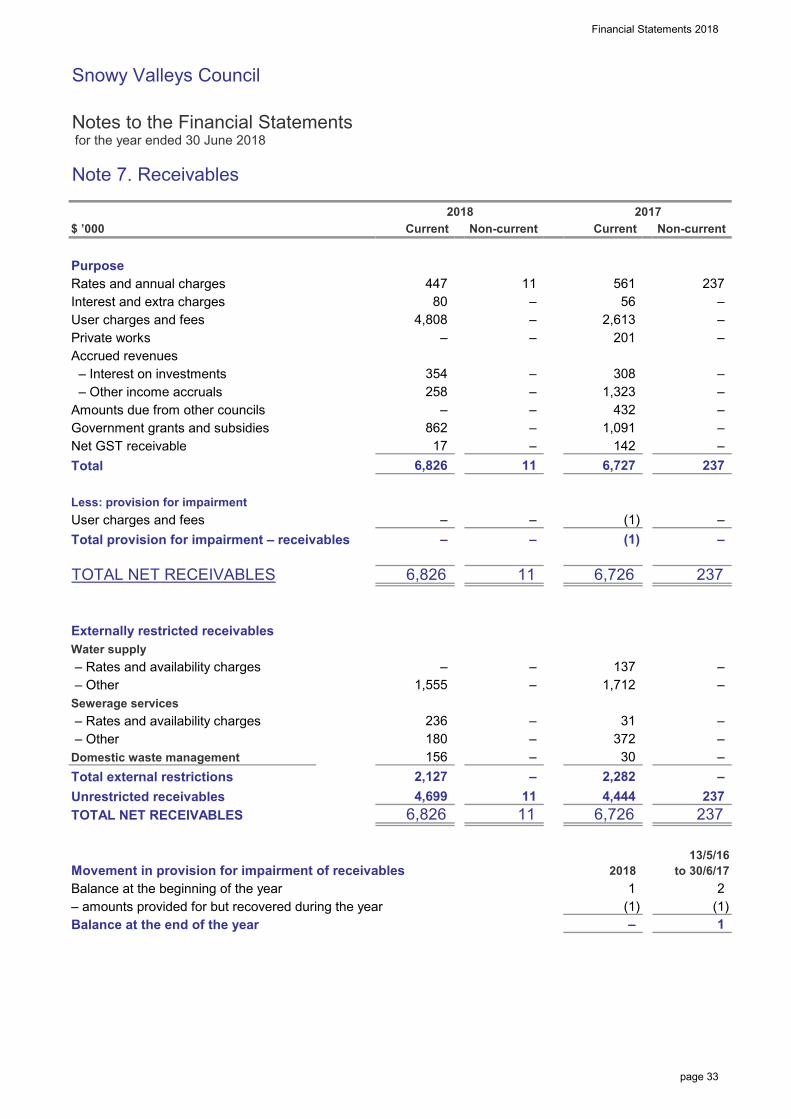
PurposeRates and annual chargesInterest and extra chargesUser charges and feesPrivate worksAccrued revenues – Interest on investments – Other income accrualsAmounts due from other councilsGovernment grants and subsidiesNet GST receivableTotal
Less: provision for impairmentUser charges and feesTotal provision for impairment – receivables
TOTAL NET RECEIVABLES
Externally restricted receivablesWater supply – Rates and availability charges – OtherSewerage services – Rates and availability charges – OtherDomestic waste managementTotal external restrictionsUnrestricted receivablesTOTAL NET RECEIVABLES
Movement in provision for impairment of receivablesBalance at the beginning of the year– amounts provided for but recovered during the yearBalance at the end of the year
4,808
447
Notes
– 80 –
–
258
862
354
–
Current 2017
56
–
–
– –
6,826 6,727
1,323
17
13/5/16 to 30/6/17
31 –
– –
156 –
– 137
4,699
(1)
11
6,826
–
–
–
(1)
1,091
11
–
237 –
11
308 –
2,613 201
Non-current
–
–
–
–
–
Non-current 2018
561
Current
432
– 237
142 –
372
6,726
–
2018
1,712
–
4,444
6,726
1,555
(1)
237
–
–
11
236
2,127
2
6,826
–
1
–
–
–
–
180
–
11
–
–
1
237
2,282
237
(1)
30
X8A2T
page 33
Financial Statements 2018
Snowy Valleys Council
Notes to the Financial Statements for the year ended 30 June 2018
Note 7. Receivables (continued)
Accounting policy for receivablesRecognition and measurementLoans and receivables are non-derivative financial assets with fixed or determinable payments that are not quotedin an active market. They are included in current assets, except for those with maturities greater than 12 monthsafter the reporting date which are classified as non-current assets. Loans and receivables are included ininventories and other assets (Note 8) and receivables (Note 7) in the Statement of Financial Position. Receivablesare recognised initially at fair value and subsequently measured at amortised cost using the effective interestmethod, less provision for impairment. Receivables are generally due for settlement within 30 days.
Cash flows relating to short-term receivables are not discounted if the effect of discounting is immaterial.
ImpairmentFor loans and receivables the amount of the loss is measured as the difference between the asset’s carryingamount and the present value of estimated future cash flows (excluding future credit losses that have not beenincurred) discounted at the financial asset’s original effective interest rate. The carrying amount of the asset isreduced and the amount of the loss is recognised in profit or loss.
Collectability of receivables is reviewed on an on-going basis. Debts that are known to be uncollectible are writtenoff by reducing the carrying amount directly. An allowance account (provision for impairment of receivables) isused when there is objective evidence that Council will not be able to collect all amounts due according to theoriginal terms of the receivables.
Significant financial difficulties of the debtor, probability that the debtor will enter bankruptcy or financialreorganisation, and default or delinquency in payments (more than 30 days overdue) are considered indicatorsthat the receivable is impaired. When a receivable for which an impairment allowance had been recognisedbecomes uncollectable in a subsequent period it is written off against the allowance account. Subsequentrecoveries of amounts previously written off are credited against other expenses in the Income statement.
Note 8. Inventories and other assets
$ ’000
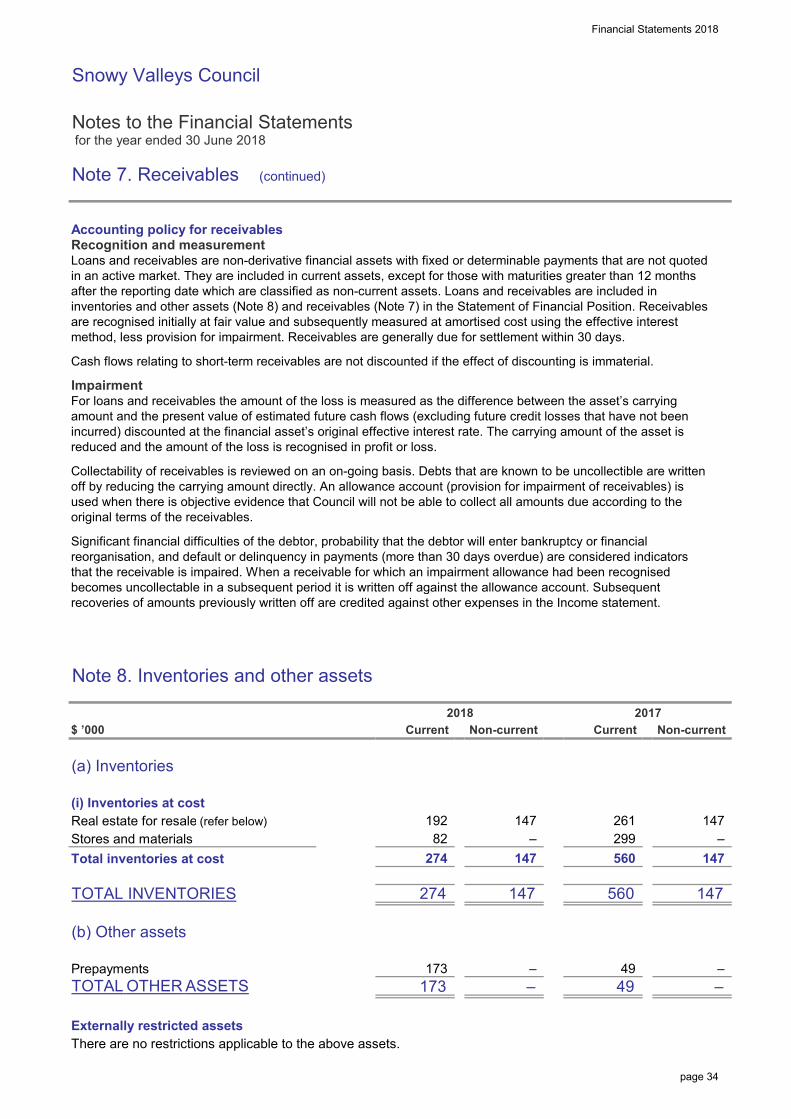
(a) Inventories
(i) Inventories at costReal estate for resale (refer below)Stores and materialsTotal inventories at cost
TOTAL INVENTORIES
(b) Other assets
PrepaymentsTOTAL OTHER ASSETS
Externally restricted assetsThere are no restrictions applicable to the above assets.
Notes
2018 2017
2017Non-current Current
49
560
– –
– 49
173
Non-current
173
– 274
147 147
147
–
–
274
Current 2018
560
147 261
147 147 299
192 82
X8A3T
page 34
Financial Statements 2018
Snowy Valleys Council
Notes to the Financial Statements for the year ended 30 June 2018
Note 8. Inventories and other assets (continued)
$ ’000
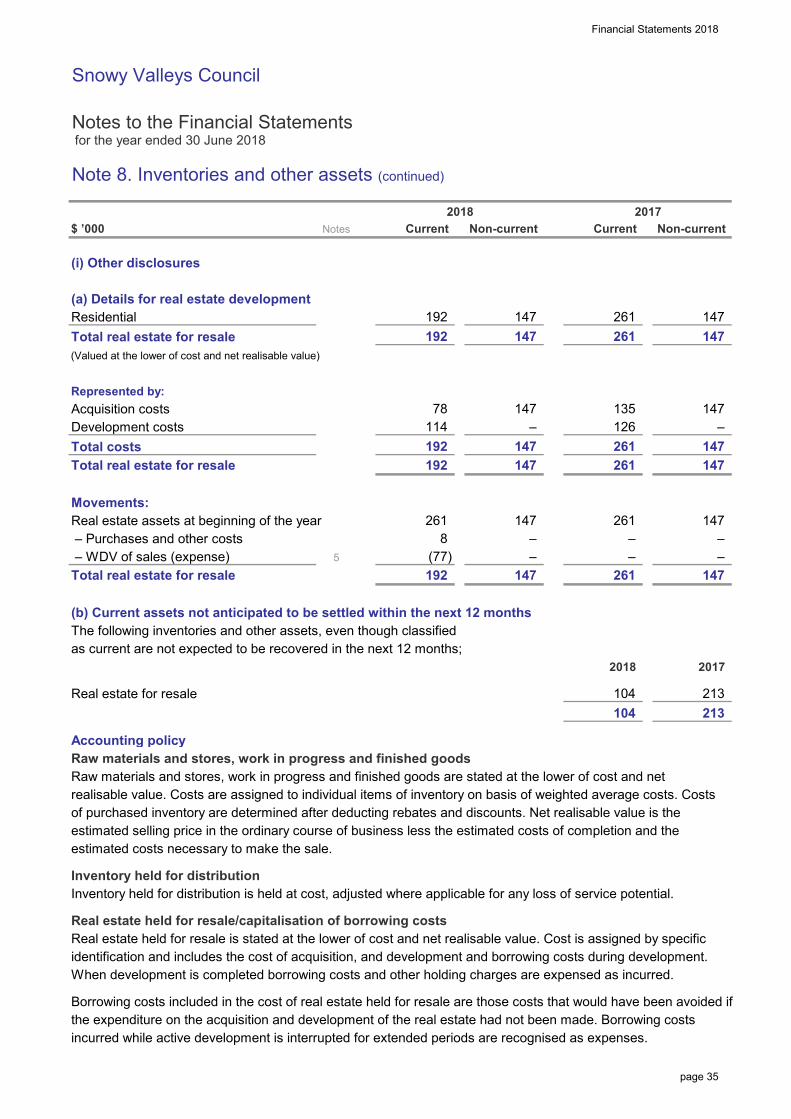
(i) Other disclosures
(a) Details for real estate developmentResidentialTotal real estate for resale(Valued at the lower of cost and net realisable value)
Represented by:Acquisition costsDevelopment costsTotal costsTotal real estate for resale
Movements:Real estate assets at beginning of the year – Purchases and other costs – WDV of sales (expense)Total real estate for resale
(b) Current assets not anticipated to be settled within the next 12 monthsThe following inventories and other assets, even though classifiedas current are not expected to be recovered in the next 12 months;
Real estate for resale
Accounting policyRaw materials and stores, work in progress and finished goodsRaw materials and stores, work in progress and finished goods are stated at the lower of cost and netrealisable value. Costs are assigned to individual items of inventory on basis of weighted average costs. Costsof purchased inventory are determined after deducting rebates and discounts. Net realisable value is theestimated selling price in the ordinary course of business less the estimated costs of completion and theestimated costs necessary to make the sale.
Inventory held for distributionInventory held for distribution is held at cost, adjusted where applicable for any loss of service potential.
Real estate held for resale/capitalisation of borrowing costsReal estate held for resale is stated at the lower of cost and net realisable value. Cost is assigned by specificidentification and includes the cost of acquisition, and development and borrowing costs during development.When development is completed borrowing costs and other holding charges are expensed as incurred.
Borrowing costs included in the cost of real estate held for resale are those costs that would have been avoided ifthe expenditure on the acquisition and development of the real estate had not been made. Borrowing costsincurred while active development is interrupted for extended periods are recognised as expenses.
114
Current Non-current Current
147 261
104
261
147
– – –
104
– 147
–
213
2017
147 147
261
8
147
135
Non-current
261
2018
261 147
147
147
147 192
147 147
192
126
2018
192 192
147 –
– (77) 5
261
Notes
78
2017
–
213
192
261
147
page 35
Financial Statements 2018
Snowy Valleys Council
Notes to the Financial Statements for the year ended 30 June 2018
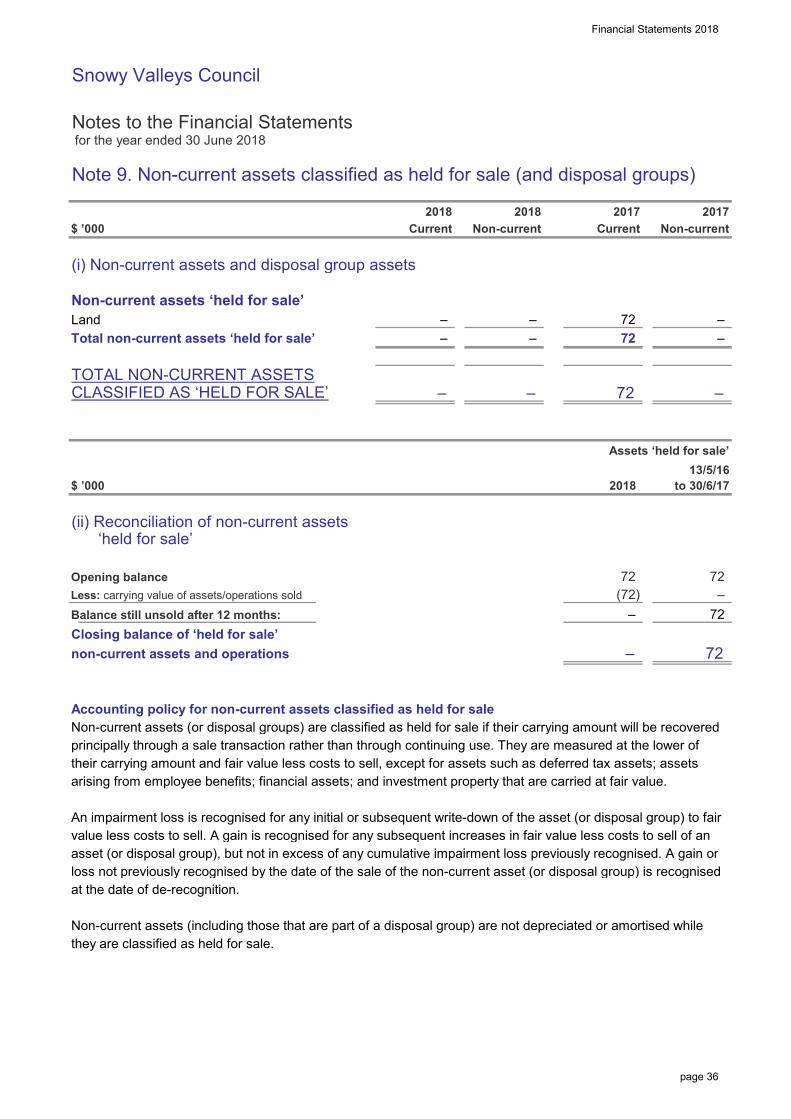
Note 9. Non-current assets classified as held for sale (and disposal groups)
$ ’000
(i) Non-current assets and disposal group assets
Non-current assets ‘held for sale’LandTotal non-current assets ‘held for sale’
TOTAL NON-CURRENT ASSETSCLASSIFIED AS ‘HELD FOR SALE’
$ ’000
(ii) Reconciliation of non-current assets ‘held for sale’
Opening balanceLess: carrying value of assets/operations sold
Balance still unsold after 12 months:Closing balance of ‘held for sale’non-current assets and operations
Accounting policy for non-current assets classified as held for saleNon-current assets (or disposal groups) are classified as held for sale if their carrying amount will be recoveredprincipally through a sale transaction rather than through continuing use. They are measured at the lower oftheir carrying amount and fair value less costs to sell, except for assets such as deferred tax assets; assetsarising from employee benefits; financial assets; and investment property that are carried at fair value.
An impairment loss is recognised for any initial or subsequent write-down of the asset (or disposal group) to fairvalue less costs to sell. A gain is recognised for any subsequent increases in fair value less costs to sell of anasset (or disposal group), but not in excess of any cumulative impairment loss previously recognised. A gain orloss not previously recognised by the date of the sale of the non-current asset (or disposal group) is recognisedat the date of de-recognition.
Non-current assets (including those that are part of a disposal group) are not depreciated or amortised whilethey are classified as held for sale.
–
Current
–
72
2017
2018 13/5/16
to 30/6/17
Non-current
–
–
Assets ‘held for sale’Disposal groups
– – – 72
–
13/5/16 to 30/6/17
72
–
– 72 –
– – – 72
72 –
72 (72)
–
2018
–
–
2017
–
Non-current2018 2018
–
Current
X8A4T
page 36
Financial Statements 2018
Snowy Valleys Council
Notes to the Financial Statements for the year ended 30 June 2018
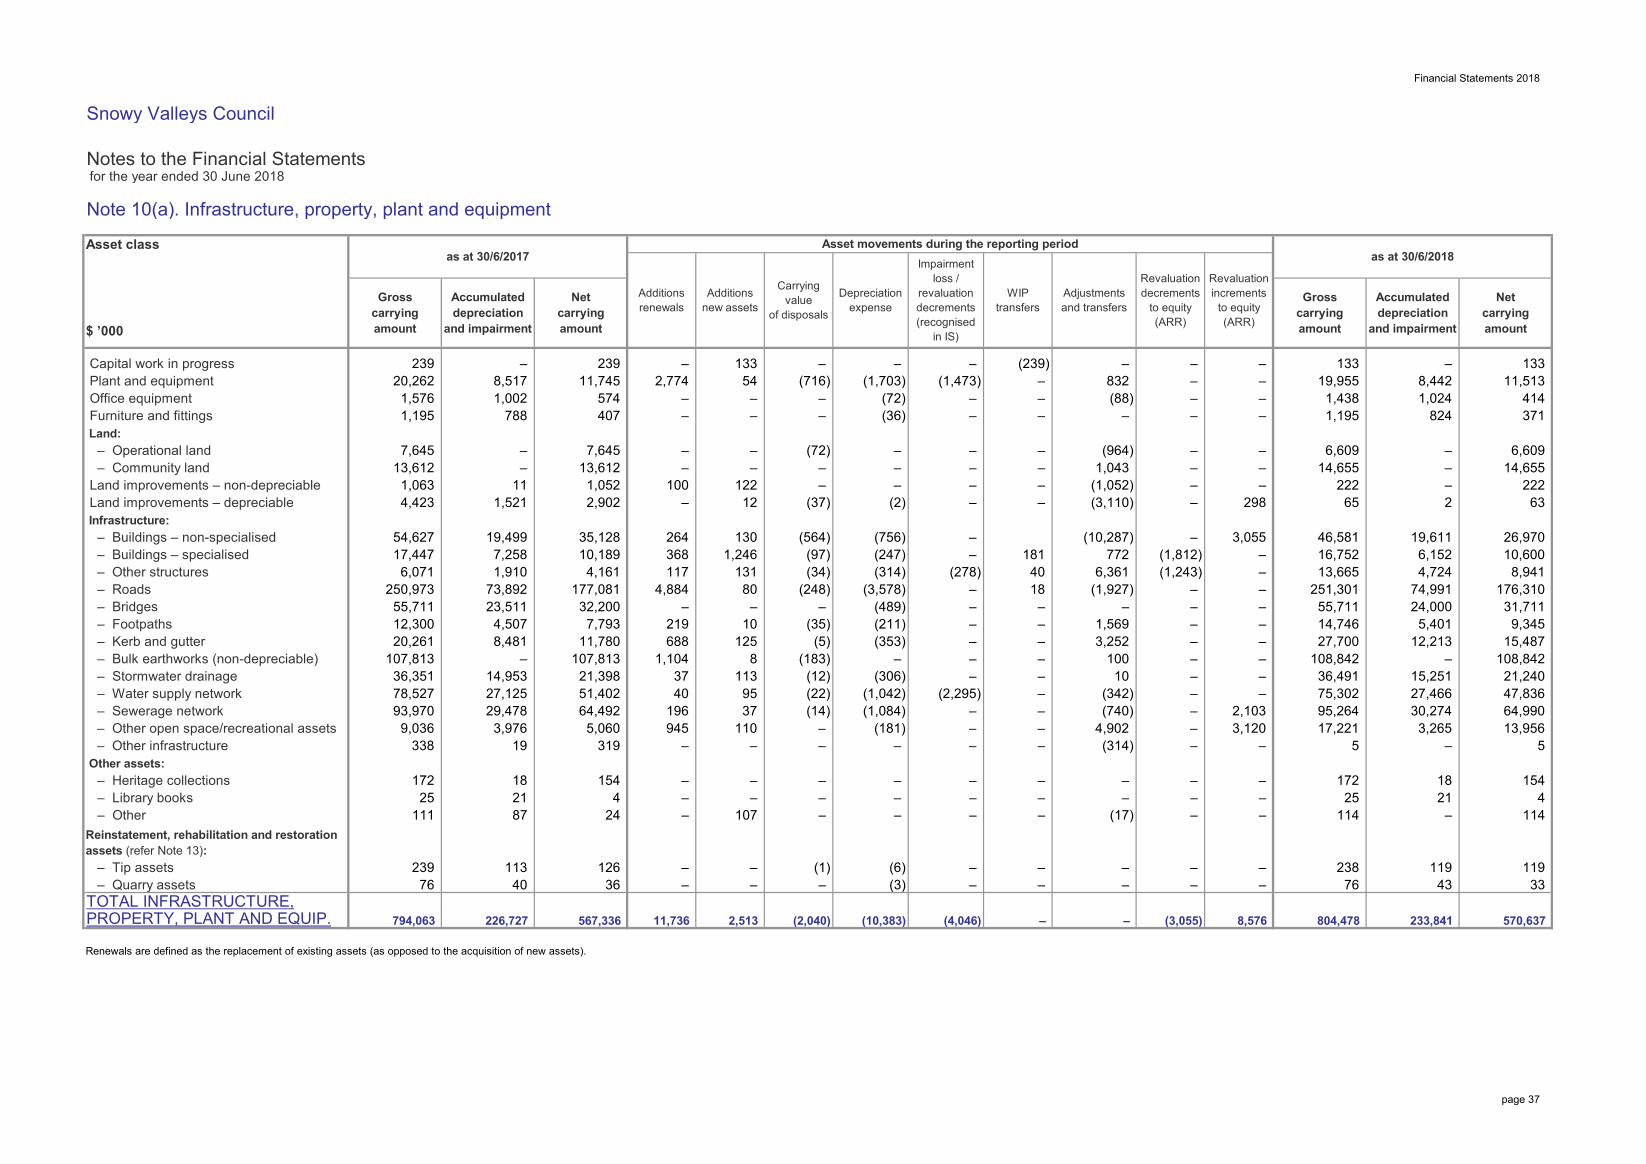
Note 10(a). Infrastructure, property, plant and equipment
Asset class
$ ’000
Capital work in progress 239 – 239 – 133 – – – (239) – – – 133 – 133 Plant and equipment 20,262 8,517 11,745 2,774 54 (716) (1,703) (1,473) – 832 – – 19,955 8,442 11,513 Office equipment 1,576 1,002 574 – – – (72) – – (88) – – 1,438 1,024 414 Furniture and fittings 1,195 788 407 – – – (36) – – – – – 1,195 824 371 Land: – Operational land 7,645 – 7,645 – – (72) – – – (964) – – 6,609 – 6,609 – Community land 13,612 – 13,612 – – – – – – 1,043 – – 14,655 – 14,655 Land improvements – non-depreciable 1,063 11 1,052 100 122 – – – – (1,052) – – 222 – 222 Land improvements – depreciable 4,423 1,521 2,902 – 12 (37) (2) – – (3,110) – 298 65 2 63 Infrastructure: – Buildings – non-specialised 54,627 19,499 35,128 264 130 (564) (756) – (10,287) – 3,055 46,581 19,611 26,970 – Buildings – specialised 17,447 7,258 10,189 368 1,246 (97) (247) – 181 772 (1,812) – 16,752 6,152 10,600 – Other structures 6,071 1,910 4,161 117 131 (34) (314) (278) 40 6,361 (1,243) – 13,665 4,724 8,941 – Roads 250,973 73,892 177,081 4,884 80 (248) (3,578) – 18 (1,927) – – 251,301 74,991 176,310 – Bridges 55,711 23,511 32,200 – – – (489) – – – – – 55,711 24,000 31,711 – Footpaths 12,300 4,507 7,793 219 10 (35) (211) – – 1,569 – – 14,746 5,401 9,345 – Kerb and gutter 20,261 8,481 11,780 688 125 (5) (353) – – 3,252 – – 27,700 12,213 15,487 – Bulk earthworks (non-depreciable) 107,813 – 107,813 1,104 8 (183) – – – 100 – – 108,842 – 108,842 – Stormwater drainage 36,351 14,953 21,398 37 113 (12) (306) – – 10 – – 36,491 15,251 21,240 – Water supply network 78,527 27,125 51,402 40 95 (22) (1,042) (2,295) – (342) – – 75,302 27,466 47,836 – Sewerage network 93,970 29,478 64,492 196 37 (14) (1,084) – – (740) – 2,103 95,264 30,274 64,990 – Other open space/recreational assets 9,036 3,976 5,060 945 110 – (181) – – 4,902 – 3,120 17,221 3,265 13,956 – Other infrastructure 338 19 319 – – – – – – (314) – – 5 – 5 Other assets: – Heritage collections 172 18 154 – – – – – – – – – 172 18 154 – Library books 25 21 4 – – – – – – – – – 25 21 4 – Other 111 87 24 – 107 – – – – (17) – – 114 – 114 Reinstatement, rehabilitation and restoration assets (refer Note 13): – Tip assets 239 113 126 – – (1) (6) – – – – – 238 119 119 – Quarry assets 76 40 36 – – – (3) – – – – – 76 43 33 TOTAL INFRASTRUCTURE,PROPERTY, PLANT AND EQUIP.
Renewals are defined as the replacement of existing assets (as opposed to the acquisition of new assets).
– – (4,046) 11,736 (2,040) 2,513 (10,383) 794,063 226,727 567,336 570,637 (3,055) 8,576 804,478 233,841
as at 30/6/2018
Net carrying amount
Asset movements during the reporting period
Accumulated depreciation
and impairment
as at 30/6/2017
WIPtransfers
Adjustmentsand transfers
Additionsnew assets
Additionsrenewals
Carrying value
of disposals
Revaluation decrements
to equity (ARR)
Revaluation increments
to equity (ARR)
Net carrying amount
Accumulated depreciation
and impairment
Gross carrying amount
Gross carrying amount
Impairment loss /
revaluation decrements (recognised
in IS)
Depreciation expense
X9A0T
X9A1T
page 37
Financial Statements 2018
Snowy Valleys Council
Notes to the Financial Statements for the year ended 30 June 2018
Note 10(a). Infrastructure, property, plant and equipment (continued)
Accounting policy for infrastructure, property, plant and equipmentInfrastructure, property, plant and equipment are held at fair value. Independent valuations are performed atleast every five years, however the carrying amount of assets is assessed at each reporting date to confirm that it is not materially different from current fair value.
Water supply and sewerage network assets are indexed at each reporting period in accordance with the RatesReference Manual issued by Crown Lands and Water (CLAW).
Increases in the carrying amounts arising on revaluation are credited to the asset revaluation reserve. To theextent that the increase reverses a decrease previously recognising profit or loss relating to that asset class, theincrease is first recognised as profit or loss. Decreases that reverse previous increases of assets in the sameclass are first charged against revaluation reserves directly in equity to the extent of the remaining reserveattributable to the class; all other decreases are charged to the Income Statement.
Subsequent costs are included in the asset’s carrying amount or recognised as a separate asset, as appropriate,only when it is probable that future economic benefits associated with the item will flow to Council and the costof the item can be measured reliably. All other repairs and maintenance are charged to the Income Statementduring the financial period in which they are incurred.
Land is not depreciated. Depreciation on other assets is calculated using the straight line method to allocatetheir cost, net of their residual values, over their estimated useful lives as follows:
Plant and equipment Years Other equipment YearsOffice equipment 5 to 10 Playground equipment 5 to 20 Office furniture 10 to 20 Benches, seats etc. 10 to 20 Computer equipment 4Vehicles 5 to 8 BuildingsHeavy plant/road making equipment 5 to 8 Buildings: masonry 50 to 200 Other plant and equipment 5 to 15 Buildings: other 20 to 40
Water and sewer assets Stormwater assetsDams and reservoirs 40 to 100 Drains 50 to 110Bores 20 to 40 Culverts 50 to 110 Reticulation pipes: PVC 70 to 80 Flood control structures 80 to 100 Reticulation pipes: other 45 to 75 Pumps and telemetry 10 to 205
Transportation assets Other infrastructure assetsSealed roads: surface 2 to 60 Bulk earthworks InfiniteSealed roads: structure 60 Swimming pools 50Unsealed roads 7 to 30 Unsealed roads 20Bridge: concrete 100 Other open space/recreational assets 20Bridge: other 40 to 80 Other infrastructure 20Footpaths 100Road subbase 200Kerb, gutter and footpaths 90
page 38
Financial Statements 2018
Snowy Valleys Council
Notes to the Financial Statements for the year ended 30 June 2018
Note 10(a). Infrastructure, property, plant and equipment (continued)
Accounting policy for infrastructure, property, plant and equipment (continued)The assets’ residual values and useful lives are reviewed, and adjusted if appropriate, at each reporting date.Gains and losses on disposals are determined by comparing proceeds with carrying amount. These are includedin the Income statement.
Land under roadsLand under roads is land under roadways and road reserves including land under footpaths, nature strips andmedian strips.
Council has elected not to recognise land under roads acquired before 1 July 2008 in accordance withAASB 1051 Land Under Roads .
Land under roads acquired after 1 July 2008 is recognised in accordance with AASB 116 Property, Plantand Equipment.
Crown reservesCrown Reserves under Council’s care and control are recognised as assets of the Council. While ownership ofthe reserves remains with the Crown, Council retains operational control of the reserves and is responsible fortheir maintenance and use in accordance with the specific purposes to which the reserves are dedicated.Improvements on Crown Reserves are also recorded as assets, while maintenance costs incurred by Counciland revenues relating to the reserves are recognised within Council’s Income Statement.
Rural Fire Service assetsUnder section 119 of the Rural Fire Services Act 1997 (NSW) , “all fire fighting equipment purchased orconstructed wholly or from money to the credit of the Fund is to be vested in the council of the area for or onbehalf of which the fire fighting equipment has been purchased or constructed”.
These assets are under the control of RFS to enable that service to comply with the Service Delivery contractwith Council and have not been recognised in these statements.
Until such time as discussions on this matter have concluded and the legislation changed, Council will notrecognise rural fire service assets including land, buildings, plant and vehicles.
page 39
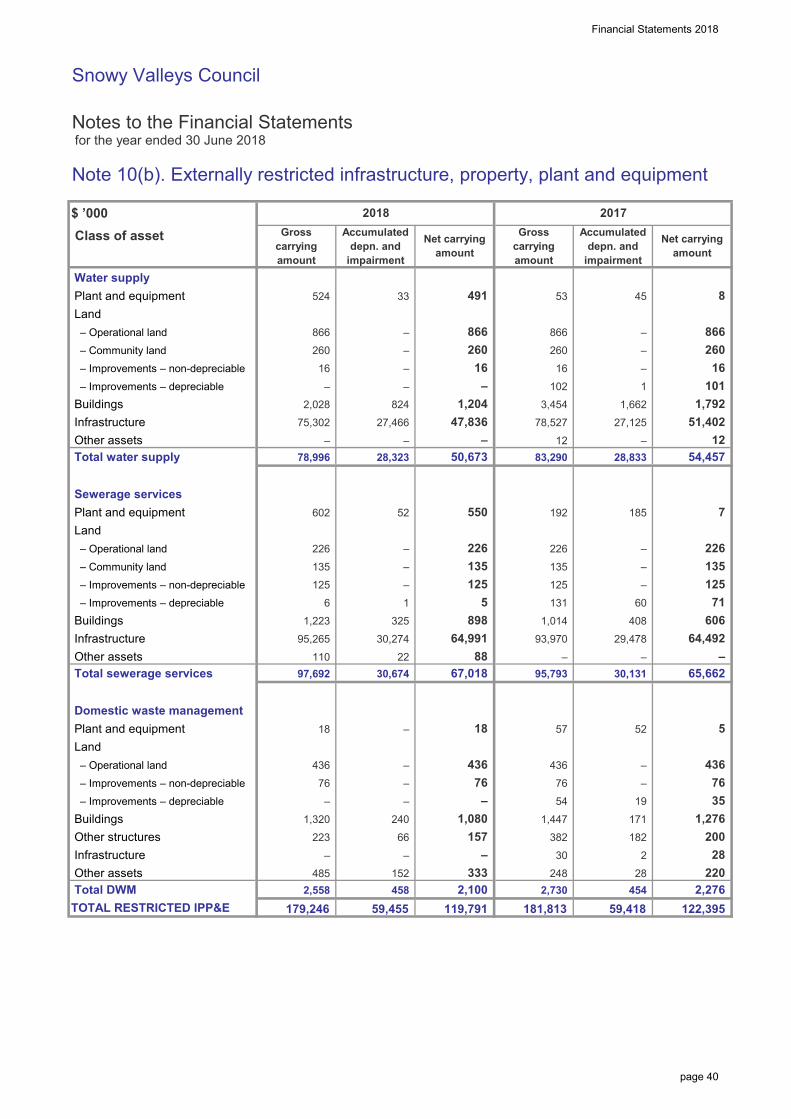
Financial Statements 2018
Snowy Valleys Council
Notes to the Financial Statements for the year ended 30 June 2018
Note 10(b). Externally restricted infrastructure, property, plant and equipment
Gross carrying amount
Accumulated depn. and
impairment
Net carrying amount
45 53
64,492
30,131
200
2017
16
–
1,792
12 – 12
866 260 866
–
30
– 93,970
7 192
83,290
454 220
2,276
382
2,730
181,813
260
54 171 19
– 131
16
$ ’000
Total sewerage services
Class of asset
Infrastructure
– Operational land
Plant and equipment Land
– Operational land
Total water supply
Buildings
2018
524
27,466
33
– –
–
Water supply
50,673
– 125
–
602 52 Plant and equipment
226 – 135
185
3,454 –
866
16 – –
226
22
898
– Community land
8
101
29,478
135
1,662
35
– 102
1,014
28
27,125
28
260 16
1 – Improvements – non-depreciable – Improvements – depreciable
– Improvements – non-depreciable – Improvements – depreciable
Other assets78,996 28,323
2,028 1,204
260
Sewerage services
Land
1,223
– Community land
325 6 1
67,018
550
824
88
–
–
Domestic waste management
Infrastructure Other structures
– Improvements – non-depreciable – Improvements – depreciable
157
18
1,080
51,402
54,457
78,527
135
Other assets
436 76
182
– Land
436
28,833
2
–
408
–
Buildings
485 248
Infrastructure
–
Buildings
223
–
– Operational land
Plant and equipment
66
Other assets2,558 Total DWM
–
179,246 59,455 119,791
76
–
30,274 95,265
436
1,320
64,991 110
47,836
–
97,692 30,674
Gross carrying amount
Accumulated depn. and
impairment
Net carrying amount
866
240
152 333 458 2,100
125 5
–
75,302 –
–
18
491
TOTAL RESTRICTED IPP&E 122,395 59,418
226
76
52 5
–
95,793
76
606
57
1,447 1,276
–
226 135 –
125
–
–
60 71 125
436
65,662
X10A10T
page 40
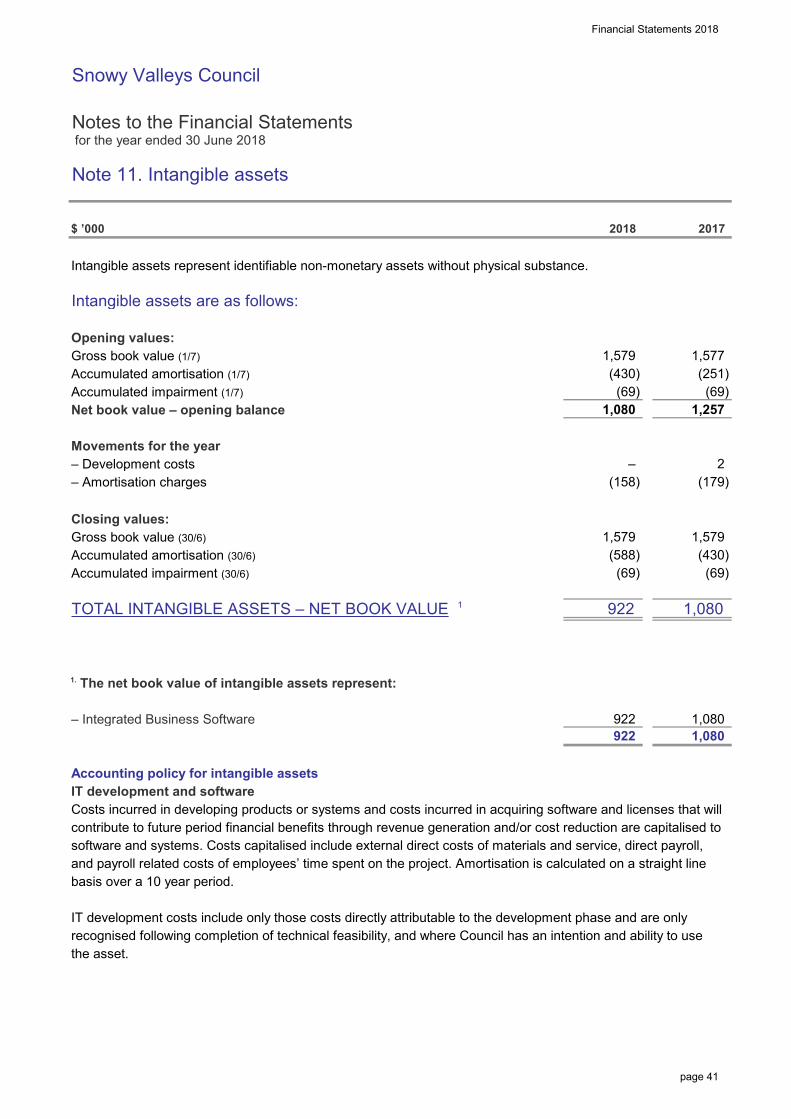
Financial Statements 2018
Snowy Valleys Council
Notes to the Financial Statements for the year ended 30 June 2018
Note 11. Intangible assets
$ ’000
Intangible assets represent identifiable non-monetary assets without physical substance.
Intangible assets are as follows:
Opening values:Gross book value (1/7)Accumulated amortisation (1/7)Accumulated impairment (1/7)Net book value – opening balance
Movements for the year– Development costs– Amortisation charges
Closing values:Gross book value (30/6)Accumulated amortisation (30/6)Accumulated impairment (30/6)
TOTAL INTANGIBLE ASSETS – NET BOOK VALUE 1
1. The net book value of intangible assets represent:
– Integrated Business Software
Accounting policy for intangible assetsIT development and software Costs incurred in developing products or systems and costs incurred in acquiring software and licenses that willcontribute to future period financial benefits through revenue generation and/or cost reduction are capitalised tosoftware and systems. Costs capitalised include external direct costs of materials and service, direct payroll,and payroll related costs of employees’ time spent on the project. Amortisation is calculated on a straight linebasis over a 10 year period.
IT development costs include only those costs directly attributable to the development phase and are onlyrecognised following completion of technical feasibility, and where Council has an intention and ability to usethe asset.
1,579
(69)
922
(69)
922
(588) (69)
1,579
1,080
1,579
1,080
1,577
1,080
(430)
1,080
1,257
(251)
– (179)
(430)
(158) 2
2018
(69)
922
2017
X10A1T
X10A2T
page 41
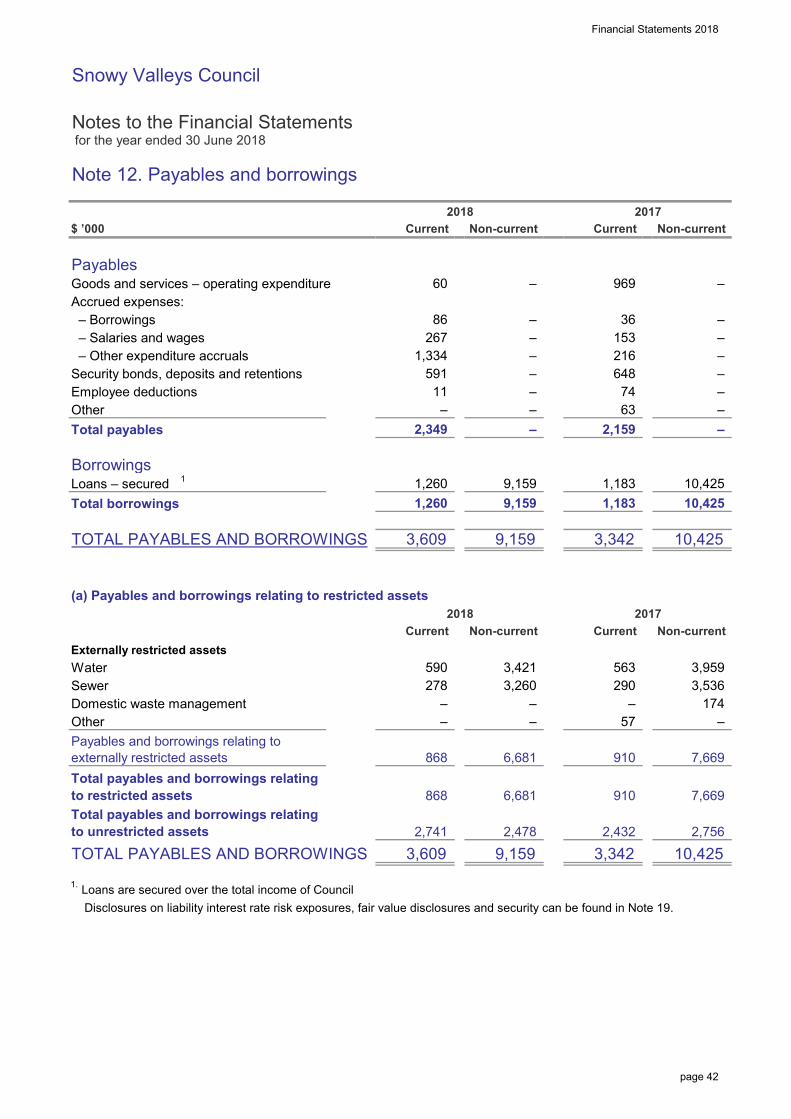
Financial Statements 2018
Snowy Valleys Council
Notes to the Financial Statements for the year ended 30 June 2018
Note 12. Payables and borrowings
$ ’000
PayablesGoods and services – operating expenditureAccrued expenses: – Borrowings – Salaries and wages – Other expenditure accrualsSecurity bonds, deposits and retentionsEmployee deductionsOtherTotal payables
BorrowingsLoans – secured 1
Total borrowings
TOTAL PAYABLES AND BORROWINGS
(a) Payables and borrowings relating to restricted assets
Externally restricted assetsWaterSewerDomestic waste managementOther
TOTAL PAYABLES AND BORROWINGS
1. Loans are secured over the total income of Council Disclosures on liability interest rate risk exposures, fair value disclosures and security can be found in Note 19.
86
1,334
1,260
590
–
267
– –
Total payables and borrowings relating to restricted assets
60
11 591
2018
–
2017Non-current
36 153
–
Total payables and borrowings relating to unrestricted assets
868
3,609
Current
910 Payables and borrowings relating to externally restricted assets
Current
–
290
1,183 9,159 9,159
– 278
1,260
–
6,681
3,260
3,342 2,432
868
– 2,159 –
–
648 –
74 63
– 216
2,349
10,425
9,159
3,536
1,183
9,159
2017
3,609
910 7,669
2,478
Current
– –
3,959
10,425
Non-current
–
563
–
969
Current Non-current
–
–
–
–
10,425
2018
174
3,421
7,669
–
Non-current
–
3,342
57
2,741 2,756
10,425
6,681
X10A3T
page 42
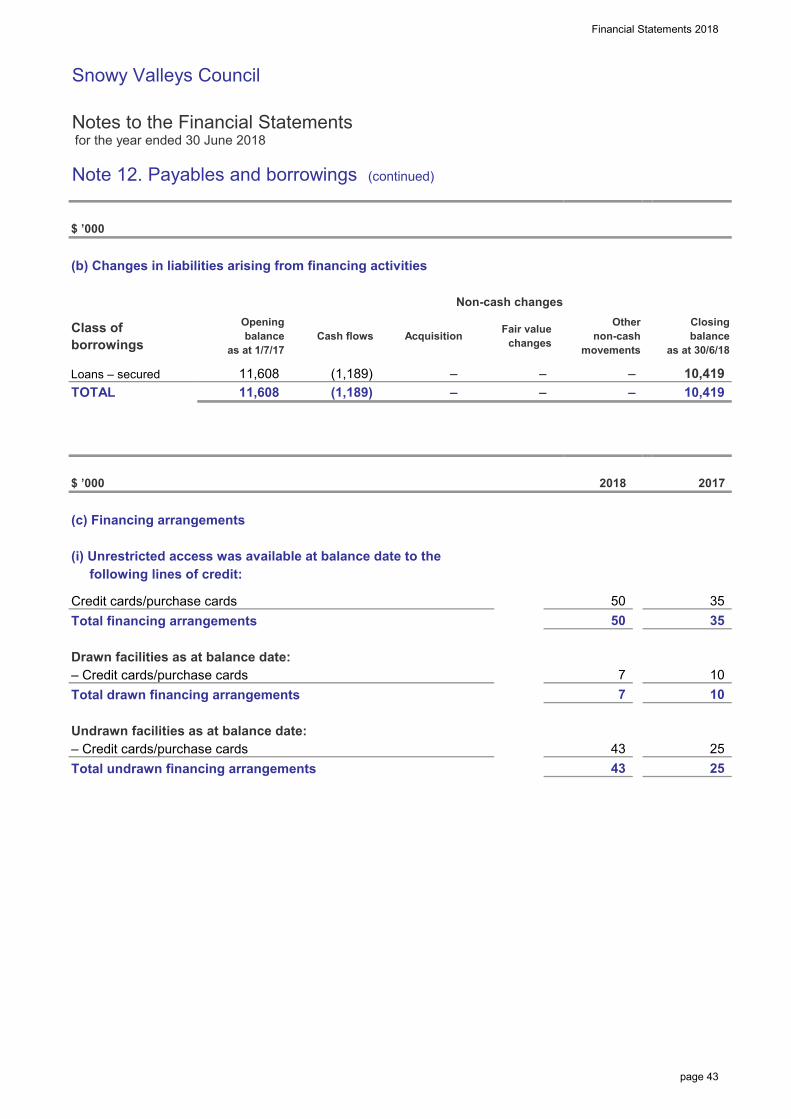
Financial Statements 2018
Snowy Valleys Council
Notes to the Financial Statements for the year ended 30 June 2018
Note 12. Payables and borrowings (continued)
$ ’000
(b) Changes in liabilities arising from financing activities
$ ’000
(c) Financing arrangements
(i) Unrestricted access was available at balance date to the following lines of credit:
Credit cards/purchase cardsTotal financing arrangements
Drawn facilities as at balance date:– Credit cards/purchase cardsTotal drawn financing arrangements
Undrawn facilities as at balance date:– Credit cards/purchase cardsTotal undrawn financing arrangements
11,608 (1,189)
Class of borrowings
Openingbalance
as at 1/7/17
5/16 to 30/6/17
(1,189) Loans – secured 11,608
Cash flows
2018
– TOTAL
50
20172018
2018
Othernon-cash
movementsAcquisition
Non-cash changes
– – –
7 7
10 10
10,419 –
35
Fair value changes
43 25
–
43
10,419
35 50
Closingbalance
as at 30/6/18
2017
25
page 43
Financial Statements 2018
Snowy Valleys Council
Notes to the Financial Statements for the year ended 30 June 2018
Note 12. Payables and borrowings (continued)
Accounting policy for payables and borrowingsPayablesThese amounts represent liabilities for goods and services provided to the Council prior to the end of financialyear that are unpaid. The amounts are unsecured and are usually paid within 30 days of recognition.
BorrowingsBorrowings are initially recognised at fair value, net of transaction costs incurred. Borrowings are subsequentlymeasured at amortised cost. Any difference between the proceeds (net of transaction costs) and theredemption amount is recognised in the income statement over the period of the borrowings using the effectiveinterest method. Fees paid on the establishment of loan facilities are recognised as transaction costs of theloan to the extent that it is probable that some or all of the facility will be drawn down. In this case, the fee isdeferred until the draw down occurs. To the extent there is no evidence that it is probable that some or all of thefacility will be drawn down, the fee is capitalised as a prepayment for liquidity services and amortised over theperiod of the facility to which it relates.
Borrowings are removed from the Statement of Financial Position when the obligation specified in the contractis discharged, cancelled or expired. The difference between the carrying amount of a financial liability that hasbeen extinguished or transferred to another party and the consideration paid, including any non-cash assetstransferred or liabilities assumed, is recognised in other income or finance cost.
Borrowings are classified as current liabilities unless Council has an unconditional right to defer settlement ofthe liability for at least 12 months after the reporting date.
Finance leasesLeases of property, plant and equipment where Council, as lessee, has substantially all the risks and rewardsof ownership are classified as finance leases. Finance leases are capitalised at the lease’s inception at thefair value of the leased property or, if lower, the present value of the minimum lease payments. Thecorresponding rental obligations, net of finance charges, are included in other short-term and long-termpayables. Each lease payment is allocated between the liability and finance cost. The finance cost is chargedto the income statement over the lease period so as to produce a constant periodic rate of interest on theremaining balance of the liability for each period.
The property, plant and equipment acquired under finance leases is depreciated over the asset's useful life orover the shorter of the asset’s useful life and the lease term if there is no reasonable certainty that Councilwill obtain ownership at the end of the lease term.
page 44
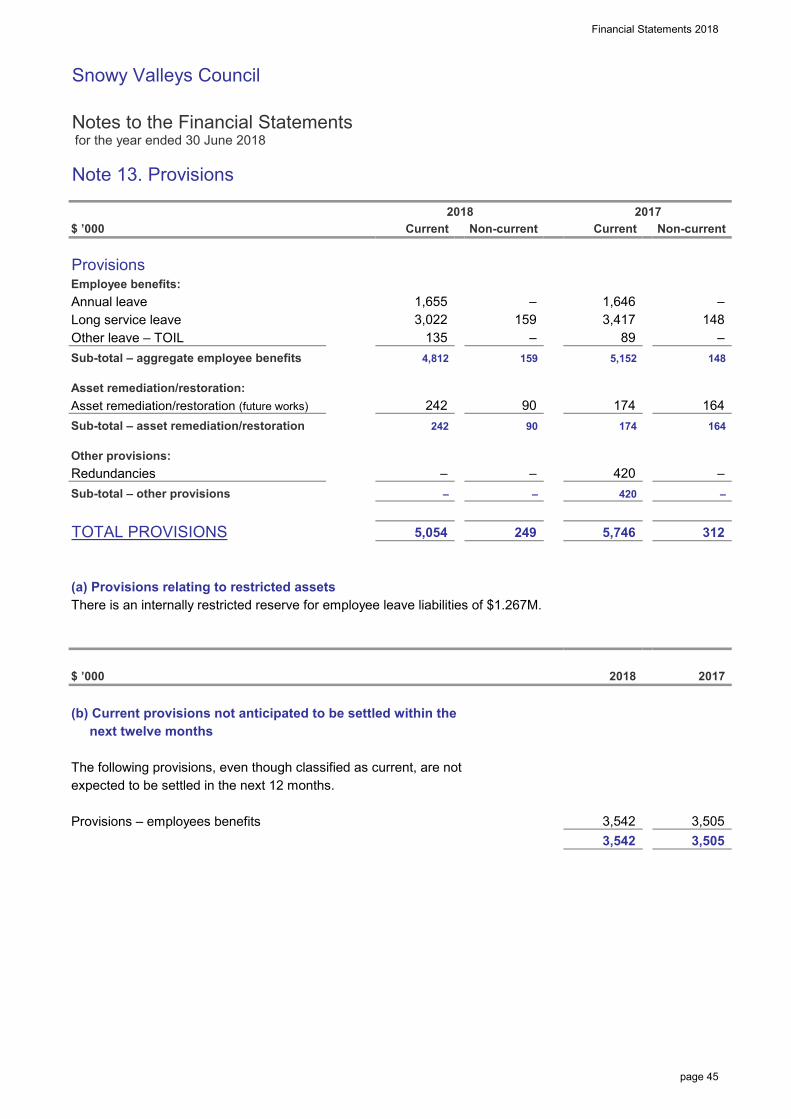
Financial Statements 2018
Snowy Valleys Council
Notes to the Financial Statements for the year ended 30 June 2018
Note 13. Provisions
$ ’000
ProvisionsEmployee benefits:Annual leaveLong service leaveOther leave – TOILSub-total – aggregate employee benefits
Asset remediation/restoration:Asset remediation/restoration (future works)
Sub-total – asset remediation/restoration
Other provisions:RedundanciesSub-total – other provisions
TOTAL PROVISIONS
(a) Provisions relating to restricted assetsThere is an internally restricted reserve for employee leave liabilities of $1.267M.
$ ’000
(b) Current provisions not anticipated to be settled within the next twelve months
The following provisions, even though classified as current, are notexpected to be settled in the next 12 months.
Provisions – employees benefits
164
242
3,022
312
–
2018
–
2017
148
90
5,054
–
–
3,505 3,542 3,505
249 5,746
420
1,646 159 3,417
–
242
2018
174
2017
–
90
–
–
159
Non-current
148
–
Current
4,812 5,152
Current Non-current
1,655
135 89 –
164
3,542
420
174
X10A4T
page 45
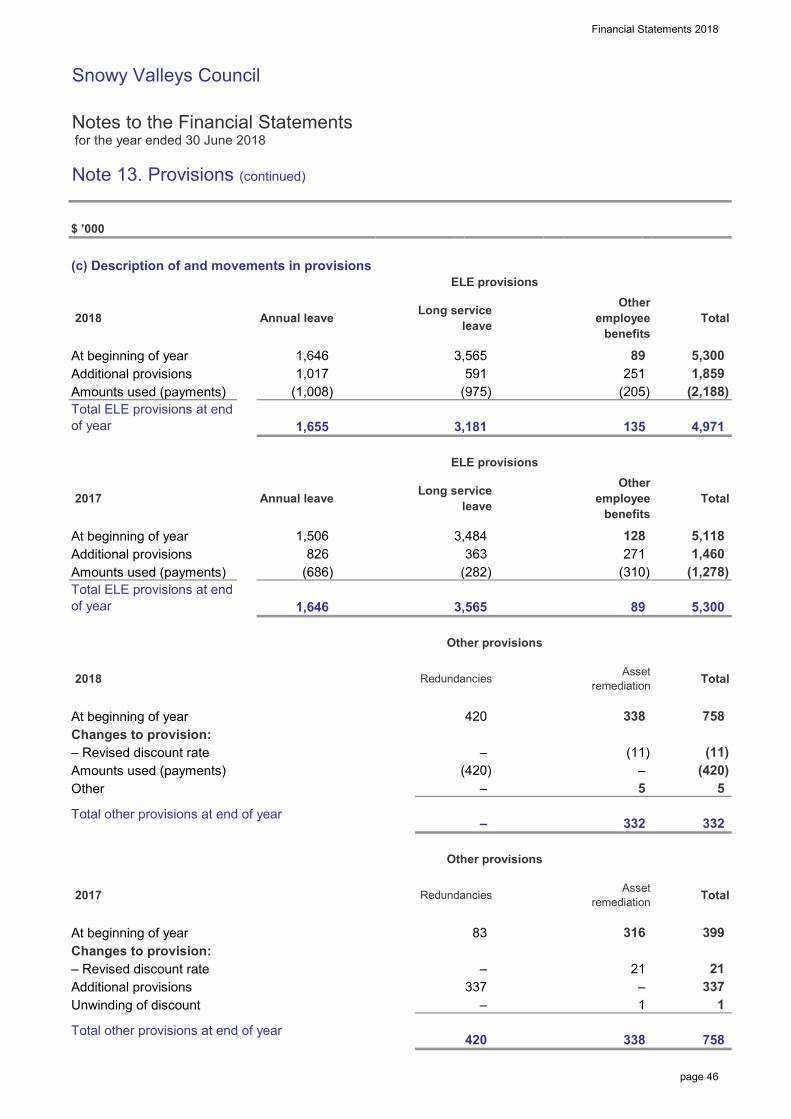
Financial Statements 2018
Snowy Valleys Council
Notes to the Financial Statements for the year ended 30 June 2018
Note 13. Provisions (continued)
$ ’000
(c) Description of and movements in provisions
At beginning of yearAdditional provisionsAmounts used (payments)
At beginning of yearAdditional provisionsAmounts used (payments)
At beginning of yearChanges to provision:– Revised discount rateAmounts used (payments)Other
At beginning of yearChanges to provision:– Revised discount rateAdditional provisionsUnwinding of discount
(1,008)
4,971 –
–
5 5
Other (enter details here...)
–
(205)
Total
1,646
Annual leave Sick leave
Total ELE provisions at end of year
591
–
ELE on-costs
–
ELE provisions
Annual leave
Long service leave
21
– –
135
826
(2,188)
1,655
1,017
Other (enter details here...)
(975)
271
–
(420)
2017
83
2018
1,646
–
–
– 420
Total Redundancies2017
Total ELE provisions at end of year
–
Self-insurance
Self-insurance
338
–
Sick leave Long service leave
ELE on-costs
Other employee
benefits
(11)
21
1,859 89
–
363
–
3,181
Other employee
benefits
Other provisions
(420)
Total
5,118
5,300 3,565
– 128
Other (enter details here...)
5,300
3,484 –
(282)
ELE provisions
– 1,460
251
–
89 –
1,506
(1,278) (310) – (686)
Other (enter details here...)
–
Redundancies
(11)
3,565 –
–
Asset remediation Total
2018
337
–
–
332
–
399
–
332
758
420 – 338 758
1
Asset remediation
–
1
316 –
– – 337
Other provisions
Total other provisions at end of year
Total other provisions at end of year
page 46
Financial Statements 2018
Snowy Valleys Council
Notes to the Financial Statements for the year ended 30 June 2018
Note 13. Provisions (continued)
Nature and purpose of non-employee benefit provisionsAsset remediationCouncil has a legal/public obligation to make, restore, rehabilitate and reinstate the Council tip and quarry.
Accounting policy for provisionsProvisions are recognised when Council has a present legal or constructive obligation as a result of past events,it is probable that an outflow of resources will be required to settle the obligation, and the amount has beenreliably estimated.
Where there are a number of similar obligations, the likelihood that an outflow will be required in settlement isdetermined by considering the class of obligations as a whole. A provision is recognised even if the likelihoodof an outflow with respect to any one item included in the same class of obligations may be small.
Provisions are measured at the present value of management’s best estimate of the expenditure required tosettle the present obligation at the reporting date. The discount rate used to determine the present valuereflects current market assessments of the time value of money and the risks specific to the liability. Theincrease in the provision due to the passage of time is recognised as interest expense.
Employee benefitsShort-term obligationsLiabilities for wages and salaries, including non-monetary benefits, annual leave and accumulating sick leaveexpected to be wholly settled within 12 months after the end of the period in which the employees render therelated service are recognised in respect of employees' services up to the end of the reporting period and aremeasured at the amounts expected to be paid when the liabilities are settled. The liability for annual leaveand accumulating sick leave is recognised in the provision for employee benefits. All other short-termemployee benefit obligations are presented as payables.
Other long-term employee benefit obligationsThe liability for long service leave and annual leave that is not expected to be wholly settled within 12 monthsafter the end of the period in which the employees render the related service is recognised in the provision foremployee benefits and measured as the present value of expected future payments to be made in respect ofservices provided by employees up to the end of the reporting period using the projected unit credit method.
Consideration is given to expected future wage and salary levels, experience of employee departures, andperiods of service. Expected future payments are discounted using market yields at the end of the reportingperiod on national government bonds with terms to maturity and currency that match, as closely as possible,the estimated future cash outflows.
The obligations are presented as current liabilities in the Statement of Financial Position if the Council doesnot have an unconditional right to defer settlement for at least 12 months after the reporting date, regardless ofwhen the actual settlement is expected to occur.
page 47
Financial Statements 2018
Snowy Valleys Council
Notes to the Financial Statements for the year ended 30 June 2018
Note 13. Provisions (continued)
Provisions for close-down and restoration, and environmental clean-up costs – tips and quarriesRestorationClose down and restoration costs include the dismantling and demolition of infrastructure and the removal ofresidual materials and remediation of disturbed areas. Estimated close down and restoration costs are providedfor in the accounting period when the obligation arising from the related disturbance occurs, whether this occursduring the development or during the operation phase, based on the net present value of estimated future costs.
Provisions for close down and restoration costs do not include any additional obligations which are expected toarise from future disturbance. The costs are estimated on the basis of a closure plan. The cost estimates are calculated annually during the life of the operation to reflect known developments, eg updated cost estimatesand revisions to the estimated lives of operations, and are subject to formal review at regular intervals.
RehabilitationWhere rehabilitation is conducted systematically over the life of the operation, rather than at the time of closure,provision is made for the estimated outstanding continuous rehabilitation work at each reporting date and thecost is charged to the Income Statement.
Provision is made for the estimated present value of the costs of environmental clean up obligations outstandingat the reporting date. These costs are charged to the Income Statement. Movements in the environmental cleanup provisions are presented as an operating cost, except for the unwinding of the discount which is shown as a borrowing cost.
Remediation procedures generally commence soon after the time the damage, remediation process and estimated remediation costs become known, but may continue for many years depending on the nature of the disturbance and the remediation techniques.
As noted above, the ultimate cost of environmental remediation is uncertain and cost estimates can vary inresponse to many factors including changes to the relevant legal requirements, the emergence of newrestoration techniques or experience at other locations. The expected timing of expenditure can also change, forexample in response to changes in quarry reserves or production rates. As a result there could be significantadjustments to the provision for close down and restoration and environmental clean up, which would affectfuture financial results.
Other movements in the provisions for close down and restoration costs, including those resulting from newdisturbance, updated cost estimates, changes to the estimated lives of operations and revisions to discountrates are capitalised within property, plant and equipment. These costs are then depreciated over the lives of theassets to which they relate.
Close down and restoration costs are a normal consequence of tip and quarry operations, and the majority ofclose down and restoration expenditure is incurred at the end of the life of the operations. Although the ultimatecost to be incurred is uncertain, Council estimates the respective costs based on feasibility and engineeringstudies using current restoration standards and techniques.
page 48
Financial Statements 2018
Snowy Valleys Council
Notes to the Financial Statements for the year ended 30 June 2018
Note 14. Accumulated surplus, revaluation reserves, changes in accounting policies, changes in accounting estimates and errors
Nature and purpose of reserves
Infrastructure, property, plant and equipment revaluation reserveThe infrastructure, property, plant and equipment revaluation reserve is used to record increments /decrements of non-current asset values due to their revaluation.
Note 15. Statement of cash flows – additional information
$ ’000
(a) Reconciliation of cash assets
Total cash and cash equivalent assetsBalance as per the Statement of Cash Flows
(b) Reconciliation of net operating result to cash provided from operating activities
Net operating result from Income StatementAdjust for non-cash items:Depreciation and amortisationNet losses/(gains) on disposal of assets
– Revaluation decrements / impairments of IPP&E direct to Income StatementUnwinding of discount rates on reinstatement provisions 13c
+/- Movement in operating assets and liabilities and other cash items:Decrease/(increase) in receivablesIncrease/(decrease) in provision for doubtful debtsDecrease/(increase) in inventoriesDecrease/(increase) in other assetsIncrease/(decrease) in payablesIncrease/(decrease) in accrued interest payableIncrease/(decrease) in other accrued expenses payableIncrease/(decrease) in other liabilitiesIncrease/(decrease) in employee leave entitlementsIncrease/(decrease) in other provisionsNet cash provided from/(used in)operating activities from the Statement of Cash Flows
(415)
9,051
21
(124) 217
(1) 127
(638) 50
22
(944)
337
2,785
219
12,324
1,232 (949) 182
12,654 31,261
(183)
(11)
(329)
(909)
10,541
2018
13,240
(2,671)
1,084
13,240
2017
165
Notes
2,271
12,674
(1)
6a 12,674
6,416
4,046 Losses/(gains) recognised on fair value re-measurements through the Income Statement:
10a
54d
X10A5T
X10A6T
X10A7T
X10A9T
page 49
Financial Statements 2018
Snowy Valleys Council
Notes to the Financial Statements for the year ended 30 June 2018
Note 16. Interests in other entities
$ ’000
Subsidiaries, joint arrangements and associates not recognised
The following subsidiaries, joint arrangements and associates have not been recognised in this financial report.
Name of entity/operation Principal activity/type of entity
Riverina Regional Library Provision of Library Services to member local governement areas
Reasons for non-recognitionCouncil holds 10.82% equity share in Riverina Library and has assessed this as not material, hence not recognised.
$224K $4.48M
2018Net profit Net assets
2018
X10A0T
page 50
Financial Statements 2018
Snowy Valleys Council
Notes to the Financial Statements for the year ended 30 June 2018
Note 17. Commitments for expenditure
$ ’000
(a) Capital commitments (exclusive of GST)
Capital expenditure committed for at the reporting date but notrecognised in the financial statements as liabilities:
Property, plant and equipmentBuildingsPlant and equipmentNetwork for One DomainRoad - Clarkes Hill ResconstructionTotal commitments
These expenditures are payable as follows:Within the next yearTotal payable
Sources for funding of capital commitments:Future grants and contributionsUnexpended grantsInternally restricted reservesTotal sources of funding
Details of capital commitments2 Specialised Garbage Trucks and 1 Tip Truck on order.
(b) Operating lease commitments (non-cancellable)
a. Commitments under non-cancellable operating leases at the reporting date, but not recognised as liabilities are payable:
Within the next yearTotal non-cancellable operating lease commitments
b. Non-cancellable operating leases include the following assets:IT Equipment including Servers, Laptops and PC's
Conditions relating to operating leases:– All operating lease agreements are secured only against the leased asset.– No lease agreements impose any financial restrictions on Council regarding future debt etc.
740 225
2018
101 740
91
91
684
2017
–
740
158 740
– 158
–
1,158
–
740
1,158
1,158
1,158
– 740 909
740 101
740
X10A11T
page 51
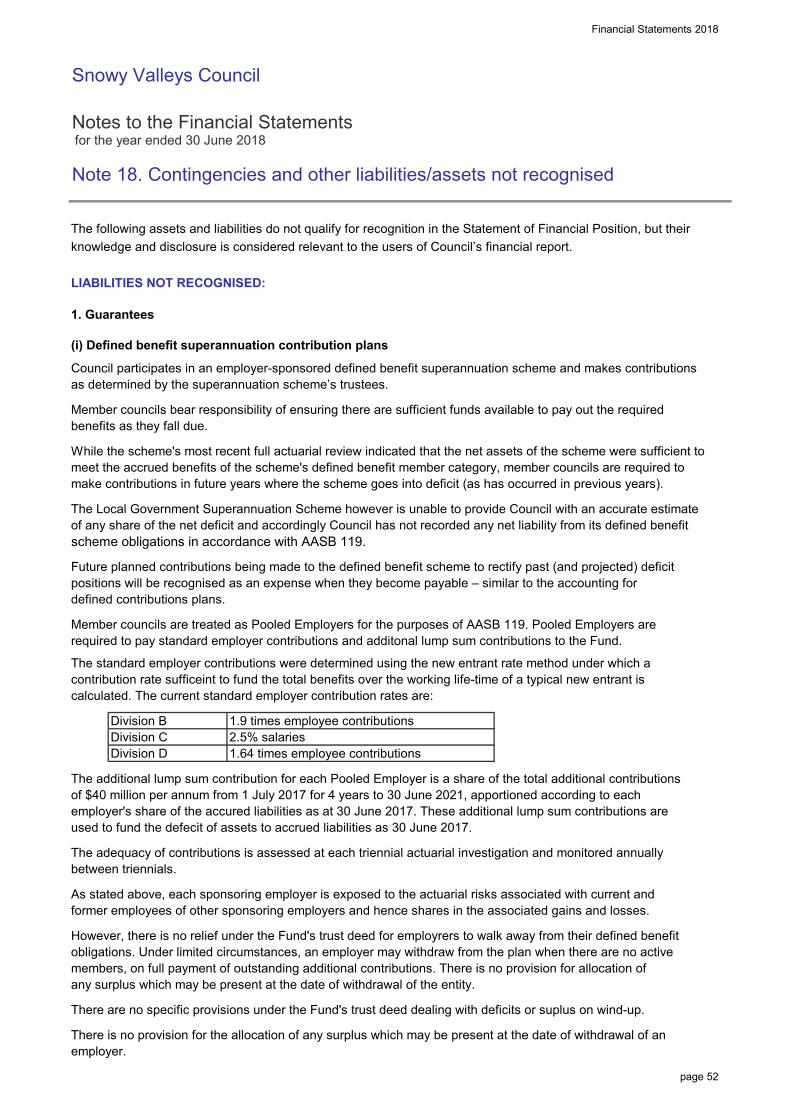
Financial Statements 2018
Snowy Valleys Council
Notes to the Financial Statements for the year ended 30 June 2018
Note 18. Contingencies and other liabilities/assets not recognised
The following assets and liabilities do not qualify for recognition in the Statement of Financial Position, but their knowledge and disclosure is considered relevant to the users of Council’s financial report.
LIABILITIES NOT RECOGNISED:
1. Guarantees
(i) Defined benefit superannuation contribution plans
Council participates in an employer-sponsored defined benefit superannuation scheme and makes contributionsas determined by the superannuation scheme’s trustees.
Member councils bear responsibility of ensuring there are sufficient funds available to pay out the required benefits as they fall due.
While the scheme's most recent full actuarial review indicated that the net assets of the scheme were sufficient tomeet the accrued benefits of the scheme's defined benefit member category, member councils are required to make contributions in future years where the scheme goes into deficit (as has occurred in previous years).
The Local Government Superannuation Scheme however is unable to provide Council with an accurate estimate of any share of the net deficit and accordingly Council has not recorded any net liability from its defined benefit scheme obligations in accordance with AASB 119.
Future planned contributions being made to the defined benefit scheme to rectify past (and projected) deficitpositions will be recognised as an expense when they become payable – similar to the accounting fordefined contributions plans.
Member councils are treated as Pooled Employers for the purposes of AASB 119. Pooled Employers are required to pay standard employer contributions and additonal lump sum contributions to the Fund.
The standard employer contributions were determined using the new entrant rate method under which acontribution rate sufficeint to fund the total benefits over the working life-time of a typical new entrant iscalculated. The current standard employer contribution rates are:
Division B 1.9 times employee contributionsDivision C 2.5% salariesDivision D 1.64 times employee contributions
The additional lump sum contribution for each Pooled Employer is a share of the total additional contributionsof $40 million per annum from 1 July 2017 for 4 years to 30 June 2021, apportioned according to eachemployer's share of the accured liabilities as at 30 June 2017. These additional lump sum contributions areused to fund the defecit of assets to accrued liabilities as 30 June 2017.
The adequacy of contributions is assessed at each triennial actuarial investigation and monitored annuallybetween triennials.
As stated above, each sponsoring employer is exposed to the actuarial risks associated with current and former employees of other sponsoring employers and hence shares in the associated gains and losses.
However, there is no relief under the Fund's trust deed for employrers to walk away from their defined benefitobligations. Under limited circumstances, an employer may withdraw from the plan when there are no activemembers, on full payment of outstanding additional contributions. There is no provision for allocation of any surplus which may be present at the date of withdrawal of the entity.
There are no specific provisions under the Fund's trust deed dealing with deficits or suplus on wind-up.
There is no provision for the allocation of any surplus which may be present at the date of withdrawal of anemployer.
X10A14T
page 52
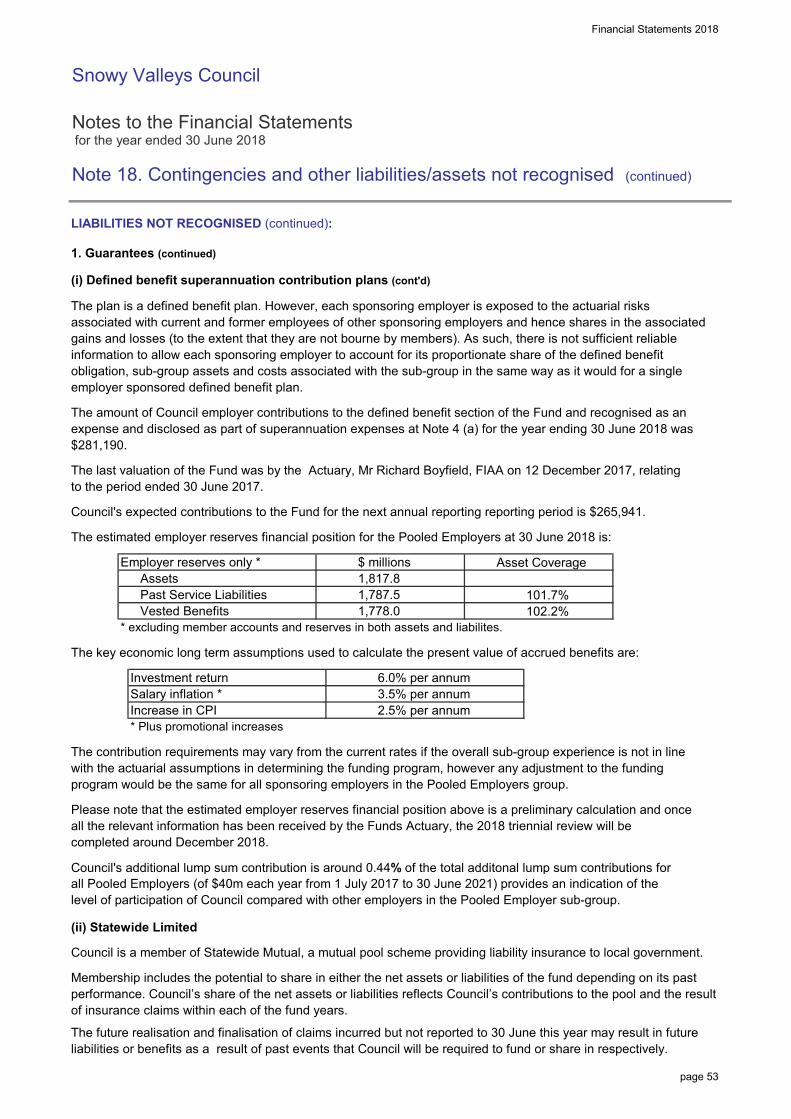
Financial Statements 2018
Snowy Valleys Council
Notes to the Financial Statements for the year ended 30 June 2018
Note 18. Contingencies and other liabilities/assets not recognised (continued)
LIABILITIES NOT RECOGNISED (continued):
1. Guarantees (continued)
(i) Defined benefit superannuation contribution plans (cont'd)
The plan is a defined benefit plan. However, each sponsoring employer is exposed to the actuarial risksassociated with current and former employees of other sponsoring employers and hence shares in the associatedgains and losses (to the extent that they are not bourne by members). As such, there is not sufficient reliableinformation to allow each sponsoring employer to account for its proportionate share of the defined benefitobligation, sub-group assets and costs associated with the sub-group in the same way as it would for a singleemployer sponsored defined benefit plan.
The amount of Council employer contributions to the defined benefit section of the Fund and recognised as an expense and disclosed as part of superannuation expenses at Note 4 (a) for the year ending 30 June 2018 was$281,190.
The last valuation of the Fund was by the Actuary, Mr Richard Boyfield, FIAA on 12 December 2017, relatingto the period ended 30 June 2017.
Council's expected contributions to the Fund for the next annual reporting reporting period is $265,941.
The estimated employer reserves financial position for the Pooled Employers at 30 June 2018 is:
Employer reserves only * $ millions Asset CoverageAssets 1,817.8Past Service Liabilities 1,787.5 101.7%Vested Benefits 1,778.0 102.2%
* excluding member accounts and reserves in both assets and liabilites.
The key economic long term assumptions used to calculate the present value of accrued benefits are:
Investment return 6.0% per annumSalary inflation * 3.5% per annumIncrease in CPI 2.5% per annum* Plus promotional increases
The contribution requirements may vary from the current rates if the overall sub-group experience is not in linewith the actuarial assumptions in determining the funding program, however any adjustment to the fundingprogram would be the same for all sponsoring employers in the Pooled Employers group.
Please note that the estimated employer reserves financial position above is a preliminary calculation and onceall the relevant information has been received by the Funds Actuary, the 2018 triennial review will be completed around December 2018.
Council's additional lump sum contribution is around 0.44% of the total additonal lump sum contributions forall Pooled Employers (of $40m each year from 1 July 2017 to 30 June 2021) provides an indication of the level of participation of Council compared with other employers in the Pooled Employer sub-group.
(ii) Statewide Limited
Council is a member of Statewide Mutual, a mutual pool scheme providing liability insurance to local government.
Membership includes the potential to share in either the net assets or liabilities of the fund depending on its pastperformance. Council’s share of the net assets or liabilities reflects Council’s contributions to the pool and the resultof insurance claims within each of the fund years.
The future realisation and finalisation of claims incurred but not reported to 30 June this year may result in futureliabilities or benefits as a result of past events that Council will be required to fund or share in respectively.
page 53
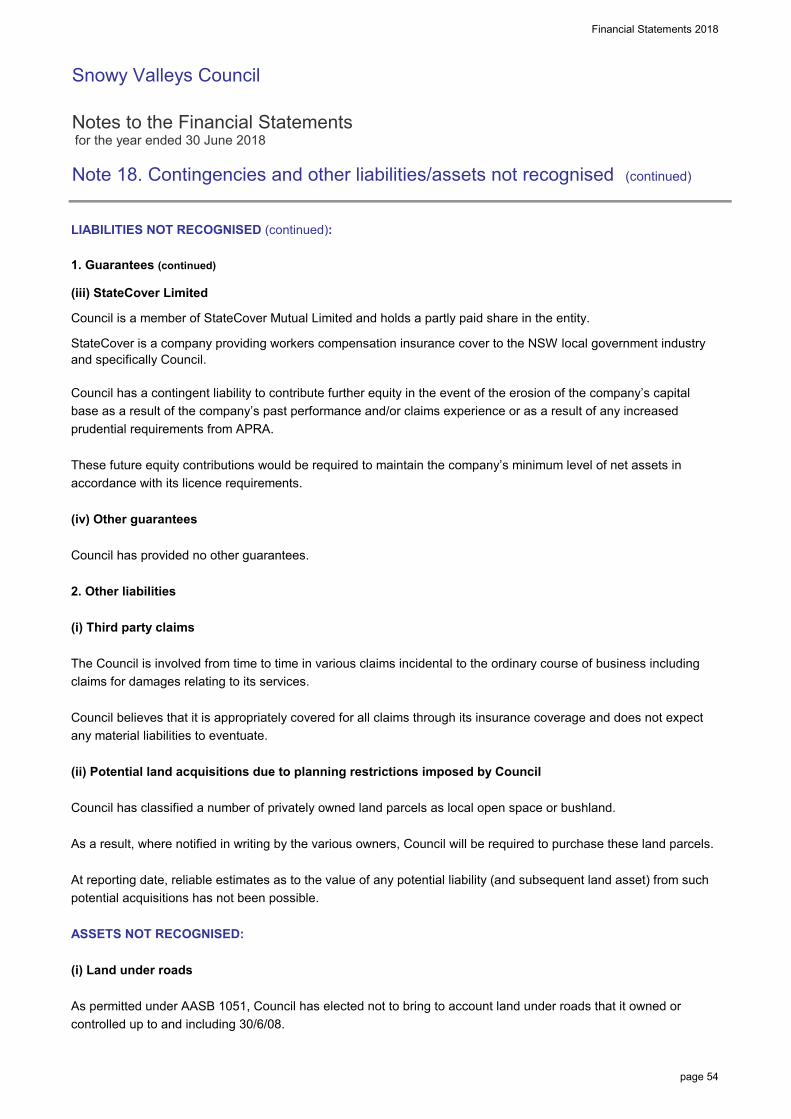
Financial Statements 2018
Snowy Valleys Council
Notes to the Financial Statements for the year ended 30 June 2018
Note 18. Contingencies and other liabilities/assets not recognised (continued)
LIABILITIES NOT RECOGNISED (continued):
1. Guarantees (continued)
(iii) StateCover Limited
Council is a member of StateCover Mutual Limited and holds a partly paid share in the entity.
StateCover is a company providing workers compensation insurance cover to the NSW local government industryand specifically Council.
Council has a contingent liability to contribute further equity in the event of the erosion of the company’s capitalbase as a result of the company’s past performance and/or claims experience or as a result of any increasedprudential requirements from APRA.
These future equity contributions would be required to maintain the company’s minimum level of net assets inaccordance with its licence requirements.
(iv) Other guarantees
Council has provided no other guarantees.
2. Other liabilities
(i) Third party claims
The Council is involved from time to time in various claims incidental to the ordinary course of business includingclaims for damages relating to its services.
Council believes that it is appropriately covered for all claims through its insurance coverage and does not expectany material liabilities to eventuate.
(ii) Potential land acquisitions due to planning restrictions imposed by Council
Council has classified a number of privately owned land parcels as local open space or bushland.
As a result, where notified in writing by the various owners, Council will be required to purchase these land parcels.
At reporting date, reliable estimates as to the value of any potential liability (and subsequent land asset) from suchpotential acquisitions has not been possible.
ASSETS NOT RECOGNISED:
(i) Land under roads
As permitted under AASB 1051, Council has elected not to bring to account land under roads that it owned orcontrolled up to and including 30/6/08.
page 54
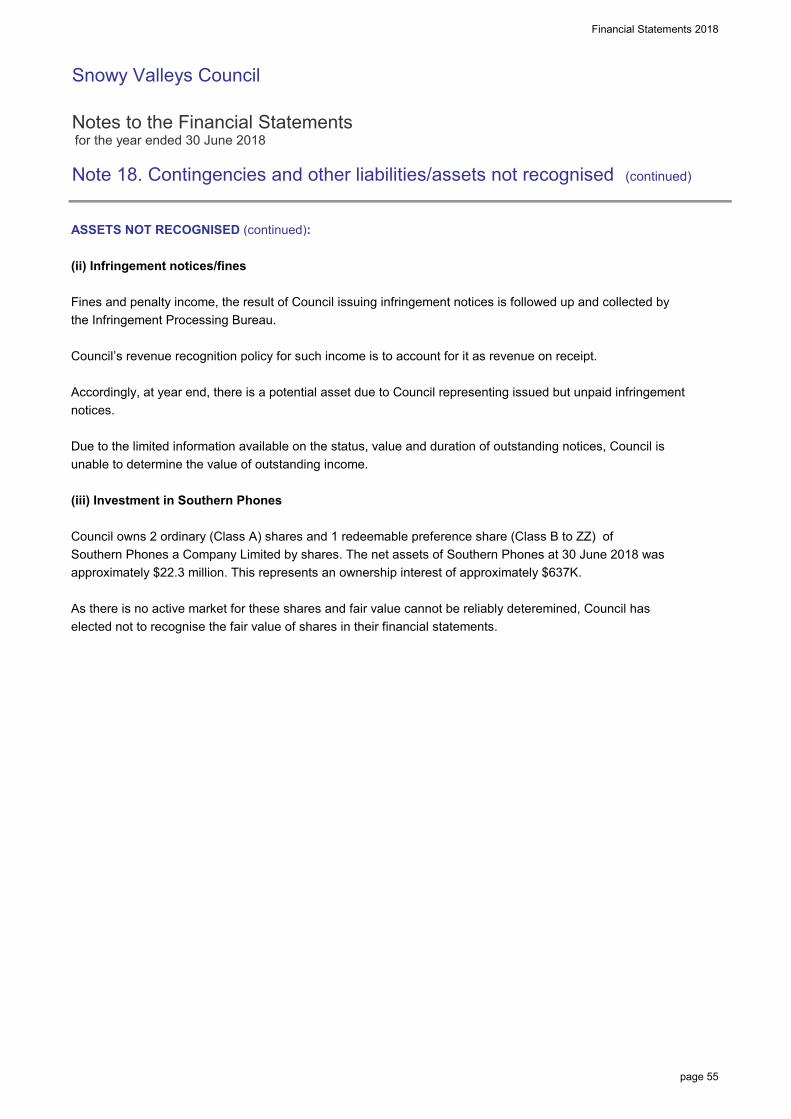
Financial Statements 2018
Snowy Valleys Council
Notes to the Financial Statements for the year ended 30 June 2018
Note 18. Contingencies and other liabilities/assets not recognised (continued)
ASSETS NOT RECOGNISED (continued):
(ii) Infringement notices/fines
Fines and penalty income, the result of Council issuing infringement notices is followed up and collected bythe Infringement Processing Bureau.
Council’s revenue recognition policy for such income is to account for it as revenue on receipt.
Accordingly, at year end, there is a potential asset due to Council representing issued but unpaid infringementnotices.
Due to the limited information available on the status, value and duration of outstanding notices, Council isunable to determine the value of outstanding income.
(iii) Investment in Southern Phones
Council owns 2 ordinary (Class A) shares and 1 redeemable preference share (Class B to ZZ) ofSouthern Phones a Company Limited by shares. The net assets of Southern Phones at 30 June 2018 wasapproximately $22.3 million. This represents an ownership interest of approximately $637K.
As there is no active market for these shares and fair value cannot be reliably deteremined, Council has elected not to recognise the fair value of shares in their financial statements.
page 55
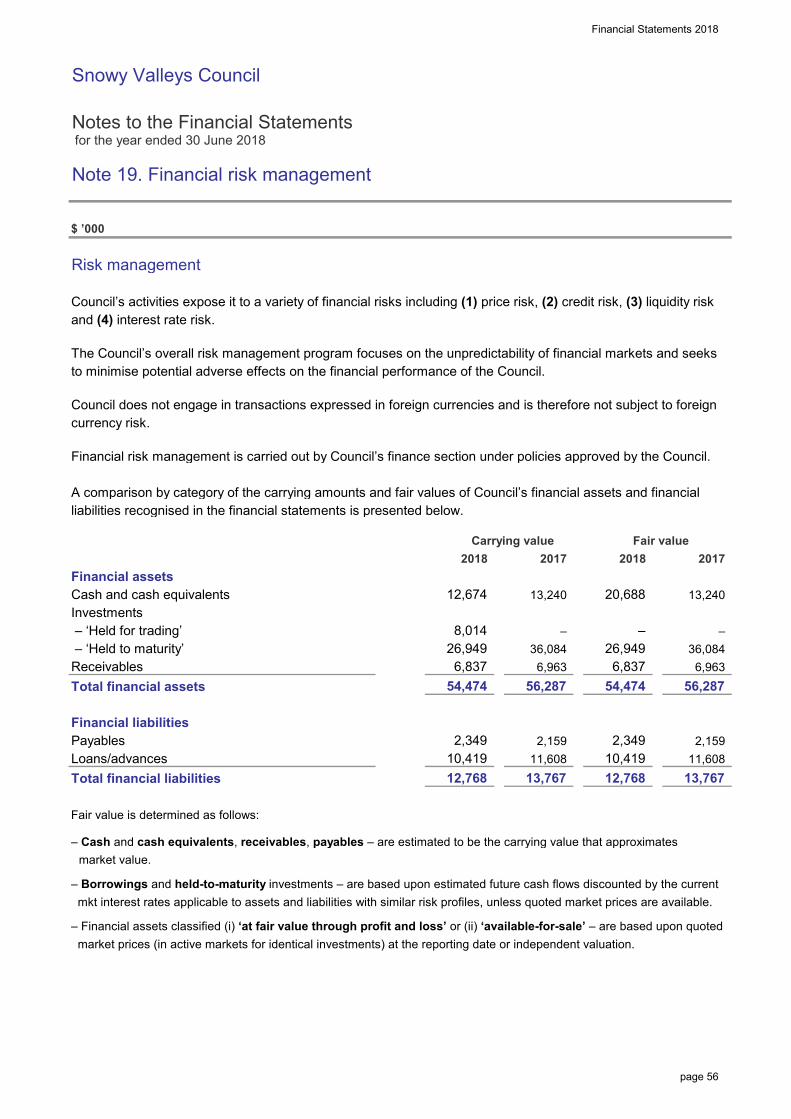
Financial Statements 2018
Snowy Valleys Council
Notes to the Financial Statements for the year ended 30 June 2018
Note 19. Financial risk management
$ ’000
Risk management
Council’s activities expose it to a variety of financial risks including (1) price risk, (2) credit risk, (3) liquidity riskand (4) interest rate risk.
The Council’s overall risk management program focuses on the unpredictability of financial markets and seeksto minimise potential adverse effects on the financial performance of the Council.
Council does not engage in transactions expressed in foreign currencies and is therefore not subject to foreigncurrency risk.
Financial risk management is carried out by Council’s finance section under policies approved by the Council.
A comparison by category of the carrying amounts and fair values of Council’s financial assets and financialliabilities recognised in the financial statements is presented below.
Financial assetsCash and cash equivalentsInvestments – ‘Held for trading’ – ‘Held to maturity’ReceivablesTotal financial assets
Financial liabilitiesPayablesLoans/advancesTotal financial liabilities
Fair value is determined as follows:
– Cash and cash equivalents, receivables, payables – are estimated to be the carrying value that approximates market value.
– Borrowings and held-to-maturity investments – are based upon estimated future cash flows discounted by the current mkt interest rates applicable to assets and liabilities with similar risk profiles, unless quoted market prices are available.
– Financial assets classified (i) ‘at fair value through profit and loss’ or (ii) ‘available-for-sale’ – are based upon quoted market prices (in active markets for identical investments) at the reporting date or independent valuation.
13,767 13,767
2,159
12,768 12,768 10,419
54,474 54,474
11,608
6,837
2,349 10,419
6,963
– 26,949
56,287 56,287
2018 2017
36,084
12,674
6,963 26,949 36,084
6,837
2017Fair value
8,014
13,240
–
Carrying value
–
2,159
13,240
11,608 2,349
20,688
2018
X10A12T
page 56
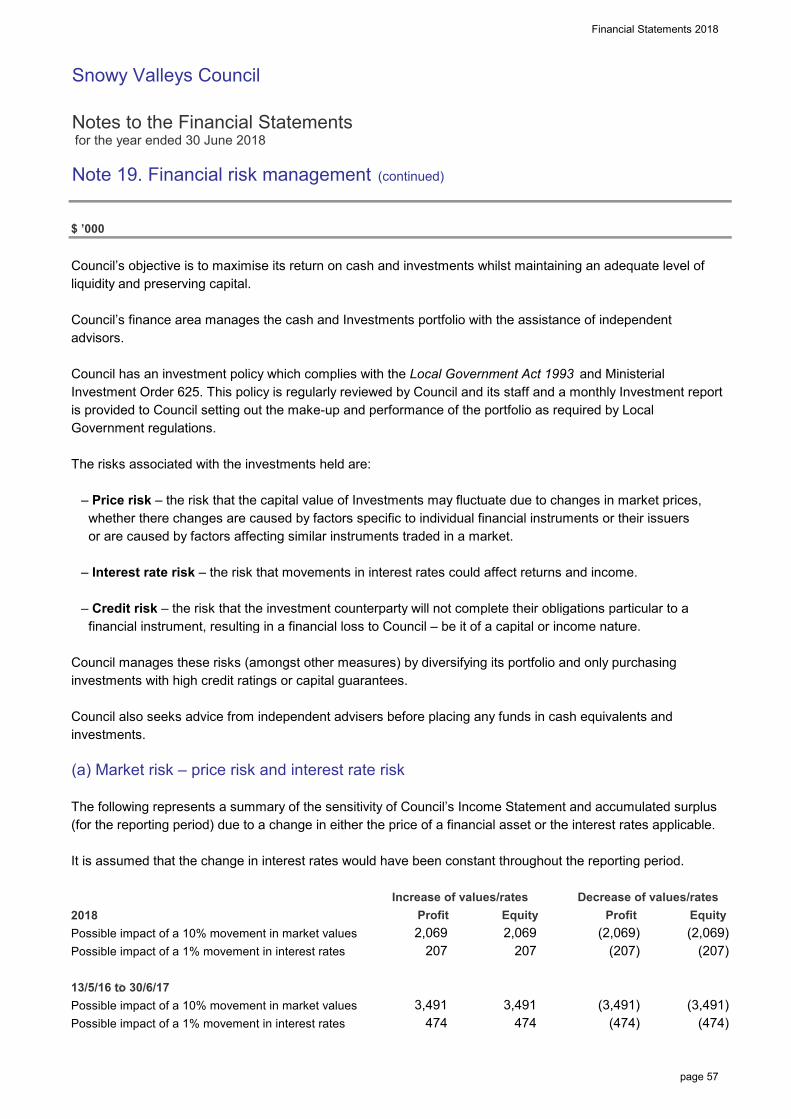
Financial Statements 2018
Snowy Valleys Council
Notes to the Financial Statements for the year ended 30 June 2018
Note 19. Financial risk management (continued)
$ ’000
Council’s objective is to maximise its return on cash and investments whilst maintaining an adequate level ofliquidity and preserving capital.
Council’s finance area manages the cash and Investments portfolio with the assistance of independentadvisors.
Council has an investment policy which complies with the Local Government Act 1993 and MinisterialInvestment Order 625. This policy is regularly reviewed by Council and its staff and a monthly Investment reportis provided to Council setting out the make-up and performance of the portfolio as required by LocalGovernment regulations.
The risks associated with the investments held are:
– Price risk – the risk that the capital value of Investments may fluctuate due to changes in market prices, whether there changes are caused by factors specific to individual financial instruments or their issuers or are caused by factors affecting similar instruments traded in a market.
– Interest rate risk – the risk that movements in interest rates could affect returns and income.
– Credit risk – the risk that the investment counterparty will not complete their obligations particular to a financial instrument, resulting in a financial loss to Council – be it of a capital or income nature.
Council manages these risks (amongst other measures) by diversifying its portfolio and only purchasinginvestments with high credit ratings or capital guarantees.
Council also seeks advice from independent advisers before placing any funds in cash equivalents andinvestments.
(a) Market risk – price risk and interest rate risk
The following represents a summary of the sensitivity of Council’s Income Statement and accumulated surplus(for the reporting period) due to a change in either the price of a financial asset or the interest rates applicable.
It is assumed that the change in interest rates would have been constant throughout the reporting period.
2018Possible impact of a 10% movement in market valuesPossible impact of a 1% movement in interest rates
13/5/16 to 30/6/17Possible impact of a 10% movement in market valuesPossible impact of a 1% movement in interest rates
Equity
(207)
(474)
207 2,069 Equity
Decrease of values/rates
(3,491) 3,491
Profit
(474) (3,491) 3,491
Profit
207 (2,069) 2,069
474
Increase of values/rates
474
(207) (2,069)
page 57
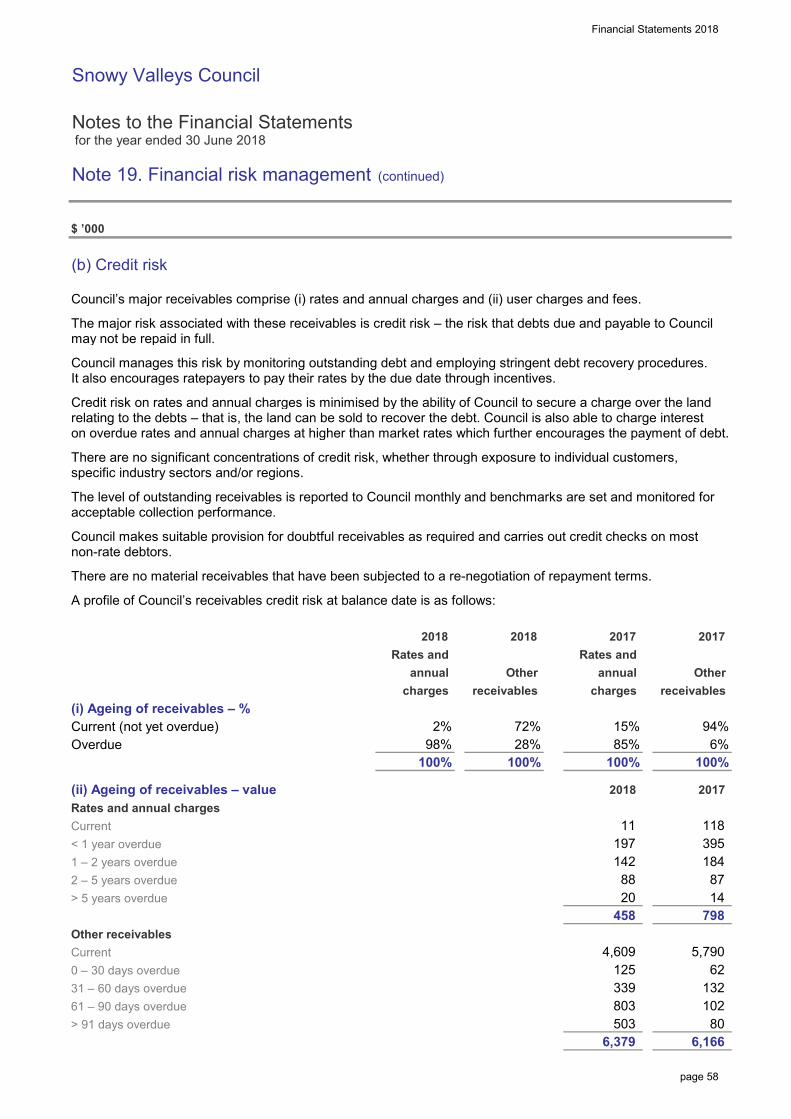
Financial Statements 2018
Snowy Valleys Council
Notes to the Financial Statements for the year ended 30 June 2018
Note 19. Financial risk management (continued)
$ ’000
(b) Credit risk
Council’s major receivables comprise (i) rates and annual charges and (ii) user charges and fees.
The major risk associated with these receivables is credit risk – the risk that debts due and payable to Councilmay not be repaid in full.
Council manages this risk by monitoring outstanding debt and employing stringent debt recovery procedures.It also encourages ratepayers to pay their rates by the due date through incentives.
Credit risk on rates and annual charges is minimised by the ability of Council to secure a charge over the landrelating to the debts – that is, the land can be sold to recover the debt. Council is also able to charge intereston overdue rates and annual charges at higher than market rates which further encourages the payment of debt.
There are no significant concentrations of credit risk, whether through exposure to individual customers,specific industry sectors and/or regions.
The level of outstanding receivables is reported to Council monthly and benchmarks are set and monitored foracceptable collection performance.
Council makes suitable provision for doubtful receivables as required and carries out credit checks on mostnon-rate debtors.
There are no material receivables that have been subjected to a re-negotiation of repayment terms.
A profile of Council’s receivables credit risk at balance date is as follows:
(i) Ageing of receivables – %Current (not yet overdue)Overdue
(ii) Ageing of receivables – valueRates and annual chargesCurrent< 1 year overdue1 – 2 years overdue2 – 5 years overdue> 5 years overdue
Other receivablesCurrent0 – 30 days overdue31 – 60 days overdue61 – 90 days overdue> 91 days overdue
6,379
458 20
142
798
118
94%
102
6,166
2017 2017
annual
4,609
503
197
88
receivables charges
184
14
803
2017
Other
125
100%
charges
2%
Rates and
11
Other
2018
100%
Rates and
receivables
98% 85% 6%100%28%
2018
100%
annual
72% 15%
395
339 62
132
2018
87
80
5,790
page 58
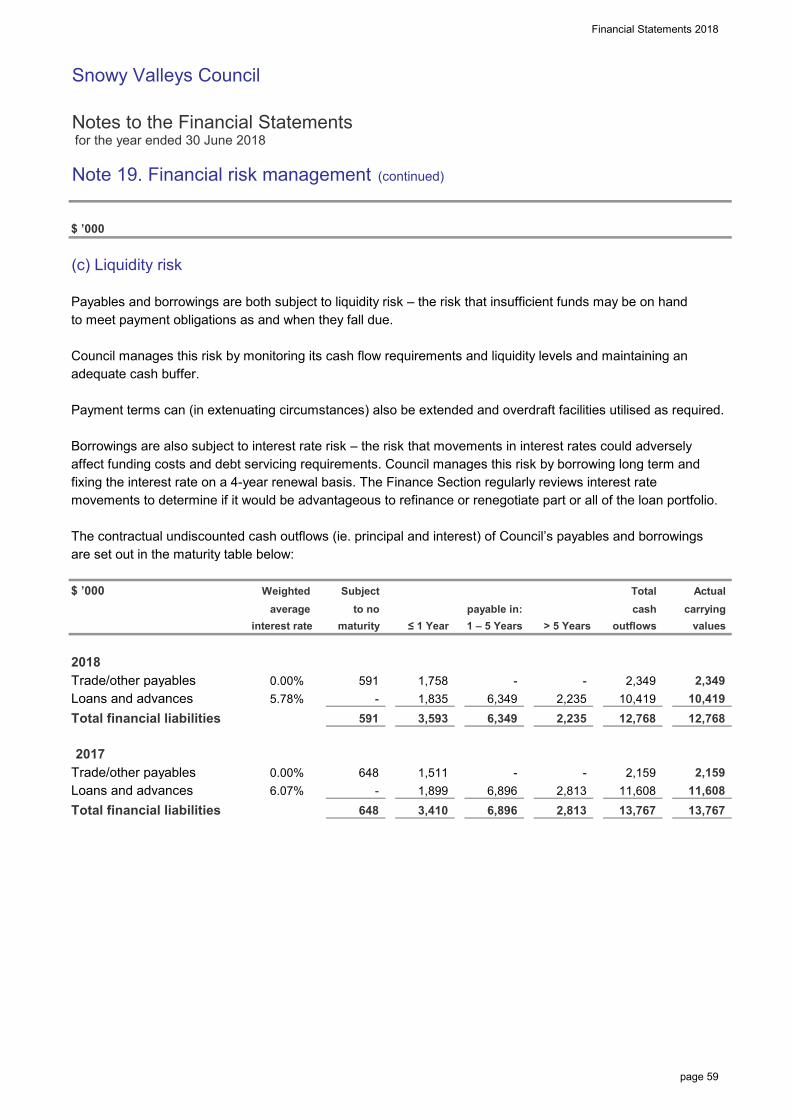
Financial Statements 2018
Snowy Valleys Council
Notes to the Financial Statements for the year ended 30 June 2018
Note 19. Financial risk management (continued)
$ ’000
(c) Liquidity risk
Payables and borrowings are both subject to liquidity risk – the risk that insufficient funds may be on handto meet payment obligations as and when they fall due.
Council manages this risk by monitoring its cash flow requirements and liquidity levels and maintaining anadequate cash buffer.
Payment terms can (in extenuating circumstances) also be extended and overdraft facilities utilised as required.
Borrowings are also subject to interest rate risk – the risk that movements in interest rates could adverselyaffect funding costs and debt servicing requirements. Council manages this risk by borrowing long term andfixing the interest rate on a 4-year renewal basis. The Finance Section regularly reviews interest ratemovements to determine if it would be advantageous to refinance or renegotiate part or all of the loan portfolio.
The contractual undiscounted cash outflows (ie. principal and interest) of Council’s payables and borrowingsare set out in the maturity table below:
$ ’000
Trade/other payablesLoans and advancesTotal financial liabilities
Trade/other payablesLoans and advancesTotal financial liabilities
10,419
2,159
Actual
13,767
0.00%6.07%
1,835
cash
11,608 1,511 1,899 6,896
6,349 591 12,768
2,813 11,608 648 13,767
648
-
3,410 2,813 6,896
2,159 -
2017
payable in:1 – 5 Years
591
≤ 1 Yearto no
Subject
0.00%5.78%
interest rateaverage
20182,349
Weighted
1,758 10,419 12,768
- 2,235
2,349
carrying
-
3,593 6,349
maturity > 5 Years outflows
Total
values
-
2,235
-
page 59
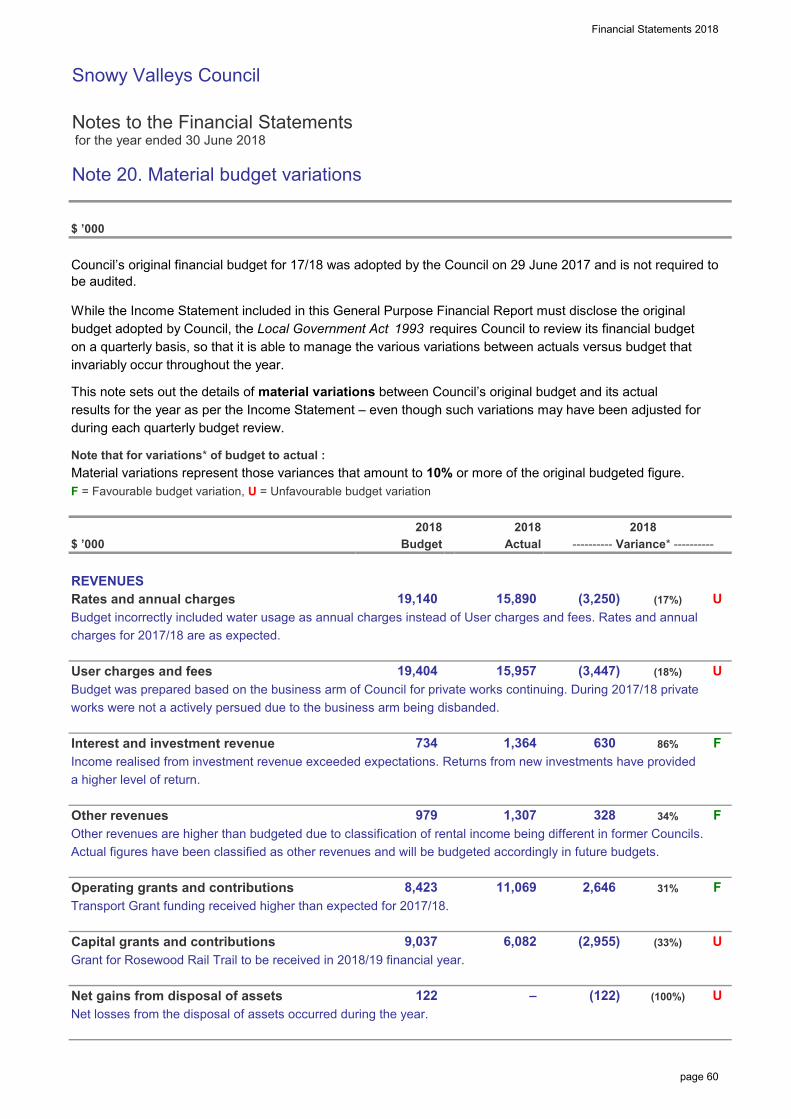
Financial Statements 2018
Snowy Valleys Council
Notes to the Financial Statements for the year ended 30 June 2018
Note 20. Material budget variations
$ ’000
While the Income Statement included in this General Purpose Financial Report must disclose the originalbudget adopted by Council, the Local Government Act 1993 requires Council to review its financial budgeton a quarterly basis, so that it is able to manage the various variations between actuals versus budget thatinvariably occur throughout the year.
This note sets out the details of material variations between Council’s original budget and its actualresults for the year as per the Income Statement – even though such variations may have been adjusted forduring each quarterly budget review.
Note that for variations* of budget to actual :Material variations represent those variances that amount to 10% or more of the original budgeted figure.F = Favourable budget variation, U = Unfavourable budget variation
$ ’000
REVENUESRates and annual chargesBudget incorrectly included water usage as annual charges instead of User charges and fees. Rates and annualcharges for 2017/18 are as expected.
User charges and feesBudget was prepared based on the business arm of Council for private works continuing. During 2017/18 privateworks were not a actively persued due to the business arm being disbanded.
Interest and investment revenueIncome realised from investment revenue exceeded expectations. Returns from new investments have provided a higher level of return.
Other revenuesOther revenues are higher than budgeted due to classification of rental income being different in former Councils. Actual figures have been classified as other revenues and will be budgeted accordingly in future budgets.
Operating grants and contributionsTransport Grant funding received higher than expected for 2017/18.
Capital grants and contributionsGrant for Rosewood Rail Trail to be received in 2018/19 financial year.
Net gains from disposal of assetsNet losses from the disposal of assets occurred during the year.
328
(18%)
Actual
15,957
F
15,890
2018---------- Variance* ----------
19,140
U
8,423 11,069
1,307
U
31%2,646
(3,447)
(3,250)
(122) (100%)
1,364
U
Budget
630
6,082
Council’s original financial budget for 17/18 was adopted by the Council on 29 June 2017 and is not required to be audited.
2018
9,037
122
U(33%)(2,955)
34%
86%
979
–
2018
19,404
(17%)
F
734 F
X10A13T
page 60
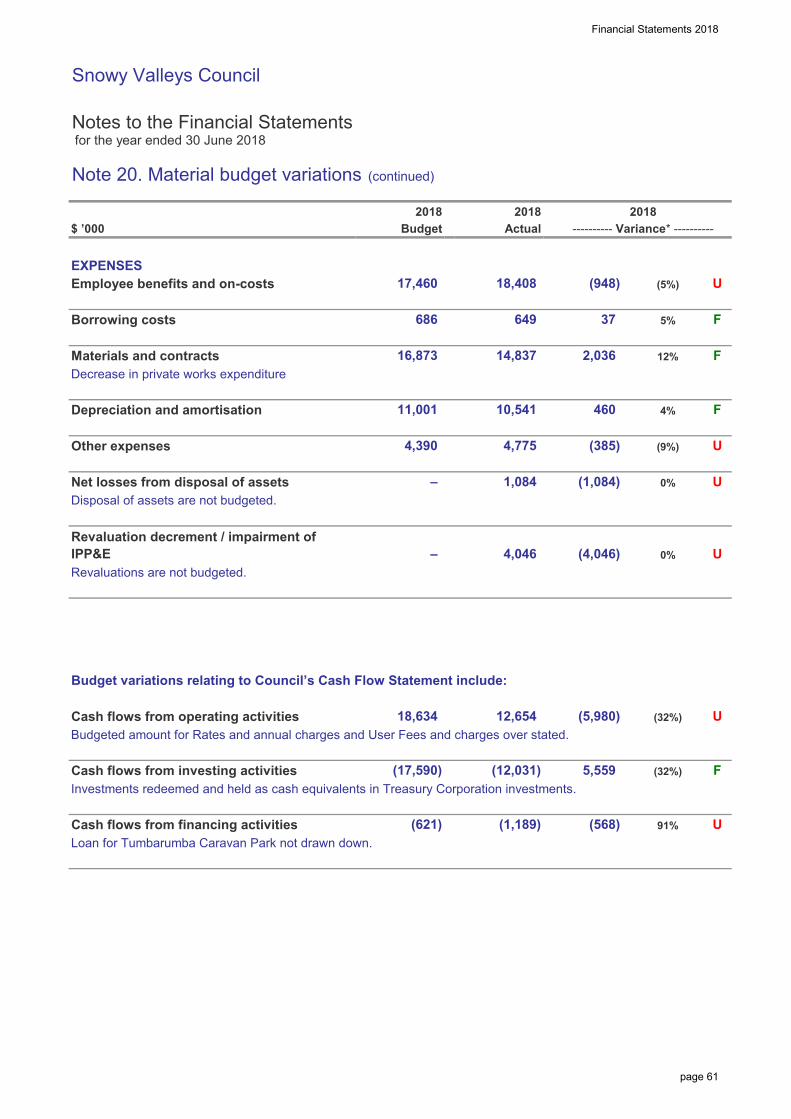
Financial Statements 2018
Snowy Valleys Council
Notes to the Financial Statements for the year ended 30 June 2018
Note 20. Material budget variations (continued)
$ ’000
EXPENSESEmployee benefits and on-costs
Borrowing costs
Materials and contractsDecrease in private works expenditure
Depreciation and amortisation
Other expenses
Net losses from disposal of assetsDisposal of assets are not budgeted.
Revaluations are not budgeted.
Budget variations relating to Council’s Cash Flow Statement include:
Cash flows from operating activitiesBudgeted amount for Rates and annual charges and User Fees and charges over stated.
Cash flows from investing activitiesInvestments redeemed and held as cash equivalents in Treasury Corporation investments.
Cash flows from financing activitiesLoan for Tumbarumba Caravan Park not drawn down.
1,084
11,001
–
(5,980)
F10,541
14,837
18,634 12,654 U(32%)
Revaluation decrement / impairment of IPP&E
12%2,036
18,408
Actual
5%
16,873
17,460
(12,031) F
(568)
(9%)
U(621)
U
–
91%
(32%)
(1,189)
(17,590) 5,559
(385)
U0%
4,390
37
0% U
(1,084)
(4,046)
460
F
4,775
F
2018
4,046
2018
4%
649
2018
U
686
---------- Variance* ----------
(5%)
Budget
(948)
page 61
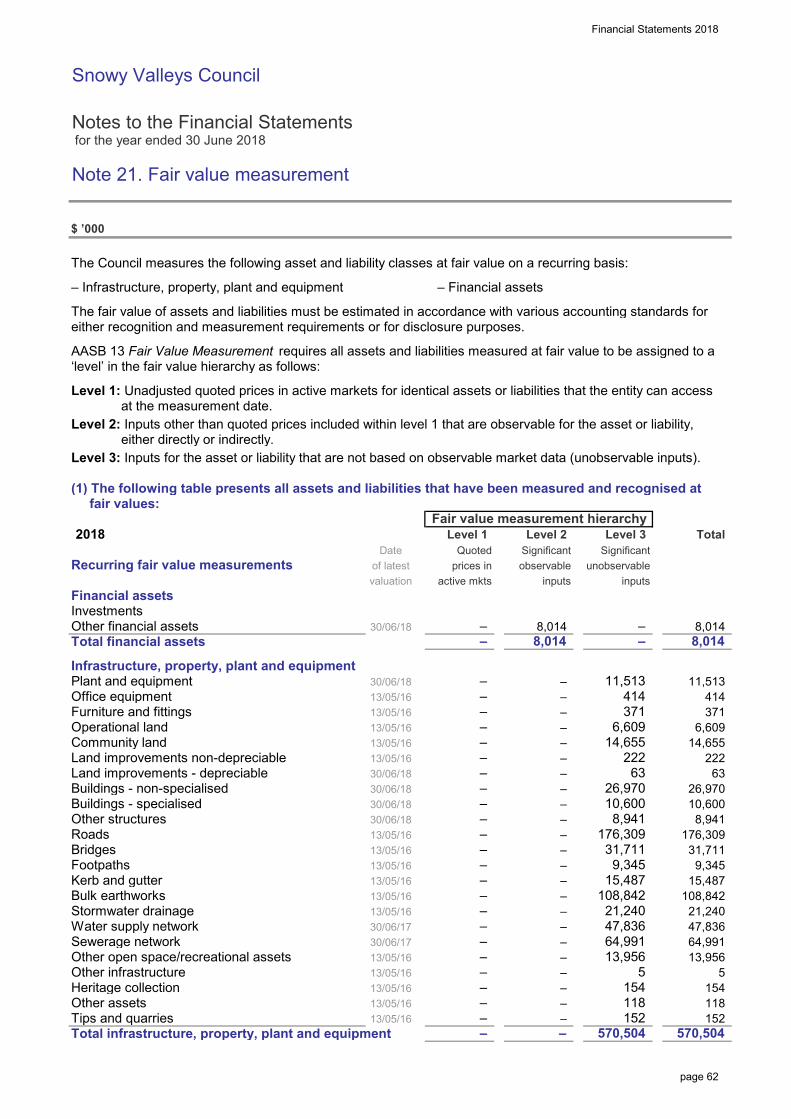
Financial Statements 2018
Snowy Valleys Council
Notes to the Financial Statements for the year ended 30 June 2018
Note 21. Fair value measurement
$ ’000
The Council measures the following asset and liability classes at fair value on a recurring basis:
– Infrastructure, property, plant and equipment – Financial assets
The fair value of assets and liabilities must be estimated in accordance with various accounting standards foreither recognition and measurement requirements or for disclosure purposes.
AASB 13 Fair Value Measurement requires all assets and liabilities measured at fair value to be assigned to a‘level’ in the fair value hierarchy as follows:
Level 1: Unadjusted quoted prices in active markets for identical assets or liabilities that the entity can access at the measurement date. Level 2: Inputs other than quoted prices included within level 1 that are observable for the asset or liability, either directly or indirectly.Level 3: Inputs for the asset or liability that are not based on observable market data (unobservable inputs).
(1) The following table presents all assets and liabilities that have been measured and recognised at fair values:
2018
Recurring fair value measurements
Financial assetsInvestmentsOther financial assetsTotal financial assets
Infrastructure, property, plant and equipmentPlant and equipmentOffice equipment Furniture and fittingsOperational landCommunity landLand improvements non-depreciableLand improvements - depreciableBuildings - non-specialisedBuildings - specialisedOther structuresRoadsBridges FootpathsKerb and gutterBulk earthworksStormwater drainageWater supply networkSewerage networkOther open space/recreational assetsOther infrastructureHeritage collectionOther assetsTips and quarriesTotal infrastructure, property, plant and equipment
13/05/16 – – 15,487 15,487
– 13/05/16
–
154
prices in observable
8,014
Date
– 8,014 – 8,014
– 154
152
–
30/06/18 –
–
9,345
– – 63
414 13/05/16
13/05/16 – – 9,345
30/06/18
8,014
64,991
63 26,970
– – 6,609 6,609
8,941
11,513 414
–
– –
–
–
–
– 21,240 30/06/17 – – 47,836 47,836 30/06/17 – – 64,991
13/05/16 – 118 118
inputsactive mkts
Total
valuation
13/05/16
11,513 –
– 14,655 14,655
13/05/16–
371
–
13/05/16
13/05/16 – 108,842 108,842 13/05/16
Quoted Significant
13/05/16 –
30/06/18
30/06/1813/05/16 – 176,309 176,309
– 21,240
–
30/06/18
– –
Fair value measurement hierarchyLevel 1 Level 2
Significant
570,504 – 570,504 –
13/05/16 – – 5 5 13/05/16 – – 13,956
–
inputs
222 222
– – 8,941
Level 3
10,600 26,970
31,711
13/05/16
371 – –
30/06/18
13,956
13/05/16 – – 152
unobservable
31,711
of latest
10,600
X10A8T
X10A16T
page 62
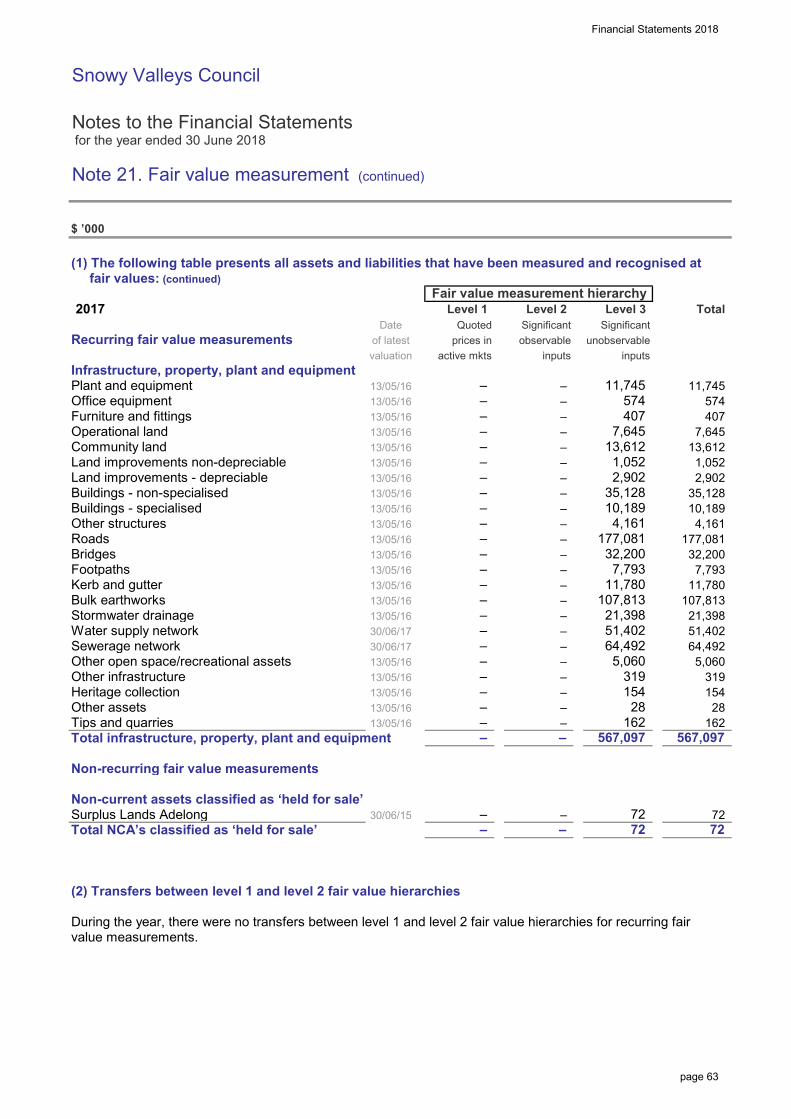
Financial Statements 2018
Snowy Valleys Council
Notes to the Financial Statements for the year ended 30 June 2018
Note 21. Fair value measurement (continued)
$ ’000
(1) The following table presents all assets and liabilities that have been measured and recognised at fair values: (continued)
2017
Recurring fair value measurements
Infrastructure, property, plant and equipmentPlant and equipmentOffice equipment Furniture and fittingsOperational landCommunity landLand improvements non-depreciableLand improvements - depreciableBuildings - non-specialisedBuildings - specialisedOther structuresRoadsBridges FootpathsKerb and gutterBulk earthworksStormwater drainageWater supply networkSewerage networkOther open space/recreational assetsOther infrastructureHeritage collectionOther assetsTips and quarriesTotal infrastructure, property, plant and equipment
Non-recurring fair value measurements
Non-current assets classified as ‘held for sale’Surplus Lands AdelongTotal NCA’s classified as ‘held for sale’
(2) Transfers between level 1 and level 2 fair value hierarchies
During the year, there were no transfers between level 1 and level 2 fair value hierarchies for recurring fairvalue measurements.
13/05/16 2,902 2,902
– 28 28
–
567,097 – –
13/05/16
7,645
– – 32,200
–
–
–
– 13/05/16 – – 11,745 11,745
13/05/16 – –
13/05/16
Date QuotedLevel 1 Level 2
inputs
Level 3
13/05/16
– – 154 154 13/05/16
13/05/1610,189 10,189
13,612
13/05/16 –
– 4,161
13/05/16 –
valuationof latest
574
11,780 13/05/16
13/05/16
11,780 –
Significant Significant
13/05/16
13/05/16 –
407 –
72 72 72 72 30/06/15
–
–
–
– 567,097
– –
–
162 162
107,813 107,813 13/05/16
4,161 13/05/16
– – 21,398 21,398 30/06/17 – – 51,402 51,402
– –
Total
7,645
177,081
13/05/16 – – 319 319 13/05/16
– – – 5,060 5,060
13/05/16
30/06/17 – 64,492 64,492
177,081
–
– – 35,128 35,128
32,200 13/05/16 – – 7,793 7,793
– 13,612
– –
– 407
active mkts
574
prices in observable unobservableinputs
Fair value measurement hierarchy
13/05/16 – – 1,052 1,052
page 63
Financial Statements 2018
Snowy Valleys Council Notes to the Financial Statements for the year ended 30 June 2018 Note 21. Fair value measurement (continued)
page 64
(3) Valuation techniques used to derive level 2 and level 3 fair values Where Council is unable to derive fair valuations using quoted market prices of identical assets (i.e. level 1 inputs), Council instead utilises a spread of both observable inputs (level 2 inputs) and unobservable inputs (level 3 inputs). The fair valuation techniques Council has employed while utilising level 2 and level 3 inputs are as follows: Infrastructure, property, plant and equipment Plant and equipment, office equipment and furniture and fittings Plant and equipment, office equipment and furniture and fittings are valued at cost but are disclosed at fair value in the notes. The carrying amount of these assets is assumed to approximate fair value due to the nature of the items (being readily sourced and replaceable).
The key unobservable inputs to the valuation are the remaining useful life and remaining value. Council reviews these assets against replacement costs of similar assets. There has been no change to the valuation process during the reporting period.
Typical assets within these classes include, plant/equipment - trucks, cars, mowers, graders, rollers, loaders, office equipment – computers, printers, furniture/fittings – work desks/chairs Stormwater drainage assets Stormwater drainage assets are valued using the cost approach but are disclosed at fair value in the notes. These assets typically include pipes/conduits, pits, headwalls located in urban areas.
The key unobservable inputs to the valuation are the remaining useful life, condition and remaining value. Replacement costs are compiled ‘in house’ by experienced engineers and are calculated by either applying recent actual project costs or by sourcing supplier component costs and then estimating project costs. When estimating project costs, consideration is given to project specifications, location, site conditions and construction techniques. Unit rates for box culverts range from $626 to $4,351/m, for reinforced and uPVC pipes from $45 to $2,208/m, for headwalls from $144 to $6,795/unit and for pits from $225 to $21,568/unit.
There has been no change to the valuation process during the reporting period. Other structure assets Other structure assets are valued using the cost approach but are disclosed at fair value in the notes. These assets typically include retaining walls, shelters, swimming pools. Where possible larger assets such as swimming pools are componentised into significant parts. The key unobservable inputs to the valuation are the remaining useful life, condition and remaining value. Replacement costs are compiled ‘in house’ by experienced engineers and are calculated by either applying recent actual project costs or by sourcing supplier component costs and then estimating project costs.
When estimating project costs, consideration is given to project specifications, location, site conditions and construction techniques. Unit rates for retaining walls range from $224 to $1,740/m2 and for shelters from $280 to $86,700/unit.
There has been no change to the valuation process during the reporting period. Land improvement depreciable and non-depreciable assets These assets are valued using the cost approach but are disclosed at fair value in the notes. These assets typically include playing fields, playground equipment, tables /seats.
The key unobservable inputs to the valuation are the remaining useful life, condition and remaining value. Replacement costs are compiled ‘in house’ by experienced engineers and are calculated by either applying recent actual project costs or by sourcing supplier component costs and then estimating project costs.
Financial Statements 2018_
Snowy Valleys Council Notes to the Financial Statements for the year ended 30 June 2018 Note 21. Fair value measurement (continued)
page 65
When estimating project costs, consideration is given to project specifications, location, site conditions and construction techniques. Unit rates include $40/m3 for ground works, for tracks/paths range from $20 to $189/m2 and for play equipment from $1,120 to $47,459/unit.
There has been no change to the valuation process during the reporting period. Operational and Community land assets These assets are valued using the cost approach but are disclosed at fair value in the notes. These assets typically include saleable Operational Land such as land associated with works depot, offices and non-saleable Community Land associated with town commons, parks. The key unobservable inputs to the valuation are the remaining useful life, condition and remaining value. Replacement costs are either sourced from actual recent purchase costs, from qualified valuers or from Valuer-General Unimproved Capital Values. Unit rates range from $0.64 to $4,455/m2.
There has been no change to the valuation process during the reporting period. Buildings – non specialised and specialised assets These assets are valued using the cost approach but are disclosed at fair value in the notes. These assets typically include Council offices (non specialised) and water/sewer treatment plant buildings (specialised).
The key unobservable inputs to the valuation are the remaining useful life, condition and remaining value. Replacement costs are compiled ‘in house’ by experienced engineers and are calculated by either applying recent actual project costs or by sourcing supplier component costs and then estimating project costs. Alternatively, quotations can be sourced from qualified professionals.
Buildings are componentised into significant parts to assist in applying appropriate useful lives and replacement costs.
When estimating project costs, consideration is given to project specifications, location, site conditions and construction techniques. Unit rates for roofs range from $158 to $311/m2, for internal floors from $50 to $181/m2, for external walls from $308 to $805 and for mechanical components from $10,546 to $78,552/unit.
There has been no change to the valuation process during the reporting period. Road assets Road assets are valued using the cost approach but are disclosed at fair value in the notes. These assets typically include sealed/unsealed pavements, surfaces (bituminous seals, asphaltic concrete), kerb and gutter, safety barriers, culverts.
The key unobservable inputs to the valuation are the remaining useful life, condition and remaining value. Replacement costs are compiled ‘in house’ by experienced engineers and are calculated by either applying recent actual project costs or by sourcing supplier component costs and then estimating project costs. Where applicable contract rates are applied (eg, surface assets).
Roads/surfaces/kerb assets are segmented into manageable lengths and uniform specifications.
When estimating project costs, consideration is given to project specifications, location, site conditions and construction techniques. Unit rates for unsealed pavement range from $1.66 to $12.03/m2, for sealed pavements from $2.13 to $88.47/m2, for surface assets from $2.07 to $200/m2, for kerb and gutter assets from $86 to $313/m and for rural road culverts from $168 to $12,500/m.
There has been no change to the valuation process during the reporting period. Bridge assets Bridge assets are valued using the cost approach but are disclosed at fair value in the notes. These assets typically include concrete/steel bridges. Although some timber bridges are still in use, they are being progressively phased out.
Financial Statements 2018_
Snowy Valleys Council Notes to the Financial Statements for the year ended 30 June 2018 Note 21. Fair value measurement (continued)
page 66
The key unobservable inputs to the valuation are the remaining useful life, condition and remaining value. Replacement costs are compiled ‘in house’ by experienced engineers and are calculated by either applying recent actual project costs or by sourcing supplier component costs and then estimating project costs. Where applicable contract rates are applied.
When estimating project costs, consideration is given to project specifications, location, site conditions and construction techniques. Unit rates range from $860 to $5,761m2.
There has been no change to the valuation process during the reporting period. Footpath assets Footpath assets are valued using the cost approach but are disclosed at fair value in the notes. These assets are typically constructed using concrete, gravel, pavers.
The key unobservable inputs to the valuation are the remaining useful life, condition and remaining value. Replacement costs are compiled ‘in house’ by experienced engineers and are calculated by either applying recent actual project costs or by sourcing supplier component costs and then estimating project costs.
Footpath assets are segmented into manageable lengths and uniform specifications.
When estimating project costs, consideration is given to project specifications, location, site conditions and construction techniques. Unit rates range from $65 to $214/m2.
There has been no change to the valuation process during the reporting period. Water supply and Sewerage network assets Water supply and Sewerage network assets are valued using the cost approach but are disclosed at fair value in the notes. These assets typically include mains/conduits, pumping stations, reservoirs.
The key unobservable inputs to the valuation are the remaining useful life, condition and remaining value. Replacement costs were last compiled by Australis Advisory Group and are calculated by either applying recent actual project costs or by sourcing supplier component costs and then estimating project costs. The key reference industry document used is 2017 Australis Asset Advisory Group Valuation Report and data.
Mains are segmented into manageable lengths and uniform specifications.
When estimating project costs, consideration is given to project specifications, location, site conditions and construction techniques. Unit rates for water mains range from $16.25 to $443/m, for sewer mains from $18 to $912 and for water reservoirs from $20,250 to $769,500/unit.
Water supply and Sewerage network assets are indexed at each reporting period in accordance with the Rates Reference Manual issued by Crown Lands and Water. There has been no change to the valuation process during the reporting period. Non-current assets classified as ‘held for sale’ The value of Council land ‘held for sale’ is based on the valuation provided by the Valuer General’s Department.
There has been no change to the valuation process during the reporting period.
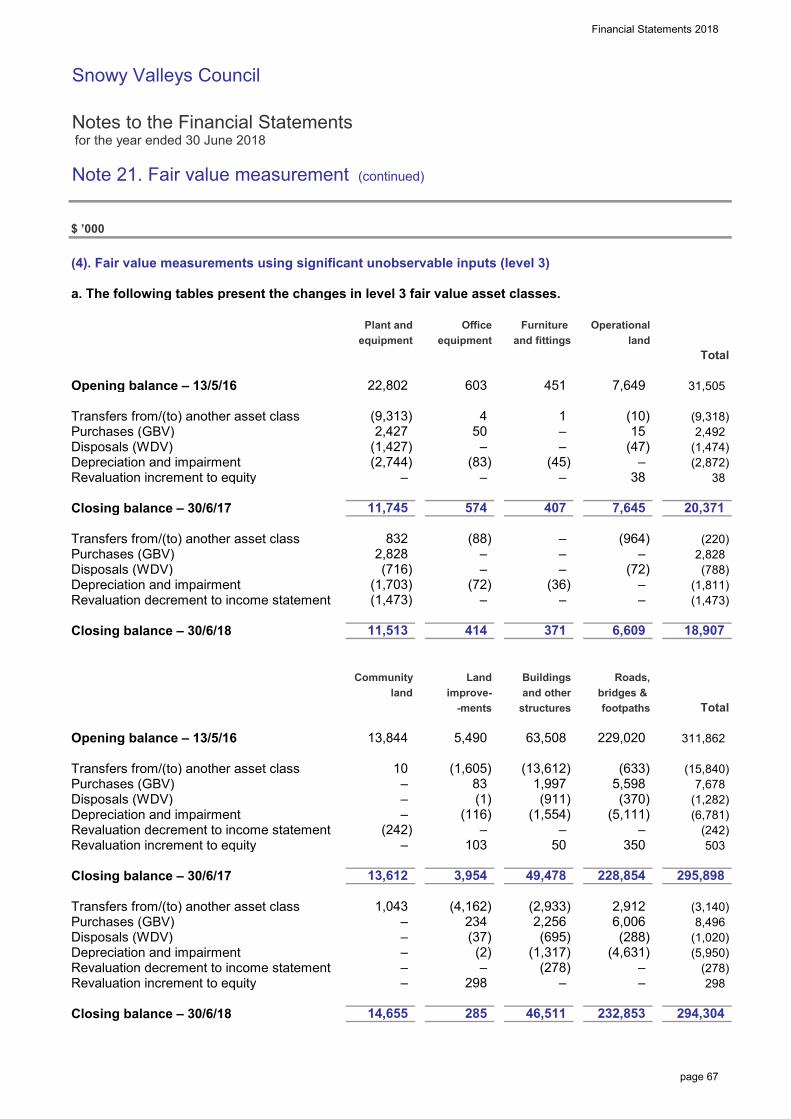
Financial Statements 2018
Snowy Valleys Council
Notes to the Financial Statements for the year ended 30 June 2018
Note 21. Fair value measurement (continued)
$ ’000
(4). Fair value measurements using significant unobservable inputs (level 3)
a. The following tables present the changes in level 3 fair value asset classes.
Opening balance – 13/5/16
Transfers from/(to) another asset classPurchases (GBV)Disposals (WDV)Depreciation and impairmentRevaluation increment to equity
Closing balance – 30/6/17
Transfers from/(to) another asset classPurchases (GBV)Disposals (WDV)Depreciation and impairmentRevaluation decrement to income statement
Closing balance – 30/6/18
Opening balance – 13/5/16
Transfers from/(to) another asset classPurchases (GBV)Disposals (WDV)Depreciation and impairmentRevaluation decrement to income statementRevaluation increment to equity
Closing balance – 30/6/17
Transfers from/(to) another asset classPurchases (GBV)Disposals (WDV)Depreciation and impairmentRevaluation decrement to income statementRevaluation increment to equity
Closing balance – 30/6/18
2,828
(4,631)
7,678
3,954
103
(1,282)
20,371
49,478
–
(1,811) (788)
(220)
229,020
(242)
Roads,
(1,605)
-ments
50
6,609
7,645
(1,473)
– (72) (36)
– –
574
414
2,828
–
–
6,006
– 350
(911)
– (278)
1,043
832 (88) – (964)
(2)
(15,840)
footpathsstructures
294,304
–
228,854 295,898
(4,162)
(37)
– – 298
(2,933)
– –
63,508
18,907 371
Land
(13,612)
(242)
298
(695) 234 8,496
(6,781)
1,997
(1,554)
– –
311,862 13,844 5,490
land and otherimprove-
(1,703)
11,513
–
285
2,256
–
(1)
13,612
– (370)
(288)
(5,111)
(1,473)
bridges &
83
15 2,492 (9,318)
232,853
(116)
(72)
–
10
– –
Buildings
11,745
– (47) (1,474) (2,744)
14,655
(716)
503
(278)
2,912
(5,950)
4 1
407
(3,140)
–
–
5,598
(2,872) –
(45)
603 451 7,649 31,505
land
Community
38
Plant and
(83)
Furniture
(1,427) – 50
(10)
Operational
– –
Total
(633)
(1,317)
–
(9,313)
– (1,020)
22,802
equipment and fittings
2,427
Total
38 –
Officeequipment
–
46,511
page 67
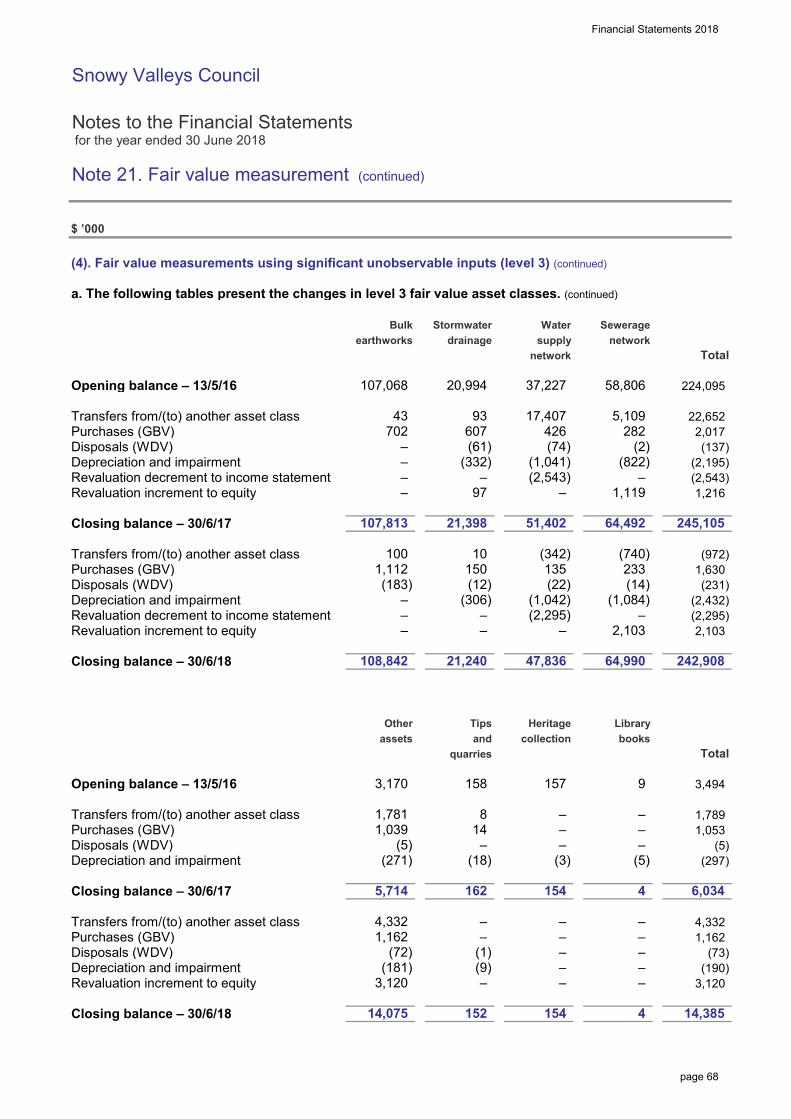
Financial Statements 2018
Snowy Valleys Council
Notes to the Financial Statements for the year ended 30 June 2018
Note 21. Fair value measurement (continued)
$ ’000
(4). Fair value measurements using significant unobservable inputs (level 3) (continued)
a. The following tables present the changes in level 3 fair value asset classes. (continued)
Opening balance – 13/5/16
Transfers from/(to) another asset classPurchases (GBV)Disposals (WDV)Depreciation and impairmentRevaluation decrement to income statementRevaluation increment to equity
Closing balance – 30/6/17
Transfers from/(to) another asset classPurchases (GBV)Disposals (WDV)Depreciation and impairmentRevaluation decrement to income statementRevaluation increment to equity
Closing balance – 30/6/18
Opening balance – 13/5/16
Transfers from/(to) another asset classPurchases (GBV)Disposals (WDV)Depreciation and impairment
Closing balance – 30/6/17
Transfers from/(to) another asset classPurchases (GBV)Disposals (WDV)Depreciation and impairmentRevaluation increment to equity
Closing balance – 30/6/18
157 9
152 154
(73) (9) –
Other
–
1,781 8 – – 1,789
242,908
(5)
– –
1,053
(190) –
– – (181)
154
– 2,103
14 –
1,162 –
collection
3,120
1,162
– –
(22) (14) (183)
Total
233
3,494
10
–
47,836
1,039
(297)
quarries
–
3,120 –
–
162
158
booksHeritage
3,170
(5)
Library
–
245,105 107,813
1,119
(3) (5)
135 (342)
(231)
(2,295) –
(2,295)
(12) –
assets and
108,842
64,492
– (2,543)
(74)
–
1,630 1,112 150 (740)
(306) (1,042) (1,084)
21,398
(972)
97
Tips
(2,432) –
–
21,240 64,990
100
2,103
4
Water
– 607
(2)
–
(137)
1,216
426
224,095
– (332)
22,652
networkearthworks
282 (61)
(822)
93 5,109
Stormwater
43 17,407
–
107,068
(72)
37,227
network
702
(2,543)
20,994
4,332 – –
(271) (18)
5,714
–
drainage
51,402
(1,041)
2,017
Sewerage
Total
(2,195)
Bulk
14,385 4 14,075
4,332
(1)
6,034
58,806
supply
–
–
page 68
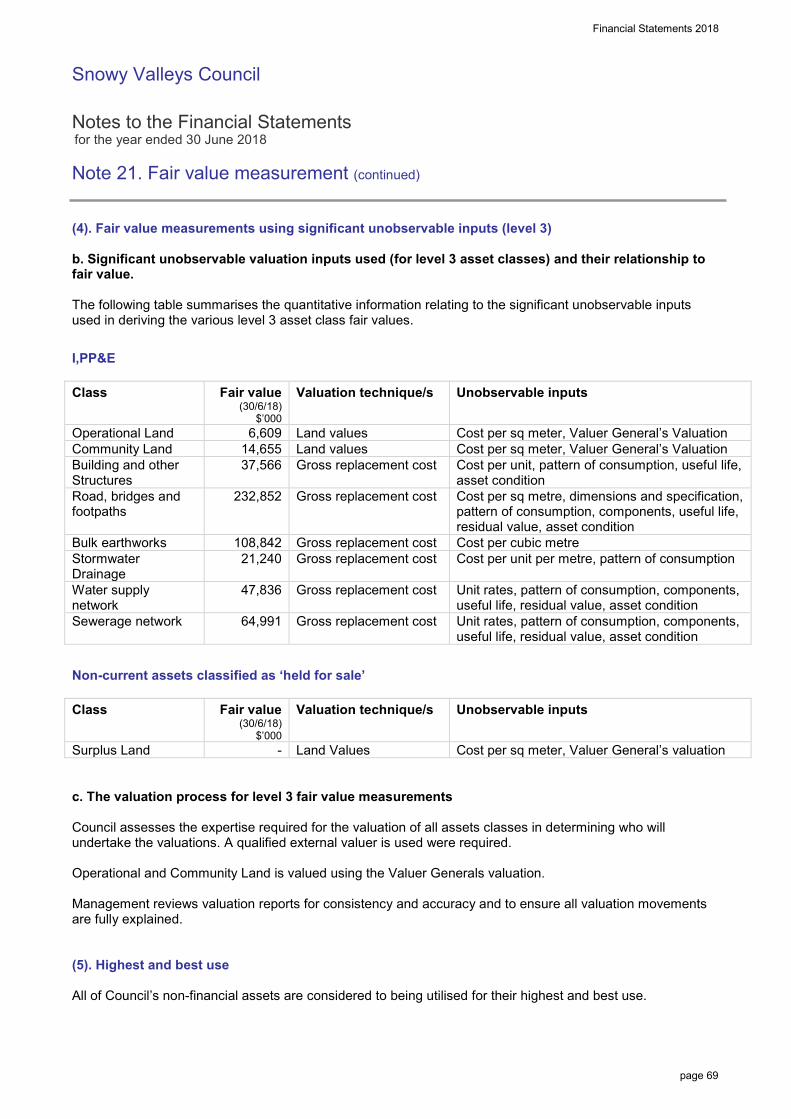
Financial Statements 2018
Snowy Valleys Council Notes to the Financial Statements for the year ended 30 June 2018 Note 21. Fair value measurement (continued)
page 69
(4). Fair value measurements using significant unobservable inputs (level 3) b. Significant unobservable valuation inputs used (for level 3 asset classes) and their relationship to fair value. The following table summarises the quantitative information relating to the significant unobservable inputs used in deriving the various level 3 asset class fair values. I,PP&E
Class
Fair value (30/6/18)
$’000
Valuation technique/s
Unobservable inputs
Operational Land 6,609 Land values Cost per sq meter, Valuer General’s Valuation Community Land 14,655 Land values Cost per sq meter, Valuer General’s Valuation Building and other Structures
37,566
Gross replacement cost Cost per unit, pattern of consumption, useful life, asset condition
Road, bridges and footpaths
232,852 Gross replacement cost Cost per sq metre, dimensions and specification, pattern of consumption, components, useful life, residual value, asset condition
Bulk earthworks 108,842 Gross replacement cost Cost per cubic metre Stormwater Drainage
21,240 Gross replacement cost Cost per unit per metre, pattern of consumption
Water supply network
47,836 Gross replacement cost Unit rates, pattern of consumption, components, useful life, residual value, asset condition
Sewerage network 64,991 Gross replacement cost Unit rates, pattern of consumption, components, useful life, residual value, asset condition
Non-current assets classified as ‘held for sale’
Class
Fair value (30/6/18)
$’000
Valuation technique/s
Unobservable inputs
Surplus Land - Land Values Cost per sq meter, Valuer General’s valuation c. The valuation process for level 3 fair value measurements Council assesses the expertise required for the valuation of all assets classes in determining who will undertake the valuations. A qualified external valuer is used were required. Operational and Community Land is valued using the Valuer Generals valuation. Management reviews valuation reports for consistency and accuracy and to ensure all valuation movements are fully explained. (5). Highest and best use All of Council’s non-financial assets are considered to being utilised for their highest and best use.
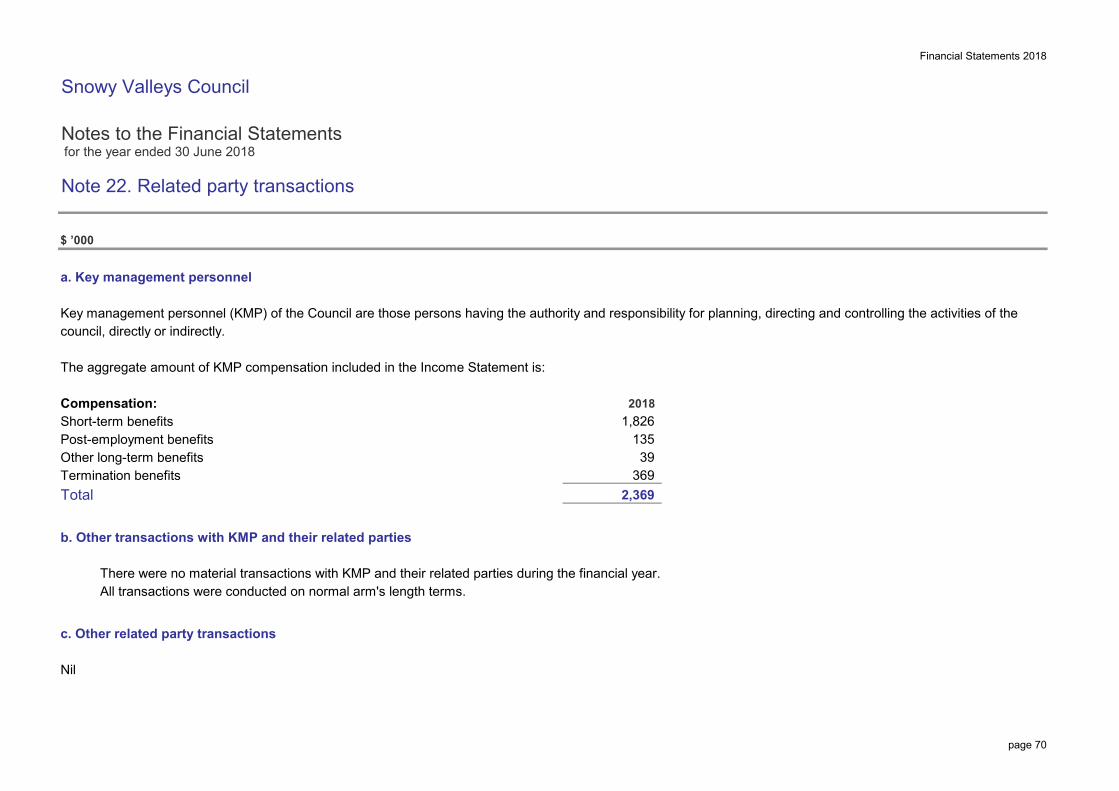
Financial Statements 2018
Snowy Valleys Council
Notes to the Financial Statements for the year ended 30 June 2018
Note 22. Related party transactions
$ ’000
a. Key management personnel
Key management personnel (KMP) of the Council are those persons having the authority and responsibility for planning, directing and controlling the activities of thecouncil, directly or indirectly.
The aggregate amount of KMP compensation included in the Income Statement is:
Compensation:Short-term benefitsPost-employment benefitsOther long-term benefitsTermination benefitsTotal
b. Other transactions with KMP and their related parties
c. Other related party transactions
Nil
20181,826
135 39
2017
–
There were no material transactions with KMP and their related parties during the financial year.All transactions were conducted on normal arm's length terms.
369 2,369
X11A0T
page 70
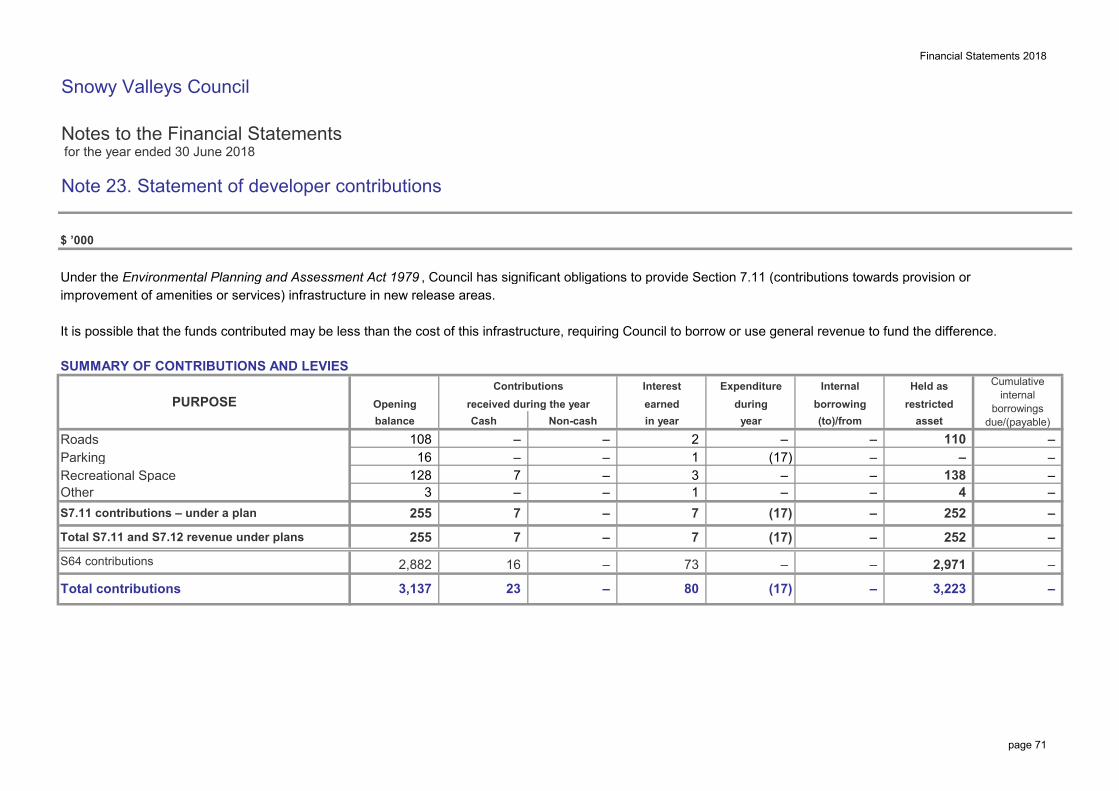
Financial Statements 2018
Snowy Valleys Council
Notes to the Financial Statements for the year ended 30 June 2018
Note 23. Statement of developer contributions
$ ’000
Under the Environmental Planning and Assessment Act 1979 , Council has significant obligations to provide Section 7.11 (contributions towards provision orimprovement of amenities or services) infrastructure in new release areas.
It is possible that the funds contributed may be less than the cost of this infrastructure, requiring Council to borrow or use general revenue to fund the difference.
SUMMARY OF CONTRIBUTIONS AND LEVIES
RoadsParkingRecreational SpaceOther
Cumulative internal
borrowings due/(payable)
– – – – –
–
–
–
128
(17)
7
73
2 –
–
–
Non-cash
1 – 7 255
3
Total contributions
S7.11 contributions – under a plan
PURPOSE Openingbalance
– –
earned
16
Contributionsreceived during the year
Interest
(17)
yearCash
3,137
2,882
7
16
255
(17)
–
108
– –
3
–
assetin year
–
2,971
–
(17) 7
80
252
252
–
3,223
–
–
–
–
Held as
–
Internal
1
Expenditureborrowing
–
restricted(to)/from
138
during
– 110
S64 contributions
Total S7.11 and S7.12 revenue under plans
7
–
– 23
– 4 –
X12A0T
page 71

Financial Statements 2018
Snowy Valleys Council
Notes to the Financial Statements for the year ended 30 June 2018
Note 23. Statement of developer contributions (continued)
$ ’000
S7.11 CONTRIBUTIONS – UNDER A PLAN
CONTRIBUTION PLAN NUMBER (former Tumut)
RoadsParkingRecreational SpaceOther
Cumulative internal
borrowings due/(payable)
– –
– – –
Contributions
balancePURPOSE earned
–
(to)/from
– –
Opening
–
received during the yearExpenditure
3
borrowing
2
Interest
in year
– –
110 (17)
138
yearduring
128
255 Total –
Non-cash
108 Cash
7
7 –
–
– – 16 1
(17) 4 1 3 –
7 –
252
assetrestricted
–
Internal
–
–
Held as
–
page 72
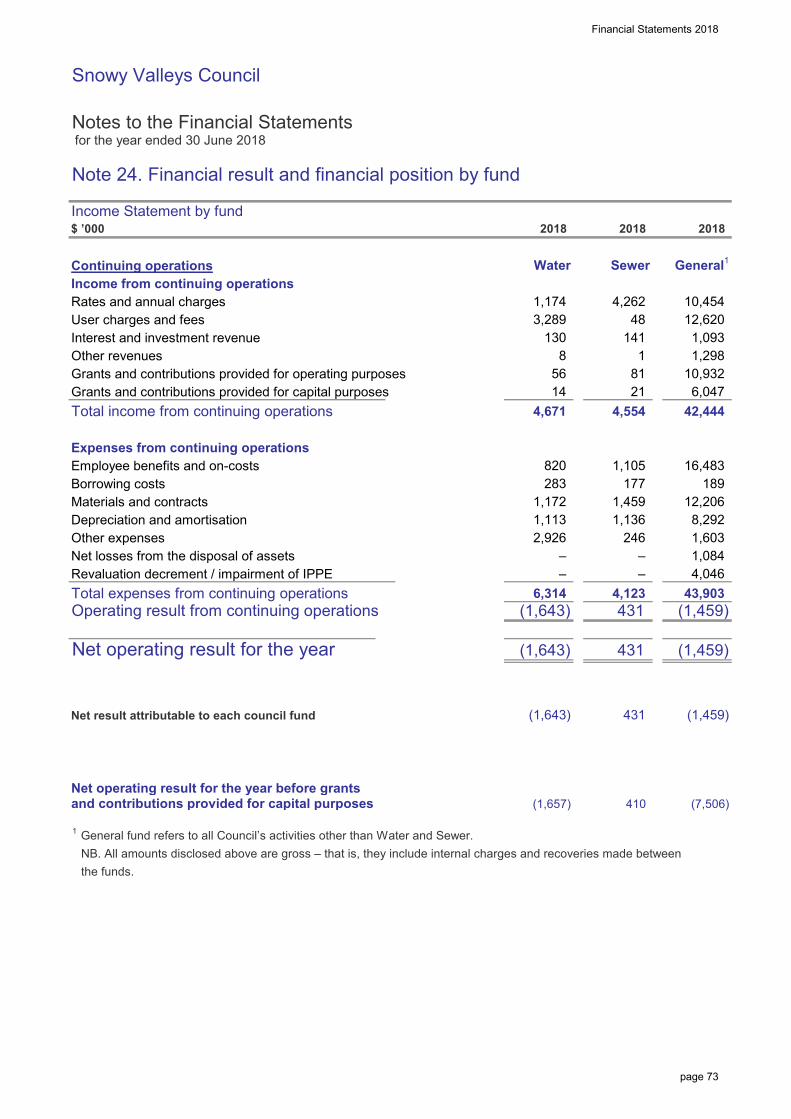
Financial Statements 2018
Snowy Valleys Council
Notes to the Financial Statements for the year ended 30 June 2018
Note 24. Financial result and financial position by fund
Income Statement by fund$ ’000
Continuing operationsIncome from continuing operationsRates and annual chargesUser charges and feesInterest and investment revenueOther revenuesGrants and contributions provided for operating purposesGrants and contributions provided for capital purposesTotal income from continuing operations
Expenses from continuing operationsEmployee benefits and on-costsBorrowing costsMaterials and contractsDepreciation and amortisationOther expensesNet losses from the disposal of assetsRevaluation decrement / impairment of IPPETotal expenses from continuing operationsOperating result from continuing operations
Net operating result for the year
Net result attributable to each council fund
Net operating result for the year before grants and contr and contributions provided for capital purposes
1 General fund refers to all Council’s activities other than Water and Sewer. NB. All amounts disclosed above are gross – that is, they include internal charges and recoveries made between the funds.
431
431
(1,657)
1,459
–
1,084
–
4,671
– – 4,123
410
(1,643) 431
1,113
(1,459) (1,643)
–
– 4,046
–
42,444
– (1,643)
1,105 283
(1,459)
12,206
6,314
14
1,136
4,554
8,292 1,172
2,926 246 – –
(7,506)
81 56
820 189
43,903
21 6,047
1,603
16,483 177
(1,459)
2018 2018
130
10,454 48
1,093 3,289 12,620
2018
4,262
2018
141
General1SewerWater
1,174
1,298 1 8 10,932
X13A1T
page 73
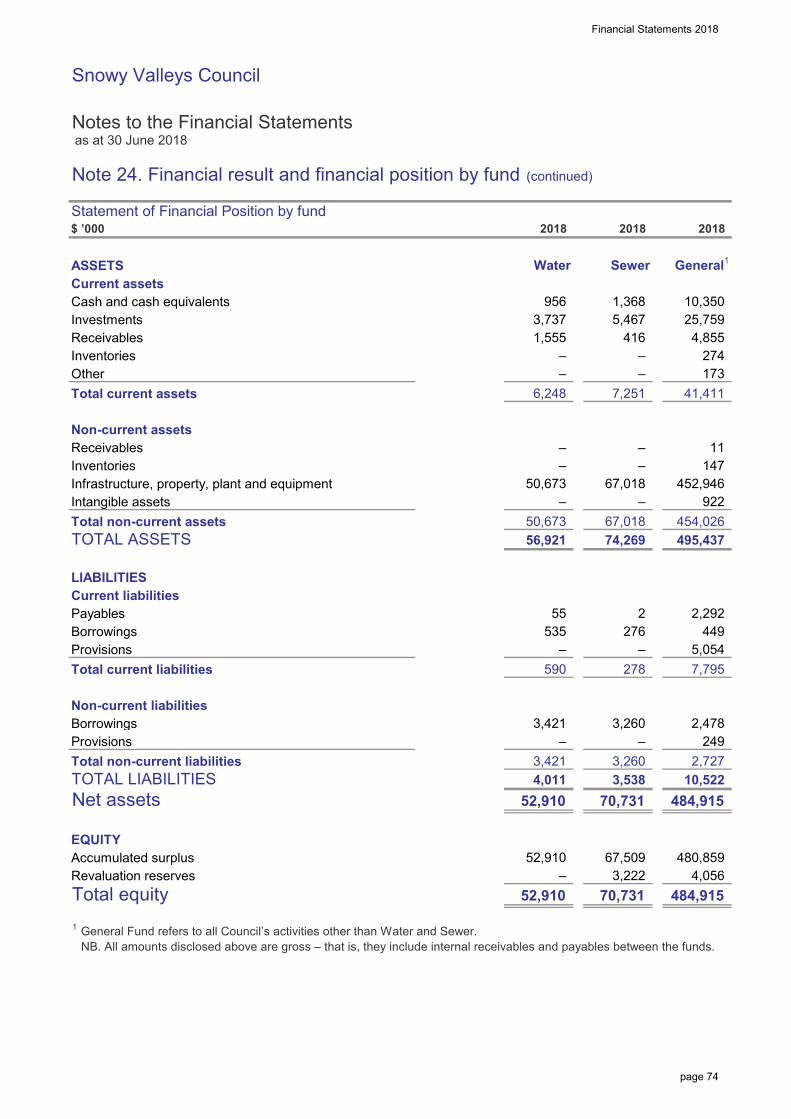
Financial Statements 2018
Snowy Valleys Council
Notes to the Financial Statements as at 30 June 2018
Note 24. Financial result and financial position by fund (continued)
Statement of Financial Position by fund$ ’000
ASSETSCurrent assetsCash and cash equivalentsInvestmentsReceivablesInventoriesOtherTotal current assets
Non-current assetsReceivablesInventoriesInfrastructure, property, plant and equipmentIntangible assetsTotal non-current assetsTOTAL ASSETS
LIABILITIESCurrent liabilitiesPayablesBorrowingsProvisionsTotal current liabilities
Non-current liabilitiesBorrowingsProvisionsTotal non-current liabilitiesTOTAL LIABILITIESNet assets
EQUITYAccumulated surplusRevaluation reservesTotal equity1 General Fund refers to all Council’s activities other than Water and Sewer. NB. All amounts disclosed above are gross – that is, they include internal receivables and payables between the funds.
249
480,859 67,509
–
–
922
2018
–
1,368 3,737 5,467 1,555 416
173
4,056
7,795
52,910
484,915
–
3,538
41,411
0
6,248 –
2018
956
Sewer
2018
Water
25,759 4,855
General1
10,350
2018
2,478
–
452,946
11 147 –
– 535 449
5,054
2,292
454,026
50,673 – –
67,018
276
67,018
–
7,251
– –
274
–
2
74,269
3,421
4,011 2,727 3,260
10,522 52,910
70,731 484,915
56,921
55
70,731
495,437
52,910
– –
–
3,222
3,260 –
590 278
3,421
–
–
50,673 – –
–
page 74
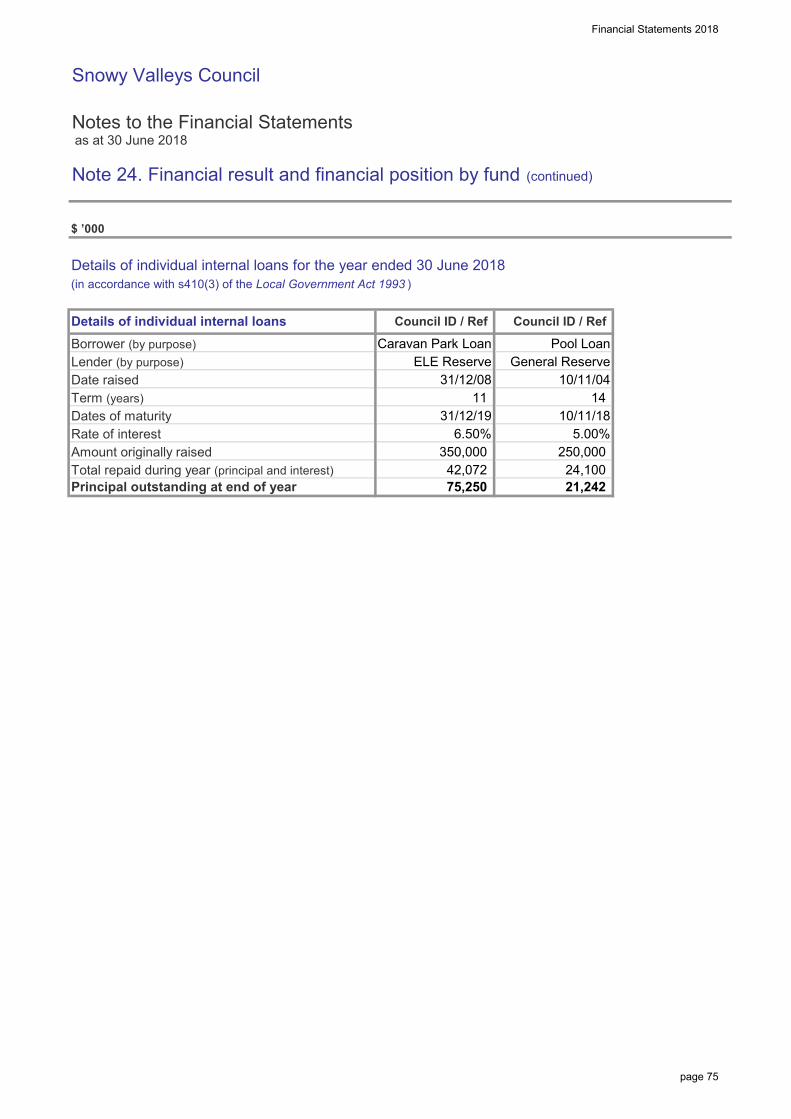
Financial Statements 2018
Snowy Valleys Council
Notes to the Financial Statements as at 30 June 2018
Note 24. Financial result and financial position by fund (continued)
$ ’000
Details of individual internal loans for the year ended 30 June 2018(in accordance with s410(3) of the Local Government Act 1993 )
Borrower (by purpose)Lender (by purpose)Date raisedTerm (years)Dates of maturityRate of interestAmount originally raisedTotal repaid during year (principal and interest)Principal outstanding at end of year
Details of individual internal loans Council ID / Ref Council ID / Ref Council ID / RefCaravan Park Loan Pool Loan
ELE Reserve General Reserve
5.00%250,000 24,100
75,250 21,242
31/12/19 10/11/186.50%
350,000 42,072
31/12/08 10/11/0411 14
page 75
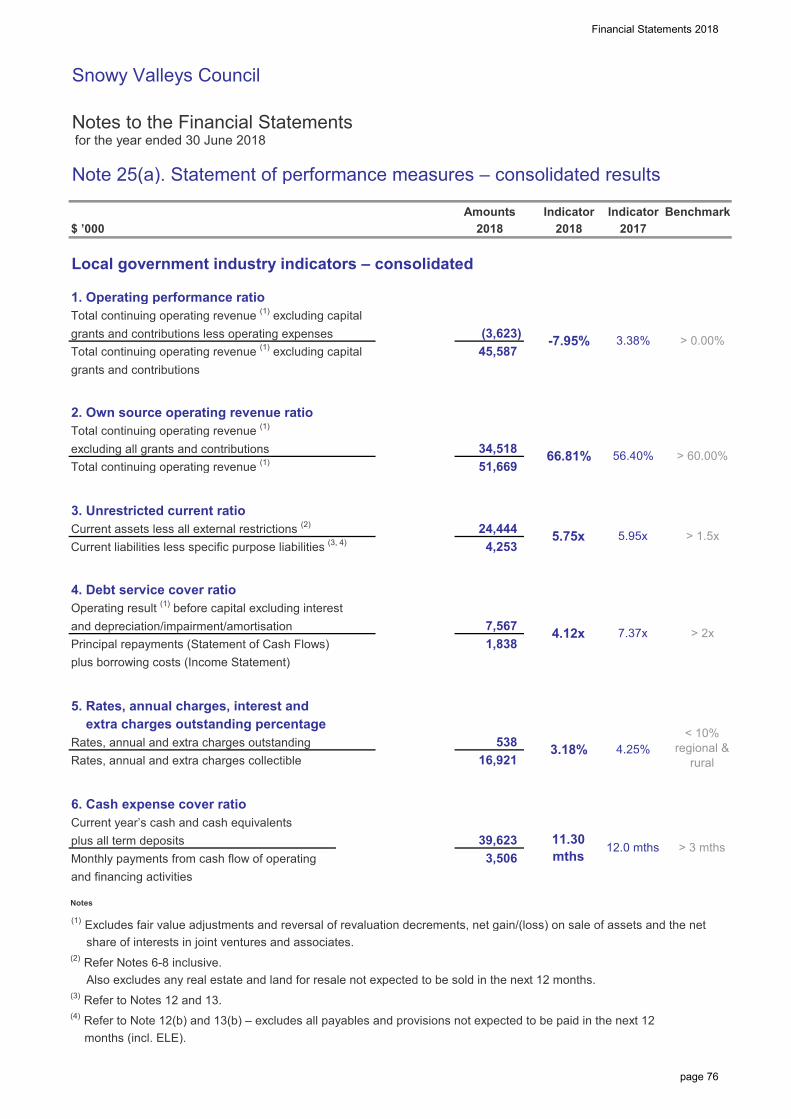
Financial Statements 2018
Snowy Valleys Council
Notes to the Financial Statements for the year ended 30 June 2018
Note 25(a). Statement of performance measures – consolidated results
$ ’000
Local government industry indicators – consolidated
1. Operating performance ratioTotal continuing operating revenue (1) excluding capitalgrants and contributions less operating expensesTotal continuing operating revenue (1) excluding capitalgrants and contributions
2. Own source operating revenue ratioTotal continuing operating revenue (1)
excluding all grants and contributionsTotal continuing operating revenue (1)
3. Unrestricted current ratioCurrent assets less all external restrictions (2)
Current liabilities less specific purpose liabilities (3, 4)
4. Debt service cover ratioOperating result (1) before capital excluding interestand depreciation/impairment/amortisationPrincipal repayments (Statement of Cash Flows)plus borrowing costs (Income Statement)
5. Rates, annual charges, interest and extra charges outstanding percentageRates, annual and extra charges outstandingRates, annual and extra charges collectible
6. Cash expense cover ratioCurrent year’s cash and cash equivalentsplus all term depositsMonthly payments from cash flow of operating and financing activities
Notes
(1) Excludes fair value adjustments and reversal of revaluation decrements, net gain/(loss) on sale of assets and the net share of interests in joint ventures and associates.(2) Refer Notes 6-8 inclusive. Also excludes any real estate and land for resale not expected to be sold in the next 12 months.(3) Refer to Notes 12 and 13.(4) Refer to Note 12(b) and 13(b) – excludes all payables and provisions not expected to be paid in the next 12 months (incl. ELE).
3,506
< 10% regional &
rural
538 3.18% 4.25%
1,838
45,587
34,518 66.81% 56.40% > 60.00%51,669
16,921
4.12x 7.37x > 2x
x12 39,623 11.30 mths 12.0 mths > 3 mths
5.75x 5.95x > 1.5x24,444
Amounts Indicator Benchmark
7,567
(3,623) -7.95% 3.38% > 0.00%
4,253
2018 2018 2017Indicator
X13A0T
page 76
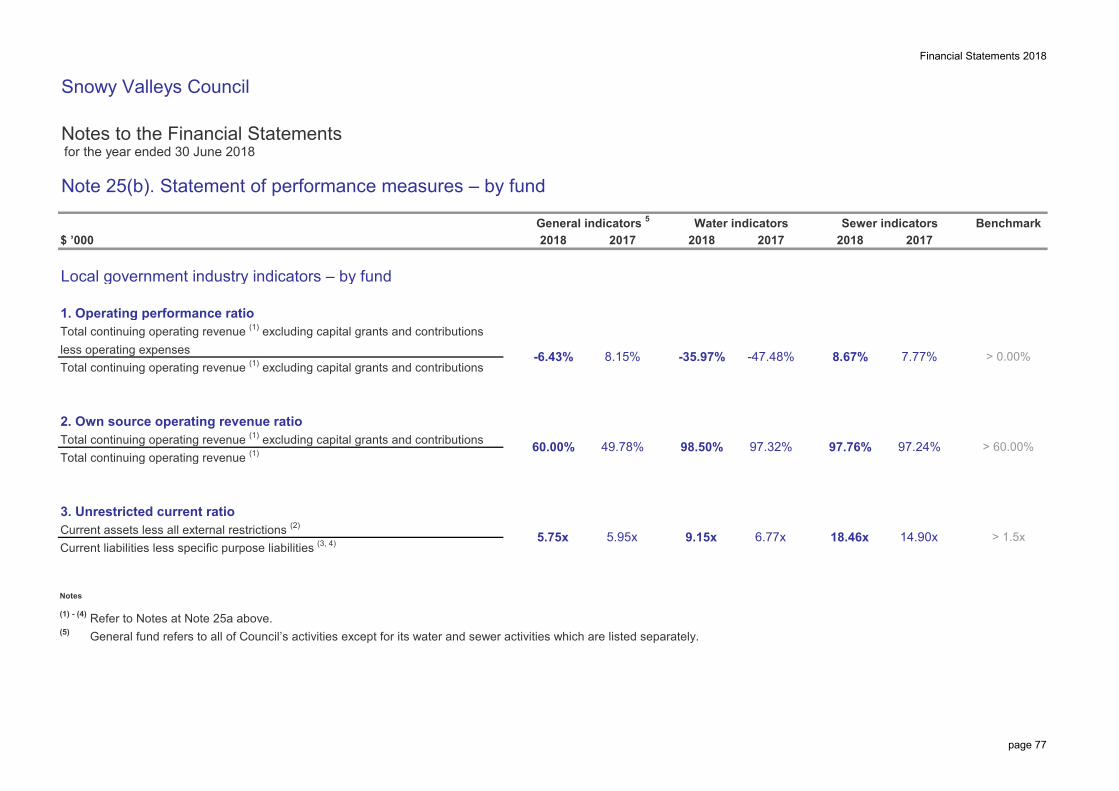
Financial Statements 2018
Snowy Valleys Council
Notes to the Financial Statements for the year ended 30 June 2018
Note 25(b). Statement of performance measures – by fund
$ ’000
Local government industry indicators – by fund
1. Operating performance ratioTotal continuing operating revenue (1) excluding capital grants and contributions less operating expensesTotal continuing operating revenue (1) excluding capital grants and contributions
2. Own source operating revenue ratioTotal continuing operating revenue (1) excluding capital grants and contributions Total continuing operating revenue (1)
3. Unrestricted current ratioCurrent assets less all external restrictions (2)
Current liabilities less specific purpose liabilities (3, 4)
Notes
(1) - (4) Refer to Notes at Note 25a above.(5) General fund refers to all of Council’s activities except for its water and sewer activities which are listed separately.
Benchmark
> 60.00%
> 0.00%
60.00%
5.75x
-6.43% 8.15% -35.97% -47.48% 8.67% 7.77%
2018 2018 20182017 2017
98.50% 97.32% 97.76% 97.24%
5.95x 14.90x18.46x9.15x
2017Water indicators Sewer indicatorsGeneral indicators 5
6.77x > 1.5x
49.78%
X14A0T
page 77
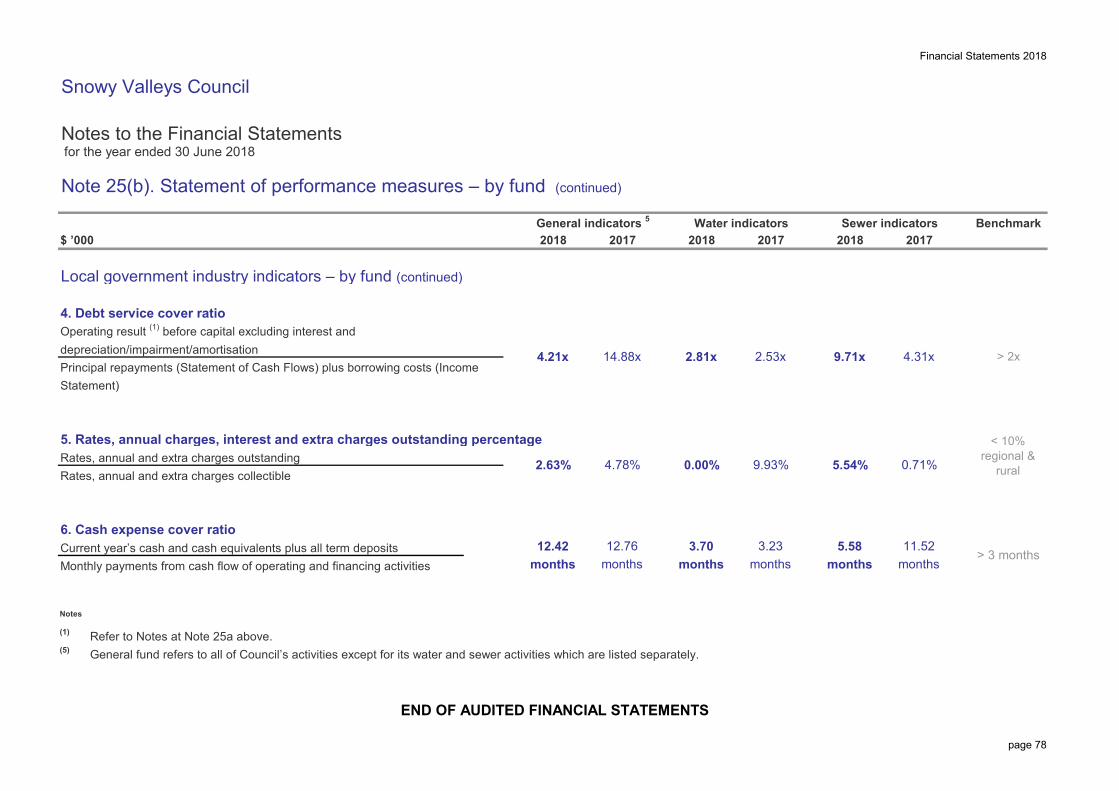
Financial Statements 2018
Snowy Valleys Council
Notes to the Financial Statements for the year ended 30 June 2018
Note 25(b). Statement of performance measures – by fund (continued)
$ ’000
Local government industry indicators – by fund (continued)
4. Debt service cover ratioOperating result (1) before capital excluding interest and depreciation/impairment/amortisationPrincipal repayments (Statement of Cash Flows) plus borrowing costs (IncomeStatement)
5. Rates, annual charges, interest and extra charges outstanding percentageRates, annual and extra charges outstandingRates, annual and extra charges collectible
6. Cash expense cover ratioCurrent year’s cash and cash equivalents plus all term depositsMonthly payments from cash flow of operating and financing activities
Notes
(1) Refer to Notes at Note 25a above.(5) General fund refers to all of Council’s activities except for its water and sewer activities which are listed separately.
4.21x
2.63%
14.88x 2.81x 2.53x 9.71x
11.52 months
2017
5.54% 0.71%0.00% 9.93%4.78%
General indicators 5 Water indicators Sewer indicators
4.31x
x12
Benchmark2018 2017 2018 2017
months months monthsmonths12.42 3.70 5.58 12.76 3.23
months
> 2x
> 3 months
END OF AUDITED FINANCIAL STATEMENTS
2018
< 10% regional &
rural
page 78
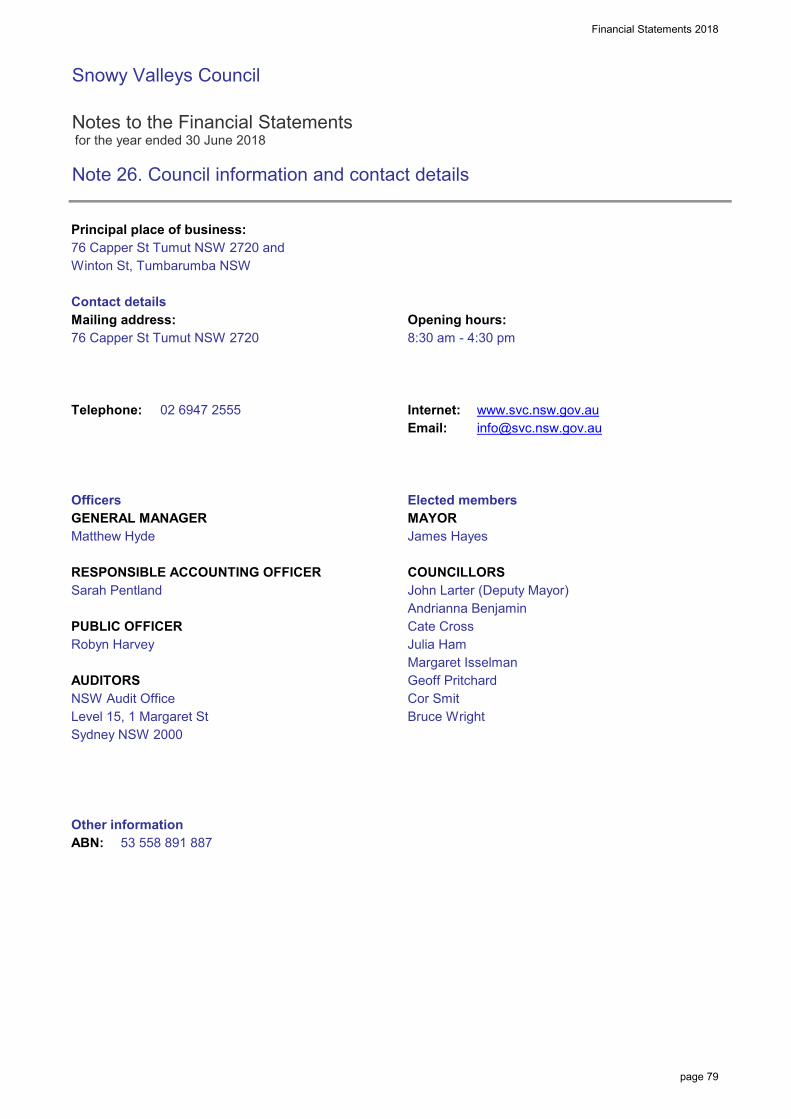
Financial Statements 2018
Snowy Valleys Council
Notes to the Financial Statements for the year ended 30 June 2018
Note 26. Council information and contact details
Principal place of business:76 Capper St Tumut NSW 2720 andWinton St, Tumbarumba NSW
Contact detailsMailing address: Opening hours:76 Capper St Tumut NSW 2720 8:30 am - 4:30 pm
Telephone: 02 6947 2555 Internet: www.svc.nsw.gov.auEmail: [email protected]
Officers Elected membersGENERAL MANAGER MAYORMatthew Hyde James Hayes
RESPONSIBLE ACCOUNTING OFFICER COUNCILLORSSarah Pentland John Larter (Deputy Mayor)
Andrianna BenjaminPUBLIC OFFICER Cate CrossRobyn Harvey Julia Ham
Margaret IsselmanAUDITORS Geoff PritchardNSW Audit Office Cor SmitLevel 15, 1 Margaret St Bruce WrightSydney NSW 2000
Other informationABN: 53 558 891 887
X15A0T
page 79
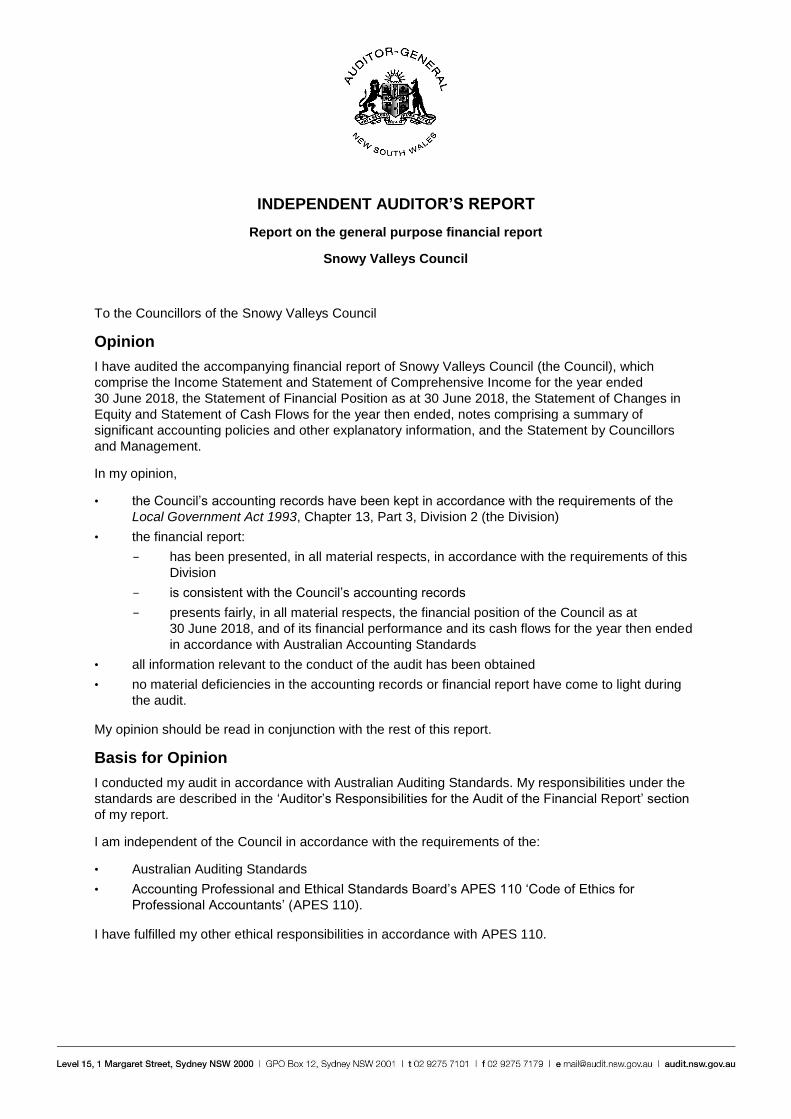
INDEPENDENT AUDITOR’S REPORT
Report on the general purpose financial report
Snowy Valleys Council
To the Councillors of the Snowy Valleys Council
Opinion
I have audited the accompanying financial report of Snowy Valleys Council (the Council), which
comprise the Income Statement and Statement of Comprehensive Income for the year ended
30 June 2018, the Statement of Financial Position as at 30 June 2018, the Statement of Changes in
Equity and Statement of Cash Flows for the year then ended, notes comprising a summary of
significant accounting policies and other explanatory information, and the Statement by Councillors
and Management.
In my opinion,
• the Council’s accounting records have been kept in accordance with the requirements of the
Local Government Act 1993, Chapter 13, Part 3, Division 2 (the Division)
• the financial report:
- has been presented, in all material respects, in accordance with the requirements of this
Division
- is consistent with the Council’s accounting records
- presents fairly, in all material respects, the financial position of the Council as at
30 June 2018, and of its financial performance and its cash flows for the year then ended
in accordance with Australian Accounting Standards
• all information relevant to the conduct of the audit has been obtained
• no material deficiencies in the accounting records or financial report have come to light during
the audit.
My opinion should be read in conjunction with the rest of this report.
Basis for Opinion
I conducted my audit in accordance with Australian Auditing Standards. My responsibilities under the
standards are described in the ‘Auditor’s Responsibilities for the Audit of the Financial Report’ section
of my report.
I am independent of the Council in accordance with the requirements of the:
• Australian Auditing Standards
• Accounting Professional and Ethical Standards Board’s APES 110 ‘Code of Ethics for
Professional Accountants’ (APES 110).
I have fulfilled my other ethical responsibilities in accordance with APES 110.
Parliament promotes independence by ensuring the Auditor-General and the Audit Office of
New South Wales are not compromised in their roles by:
• providing that only Parliament, and not the executive government, can remove an
Auditor-General
• mandating the Auditor-General as auditor of councils
• precluding the Auditor-General from providing non-audit services.
I believe the audit evidence I have obtained is sufficient and appropriate to provide a basis for my
audit opinion.
Other Information
Other information comprises the information included in the Council’s annual report for the year ended
30 June 2018, other than the financial report and my Independent Auditor’s Report thereon. The
Councillors are responsible for the other information. At the date of this Independent Auditor’s Report,
the other information I have received comprise the special purpose financial statements and Special
Schedules (the Schedules).
My opinion on the financial report does not cover the other information. Accordingly, I do not express
any form of assurance conclusion on the other information. However, as required by the Local
Government Act 1993, I have separately expressed an opinion on the special purpose financial
statements and Special Schedule 2 - Permissible income for general rates.
In connection with my audit of the financial report, my responsibility is to read the other information
and, in doing so, consider whether the other information is materially inconsistent with the financial
report or my knowledge obtained in the audit, or otherwise appears to be materially misstated.
If, based on the work I have performed, I conclude there is a material misstatement of the other
information, I must report that fact.
I have nothing to report in this regard.
The Councillors’ Responsibilities for the Financial Report
The Councillors are responsible for the preparation and fair presentation of the financial report in
accordance with Australian Accounting Standards and the Local Government Act 1993, and for such
internal control as the Councillors determine is necessary to enable the preparation and fair
presentation of the financial report that is free from material misstatement, whether due to fraud or
error.
In preparing the financial report, the Councillors are responsible for assessing the Council’s ability to
continue as a going concern, disclosing, as applicable, matters related to going concern and using the
going concern basis of accounting except where the Council will be dissolved or amalgamated by an
Act of Parliament, or otherwise cease operations.
Auditor’s Responsibilities for the Audit of the Financial Report
My objectives are to:
• obtain reasonable assurance about whether the financial report as a whole is free from material
misstatement, whether due to fraud or error
• issue an Independent Auditor’s Report including my opinion.
Reasonable assurance is a high level of assurance, but does not guarantee an audit conducted in
accordance with Australian Auditing Standards will always detect material misstatements.
Misstatements can arise from fraud or error. Misstatements are considered material if, individually or
in aggregate, they could reasonably be expected to influence the economic decisions users take
based on the financial report.
A description of my responsibilities for the audit of the financial report is located at the Auditing and
Assurance Standards Board website at: www.auasb.gov.au/auditors_responsibilities/ar4.pdf. The
description forms part of my auditor’s report.
My opinion does not provide assurance:
• that the Council carried out its activities effectively, efficiently and economically
• on the Original Budget information included in the Income Statement, Statement of Cash Flows,
and Note 20 Material budget variations
• on the Special Schedules. A separate opinion has been provided on Special Schedule 2 -
Permissible income for general rates
• about the security and controls over the electronic publication of the audited financial report on
any website where it may be presented
• about any other information which may have been hyperlinked to/from the financial report.
Lawrissa Chan
Director
30 November 2018
SYDNEY
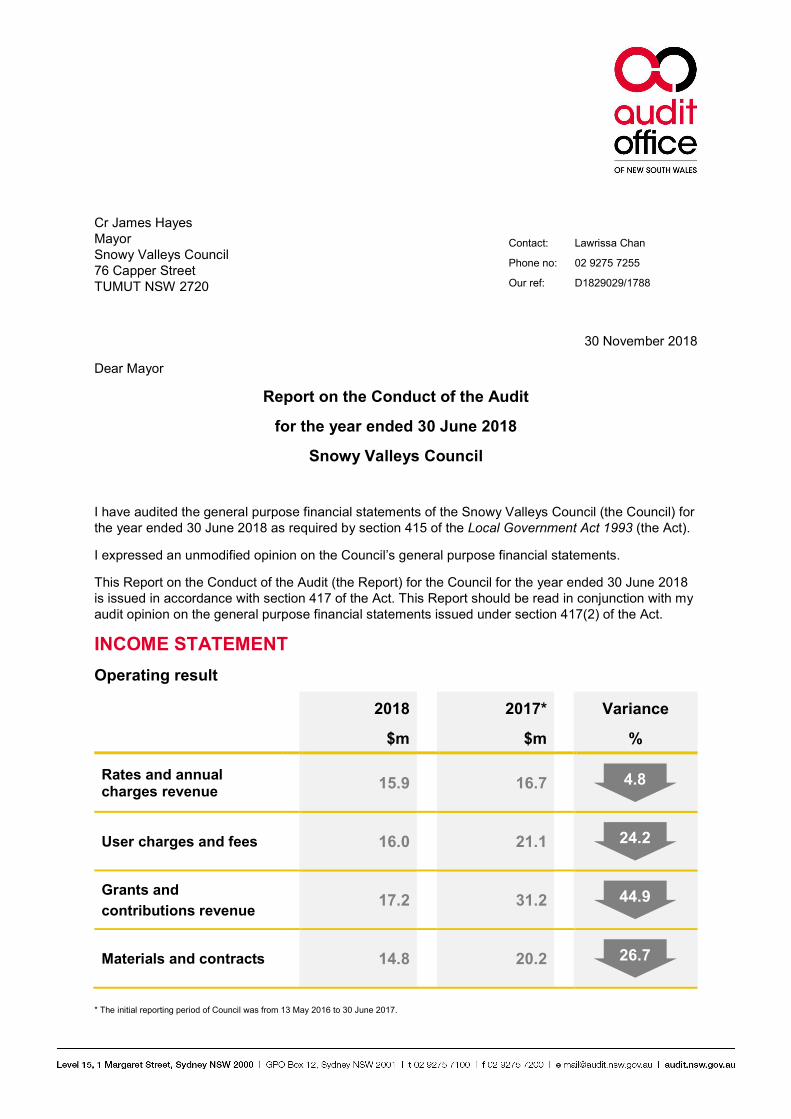
Cr James Hayes Mayor Snowy Valleys Council 76 Capper Street TUMUT NSW 2720
30 November 2018
Dear Mayor
Report on the Conduct of the Audit
for the year ended 30 June 2018
Snowy Valleys Council
I have audited the general purpose financial statements of the Snowy Valleys Council (the Council) for the year ended 30 June 2018 as required by section 415 of the Local Government Act 1993 (the Act).
I expressed an unmodified opinion on the Council’s general purpose financial statements.
This Report on the Conduct of the Audit (the Report) for the Council for the year ended 30 June 2018 is issued in accordance with section 417 of the Act. This Report should be read in conjunction with my audit opinion on the general purpose financial statements issued under section 417(2) of the Act.
INCOME STATEMENT
Operating result
2018 2017* Variance
$m $m %
Rates and annual charges revenue
15.9 16.7
User charges and fees 16.0 21.1
Grants and
contributions revenue 17.2 31.2
Materials and contracts 14.8 20.2
* The initial reporting period of Council was from 13 May 2016 to 30 June 2017.
4.8
24.2
44.9
26.7
Contact: Lawrissa Chan
Phone no: 02 9275 7255
Our ref: D1829029/1788
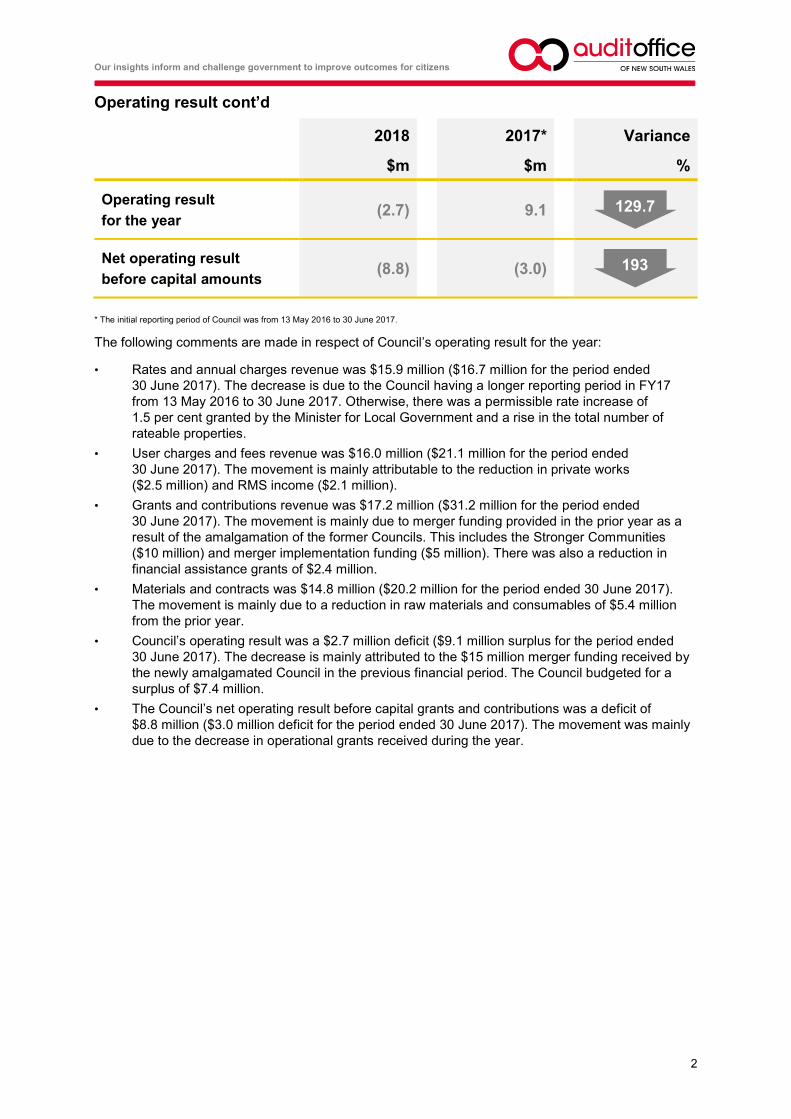
Our insights inform and challenge government to improve outcomes for citizens
2
Operating result cont’d
2018 2017* Variance
$m $m %
Operating result
for the year (2.7) 9.1
Net operating result
before capital amounts (8.8) (3.0)
* The initial reporting period of Council was from 13 May 2016 to 30 June 2017.
The following comments are made in respect of Council’s operating result for the year:
• Rates and annual charges revenue was $15.9 million ($16.7 million for the period ended 30 June 2017). The decrease is due to the Council having a longer reporting period in FY17 from 13 May 2016 to 30 June 2017. Otherwise, there was a permissible rate increase of 1.5 per cent granted by the Minister for Local Government and a rise in the total number of rateable properties.
• User charges and fees revenue was $16.0 million ($21.1 million for the period ended 30 June 2017). The movement is mainly attributable to the reduction in private works ($2.5 million) and RMS income ($2.1 million).
• Grants and contributions revenue was $17.2 million ($31.2 million for the period ended 30 June 2017). The movement is mainly due to merger funding provided in the prior year as a result of the amalgamation of the former Councils. This includes the Stronger Communities ($10 million) and merger implementation funding ($5 million). There was also a reduction in financial assistance grants of $2.4 million.
• Materials and contracts was $14.8 million ($20.2 million for the period ended 30 June 2017). The movement is mainly due to a reduction in raw materials and consumables of $5.4 million from the prior year.
• Council’s operating result was a $2.7 million deficit ($9.1 million surplus for the period ended 30 June 2017). The decrease is mainly attributed to the $15 million merger funding received by the newly amalgamated Council in the previous financial period. The Council budgeted for a surplus of $7.4 million.
• The Council’s net operating result before capital grants and contributions was a deficit of $8.8 million ($3.0 million deficit for the period ended 30 June 2017). The movement was mainly due to the decrease in operational grants received during the year.
129.7
193
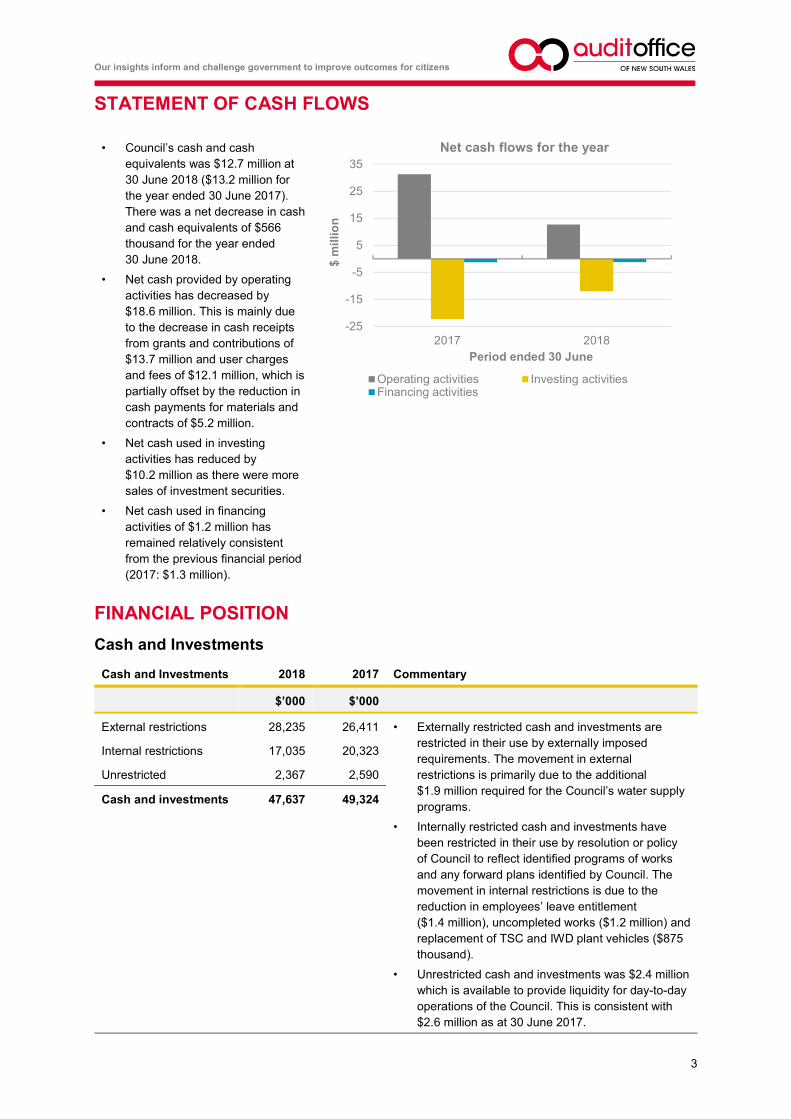
Our insights inform and challenge government to improve outcomes for citizens
3
STATEMENT OF CASH FLOWS
• Council’s cash and cash equivalents was $12.7 million at 30 June 2018 ($13.2 million for the year ended 30 June 2017). There was a net decrease in cash and cash equivalents of $566 thousand for the year ended 30 June 2018.
• Net cash provided by operating activities has decreased by $18.6 million. This is mainly due to the decrease in cash receipts from grants and contributions of $13.7 million and user charges and fees of $12.1 million, which is partially offset by the reduction in cash payments for materials and contracts of $5.2 million.
• Net cash used in investing activities has reduced by $10.2 million as there were more sales of investment securities.
• Net cash used in financing activities of $1.2 million has remained relatively consistent from the previous financial period (2017: $1.3 million).
FINANCIAL POSITION
Cash and Investments
Cash and Investments 2018 2017 Commentary
$’000 $’000
External restrictions 28,235 26,411 • Externally restricted cash and investments are restricted in their use by externally imposed requirements. The movement in external restrictions is primarily due to the additional $1.9 million required for the Council’s water supply programs.
• Internally restricted cash and investments have been restricted in their use by resolution or policy of Council to reflect identified programs of works and any forward plans identified by Council. The movement in internal restrictions is due to the reduction in employees’ leave entitlement ($1.4 million), uncompleted works ($1.2 million) and replacement of TSC and IWD plant vehicles ($875 thousand).
• Unrestricted cash and investments was $2.4 million which is available to provide liquidity for day-to-day operations of the Council. This is consistent with $2.6 million as at 30 June 2017.
Internal restrictions 17,035 20,323
Unrestricted 2,367 2,590
Cash and investments 47,637 49,324
-25
-15
-5
5
15
25
35
2017 2018$
mil
lio
n
Period ended 30 June
Net cash flows for the year
Operating activities Investing activitiesFinancing activities
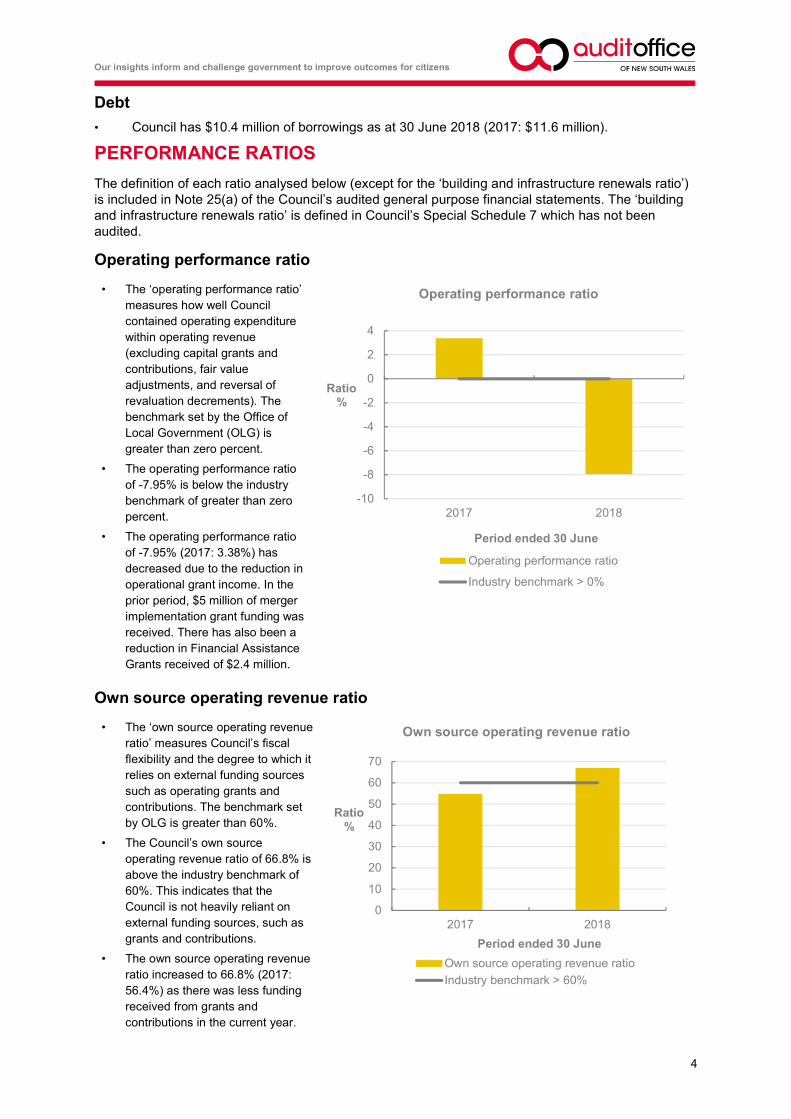
Our insights inform and challenge government to improve outcomes for citizens
4
Debt
• Council has $10.4 million of borrowings as at 30 June 2018 (2017: $11.6 million).
PERFORMANCE RATIOS
The definition of each ratio analysed below (except for the ‘building and infrastructure renewals ratio’) is included in Note 25(a) of the Council’s audited general purpose financial statements. The ‘building and infrastructure renewals ratio’ is defined in Council’s Special Schedule 7 which has not been audited.
Operating performance ratio
• The ‘operating performance ratio’ measures how well Council contained operating expenditure within operating revenue (excluding capital grants and contributions, fair value adjustments, and reversal of revaluation decrements). The benchmark set by the Office of Local Government (OLG) is greater than zero percent.
• The operating performance ratio of -7.95% is below the industry benchmark of greater than zero percent.
• The operating performance ratio of -7.95% (2017: 3.38%) has decreased due to the reduction in operational grant income. In the prior period, $5 million of merger implementation grant funding was received. There has also been a reduction in Financial Assistance Grants received of $2.4 million.
Own source operating revenue ratio
• The ‘own source operating revenue ratio’ measures Council’s fiscal flexibility and the degree to which it relies on external funding sources such as operating grants and contributions. The benchmark set by OLG is greater than 60%.
• The Council’s own source operating revenue ratio of 66.8% is above the industry benchmark of 60%. This indicates that the Council is not heavily reliant on external funding sources, such as grants and contributions.
• The own source operating revenue ratio increased to 66.8% (2017: 56.4%) as there was less funding received from grants and contributions in the current year.
-10
-8
-6
-4
-2
0
2
4
2017 2018
Ratio%
Period ended 30 June
Operating performance ratio
Operating performance ratio
Industry benchmark > 0%
0
10
20
30
40
50
60
70
2017 2018
Ratio%
Period ended 30 June
Own source operating revenue ratio
Own source operating revenue ratio
Industry benchmark > 60%
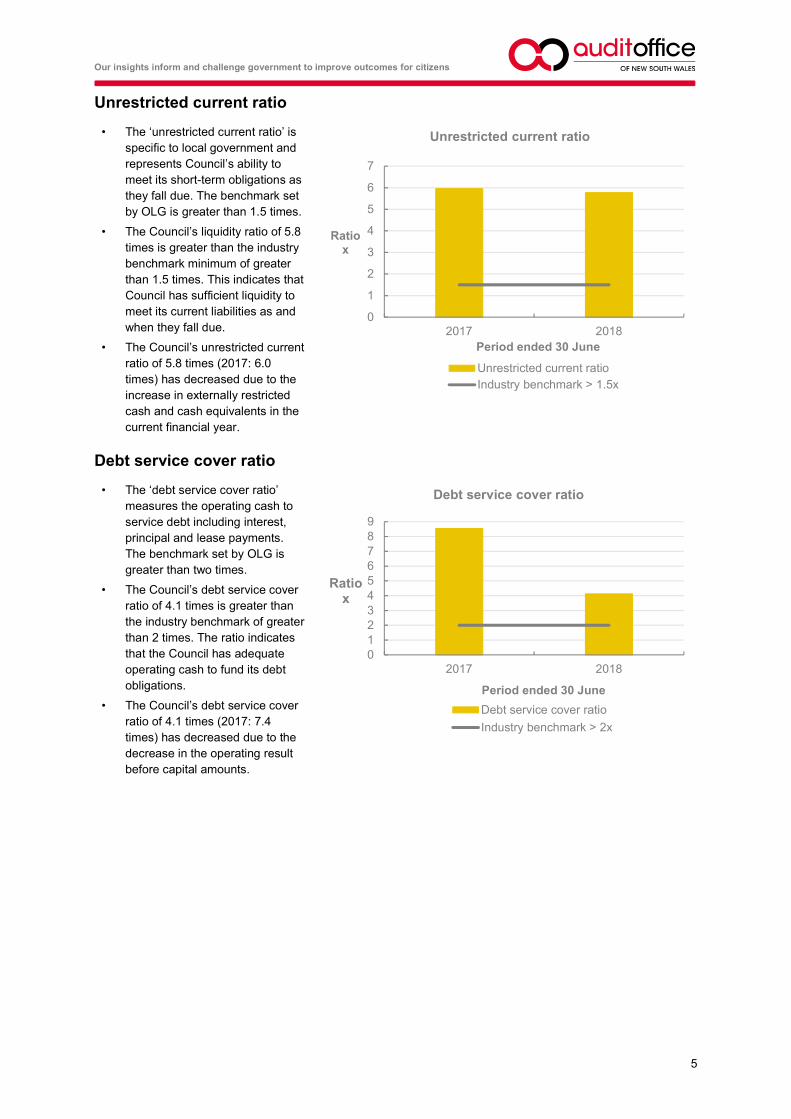
Our insights inform and challenge government to improve outcomes for citizens
5
Unrestricted current ratio
• The ‘unrestricted current ratio’ is specific to local government and represents Council’s ability to meet its short-term obligations as they fall due. The benchmark set by OLG is greater than 1.5 times.
• The Council’s liquidity ratio of 5.8 times is greater than the industry benchmark minimum of greater than 1.5 times. This indicates that Council has sufficient liquidity to meet its current liabilities as and when they fall due.
• The Council’s unrestricted current ratio of 5.8 times (2017: 6.0 times) has decreased due to the increase in externally restricted cash and cash equivalents in the current financial year.
Debt service cover ratio
• The ‘debt service cover ratio’ measures the operating cash to service debt including interest, principal and lease payments. The benchmark set by OLG is greater than two times.
• The Council’s debt service cover ratio of 4.1 times is greater than the industry benchmark of greater than 2 times. The ratio indicates that the Council has adequate operating cash to fund its debt obligations.
• The Council’s debt service cover ratio of 4.1 times (2017: 7.4 times) has decreased due to the decrease in the operating result before capital amounts.
0
1
2
3
4
5
6
7
2017 2018
Ratiox
Period ended 30 June
Unrestricted current ratio
Unrestricted current ratioIndustry benchmark > 1.5x
0123456789
2017 2018
Ratiox
Period ended 30 June
Debt service cover ratio
Debt service cover ratio
Industry benchmark > 2x
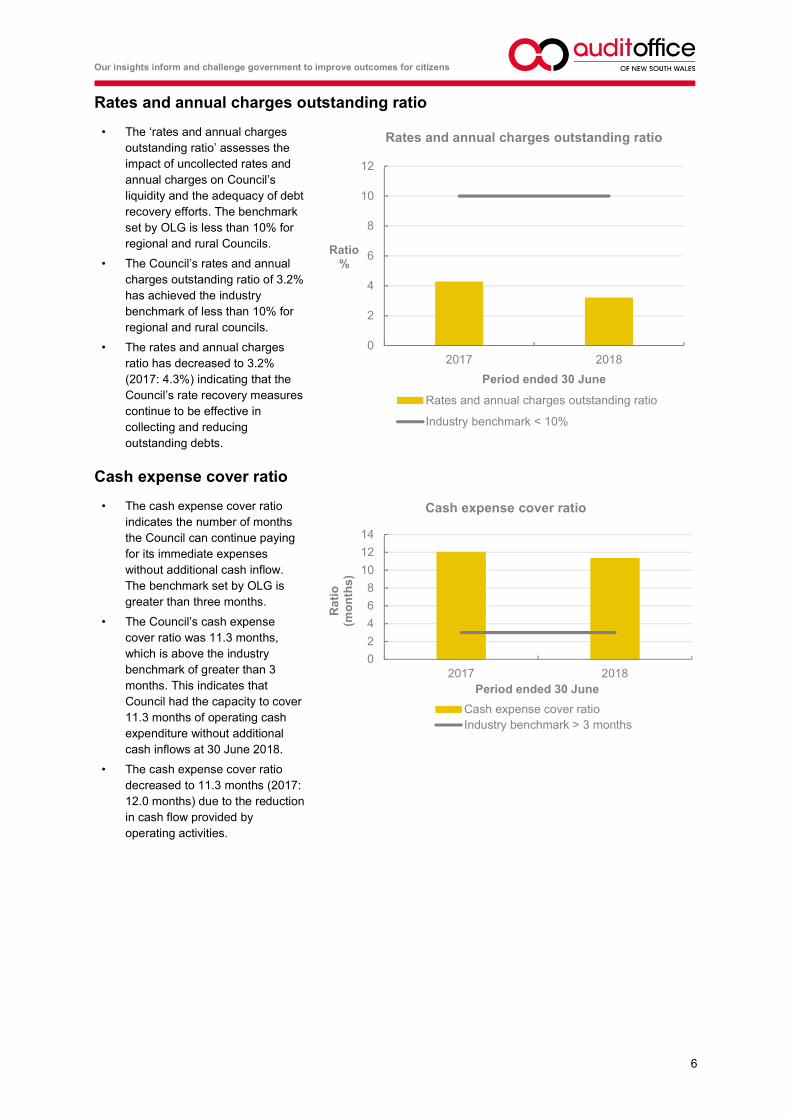
Our insights inform and challenge government to improve outcomes for citizens
6
Rates and annual charges outstanding ratio
• The ‘rates and annual charges outstanding ratio’ assesses the impact of uncollected rates and annual charges on Council’s liquidity and the adequacy of debt recovery efforts. The benchmark set by OLG is less than 10% for regional and rural Councils.
• The Council’s rates and annual charges outstanding ratio of 3.2% has achieved the industry benchmark of less than 10% for regional and rural councils.
• The rates and annual charges ratio has decreased to 3.2% (2017: 4.3%) indicating that the Council’s rate recovery measures continue to be effective in collecting and reducing outstanding debts.
Cash expense cover ratio
• The cash expense cover ratio indicates the number of months the Council can continue paying for its immediate expenses without additional cash inflow. The benchmark set by OLG is greater than three months.
• The Council’s cash expense cover ratio was 11.3 months, which is above the industry benchmark of greater than 3 months. This indicates that Council had the capacity to cover 11.3 months of operating cash expenditure without additional cash inflows at 30 June 2018.
• The cash expense cover ratio decreased to 11.3 months (2017: 12.0 months) due to the reduction in cash flow provided by operating activities.
0
2
4
6
8
10
12
2017 2018
Ratio%
Period ended 30 June
Rates and annual charges outstanding ratio
Rates and annual charges outstanding ratio
Industry benchmark < 10%
0
2
4
6
8
10
12
14
2017 2018
Ra
tio
(mo
nth
s)
Period ended 30 June
Cash expense cover ratio
Cash expense cover ratioIndustry benchmark > 3 months
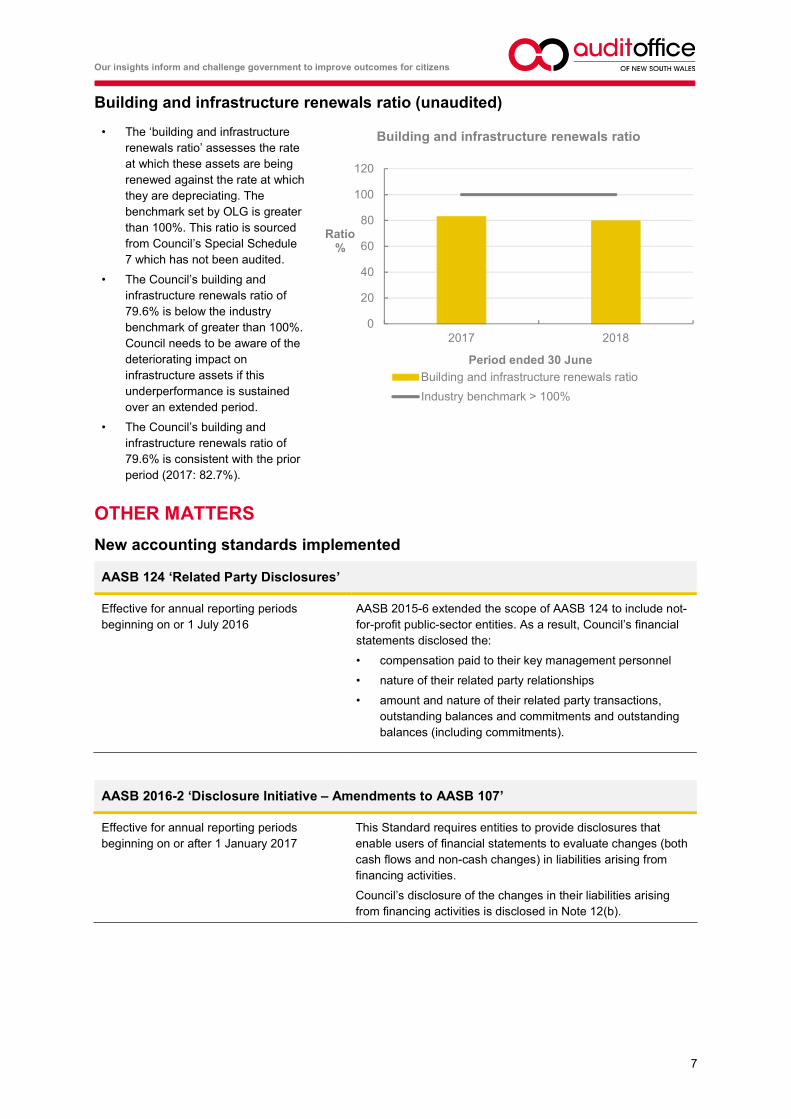
Our insights inform and challenge government to improve outcomes for citizens
7
Building and infrastructure renewals ratio (unaudited)
• The ‘building and infrastructure renewals ratio’ assesses the rate at which these assets are being renewed against the rate at which they are depreciating. The benchmark set by OLG is greater than 100%. This ratio is sourced from Council’s Special Schedule 7 which has not been audited.
• The Council’s building and infrastructure renewals ratio of 79.6% is below the industry benchmark of greater than 100%. Council needs to be aware of the deteriorating impact on infrastructure assets if this underperformance is sustained over an extended period.
• The Council’s building and infrastructure renewals ratio of 79.6% is consistent with the prior period (2017: 82.7%).
OTHER MATTERS
New accounting standards implemented
AASB 124 ‘Related Party Disclosures’
Effective for annual reporting periods beginning on or 1 July 2016
AASB 2015-6 extended the scope of AASB 124 to include not-for-profit public-sector entities. As a result, Council’s financial statements disclosed the:
• compensation paid to their key management personnel
• nature of their related party relationships
• amount and nature of their related party transactions, outstanding balances and commitments and outstanding balances (including commitments).
AASB 2016-2 ‘Disclosure Initiative – Amendments to AASB 107’
Effective for annual reporting periods beginning on or after 1 January 2017
This Standard requires entities to provide disclosures that enable users of financial statements to evaluate changes (both cash flows and non-cash changes) in liabilities arising from financing activities.
Council’s disclosure of the changes in their liabilities arising from financing activities is disclosed in Note 12(b).
0
20
40
60
80
100
120
2017 2018
Ratio%
Period ended 30 June
Building and infrastructure renewals ratio
Building and infrastructure renewals ratio
Industry benchmark > 100%

Our insights inform and challenge government to improve outcomes for citizens
8
AASB 2016-4 ‘Recoverable Amount of Non-Cash Generating Specialised Assets of Not-for-Profit Entities’ – Amendment to AASB 116 & 136
Effective for annual reporting periods beginning on or after 1 January 2017
This Standard no longer requires not-for-profit entities to consider AASB 136 Impairment of Assets for non-cash-generating specialised assets at fair value.
It is expected for not-for-profit entities holding non-cash-generating, the recoverable amount of these assets is expected to be materially the same as fair value, determined under AASB 113 Fair Value Measurement.
Legislative compliance
My audit procedures did not identify any instances of non-compliance with legislative requirements or a material deficiency in the Council’s accounting records or financial reports. The Council’s:
• accounting records were maintained in a manner and form to allow the general purpose financial statements to be prepared and effectively audited
• staff provided all accounting records and information relevant to the audit.
Lawrissa Chan Director, Financial Audit Services
cc: Matthew Hyde, General Manager Robyn Harvey, Director Internal Services David Maxwell, Audit, Risk and Improvement Committee Chair Tim Hurst, Chief Executive of the Office of Local Government

Snowy Valleys Council SPECIAL PURPOSE FINANCIAL STATEMENTS for the year ended 30 June 2018
Leading, engaging & supportingstrong & vibrant communities
SPFS 2018
Snowy Valleys Council
Special Purpose Financial Statements for the year ended 30 June 2018
Contents
1. Statement by Councillors and Management
2. Special Purpose Financial Statements:
Income Statement – Water Supply Business ActivityIncome Statement – Sewerage Business ActivityIncome Statement – Other Business Activities
Statement of Financial Position – Water Supply Business ActivityStatement of Financial Position – Sewerage Business ActivityStatement of Financial Position – Other Business Activities
3. Notes to the Special Purpose Financial Statements
4. Auditor’s Report
Background
These Special Purpose Financial Statements have been prepared for the use by both Council and the Office ofLocal Government in fulfilling their requirements under National Competition Policy.
The principle of competitive neutrality is based on the concept of a ‘level playing field’ between persons/entitiescompeting in a market place, particularly between private and public sector competitors.
Essentially, the principle is that government businesses, whether Commonwealth, state or local, should operatewithout net competitive advantages over other businesses as a result of their public ownership.
For Council, the principle of competitive neutrality and public reporting applies only to declared business activities.
These include (a) those activities classified by the Australian Bureau of Statistics as business activities beingwater supply, sewerage services, abattoirs, gas production and reticulation, and (b) those activities with a turnoverof more than $2 million that Council has formally declared as a business activity (defined as Category 1 activities).
In preparing these financial statements for Council’s self-classified Category 1 businesses and ABS-definedactivities, councils must (a) adopt a corporatisation model and (b) apply full cost attribution including tax-equivalentregime payments and debt guarantee fees (where the business benefits from Council's borrowing position bycomparison with commercial rates).
6
Page
345
2
(iv)
9
87
(i)
(ii)
19
(iii)
page 1
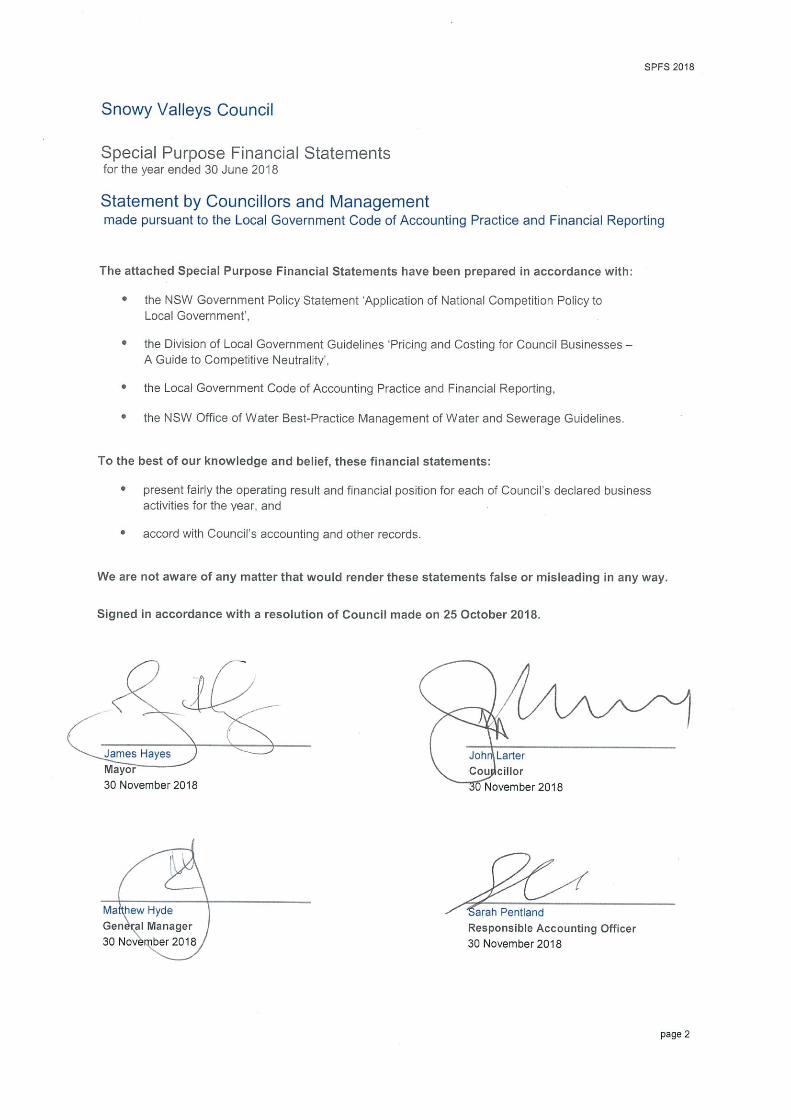
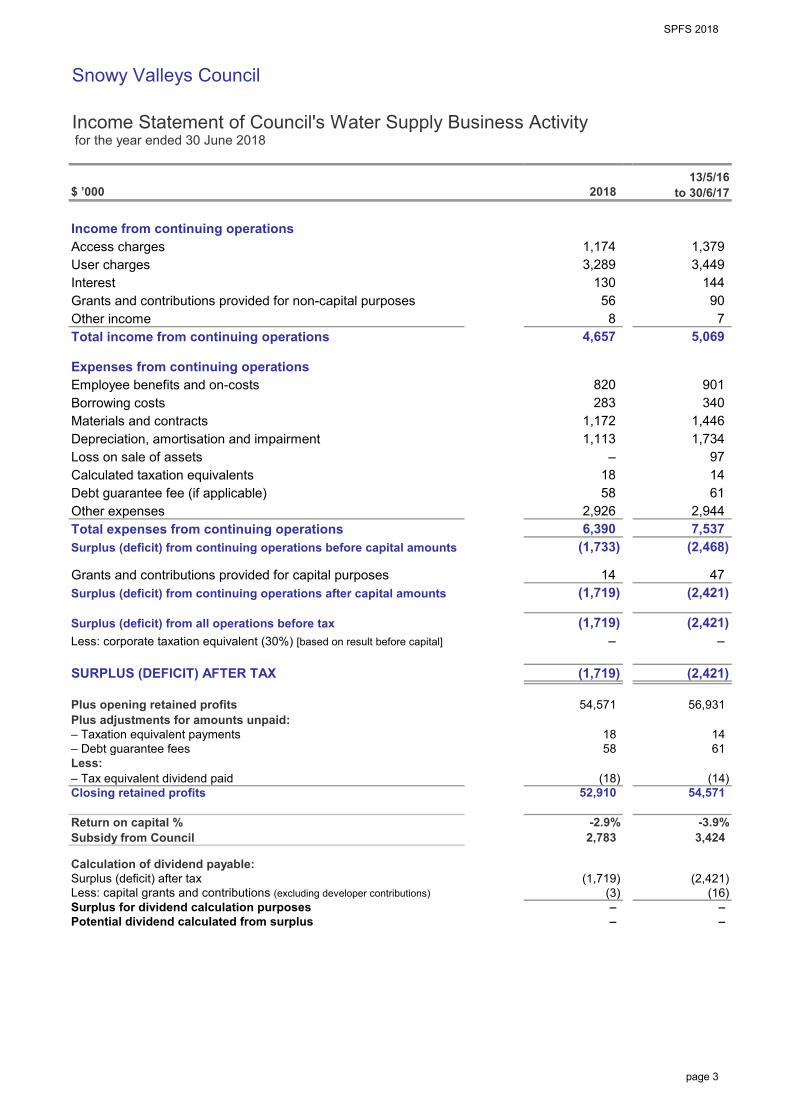
SPFS 2018
Snowy Valleys Council
Income Statement of Council's Water Supply Business Activity for the year ended 30 June 2018
$ ’000
Income from continuing operationsAccess chargesUser chargesInterestGrants and contributions provided for non-capital purposesOther incomeTotal income from continuing operations
Expenses from continuing operationsEmployee benefits and on-costsBorrowing costsMaterials and contractsDepreciation, amortisation and impairmentLoss on sale of assetsCalculated taxation equivalentsDebt guarantee fee (if applicable)Other expensesTotal expenses from continuing operationsSurplus (deficit) from continuing operations before capital amounts
Grants and contributions provided for capital purposesSurplus (deficit) from continuing operations after capital amounts
Surplus (deficit) from all operations before taxLess: corporate taxation equivalent (30%) [based on result before capital]
SURPLUS (DEFICIT) AFTER TAX
Plus opening retained profitsPlus adjustments for amounts unpaid:– Taxation equivalent payments– Debt guarantee feesLess:– Tax equivalent dividend paidClosing retained profits
Return on capital %Subsidy from Council
Calculation of dividend payable:Surplus (deficit) after taxLess: capital grants and contributions (excluding developer contributions)Surplus for dividend calculation purposesPotential dividend calculated from surplus
13/5/16to 30/6/17
(1,733)
14 (1,719)
(1,719) –
– –
2018
(18) 52,910
-2.9%2,783
1,174 3,289
130 56 8
4,657
820 283
1,172 1,113
(1,719)
54,571
(1,719) (3)
(2,421) (16)
–
– 18 58
2,926 6,390
18 58
(14) 54,571
-3.9%3,424
–
61 2,944 7,537
(2,468)
47 (2,421)
(2,421) –
(2,421)
56,931
14 61
1,379 3,449
144 90 7
5,069
901 340
1,446 1,734
97 14
X3A0T
page 3
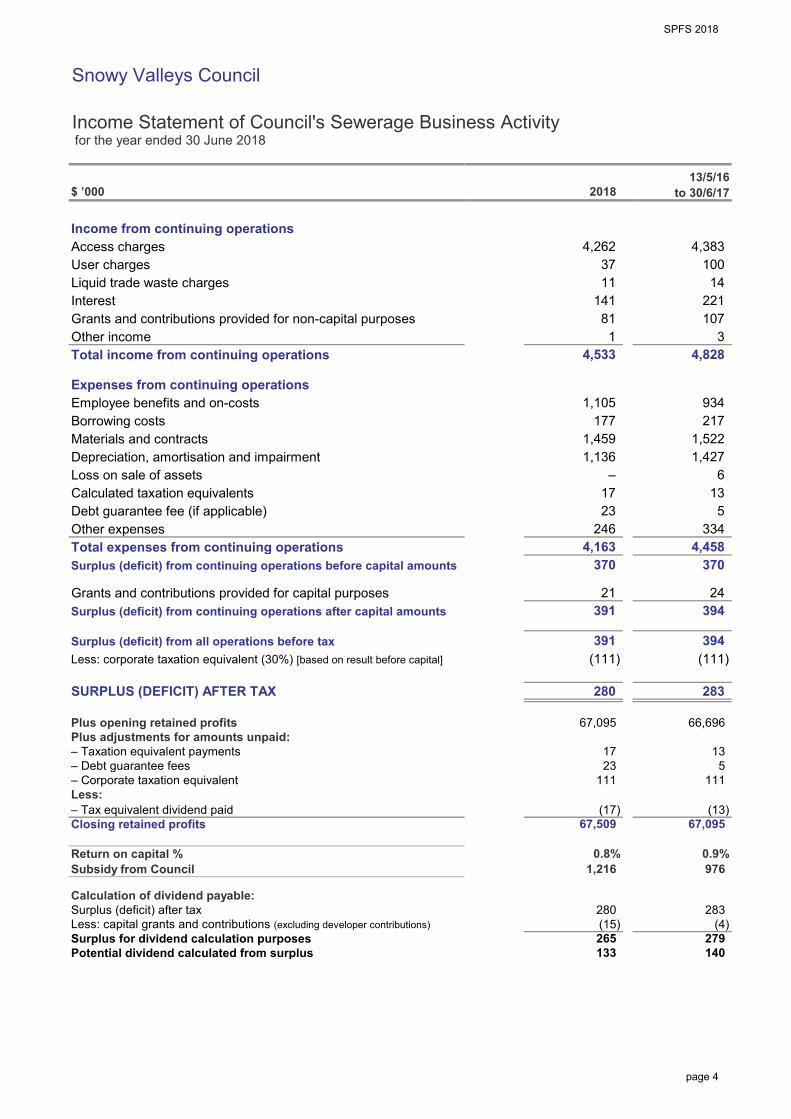
SPFS 2018
Snowy Valleys Council
Income Statement of Council's Sewerage Business Activity for the year ended 30 June 2018
$ ’000
Income from continuing operationsAccess chargesUser chargesLiquid trade waste chargesInterestGrants and contributions provided for non-capital purposesOther incomeTotal income from continuing operations
Expenses from continuing operationsEmployee benefits and on-costsBorrowing costsMaterials and contractsDepreciation, amortisation and impairmentLoss on sale of assetsCalculated taxation equivalentsDebt guarantee fee (if applicable)Other expensesTotal expenses from continuing operationsSurplus (deficit) from continuing operations before capital amounts
Grants and contributions provided for capital purposesSurplus (deficit) from continuing operations after capital amounts
Surplus (deficit) from all operations before taxLess: corporate taxation equivalent (30%) [based on result before capital]
SURPLUS (DEFICIT) AFTER TAX
Plus opening retained profitsPlus adjustments for amounts unpaid:– Taxation equivalent payments– Debt guarantee fees– Corporate taxation equivalentLess:– Tax equivalent dividend paidClosing retained profits
Return on capital %Subsidy from Council
Calculation of dividend payable:Surplus (deficit) after taxLess: capital grants and contributions (excluding developer contributions)Surplus for dividend calculation purposesPotential dividend calculated from surplus
13/5/16to 30/6/17
5 111
(13)
394 (111)
283
66,696
2018
3
934 217
1,522 1,427
6
4,828
4,383 100 14
4,262 37 11
141
5 334
4,458
21 391
81 1
4,533
67,095
1,105 177
1,459
221 107
1,136
370
24 394
280
67,095
0.9%976
– 17
391 (111)
283 (4)
279 140
17 23
111
(17)
133
13
13
67,509
0.8%1,216
280 (15) 265
23 246
4,163 370
X3A1T
page 4
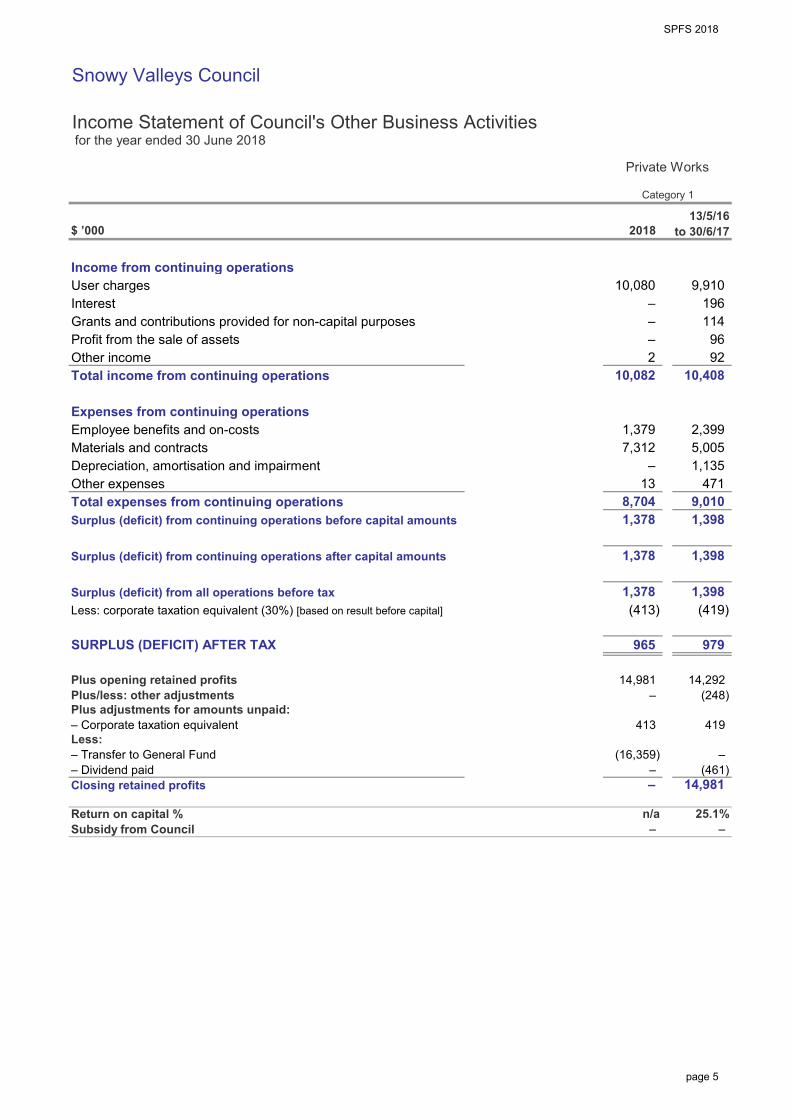
SPFS 2018
Snowy Valleys Council
Income Statement of Council's Other Business Activities for the year ended 30 June 2018
$ ’000
Income from continuing operationsUser chargesInterestGrants and contributions provided for non-capital purposesProfit from the sale of assetsOther incomeTotal income from continuing operations
Expenses from continuing operationsEmployee benefits and on-costsMaterials and contractsDepreciation, amortisation and impairmentOther expensesTotal expenses from continuing operationsSurplus (deficit) from continuing operations before capital amounts
Surplus (deficit) from continuing operations after capital amounts
Surplus (deficit) from all operations before taxLess: corporate taxation equivalent (30%) [based on result before capital]
SURPLUS (DEFICIT) AFTER TAX
Plus opening retained profitsPlus/less: other adjustments (details here...)Plus adjustments for amounts unpaid:– Corporate taxation equivalentLess:– Transfer to General Fund– Dividend paidClosing retained profits
Return on capital %Subsidy from Council
13/5/16
to 30/6/17
(248)
114 96
10,080
1,378 1,398
– –
92 2 10,408
–
1,379
9,910
9,010 471 13
1,398
8,704
1,378
Private Works
2018
196
10,082
5,005
1,398
2,399
1,135 7,312
–
(16,359)
413
–
979
1,378 (419) (413)
(461) –
419
–
14,292 14,981
965
25.1%
–
n/a–
14,981
–
0 Category 1
X3A2T
page 5
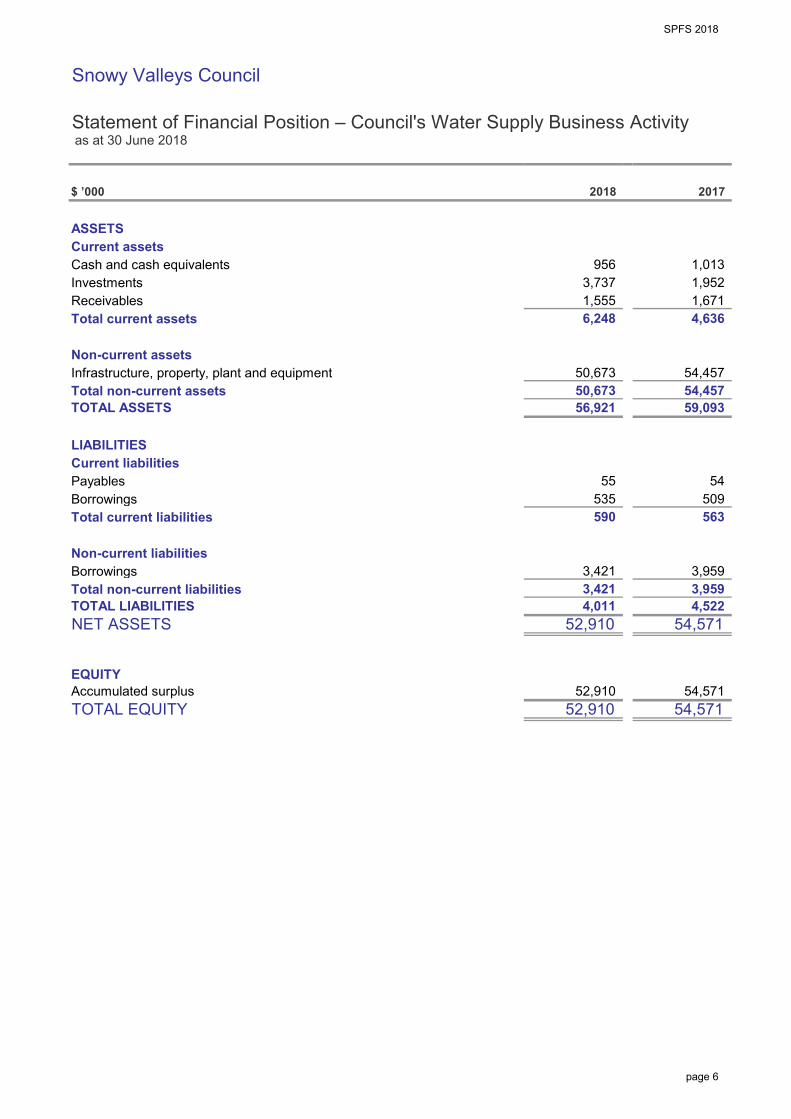
SPFS 2018
Snowy Valleys Council
Statement of Financial Position – Council's Water Supply Business Activity as at 30 June 2018
$ ’000
ASSETSCurrent assetsCash and cash equivalentsInvestmentsReceivablesTotal current assets
Non-current assetsInfrastructure, property, plant and equipmentTotal non-current assetsTOTAL ASSETS
LIABILITIESCurrent liabilitiesPayablesBorrowingsTotal current liabilities
Non-current liabilitiesBorrowingsTotal non-current liabilitiesTOTAL LIABILITIESNET ASSETS
EQUITYAccumulated surplusTOTAL EQUITY 54,571
52,910
59,093
55 535
563 590 509
4,011
3,421
54,571 4,522
20172018
56,921
54
54,457
3,959 3,421
52,910
3,959
956 1,013
50,673 54,457 50,673
3,737 1,952 1,555 1,671 6,248 4,636
52,910 54,571
X4A0T
page 6
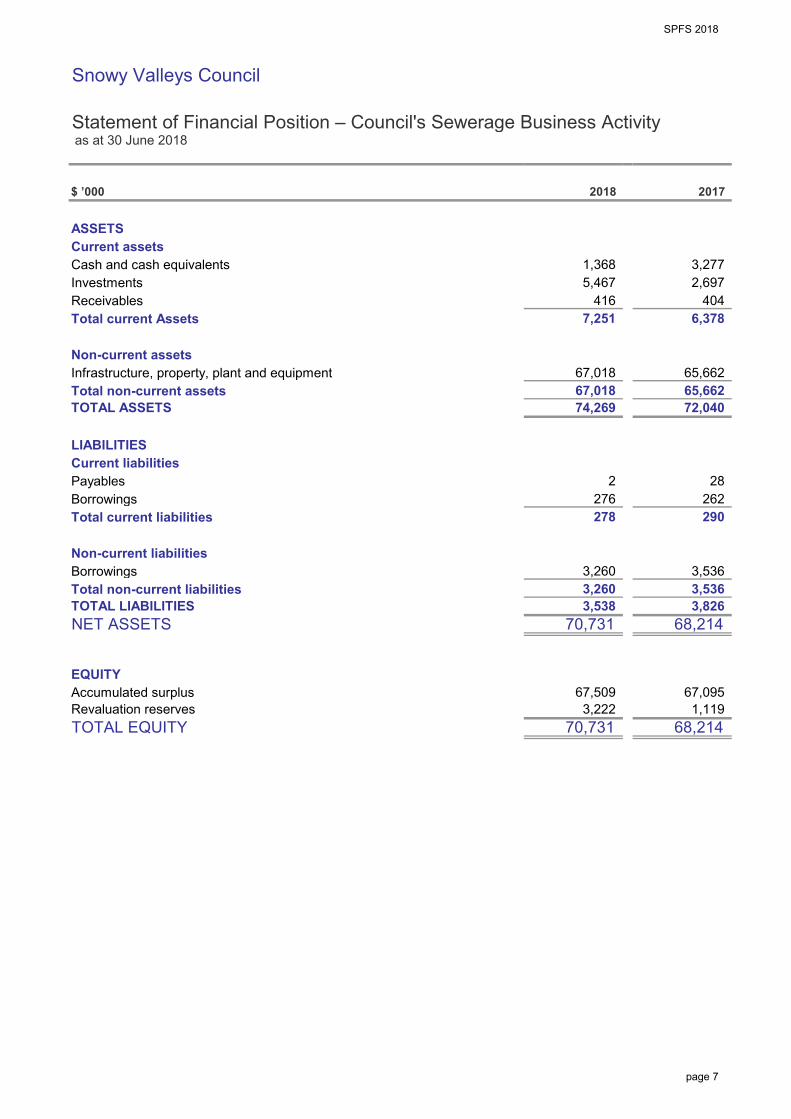
SPFS 2018
Snowy Valleys Council
Statement of Financial Position – Council's Sewerage Business Activity as at 30 June 2018
$ ’000
ASSETSCurrent assetsCash and cash equivalentsInvestmentsReceivablesTotal current Assets
Non-current assetsInfrastructure, property, plant and equipmentTotal non-current assetsTOTAL ASSETS
LIABILITIESCurrent liabilitiesPayablesBorrowingsTotal current liabilities
Non-current liabilitiesBorrowingsTotal non-current liabilitiesTOTAL LIABILITIESNET ASSETS
EQUITYAccumulated surplusRevaluation reservesTOTAL EQUITY
28 2
72,040
68,214
416 404 5,467
2017
67,018 65,662
1,368
2018
3,277
3,538
276 262 278 290
2,697
7,251 6,378
74,269
67,509
3,536
3,222 1,119
3,260
68,214
3,826 3,260 3,536
67,095
70,731
70,731
67,018 65,662
X4A1T
page 7
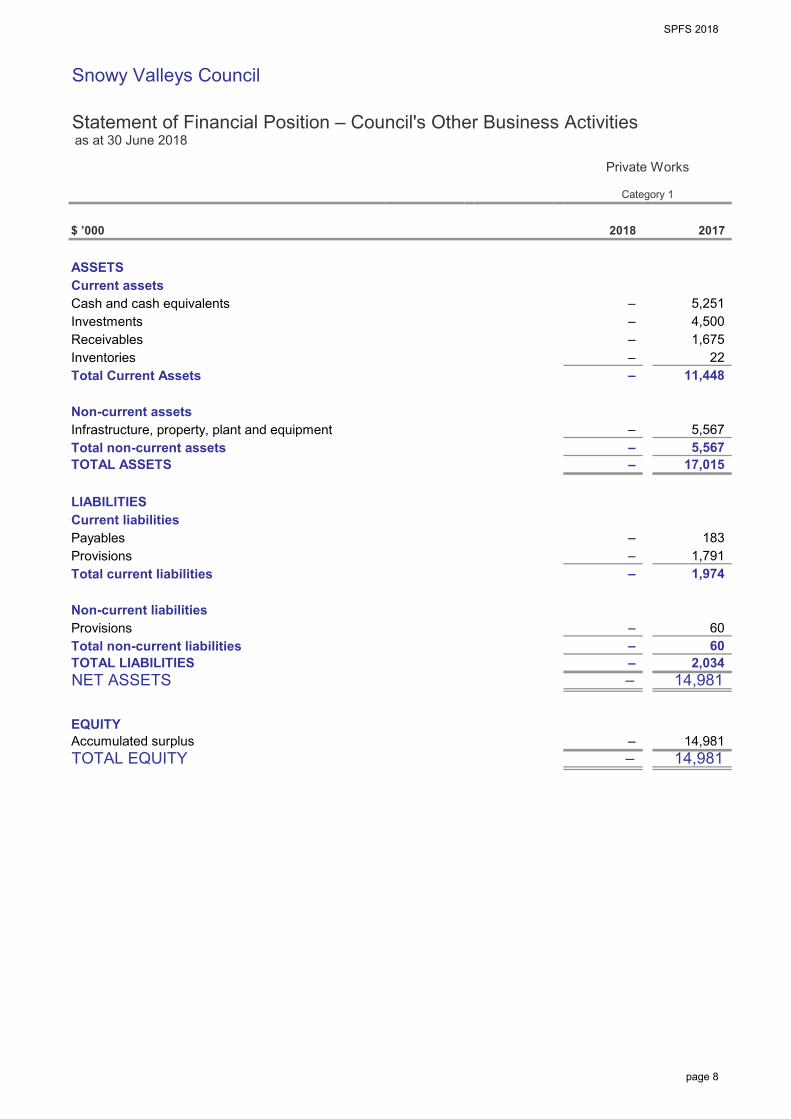
SPFS 2018
Snowy Valleys Council
Statement of Financial Position – Council's Other Business Activities as at 30 June 2018
$ ’000
ASSETSCurrent assetsCash and cash equivalentsInvestmentsReceivablesInventoriesTotal Current Assets
Non-current assetsInfrastructure, property, plant and equipmentTotal non-current assetsTOTAL ASSETS
LIABILITIESCurrent liabilitiesPayablesProvisionsTotal current liabilities
Non-current liabilitiesProvisionsTotal non-current liabilitiesTOTAL LIABILITIESNET ASSETS
EQUITYAccumulated surplusTOTAL EQUITY
22 – –
–
2,034 14,981
60
1,791
60
1,974
17,015
–
– 183
4,500
5,567
1,675
5,567
11,448
– –
–
Private Works
Category 1
5,251
2018
–
2017
–
–
–
–
14,981 –
–
–
–
14,981
X4A2T
page 8
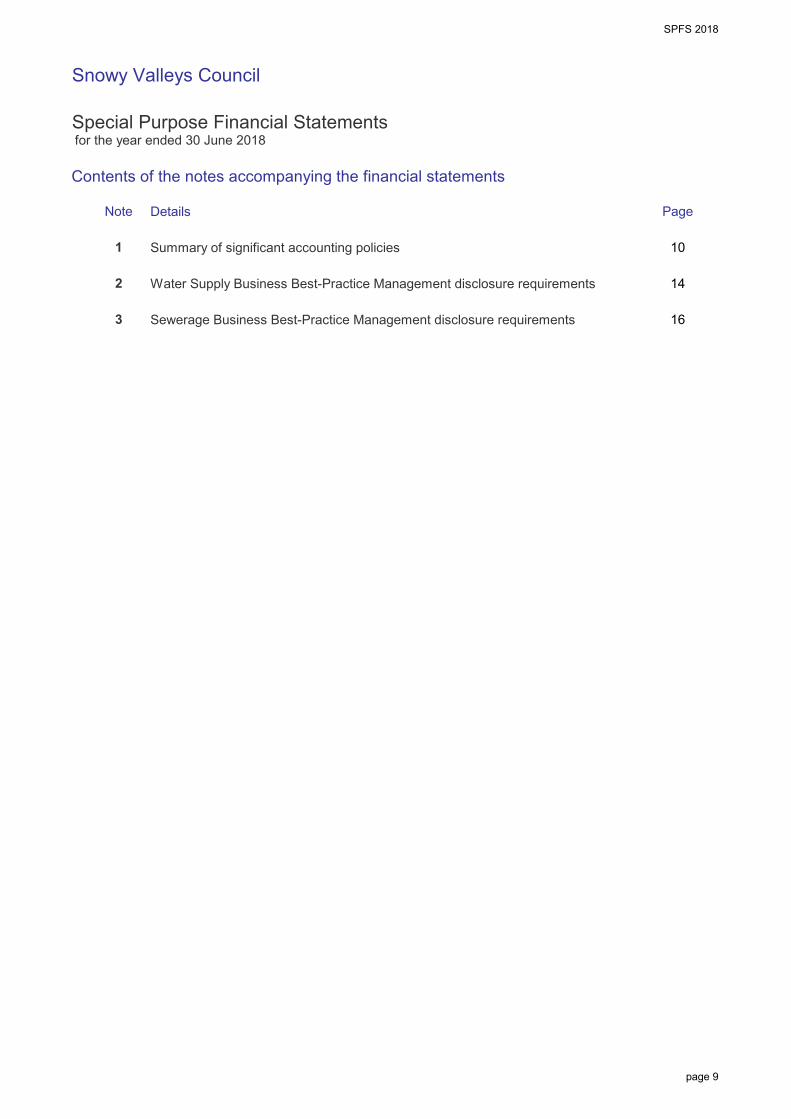
SPFS 2018
Snowy Valleys Council
Special Purpose Financial Statements for the year ended 30 June 2018
Contents of the notes accompanying the financial statements
Details
Summary of significant accounting policies
Water Supply Business Best-Practice Management disclosure requirements
Sewerage Business Best-Practice Management disclosure requirements 163
Note Page
1
2
10
14
X5A0T
page 9
SPFS 2018
Snowy Valleys Council Notes to the Special Purpose Financial Statements for the year ended 30 June 2018 Note 1. Significant accounting policies
page 10
A statement summarising the supplemental accounting policies adopted in the preparation of the Special Purpose Financial Statements (SPFS) for National Competition Policy (NCP) reporting purposes follows. These financial statements are SPFS prepared for use by Council and the Office of Local Government. For the purposes of these statements, the Council is a non-reporting not-for-profit entity. The figures presented in these Special Purpose Financial Statements have been prepared in accordance with the recognition and measurement criteria of relevant Australian Accounting Standards, other authoritative pronouncements of the Australian Accounting Standards Board (AASB) and Australian Accounting Interpretations. The disclosures in these Special Purpose Financial Statements have been prepared in accordance with the Local Government Act 1993 (NSW), the Local Government (General) Regulation, and the Local Government Code of Accounting Practice and Financial Reporting. The statements are prepared on an accruals basis. They are based on historic costs and do not take into account changing money values or, except where specifically stated, current values of non-current assets. Certain taxes and other costs, appropriately described, have been imputed for the purposes of the National Competition Policy. The Statement of Financial Position includes notional assets/liabilities receivable from/payable to Council's general fund. These balances reflect a notional intra-entity funding arrangement with the declared business activities. National Competition Policy Council has adopted the principle of ‘competitive neutrality’ in its business activities as part of the National Competition Policy which is being applied throughout Australia at all levels of government. The framework for its application is set out in the June 1996 NSW government policy statement titled 'Application of National Competition Policy to Local Government'. The Pricing and Costing for Council Businesses, A Guide to Competitive Neutrality issued by the Office of Local Government in July 1997 has also been adopted. The pricing and costing guidelines outline the process for identifying and allocating costs to activities and provide a standard for disclosure requirements. These disclosures are reflected in Council’s pricing and/or financial reporting systems and include taxation equivalents, Council subsidies, return on investments (rate of return), and dividends paid. Declared business activities In accordance with Pricing and Costing for Council Businesses – A Guide to Competitive Neutrality, Council has declared that the following are to be considered as business activities: Category 1 (where gross operating turnover is over $2 million) a. Snowy Valleys Council Sewerage Service
Comprising the whole of the operations and assets of the sewerage reticulation and treatment system, servicing the towns of Adelong, Batlow, Khancoban, Talbingo, Tumbarumba and Tumut.
SPFS 20187
Snowy Valleys Council Notes to the Special Purpose Financial Statements for the year ended 30 June 2018 Note 1. Significant accounting policies (continued)
page 11
b. Snowy Valleys Council Water Supply Service
Comprising the whole of the operations and assets of the water supply system servicing the towns of Adelong, Batlow, Khancoban, Talbingo, Tumbarumba and Tumut.
c. Snowy Valleys Council Private Works
Independent works unit servicing the needs of Council and government bodies, including Roads and Maritime Services and private parties. Provides the majority of Council’s maintenance and construction services on a provider/client service basis. This business unit is currently being restructured and has not continue to be an independent works unit but an integrated works division of Snowy Valleys Council during 2017-18.
Category 2 (where gross operating turnover is less than $2 million) Nil Monetary amounts Amounts shown in the financial statements are in Australian currency and rounded to the nearest thousand dollars, except for Note 2 (Water Supply Best-Practice Management Disclosures) and Note 3 (Sewerage Best-Practice Management Disclosures). As required by Crown Lands and Water (CLAW), the amounts shown in Note 2 and Note 3 are disclosed in whole dollars. (i) Taxation-equivalent charges Council is liable to pay various taxes and financial duties. Where this is the case, they are disclosed as a cost of operations just like all other costs. However, where Council does not pay some taxes which are generally paid by private sector businesses, such as income tax, these equivalent tax payments have been applied to all Council-nominated business activities and are reflected in Special Purpose Financial Statements. For the purposes of disclosing comparative information relevant to the private sector equivalent, the following taxation equivalents have been applied to all Council-nominated business activities (this does not include Council’s non-business activities): Notional rate applied (%) Corporate income tax rate – 30% Land tax – the first $629,000 of combined land values attracts 0%. For the combined land values in excess of $629,001 up to $3,846,000 the rate is 1.6% + $100. For the remaining combined land value that exceeds $3,846,000 a premium marginal rate of 2.0% applies. Payroll tax – 5.45% on the value of taxable salaries and wages in excess of $750,000. In accordance with Crown Lands and Water (CLAW), a payment for the amount calculated as the annual tax equivalent charges (excluding income tax) must be paid from water supply and sewerage business activities.
SPFS 20187
Snowy Valleys Council Notes to the Special Purpose Financial Statements for the year ended 30 June 2018 Note 1. Significant accounting policies (continued)
page 12
The payment of taxation equivalent charges, referred to in the NSW Office of Water Guidelines to as a ‘dividend for taxation equivalent’, may be applied for any purpose allowed under the Local Government Act, 1993. Achievement of substantial compliance to the NSW Office of Water Guidelines is not a prerequisite for the payment of the tax equivalent charges, however the payment must not exceed $3 per assessment. Income tax An income tax equivalent has been applied on the profits of the business activities. Whilst income tax is not a specific cost for the purpose of pricing a good or service, it needs to be taken into account in terms of assessing the rate of return required on capital invested. Accordingly, the return on capital invested is set at a pre-tax level - gain/(loss) from ordinary activities before capital amounts, as would be applied by a private sector competitor. That is, it should include a provision equivalent to the corporate income tax rate, currently 30%. Income tax is only applied where a gain/ (loss) from ordinary activities before capital amounts has been achieved. Since the taxation equivalent is notional – that is, it is payable to Council as the ‘owner’ of business operations - it represents an internal payment and has no effect on the operations of the Council. Accordingly, there is no need for disclosure of internal charges in the SPFS. The rate applied of 30% is/is not the equivalent company tax rate prevalent at reporting date. No adjustments have been made for variations that have occurred during the year. Local government rates and charges A calculation of the equivalent rates and charges payable on all category 1 businesses has been applied to all land assets owned or exclusively used by the business activity. Loan and debt guarantee fees The debt guarantee fee is designed to ensure that council business activities face ‘true’ commercial borrowing costs in line with private sector competitors. In order to calculate a debt guarantee fee, Council has determined what the differential borrowing rate would have been between the commercial rate and Council’s borrowing rate for its business activities. (ii) Subsidies Government policy requires that subsidies provided to customers, and the funding of those subsidies, must be explicitly disclosed. Subsidies occur when Council provides services on a less-than-cost-recovery basis. This option is exercised on a range of services in order for Council to meet its community service obligations. Accordingly, ‘subsidies disclosed’ (in relation to National Competition Policy) represents the difference between revenue generated from ‘rate of return’ pricing and revenue generated from prices set by Council in any given financial year. The overall effect of subsidies is contained within the Income Statement of each reported business activity.
SPFS 20187
Snowy Valleys Council Notes to the Special Purpose Financial Statements for the year ended 30 June 2018 Note 1. Significant accounting policies (continued)
page 13
(iii) Return on investments (rate of return) The NCP policy statement requires that councils with Category 1 businesses ‘would be expected to generate a return on capital funds employed that is comparable to rates of return for private businesses operating in a similar field’. Such funds are subsequently available for meeting commitments or financing future investment strategies. The actual rate of return achieved by each business activity is disclosed at the foot of each respective Income Statement. The rate of return is calculated as follows:
Operating result before capital income + interest expense
Written down value of I,PP&E as at 30 June As a minimum, business activities should generate a return equal to the Commonwealth 10 year bond rate which is 2.63% at 30/6/18. (iv) Dividends Council is not required to pay dividends to either itself (as owner of a range of businesses) or to any external entities. Local government water supply and sewerage businesses are permitted to pay an annual dividend from its water supply or sewerage business surplus. Each dividend must be calculated and approved in accordance with the DPIW guidelines and must not exceed: (i) 50% of this surplus in any one year, or
(ii) the number of water supply or sewerage assessments at 30 June 2018 multiplied by $30 (less the payment for tax equivalent charges, not exceeding $3 per assessment).
In accordance with the DPIW guidelines a Dividend Payment form, Statement of Compliance, Unqualified Independent Financial Audit Report and Compliance Audit Report are required to be submitted to the DPIW.
END OF AUDITED SPECIAL PURPOSE FINANCIAL STATEMENTS
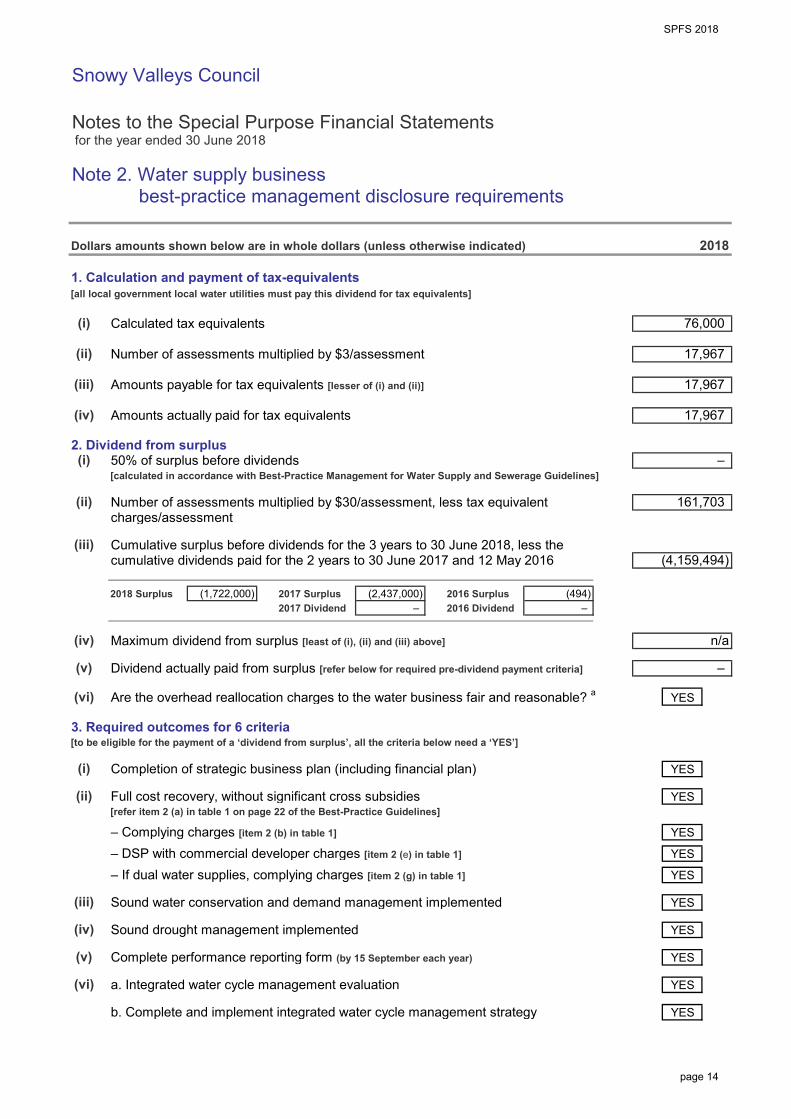
SPFS 2018
Snowy Valleys Council
Notes to the Special Purpose Financial Statements for the year ended 30 June 2018
Note 2. Water supply business best-practice management disclosure requirements
Dollars amounts shown below are in whole dollars (unless otherwise indicated)
1. Calculation and payment of tax-equivalents[all local government local water utilities must pay this dividend for tax equivalents]
Calculated tax equivalents
Number of assessments multiplied by $3/assessment
Amounts payable for tax equivalents [lesser of (i) and (ii)]
Amounts actually paid for tax equivalents
2. Dividend from surplus50% of surplus before dividends[calculated in accordance with Best-Practice Management for Water Supply and Sewerage Guidelines]
Number of assessments multiplied by $30/assessment, less tax equivalentcharges/assessment
Cumulative surplus before dividends for the 3 years to 30 June 2018, less thecumulative dividends paid for the 2 years to 30 June 2017 and 12 May 2016
2018 Surplus 2017 Surplus 2016 Surplus2017 Dividend 2016 Dividend
Maximum dividend from surplus [least of (i), (ii) and (iii) above]
Dividend actually paid from surplus [refer below for required pre-dividend payment criteria]
Are the overhead reallocation charges to the water business fair and reasonable? a
3. Required outcomes for 6 criteria[to be eligible for the payment of a ‘dividend from surplus’, all the criteria below need a ‘YES’]
Completion of strategic business plan (including financial plan)
Full cost recovery, without significant cross subsidies[refer item 2 (a) in table 1 on page 22 of the Best-Practice Guidelines]
– Complying charges [item 2 (b) in table 1]
– DSP with commercial developer charges [item 2 (e) in table 1]
– If dual water supplies, complying charges [item 2 (g) in table 1]
Sound water conservation and demand management implemented
Sound drought management implemented
Complete performance reporting form (by 15 September each year)
a. Integrated water cycle management evaluation
b. Complete and implement integrated water cycle management strategy
(iv)
(iii)
(i)
(iv)
(iii)
(iii)
(i)
(ii)
(ii)
(v)
(i)
(vi)
– (1,722,000) (2,437,000)
YES
YES
– (494)
YES
(iv) YES
YES
YES
(ii)
YES
YES
76,000
17,967
n/a
2018
–
–
161,703
(4,159,494)
17,967
17,967
YES
YES(v)
(vi)
YES
X6A0T
page 14
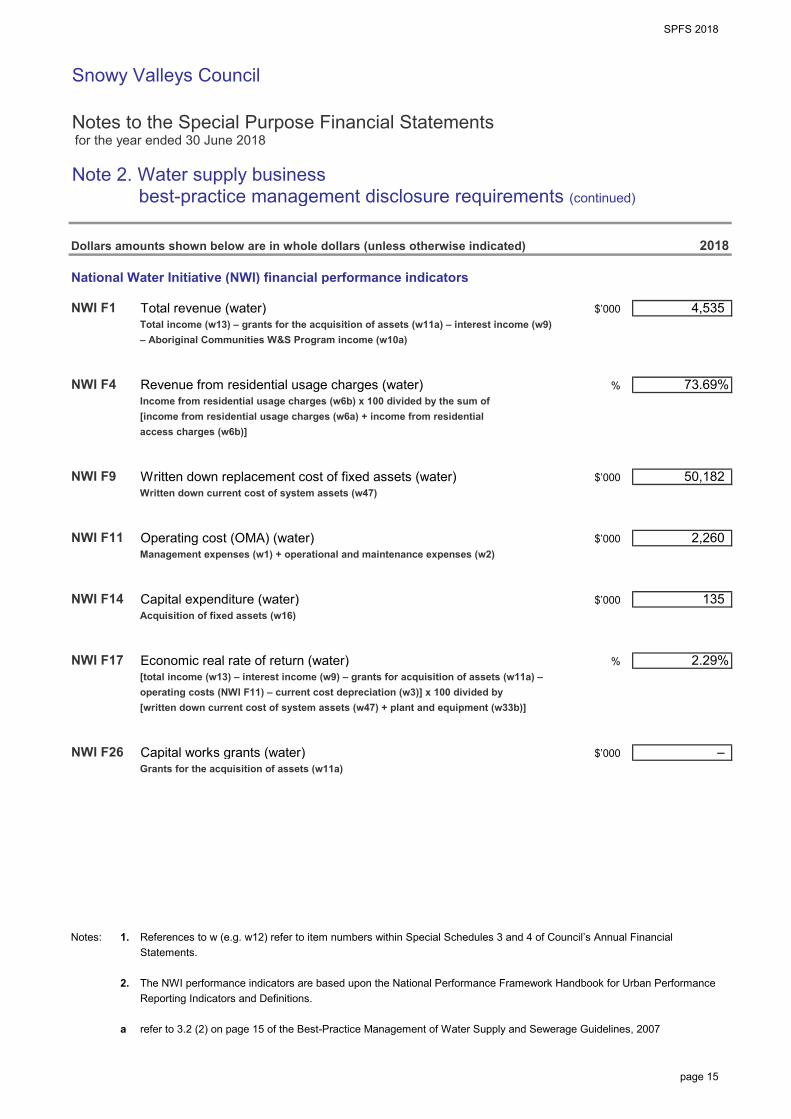
SPFS 2018
Snowy Valleys Council
Notes to the Special Purpose Financial Statements for the year ended 30 June 2018
Note 2. Water supply business best-practice management disclosure requirements (continued)
Dollars amounts shown below are in whole dollars (unless otherwise indicated)
National Water Initiative (NWI) financial performance indicators
Total revenue (water)Total income (w13) – grants for the acquisition of assets (w11a) – interest income (w9)– Aboriginal Communities W&S Program income (w10a)
Revenue from residential usage charges (water)Income from residential usage charges (w6b) x 100 divided by the sum of[income from residential usage charges (w6a) + income from residentialaccess charges (w6b)]
Written down replacement cost of fixed assets (water)Written down current cost of system assets (w47)
Operating cost (OMA) (water)Management expenses (w1) + operational and maintenance expenses (w2)
Capital expenditure (water)Acquisition of fixed assets (w16)
Economic real rate of return (water)[total income (w13) – interest income (w9) – grants for acquisition of assets (w11a) –operating costs (NWI F11) – current cost depreciation (w3)] x 100 divided by[written down current cost of system assets (w47) + plant and equipment (w33b)]
Capital works grants (water)Grants for the acquisition of assets (w11a)
Notes: 1. References to w (e.g. w12) refer to item numbers within Special Schedules 3 and 4 of Council’s Annual FinancialStatements.
2. The NWI performance indicators are based upon the National Performance Framework Handbook for Urban PerformanceReporting Indicators and Definitions.
a refer to 3.2 (2) on page 15 of the Best-Practice Management of Water Supply and Sewerage Guidelines, 2007
$’000NWI F9
2018
4,535
NWI F4 %
50,182
$’000
73.69%
NWI F1
NWI F26 – $’000
NWI F11
NWI F17 %
NWI F14 $’000
2.29%
135
2,260 $’000
page 15
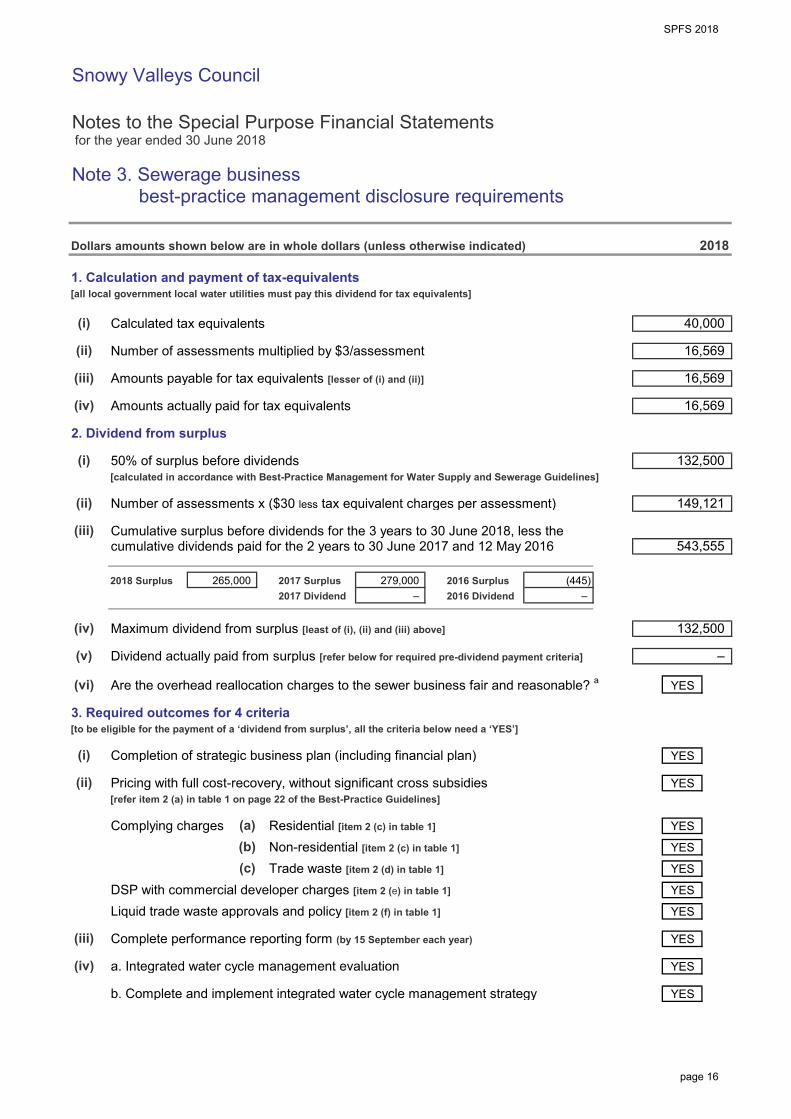
SPFS 2018
Snowy Valleys Council
Notes to the Special Purpose Financial Statements for the year ended 30 June 2018
Note 3. Sewerage business best-practice management disclosure requirements
Dollars amounts shown below are in whole dollars (unless otherwise indicated)
1. Calculation and payment of tax-equivalents[all local government local water utilities must pay this dividend for tax equivalents]
Calculated tax equivalents
Number of assessments multiplied by $3/assessment
Amounts payable for tax equivalents [lesser of (i) and (ii)]
Amounts actually paid for tax equivalents
2. Dividend from surplus
50% of surplus before dividends[calculated in accordance with Best-Practice Management for Water Supply and Sewerage Guidelines]
Number of assessments x ($30 less tax equivalent charges per assessment)
Cumulative surplus before dividends for the 3 years to 30 June 2018, less thecumulative dividends paid for the 2 years to 30 June 2017 and 12 May 2016
2018 Surplus 2017 Surplus 2016 Surplus2017 Dividend 2016 Dividend
Maximum dividend from surplus [least of (i), (ii) and (iii) above]
Dividend actually paid from surplus [refer below for required pre-dividend payment criteria]
Are the overhead reallocation charges to the sewer business fair and reasonable? a
3. Required outcomes for 4 criteria [to be eligible for the payment of a ‘dividend from surplus’, all the criteria below need a ‘YES’]
Completion of strategic business plan (including financial plan)
Pricing with full cost-recovery, without significant cross subsidies [refer item 2 (a) in table 1 on page 22 of the Best-Practice Guidelines]
Complying charges Residential [item 2 (c) in table 1] Non-residential [item 2 (c) in table 1] Trade waste [item 2 (d) in table 1]
DSP with commercial developer charges [item 2 (e) in table 1] Liquid trade waste approvals and policy [item 2 (f) in table 1]
Complete performance reporting form (by 15 September each year)
a. Integrated water cycle management evaluation
b. Complete and implement integrated water cycle management strategy
279,000 –
(v)
(iii)
(i)
(ii)
(a)(b)
(vi)
(iv)
–
(i)
(iv)
(iii)
(ii)
(iii)
265,000
(i)
(ii) 149,121
(445)
(iv)
(c)
2018
YES
132,500
–
YES
16,569
16,569
YES
YES
543,555
YES
YES
40,000
16,569
YES
YES
YES
132,500
YES
YES
X7A0T
page 16
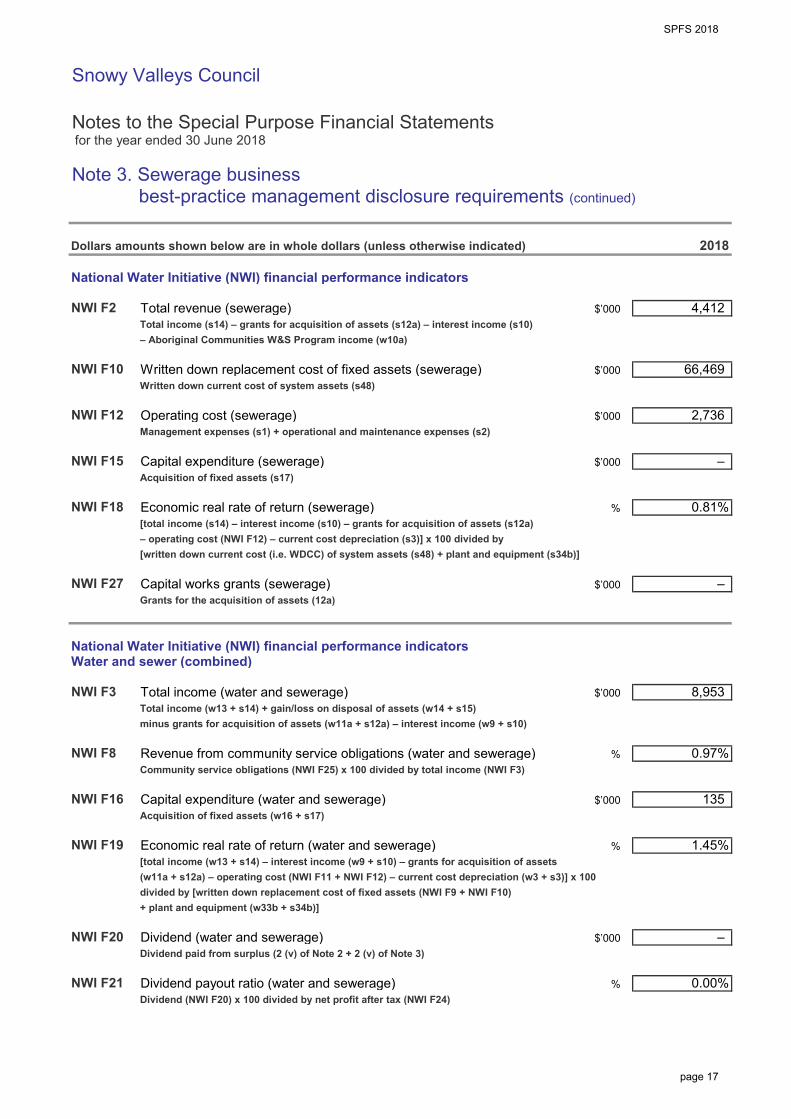
SPFS 2018
Snowy Valleys Council
Notes to the Special Purpose Financial Statements for the year ended 30 June 2018
Note 3. Sewerage business best-practice management disclosure requirements (continued)
Dollars amounts shown below are in whole dollars (unless otherwise indicated)
National Water Initiative (NWI) financial performance indicators
Total revenue (sewerage)Total income (s14) – grants for acquisition of assets (s12a) – interest income (s10)– Aboriginal Communities W&S Program income (w10a)
Written down replacement cost of fixed assets (sewerage)Written down current cost of system assets (s48)
Operating cost (sewerage)Management expenses (s1) + operational and maintenance expenses (s2)
Capital expenditure (sewerage)Acquisition of fixed assets (s17)
Economic real rate of return (sewerage)[total income (s14) – interest income (s10) – grants for acquisition of assets (s12a)– operating cost (NWI F12) – current cost depreciation (s3)] x 100 divided by[written down current cost (i.e. WDCC) of system assets (s48) + plant and equipment (s34b)]
Capital works grants (sewerage)Grants for the acquisition of assets (12a)
National Water Initiative (NWI) financial performance indicatorsWater and sewer (combined)
Total income (water and sewerage)Total income (w13 + s14) + gain/loss on disposal of assets (w14 + s15)minus grants for acquisition of assets (w11a + s12a) – interest income (w9 + s10)
Revenue from community service obligations (water and sewerage)Community service obligations (NWI F25) x 100 divided by total income (NWI F3)
Capital expenditure (water and sewerage)Acquisition of fixed assets (w16 + s17)
Economic real rate of return (water and sewerage)[total income (w13 + s14) – interest income (w9 + s10) – grants for acquisition of assets(w11a + s12a) – operating cost (NWI F11 + NWI F12) – current cost depreciation (w3 + s3)] x 100divided by [written down replacement cost of fixed assets (NWI F9 + NWI F10)+ plant and equipment (w33b + s34b)]
Dividend (water and sewerage)Dividend paid from surplus (2 (v) of Note 2 + 2 (v) of Note 3)
Dividend payout ratio (water and sewerage)Dividend (NWI F20) x 100 divided by net profit after tax (NWI F24)
NWI F16 $’000
NWI F27
NWI F18
NWI F15 $’000
%
$’000
NWI F2
NWI F10
NWI F12
$’000
$’000
1.45%
135
%
– $’000
0.00%
NWI F19
NWI F21
NWI F20
%
NWI F3 $’000 8,953
NWI F8 % 0.97%
2018
$’000
–
66,469
4,412
0.81%
2,736
–
page 17
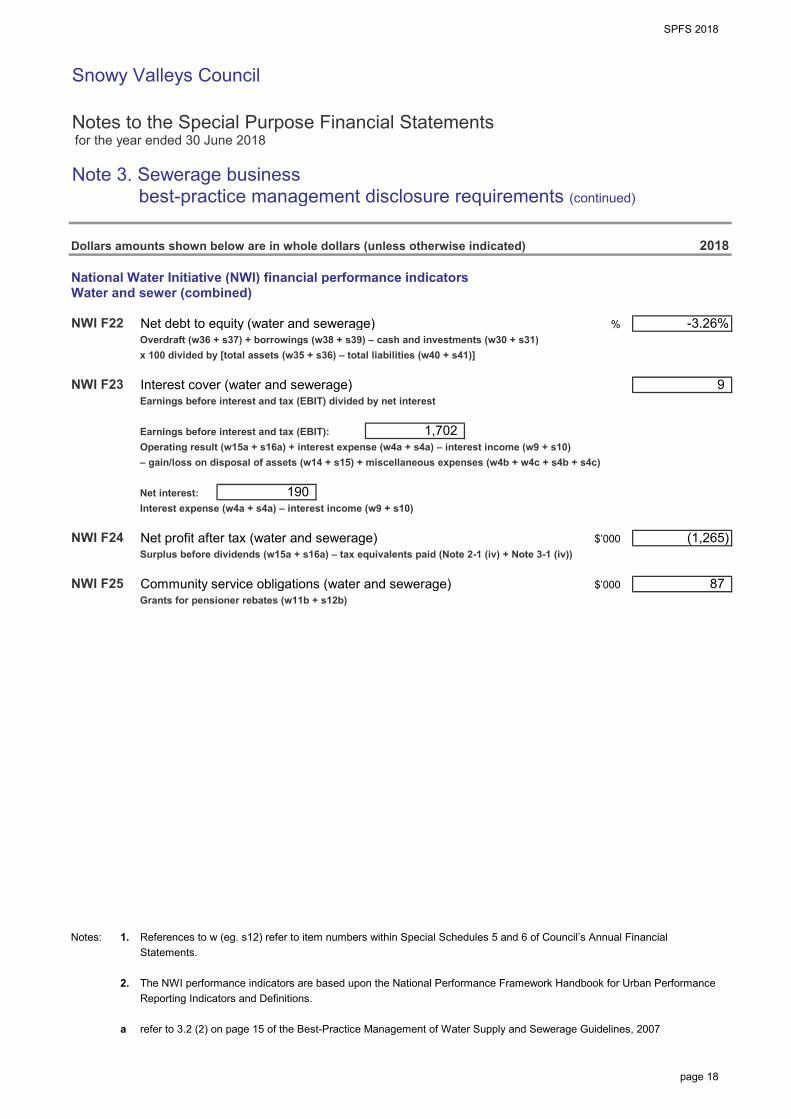
SPFS 2018
Snowy Valleys Council
Notes to the Special Purpose Financial Statements for the year ended 30 June 2018
Note 3. Sewerage business best-practice management disclosure requirements (continued)
Dollars amounts shown below are in whole dollars (unless otherwise indicated)
National Water Initiative (NWI) financial performance indicatorsWater and sewer (combined)
Net debt to equity (water and sewerage)Overdraft (w36 + s37) + borrowings (w38 + s39) – cash and investments (w30 + s31)x 100 divided by [total assets (w35 + s36) – total liabilities (w40 + s41)]
Interest cover (water and sewerage)Earnings before interest and tax (EBIT) divided by net interest
Earnings before interest and tax (EBIT):Operating result (w15a + s16a) + interest expense (w4a + s4a) – interest income (w9 + s10)– gain/loss on disposal of assets (w14 + s15) + miscellaneous expenses (w4b + w4c + s4b + s4c)
Net interest:Interest expense (w4a + s4a) – interest income (w9 + s10)
Net profit after tax (water and sewerage)Surplus before dividends (w15a + s16a) – tax equivalents paid (Note 2-1 (iv) + Note 3-1 (iv))
Community service obligations (water and sewerage)Grants for pensioner rebates (w11b + s12b)
Notes: 1. References to w (eg. s12) refer to item numbers within Special Schedules 5 and 6 of Council’s Annual FinancialStatements.
2. The NWI performance indicators are based upon the National Performance Framework Handbook for Urban PerformanceReporting Indicators and Definitions.
a refer to 3.2 (2) on page 15 of the Best-Practice Management of Water Supply and Sewerage Guidelines, 2007
-3.26%
2018
87
9
(1,265)
190
$’000
NWI F25 $’000
NWI F24
NWI F23
NWI F22 %
1,702
page 18
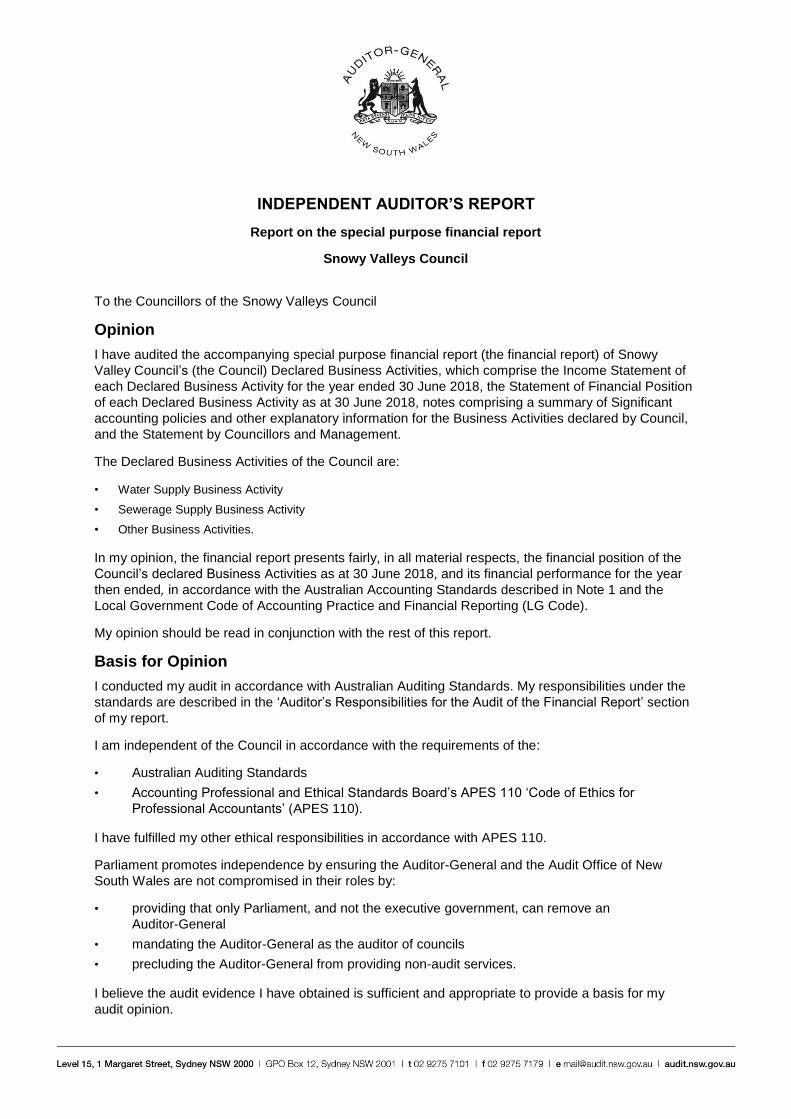
INDEPENDENT AUDITOR’S REPORT
Report on the special purpose financial report
Snowy Valleys Council
To the Councillors of the Snowy Valleys Council
Opinion
I have audited the accompanying special purpose financial report (the financial report) of Snowy
Valley Council’s (the Council) Declared Business Activities, which comprise the Income Statement of
each Declared Business Activity for the year ended 30 June 2018, the Statement of Financial Position
of each Declared Business Activity as at 30 June 2018, notes comprising a summary of Significant
accounting policies and other explanatory information for the Business Activities declared by Council,
and the Statement by Councillors and Management.
The Declared Business Activities of the Council are:
• Water Supply Business Activity
• Sewerage Supply Business Activity
• Other Business Activities.
In my opinion, the financial report presents fairly, in all material respects, the financial position of the
Council’s declared Business Activities as at 30 June 2018, and its financial performance for the year
then ended, in accordance with the Australian Accounting Standards described in Note 1 and the
Local Government Code of Accounting Practice and Financial Reporting (LG Code).
My opinion should be read in conjunction with the rest of this report.
Basis for Opinion
I conducted my audit in accordance with Australian Auditing Standards. My responsibilities under the
standards are described in the ‘Auditor’s Responsibilities for the Audit of the Financial Report’ section
of my report.
I am independent of the Council in accordance with the requirements of the:
• Australian Auditing Standards
• Accounting Professional and Ethical Standards Board’s APES 110 ‘Code of Ethics for
Professional Accountants’ (APES 110).
I have fulfilled my other ethical responsibilities in accordance with APES 110.
Parliament promotes independence by ensuring the Auditor-General and the Audit Office of New
South Wales are not compromised in their roles by:
• providing that only Parliament, and not the executive government, can remove an
Auditor-General
• mandating the Auditor-General as the auditor of councils
• precluding the Auditor-General from providing non-audit services.
I believe the audit evidence I have obtained is sufficient and appropriate to provide a basis for my
audit opinion.
Emphasis of Matter - Basis of Accounting
Without modifying my opinion, I draw attention to Note 1 to the financial report which describes the
basis of accounting. The financial report has been prepared for the purpose of fulfilling the Council’s
financial reporting responsibilities under the LG Code. As a result, the financial report may not be
suitable for another purpose.
Other Information
Other information comprises the information included in the Council’s annual report for the year ended
30 June 2018, other than the financial report and my Independent Auditor’s Report thereon. The
Councillors are responsible for the other information. At the date of this Independent Auditor’s Report,
the other information I have received comprise the general purpose financial statements and Special
Schedules (the Schedules).
My opinion on the financial report does not cover the other information. Accordingly, I do not express
any form of assurance conclusion on the other information. However, as required by the Local
Government Act 1993, I have separately expressed an opinion on the general purpose financial
statements and Special Schedule 2 - Permissible income for general rates.
In connection with my audit of the financial report, my responsibility is to read the other information
and, in doing so, consider whether the other information is materially inconsistent with the financial
report or my knowledge obtained in the audit, or otherwise appears to be materially misstated.
If, based on the work I have performed, I conclude there is a material misstatement of the other
information, I must report that fact. I have nothing to report in this regard.
The Councillors’ Responsibilities for the Financial Report
The Councillors are responsible for the preparation and fair presentation of the financial report and for
determining that the accounting policies, described in Note 1 to the financial report, are appropriate to
meet the requirements in the LG Code. The Councillors’ responsibility also includes such internal
control as the Councillors determine is necessary to enable the preparation and fair presentation of
the financial report that is free from material misstatement, whether due to fraud or error.
In preparing the financial report, the Councillors are responsible for assessing the Council’s ability to
continue as a going concern, disclosing, as applicable, matters related to going concern and using the
going concern basis of accounting, unless it is not appropriate to do so.
Auditor’s Responsibilities for the Audit of the Financial Report
My objectives are to:
• obtain reasonable assurance about whether the financial report as a whole is free from material
misstatement, whether due to fraud or error
• issue an Independent Auditor’s Report including my opinion.
Reasonable assurance is a high level of assurance, but does not guarantee an audit conducted in
accordance with Australian Auditing Standards will always detect material misstatements.
Misstatements can arise from fraud or error. Misstatements are considered material if, individually or
in aggregate, they could reasonably be expected to influence the economic decisions users take
based on the financial report.
A description of my responsibilities for the audit of the financial report is located at the Auditing and
Assurance Standards Board website at: www.auasb.gov.au/auditors_responsibilities/ar4.pdf. The
description forms part of my auditor’s report.
My opinion does not provide assurance:
• that the Council carried out its activities effectively, efficiently and economically
• about the security and controls over the electronic publication of the audited financial report on
any website where it may be presented
• about any other information which may have been hyperlinked to/from the financial report.
Lawrissa Chan
Director, Financial Audit Services
30 November 2018
SYDNEY
Snowy Valleys Council SPECIAL SCHEDULES for the year ended 30 June 2018
Leading, engaging & supportingstrong & vibrant communities
Special Schedules 2018
Snowy Valleys Council
Special Schedules for the year ended 30 June 2018
Contents
Special Schedules 1
Net Cost of Services
Permissible income for general ratesIndependent Auditors Report
Water Supply Operations – incl. Income StatementWater Supply – Statement of Financial Position
Sewerage Service Operations – incl. Income StatementSewerage Service – Statement of Financial Position
Notes to Special Schedules 3 and 5
Report on Infrastructure Assets
1 Special Schedules are not audited (with the exception of Special Schedule 2).
Background
These Special Schedules have been designed to meet the requirements of special purpose users such as;
the NSW Grants Commissionthe Australian Bureau of Statistics (ABS),the NSW Office of Water (NOW), andthe Office of Local Government (OLG).
The financial data is collected for various uses including;
the allocation of Financial Assistance Grants,the incorporation of Local Government financial figures in national statistics,the monitoring of loan approvals,the allocation of borrowing rights, andthe monitoring of the financial activities of specific services.
17Special Schedule 7
(ii)
(i)
16
15
Page
2
811
Special Schedule 6Special Schedule 5 12
Special Schedule 1
Special Schedule 3
Special Schedule 2 4Special Schedule 2 6
Special Schedule 4
page 1
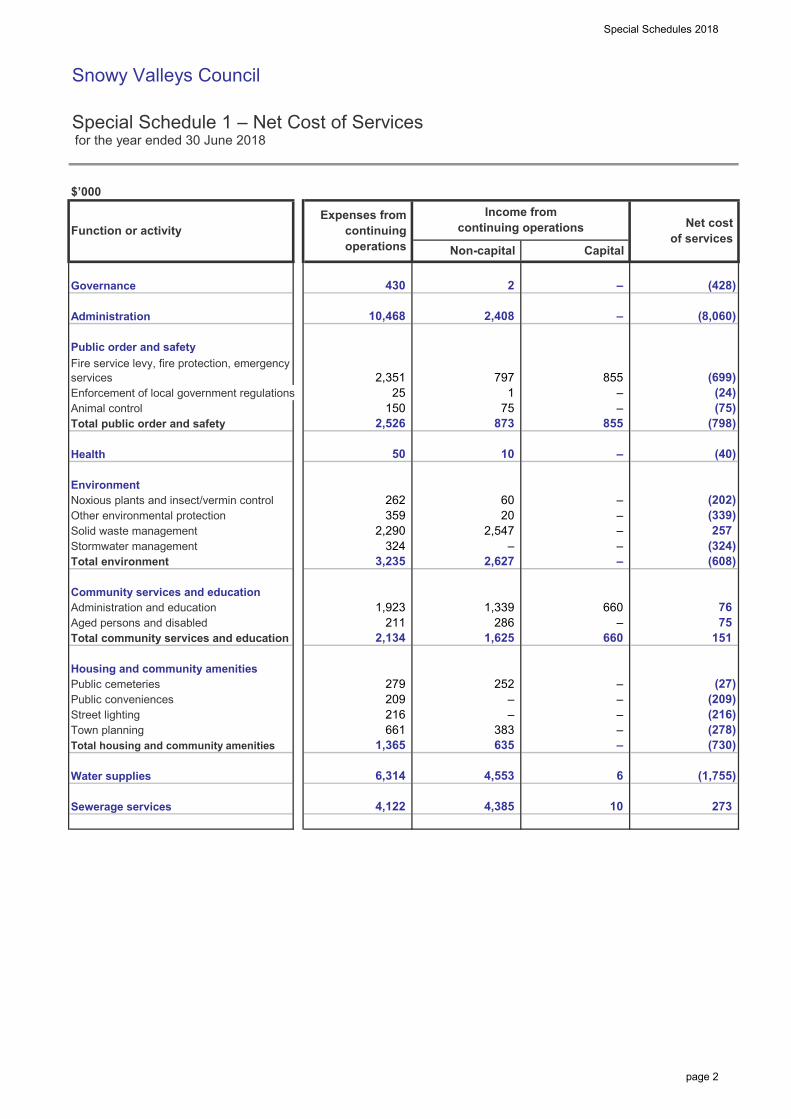
Special Schedules 2018
Snowy Valleys Council
Special Schedule 1 – Net Cost of Services for the year ended 30 June 2018
$’000
Governance
Administration
Public order and safety
Enforcement of local government regulationsAnimal controlTotal public order and safety
Health
EnvironmentNoxious plants and insect/vermin controlOther environmental protectionSolid waste managementStormwater managementTotal environment
Community services and educationAdministration and educationAged persons and disabledTotal community services and education
Housing and community amenitiesPublic cemeteriesPublic conveniencesStreet lightingTown planningTotal housing and community amenities
Water supplies
Sewerage services
– –
Expenses from. continuing. operations. Non-capital.
25
–
Capital.
Income fromcontinuing operations
1
10
20 60
2,547
873
2,627
359
855
– –
383
1,625
6,314
–
4,385 4,122 10
–
(27) (209)
(278) (216)
660
– 252
635
4,553
10,468
2,351
2,408
(798)
– (40)
855
50
150 2,526
–
797
Function or activity
Fire service levy, fire protection, emergency services
216 661
Net cost.of services.
(24) (699)
(608) (324)
430 2 – (428)
(75) – –
(8,060)
75
262
211 2,134
209
286
6
– 1,365
279
2,290
3,235 324
–
660 75
1,339
(1,755)
(730)
151
1,923
–
273
76
(202)
257
–
– (339) –
X2A0T
page 2
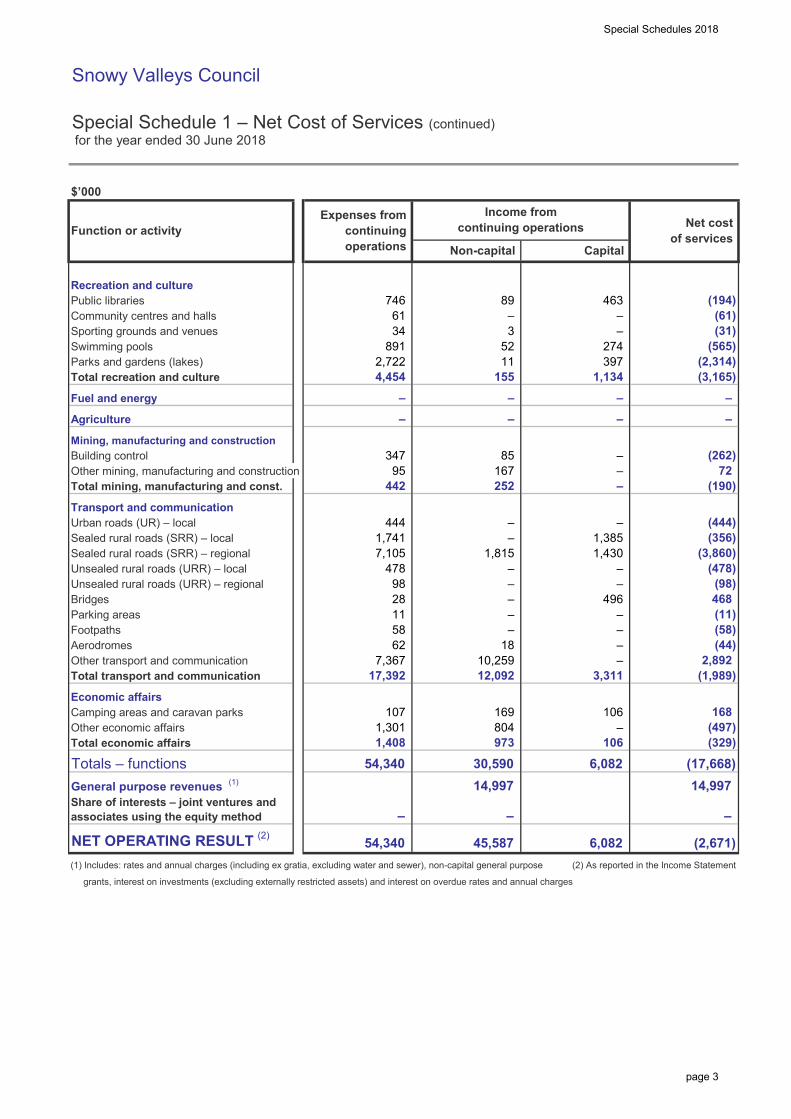
Special Schedules 2018
Snowy Valleys Council
Special Schedule 1 – Net Cost of Services (continued) for the year ended 30 June 2018
$’000
Recreation and culturePublic librariesCommunity centres and hallsSporting grounds and venuesSwimming poolsParks and gardens (lakes)Total recreation and culture
Fuel and energy
Agriculture
Mining, manufacturing and constructionBuilding controlOther mining, manufacturing and constructionTotal mining, manufacturing and const.
Transport and communicationUrban roads (UR) – localSealed rural roads (SRR) – localSealed rural roads (SRR) – regionalUnsealed rural roads (URR) – localUnsealed rural roads (URR) – regionalBridgesParking areasFootpathsAerodromesOther transport and communicationTotal transport and communication
Economic affairsCamping areas and caravan parksOther economic affairsTotal economic affairs
Totals – functionsGeneral purpose revenues (1)
NET OPERATING RESULT (2)
(1) Includes: rates and annual charges (including ex gratia, excluding water and sewer), non-capital general purpose (2) As reported in the Income Statement
grants, interest on investments (excluding externally restricted assets) and interest on overdue rates and annual charges
Income fromcontinuing operations
52
89
54,340
–
17,392 12,092
1,408 1,301
45,587
973
169 107
14,997 54,340
804
–
30,590
– 106
6,082
–
–
– 18 –
10,259
11
7,367 62 58 –
28
3,311
Function or activity
252 –
–
–
167 –
–
–
–
496 –
–
–
95
– 1,134 4,454 155
– –
–
442
347
1,741 –
Non-capital.
Expenses from. continuing. operations.
2,722
34 891
–
1,815 478
444 –
7,105
85
3
1,385
(58)
(565)
(3,165) 397 11
Capital.
463 –
274
98
1,430 – –
6,082
(3,860) (478)
(98)
(2,671)
–
(17,668) (329)
168
(1,989) 2,892
(497)
(11)
(44)
106
–
14,997
746 (194) 61
468
(190)
(31) (61)
–
Net cost.of services.
(262) 72
(444) (356)
–
(2,314)
Share of interests – joint ventures and associates using the equity method
page 3
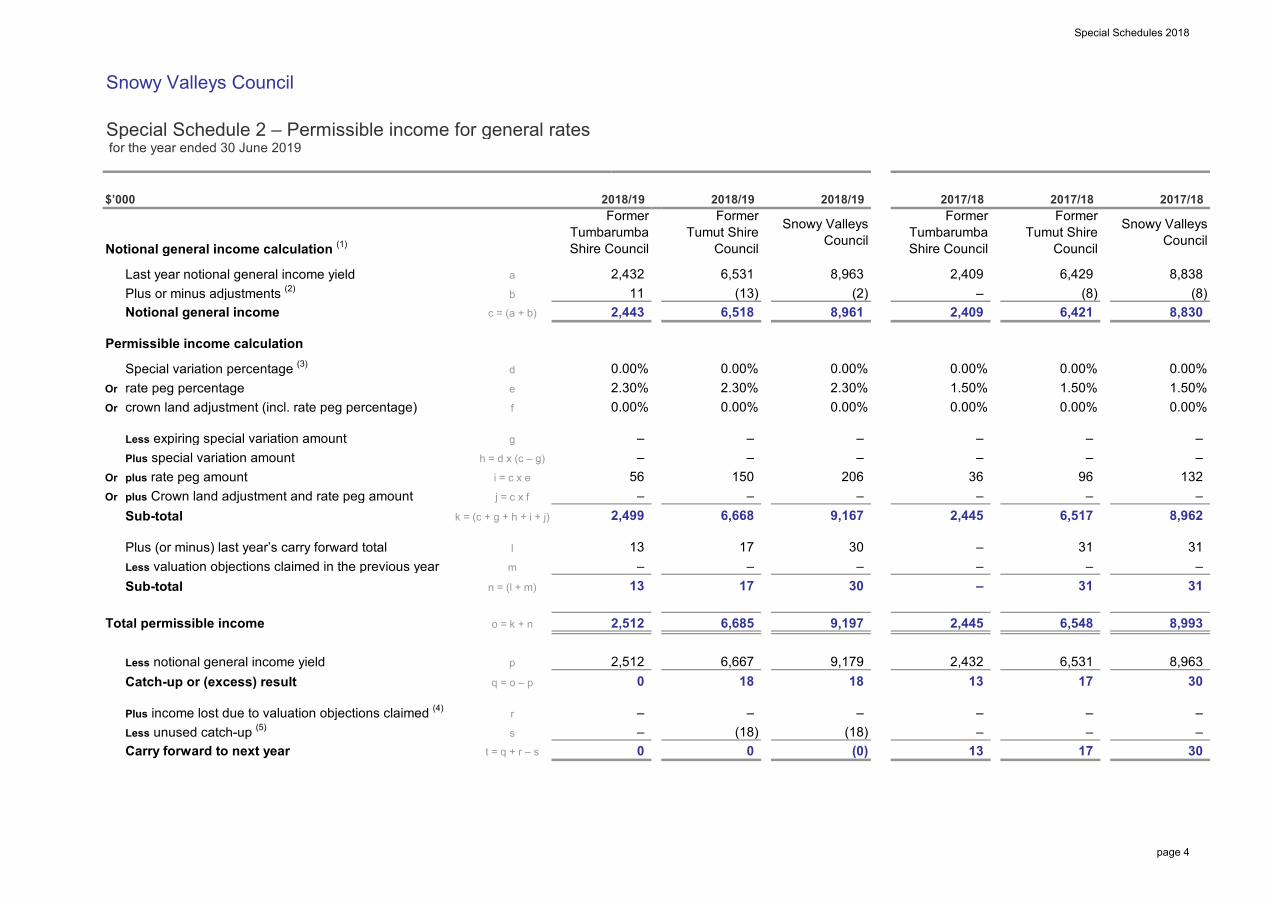
Special Schedules 2018
Snowy Valleys Council
Special Schedule 2 – Permissible income for general rates for the year ended 30 June 2019
$’000
Notional general income calculation (1)
Last year notional general income yieldPlus or minus adjustments (2)
Notional general income
Permissible income calculation
Special variation percentage (3)
Or rate peg percentageOr crown land adjustment (incl. rate peg percentage)
Less expiring special variation amountPlus special variation amount
Or plus rate peg amountOr plus Crown land adjustment and rate peg amount
Sub-total
Plus (or minus) last year’s carry forward totalLess valuation objections claimed in the previous yearSub-total
Total permissible income
Less notional general income yieldCatch-up or (excess) result
Plus income lost due to valuation objections claimed (4)
Less unused catch-up (5)
Carry forward to next year
Former Tumbarumba Shire Council
Former Tumbarumba Shire Council
FormerTumut Shire
Council
2018/19 2018/19 2018/19 2017/18 2017/18 2017/18
b 11
FormerTumut Shire
Council
Snowy Valleys Council
a 2,432 6,531 8,963 2,409 6,429 8,838
Snowy Valleys Council
c = (a + b) 2,443 6,518 8,961 – (8) (8)
2,409 6,421 8,830 (13) (2)
e 2.30%d 0.00% 0.00% 0.00% 0.00% 0.00% 0.00%
f 0.00% 0.00% 0.00%1.50% 1.50%
0.00% 0.00% 0.00%2.30% 2.30% 1.50%
h = d x (c – g) – g – – – – – –
j = c x f –
– – – i = c x e 56 150 206 36 96 132
– –
– – – k = (c + g + h + i + j) 2,499 6,668 9,167 2,445 6,517 8,962
– –
– l 13 17 30 – 31 31
– – – n = (l + m) 13 17 30 – 31 31
– – m
o = k + n 2,512 6,685 9,197 2,445 6,548 8,993
– –
q = o – p 0 p 2,512 6,667 9,179 2,432 6,531 8,963
13 17 30 18 18
– s – (18) (18) – – –
– – r –
13 17 30 0 (0) t = q + r – s 0
X3A0T
page 4
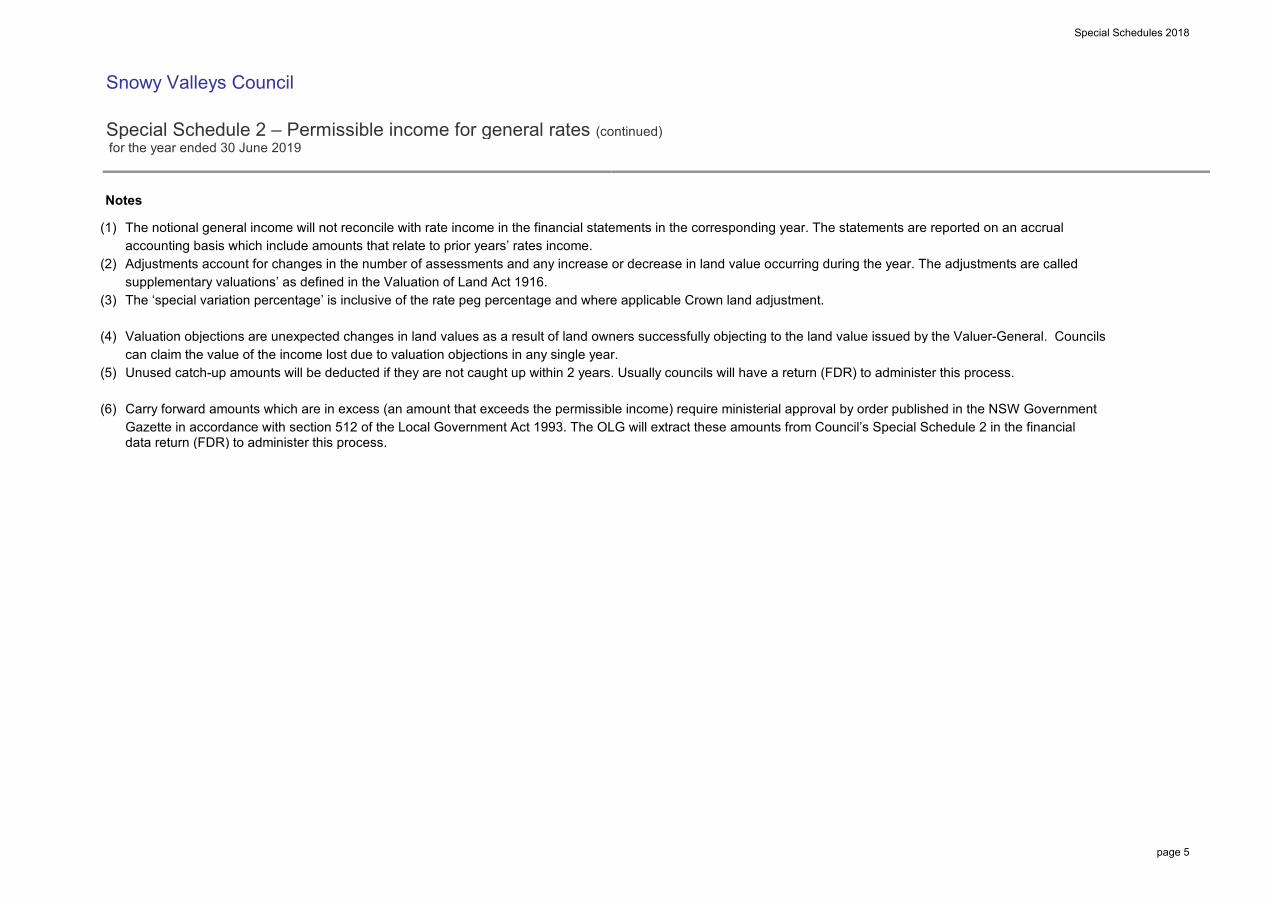
Special Schedules 2018
Snowy Valleys Council
Special Schedule 2 – Permissible income for general rates (continued) for the year ended 30 June 2019
Notes
(1) The notional general income will not reconcile with rate income in the financial statements in the corresponding year. The statements are reported on an accrualaccounting basis which include amounts that relate to prior years’ rates income.
(2) Adjustments account for changes in the number of assessments and any increase or decrease in land value occurring during the year. The adjustments are calledsupplementary valuations’ as defined in the Valuation of Land Act 1916.
(3) The ‘special variation percentage’ is inclusive of the rate peg percentage and where applicable Crown land adjustment.
(4) Valuation objections are unexpected changes in land values as a result of land owners successfully objecting to the land value issued by the Valuer-General. Councilscan claim the value of the income lost due to valuation objections in any single year.
(5) Unused catch-up amounts will be deducted if they are not caught up within 2 years. Usually councils will have a return (FDR) to administer this process.
(6) Carry forward amounts which are in excess (an amount that exceeds the permissible income) require ministerial approval by order published in the NSW GovernmentGazette in accordance with section 512 of the Local Government Act 1993. The OLG will extract these amounts from Council’s Special Schedule 2 in the financialdata return (FDR) to administer this process.
page 5
INDEPENDENT AUDITOR’S REPORT
Special Schedule 2 - Permissible Income for general rates
Snowy Valleys Council
To the Councillors of Snowy Valleys Council
Opinion
I have audited the accompanying Special Schedule 2 – Permissible Income for general rates (the
Schedule) of Snowy Valleys Council (the Council) for the year ending 30 June 2019.
In my opinion, the Schedule of the Council for the year ending 30 June 2019 is prepared, in all
material respects in accordance with the requirements of the Local Government Code of Accounting
Practice and Financial Reporting (LG Code) issued by the Office of Local Government (OLG), and is
in accordance with the books and records of the Council.
My opinion should be read in conjunction with the rest of this report.
Basis for Opinion
I conducted my audit in accordance with Australian Auditing Standards. My responsibilities under the
standards are described in the ‘Auditor’s Responsibilities for the Audit of the Schedule’ section of my
report.
I am independent of the Council in accordance with the requirements of the:
• Australian Auditing Standards
• Accounting Professional and Ethical Standards Board’s APES 110 ‘Code of Ethics for
Professional Accountants’ (APES 110).
I have fulfilled my other ethical responsibilities in accordance with APES 110.
Parliament promotes independence by ensuring the Auditor-General and the Audit Office of
New South Wales are not compromised in their roles by:
• providing that only Parliament, and not the executive government, can remove an
Auditor-General
• mandating the Auditor-General as auditor of councils
• precluding the Auditor-General from providing non-audit services.
I believe that the audit evidence I have obtained is sufficient and appropriate to provide a basis for my
audit opinion.
Other Information
Other information comprises the information included in the Council’s annual report for the year ended
30 June 2018, other than the Schedule and my Independent Auditor’s Report thereon. The Councillors
are responsible for the other information. At the date of this Independent Auditor’s Report, the other
information I have received comprise the general purpose financial statements, special purpose
financial statements and the Special Schedules excluding Special Schedule 2 (the other Schedules).
My opinion on the Schedule does not cover the other information. Accordingly, I do not express any
form of assurance conclusion on the other information. However, as required by the Local
Government Act 1993, I have separately expressed an opinion on the general purpose financial
statements and the special purpose financial statements.
In connection with my audit of the Schedule, my responsibility is to read the other information and, in
doing so, consider whether the other information is materially inconsistent with the Schedule or my
knowledge obtained in the audit, or otherwise appears to be materially misstated.
If, based on the work I have performed, I conclude there is a material misstatement of the other
information, I must report that fact.
I have nothing to report in this regard.
The Councillors’ Responsibilities for the Schedule
The Councillors are responsible for the preparation of the Schedule in accordance with the LG Code.
The Councillors’ responsibility also includes such internal control as the Councillors determine is
necessary to enable the preparation of the Schedule that is free from material misstatement, whether
due to fraud or error.
In preparing the Schedule, the Councillors are responsible for assessing the Council’s ability to
continue as a going concern, disclosing, as applicable, matters related to going concern and using the
going concern basis of accounting, unless it is not appropriate to do so.
Auditor’s Responsibilities for the Audit of the Schedule
My objectives are to:
• obtain reasonable assurance whether the Schedule as a whole is free from material
misstatement, whether due to fraud or error
• issue an Independent Auditor’s Report including my opinion.
Reasonable assurance is a high level of assurance, but does not guarantee an audit conducted in
accordance with Australian Auditing Standards will always detect material misstatements.
Misstatements can arise from fraud or error. Misstatements are considered material if, individually or
in aggregate, they could reasonably be expected to influence the economic decisions users take
based on the Schedule.
A description of my responsibilities for the audit of the Schedule is located at the Auditing and
Assurance Standards Board website at: www.auasb.gov.au/auditors_responsibilities/ar8.pdf. The
description forms part of my auditor’s report.
My opinion does not provide assurance:
• that the Council carried out its activities effectively, efficiently and economically
• about the security and controls over the electronic publication of the audited Schedule on any
website where it may be presented
• about any other information which may have been hyperlinked to/from the Schedule.
Lawrissa Chan
Director
30 November 2018
SYDNEY
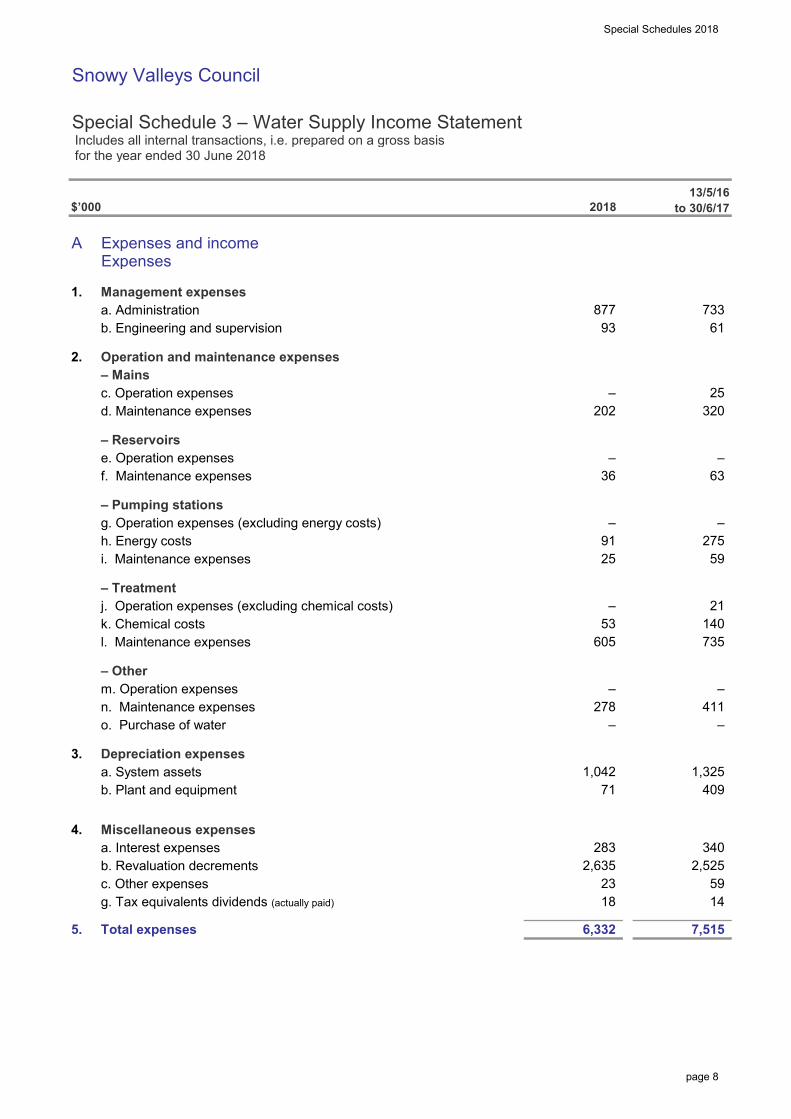
Special Schedules 2018
Snowy Valleys Council
Special Schedule 3 – Water Supply Income Statement Includes all internal transactions, i.e. prepared on a gross basis for the year ended 30 June 2018
$’000
A Expenses and incomeExpenses
1. Management expensesa. Administrationb. Engineering and supervision
2. Operation and maintenance expenses– Mainsc. Operation expensesd. Maintenance expenses
– Reservoirse. Operation expensesf. Maintenance expenses
– Pumping stationsg. Operation expenses (excluding energy costs)h. Energy costsi. Maintenance expenses
– Treatmentj. Operation expenses (excluding chemical costs)k. Chemical costsl. Maintenance expenses
– Otherm. Operation expensesn. Maintenance expenseso. Purchase of water
3. Depreciation expensesa. System assetsb. Plant and equipment
4. Miscellaneous expensesa. Interest expensesb. Revaluation decrementsc. Other expensesg. Tax equivalents dividends (actually paid)
5. Total expenses
13/5/16to 30/6/17
7,515
733 93 61
2018
6,332
877
1,042
320 202
63 – –
– 25
36
21
59
– – 275
25
735
91
605
– 53 140
–
– –
– 411 278
1,325
59 2,525
283 2,635
340
71
18
409
23 14
X5A0T
page 8
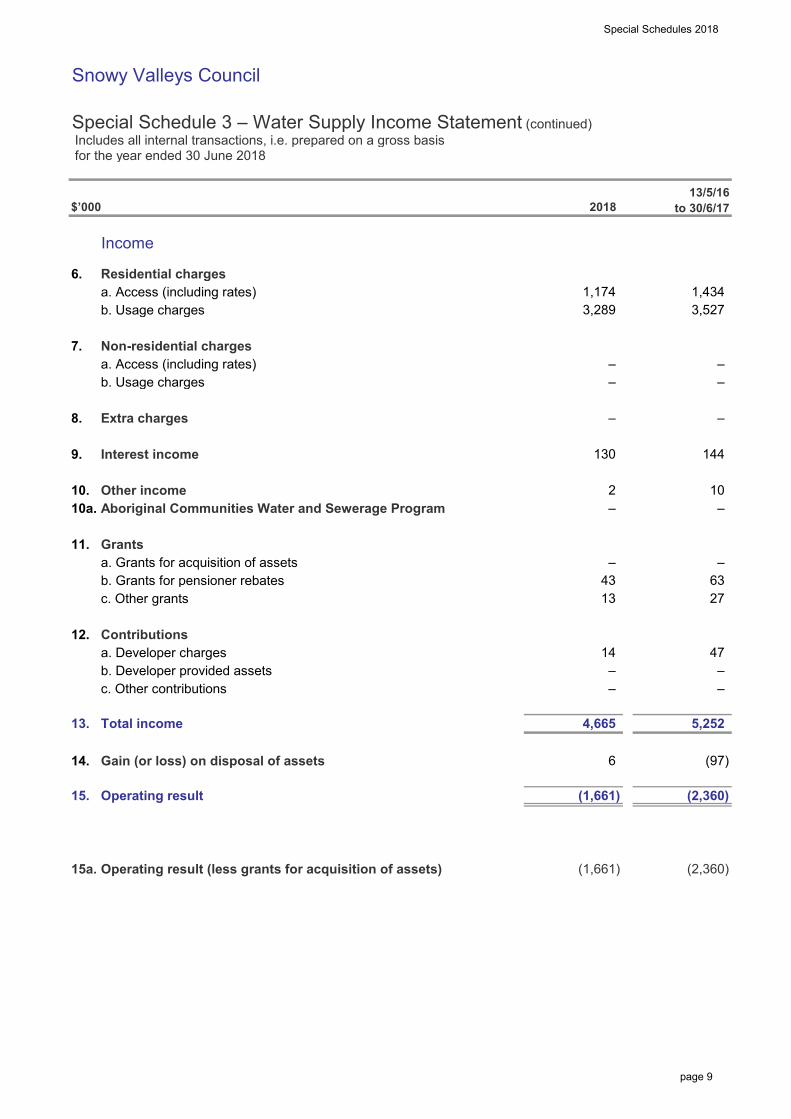
Special Schedules 2018
Snowy Valleys Council
Special Schedule 3 – Water Supply Income Statement (continued) Includes all internal transactions, i.e. prepared on a gross basis for the year ended 30 June 2018
$’000
Income
6. Residential chargesa. Access (including rates)b. Usage charges
7. Non-residential chargesa. Access (including rates)b. Usage charges
8. Extra charges
9. Interest income
10. Other income10a. Aboriginal Communities Water and Sewerage Program
11. Grantsa. Grants for acquisition of assetsb. Grants for pensioner rebatesc. Other grants
12. Contributionsa. Developer chargesb. Developer provided assetsc. Other contributions
13. Total income
14. Gain (or loss) on disposal of assets
15. Operating result
15a. Operating result (less grants for acquisition of assets)
13/5/16to 30/6/17
(2,360) (1,661)
3,289 1,174
–
–
5,252
–
2
144
1,434
–
14
4,665
–
130
–
–
3,527
2018
(2,360)
47 –
10
– 43 63
–
–
– –
13 27
(1,661)
6 (97)
–
page 9
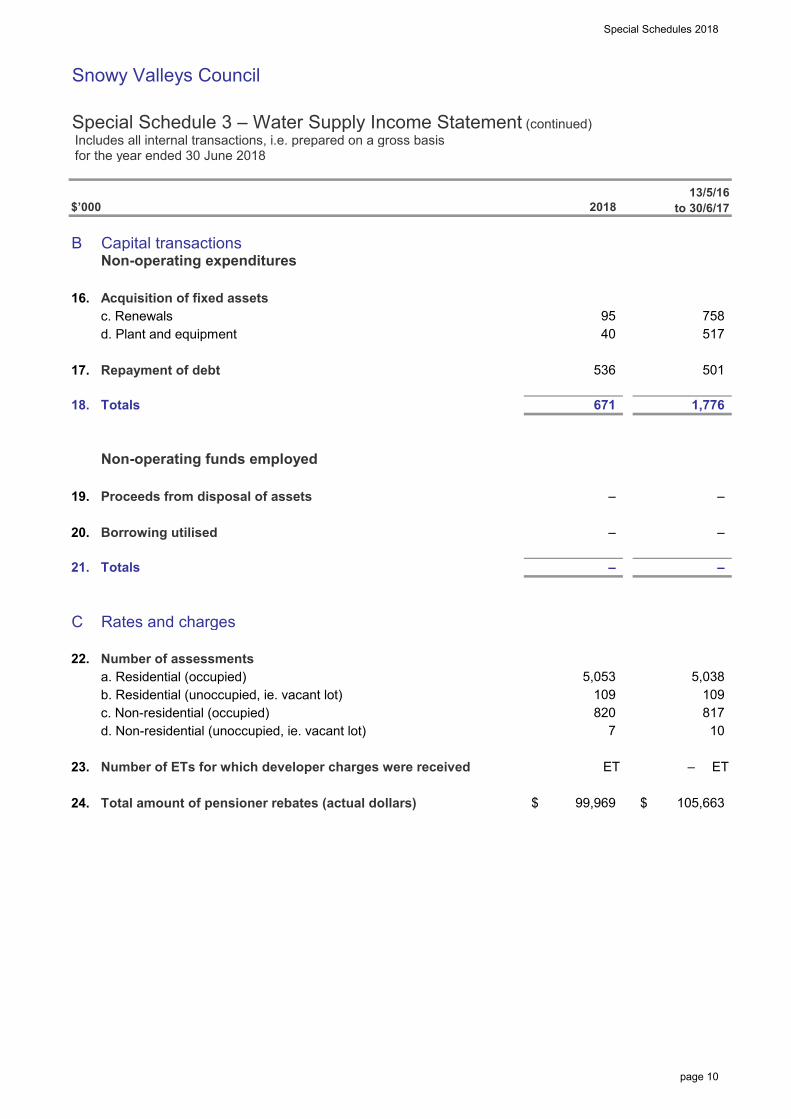
Special Schedules 2018
Snowy Valleys Council
Special Schedule 3 – Water Supply Income Statement (continued) Includes all internal transactions, i.e. prepared on a gross basis for the year ended 30 June 2018
$’000
B Capital transactionsNon-operating expenditures
16. Acquisition of fixed assetsc. Renewalsd. Plant and equipment
17. Repayment of debt
18. Totals
Non-operating funds employed
19. Proceeds from disposal of assets
20. Borrowing utilised
21. Totals
C Rates and charges
22. Number of assessmentsa. Residential (occupied)b. Residential (unoccupied, ie. vacant lot)c. Non-residential (occupied)d. Non-residential (unoccupied, ie. vacant lot)
23. Number of ETs for which developer charges were received
24. Total amount of pensioner rebates (actual dollars)
13/5/16to 30/6/17
817 10
820 7
– ETET
105,663$ 99,969$
– –
536
758
109 109 5,038 5,053
2018
– –
95 517
501
–
1,776
40
671
–
page 10
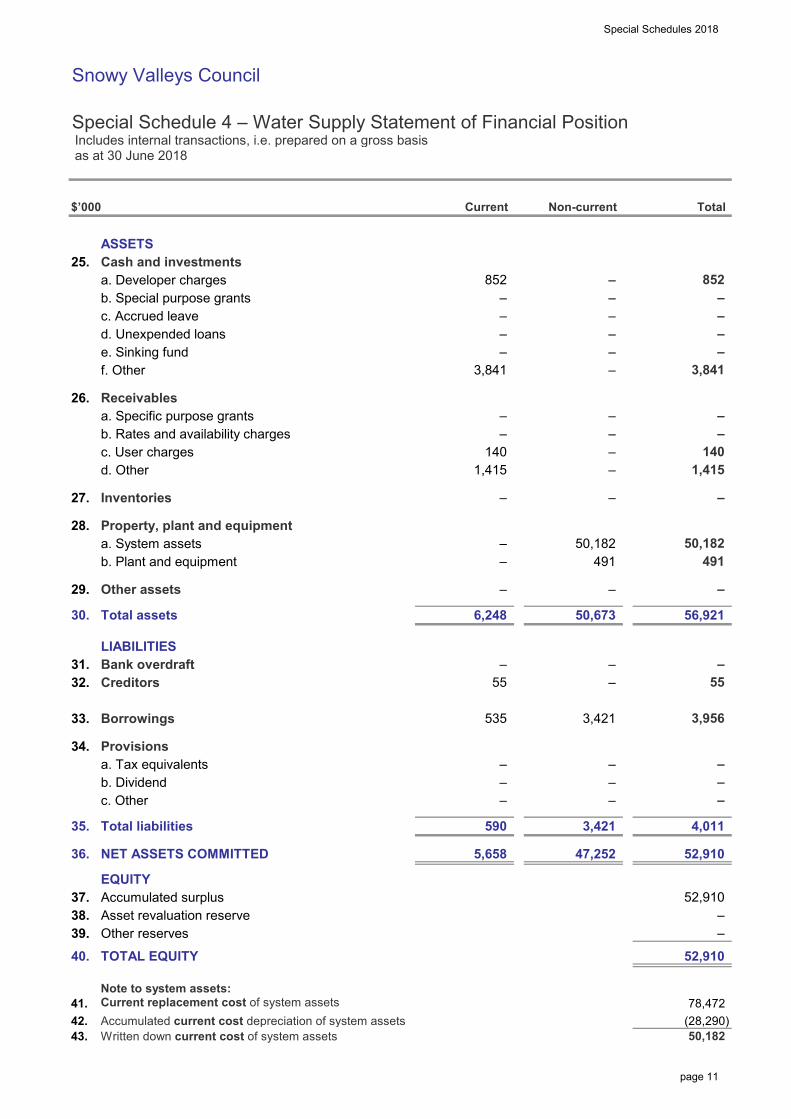
Special Schedules 2018
Snowy Valleys Council
Special Schedule 4 – Water Supply Statement of Financial Position Includes internal transactions, i.e. prepared on a gross basis as at 30 June 2018
$’000
ASSETS25. Cash and investments
a. Developer chargesb. Special purpose grantsc. Accrued leaved. Unexpended loanse. Sinking fundf. Other
26. Receivablesa. Specific purpose grantsb. Rates and availability chargesc. User chargesd. Other
27. Inventories
28. Property, plant and equipmenta. System assetsb. Plant and equipment
29. Other assets
30. Total assets
LIABILITIES31. Bank overdraft32. Creditors
33. Borrowings
34. Provisionsa. Tax equivalentsb. Dividendc. Other
35. Total liabilities
36. NET ASSETS COMMITTED
EQUITY37. Accumulated surplus38. Asset revaluation reserve39. Other reserves
40. TOTAL EQUITY
Note to system assets:41. Current replacement cost of system assets42. Accumulated current cost depreciation of system assets43. Written down current cost of system assets
Current
852 –
– –
–
– –
–
Total
852
– –
50,182
3,841
140 1,415
Non-current
–
–
55
–
–
–
1,415
–
3,841 –
140
50,673
–
– –
–
6,248
50,182
– – – –
–
– –
52,910
50,182
78,472 (28,290)
–
52,910
52,910
4,011
–
–
–
–
–
56,921
–
47,252 5,658
–
3,421 3,956 535
3,421
–
– –
– –
–
491
– 55
491
–
– –
590
X6A0T
page 11
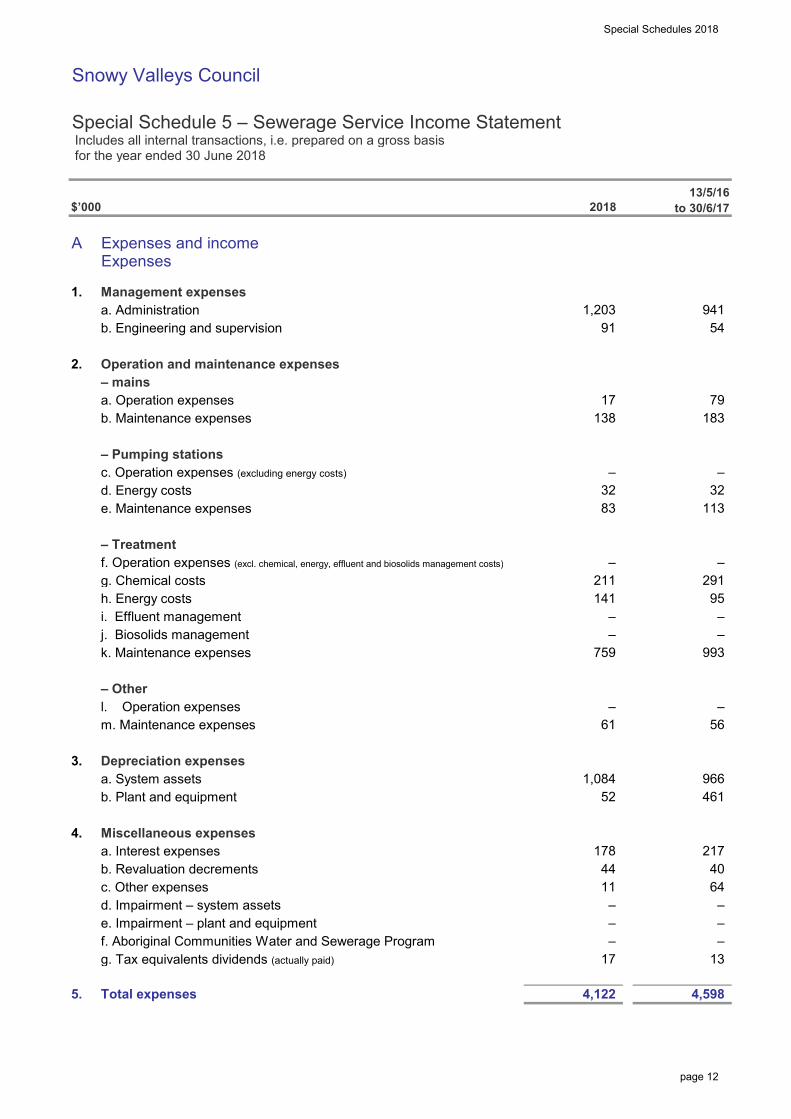
Special Schedules 2018
Snowy Valleys Council
Special Schedule 5 – Sewerage Service Income Statement Includes all internal transactions, i.e. prepared on a gross basis for the year ended 30 June 2018
$’000
A Expenses and incomeExpenses
1. Management expensesa. Administrationb. Engineering and supervision
2. Operation and maintenance expenses– mainsa. Operation expensesb. Maintenance expenses
– Pumping stationsc. Operation expenses (excluding energy costs)
d. Energy costse. Maintenance expenses
– Treatmentf. Operation expenses (excl. chemical, energy, effluent and biosolids management costs)
g. Chemical costsh. Energy costsi. Effluent managementj. Biosolids managementk. Maintenance expenses
– Otherl. Operation expensesm. Maintenance expenses
3. Depreciation expensesa. System assetsb. Plant and equipment
4. Miscellaneous expensesa. Interest expensesb. Revaluation decrementsc. Other expensesd. Impairment – system assetse. Impairment – plant and equipmentf. Aboriginal Communities Water and Sewerage Programg. Tax equivalents dividends (actually paid)
5. Total expenses
13/5/16to 30/6/17
32
211 141
113
966 52
–
32 83
–
–
95
–
–
64 44 40
17 13
291
11
178 217
– –
–
461
– – –
– –
– 993
56
4,122 4,598
1,084
941 91 54
–
138 79 17
–
183
2018
1,203
759
61
X7A0T
page 12
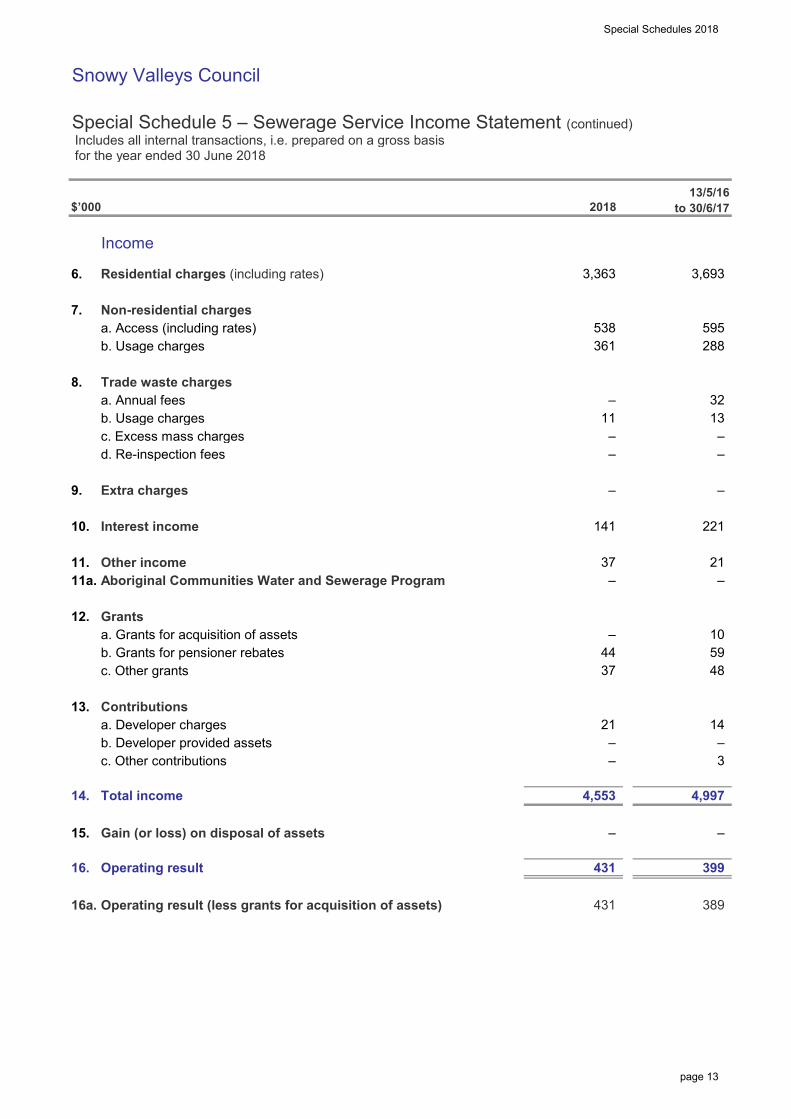
Special Schedules 2018
Snowy Valleys Council
Special Schedule 5 – Sewerage Service Income Statement (continued) Includes all internal transactions, i.e. prepared on a gross basis for the year ended 30 June 2018
$’000
Income
6. Residential charges (including rates)
7. Non-residential chargesa. Access (including rates)b. Usage charges
8. Trade waste chargesa. Annual feesb. Usage chargesc. Excess mass chargesd. Re-inspection fees
9. Extra charges
10. Interest income
11. Other income11a. Aboriginal Communities Water and Sewerage Program
12. Grantsa. Grants for acquisition of assetsb. Grants for pensioner rebatesc. Other grants
13. Contributionsa. Developer chargesb. Developer provided assetsc. Other contributions
14. Total income
15. Gain (or loss) on disposal of assets
16. Operating result
16a. Operating result (less grants for acquisition of assets)
13/5/16to 30/6/17
3,693 3,363
2018
21 14
37 21 – –
37 48
–
–
59 – 10
4,553 4,997
–
389
–
361 538
–
44
141 221
11 13
– –
–
32
595 288
– – –
431 399
431
– 3
page 13
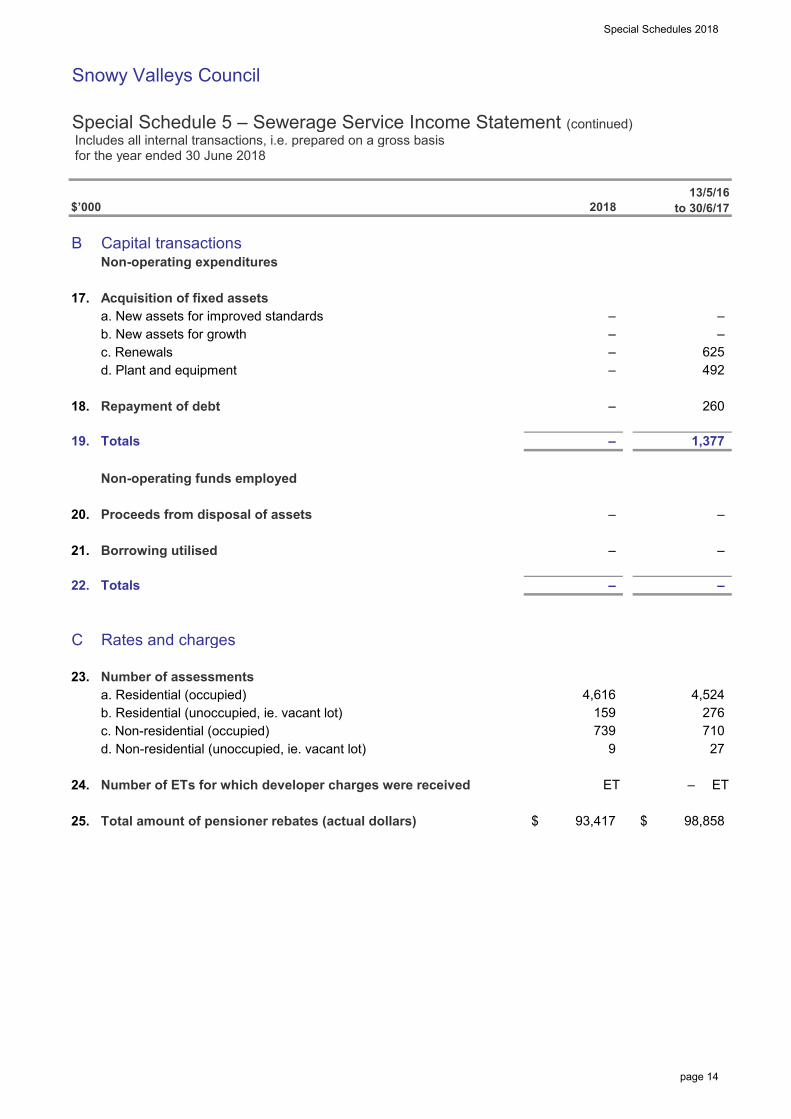
Special Schedules 2018
Snowy Valleys Council
Special Schedule 5 – Sewerage Service Income Statement (continued) Includes all internal transactions, i.e. prepared on a gross basis for the year ended 30 June 2018
$’000
B Capital transactionsNon-operating expenditures
17. Acquisition of fixed assetsa. New assets for improved standardsb. New assets for growthc. Renewalsd. Plant and equipment
18. Repayment of debt
19. Totals
Non-operating funds employed
20. Proceeds from disposal of assets
21. Borrowing utilised
22. Totals
C Rates and charges
23. Number of assessmentsa. Residential (occupied)b. Residential (unoccupied, ie. vacant lot)c. Non-residential (occupied)d. Non-residential (unoccupied, ie. vacant lot)
24. Number of ETs for which developer charges were received
25. Total amount of pensioner rebates (actual dollars)
13/5/16to 30/6/17
–
–
276 710
4,524
–
–
–
ET
93,417$
–
739 159
9
–
–
4,616
27
– ET
98,858$
1,377 –
– – 625 –
–
492
260
–
2018
page 14
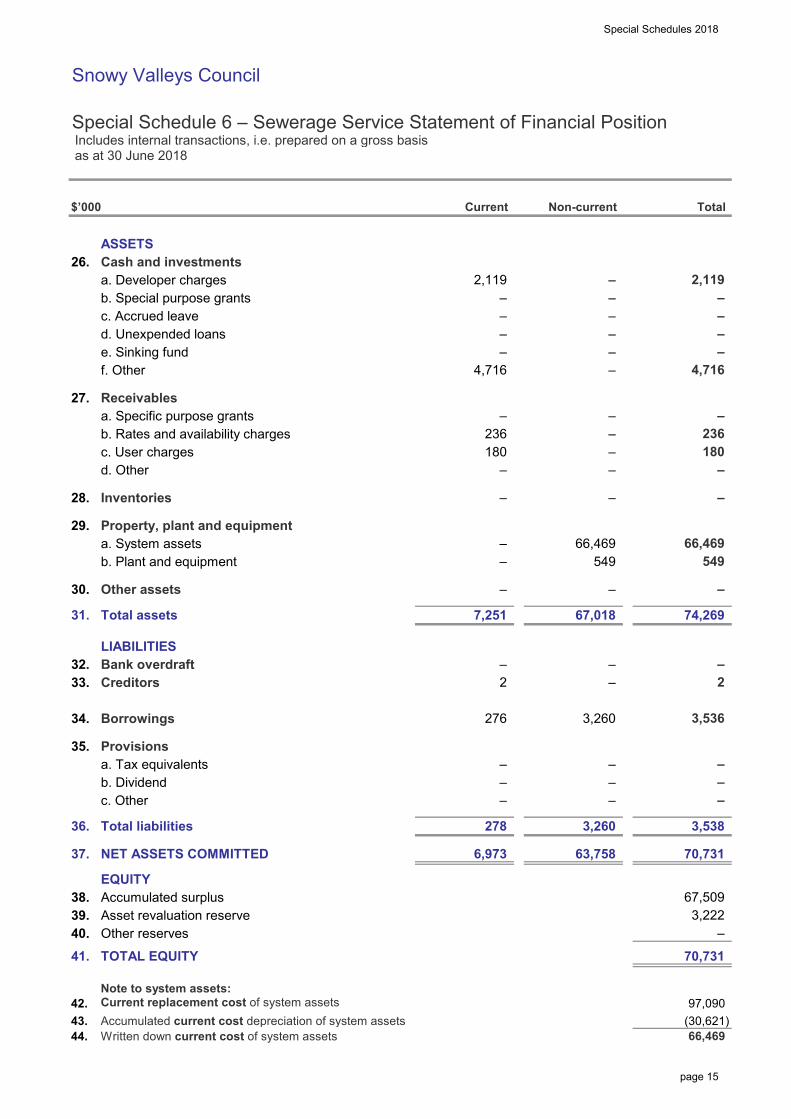
Special Schedules 2018
Snowy Valleys Council
Special Schedule 6 – Sewerage Service Statement of Financial Position Includes internal transactions, i.e. prepared on a gross basis as at 30 June 2018
$’000
ASSETS26. Cash and investments
a. Developer chargesb. Special purpose grantsc. Accrued leaved. Unexpended loanse. Sinking fundf. Other
27. Receivablesa. Specific purpose grantsb. Rates and availability chargesc. User chargesd. Other
28. Inventories
29. Property, plant and equipmenta. System assetsb. Plant and equipment
30. Other assets
31. Total assets
LIABILITIES32. Bank overdraft33. Creditors
34. Borrowings
35. Provisionsa. Tax equivalentsb. Dividendc. Other
36. Total liabilities
37. NET ASSETS COMMITTED
EQUITY38. Accumulated surplus39. Asset revaluation reserve40. Other reserves
41. TOTAL EQUITY
Note to system assets:42. Current replacement cost of system assets43. Accumulated current cost depreciation of system assets44. Written down current cost of system assets
6,973
–
2
– –
– –
–
278 3,260
–
– –
70,731
3,538
– – –
276
–
67,509
66,469
97,090 (30,621)
3,222
70,731
63,758
2
–
2,119
–
74,269
66,469
67,018
–
3,536
–
–
3,260
– – 549
66,469
7,251
–
549
180 – –
–
–
–
–
236
–
– –
–
–
180 –
– – –
– –
Non-current Current
4,716 – –
–
–
Total
– –
2,119
4,716
236
X8A0T
page 15
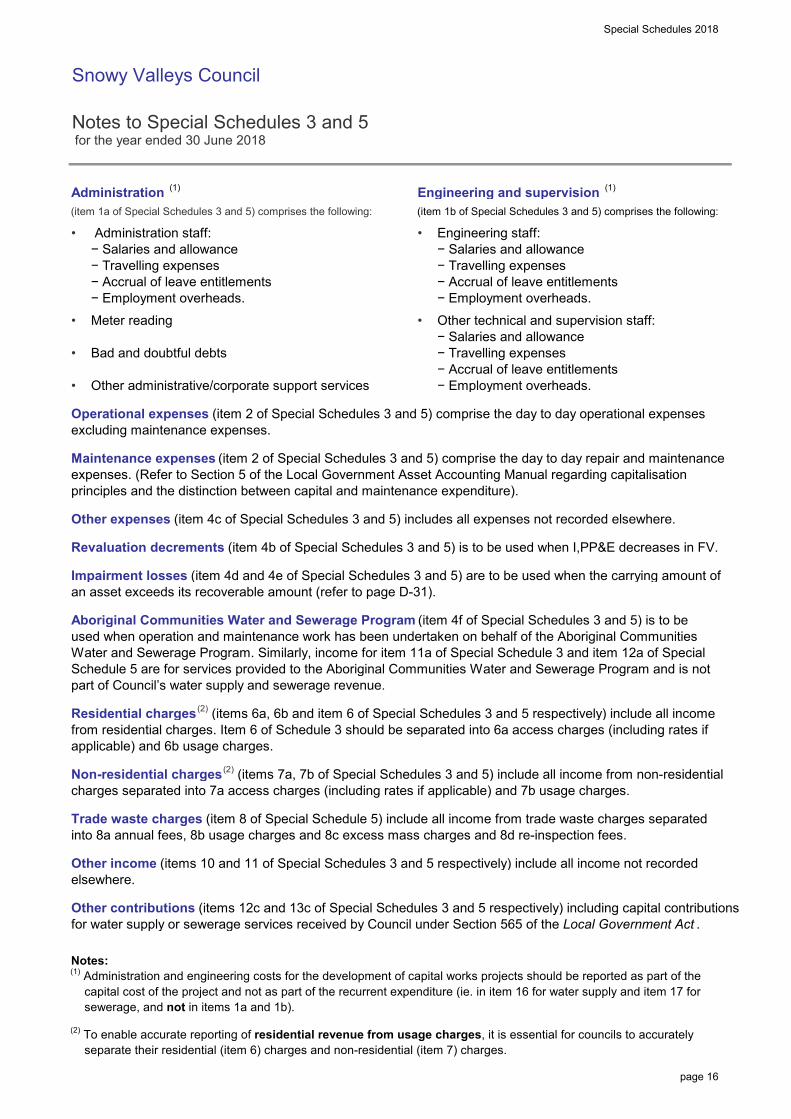
Special Schedules 2018
Snowy Valleys Council
Notes to Special Schedules 3 and 5 for the year ended 30 June 2018
Administration (1) Engineering and supervision (1)
(item 1a of Special Schedules 3 and 5) comprises the following: (item 1b of Special Schedules 3 and 5) comprises the following:
• Administration staff: • Engineering staff:− Salaries and allowance − Salaries and allowance− Travelling expenses − Travelling expenses− Accrual of leave entitlements − Accrual of leave entitlements− Employment overheads. − Employment overheads.
• Meter reading • Other technical and supervision staff:− Salaries and allowance
• Bad and doubtful debts − Travelling expenses− Accrual of leave entitlements
• Other administrative/corporate support services − Employment overheads.
Operational expenses (item 2 of Special Schedules 3 and 5) comprise the day to day operational expensesexcluding maintenance expenses.
Maintenance expenses (item 2 of Special Schedules 3 and 5) comprise the day to day repair and maintenanceexpenses. (Refer to Section 5 of the Local Government Asset Accounting Manual regarding capitalisationprinciples and the distinction between capital and maintenance expenditure).
Other expenses (item 4c of Special Schedules 3 and 5) includes all expenses not recorded elsewhere.
Revaluation decrements (item 4b of Special Schedules 3 and 5) is to be used when I,PP&E decreases in FV.
Impairment losses (item 4d and 4e of Special Schedules 3 and 5) are to be used when the carrying amount ofan asset exceeds its recoverable amount (refer to page D-31).
Aboriginal Communities Water and Sewerage Program (item 4f of Special Schedules 3 and 5) is to beused when operation and maintenance work has been undertaken on behalf of the Aboriginal CommunitiesWater and Sewerage Program. Similarly, income for item 11a of Special Schedule 3 and item 12a of SpecialSchedule 5 are for services provided to the Aboriginal Communities Water and Sewerage Program and is notpart of Council’s water supply and sewerage revenue.
Residential charges
(2) (items 6a, 6b and item 6 of Special Schedules 3 and 5 respectively) include all incomefrom residential charges. Item 6 of Schedule 3 should be separated into 6a access charges (including rates ifapplicable) and 6b usage charges.
Non-residential charges
(2) (items 7a, 7b of Special Schedules 3 and 5) include all income from non-residentialcharges separated into 7a access charges (including rates if applicable) and 7b usage charges.
Trade waste charges (item 8 of Special Schedule 5) include all income from trade waste charges separatedinto 8a annual fees, 8b usage charges and 8c excess mass charges and 8d re-inspection fees.
Other income (items 10 and 11 of Special Schedules 3 and 5 respectively) include all income not recordedelsewhere.
Other contributions (items 12c and 13c of Special Schedules 3 and 5 respectively) including capital contributionsfor water supply or sewerage services received by Council under Section 565 of the Local Government Act .
Notes:(1) Administration and engineering costs for the development of capital works projects should be reported as part of the
capital cost of the project and not as part of the recurrent expenditure (ie. in item 16 for water supply and item 17 forsewerage, and not in items 1a and 1b).
(2) To enable accurate reporting of residential revenue from usage charges, it is essential for councils to accuratelyseparate their residential (item 6) charges and non-residential (item 7) charges.
X9A0T
page 16
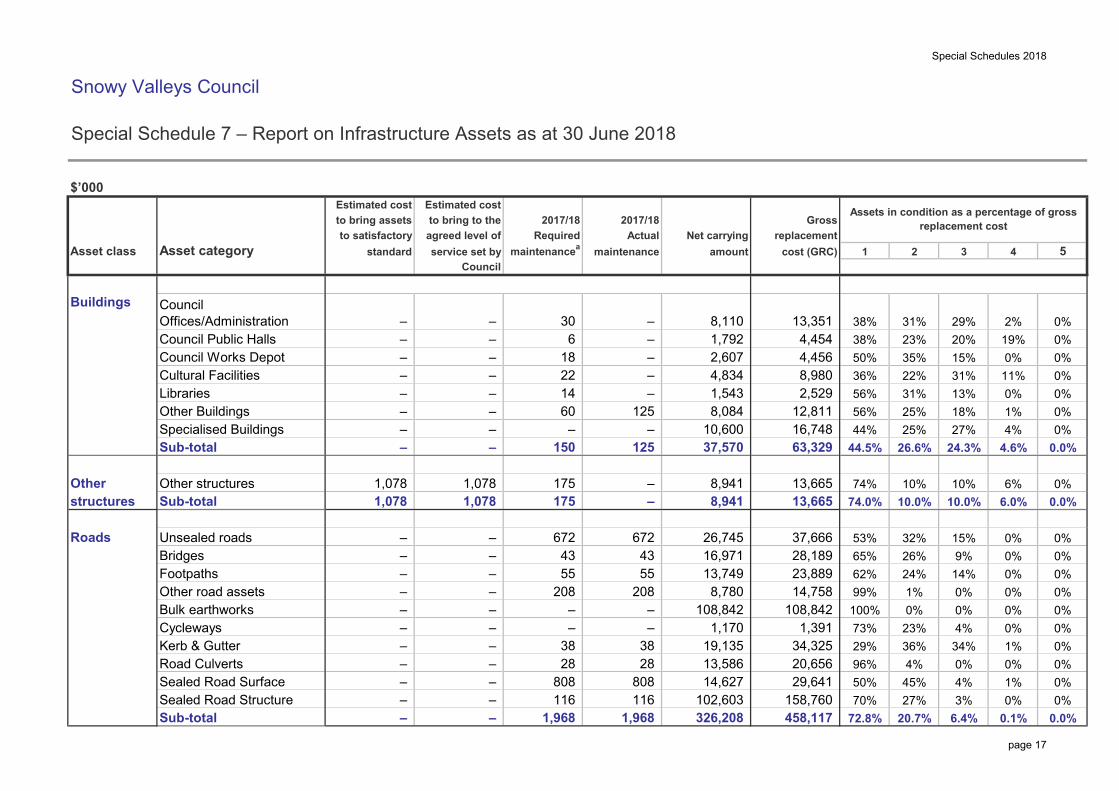
Special Schedules 2018
Snowy Valleys Council
Special Schedule 7 – Report on Infrastructure Assets as at 30 June 2018
$’000
0%29,641 50% 45% 0%
96%0%
458,117
4%
0.0%
0%
11%
–
–
0%0%
14
1,968
74.0%
–
55
–
672
208
0%
72.8%
13,665 6.0%
–
–
28 –
Sub-total
Sealed Road Surface – 808
– –
Sealed Road Structure
150
43 43
116
–
– 38 38 28
99%100%
34,325 29%23%73%
34%4%
– –
–
102,603
Libraries
26%24%
65%
10,600
Other road assets
Road Culverts
Bulk earthworks
55
Kerb & Gutter
– – –
–
–
808
Footpaths
0%0%4,456 50%
36%
– – – 37,666 0%
27%
0%
0%
0.0%
60 –
63,329 4.6%
22%15%31%
5
38%
Other Buildings
Council Works DepotCultural Facilities
3
0%0%
26.6%
25%25%
31%20%
4
125 4%
2%
56%
13,351
0%
29%– –
1%18%
35%–
13%
19%
44%
–
Sub-totalSpecialised Buildings
8,980 – –
38%23%
2,529 31%
30
22
Asset category
Council Public Halls – 6
Required Actual replacementcost (GRC)maintenancea
to satisfactory
Estimated cost
agreed level ofservice set by
Council
– –
Council Offices/Administration
21
9%
0.0%
0%0%
14,758
Sub-total
Asset class
to bring assetsEstimated cost
2017/18to bring to the 2017/18 Gross
standard maintenance
–
Buildings
1,792 2,607 4,834 –
4,454
– 18
–
–
24.3%
1,543 8,084 12,811
16,748
Unsealed roads
1%
56%–
1,078
– –
62%
–
672
10.0%1,078
14%0%
37,570
8,941
Cycleways
Bridges
1,078 8,941
26,745 16,971 13,749 8,780
108,842 1,170
Roads
structures
–
0%0%
6.4% 0.1%
20,656
208
36%
70% 27% 3% 0% 0%158,760 1%
20.7%1,968
14,627
326,208
– – – – – 125 44.5%
0%
13,586
Other Other structures 1,078 175 – 13,665 74% 10% 10% 6% 0%
0%
–
175
–
1%0%0%
0%23,889
0%0%
28,189
108,842
10.0%
0% 0%
19,135
Assets in condition as a percentage of gross replacement cost
Net carryingamount
8,110
4%
15%53% 32%
1,391
116
X10A0T
page 17
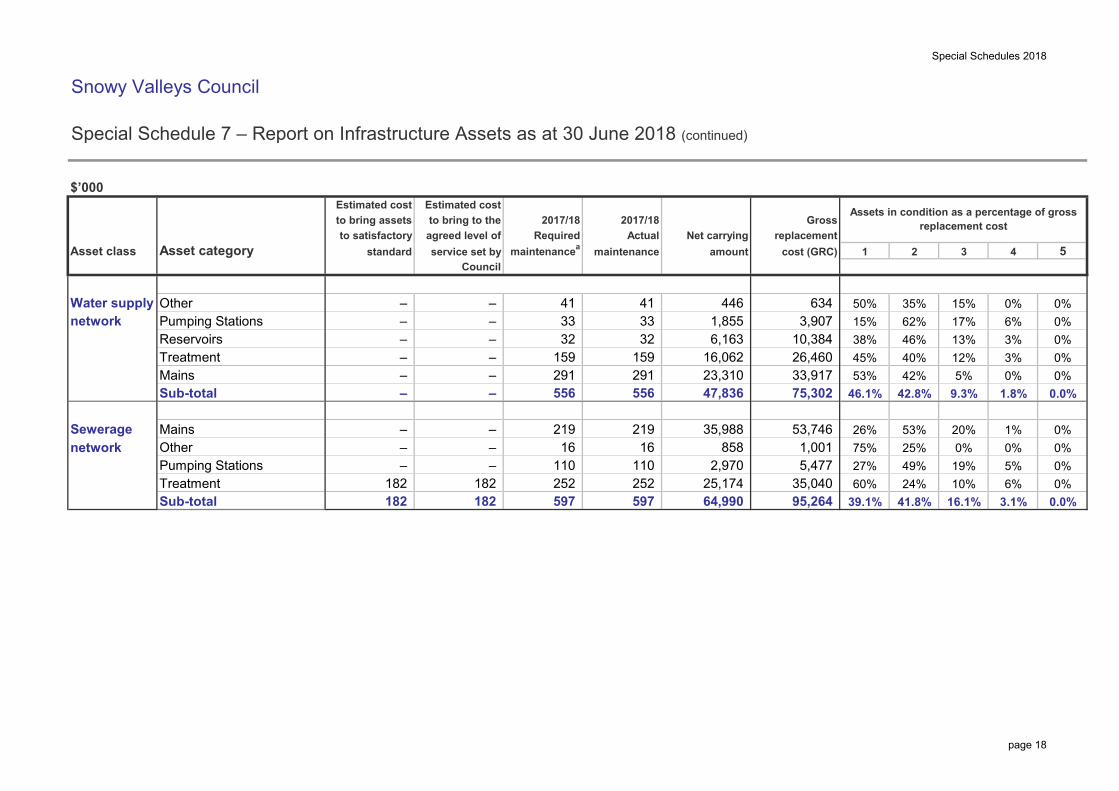
Special Schedules 2018
Snowy Valleys Council
Special Schedule 7 – Report on Infrastructure Assets as at 30 June 2018 (continued)
$’000
network 0% 0%1,001 19% 5%0%
41.8%
network Pumping Stations Water supply
Sewerage
Reservoirs
Other35,988 1%
597
15%
2
634 35% 0%17%
50%
3replacement
0%
GrossEstimated cost
1.8%42.8% 0.0%9.3%46.1%75,302
1
62%
cost (GRC)
0%
maintenance
–
ActualRequired2017/18
agreed level of
33
159 32
– 159
41 41
TreatmentMains
– – –
Other
Asset class
2017/18Estimated costto bring to the
service set byCouncil
45% 3%
6%24%
15%
40%3%
26,460 0%13%46%
5,477
4 5
6%
0%
Mains –
Sub-total
16 –
38%
556 –
33
to satisfactorystandard
to bring assets
maintenancea
23,310 47,836
Asset category
–
32 – 10,384
64,990 182 Sub-total
–
26% 53%53,746 25%
60%49%
597
16 – –
182
219
12%
0%
219
27%75%
0%
0%
110 35,040
110
– 291 291 33,917 556
95,264 3.1%39.1% 16.1%182
Pumping Stations Treatment 252
182
53% 42% 5%
20%
Net carryingamount
446
25,174 0.0%
– –
–
10%252
0%–
3,907
0%
Assets in condition as a percentage of gross replacement cost
1,855 6,163
16,062
858 2,970
page 18

Special Schedules 2018
Snowy Valleys Council
Special Schedule 7 – Report on Infrastructure Assets as at 30 June 2018 (continued)
$’000
drainage
Notes:a Required maintenance is the amount identified in Council’s asset management plans.
Infrastructure asset condition assessment ‘key’
Excellent/very good No work required (normal maintenance) Condition Description here…Good Only minor maintenance work required Condition Description here…Satisfactory Maintenance work required Condition Description here…Poor Renewal required Condition Description here…Very poor Urgent renewal/upgrading required Condition Description here…
5
0%
replacement
0%Stormwater
5
–
–
Open space/ recreational – 299
– –
maintenanceActualRequiredto satisfactory
standard
–
– – 20%79%29,619 Stormwater Converters
maintenancea
Estimated cost
agreed level of
21,240
10,768 3,188
–
Other Open Space/Recreation
36,427 Sub-total 79.6%
to bring to the
Council
0%111
4,111 17,013
4
–
3cost (GRC)
Gross
5 – 0%0%5 1%
14%
2017/18
21
– –
Asset category
Head Walls
33
48
2017/18
83%–
Net carryingamount
18%6,611
0.0%13,956
5 1.0% 99.0%1% 0% 0% 0% 99%
Swimming pools 93 47 47 5,436 67%93
0.0%–
0.0% 0.0%
0%4% 21%
8.3% 17.9%
5%
0.0%
0%7.1%
Asset class
19.6%
Stormwater Conduits Inlet and Junction Pits
1%
3%
service set by
0.0%– 9 5
0.8%
8%assetsSub-total
Other
–
192 15 – 82%
to bring assets
0%0% 0%
99%0%
93 346 346 7,839 66.7%
Estimated cost
299 2,403 66% 18% 11%
–
–
0%
5 5
– – assets Sub-total –
infrastructure Other Infrastructure Assets – 9
3,649 749,948 63.7% 25.7% 9.3% 1.2% 0.0%1,353
Assets in condition as a percentage of gross replacement cost
4321 6
10987
520,746 TOTAL – ALL ASSETS 1,353 3,792
– 93
page 19
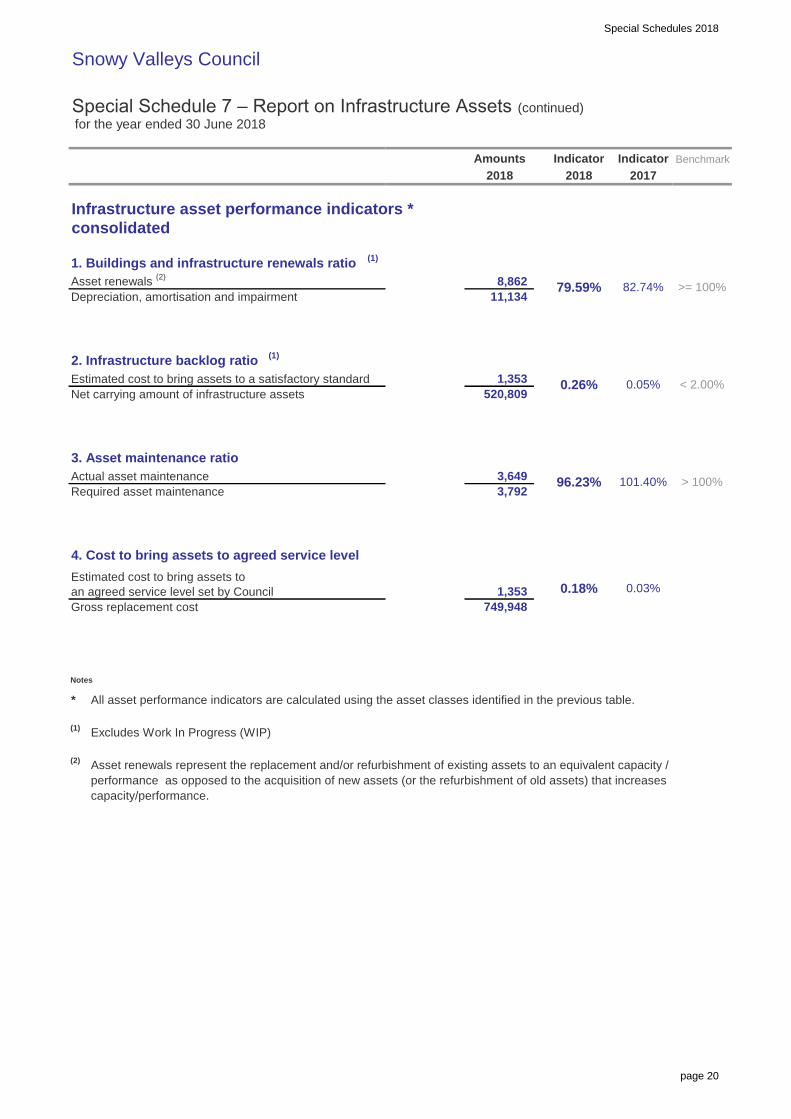
Special Schedules 2018
Snowy Valleys Council
Special Schedule 7 – Report on Infrastructure Assets (continued)
for the year ended 30 June 2018
$ ’000
Infrastructure asset performance indicators *
consolidated
1. Buildings and infrastructure renewals ratio(1)
Asset renewals (2)
Depreciation, amortisation and impairment
2. Infrastructure backlog ratio(1)
Estimated cost to bring assets to a satisfactory standard
Net carrying amount of infrastructure assets
3. Asset maintenance ratio
Actual asset maintenance
Required asset maintenance
4. Cost to bring assets to agreed service level
Gross replacement cost
Notes
* All asset performance indicators are calculated using the asset classes identified in the previous table.
(1)Excludes Work In Progress (WIP)
(2)Asset renewals represent the replacement and/or refurbishment of existing assets to an equivalent capacity /
capacity/performance as opposed to the acquisition of new assets (or the refurbishment of old assets) thatperformance as opposed to the acquisition of new assets (or the refurbishment of old assets) that increases
increases capacity/performance.capacity/performance.
1,353 0.18% 0.03%
749,948
Amounts Indicator Benchmark
2018 2018 2017
< 2.00%520,809
96.23% 101.40% > 100%
79.59% 82.74%11,134
1,353
3,792
8,862
0.05%
>= 100%
Estimated cost to bring assets to
an agreed service level set by Council
Indicator
3,649
0.26%
page 20
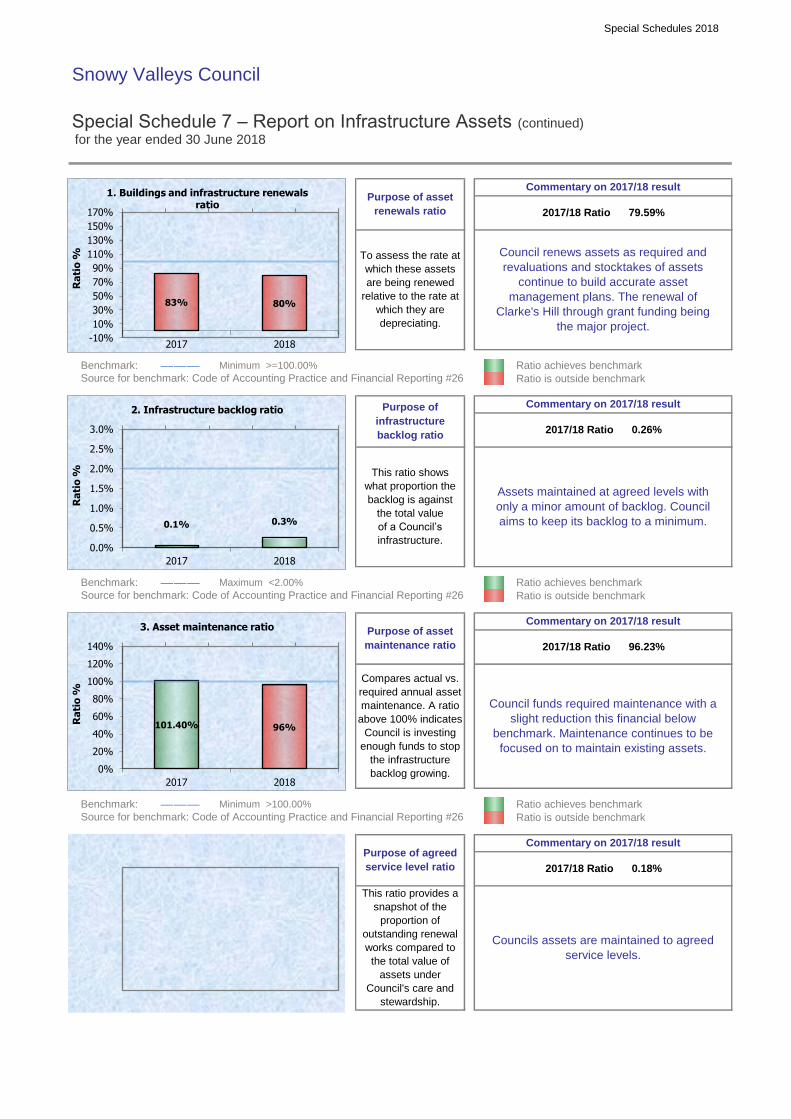
Special Schedules 2018
Snowy Valleys Council
Special Schedule 7 – Report on Infrastructure Assets (continued)
for the year ended 30 June 2018
Benchmark: ――― Minimum >=100.00% Ratio achieves benchmark
Source for benchmark: Code of Accounting Practice and Financial Reporting #26 Ratio is outside benchmark
Benchmark: ――― Maximum <2.00% Ratio achieves benchmark
Source for benchmark: Code of Accounting Practice and Financial Reporting #26 Ratio is outside benchmark
Benchmark: ――― Minimum >100.00% Ratio achieves benchmark
Source for benchmark: Code of Accounting Practice and Financial Reporting #26 Ratio is outside benchmark
Purpose of agreed
service level ratio
Commentary on 2017/18 result
2017/18 Ratio 0.18%
Council renews assets as required and
revaluations and stocktakes of assets
continue to build accurate asset
management plans. The renewal of
Clarke's Hill through grant funding being
the major project.
Commentary on 2017/18 result
2017/18 Ratio 0.26%
2017/18 Ratio 96.23%
Assets maintained at agreed levels with
only a minor amount of backlog. Council
aims to keep its backlog to a minimum.
Commentary on 2017/18 result
Purpose of asset
renewals ratio
Compares actual vs.
required annual asset
maintenance. A ratio
above 100% indicates
Council is investing
enough funds to stop
the infrastructure
backlog growing.
Council funds required maintenance with a
slight reduction this financial below
benchmark. Maintenance continues to be
focused on to maintain existing assets.
To assess the rate at
which these assets
are being renewed
relative to the rate at
which they are
depreciating.
Purpose of
infrastructure
backlog ratio
This ratio provides a
snapshot of the
proportion of
outstanding renewal
works compared to
the total value of
assets under
Council's care and
stewardship.
Councils assets are maintained to agreed
service levels.
Commentary on 2017/18 result
Purpose of asset
maintenance ratio
This ratio shows
what proportion the
backlog is against
the total value
of a Council’s
infrastructure.
2017/18 Ratio 79.59%
83% 80%
-10%
10%
30%
50%
70%
90%
110%
130%
150%
170%
2017 2018
Ra
tio
%
1. Buildings and infrastructure renewals ratio
0.1% 0.3%
0.0%
0.5%
1.0%
1.5%
2.0%
2.5%
3.0%
2017 2018
Ra
tio
%
2. Infrastructure backlog ratio
101.40% 96%
0%
20%
40%
60%
80%
100%
120%
140%
2017 2018
Ra
tio
%
3. Asset maintenance ratio
0% 0%0%
20%
40%
60%
80%
100%
120%
2017 2018
Ra
tio
%
4. Cost to bring assets to agreed service level
page 21
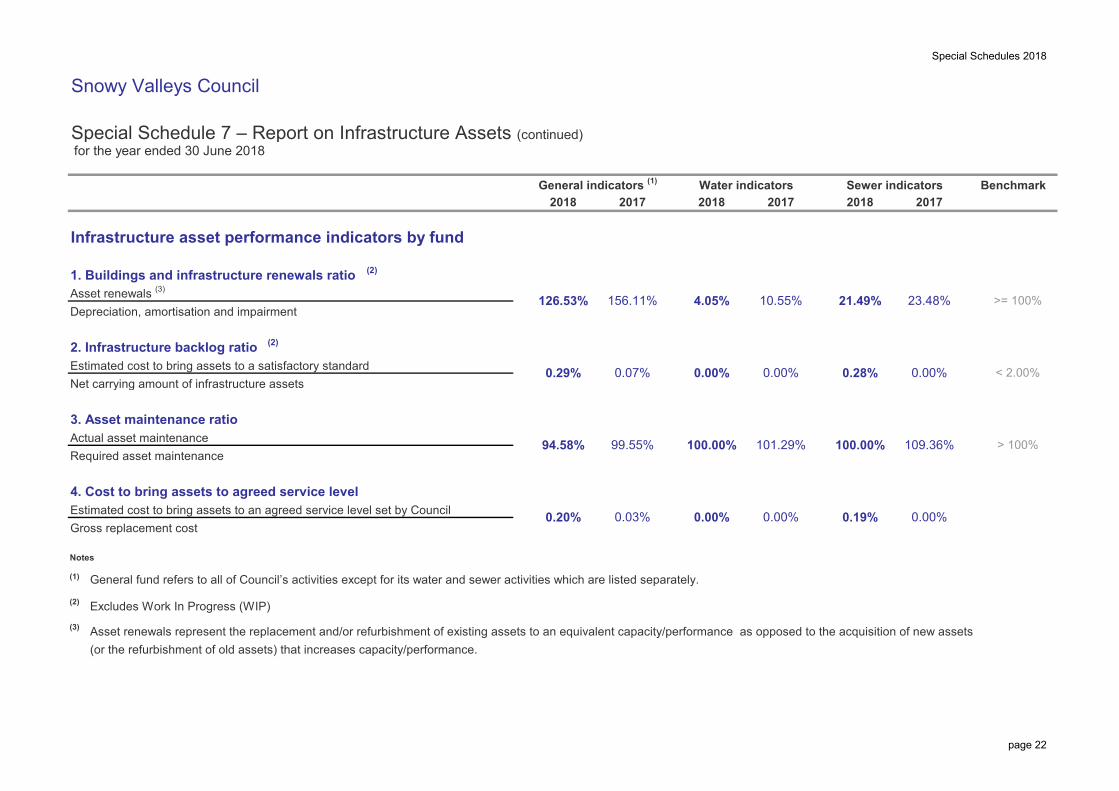
Special Schedules 2018
Snowy Valleys Council
Special Schedule 7 – Report on Infrastructure Assets (continued) for the year ended 30 June 2018
$ ’000
Infrastructure asset performance indicators by fund
1. Buildings and infrastructure renewals ratio (2)
Asset renewals (3)
Depreciation, amortisation and impairment
2. Infrastructure backlog ratio (2)
Estimated cost to bring assets to a satisfactory standardNet carrying amount of infrastructure assets
3. Asset maintenance ratioActual asset maintenanceRequired asset maintenance
4. Cost to bring assets to agreed service levelEstimated cost to bring assets to an agreed service level set by CouncilGross replacement cost
Notes
(1) General fund refers to all of Council’s activities except for its water and sewer activities which are listed separately.
(2) Excludes Work In Progress (WIP)(3) Asset renewals represent the replacement and/or refurbishment of existing assets to an equivalent capacity/performance as opposed to the acquisition of new assets
(or the refurbishment of old assets) that increases capacity/performance.
0.28%
100.00%
0.00%
94.58%
General indicators (1)
2017
>= 100%
< 2.00%
> 100%
Benchmark2017
Sewer indicatorsWater indicators20172018
4.05% 21.49%126.53%
0.00%
109.36%
0.00%
0.29%
0.00% 0.19%0.20%
0.00%0.07%
100.00%101.29%
0.00%0.03%
99.55%
2018
10.55%156.11% 23.48%
2018
page 22