Embed Size (px)
Citation preview

5/19/10 3:38 PMGlobal Warming And Climate Change | Cover Story | Chemical & Engineering News
Page 1 of 20http://pubs.acs.org/cen/coverstory/87/8751cover.html
Chemical & Engineering News
Serving the chemical, life sciences and laboratory worlds
Cover Story
Home » December 21, 2009 Issue » Cover Story » Global Warming And Climate Change
December 21, 2009Volume 87, Number 51pp. 11 - 21
Global Warming And Climate Change
Believers, deniers, and doubters view the scientific forecast fromdifferent angles
Stephen K. Ritter
NASA
Breakdown Satellite images show the sudden collapse of the Larsen B Ice Shelf, in Antarctica,
from Jan. 31 to March 7, 2002 (from left). A total of 3,250 km2 of the shelf collapsed.
5/19/10 3:38 PMGlobal Warming And Climate Change | Cover Story | Chemical & Engineering News
Page 2 of 20http://pubs.acs.org/cen/coverstory/87/8751cover.html
Courtesy of John Christy
Courtesy of Michael Mann
View Enlarged Image
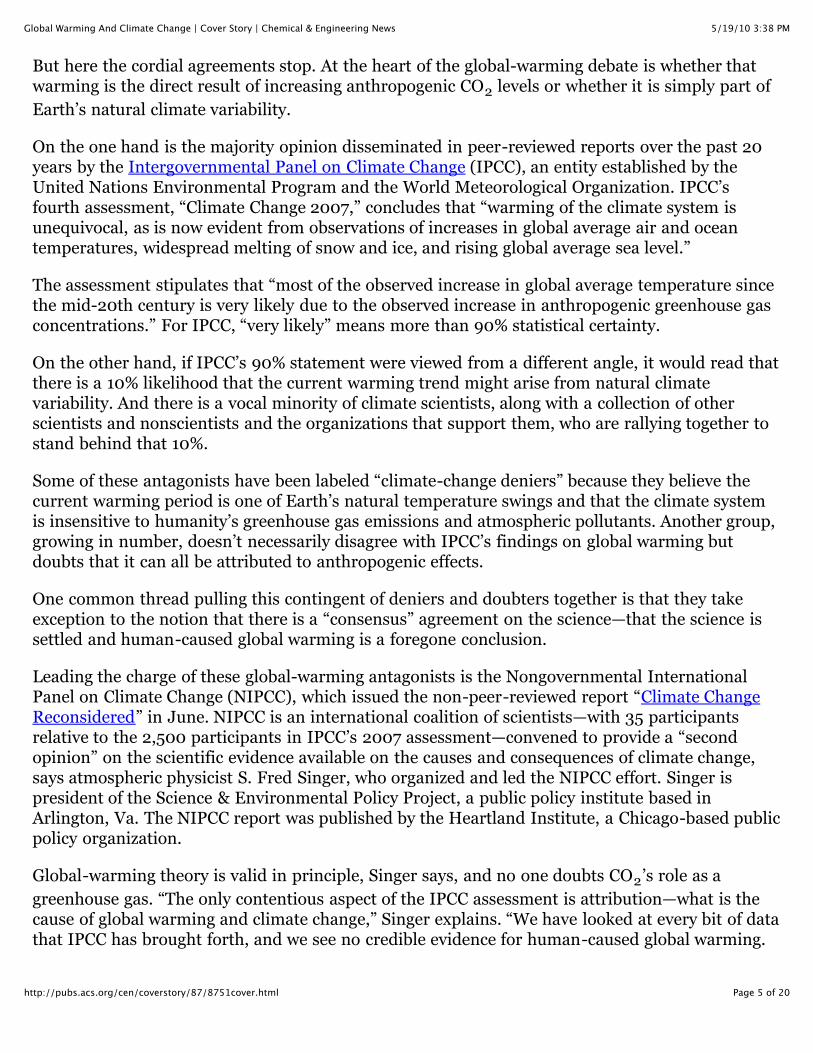
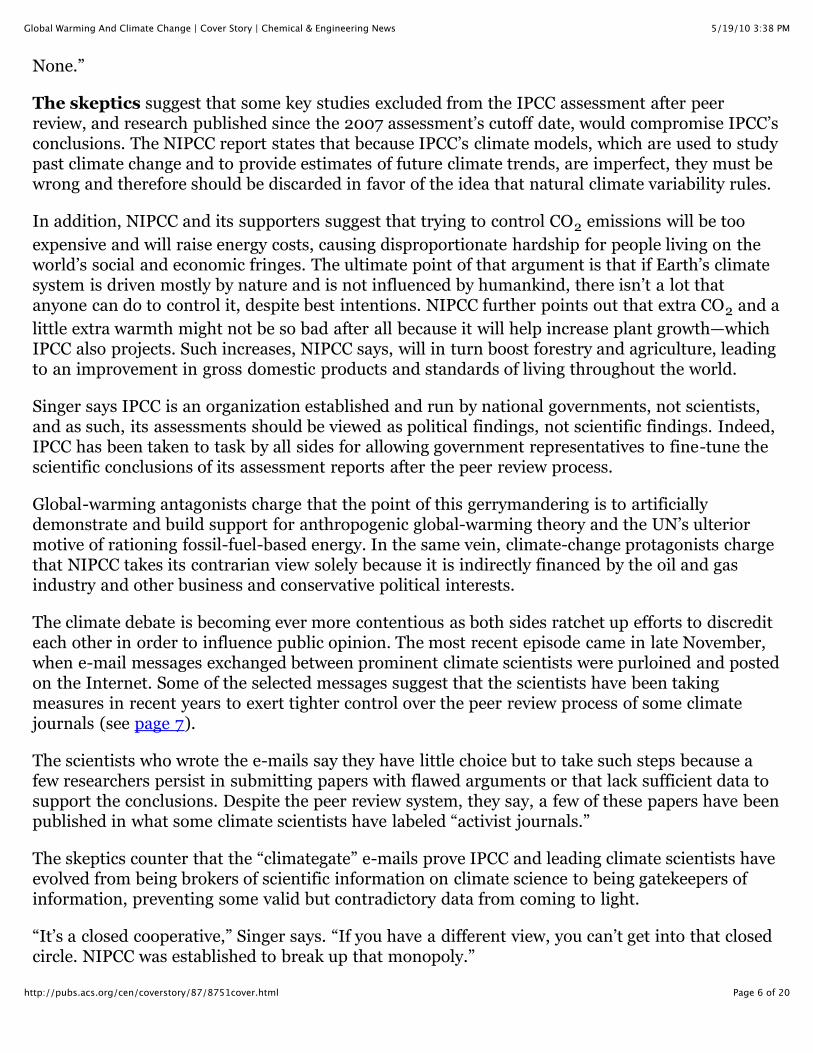
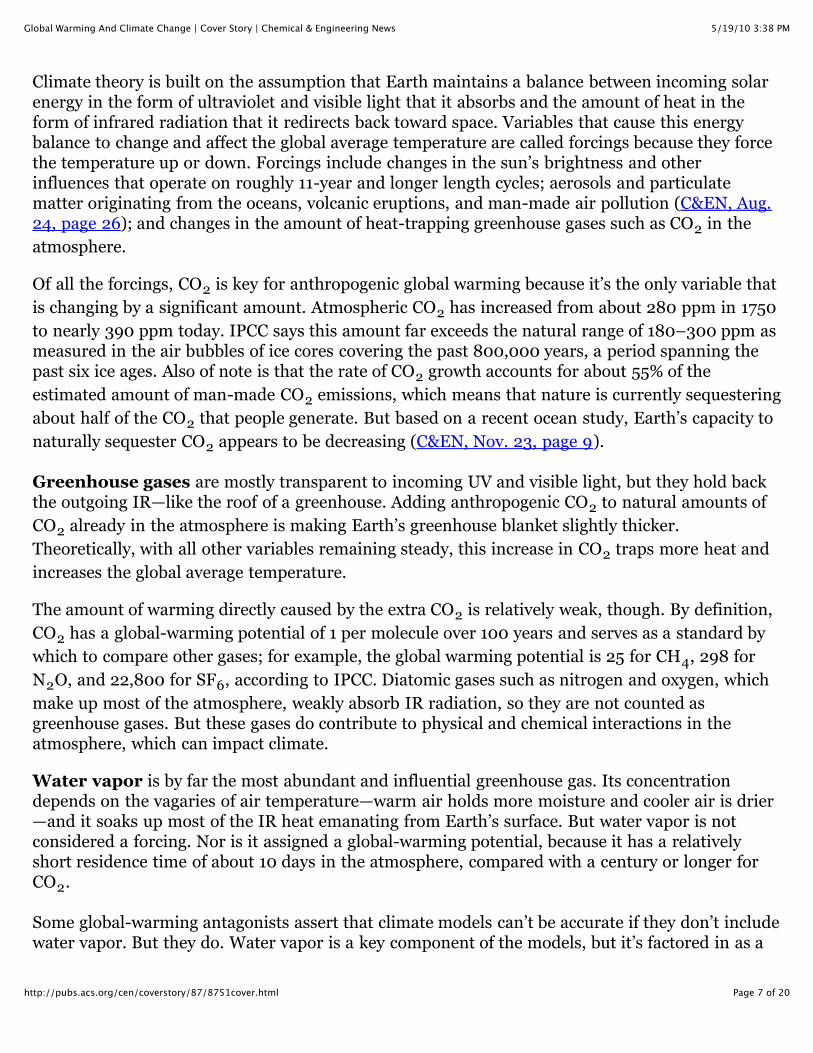
HOCKEY STICK A plot of average temperature across the Northern Hemisphere (top) used by
IPCC in its 2001 assessment, dubbed the “hockey stick” because of its shape, was decried by
global-warming skeptics as hiding the Medieval Warm Period (950–1250) and Little Ice Age
(1400–1700) and overemphasizing warming in the late 1900s. Data from tree rings, corals, ice
cores, and historical records are shown in blue, and thermometer readings are in red;
uncertainties in the data are in gray. The hockey stick data have since been substantiated with
similar temperature reconstructions by other groups (bottom).

5/19/10 3:38 PMGlobal Warming And Climate Change | Cover Story | Chemical & Engineering News
Page 3 of 20http://pubs.acs.org/cen/coverstory/87/8751cover.html
Courtesy of Michael Mann
THE GOOD AND THE BAD Weather station placement can lead to a bias in temperature readings
that, if not properly accounted for, can skew current trends and thus climate model projections.
A classic Stevenson screen station (white box) with a mercury thermometer in Orland, Calif., is
properly sited (top), but a newer electronic temperature sensor in Marysville, Calif., is too close
to a building, exhaust fans, and an asphalt parking lot (bottom).
Courtesy of Craig Idso

5/19/10 3:38 PMGlobal Warming And Climate Change | Cover Story | Chemical & Engineering News
Page 4 of 20http://pubs.acs.org/cen/coverstory/87/8751cover.html
THE MERITS AND DEMERITS OF CO2 Pea plants grow bigger and faster (top) under higher CO2
conditions current global concentration is 390 ppm as do lobsters and some other sea dwellers.
But other creatures, like the pencil urchin (bottom), suffer devastating effects in acidified water
stemming from high CO2 conditions.
Michael Ernst/Woods Hole Research Center
Whether or not global warming stemming from human activities is occurring is developing intothe great scientific debate of our time. If it’s true, the larger questions are what the climateconsequences will be and whether or not there is anything anyone can do about it.
Policymakers meeting in Copenhagen just wrapped up two weeks of discussions driven by thosequestions. At C&EN press time, they had failed to agree on an international treaty to controlgreenhouse gas emissions in an effort to stave off global warming while preserving currentstandards of living. An underlying cause that seems to be holding everything up is a renewedupwelling of uncertainty in the science behind the debate.
Mainstream climate scientists maintain that man-made global warming is happening. But a fewglobal-warming skeptics argue that there is still a lot of guesswork in how those scientists came tothat conclusion.
At the root of the for-and-against arguments is a lot of good science—science that is stillunfolding. There is no question that Earth’s atmospheric carbon dioxide concentration hasincreased since the Industrial Revolution began in the late 1700s, with most of the rise comingsince 1950. And there is agreement that the CO2 increase is largely the result of emissions from
burning fossil fuels. Another piece of data that everyone agrees with is that the global averagetemperature has risen since 1850, when reliable instrument temperature measurements began,with most of the warming occurring since 1970.
5/19/10 3:38 PMGlobal Warming And Climate Change | Cover Story | Chemical & Engineering News
Page 5 of 20http://pubs.acs.org/cen/coverstory/87/8751cover.html
But here the cordial agreements stop. At the heart of the global-warming debate is whether thatwarming is the direct result of increasing anthropogenic CO2 levels or whether it is simply part of
Earth’s natural climate variability.
On the one hand is the majority opinion disseminated in peer-reviewed reports over the past 20years by the Intergovernmental Panel on Climate Change (IPCC), an entity established by theUnited Nations Environmental Program and the World Meteorological Organization. IPCC’sfourth assessment, “Climate Change 2007,” concludes that “warming of the climate system isunequivocal, as is now evident from observations of increases in global average air and oceantemperatures, widespread melting of snow and ice, and rising global average sea level.”
The assessment stipulates that “most of the observed increase in global average temperature sincethe mid-20th century is very likely due to the observed increase in anthropogenic greenhouse gasconcentrations.” For IPCC, “very likely” means more than 90% statistical certainty.
On the other hand, if IPCC’s 90% statement were viewed from a different angle, it would read thatthere is a 10% likelihood that the current warming trend might arise from natural climatevariability. And there is a vocal minority of climate scientists, along with a collection of otherscientists and nonscientists and the organizations that support them, who are rallying together tostand behind that 10%.
Some of these antagonists have been labeled “climate-change deniers” because they believe thecurrent warming period is one of Earth’s natural temperature swings and that the climate systemis insensitive to humanity’s greenhouse gas emissions and atmospheric pollutants. Another group,growing in number, doesn’t necessarily disagree with IPCC’s findings on global warming butdoubts that it can all be attributed to anthropogenic effects.
One common thread pulling this contingent of deniers and doubters together is that they takeexception to the notion that there is a “consensus” agreement on the science—that the science issettled and human-caused global warming is a foregone conclusion.
Leading the charge of these global-warming antagonists is the Nongovernmental InternationalPanel on Climate Change (NIPCC), which issued the non-peer-reviewed report “Climate ChangeReconsidered” in June. NIPCC is an international coalition of scientists—with 35 participantsrelative to the 2,500 participants in IPCC’s 2007 assessment—convened to provide a “secondopinion” on the scientific evidence available on the causes and consequences of climate change,says atmospheric physicist S. Fred Singer, who organized and led the NIPCC effort. Singer ispresident of the Science & Environmental Policy Project, a public policy institute based inArlington, Va. The NIPCC report was published by the Heartland Institute, a Chicago-based publicpolicy organization.
Global-warming theory is valid in principle, Singer says, and no one doubts CO2’s role as a
greenhouse gas. “The only contentious aspect of the IPCC assessment is attribution—what is thecause of global warming and climate change,” Singer explains. “We have looked at every bit of datathat IPCC has brought forth, and we see no credible evidence for human-caused global warming.
5/19/10 3:38 PMGlobal Warming And Climate Change | Cover Story | Chemical & Engineering News
Page 6 of 20http://pubs.acs.org/cen/coverstory/87/8751cover.html
None.”
The skeptics suggest that some key studies excluded from the IPCC assessment after peerreview, and research published since the 2007 assessment’s cutoff date, would compromise IPCC’sconclusions. The NIPCC report states that because IPCC’s climate models, which are used to studypast climate change and to provide estimates of future climate trends, are imperfect, they must bewrong and therefore should be discarded in favor of the idea that natural climate variability rules.
In addition, NIPCC and its supporters suggest that trying to control CO2 emissions will be too
expensive and will raise energy costs, causing disproportionate hardship for people living on theworld’s social and economic fringes. The ultimate point of that argument is that if Earth’s climatesystem is driven mostly by nature and is not influenced by humankind, there isn’t a lot thatanyone can do to control it, despite best intentions. NIPCC further points out that extra CO2 and a
little extra warmth might not be so bad after all because it will help increase plant growth—whichIPCC also projects. Such increases, NIPCC says, will in turn boost forestry and agriculture, leadingto an improvement in gross domestic products and standards of living throughout the world.
Singer says IPCC is an organization established and run by national governments, not scientists,and as such, its assessments should be viewed as political findings, not scientific findings. Indeed,IPCC has been taken to task by all sides for allowing government representatives to fine-tune thescientific conclusions of its assessment reports after the peer review process.
Global-warming antagonists charge that the point of this gerrymandering is to artificiallydemonstrate and build support for anthropogenic global-warming theory and the UN’s ulteriormotive of rationing fossil-fuel-based energy. In the same vein, climate-change protagonists chargethat NIPCC takes its contrarian view solely because it is indirectly financed by the oil and gasindustry and other business and conservative political interests.
The climate debate is becoming ever more contentious as both sides ratchet up efforts to discrediteach other in order to influence public opinion. The most recent episode came in late November,when e-mail messages exchanged between prominent climate scientists were purloined and postedon the Internet. Some of the selected messages suggest that the scientists have been takingmeasures in recent years to exert tighter control over the peer review process of some climatejournals (see page 7).
The scientists who wrote the e-mails say they have little choice but to take such steps because afew researchers persist in submitting papers with flawed arguments or that lack sufficient data tosupport the conclusions. Despite the peer review system, they say, a few of these papers have beenpublished in what some climate scientists have labeled “activist journals.”
The skeptics counter that the “climategate” e-mails prove IPCC and leading climate scientists haveevolved from being brokers of scientific information on climate science to being gatekeepers ofinformation, preventing some valid but contradictory data from coming to light.
“It’s a closed cooperative,” Singer says. “If you have a different view, you can’t get into that closedcircle. NIPCC was established to break up that monopoly.”
5/19/10 3:38 PMGlobal Warming And Climate Change | Cover Story | Chemical & Engineering News
Page 7 of 20http://pubs.acs.org/cen/coverstory/87/8751cover.html
Climate theory is built on the assumption that Earth maintains a balance between incoming solarenergy in the form of ultraviolet and visible light that it absorbs and the amount of heat in theform of infrared radiation that it redirects back toward space. Variables that cause this energybalance to change and affect the global average temperature are called forcings because they forcethe temperature up or down. Forcings include changes in the sun’s brightness and otherinfluences that operate on roughly 11-year and longer length cycles; aerosols and particulatematter originating from the oceans, volcanic eruptions, and man-made air pollution (C&EN, Aug.24, page 26); and changes in the amount of heat-trapping greenhouse gases such as CO2 in the
atmosphere.
Of all the forcings, CO2 is key for anthropogenic global warming because it’s the only variable that
is changing by a significant amount. Atmospheric CO2 has increased from about 280 ppm in 1750
to nearly 390 ppm today. IPCC says this amount far exceeds the natural range of 180–300 ppm asmeasured in the air bubbles of ice cores covering the past 800,000 years, a period spanning thepast six ice ages. Also of note is that the rate of CO2 growth accounts for about 55% of the
estimated amount of man-made CO2 emissions, which means that nature is currently sequestering
about half of the CO2 that people generate. But based on a recent ocean study, Earth’s capacity to
naturally sequester CO2 appears to be decreasing (C&EN, Nov. 23, page 9).
Greenhouse gases are mostly transparent to incoming UV and visible light, but they hold backthe outgoing IR—like the roof of a greenhouse. Adding anthropogenic CO2 to natural amounts of
CO2 already in the atmosphere is making Earth’s greenhouse blanket slightly thicker.
Theoretically, with all other variables remaining steady, this increase in CO2 traps more heat and
increases the global average temperature.
The amount of warming directly caused by the extra CO2 is relatively weak, though. By definition,
CO2 has a global-warming potential of 1 per molecule over 100 years and serves as a standard by
which to compare other gases; for example, the global warming potential is 25 for CH4, 298 for
N2O, and 22,800 for SF6, according to IPCC. Diatomic gases such as nitrogen and oxygen, which
make up most of the atmosphere, weakly absorb IR radiation, so they are not counted asgreenhouse gases. But these gases do contribute to physical and chemical interactions in theatmosphere, which can impact climate.
Water vapor is by far the most abundant and influential greenhouse gas. Its concentrationdepends on the vagaries of air temperature—warm air holds more moisture and cooler air is drier—and it soaks up most of the IR heat emanating from Earth’s surface. But water vapor is notconsidered a forcing. Nor is it assigned a global-warming potential, because it has a relativelyshort residence time of about 10 days in the atmosphere, compared with a century or longer forCO2.
Some global-warming antagonists assert that climate models can’t be accurate if they don’t includewater vapor. But they do. Water vapor is a key component of the models, but it’s factored in as a

5/19/10 3:38 PMGlobal Warming And Climate Change | Cover Story | Chemical & Engineering News
Page 8 of 20http://pubs.acs.org/cen/coverstory/87/8751cover.html
feedback, rather than a forcing. Feedbacks are physical processes that change in response to atemperature change and subsequently amplify or diminish the effects of forcings. For water vapor,when the temperature goes up or down, its concentration quickly adjusts to increase or decreasethe trapping of heat.
Ozone is another important component of the atmosphere, but because it is not evenly dispersedand is short-lived, being constantly created and destroyed in the atmosphere, it doesn’t have anassigned global-warming potential either. Ozone filters UV light and contributes to cooling in thestratosphere, which is located more than 20 km above Earth’s surface. It also functions as agreenhouse gas and contributes to warming in the troposphere 6–20 km above the surface.
Aerosols, the forcings with the most uncertainty in their effects, are a suspension of fineparticulate matter or droplets arising from volcanic emissions, smoke, oceanic haze, and airpollution. Some aerosols form directly, but others form during oxidation processes in theatmosphere. For example, sulfur dioxide and other sulfur compounds originating from burningfossil fuels and from volcanoes and phytoplankton are converted into sulfate aerosols in theatmosphere by hydroxyl radicals and other oxidants. Ozone also generates hydroxyl radicals thatcontribute to aerosol formation.
Climate scientists know that aerosols exert an overall cooling influence on climate—a negativeforcing—by scattering incoming light and playing a role in forming and dissipating clouds. Butthey have had difficulties in adequately accounting for aerosol effects on greenhouse gases inclimate models.
Water in the form of clouds is also difficult to parameterize in models because cloud formation isdynamic and clouds have a fleeting existence. Clouds are the most uncertain feedback to plug intomodels because they give rise to both positive and negative influences: Low clouds primarilyprevent surface heat from escaping into space, and high clouds reflect incoming sunlight.
Overall, water vapor and clouds are responsible for about 60% of the greenhouse effect, followedby CO2 at about 26%, and then smaller contributions from CH4, O3, and other gases. In the
absence of natural greenhouse warming, Earth’s average temperature would be about –18 °C (0 °F), essentially a frozen planet. The natural greenhouse effect warms Earth by some 33 °C, to about15 °C (59 °F).
The combined forcings and feedbacks stemming from Earth’s current oceanic, continental, andatmospheric makeup are the cause and effect that moderate Earth’s energy balance. As described
in the 2007 IPCC report, the global energy balance is about 240 watts per m2. The combination offorcings arising from anthropogenic effects, including increases in greenhouse gas emissions
minus decreases from aerosols, totals 1.6 W/m2.
IPCC has concluded that that extra bit of energy, coupled with ensuing net positive feedbacks, hasnudged up the global average temperature. As laid out in the 2007 assessment, warming duringthe 100-year period from 1906 to 2005 caused a global average temperature increase of 0.74 °C,to about 16 °C (61 °F).
5/19/10 3:38 PMGlobal Warming And Climate Change | Cover Story | Chemical & Engineering News
Page 9 of 20http://pubs.acs.org/cen/coverstory/87/8751cover.html
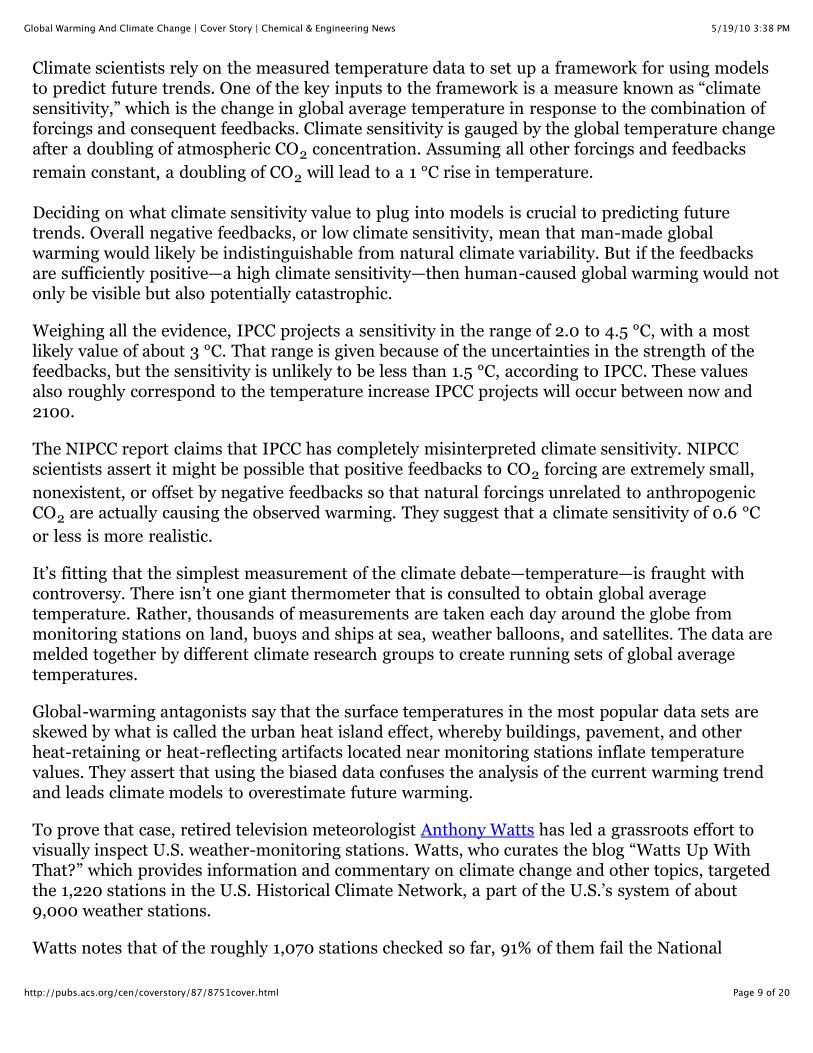
Climate scientists rely on the measured temperature data to set up a framework for using modelsto predict future trends. One of the key inputs to the framework is a measure known as “climatesensitivity,” which is the change in global average temperature in response to the combination offorcings and consequent feedbacks. Climate sensitivity is gauged by the global temperature changeafter a doubling of atmospheric CO2 concentration. Assuming all other forcings and feedbacks
remain constant, a doubling of CO2 will lead to a 1 °C rise in temperature.
Deciding on what climate sensitivity value to plug into models is crucial to predicting futuretrends. Overall negative feedbacks, or low climate sensitivity, mean that man-made globalwarming would likely be indistinguishable from natural climate variability. But if the feedbacksare sufficiently positive—a high climate sensitivity—then human-caused global warming would notonly be visible but also potentially catastrophic.
Weighing all the evidence, IPCC projects a sensitivity in the range of 2.0 to 4.5 °C, with a mostlikely value of about 3 °C. That range is given because of the uncertainties in the strength of thefeedbacks, but the sensitivity is unlikely to be less than 1.5 °C, according to IPCC. These valuesalso roughly correspond to the temperature increase IPCC projects will occur between now and2100.
The NIPCC report claims that IPCC has completely misinterpreted climate sensitivity. NIPCCscientists assert it might be possible that positive feedbacks to CO2 forcing are extremely small,
nonexistent, or offset by negative feedbacks so that natural forcings unrelated to anthropogenicCO2 are actually causing the observed warming. They suggest that a climate sensitivity of 0.6 °C
or less is more realistic.
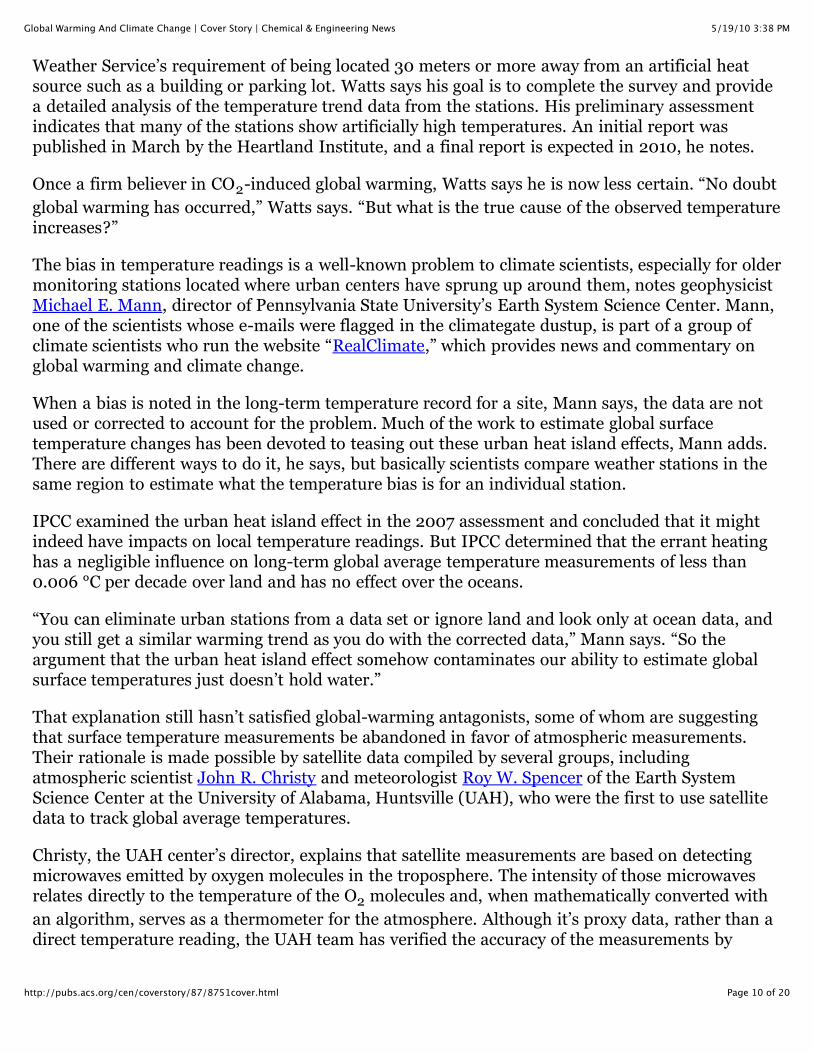
It’s fitting that the simplest measurement of the climate debate—temperature—is fraught withcontroversy. There isn’t one giant thermometer that is consulted to obtain global averagetemperature. Rather, thousands of measurements are taken each day around the globe frommonitoring stations on land, buoys and ships at sea, weather balloons, and satellites. The data aremelded together by different climate research groups to create running sets of global averagetemperatures.
Global-warming antagonists say that the surface temperatures in the most popular data sets areskewed by what is called the urban heat island effect, whereby buildings, pavement, and otherheat-retaining or heat-reflecting artifacts located near monitoring stations inflate temperaturevalues. They assert that using the biased data confuses the analysis of the current warming trendand leads climate models to overestimate future warming.
To prove that case, retired television meteorologist Anthony Watts has led a grassroots effort tovisually inspect U.S. weather-monitoring stations. Watts, who curates the blog “Watts Up WithThat?” which provides information and commentary on climate change and other topics, targetedthe 1,220 stations in the U.S. Historical Climate Network, a part of the U.S.’s system of about9,000 weather stations.
Watts notes that of the roughly 1,070 stations checked so far, 91% of them fail the National
5/19/10 3:38 PMGlobal Warming And Climate Change | Cover Story | Chemical & Engineering News
Page 10 of 20http://pubs.acs.org/cen/coverstory/87/8751cover.html
Weather Service’s requirement of being located 30 meters or more away from an artificial heatsource such as a building or parking lot. Watts says his goal is to complete the survey and providea detailed analysis of the temperature trend data from the stations. His preliminary assessmentindicates that many of the stations show artificially high temperatures. An initial report waspublished in March by the Heartland Institute, and a final report is expected in 2010, he notes.
Once a firm believer in CO2-induced global warming, Watts says he is now less certain. “No doubt
global warming has occurred,” Watts says. “But what is the true cause of the observed temperatureincreases?”
The bias in temperature readings is a well-known problem to climate scientists, especially for oldermonitoring stations located where urban centers have sprung up around them, notes geophysicistMichael E. Mann, director of Pennsylvania State University’s Earth System Science Center. Mann,one of the scientists whose e-mails were flagged in the climategate dustup, is part of a group ofclimate scientists who run the website “RealClimate,” which provides news and commentary onglobal warming and climate change.
When a bias is noted in the long-term temperature record for a site, Mann says, the data are notused or corrected to account for the problem. Much of the work to estimate global surfacetemperature changes has been devoted to teasing out these urban heat island effects, Mann adds.There are different ways to do it, he says, but basically scientists compare weather stations in thesame region to estimate what the temperature bias is for an individual station.
IPCC examined the urban heat island effect in the 2007 assessment and concluded that it mightindeed have impacts on local temperature readings. But IPCC determined that the errant heatinghas a negligible influence on long-term global average temperature measurements of less than0.006 °C per decade over land and has no effect over the oceans.
“You can eliminate urban stations from a data set or ignore land and look only at ocean data, andyou still get a similar warming trend as you do with the corrected data,” Mann says. “So theargument that the urban heat island effect somehow contaminates our ability to estimate globalsurface temperatures just doesn’t hold water.”
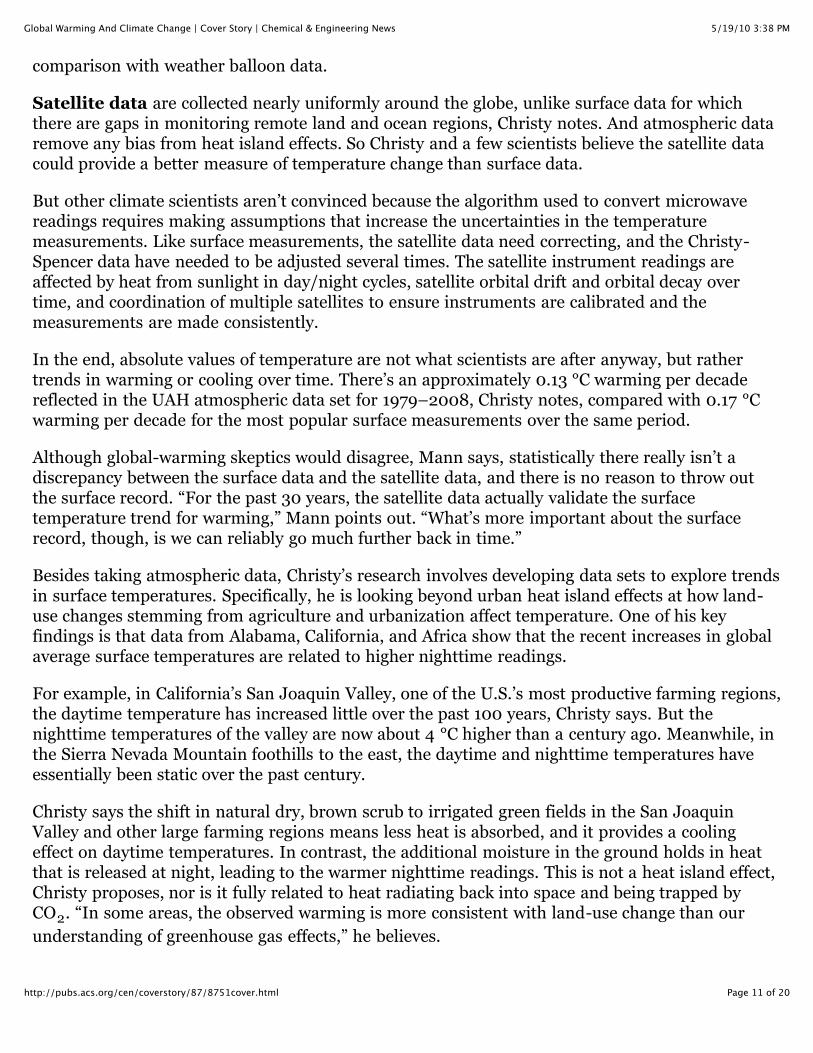
That explanation still hasn’t satisfied global-warming antagonists, some of whom are suggestingthat surface temperature measurements be abandoned in favor of atmospheric measurements.Their rationale is made possible by satellite data compiled by several groups, includingatmospheric scientist John R. Christy and meteorologist Roy W. Spencer of the Earth SystemScience Center at the University of Alabama, Huntsville (UAH), who were the first to use satellitedata to track global average temperatures.
Christy, the UAH center’s director, explains that satellite measurements are based on detectingmicrowaves emitted by oxygen molecules in the troposphere. The intensity of those microwavesrelates directly to the temperature of the O2 molecules and, when mathematically converted with
an algorithm, serves as a thermometer for the atmosphere. Although it’s proxy data, rather than adirect temperature reading, the UAH team has verified the accuracy of the measurements by
5/19/10 3:38 PMGlobal Warming And Climate Change | Cover Story | Chemical & Engineering News
Page 11 of 20http://pubs.acs.org/cen/coverstory/87/8751cover.html
comparison with weather balloon data.
Satellite data are collected nearly uniformly around the globe, unlike surface data for whichthere are gaps in monitoring remote land and ocean regions, Christy notes. And atmospheric dataremove any bias from heat island effects. So Christy and a few scientists believe the satellite datacould provide a better measure of temperature change than surface data.
But other climate scientists aren’t convinced because the algorithm used to convert microwavereadings requires making assumptions that increase the uncertainties in the temperaturemeasurements. Like surface measurements, the satellite data need correcting, and the Christy-Spencer data have needed to be adjusted several times. The satellite instrument readings areaffected by heat from sunlight in day/night cycles, satellite orbital drift and orbital decay overtime, and coordination of multiple satellites to ensure instruments are calibrated and themeasurements are made consistently.
In the end, absolute values of temperature are not what scientists are after anyway, but rathertrends in warming or cooling over time. There’s an approximately 0.13 °C warming per decadereflected in the UAH atmospheric data set for 1979–2008, Christy notes, compared with 0.17 °Cwarming per decade for the most popular surface measurements over the same period.
Although global-warming skeptics would disagree, Mann says, statistically there really isn’t adiscrepancy between the surface data and the satellite data, and there is no reason to throw outthe surface record. “For the past 30 years, the satellite data actually validate the surfacetemperature trend for warming,” Mann points out. “What’s more important about the surfacerecord, though, is we can reliably go much further back in time.”
Besides taking atmospheric data, Christy’s research involves developing data sets to explore trendsin surface temperatures. Specifically, he is looking beyond urban heat island effects at how land-use changes stemming from agriculture and urbanization affect temperature. One of his keyfindings is that data from Alabama, California, and Africa show that the recent increases in globalaverage surface temperatures are related to higher nighttime readings.
For example, in California’s San Joaquin Valley, one of the U.S.’s most productive farming regions,the daytime temperature has increased little over the past 100 years, Christy says. But thenighttime temperatures of the valley are now about 4 °C higher than a century ago. Meanwhile, inthe Sierra Nevada Mountain foothills to the east, the daytime and nighttime temperatures haveessentially been static over the past century.
Christy says the shift in natural dry, brown scrub to irrigated green fields in the San JoaquinValley and other large farming regions means less heat is absorbed, and it provides a coolingeffect on daytime temperatures. In contrast, the additional moisture in the ground holds in heatthat is released at night, leading to the warmer nighttime readings. This is not a heat island effect,Christy proposes, nor is it fully related to heat radiating back into space and being trapped byCO2. “In some areas, the observed warming is more consistent with land-use change than our
understanding of greenhouse gas effects,” he believes.
5/19/10 3:38 PMGlobal Warming And Climate Change | Cover Story | Chemical & Engineering News
Page 12 of 20http://pubs.acs.org/cen/coverstory/87/8751cover.html
Christy thinks a better approach in compiling surface data for modeling could be to use only thedaytime high temperatures, rather than the daily low and high temperatures, to eliminate thepossible bias in nighttime readings. Christy acknowledges that most climate scientists don’t agreewith his methods or conclusions; although he was an IPCC lead author for its 2001 assessment,not all of the data he submitted to IPCC for the 2007 assessment were included, he says.
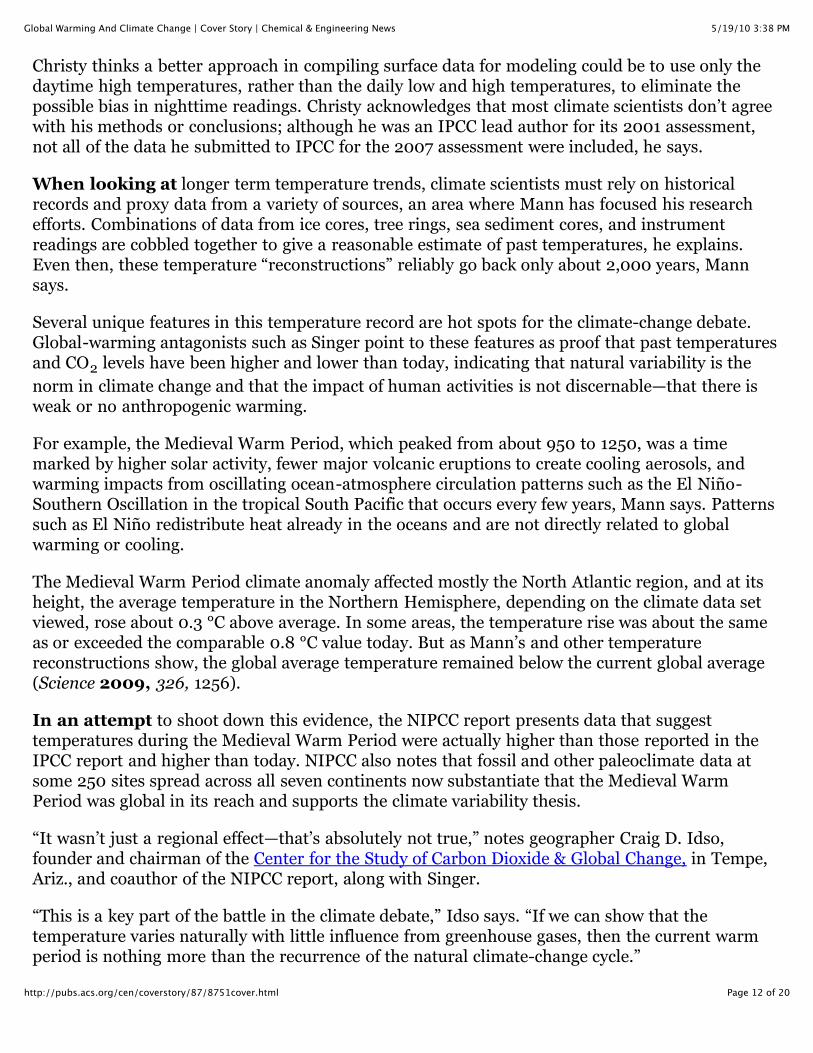
When looking at longer term temperature trends, climate scientists must rely on historicalrecords and proxy data from a variety of sources, an area where Mann has focused his researchefforts. Combinations of data from ice cores, tree rings, sea sediment cores, and instrumentreadings are cobbled together to give a reasonable estimate of past temperatures, he explains.Even then, these temperature “reconstructions” reliably go back only about 2,000 years, Mannsays.
Several unique features in this temperature record are hot spots for the climate-change debate.Global-warming antagonists such as Singer point to these features as proof that past temperaturesand CO2 levels have been higher and lower than today, indicating that natural variability is the
norm in climate change and that the impact of human activities is not discernable—that there isweak or no anthropogenic warming.
For example, the Medieval Warm Period, which peaked from about 950 to 1250, was a timemarked by higher solar activity, fewer major volcanic eruptions to create cooling aerosols, andwarming impacts from oscillating ocean-atmosphere circulation patterns such as the El Niño-Southern Oscillation in the tropical South Pacific that occurs every few years, Mann says. Patternssuch as El Niño redistribute heat already in the oceans and are not directly related to globalwarming or cooling.
The Medieval Warm Period climate anomaly affected mostly the North Atlantic region, and at itsheight, the average temperature in the Northern Hemisphere, depending on the climate data setviewed, rose about 0.3 °C above average. In some areas, the temperature rise was about the sameas or exceeded the comparable 0.8 °C value today. But as Mann’s and other temperaturereconstructions show, the global average temperature remained below the current global average(Science 2009, 326, 1256).
In an attempt to shoot down this evidence, the NIPCC report presents data that suggesttemperatures during the Medieval Warm Period were actually higher than those reported in theIPCC report and higher than today. NIPCC also notes that fossil and other paleoclimate data atsome 250 sites spread across all seven continents now substantiate that the Medieval WarmPeriod was global in its reach and supports the climate variability thesis.
“It wasn’t just a regional effect—that’s absolutely not true,” notes geographer Craig D. Idso,founder and chairman of the Center for the Study of Carbon Dioxide & Global Change, in Tempe,Ariz., and coauthor of the NIPCC report, along with Singer.
“This is a key part of the battle in the climate debate,” Idso says. “If we can show that thetemperature varies naturally with little influence from greenhouse gases, then the current warmperiod is nothing more than the recurrence of the natural climate-change cycle.”
5/19/10 3:38 PMGlobal Warming And Climate Change | Cover Story | Chemical & Engineering News
Page 13 of 20http://pubs.acs.org/cen/coverstory/87/8751cover.html
After the Medieval Warm Period came a cooling-off period known as the Little Ice Age, which hitits nadir between 1400 and 1700. The temperature dip—as low as –0.7 °C below average—stemmed from low solar activity and increased volcanic activity, with cooling effects from ocean-atmosphere oscillations. Like the Medieval Warm Period, it was of limited scope in the NorthernHemisphere and not global in nature, according to IPCC.
A climate conundrum related to these historical temperature swings is the infamous “hockey stick”graph used in IPCC’s 2001 assessment. The graph, which depicts one of Mann’s temperaturereconstructions, shows muted warming and cooling over the Medieval Warm Period and Little IceAge because the temperatures are averaged over the entire Northern Hemisphere and not localizedto Europe, where most people lived during those periods. Global-warming skeptics say the graphmakes it look as though the anomalies didn’t exist. The graph also shows a sudden upturn intemperature in the late 1900s attributed to rising CO2 concentrations so that the overall graph
looks like the profile of a hockey stick lying on its side.
IPCC chose to feature Mann’s reconstruction over other similar data sets in its 2001 summaryreport for policymakers to show that it’s warmer now than it has been over the past 1,000 years.Some skeptical scientists pointed out errors in Mann’s and coworkers’ descriptions of the data setsused, which Mann confirmed and announced in a published correction. Meanwhile, other skepticstook it a step further and claimed there were actual flaws in the statistical methods used tocombine the data to make the reconstruction. Global-warming antagonists seized the opportunityto assert that the graph was an effort to hoodwink the public by showing a warming trend that wasnot real, which led to a congressional inquiry.
Mann’s data held up to scrutiny by a National Academy of Sciences review panel, which“acquitted” the data but made specific suggestions on how scientists should improve temperaturereconstructions. Now, 10 years later, Mann reports that his original finding has been confirmed byother data sets his group has generated and by more than a dozen independent estimates usingdifferent arrays of data and different statistical methods (Proc. Natl. Acad. Sci. USA 2008, 105,
13252). Yet the hockey stick graph is labeled as disingenuous in the NIPCC report.
“It was unfortunate that some contrarian circles made it seem as if the entire edifice of climatechange rested on our one reconstruction data set,” Mann says. “We still have the same conclusionfrom a decade ago and have even extended it to the past 2,000 years.”
Global-warming antagonists, carrying the banner of natural climate variability, still say that thetemperature fluctuation from the Medieval Warm Period to the Little Ice Age is clear evidence thatnature rules when it comes to climate change. They add that the current warming isn’t beingcaused by anthropogenic CO2 but is instead simply a continuation of Earth’s recovery from the
Little Ice Age.
That is a bit misleading, Mann says. “Suggesting that Earth recovers from climate changes impliesthat the climate system works in a completely different way than we know it does based onphysics,” he observes. “The climate doesn’t rebound. It isn’t like a spring that someone pulls and
5/19/10 3:38 PMGlobal Warming And Climate Change | Cover Story | Chemical & Engineering News
Page 14 of 20http://pubs.acs.org/cen/coverstory/87/8751cover.html
lets go. The primary changes are due to the response to forcings.
“If natural variability was primarily ruling what we see today, we would still be in the Little IceAge,” Mann continues. “We should have seen cooling in the past few decades because solar outputhas dropped off and there have been relatively more volcanic eruptions. To those who say today’swarming is natural variation, the natural forcings are actually pushing us in the wrong direction.”
Looking at climate features during the past century provides additional hot spots for the climatedebate. For example, the higher solar output in the early-20th century contributed to a warmstretch in the 1930s. But as the solar output waned, temperatures cooled in the late 1940s andthen remained steady for several decades, even though the post-World War II era was a timemarked by industrial development, more cars, and a rapid rise in CO2 levels.
NIPCC and global-warming critics point to a lack of CO2-temperature correlation to discount
IPCC’s pro-anthropogenic assessments. “With IPCC, sometimes you get a CO2-temperature
correlation, and sometimes you don’t,” Singer says. “IPCC and others try to skip over or explainthat problem away. But you can’t do that. For global-warming theory to be completely valid, thatcorrelation has to be present at all times.”
IPCC points out that during the 1945–75 period, CO2-forced warming was countered by lower
solar activity, emissions from volcanoes, and an increase in particulates and atmospheric aerosolsgenerated from increased fossil-fuel emissions. Some climate scientists have suggested that whenpollution regulations and improved technology reined in man-made emissions and the air beganto clear in the late 1970s, CO2 forcing again emerged on top, leading to the current warming trend
that has accelerated as CO2 levels continue to rise. The “global dimming” caused by aerosols and
particulates is the basis of one of the proposed geoengineering technologies to offset globalwarming (C&EN, Nov. 23, page 28).
During the past 20 years, several events point to natural climate variability’s influence ontemperature, but overall the warming trend due to rising CO2 levels is now unmistakable, IPCC
says. For example, warming stopped in 1991–93, when the eruption of Mount Pinatubo, in thePhilippines, spewed out massive amounts of sulfur compounds. These compounds formed aerosolsand drove down the average global temperature about 0.2 °C. The volcano erupted at thebeginning of an El Niño warming event, which offset some of the volcano’s cooling effects. Theensuing El Niño in 1998, dubbed the “El Niño of the Century,” made that the hottest year everrecorded (although in some data sets, 2005 was warmer), with a global average temperature thatwas 0.5 °C above the modern average.
Since 1998, temperatures have leveled off, even as CO2 concentrations have continued to rise at
a faster rate, leading to a “climate canard,” often referenced in climate-change discussions, thatglobal warming has stopped. Global-warming antagonists say it’s yet another example of the CO2-
temperature correlation falling apart.
But Mann points out that by cherry-picking data, recent temperatures could appear to be warming

5/19/10 3:38 PMGlobal Warming And Climate Change | Cover Story | Chemical & Engineering News
Page 15 of 20http://pubs.acs.org/cen/coverstory/87/8751cover.html
or cooling. Scanning the 10-year trend from 1998 to 2007, it looks like temperatures are coolingbecause 1998 was an uncharacteristically warm year. But taking the 10 years from 1999 to 2008,there is a warming trend, even though 2008 was the coolest year since 2000 because it includedEl Niño’s cooling phase, known as La Niña. In addition, every year from 2001 to 2008 is amongthe top 10 warmest years in the historical record.
Temperatures never increase or decrease in a smooth, linear fashion, Mann says, but yield ajagged pattern. Mann and other climate scientists caution that it’s difficult to make much sense ofclimate change by looking at time frames as short as 10 years because the shorter the trend, themore it is dominated by natural variability noise. Looking further back, the linear 25-year trendfrom a data set generated by NASA’s Goddard Institute for Space Studies (GISS) at ColumbiaUniversity shows global temperatures rising 0.19 °C per decade, Mann says. That trend matchesIPCC’s model estimate of anthropogenic warming, he adds. And measurements taken in recentweeks by climate research centers worldwide indicate that 2009 will be one of the warmest yearson record, at about 0.4 °C above average.
“We can always go back far enough into the geological record and see time intervals where it waswarmer or cooler than it is today,” Mann says. “No one is disputing that.” For example, the earlyCretaceous period 100 million years ago, when dinosaurs roamed Earth, was certainlysubstantially warmer than today, and CO2 levels were substantially higher, he notes. “But that
doesn’t contradict the fact that we are increasing greenhouse gas concentrations today at a fasterrate than Earth has ever seen to our knowledge and that the temperature and other changes thatare taking place are happening at a far greater rate,” Mann adds.
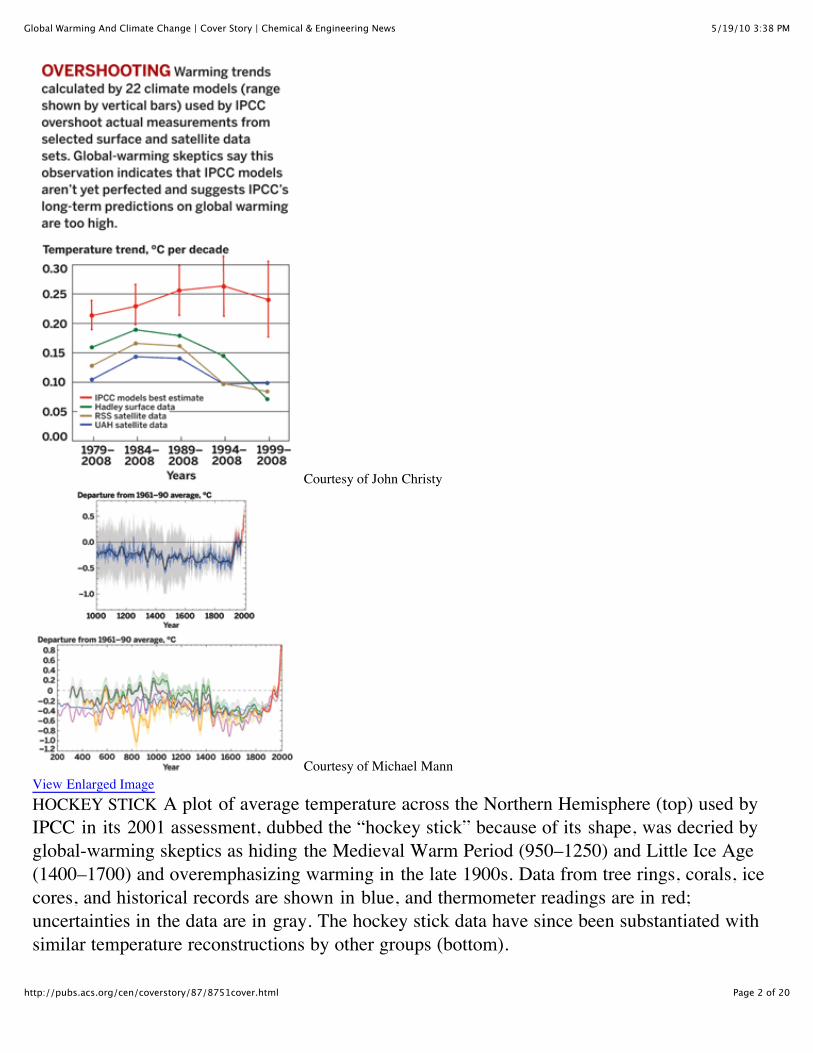
Beyond current temperature observations, global-warming antagonists are seizing on thetemperature discrepancies proposed by Christy and others as proof that IPCC’s projections ofEarth’s future climate—based on models using the possibly biased data—are faulty. For example,Christy has shown that the IPCC model average temperature—IPCC’s best guess—has beenincreasing about 0.25 °C per decade over the past 30 years, which is significantly higher thanseveral measured data sets, including UAH’s satellite value of about 0.13 °C per decade. Themeasured data fall outside the range of the model projections.
“That means the IPCC models are overestimating what is actually happening, which indicates thatthe models are retaining too much heat and the climate sensitivity is set too high,” Christy says. Italso suggests that IPCC’s long-range temperature predictions could be too hot, he adds.
While Christy spends his time mulling over temperature data, Spencer, his UAH colleague, istrying to better understand the intricacies of climate sensitivity. IPCC concludes that the effect ofanthropogenic CO2 on temperature, even though it is a small forcing, gets magnified by positive
feedback, Spencer says. “That’s where a minority of us disagree. We think that climate change isthe result of fairly strong natural forcings operating on a fairly insensitive climate system,” headds.
To explain, Spencer says that he thinks climate modelers have been misinterpreting cause andeffect when it comes to how clouds and temperatures vary together in the climate system. He says

5/19/10 3:38 PMGlobal Warming And Climate Change | Cover Story | Chemical & Engineering News
Page 16 of 20http://pubs.acs.org/cen/coverstory/87/8751cover.html
modelers tend to associate decreasing cloud cover after warming with positive cloud feedback—warming causing a cloud decrease to let in more sunlight. In reality, he thinks it is the decrease inclouds caused by natural, chaotic fluctuations in global ocean-atmospheric circulation patternsthat mostly causes the warming—a natural forcing.
“If you make that misinterpretation, it skews the rest of the analysis into man-made globalwarming—it gives the illusion that the climate system is much more sensitive than it really is,”Spencer says. “If the climate system is less sensitive, this means that the extra CO2 pumped into
the atmosphere is not enough to cause all the observed warming over the past 100 years—somenatural mechanism must also be involved.”
Spencer’s candidate is the Pacific Decadal Oscillation (PDO), an ocean-atmospheric circulationpattern similar to and influenced by El Niño but occurring in the North Pacific Ocean and runningon a 60-year cycle. During PDO’s positive phase, the western Pacific cools, the eastern Pacificwarms, and land in North America warms; during the negative phase, the opposite occurs.
“Unfortunately, the data now show us that we have underestimated the climate crisis.”
For instance, PDO was positive from about 1915 to 1945, when there was a global-warming trend,Spencer says. PDO went negative from 1945 to 1977, when global temperatures were cooler, andwent positive again in 1978, which was the onset of the current warming period.
Melting of Arctic ice provides evidence for this on-off cycle, Spencer claims. In late 2007, theNorthwest Passage in the Arctic Ocean opened, a rare event that allows ships to travel therelatively short distance between the Atlantic and Pacific Oceans. Spencer points out that theNorthwest Passage also opened in 1939 and 1940, just as the previous PDO positive phase wascoming to an end.
Because CO2 concentrations in the 1940s were lower, Spencer suggests anthropogenic warming
could not have caused the melting back then, when Arctic temperatures were nearly as warm asthey are now. He also suggests the current warming could be caused by the same effect. Spencerestimates that the PDO effect can explain about 70%, or 0.5 °C, of the 0.74 °C global warmingobserved during the past century and that anthropogenic CO2 is responsible for the other 30%, or
about 0.2 °C.
A new negative PDO phase might be getting started, Spencer says. If cooler temperatures prevailin the coming 30 years, the trend might verify his hypothesis, which has not been published but isin the process of being vetted by the climate science community.
Based on his work and studies by a few other groups, it looks like net negative feedbacks canoperate on year-to-year time scales, Spencer says. But on the long term, it might be that netpositive feedbacks prevail.
There is only one Earth to observe and test with climate models, and attempts to do so areseverely limited by humanity’s relatively short existence and the inherent complexity of the globalclimate system. That is why IPCC’s 2007 assessment was based on 18 different models that made
5/19/10 3:38 PMGlobal Warming And Climate Change | Cover Story | Chemical & Engineering News
Page 17 of 20http://pubs.acs.org/cen/coverstory/87/8751cover.html
different assumptions—and provided a range of results.
Climate modelers tend to spend much of their time checking the models, which are based ondifferential equations with few to many variables, to confirm if large-scale features work properly.For example, they must make sure that ocean currents go the right way and that it rains andsnows where it should. There are problematic areas in which models still don’t work well, such aspredicting Indian monsoons correctly, the NIPCC report notes. But it does not discount themodels from being “good enough to be useful,” Mann says.
One success is modeling the climate change stemming from the 1991 eruption of Mount Pinatubo.The eruption spewed sulfates into the atmosphere, and the resulting aerosols led to cooling forabout three years, which was enough time for water vapor to equilibrate to cooler sea-surfacetemperatures. IPCC’s modelers have been able to accurately simulate the decrease in water vaporin line with satellite observations and match the global temperature decrease that occurred, a goodsign that the feedback parameters are accurate and that climate sensitivity is set about right, Mannsays.
On the other hand, NIPCC points to one climate “fingerprint” that suggests a discrepancy betweenIPCC model projections and reality. IPCC climate models predict that the lower part of thetroposphere in the tropics should be warming at a rate that is 1.3 times faster than at ground level,UAH’s Christy notes. Warming from solar variability or other known natural factors will not yieldthis characteristic pattern, only sustained anthropogenic greenhouse gas effects, Christy says.
But in the measured satellite and balloon temperature data, collected from two altitude ranges—the lower troposphere from sea level to about 10 km, and the lower stratosphere above 15 km—“wefind that the warming is the same or a little less in the atmosphere than at the surface,” Christysays. “This discrepancy has caused a lot of consternation because it’s another example showingthat the models are retaining too much heat.” Singer is more emphatic, stating that the mismatch“clearly falsifies the hypothesis of anthropogenic global warming.”
The real test, however, is running models over a modern 100-year period with and withoutanthropogenic effects included and then comparing the results with the observed data. IPCCmodelers carried out this test for the 2007 assessment. When they left out anthropogenic effects,the models failed to match the observed temperature trend. When the simulations included theanthropogenic forcings and feedbacks, the observations matched quite well, making it reasonableto assume the model projections for future temperature trends are valid.
“That really shows that the only way we can explain the current warming trend is through humanimpacts,” Mann points out. “With the low sensitivity proposed by NIPCC and others, there is noother way to explain the swings in climate that we know have happened.”
Singer retorts that although IPCC claims to be able to reproduce the 20th-century temperaturehistory using the models, “the only way they can do it is by arbitrarily choosing parameters tomake it work—it’s a curve-fitting exercise,” Singer says. “If you have enough arbitrary parameters,you can make any model work. The problem with that is people who claim models agree withobservations at some point have to go back and change the parameters when new scientific details
5/19/10 3:38 PMGlobal Warming And Climate Change | Cover Story | Chemical & Engineering News
Page 18 of 20http://pubs.acs.org/cen/coverstory/87/8751cover.html
emerge in order to keep the models in agreement.”
For example, Singer points to a recent study by atmospheric chemist Drew T. Shindell andcolleagues of NASA’s GISS that sheds new light on aerosol effects. They found that methaneinteractions with hydroxyl radicals and other oxidants during aerosol formation increasemethane’s global-warming potential by 20–40% (C&EN, Nov. 2, page 13).
The implications of the study are that CH4 in combination with other minor forcings such as CO
and volatile organic compounds add up to nearly equal CO2 as a forcing, Shindell says. He adds
that the study suggests that by controlling sulfate emissions to prevent aerosol formation andclean up the air, we are inadvertently increasing global warming by reducing the cooling effects ofthe aerosols and increasing the impact of CH4.
The Shindell study seemingly would lead to alterations in climate models, Singer points out, andin order to keep the models in agreement with past temperature observations, some otherparameters would have to be arbitrarily adjusted. “That just doesn’t wash,” he says.
As climate change has taken the scientific spotlight, new papers on climate change are coming outevery week in top-tier journals such as Science and Nature. They almost exclusively supportIPCC’s assessment of anthropogenic global warming.
A team of 26 climate scientists issued an independent, non-peer-reviewed report, “TheCopenhagen Diagnosis,” late last month to summarize recent findings that have been reportedsince the cutoff date for IPCC’s 2007 report. This unofficial IPCC update is designed to tide overpolicymakers until the next assessment wraps up in 2013. It was timed to come out just ahead ofthe Copenhagen climate conference.
Mann, one of the new report’s authors, says it confirms IPCC’s 2007 assessment thatanthropogenic global warming is unequivocal and notes that warming by 2100 could exceed earlierprojections. It further concludes that global ice sheets are melting faster than predicted and thatsea-level rise, due to expansion of the warming oceans and the melting ice, is expected to behigher than previously forecast. One reason for the discrepancy could be that climate models usedin the 2007 assessment included fast feedbacks such as water vapor but omitted slow feedbackssuch as melting ice and changing vegetation patterns, the report notes.
As climate physicist and report coauthor Stefan Rahmstorf of Germany’s Potsdam Institute forClimate Impact Research put it, “Unfortunately, the data now show us that we haveunderestimated the climate crisis.”
The report concludes that “global CO2 emissions must peak and then decline rapidly within the
next five to 10 years for the world to have a reasonable chance of avoiding the very worst impactsof climate change.”
Some scientists had already projected that IPCC was too conservative in its warnings. Forexample, leading climate modeler James E. Hansen, a climate physicist at GISS, has projected that
5/19/10 3:38 PMGlobal Warming And Climate Change | Cover Story | Chemical & Engineering News
Page 19 of 20http://pubs.acs.org/cen/coverstory/87/8751cover.html
if atmospheric CO2 levels reach about 450 ppm, which is on pace to happen in the next 25 years,
Earth could reach a “tipping point” at which warming exacerbated by strong positive feedbackswill disrupt climate for centuries, with the harshest result being a possible sea-level rise of tens ofmeters.
Despite the scientific evidence laid out by IPCC and mainstream climate scientists, it’s difficultfor them to rebut NIPCC’s analysis and the claims of global-warming skeptics. Most climatescientists don’t even try, and in fact many climate scientists on both sides of the debate admit thatthey haven’t bothered to read NIPCC’s report, as it just repeats what they already know.
According to IPCC’s information and communications officer, Carola Traverso Saibante, IPCC hasnot officially evaluated NIPCC’s report and doesn’t plan to. IPCC appears to be keeping its headdown and working on it next assessment. As Traverso Saibante says, “IPCC’s role is only to assessthe science and disseminate its findings.”
For Penn State’s Mann, one of the few scientists C&EN talked to who acknowledged scrutinizingthe NIPCC report: “It was disappointing to see that it is nothing other than a regurgitation of anumber of contrarian myths about climate change. Beyond the editorialized comments, it terriblymisrepresents the science.”
For UAH’s Christy, who says he did not participate in or read the NIPCC report, he recognizesthat human activities are contributing to climate change. But he urges caution in evaluating whatto do about model projections, and he has provided expert testimony to congressional committeesto that effect, telling them that legislation to control CO2 emissions will be expensive and not have
any significant effect on global warming.
“It really doesn’t matter what the climate sensitivity is, proposals for controlling CO2 or
geoengineering to increase aerosols to cool the planet will not put much of a dent at all intowhatever is going to happen,” Christy says. He adds that it would only disadvantage people livingin developing countries and impoverished regions of the U.S. and other Western countries. Yet,Christy says, aborting the control of CO2 emissions should be no excuse for reducing
environmental protection. “We shouldn’t undo the good things that have been done to clean theair and water. More should be done, especially in developing countries,” he says.
Climatologist Michael Hulme of the University of East Anglia, in England, comments that thescientific evidence backing the basic idea of human activity changing the global climate system isnow overwhelming, even if there are still gaps in knowledge and scientific predictions for futureconsequences are uncertain.
“It is vital that we understand the many valid reasons for disagreeing about global warming andclimate change,” Hulme says. “We must recognize that they are rooted in different political,national, organizational, religious, and intellectual cultures—our different ways of seeing theworld.
“But we must not hide behind the dangerously false premise that consensus science leads to

5/19/10 3:38 PMGlobal Warming And Climate Change | Cover Story | Chemical & Engineering News
Page 20 of 20http://pubs.acs.org/cen/coverstory/87/8751cover.html
consensus politics. In the end, politics will always trump science. Making constructive use of theidea of climate change means that we need better politics, not merely better science.”
Global Warming And Climate ChangeBelievers, deniers, and doubters view the scientific forecast from different anglesClimate Debate: Which Comes First, CO2 Or The Heat?
Chemical & Engineering NewsISSN 0009-2347Copyright © 2010 American Chemical Society