Embed Size (px)
Citation preview
Human-causedGlobalWarmingandClimateChange:UnderstandingtheScience
AResourceforTeachers,StudentsandPolicyMakers
There Is No Planet B
Human-causedGlobalWarmingandClimateChange:UnderstandingtheScience
AResourceforTeachers,StudentsandPolicyMakers
JohnGibbonsLongIslandUniversity
Copyright ©2020 by John Gibbons
Reproduction or translation of any part of this work beyond that permitted by Section 107 or 108 of the 1976 United States Copyright Act without the permission of the copyright owner is unlawful. Requests for permission or further information should be addressed to John Gibbons, 720 Midwood Road, PO Box 577, Cutchogue, NY 11935. Email: [email protected]
Cover: Graphic courtesy of NASA eBook ISBN: 978-1-940380-05-6 Published in coordination with University Science Books https://www.uscibooks.com/gibbons.htm

“I am only one, but I am one. I cannot do everything, but I can do something. And I will not let what I cannot do interfere with what I can do.”
— Edward Everett Hale
Preface
Iwritethissummarywithasenseofhumilityasanonscientist,standingontheshouldersofgiants–themenandwomenofsciencewhohavedonetheresearch,understandtheproblemcompletely,andareworriedabouttheconsequencesofunmitigatedglobalwarming.ThisResourceismyattempttomakethiscomplexsubjectaccessibletoteachers,students,andpolicy-makers
Youmightbewonderinghowanassistantprofessorofeducationwoulddecidetoresearchandwriteaboutthescienceofglobalwarmingandclimatechange.Asidefromthefactthatthisisatopicthateveryoneshouldbecomefamiliarwith,Iwasactuallyjustdoingwhatteachersalwaysdo–respondtostudents’questions.Studentsaskquestionsallthetimeabouttopicsthatareinterestingtothem.SomeofthosequestionswereaboutclimatechangeandIhadnoinformationthatIcouldconfidentlyprovidetothem.Forexample,onestudentwantedtoknowexactlyhowcarbondioxideintheatmospherewarmstheearth.Answeringdifficultquestionshasalwaysbeenoneofthemostexcitingaspectsofteachingbecauseitcompelsbothteacherandstudenttoexpandtheirknowledgeinventory.
Itdidn’ttakelongafterbeginningmyresearchintoglobalwarmingandclimatechangetorealizethatthissubjectwastrulyofparamountimportanceforeveryone,butespeciallyourstudentswhomustliveintheworldwearecreating.Afteradecadeofresearch,Idecidedtopublishasummaryofthesciencetoprovideotherteacherswiththeobjective,science-basedinformationtheyneedtodesigneffectivelessonsonglobalwarmingandclimatechange.Ihavemadeeveryefforttokeepthesectionsinthis‘teacher’sresource’shortandtothepoint,andIhaveincludedquotesfromlegitimatesciencesourcesaswellasnumerousgraphicstohelpmakethemessageclear.Ibelieveitisimperativethatthetopicofglobalwarmingandclimatechangebetaughtateverygradelevelandineverysubjectarea;theconsequencesofinactionwillbehorrificintermsofhumansuffering.Hopefully,teacherswillusetheinformationtodesigncreativeactivitiesthathelptheirstudentsunderstandtheproblemsposedbyglobalwarmingandgaininsightsintopossiblesolutions.Thisresourcecanalsoserveasa‘studentreading’toprovidethebasicknowledgetojuniorhighandhighschoolstudents,collegeundergrads,andotherinterestedparties.Policymakersshouldalsofindthecontentinformative.
MostofthewritingisminebutIhaveattemptedtoincorporatequotesfrommore“expert”sourceswheneverfeasibleandconsistentwiththeoverallobjectiveofmakingthescienceunderstandable.
Forthoseseekingabroaderperspectivewritteninlanguageaccessibletonon-scientists,Irecommendthebook,Earth:TheOperators’Manual,byRichardAlley.TheauthoristheEvanPughProfessorofGeosciencesatPennStateUniversityandamemberoftheNationalAcademyofSciences.Thebookreadslikeanovelbutprovidesvirtuallyallrelevantclimatechangeinformationtomakethereaderwellinformedonthetopic.Itisanexcellentresource.
TableofContents Introduction 1 Int.1–FossilFuels,GreenhouseGasesandGlobalWarming 1 Int.2–TheScientificConsensus 2 Int.3–CorporateHypocrisyonGlobalWarming 3 Chapter1–HistoricalPerspectiveonGlobalWarming 4
1.1 –TheFirstHintthatGreenhouseGasesWarmtheEarth 41.2 –DeterminismandClimateChange 4
Chapter2–TheEarthIsWarming 5 2.1–TheWarmingIsRapid 5 2.2–TheWarmingIsGlobal 6 2.3–TheMeasurementsAreReliable 7 2.4–Earth’sClimateSystemMustAdjusttoaWarmingWorld 9 2.5–HowEarthAdjuststoaWarmingWorld 10 2.6–ObservationalEvidenceConfirmsGlobalWarming 10Chapter3–ClimateDenialism:CouldtheWarmingBeNatural? 14 3.1–IstheCurrentGlobalWarmingJustAnotherNaturalEvent? 14 3.2–CouldtheSunBeCausingtheCurrentGlobalWarming? 15 3.3–IstheCurrentGlobalWarmingtheResultofNaturalVariability? 16 3.4–Conclusion:ClimateDenialism 18Chapter4–ClimateSensitivity 19 Chapter5–UnderstandingtheBasicsofGlobalWarming:HeatandHeatTransfer 21 5.1–Understanding“Heat” 21 5.2–“HeatTransfer”:Conduction,Convection,andRadiativeTransfer 21Chapter6–UnderstandingthePhysicsofGlobalWarming 23 6.1–TheElectromagneticSpectrum 23 6.2–EmissionsSpectraofSunandEarth 24 6.3–ThermodynamicEquilibrium:EnergyIn=EnergyOut 25 6.4–WhytheEarthEmitsRadiationatInfraredWavelengths 26 6.5–TheEarth’sAlbedoorReflectivity 28 6.6–RadiativeTransfer:HowSolarRadiationWarmstheEarth’sSurface 29 6.7–HowGreenhouseGasesWarmtheEarth 29 6.8–WhyCarbonDioxideistheMostImportantGreenhouseGas 31
Chapter7–UnderstandingtheCarbonCycle 32 7.1–TheCarbonCycleBasics:“Sources”,“Sinks”,and“Flows”ofCarbon 32 7.2–The“Short-term”orOrganicCarbonCycle 33 7.3–The“Long-term”orInorganicCarbonCycle 34Chapter8–GreenhouseGasEmissionsandConcentration 35 8.1–EmissionsandAtmosphericConcentrationofGHGs 35 8.2–IncreasingEmissions=IncreasingConcentrationofCO2 36
8.3–DoAllFossilFuelsEmittheSameAmountofCarbonDioxide? 378.4–HumanSourcesofGreenhouseGases 37
Chapter9–HowDoHumanActivitiesWarmtheEarth? 38 9.1–HumanActivitiesIncreasetheAtmosphericConcentrationofCO2 38 9.2–TheProofsthatHumanActivitiesCauseGlobalWarming 39
9.2.1–ExperimentalProof 399.2.2–Theoretical“Proof” 399.2.3–TheChemistryofFossilFuelCombustion 399.2.4–“RealWorld”CarbonEmissions 429.2.5–“ObservationalProof”:IncreasingCO2&IncreasingTemperature 439.2.6–Radiative(Climate)Forcing:Naturalvs.AnthropogenicForcing 449.2.7–IsotopicAnalysis:The“HumanFingerprint” 46
Chapter10–WhyScientistsAreWorried:ClimateFeedbacks 47 10.1–Overview:ClimateFeedbacks 47
10.2–AmplifyingFeedbacks 4810.2.1–Ice-AlbedoFeedback 4810.2.2–WaterVaporFeedback 4910.2.3–PermafrostCarbonFeedback 5010.2.4–MethaneReservoirEmissionsFeedback 51
10.3–DiminishingFeedbacks 5210.3.1–BlackbodyRadiation(PlanckorStefan-Boltzmann)Feedback 5210.3.2–Evaporation/CloudFeedback 5210.3.3–Long-termCarbonDioxideFeedback(InorganicCarbonCycle) 52
10.4–OtherFactorsInfluencingGlobalWarming 53Chapter11–WhyScientistsAreWorried:ClimateTippingPoints 54 11.1–WhatAreClimateTippingPoints 54 11.2–PotentialClimateTippingPoints 55
11.2.1–ArcticSeaIce 5511.2.2–GreenlandIceSheets 5611.2.3–WestAntarcticIceSheet 5611.2.4–AtlanticMeridionalOverturningCirculation(AMOC) 5611.2.5–CoralReefCollapse 5611.2.6–PermafrostMeltdown 56
Chapter12–WhyScientistsAreWorried:Earth’sOceans 57 12.1–OceanWarming 57 12.2–EffectsofOceanWarming 59 12.3–CommittedWarming 59 12.4–OceanAcidification:The“OtherCO2Problem” 60 12.5–LocalStressors,Hypoxia,andEcosystemResilience 61 12.6–SeaLevelRise 62Chapter13–WhyScientistsAreWorried:ExtremeWeatherEvents. 64 Chapter14–WhatCanWeDoaboutClimateChange? 66 14.1–Adaptation,Mitigation,andGeoengineering 66 14.1.1–Adaptation 66 14.1.2–Mitigation 67 14.1.3–Geoengineering 67 14.1.4–ProjectDrawdown 68 Chapter15–Conclusion 69 15.1–ScienceandUncertainty 69Epilogue 71
1
Introduction Writingasummarysuchasthisinlanguagethatisclear,concise,andaccurateinlanguageanon-scientistcanunderstandisalwaysachallenge,andit’sespeciallychallengingbecausetheearth’sclimatesystemisextremelycomplex.Butthescienceisclear,experimentallyandtheoreticallyverified,andcompelling,andtheconsequencesofunmitigatedclimatechangesodirethatanyconcernedinhabitantofearthshouldmaketheefforttounderstandwhat’sgoingonwithourplanet.
Int.1–FossilFuels,GreenhouseGasesandGlobalWarmingItisundeniablytruethatEarth,ourhomeplanet,iswarming.Thewarmingisrapidandglobalandvirtuallyeveryclimatescientistintheworldagreesthatthiswarmingresultsfromhumanactivities,primarilytheburningoffossilfuels.Sincethecombustionoffossilfuelsplayssuchaprominentrole,let’sbesureweunderstandwhatwemeanbytheterm“fossilfuels”.Theword“fossil”givesawaytheoriginofthesefuels.Theyareancient.AccordingtotheU.S.DepartmentofEnergy:
“Fossilenergysources,includingoil,coalandnaturalgas,arenon-renewableresourcesthatformedwhenprehistoricplantsandanimalsdiedandweregraduallyburiedbylayersofrock.Overmillionsofyears,differenttypesoffossilfuelsformed--dependingonwhatcombinationoforganicmatterwaspresent,howlongitwasburiedandwhattemperatureandpressureconditionsexistedastimepassed.”
Importantly,fossilfuelsare“non-renewable”.Inotherwords,thesupplyisfinite,andwhenthey’regone,they’regone.Thereisnoprocessoccurringtodaythatwillreplenishthesefuels.
Burningfossilfuelshasprovideduswithaverycomfortablestandardofliving,butitcomeswithacost.Thecombustionoffossilfuelsemitsgreenhousegasesthataccumulateintheatmosphere.Thesegreenhousegasesallowsunlighttopenetratetheearth’satmosphereunimpededandwarmtheearth’ssurface.Theearththenreradiatesthisheatenergybacktospaceatinfraredwavelengths,butunlikeincomingsunlight,theseoutgoinginfraredwavelengthsdonotpassthroughtheatmosphereunimpeded.Muchlikeablanketpreventstheescapeofheatfromyourbody,greenhousegasesabsorbtheoutgoingradiation,retainingtheheatandfurtherwarmingtheearth.Themaingreenhousegasesarewatervapor,carbondioxide,methane,ozone,nitrousoxide,andthemanmadegases,chloroflourocarbonsandhydroflourocarbons.Althoughgreenhousegasesoccurnaturally,humanactivitieshaveincreasedtheatmosphericconcentrationofthesegasescausingglobalwarmingandclimatechange.Unlessweeliminateallhumanemissionsofgreenhousegases,thewarmingwillcontinue.Howconfidentareclimatescientiststhathumanactivitiesarecausinggreenhousegasestoaccumulateintheatmosphere,warmingtheearth,andforcingearth’sclimatetochangeinwaysthatposeaseriousproblemfortheearthandhumanity?They’recertain.
2
Int.2–TheScientificConsensus
Virtuallyeveryorganizationofprofessionalscientistsintheworldconcurswiththepositionthatourcurrentglobalwarmingistheresultofhumanactivities.ThefollowingpassagequotesthebodyofaletterwrittenundertheauspicesoftheAmericanAssociationfortheAdvancementofScience(AAAS),LettertoCongressdatedJune28,2016.
“DearMembersofCongress,
We,asleadersofmajorscientificorganizations,writetoremindyouoftheconsensusscientificviewofclimatechange.
Observationsthroughouttheworldmakeitclearthatclimatechangeisoccurring,andrigorousscientificresearchconcludesthatthegreenhousegasesemittedbyhumanactivitiesaretheprimarydriver.Thisconclusionisbasedonmultipleindependentlinesofevidenceandthevastbodyofpeer-reviewedscience.
Thereisstrongevidencethatongoingclimatechangeishavingbroadnegativeimpactsonsociety,includingtheglobaleconomy,naturalresources,andhumanhealth.FortheUnitedStates,climatechangeimpactsincludegreaterthreatsofextremeweatherevents,sealevelrise,andincreasedriskofregionalwaterscarcity,heatwaves,wildfires,andthedisturbanceofbiologicalsystems.Theseverityofclimatechangeimpactsisincreasingandisexpectedtoincreasesubstantiallyinthecomingdecades.
Toreducetheriskofthemostsevereimpactsofclimatechange,greenhousegasemissionsmustbesubstantiallyreduced.Inaddition,adaptationisnecessarytoaddressunavoidableconsequencesforhumanhealthandsafety,foodsecurity,wateravailability,andnationalsecurity,amongothers.
We,inthescientificcommunity,arepreparedtoworkwithyouonthescientificissuesimportanttoyourdeliberationsasyouseektoaddressthechallengesofourchangingclimate.”
Theletterissignedbythepresidentsof31Americanscientificorganizations,and,since2016whentheletterwaswritten,theevidencehasbecomefarmorecompellingandworrisome.Butit’snotjustprofessionalscientistsintheUnitedStateswhoaredeeplyconcerned.Virtuallyeveryorganizationofprofessionalscientistsintheworldconcurs.AndtheUnitedStatesGovernmentagrees.TheFourthNationalClimateAssessment,acongressionallymandatedreportwrittenby13agenciesoftheUnitedStatesFederalGovernmentstatesthat:
"itisextremelylikelythathumanactivities,especiallyemissionsofgreenhousegases,arethedominantcauseoftheobservedwarmingsincethemid-20thcentury.Forthewarmingoverthelastcentury,thereisnoconvincingalternativeexplanationsupportedbytheextentoftheobservationalevidence."(Vol.1,“ClimateScienceSpecialReport”)
3
Int.3–CorporateHypocrisyonGlobalWarming
Butaren’ttherescientiststhatdonotbelieveinanthropogenicclimatechange?Yes,buttheyareveryfewandtheyareoutliers,oftenfundedbythefossilfuelindustryorconservative“thinktanks”,thatprofitfromthefossilfuelindustry.Thisisthesamefossilfuelindustrythathasknownthetruthaboutglobalwarmingforalongtime.IntheAugust1966editionoftheMiningCongressJournal,JamesGarvey,PresidentofBituminousCoalResearch,states:
"ThereisevidencethattheamountofcarbondioxideintheEarth'satmosphereisincreasingrapidlyasaresultofthecombustionoffossilfuels."Garveycontinues,"Ifthefuturerateofincreasecontinuesasitisatthepresent,ithasbeenpredictedthat,becausetheCO2envelopereducesradiation,thetemperatureoftheEarth'satmospherewillincreaseandthatvastchangesintheclimatesoftheEarthwillresult."
ThispastOctober,RexTillerson,formerCEOofExxonMobilandSecretaryofStateunderPresidentTrump,testifiedunderoathinaNewYorkcourtroomthatthecompanyknewforyearsthatglobalwarmingwasasignificantthreat.
“Weknew,weknewitwasarealissue,”saidTillerson.“Weknewitwasaseriousissueandweknewitwasonethat’sgoingtobewithusnow,forevermore,andit’snotsomethingthatwasjustsuddenlygoingtodisappearoffofourconcernlistbecauseitisgoingtobewithusforcertainlywellbeyondmylifetime.”
ExxonMobil’sinternaldocumentsconfirmthis.AninternalreportpreparedbyExxonresearcher,JamesBlackin1978states:
“Adoublingofcarbondioxideisestimatedtobecapableofincreasingtheaverageglobaltemperaturebyfrom1°to3°C,witha10°Crisepredictedatthepoles.”
Andtherearemanyotherinternalreportsfromdecadesagothatcorroborateexactlywhatthescientificcommunitytellsusabouthuman-causedglobalwarmingandclimatechange.Despitetheirownreports,thefossilfuelindustrycontinuestofundclimatedenialismproducingpropagandaintendedtocreatedoubt,obscurethetruthanddeceivethepublic. Thescientificprocessencouragespresentingevidencethatcontradictsanestablishedscientificposition,butclimatedenialistsoffernosuchevidence.Theirchallengesarebaselesssmokescreens,debunkedbylegitimatescientists,onlytoreappearagainandagain.Hereisoneundeniablefact.Ifthefossilfuelindustryanditscontrarianscientistscoulddisprovethescientificconsensus,theywouldpublishtheirrebuttal,wintheNoblePrizeandwewouldallbedancinginthestreets.Don’tholdyourbreath.
4
Chapter1–HistoricalPerspectiveonGlobalWarming
1.1-TheFirstHintthatGreenhouseGasesWarmtheEarth
Inthelate1800’s,scientistsmeasuredthesolarenergyreachingtheearthandcalculatedthatthetemperatureoftheearthshouldbeminus180Celsius(00F)–afrozensnowball.Butactualmeasurementsrevealedtheearth’stemperaturetobearelativelymild150C(590F).Thescientistsconcludedthatthisadditionalwarmingmustresultfromtraceamountsofgreenhousegasesintheearth’satmosphere.Thiswasnotwildspeculation.In1859JohnTyndallhadexperimentallyprovedthatcarbondioxideandothergreenhousegasesabsorbinfraredradiation,producingawarmingeffect.Aroundthesametime,chemistshaddiscoveredtheformulasforthecombustionoffossilfuelsprovidinganunderstandingofmankind’sroleintheemissionsofgreenhousegases.Bytheearly1900’sphysicistsunderstoodthebasicsofquantumtheory–thephysicsexplaininghowsubatomicparticlesinteractwitheachotherandwithordinarymatter.Thisprovidedthebasisforunderstandinghowgreenhousegasesabsorbinfraredradiation,causingtheearthtowarm.
Bythemid1900’s,scientistswereawareoftherelationshipsaffectingtheearth’sclimatesystem.Wenowunderstandthoserelationshipsquitewell.Theserelationshipshaven’tchangedsincethe1800’s,theyhavebeenexperimentallyandtheoreticallyverified,andtheyformthefoundationforunderstandinghowandwhytheearth’sclimateischanging.Letmesummarizeinabriefparagraphthescientificknowledgeasweunderstandittoday.Theproofswillbeprovidedlater.Weknowthatgreenhousegasesabsorbinfraredradiationtheearthemitstospace,warmingtheplanet.Weknowthathumanactivitiesproduceemissionsofthesegreenhousegasesthataccumulateintheatmosphere.Thisincreaseintheatmosphericconcentrationofgreenhousegasescausesadditionalwarming–globalwarming.Weknowthatglobalwarmingforcestheearth’sclimatesystemtoadjusttotheincreasedtemperature,aphenomenonwecallclimatechange.Finally,weknowthatextremeweatherevents,suchasdroughts,intenserainfallevents,flooding,andtropicalcyclones,areincreasinginfrequencyandintensityduetoglobalwarming.
1.2-DeterminismandClimateChange
TheEarth’sClimateSystemIsDeterministic.Determinism,thenotionthatthereisacauseforeveryeffect,hastwoimplicationsforclimatescience.
• First,significantchangestotheearth’sclimatesystemalwayshaveacause.Theclimatechangemightbeslow,asintherecurringglacial-interglacialevents(Milankovitchorbitalvariations),orthechangecanberapid,asintheextinctionofthedinosaurs(asteroidimpact).Or,theclimatecanchangeatarelativelyquickpacesuchasthecurrenthuman-causedwarmingcausedbyincreasedemissionsofgreenhousegases.
• Second,thecurrentglobalwarmingof10C(1.80F)since1900isasignificantclimatechangeevent,hencetheremustbeacause.Thistemperaturechangedoesn’tseemlikemuchbutonageologicaltimescale,thisincreaseintemperatureof10Cinahundredyears,withoutadramaticeventsuchasanasteroidstrike,isunprecedentedlyrapid.Weshouldbepayingattentiontochangesthis“rapid”.
5
Chapter2–TheEarthIsWarming
2.1–Fact:TheWarmingIsUnprecedentedlyRapid
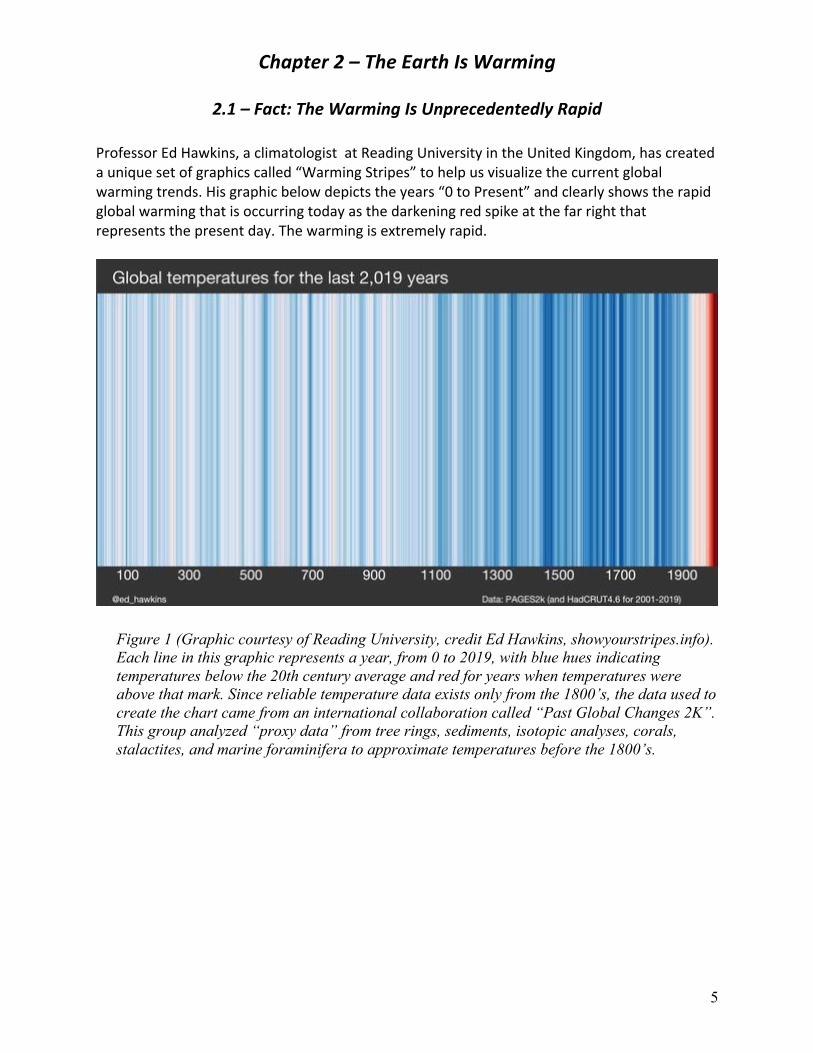
ProfessorEdHawkins,aclimatologistatReadingUniversityintheUnitedKingdom,hascreatedauniquesetofgraphicscalled“WarmingStripes”tohelpusvisualizethecurrentglobalwarmingtrends.Hisgraphicbelowdepictstheyears“0toPresent”andclearlyshowstherapidglobalwarmingthatisoccurringtodayasthedarkeningredspikeatthefarrightthatrepresentsthepresentday.Thewarmingisextremelyrapid.
Figure 1 (Graphic courtesy of Reading University, credit Ed Hawkins, showyourstripes.info). Each line in this graphic represents a year, from 0 to 2019, with blue hues indicating temperatures below the 20th century average and red for years when temperatures were above that mark. Since reliable temperature data exists only from the 1800’s, the data used to create the chart came from an international collaboration called “Past Global Changes 2K”. This group analyzed “proxy data” from tree rings, sediments, isotopic analyses, corals, stalactites, and marine foraminifera to approximate temperatures before the 1800’s.
6
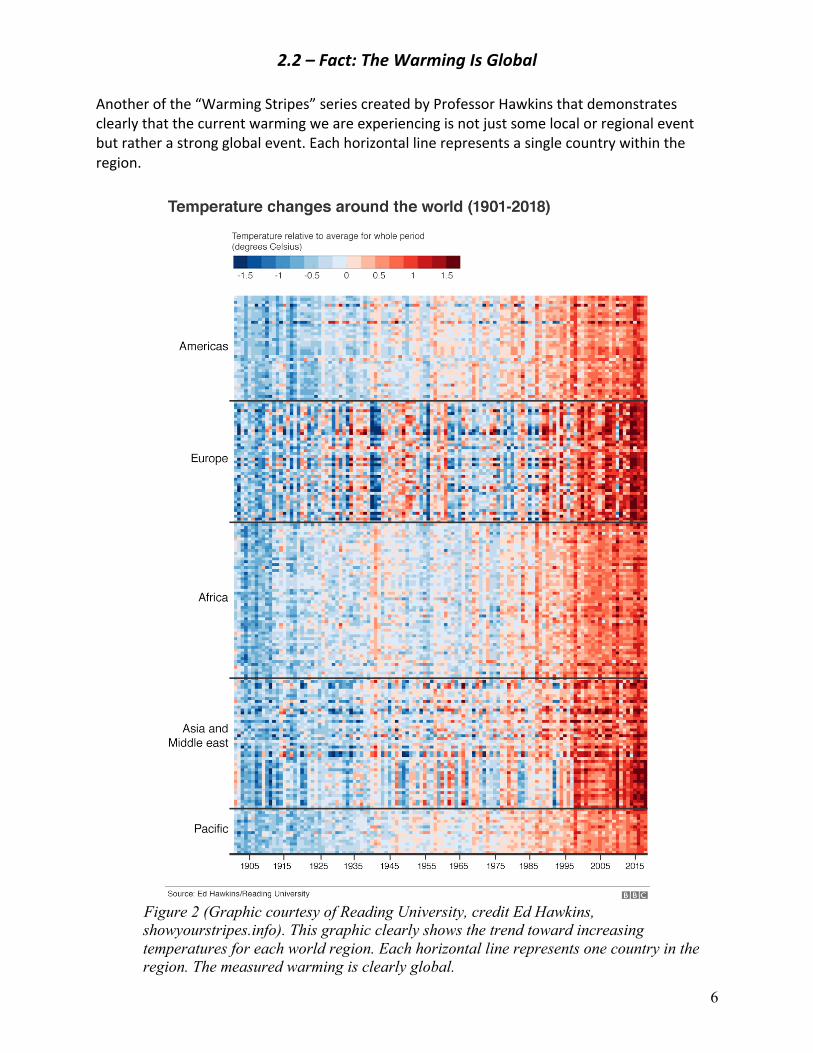
2.2–Fact:TheWarmingIsGlobal
Anotherofthe“WarmingStripes”seriescreatedbyProfessorHawkinsthatdemonstratesclearlythatthecurrentwarmingweareexperiencingisnotjustsomelocalorregionaleventbutratherastrongglobalevent.Eachhorizontallinerepresentsasinglecountrywithintheregion.
Figure 2 (Graphic courtesy of Reading University, credit Ed Hawkins, showyourstripes.info). This graphic clearly shows the trend toward increasing temperatures for each world region. Each horizontal line represents one country in the region. The measured warming is clearly global.
7
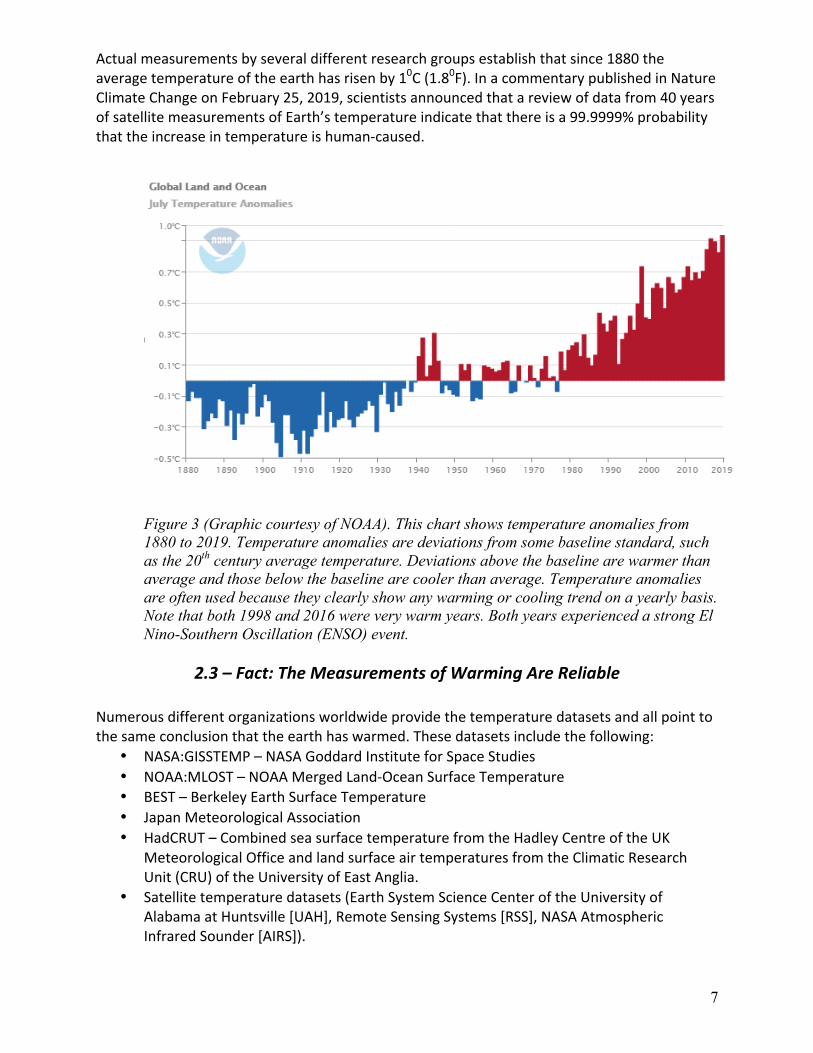
Actualmeasurementsbyseveraldifferentresearchgroupsestablishthatsince1880theaveragetemperatureoftheearthhasrisenby10C(1.80F).InacommentarypublishedinNatureClimateChangeonFebruary25,2019,scientistsannouncedthatareviewofdatafrom40yearsofsatellitemeasurementsofEarth’stemperatureindicatethatthereisa99.9999%probabilitythattheincreaseintemperatureishuman-caused.
Figure 3 (Graphic courtesy of NOAA). This chart shows temperature anomalies from 1880 to 2019. Temperature anomalies are deviations from some baseline standard, such as the 20th century average temperature. Deviations above the baseline are warmer than average and those below the baseline are cooler than average. Temperature anomalies are often used because they clearly show any warming or cooling trend on a yearly basis. Note that both 1998 and 2016 were very warm years. Both years experienced a strong El Nino-Southern Oscillation (ENSO) event.
2.3–Fact:TheMeasurementsofWarmingAreReliable
Numerousdifferentorganizationsworldwideprovidethetemperaturedatasetsandallpointtothesameconclusionthattheearthhaswarmed.Thesedatasetsincludethefollowing:
• NASA:GISSTEMP–NASAGoddardInstituteforSpaceStudies• NOAA:MLOST–NOAAMergedLand-OceanSurfaceTemperature• BEST–BerkeleyEarthSurfaceTemperature• JapanMeteorologicalAssociation• HadCRUT–CombinedseasurfacetemperaturefromtheHadleyCentreoftheUK
MeteorologicalOfficeandlandsurfaceairtemperaturesfromtheClimaticResearchUnit(CRU)oftheUniversityofEastAnglia.
• Satellitetemperaturedatasets(EarthSystemScienceCenteroftheUniversityofAlabamaatHuntsville[UAH],RemoteSensingSystems[RSS],NASAAtmosphericInfraredSounder[AIRS]).
8
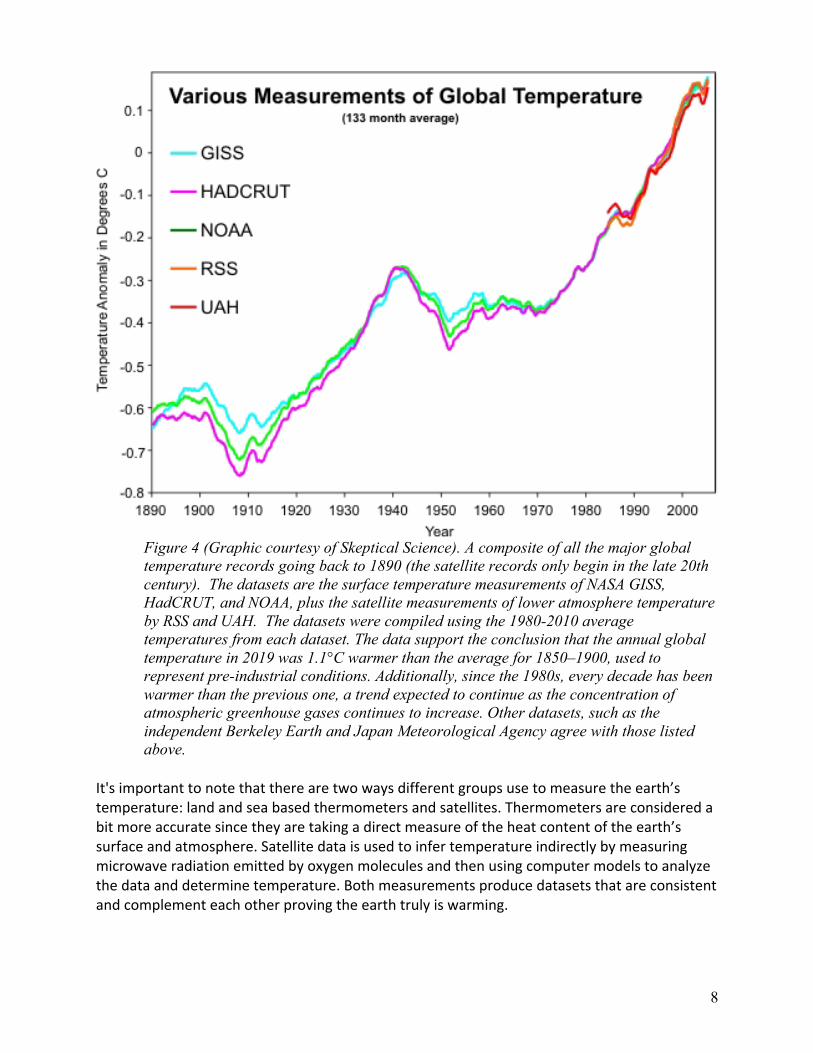
Figure 4 (Graphic courtesy of Skeptical Science). A composite of all the major global temperature records going back to 1890 (the satellite records only begin in the late 20th century). The datasets are the surface temperature measurements of NASA GISS, HadCRUT, and NOAA, plus the satellite measurements of lower atmosphere temperature by RSS and UAH. The datasets were compiled using the 1980-2010 average temperatures from each dataset. The data support the conclusion that the annual global temperature in 2019 was 1.1°C warmer than the average for 1850–1900, used to represent pre-industrial conditions. Additionally, since the 1980s, every decade has been warmer than the previous one, a trend expected to continue as the concentration of atmospheric greenhouse gases continues to increase. Other datasets, such as the independent Berkeley Earth and Japan Meteorological Agency agree with those listed above.
It'simportanttonotethattherearetwowaysdifferentgroupsusetomeasuretheearth’stemperature:landandseabasedthermometersandsatellites.Thermometersareconsideredabitmoreaccuratesincetheyaretakingadirectmeasureoftheheatcontentoftheearth’ssurfaceandatmosphere.Satellitedataisusedtoinfertemperatureindirectlybymeasuringmicrowaveradiationemittedbyoxygenmoleculesandthenusingcomputermodelstoanalyzethedataanddeterminetemperature.Bothmeasurementsproducedatasetsthatareconsistentandcomplementeachotherprovingtheearthtrulyiswarming.
9
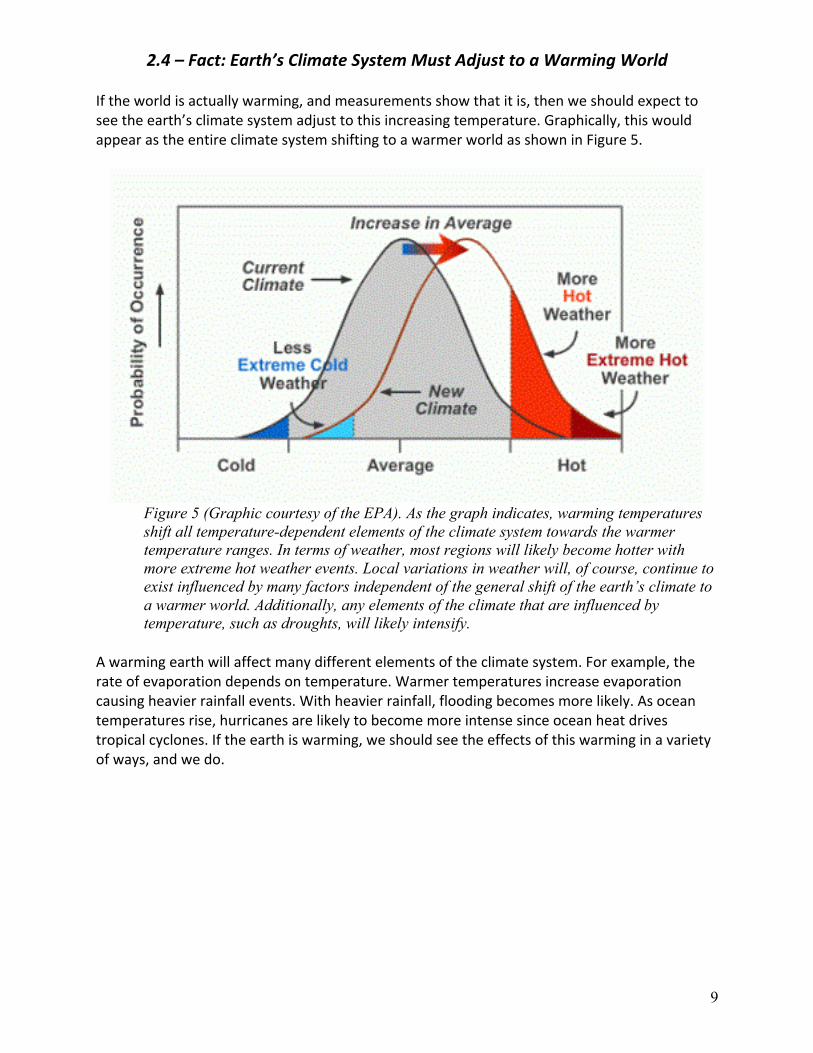
2.4–Fact:Earth’sClimateSystemMustAdjusttoaWarmingWorldIftheworldisactuallywarming,andmeasurementsshowthatitis,thenweshouldexpecttoseetheearth’sclimatesystemadjusttothisincreasingtemperature.Graphically,thiswouldappearastheentireclimatesystemshiftingtoawarmerworldasshowninFigure5.
Figure 5 (Graphic courtesy of the EPA). As the graph indicates, warming temperatures shift all temperature-dependent elements of the climate system towards the warmer temperature ranges. In terms of weather, most regions will likely become hotter with more extreme hot weather events. Local variations in weather will, of course, continue to exist influenced by many factors independent of the general shift of the earth’s climate to a warmer world. Additionally, any elements of the climate that are influenced by temperature, such as droughts, will likely intensify.
Awarmingearthwillaffectmanydifferentelementsoftheclimatesystem.Forexample,therateofevaporationdependsontemperature.Warmertemperaturesincreaseevaporationcausingheavierrainfallevents.Withheavierrainfall,floodingbecomesmorelikely.Asoceantemperaturesrise,hurricanesarelikelytobecomemoreintensesinceoceanheatdrivestropicalcyclones.Iftheearthiswarming,weshouldseetheeffectsofthiswarminginavarietyofways,andwedo.
10
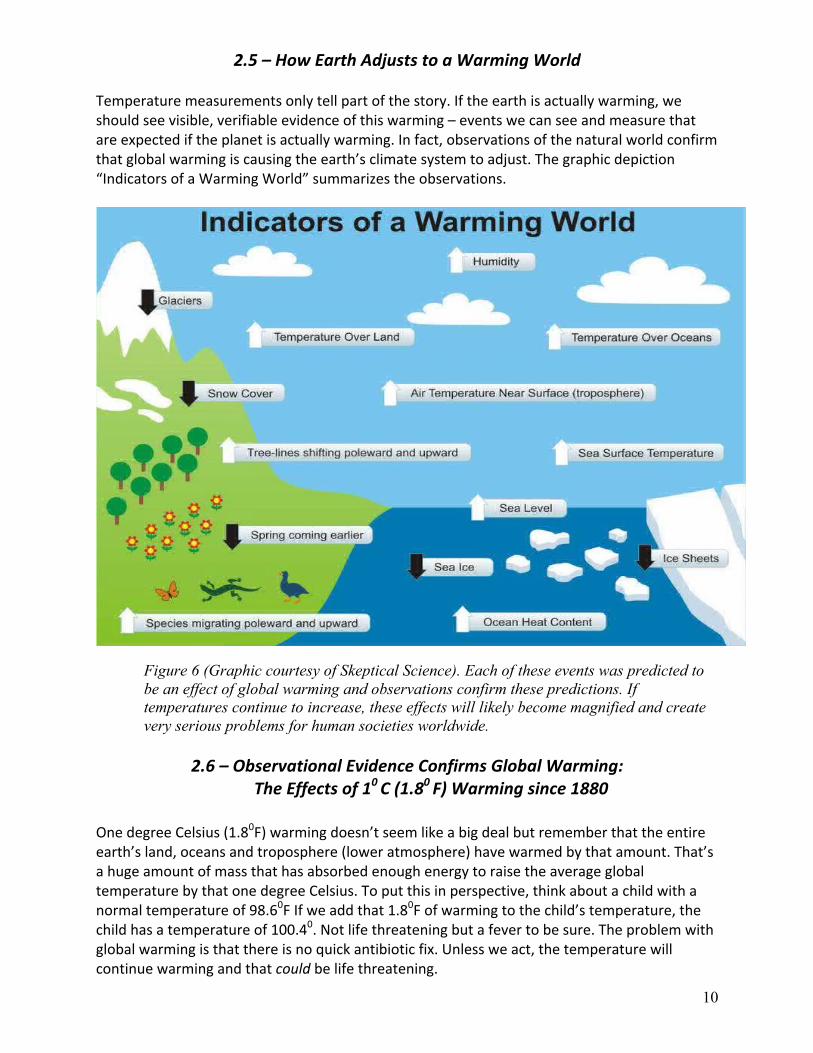
2.5–HowEarthAdjuststoaWarmingWorldTemperaturemeasurementsonlytellpartofthestory.Iftheearthisactuallywarming,weshouldseevisible,verifiableevidenceofthiswarming–eventswecanseeandmeasurethatareexpectediftheplanetisactuallywarming.Infact,observationsofthenaturalworldconfirmthatglobalwarmingiscausingtheearth’sclimatesystemtoadjust.Thegraphicdepiction“IndicatorsofaWarmingWorld”summarizestheobservations.
Figure 6 (Graphic courtesy of Skeptical Science). Each of these events was predicted to be an effect of global warming and observations confirm these predictions. If temperatures continue to increase, these effects will likely become magnified and create very serious problems for human societies worldwide.
2.6–ObservationalEvidenceConfirmsGlobalWarming:
TheEffectsof10C(1.80F)Warmingsince1880OnedegreeCelsius(1.80F)warmingdoesn’tseemlikeabigdealbutrememberthattheentireearth’sland,oceansandtroposphere(loweratmosphere)havewarmedbythatamount.That’sahugeamountofmassthathasabsorbedenoughenergytoraisetheaverageglobaltemperaturebythatonedegreeCelsius.Toputthisinperspective,thinkaboutachildwithanormaltemperatureof98.60FIfweaddthat1.80Fofwarmingtothechild’stemperature,thechildhasatemperatureof100.40.Notlifethreateningbutafevertobesure.Theproblemwithglobalwarmingisthatthereisnoquickantibioticfix.Unlessweact,thetemperaturewillcontinuewarmingandthatcouldbelifethreatening.
11
Thefollowingsymptomsareconsequencesofthe10Cofglobalwarmingthatwehavealreadyobserved.Manyclimateeffectsareregional,butthegeneralruleisthis:Dryareaswillbecomedryer,wetareaswillbecomewetter,andraineventswillbecomemoreintense.
• Recordsettingtemperatures!Adirecteffectofthe10Cincreaseinglobalmean
temperature,theearthisexperiencingconsistentlywarmerrecordtemperaturesworldwide.JuneandJuly,2019,werethewarmestsummermonthssincemodernrecordshavebeenkept(1880).JulywasalsothewarmestmontheverrecordedbeatingoutJuly,2016,whichwasastrongelNiñoyear.2019summertemperatureshit1150FinseveralcountriesofEuropeandIndiasaw1200F.Datashowthatfordecadesnow,recordhightemperaturesvastlyoutnumberrecordlowsworldwide.
• Heatwaves!Aheatwaveisaprolongedperiodofextremelyhightemperaturesforaparticularregion.Sincewhatisconsideredahightemperatureforanyparticularregionvaries,thetermis“relative”.Likerecordsettinghightemperatures,heatwaveshavebecomemorecommonandmoreintense.Additionally,researchandmodelssuggestthatastemperaturesrise,heatwaveswillcontinuetobecomemorefrequentandmoreintense.
• Droughts!Adroughtisaprolongedperiodofabnormallylowrainfall.Higherglobaltemperaturescauseanincreaseinevaporation.Increasedevaporationcombinedwithexcessivetemperaturesandmorefrequentandintenseheatwaveshaveresultedinseveredroughtsindrought-proneareasoftheworld.Droughtsleadtocropfailure,famineandthedisplacementofthousandsofpeopleleadingtoworldwiderefugeeproblems.Thentherearemegadroughts–prolongedperiodsofseveredroughtthatlastformonthsoryears.ThesearesoseriousthathistoricallytheyareknowntohaveendedvibrantcivilizationssuchastheAnasaziintheAmericanSouthwest.Rememberthegeneralrule:Dryareaswillbecomedryerduetotheincreasedevaporationcausedbyincreasingtemperatures.
• Wildfires!Anotherconsequenceofincreasedtemperature,evaporationanddroughtisthedryingofgroundcovermakingwildfiresmorecommonandmoreintense.The2018wildfireseasonwasoneofthedeadliestandmostdestructiveonrecordwithCaliforniaenduringthemostdestructivewildfireseasonever.2019sawthesamesituationinAustralia.Asworldwidetemperaturesincrease,wildfiresincreaseeveninareassuchastheArcticthattypicallydonotexperiencewildfires.
• Heavyprecipitationevents!Higherglobalaveragetemperaturescauseincreasedevaporationputtingmorewatervaporintotheatmosphere.Importantly,awarmeratmosphereholdsmorewatervaporthanacooleratmosphere.Ascloudscontainingwatervaporrise,theycoolandtheincreasedamountofwatervaporcondensesandfallsasrelativelyheavier,monsoon-likerainfall.Also,watervaporisapotentgreenhousegasandtheadditionalamountofwatervaporintheatmosphereisanamplifyingfeedbackmechanismthatenhancesthe“greenhouseeffect”.
• Flooding!Becauseoftheincreasedheavyprecipitationeventscausedbyincreasingevaporation,extremefloodingeventsareoccurringwithincreasingfrequencyandintensity.Monsoon-likeheavyrainfallcanoverwhelmthenaturalandmanmadechannelsandproduceextremeflooding,whichcauseshumansufferingandplacesafinancialburdenonindividual,state,andfederalresources.
12
• SeaIceMelting!Astheearthwarms,seaicemeltsespeciallyintheArcticOceanandSouthernOceansurroundingthecontinentofAntarctica.Thisdoesnotcausesealevelstorisesinceseaiceisalready“partof”theoceans.Buttherealprobleminvolvesthe“Ice-Albedo”effect,anamplifying(warming)feedback.Seaicereflectsvirtuallyallofthesunlightthatstrikesit.Asseaicemelts,thedarkeroceanwaterabsorbsalmostallofthatheatenergyfromsunlightcausingadditionalwarming.
• MountainGlaciersMelting!Mountainglaciersvirtuallyworldwidearemeltingandretreatingastheearthwarmsandtheyaremeltingatanacceleratingrate.Muchofthemeltwatereventuallyreachestheoceans,whichaccountsforaboutone-thirdofcurrentsealevelrise(aboutthesamecontributionasthemeltingGreenlandicesheet).Anotherproblemistheeffectthelossofmountainglacierswillhaveonthelocalcommunitiesthatdependonmeltwaterfortheirfreshwatersupply.Inmanyoftheseregionsthereissimplynosubstituteandthelocalinhabitantswillbecomerefugees.
• PolarIceSheetsMelting!Thetwolargesticesheetsontheplanet,theGreenlandicesheetandtheAntarcticicesheet,arebothmeltingandlosingmass.IftheGreenlandicesheetmeltsentirely,thesealevelwillriseby6meters(about20feet)andtheAntarcticicesheetcontainsenoughwatertoraisesealevelbyabout70meters(about230feet).Whileatotalmeltdownisnotlikely,bothicesheetsarelosingmassatanacceleratingrate.Currently,theGreenlandicesheetcontributesaboutone-thirdoftheriseinsealevelandAntarcticicesheetmuchless.ThesemeltratesareacceleratingandcouldbecomesignificantlyhigherifhumanemissionsofGHGscontinuetopushtheconcentrationofthesegaseshigher.MostclimatescientistsbelievetheGreenlandicesheetisconsiderablymorevulnerableandcouldreacha“tippingpoint”atglobalwarmingof20C.Thisisalsomoreproblematicbecauseofthe“ArcticAmplification”.DuetothelocalIce-Albedoamplifyingfeedbackthatiscurrentlyoccurring,theArcticiswarmingtwiceasfastastherestoftheworld.Recentresearchindicatesthatpolaricesheetsaremelting6timesfasterthanthe1990’s.
• SeaLevelRise!AccordingtoNASA,overthelastseveraldecades,sealevelshaverisenatthefastestrateeverrecordedandtherateisaccelerating.Currently,sealevelsarerisingduetothermalexpansionoftheoceans(likemostsubstances,waterexpandsasitwarms),landsubsidence,slowingofoceancurrents,themeltingofmountainglaciers,andthemeltingofthepolaricesheets.Ifsealevelsriseby1to2meters(about3to6feet)by2100aspredicted,millionsofpeoplelivingincoastalregionswillbecomerefugees.Andsealevelrisevariesconsiderablydependingonothervariablesaffectingspecificcoastalregionsoftheworld.Forexample,theUnitedStatesEastCoastwillexperiencegreaterthanaveragesealevelincreaseduetoreboundlandsubsidencefromthelastglaciationandslowingoftheGulfStream,allowingwaterto“pileup”alongthecoast.Worldwide,thethreatofsealevelriseandstormsurgeassociatedwithstormswillendangeroverabillionpeopleby2100.
• Desertification!Thedefinitionof“desertification”isbroaderthantheSahara-likeimagemostofushave.AccordingtheUnitedNationsConventiontoCombatDesertification(UNCCD),desertificationmeans,“landdegradationinarid,semi-aridanddrysub-humidareasresultingfromvariousfactors,includingclimaticvariationsandhumanactivities.”WritinginCarbonBriefExplainers,August6,2019,RobertMcSweeneystates,“Thecombinedimpactofclimatechange,landmismanagementandunsustainablefreshwaterusehasseentheworld’swater-scarceregionsincreasinglydegraded.Thisleavestheirsoilslessabletosupportcrops,livestockandwildlife…threateningthefood
13
securityandlivelihoodsofmorethantwo-billionpeople.”Whiletherearenaturalfactorscontributingtodesertification,theseproblemsareexacerbatedbyglobalwarmingasdrylandsbecomeevendryerduetoincreasedevaporation.
• Tropicalcyclones!Tropicalcyclonesarefueledbyseasurfacetemperatures,whichiswhytheyhavetraditionallybeentropicalevents.Asseasurfacetemperatures(SST)rise,climatescientistspredictthatthesecycloneswillincreaseinintensityandduration.Theactualvariablesthatcausethesestormstoformarecomplexandcomplicated,whichmakesthefrequencyoftheseextremeweathereventsdifficulttopredict.However,theincreasedseasurfacetemperaturewilldefinitelyimpactthesestormsoncetheyformandtheincreasedevaporationwillcausemoreintenserainfallassociatedwiththesestorms.Also,warmingSSTsinmiddlelatitudesenabletropicalsystemstomaintainintensityastheymovepoleward.
• Oceanacidification!Theoceansarecurrentlyabsorbingbetween25%and50%ofthecarbondioxideemittedbyhumans.TheCO2dissolvesinthesaltwaterandformscarbonicacid,which“dissociates”intobicarbonateionsandhydrogenions.TheincreasedconcentrationofhydrogenionslowersthepHcausingtheoceantobecomemoreacidic.AccordingtotheOceanConservancy,oceanacidificationhasincreasedby30%sincethebeginningoftheIndustrialRevolutionand,“Thisrateofchangesurpassesalloceanchemistrychangesinthepast50millionyears.Livinginanacidifyingoceanischallengingforcorals,oysters,lobstersandothershell-buildinganimals.”
• Speciesextinction!Manyscientistsaresuggestingthecurrentgeologicepoch,theHoloceneepoch,shouldberenamedthe“Anthropocene”becausehumansarehavingsuchanenormousimpactonearth’sclimate.Oneofthehumanimpactsisnamedthe“SixthMassExtinction”becausesomanyspeciesareunabletoadapttoenvironmentalchangeshumanshavecaused.Naturalselectionworksbyselectingthosebodyformsbestadaptedtochangingconditionsandpassingthosegenesontothenextgeneration.Butformanyspecieswithslowerreproductiveratesthatproducefewoffspring,thisevolutionaryprocesstakestoomuchtimetoaccomplishand,iftheycannotadapt,theybecomeextinct.Thecurrentpaceofglobalwarmingisplacingseverelimitsontheadaptiveabilityofmany,manyspecies.
• Tropicalclimatezonesexpandpoleward–Astheearth’stemperaturerises,tropicalecosystemsandspeciesfollowthewarmthandexpandpolewardputtingadditionalpressureonindigenousspecies.Buttherealproblemforhumansinvolvestheincreasingriskoftropicaldiseasesinvadingsubtropicalregions,suchasFloridaandtheAmericanSouthwest.SomeofthesetropicaldiseasesarerarebutdeadlyincludingEbolahemorrhagicfeverandLassafeverandcurrently,thereisnovaccineorcureforthesediseases.Thesediseasesarecarriedbyinsectvectors,suchasmosquitoes,whichcannotsurvivecolderclimatesbutasglobalwarmingexpandstheirrange,thediseaseswillfollowintopopulous,moretemperateregions.
Asglobalmeantemperatureincreases,alloftheseobservedeffectswilllikelyincreaseinintensityandfrequency.TheIPCCissuedaSpecialReport:GlobalWarmingof1.50C(seepage19)haswarnedusthatfailingtostopglobalwarmingat1.50Cwillhavedrasticconsequencesfortheearth’sclimatesystemandallofearth’sspecies,includinghumans.
14
Chapter3–ClimateDenialism:CouldtheWarmingbeNatural?
Scientistsrelyonobjectiveevidencetoreachtheirconclusionsandallconclusionsareconditional–tentativelyacceptedbasedoncurrentevidence.Objectivityrequirescompletehonestyandthatmeansallexplanationsmustbeconsideredviableuntiltheyaredisprovedorrejectedforlackofevidence.Ofcourse,thismeansthatscientistsmustconsidernaturalexplanationsforthecurrentglobalwarmingandclimatechangeandtheyhave.Scientistshaveevaluatedandeliminatedeveryknownnaturaleventthatcouldcausetheglobalwarmingwearemeasuringtoday.However,honestyrequiresthatweaddresssomeofthemostcommonclaimsfornaturalcauses.
3.1–IstheCurrentGlobalWarmingjustanotherNaturalEvent?
“Theearthhaswarmedandcooledmanytimesinthepast,it’sjustnatural.”
Climatedenialistshavearguedthatbecausetheearthhas“naturally”warmedmanytimesinthepast,today’swarmingmustalsobenatural.Whileitistruethatwarmingandcoolingeventshaveoccurredinthepast,thoseeventsalwayshadacause.Rememberthattheearth’sclimatesystemmightbeverycomplex,butitisstilldeterministic–anysignificantchangemusthaveacause.Withoutidentifyingaspecificcauseforthecurrentwarming,theargumentthat“It’snatural”immediatelyfailsbecauseitcommitsthelogicalfallacyof“jumpingtoconclusions”.Specifically,thepremise,“theearthhaswarmednaturallyinthepast”,doesnotnecessarilyleadtotheconclusion,“today’swarmingmustbenatural.”Provingthatlinkrequiresnamingthenaturalcauseandpresentingconvincing,objectiveevidencethatprovestheassertednaturalcauseisoperatingtoday.Forexample,thefactthatsomenaturalforce,suchasanincreaseinsolarirradianceorlargescaletectonicactivity,causedwarminghundredsofmillionsofyearsagodoesnotprovethatitisoperatingtoday.Thisfallacybecomesobviouswhenwelookatsimilarexamples.Forinstance,“Humanshaveoftendiedinthepastfromnaturalcauses,thereforethismanwithaknifestickingoutofhischestmusthavediedofnaturalcauses.”Infact,overtheearth’slonghistorytherehavebeenmanydifferentnaturalcausesforwarmingandcoolingevents,includingchangesinsolaroutput,asteroidstrikes,mega-volcaniceruptionsthatreleasedhugeamountsofmagma(andcarbondioxide),theMilankovitchorbitalvariationsthatcausedtheiceages,andothers.Theoneconstantisthis:Thereisalwaysacauseforwarming,coolingandachangingclimate.Nowwecandefinitivelyaddanothercauseforthesewarmingevents,humanactivities.
15
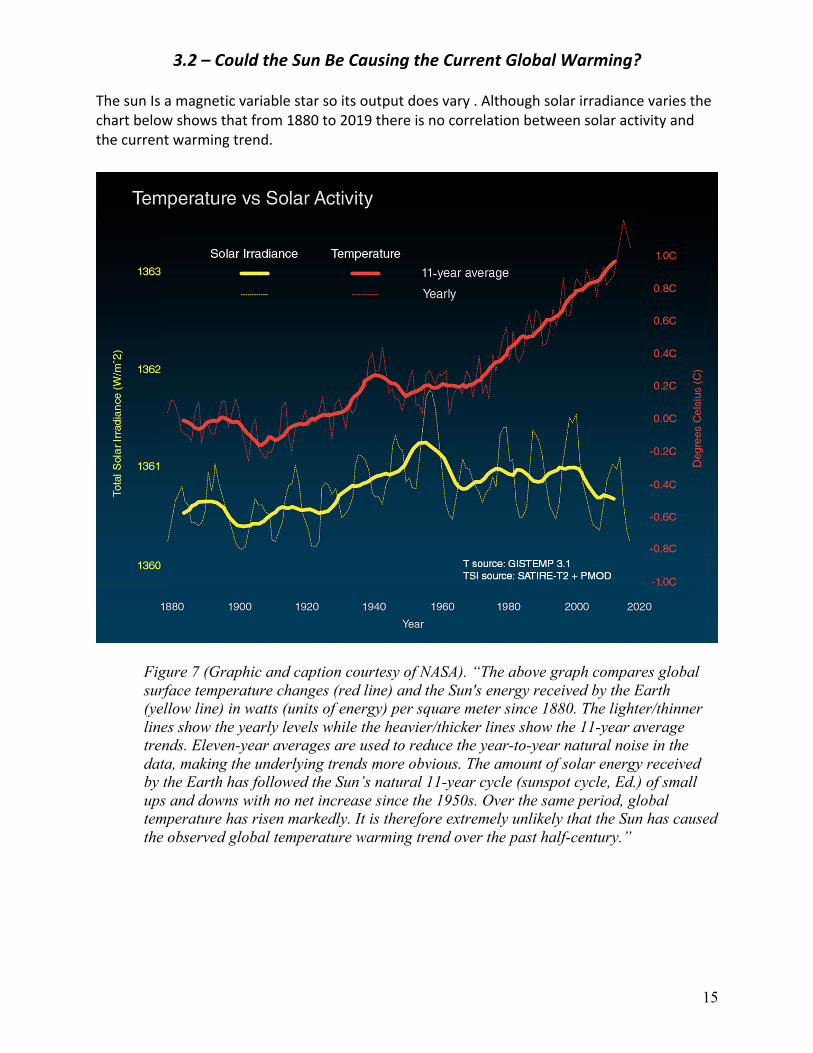
3.2–CouldtheSunBeCausingtheCurrentGlobalWarming?
ThesunIsamagneticvariablestarsoitsoutputdoesvary.Althoughsolarirradiancevariesthechartbelowshowsthatfrom1880to2019thereisnocorrelationbetweensolaractivityandthecurrentwarmingtrend.
Figure 7 (Graphic and caption courtesy of NASA). “The above graph compares global surface temperature changes (red line) and the Sun's energy received by the Earth (yellow line) in watts (units of energy) per square meter since 1880. The lighter/thinner lines show the yearly levels while the heavier/thicker lines show the 11-year average trends. Eleven-year averages are used to reduce the year-to-year natural noise in the data, making the underlying trends more obvious. The amount of solar energy received by the Earth has followed the Sun’s natural 11-year cycle (sunspot cycle, Ed.) of small ups and downs with no net increase since the 1950s. Over the same period, global temperature has risen markedly. It is therefore extremely unlikely that the Sun has caused the observed global temperature warming trend over the past half-century.”
16
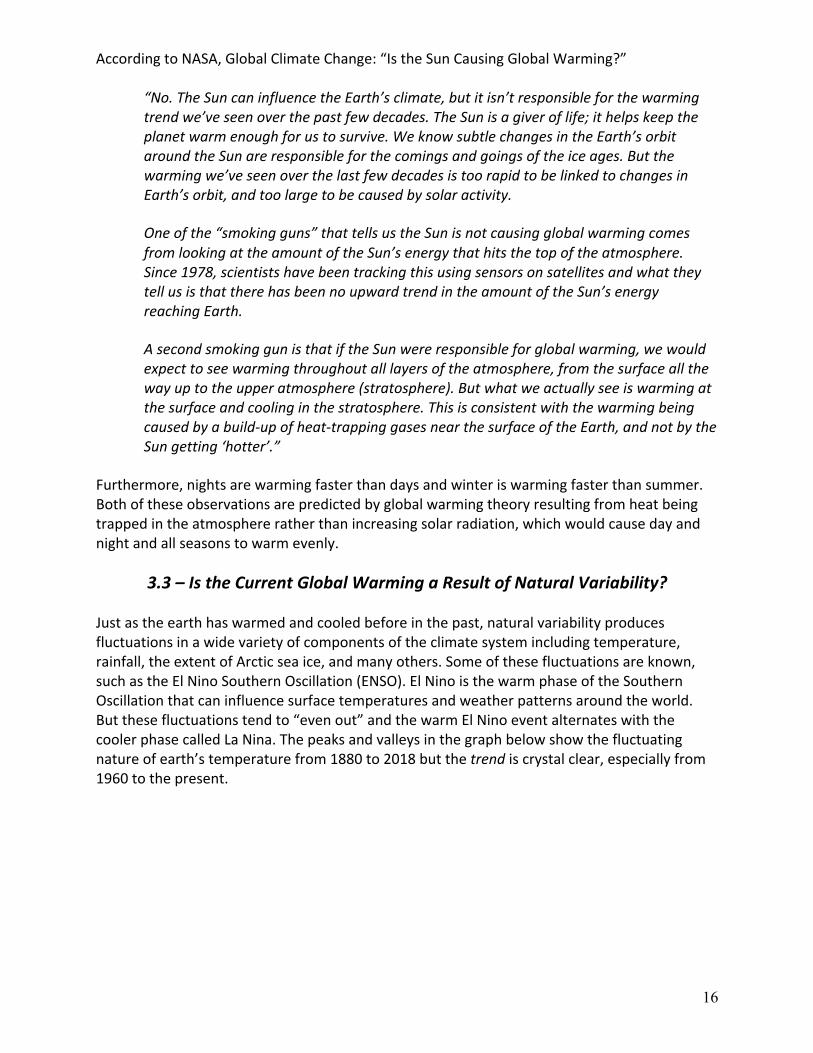
AccordingtoNASA,GlobalClimateChange:“IstheSunCausingGlobalWarming?”“No.TheSuncaninfluencetheEarth’sclimate,butitisn’tresponsibleforthewarmingtrendwe’veseenoverthepastfewdecades.TheSunisagiveroflife;ithelpskeeptheplanetwarmenoughforustosurvive.WeknowsubtlechangesintheEarth’sorbitaroundtheSunareresponsibleforthecomingsandgoingsoftheiceages.Butthewarmingwe’veseenoverthelastfewdecadesistoorapidtobelinkedtochangesinEarth’sorbit,andtoolargetobecausedbysolaractivity.
Oneofthe“smokingguns”thattellsustheSunisnotcausingglobalwarmingcomesfromlookingattheamountoftheSun’senergythathitsthetopoftheatmosphere.Since1978,scientistshavebeentrackingthisusingsensorsonsatellitesandwhattheytellusisthattherehasbeennoupwardtrendintheamountoftheSun’senergyreachingEarth.
AsecondsmokinggunisthatiftheSunwereresponsibleforglobalwarming,wewouldexpecttoseewarmingthroughoutalllayersoftheatmosphere,fromthesurfaceallthewayuptotheupperatmosphere(stratosphere).Butwhatweactuallyseeiswarmingatthesurfaceandcoolinginthestratosphere.Thisisconsistentwiththewarmingbeingcausedbyabuild-upofheat-trappinggasesnearthesurfaceoftheEarth,andnotbytheSungetting‘hotter’.”
Furthermore,nightsarewarmingfasterthandaysandwinteriswarmingfasterthansummer.Bothoftheseobservationsarepredictedbyglobalwarmingtheoryresultingfromheatbeingtrappedintheatmosphereratherthanincreasingsolarradiation,whichwouldcausedayandnightandallseasonstowarmevenly.
3.3–IstheCurrentGlobalWarmingaResultofNaturalVariability?
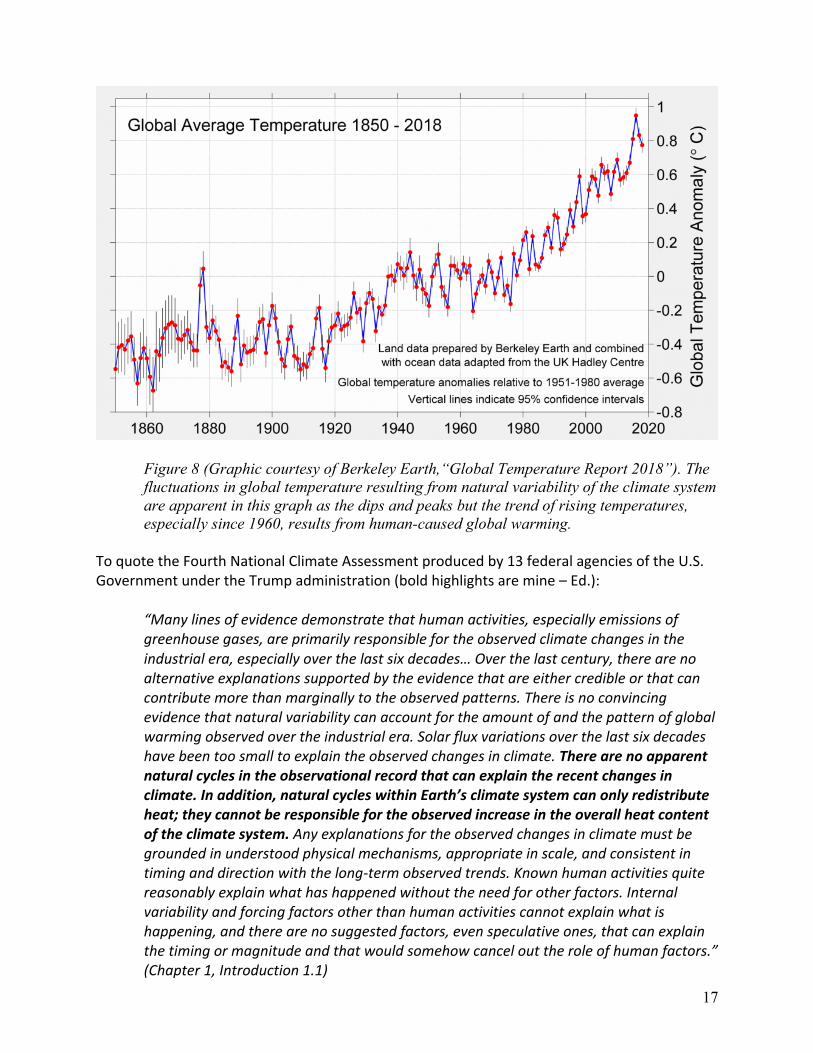
Justastheearthhaswarmedandcooledbeforeinthepast,naturalvariabilityproducesfluctuationsinawidevarietyofcomponentsoftheclimatesystemincludingtemperature,rainfall,theextentofArcticseaice,andmanyothers.Someofthesefluctuationsareknown,suchastheElNinoSouthernOscillation(ENSO).ElNinoisthewarmphaseoftheSouthernOscillationthatcaninfluencesurfacetemperaturesandweatherpatternsaroundtheworld.Butthesefluctuationstendto“evenout”andthewarmElNinoeventalternateswiththecoolerphasecalledLaNina.Thepeaksandvalleysinthegraphbelowshowthefluctuatingnatureofearth’stemperaturefrom1880to2018butthetrendiscrystalclear,especiallyfrom1960tothepresent.
17
Figure 8 (Graphic courtesy of Berkeley Earth,“Global Temperature Report 2018”). The fluctuations in global temperature resulting from natural variability of the climate system are apparent in this graph as the dips and peaks but the trend of rising temperatures, especially since 1960, results from human-caused global warming.
ToquotetheFourthNationalClimateAssessmentproducedby13federalagenciesoftheU.S.GovernmentundertheTrumpadministration(boldhighlightsaremine–Ed.):
“Manylinesofevidencedemonstratethathumanactivities,especiallyemissionsofgreenhousegases,areprimarilyresponsiblefortheobservedclimatechangesintheindustrialera,especiallyoverthelastsixdecades…Overthelastcentury,therearenoalternativeexplanationssupportedbytheevidencethatareeithercredibleorthatcancontributemorethanmarginallytotheobservedpatterns.Thereisnoconvincingevidencethatnaturalvariabilitycanaccountfortheamountofandthepatternofglobalwarmingobservedovertheindustrialera.Solarfluxvariationsoverthelastsixdecadeshavebeentoosmalltoexplaintheobservedchangesinclimate.Therearenoapparentnaturalcyclesintheobservationalrecordthatcanexplaintherecentchangesinclimate.Inaddition,naturalcycleswithinEarth’sclimatesystemcanonlyredistributeheat;theycannotberesponsiblefortheobservedincreaseintheoverallheatcontentoftheclimatesystem.Anyexplanationsfortheobservedchangesinclimatemustbegroundedinunderstoodphysicalmechanisms,appropriateinscale,andconsistentintiminganddirectionwiththelong-termobservedtrends.Knownhumanactivitiesquitereasonablyexplainwhathashappenedwithouttheneedforotherfactors.Internalvariabilityandforcingfactorsotherthanhumanactivitiescannotexplainwhatishappening,andtherearenosuggestedfactors,evenspeculativeones,thatcanexplainthetimingormagnitudeandthatwouldsomehowcancelouttheroleofhumanfactors.”(Chapter1,Introduction1.1)
18
3.4–Conclusion:ClimateDenialismFailsClimatedenialistshavemademanyargumentssuggestingthatclimatechangeissomehow“natural”buttheyprovidenoevidencetosupportthatclaimnordotheyidentifyaspecificnaturalcause.Noreasonablepersonshouldacceptapremiseorhypothesisthatoffersnocredibleevidencetosupportit.Inconclusion,wecanmaketwoobservations:Theevidencefora“natural”causeofglobalwarmingislacking.Tothisdate,climatedenialistshavenotidentifiedany“natural”forcethatcouldbedrivingthecurrentglobalwarmingnorhavetheyproducedanycredibleevidencetosupportthatassertion.Infact,fordecades,scientistshaveexaminedall“climatedrivers”,bothnaturalandmanmade,andfoundnonaturalcausesthatcouldpossiblyexplainthewarmingweareseeingtoday.The“burdenofproof”hasnotbeenmet.SeealsoChapter15,ScienceandUncertainty.Theevidenceforanthropogenicglobalwarmingiscompelling.Ontheotherhand,thescientificevidenceforanthropogenicglobalwarmingiscompellinganditisthemostpersuasivekindofevidencesciencecanoffer–convergentevidence.Thisisevidencefromvariousdifferentscientificdisciplinesthatsupportthesame,singleconclusion–thathumanactivitiesarecausingthecurrentglobalwarming.Theevidence,groundedinestablishedscientifictheory,alsoprovesthattoday’sglobalwarmingisoccurringatapacemuchquickerthaneventsfromthepast.Thefactthatearthhaswarmedby10Cin100yearsisprettymuchunprecedented.Thissuggeststwopoints:
1. Humanactivitiesthatcreateanincreaseintheatmosphericconcentrationofgreenhousegasesaresurprisinglypowerfulatinitiatingclimatechange.
2. Sincehumanemissionsofgreenhousegaseshavecausedtheproblem,humanitymustacttoaddresstheproblembyreducingtheseemissions.Thereisnonaturalforcethatcanreverseglobalwarmingandclimatechangeoveranyreasonabletimescale.Theearth’sthermostat,thelong-termcarboncyclementionedinChapter7,requiresmanymillionsofyearstoreduceatmosphericcarbondioxide,coolingtheplanet.
19
Chapter4–ClimateSensitivity
Verybasically,climatesensitivityasksthisquestion:Ifwedoubletheatmosphericconcentrationofcarbondioxide,howmuchwilltheearth’stemperaturerise?Climatescientistsknowthatcurrentemissionsofgreenhousegaseswillcausechangestotheearth’sclimatesystemthatwillbebad.Climatesensitivityasksthequestions,“Howbad?”and“Howsoon?”
ForperspectiveontheproblemtheIntergovernmentalPanelonClimateChange(IPCC)releaseda“SpecialReport:GlobalWarmingof1.50C”inOctober2018warningusthatovershooting1.50Candwarmingto2.00Cwouldhavedramaticconsequencesfortheearth’sclimate.Itwillnotbeaneasyjourney.InanOctober7,2018articleinNationalGeographicentitled“Environment”,StephenLeahy,capturestheessenceofthemonumentaleffortthatwillberequired:
“TheIPCC’sSpecialReportlaysoutvariouspathwaystostabilizeglobalwarmingat2.7degreesFahrenheit(1.5degreesCelsius).Thesesolutionsallrequireunprecedentedeffortstocutfossil-fueluseinhalfinlessthan15yearsandeliminatetheirusealmostentirelyin30years.Thismeansnohome,business,orindustryheatedbygasoroil;novehiclespoweredbydieselorgasoline;allcoalandgaspowerplantsshuttered;thepetrochemicalindustryconvertedwholesaletogreenchemistry;andheavyindustrylikesteelandaluminumproductioneitherusingcarbon-freeenergysourcesoremployingtechnologytocaptureCO2emissionsandpermanentlystoreit.”
Cuttingtheuseoffossilfuelsto“netzeroemissions”isacriticalfirststep.ThiswillpreventanyfurtherincreaseintheatmosphericconcentrationofGHGs.Unfortunately,accuratelyassessingclimatesensitivityisextremelydifficultbecauseitmustattempttopredictthefutureeffortsoftheworld’sgovernmentstoeffectivelyreduceemissionsofGHGs.Additionally,scientistsmusttrytopredictamplifying(positive)feedbacksthatintensifyglobalwarming,suchasincreasingemissionsofGHGsfrommeltingpermafrost.
Regardingcurrentestimatesofclimatesensitivity,anarticleintheJanuary,2020editionofNature,CommentSectionentitled,“Emissions–The‘businessasusual’storyismisleading”providesanupdatedanalysisoflikelypossiblefutureoutcomesforvariouspotentialemissionspathways.Toquotefromtheconclusionofthearticle:
“Assessmentofcurrentpoliciessuggeststhattheworldisoncourseforaround3°Cofwarmingabovepre-industriallevelsbytheendofthecentury—stillacatastrophicoutcome,butalongwayfrom5°C(the“businessasusual”estimateoftheIPCCFifthReport–Ed.).”
Whilethenewestimateisfarbelowearlierpessimisticpredictions,itisstill“catastrophic”.Iftheearth’stemperatureincreasesby30C,sealevelswilllikelyriseover100feet,wildfireswillravagelargesectionsoftheearth,droughtswillcausewidespreadfamine,floodsandotherextremeweathereventswilldisplacetensofmillions,andprolongedheatwaveswillkillmanytensofmillions.Andtherewillbeadditionalhorrorsdifficulttopredictorevenimagine.Totaldeathswillbecountedinthehundredsofmillions.
20
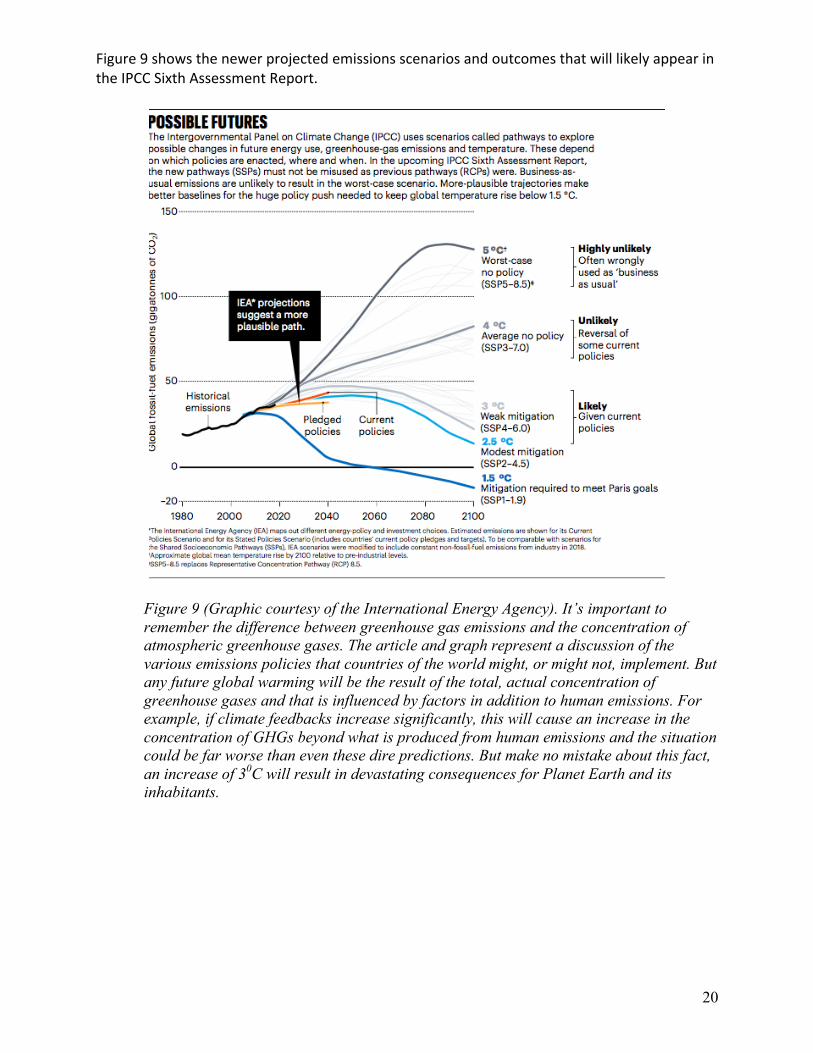
Figure9showsthenewerprojectedemissionsscenariosandoutcomesthatwilllikelyappearintheIPCCSixthAssessmentReport.
Figure 9 (Graphic courtesy of the International Energy Agency). It’s important to remember the difference between greenhouse gas emissions and the concentration of atmospheric greenhouse gases. The article and graph represent a discussion of the various emissions policies that countries of the world might, or might not, implement. But any future global warming will be the result of the total, actual concentration of greenhouse gases and that is influenced by factors in addition to human emissions. For example, if climate feedbacks increase significantly, this will cause an increase in the concentration of GHGs beyond what is produced from human emissions and the situation could be far worse than even these dire predictions. But make no mistake about this fact, an increase of 30C will result in devastating consequences for Planet Earth and its inhabitants.
21
Chapter5–UnderstandingtheBasicsofGlobalWarming:HeatandHeatTransfer
5.1–Understanding“Heat”
Accordingtothekinetic-moleculartheoryofheat,ordinarymatterismadeupofatomsandmoleculesthatareinconstantmotionduetotheenergytheypossess.Themotionoftheseatomsandmoleculesdependsontheirphaseofmatter–gas,liquid,orsolid.Inagas,themoleculesarespreadoutandthemotionofthemoleculesismoreorlessrandomwiththemoleculesconstantlycollidingwitheachother.Inaliquid,themoleculesareinloosecontactwitheachotherandtheirenergyofmotioninvolvesthemolecules“sliding”aroundeachother.Finally(ignoringplasmas),inasolidsampleofmatter,themoleculesarelockedintoafixedpositionandtheirenergyexistsasvibrationalmotion.Whatwecall“heat”dependsuponthespeedofmotionoftheatomsandmolecules.Ifthemoleculesofasampleofmatterareforcedtospeedup,theirheatenergy(andtemperature)increasesandviceversa.“Temperature”isameasureoftheaveragemolecularmotioninanysampleofmatterataspecifictime.
5.2–Understanding“HeatTransfer”:Conduction,Convection,andRadiativeTransfer
Heatcanbetransferredinthreebasicways,byconduction,convection,andradiation.Bothconductionandconvectionrequirematter–moleculesoratoms–tobeindirectcontactandheattransfersinthedirectionfromwarmertocooler(alwayswarmertocooler).Radiativetransferdoesnotrequiredirectcontactbetweenthewarmerandcoolerobjects.
Conduction.Conductionoccurswhentwoobjectsofdifferenttemperatureareinphysicalcontact.Heatalwaysmovesfromthewarmertothecoolerobjectuntilbothareatthesametemperature–thermodynamicequilibrium.Conductionoccurswhenthefastermovingmoleculesofthewarmerobjectcollidewiththeslowermovingmoleculesofthecoolerobject.Thefaster(warmer)moleculestransfersomeoftheirenergyofmotiontotheslower(cooler)moleculescausingthemtomovemorequickly,whichmeanstheyaregettingwarmer.Theprocesscontinuesuntilallthemoleculesthatareincontactaremovingatthesamerate,andarethereforeatthesametemperature.Thesystemhasreachedthermodynamicequilibrium.
Convection.Convectionoccursinliquidsorgaseswhenwarmerareasriserelativetocoolerareasandarereplacedbycoolermolecules.Thisoccursbecausewarmerareasarecomposedofmoleculesmovingmorequicklyandrapidlycollidingwitheachother,drivingthemfurtherapartintheprocess.Thismeansthesecollidingareasarelessdense(fewermoleculesperunitarea)sothey“rise”.Astheyrise,theyleavean“empty”areabehindthatisreplacedbycooler,densermolecules.Convectioniscriticallyimportanttoearth’sweathersystem;therisingairmassesreplacedbycoolerairmassescreatewindsaswellasareasoflowerandhigherpressure,whichdramaticallyaffectlocalweatherevents.
Radiation.Radiationisaformofheattransferthatcanbetransmittedthroughemptyspaceanditoperatesbecauseelectromagneticradiationcaninteractwithordinarymatterfollowingtherulesofphysics.Verybasically,allobjectsaboveabsolutezeroemitphotons(radiation).Individualatomsandmoleculescanalsoemitphotonswhen“excited”.Theelectronsof
22
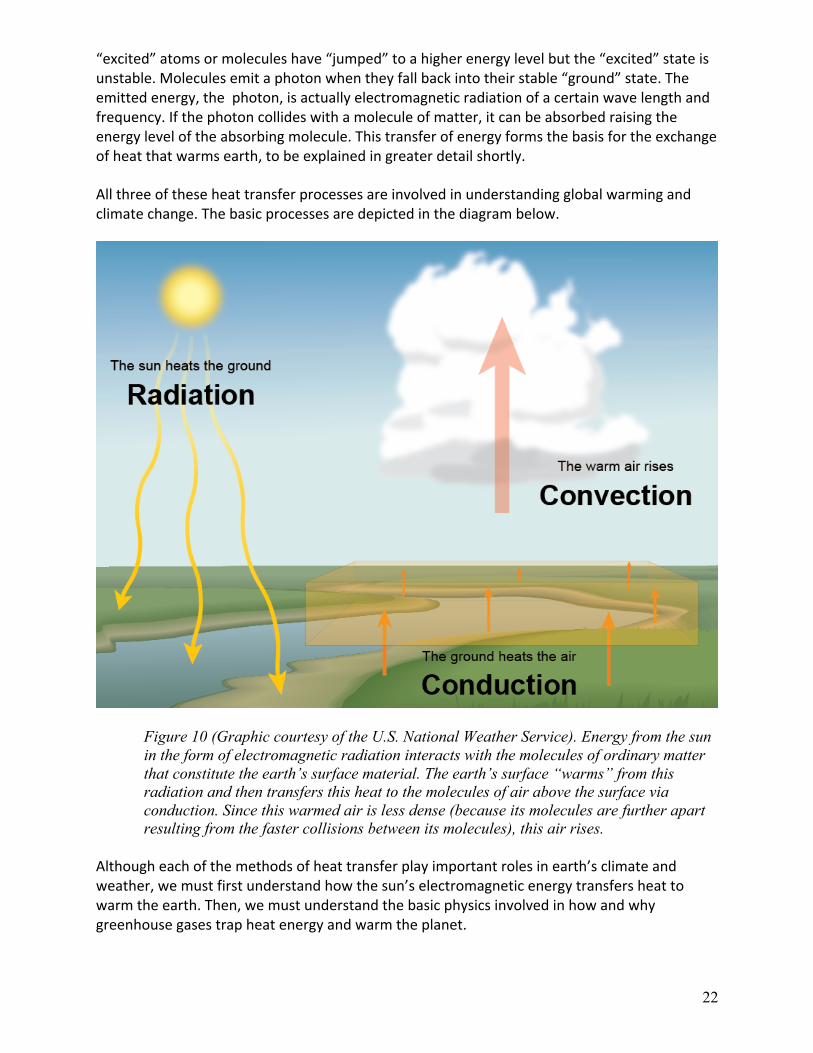
“excited”atomsormoleculeshave“jumped”toahigherenergylevelbutthe“excited”stateisunstable.Moleculesemitaphotonwhentheyfallbackintotheirstable“ground”state.Theemittedenergy,thephoton,isactuallyelectromagneticradiationofacertainwavelengthandfrequency.Ifthephotoncollideswithamoleculeofmatter,itcanbeabsorbedraisingtheenergyleveloftheabsorbingmolecule.Thistransferofenergyformsthebasisfortheexchangeofheatthatwarmsearth,tobeexplainedingreaterdetailshortly.
Allthreeoftheseheattransferprocessesareinvolvedinunderstandingglobalwarmingandclimatechange.Thebasicprocessesaredepictedinthediagrambelow.
Figure 10 (Graphic courtesy of the U.S. National Weather Service). Energy from the sun in the form of electromagnetic radiation interacts with the molecules of ordinary matter that constitute the earth’s surface material. The earth’s surface “warms” from this radiation and then transfers this heat to the molecules of air above the surface via conduction. Since this warmed air is less dense (because its molecules are further apart resulting from the faster collisions between its molecules), this air rises.
Althougheachofthemethodsofheattransferplayimportantrolesinearth’sclimateandweather,wemustfirstunderstandhowthesun’selectromagneticenergytransfersheattowarmtheearth.Then,wemustunderstandthebasicphysicsinvolvedinhowandwhygreenhousegasestrapheatenergyandwarmtheplanet.

23
Chapter6–UnderstandingthePhysicsofGlobalWarming
6.1–TheElectromagneticSpectrum
Sincethesunistheprimarysourceofheatfortheearth,wemustunderstandabitaboutradiativeenergy.Thegeneralruleisthatallobjectsaboveabsolutezeroemitradiation.Thatrule,knownasPlanck’sLaw,appliestostars,planets,humanbeings,andanyotherobjectcomposedofordinarymatter.Thegraphbelowshowstheelectromagneticradiationspectrumincludingthevisiblespectrum,whichyoulikelyrecallfromthemnemonicROYGBIV.It’seasytoforgetthatourfamiliarvisiblespectrumisonlyasmallpartoftheentireelectromagneticspectrum.It’shardtounderestimatetheimportanceofthevariouspartsoftheelectromagneticspectrumhumansuse,includingX-rays,radiowavesandmicrowaves.Thedifferencebetweenthesevariouspartsofthespectrumdependsuponthewavelengthandfrequencyofthevariouswaves.
Figure 11 (Graphic courtesy of NASA). This graphic illustrates the electromagnetic spectrum. We classify radiant energy by wavelength and organize it into a chart known as the “electromagnetic spectrum.” A portion of that chart is pictured above. Wavelength is the distance between the crests of the waves in a beam of light. The shorter the wavelength, the more energy the wave has.
24
6.2–EmissionsSpectraofSunandEarth
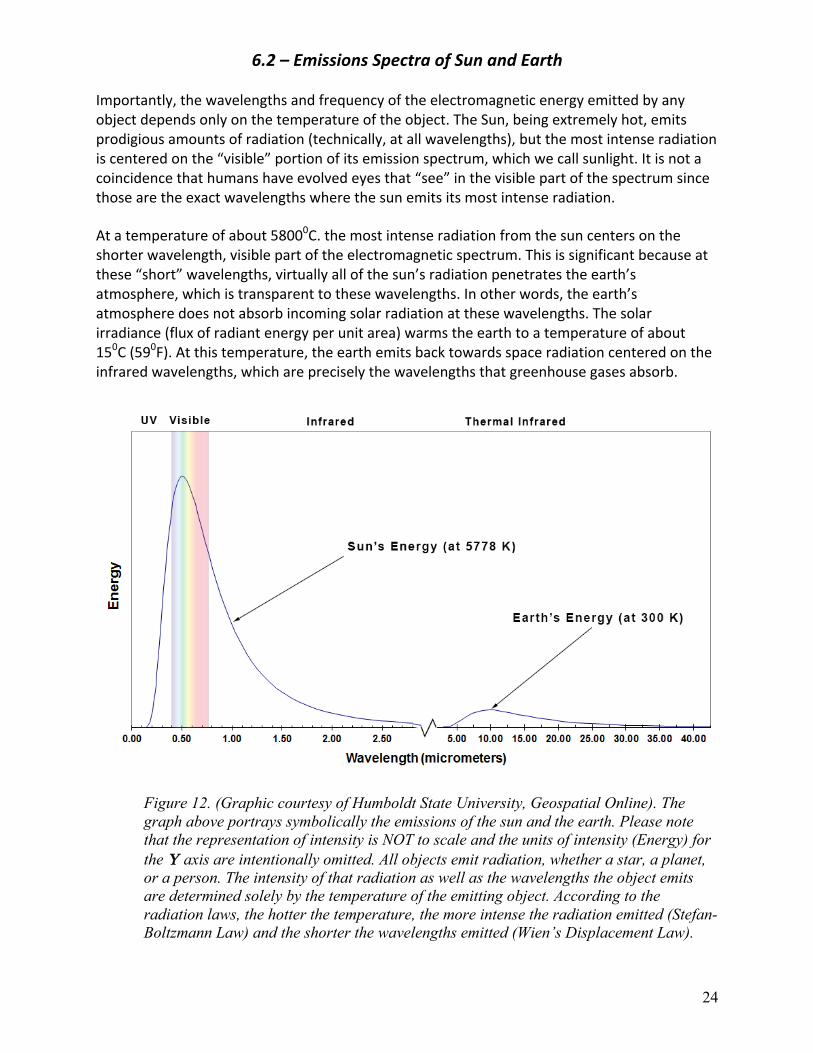
Importantly,thewavelengthsandfrequencyoftheelectromagneticenergyemittedbyanyobjectdependsonlyonthetemperatureoftheobject.TheSun,beingextremelyhot,emitsprodigiousamountsofradiation(technically,atallwavelengths),butthemostintenseradiationiscenteredonthe“visible”portionofitsemissionspectrum,whichwecallsunlight.Itisnotacoincidencethathumanshaveevolvedeyesthat“see”inthevisiblepartofthespectrumsincethosearetheexactwavelengthswherethesunemitsitsmostintenseradiation.
Atatemperatureofabout58000C.themostintenseradiationfromthesuncentersontheshorterwavelength,visiblepartoftheelectromagneticspectrum.Thisissignificantbecauseatthese“short”wavelengths,virtuallyallofthesun’sradiationpenetratestheearth’satmosphere,whichistransparenttothesewavelengths.Inotherwords,theearth’satmospheredoesnotabsorbincomingsolarradiationatthesewavelengths.Thesolarirradiance(fluxofradiantenergyperunitarea)warmstheearthtoatemperatureofabout150C(590F).Atthistemperature,theearthemitsbacktowardsspaceradiationcenteredontheinfraredwavelengths,whicharepreciselythewavelengthsthatgreenhousegasesabsorb.
Figure 12. (Graphic courtesy of Humboldt State University, Geospatial Online). The graph above portrays symbolically the emissions of the sun and the earth. Please note that the representation of intensity is NOT to scale and the units of intensity (Energy) for the Υ axis are intentionally omitted. All objects emit radiation, whether a star, a planet, or a person. The intensity of that radiation as well as the wavelengths the object emits are determined solely by the temperature of the emitting object. According to the radiation laws, the hotter the temperature, the more intense the radiation emitted (Stefan-Boltzmann Law) and the shorter the wavelengths emitted (Wien’s Displacement Law).
25
6.3.–ThermodynamicEquilibrium:EnergyIn=EnergyOut
EarthMustRadiateBacktoSpaceanAmountofEnergyEqualtotheSolarEnergyitReceives
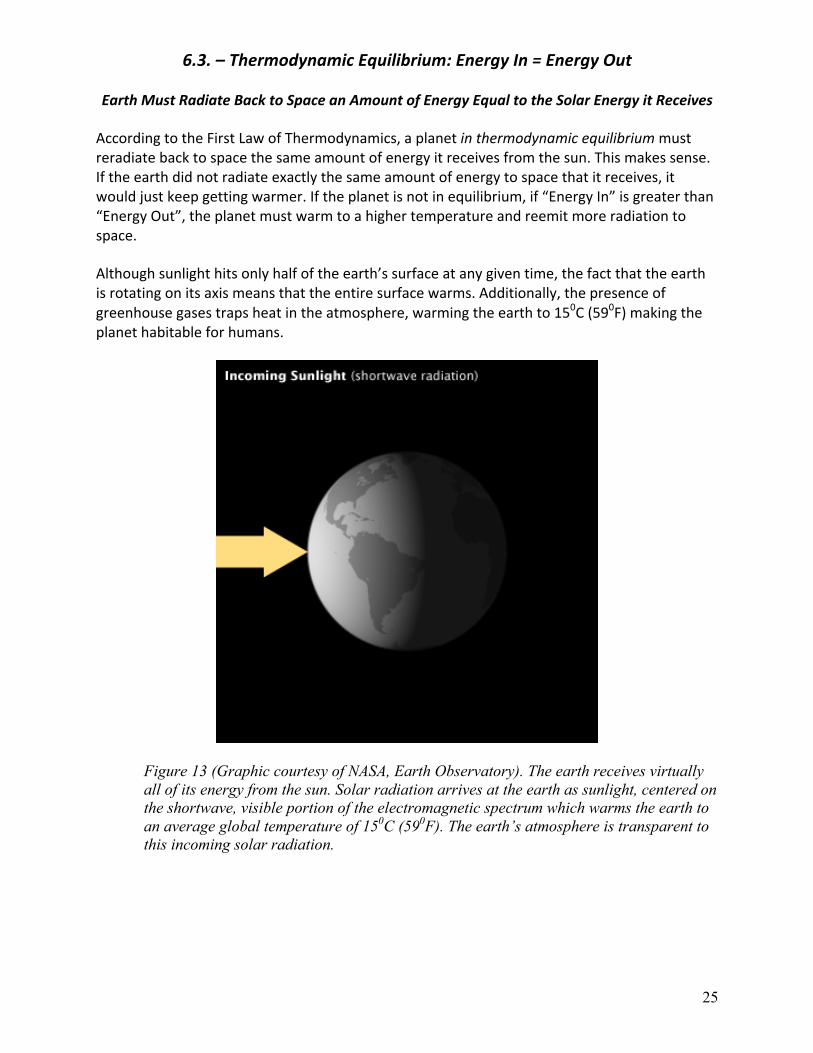
AccordingtotheFirstLawofThermodynamics,aplanetinthermodynamicequilibriummustreradiatebacktospacethesameamountofenergyitreceivesfromthesun.Thismakessense.Iftheearthdidnotradiateexactlythesameamountofenergytospacethatitreceives,itwouldjustkeepgettingwarmer.Iftheplanetisnotinequilibrium,if“EnergyIn”isgreaterthan“EnergyOut”,theplanetmustwarmtoahighertemperatureandreemitmoreradiationtospace.
Althoughsunlighthitsonlyhalfoftheearth’ssurfaceatanygiventime,thefactthattheearthisrotatingonitsaxismeansthattheentiresurfacewarms.Additionally,thepresenceofgreenhousegasestrapsheatintheatmosphere,warmingtheearthto150C(590F)makingtheplanethabitableforhumans.
Figure 13 (Graphic courtesy of NASA, Earth Observatory). The earth receives virtually all of its energy from the sun. Solar radiation arrives at the earth as sunlight, centered on the shortwave, visible portion of the electromagnetic spectrum which warms the earth to an average global temperature of 150C (590F). The earth’s atmosphere is transparent to this incoming solar radiation.
26
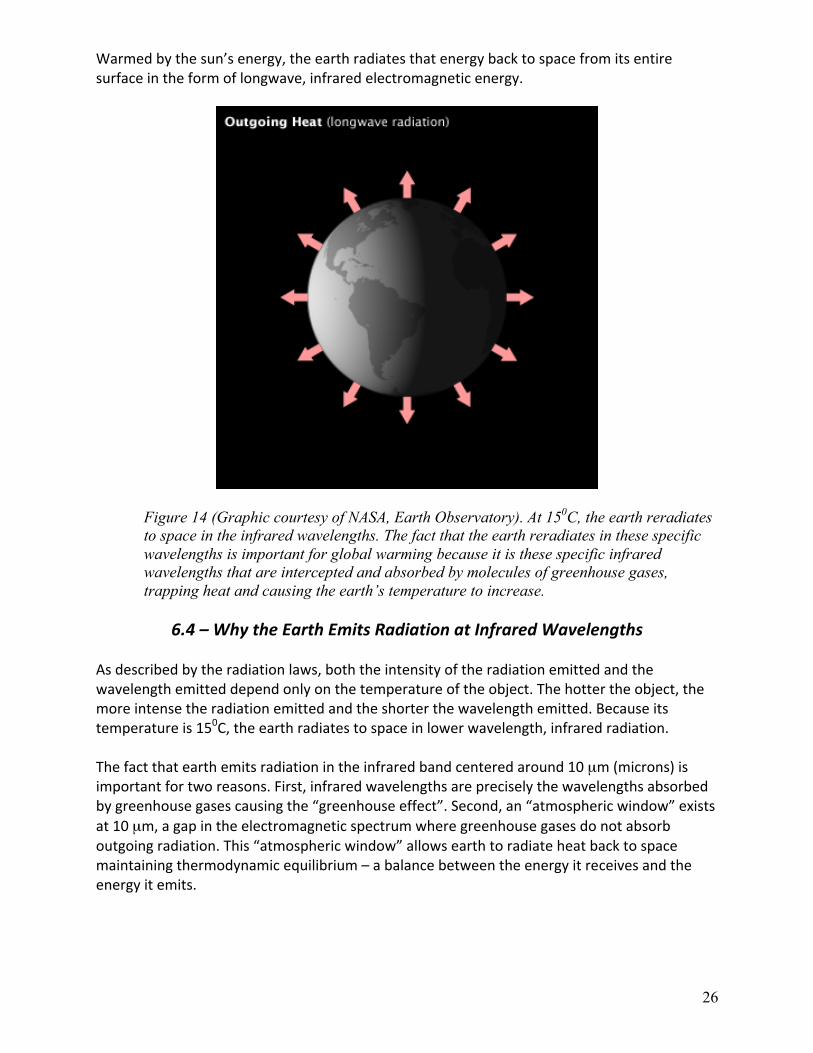
Warmedbythesun’senergy,theearthradiatesthatenergybacktospacefromitsentiresurfaceintheformoflongwave,infraredelectromagneticenergy.
Figure 14 (Graphic courtesy of NASA, Earth Observatory).At 150C, the earth reradiates to space in the infrared wavelengths. The fact that the earth reradiates in these specific wavelengths is important for global warming because it is these specific infrared wavelengths that are intercepted and absorbed by molecules of greenhouse gases, trapping heat and causing the earth’s temperature to increase.
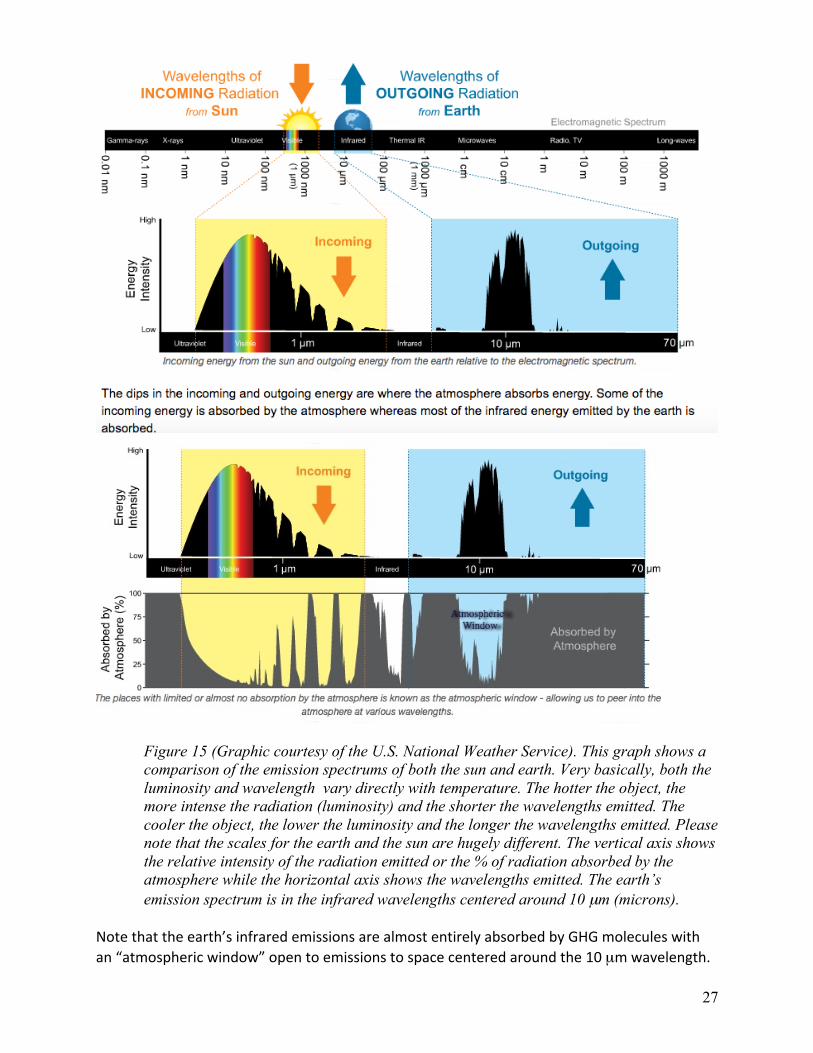
6.4–WhytheEarthEmitsRadiationatInfraredWavelengths
Asdescribedbytheradiationlaws,boththeintensityoftheradiationemittedandthewavelengthemitteddependonlyonthetemperatureoftheobject.Thehottertheobject,themoreintensetheradiationemittedandtheshorterthewavelengthemitted.Becauseitstemperatureis150C,theearthradiatestospaceinlowerwavelength,infraredradiation.
Thefactthatearthemitsradiationintheinfraredbandcenteredaround10µm(microns)isimportantfortworeasons.First,infraredwavelengthsarepreciselythewavelengthsabsorbedbygreenhousegasescausingthe“greenhouseeffect”.Second,an“atmosphericwindow”existsat10µm,agapintheelectromagneticspectrumwheregreenhousegasesdonotabsorboutgoingradiation.This“atmosphericwindow”allowsearthtoradiateheatbacktospacemaintainingthermodynamicequilibrium–abalancebetweentheenergyitreceivesandtheenergyitemits.
27
Figure 15 (Graphic courtesy of the U.S. National Weather Service). This graph shows a comparison of the emission spectrums of both the sun and earth. Very basically, both the luminosity and wavelength vary directly with temperature. The hotter the object, the more intense the radiation (luminosity) and the shorter the wavelengths emitted. The cooler the object, the lower the luminosity and the longer the wavelengths emitted. Please note that the scales for the earth and the sun are hugely different. The vertical axis shows the relative intensity of the radiation emitted or the % of radiation absorbed by the atmosphere while the horizontal axis shows the wavelengths emitted. The earth’s emission spectrum is in the infrared wavelengths centered around 10 µm (microns).
Notethattheearth’sinfraredemissionsarealmostentirelyabsorbedbyGHGmoleculeswithan“atmosphericwindow”opentoemissionstospacecenteredaroundthe10µmwavelength.
28
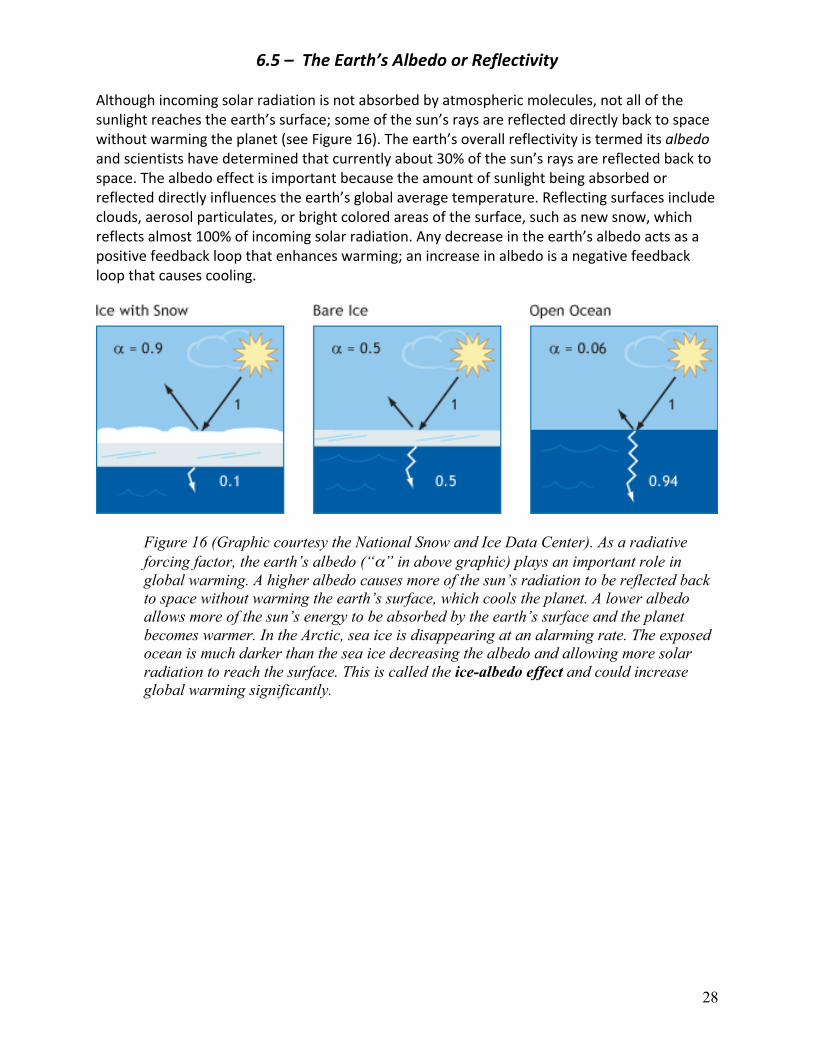
6.5–TheEarth’sAlbedoorReflectivity
Althoughincomingsolarradiationisnotabsorbedbyatmosphericmolecules,notallofthesunlightreachestheearth’ssurface;someofthesun’sraysarereflecteddirectlybacktospacewithoutwarmingtheplanet(seeFigure16).Theearth’soverallreflectivityistermeditsalbedoandscientistshavedeterminedthatcurrentlyabout30%ofthesun’sraysarereflectedbacktospace.Thealbedoeffectisimportantbecausetheamountofsunlightbeingabsorbedorreflecteddirectlyinfluencestheearth’sglobalaveragetemperature.Reflectingsurfacesincludeclouds,aerosolparticulates,orbrightcoloredareasofthesurface,suchasnewsnow,whichreflectsalmost100%ofincomingsolarradiation.Anydecreaseintheearth’salbedoactsasapositivefeedbackloopthatenhanceswarming;anincreaseinalbedoisanegativefeedbackloopthatcausescooling.
Figure 16 (Graphic courtesy the National Snow and Ice Data Center). As a radiative forcing factor, the earth’s albedo (“α” in above graphic) plays an important role in global warming. A higher albedo causes more of the sun’s radiation to be reflected back to space without warming the earth’s surface, which cools the planet. A lower albedo allows more of the sun’s energy to be absorbed by the earth’s surface and the planet becomes warmer. In the Arctic, sea ice is disappearing at an alarming rate. The exposed ocean is much darker than the sea ice decreasing the albedo and allowing more solar radiation to reach the surface. This is called the ice-albedo effect and could increase global warming significantly.
29
6.6–RadiativeTransfer:HowSolarRadiationWarmstheEarth’sSurface
Electromagneticradiation,“light”canbethoughtofaseitherawaveoraparticle.Tounderstandglobalwarming,weshouldconsiderlighttravelingthroughspaceasawave.However,whensunlightreachestheearthandinteractswithmatter,it’sbesttothinkoflightasparticles,packetsofenergycalledphotons.
Solarradiationwarmsthesurfaceoftheearthbycausingthemoleculesofthesurfacematerial(rocks,soil,etc.)tovibratemorerapidly.Energeticphotonsofsunlightstrikethemoleculesofsolidmattercomposingthesurfacecausingthemolecule’selectronstojumptoanexcitedstate.The“excited”moleculesofthesurfacematerialreturntothestable“ground”statebyvibratingmorerapidly,aprocesstermed“radiationlesstransition”or“radiationlessde-excitation”becausenophotonisreemittedbythemoleculeasitdropstoitsgroundstate.Sincetemperatureisjustameasureofthemotionofmolecules,theincreasedvibrationalenergyofthesurfacematerialmeansanincreaseinheatcontentofthesurfacemolecules.Thisheatenergytransfers,orspreads,toadjacentmoleculesviaconduction–theearth’ssurfacewarms.
6.7–HowGreenhouseGasesWarmtheEarth
Becausetheearth’stemperatureisabout150C,itradiatesenergybacktospaceininfraredwavelengths,preciselythewavelengthsthatgreenhousegasesefficientlyabsorb.Butmoleculesthatefficientlyabsorbinfraredwavelengthsarealsoefficientemittersofthoseinfraredwavelengths.Forexample,greenhousegasesabsorbinfraredradiationefficiently,thereforetheyalsoemitinfraredradiationefficiently.
Themechanismforglobalwarmingisbaseduponthefactthatgreenhousegasesabsorbsomeoftheinfraredphotonsearthisemittingtospace.Thereareactuallytwopossiblemechanismsforgreenhousegasestoabsorbinfraredradiationandwarmtheearth.
MethodOne:ReemittingInfraredPhotons.Whenaphotonofinfraredradiationencountersagreenhousegasmoleculesuchascarbondioxide,thephotonisabsorbedandtheGHGmolecule“jumps”toanexcitedstate.Technically,whentheinfraredphotonisabsorbed,thebondsholdingthecarbonandoxygenatomstogetherbend,twistorstretchchangingtheinternalarrangementofelectricchargewithinthemolecule(changingthe“dipolemoment”).Thiscausesthemoleculetojumptoan“excited”statebutthis“excited”stateisunstable.TheGHGmoleculenormallyreturnstoitsgroundstatebyemittingaphotonoflightofthesameinfraredwavelengththatitabsorbed.Agoodabsorberisagoodemitter.
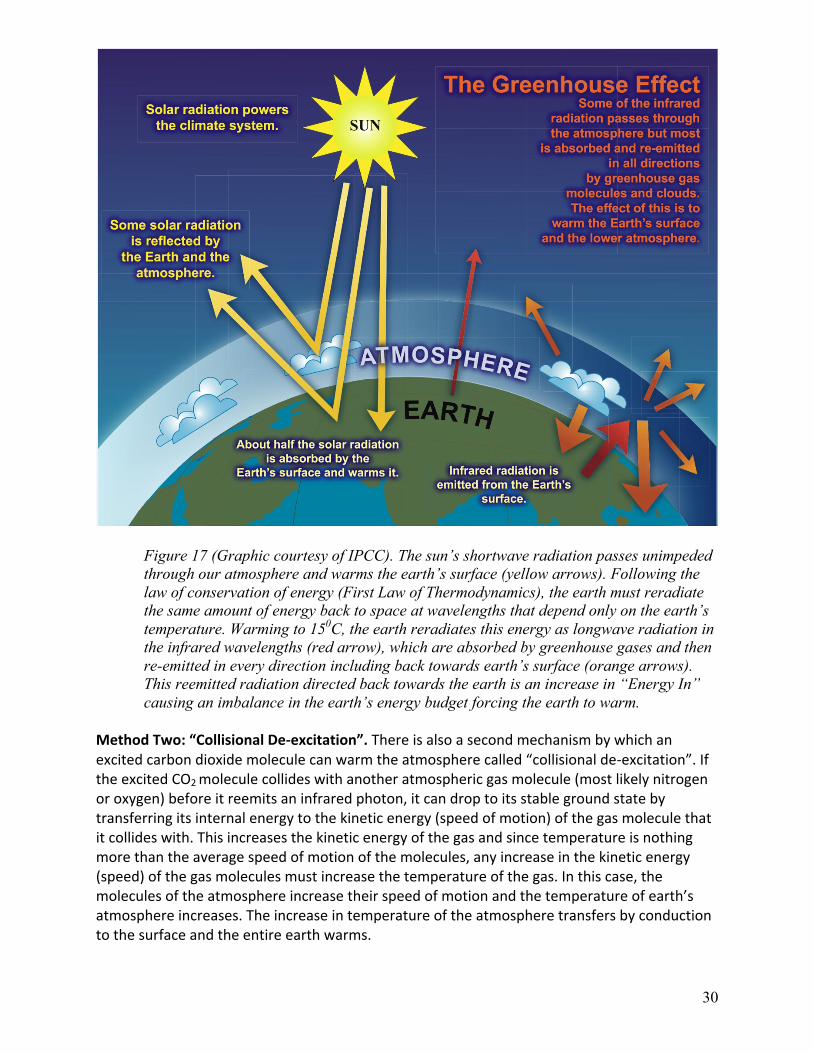
Thecatchisthis:Greenhousegasesthathaveabsorbedaninfraredphotonrisingfromearth’ssurfacereemitthisinfraredradiationineverydirectionincludingbacktowardsearth.Fromtheperspectiveoftheearth,theinfraredradiationthathasbeenredirectedbacktowardsearthbythegreenhousegasmoleculeisanincreasein“EnergyIn”.Thisextra“EnergyIn”throwstheearth’s“energybudget”outofbalanceandtheearthmustwarmandthenemitmoreheatbacktowardsspacetorestorethermodynamicequilibrium.TheUniversityCorporationforAtmosphericResearchhasawonderfulgraphicandexplanationat:
https://scied.ucar.edu/carbon-dioxide-absorbs-and-re-emits-infrared-radiation
30
Figure 17 (Graphic courtesy of IPCC). The sun’s shortwave radiation passes unimpeded through our atmosphere and warms the earth’s surface (yellow arrows). Following the law of conservation of energy (First Law of Thermodynamics), the earth must reradiate the same amount of energy back to space at wavelengths that depend only on the earth’s temperature. Warming to 150C, the earth reradiates this energy as longwave radiation in the infrared wavelengths (red arrow), which are absorbed by greenhouse gases and then re-emitted in every direction including back towards earth’s surface (orange arrows). This reemitted radiation directed back towards the earth is an increase in “Energy In” causing an imbalance in the earth’s energy budget forcing the earth to warm.
MethodTwo:“CollisionalDe-excitation”.Thereisalsoasecondmechanismbywhichanexcitedcarbondioxidemoleculecanwarmtheatmospherecalled“collisionalde-excitation”.IftheexcitedCO2moleculecollideswithanotheratmosphericgasmolecule(mostlikelynitrogenoroxygen)beforeitreemitsaninfraredphoton,itcandroptoitsstablegroundstatebytransferringitsinternalenergytothekineticenergy(speedofmotion)ofthegasmoleculethatitcollideswith.Thisincreasesthekineticenergyofthegasandsincetemperatureisnothingmorethantheaveragespeedofmotionofthemolecules,anyincreaseinthekineticenergy(speed)ofthegasmoleculesmustincreasethetemperatureofthegas.Inthiscase,themoleculesoftheatmosphereincreasetheirspeedofmotionandthetemperatureofearth’satmosphereincreases.Theincreaseintemperatureoftheatmospheretransfersbyconductiontothesurfaceandtheentireearthwarms.
31
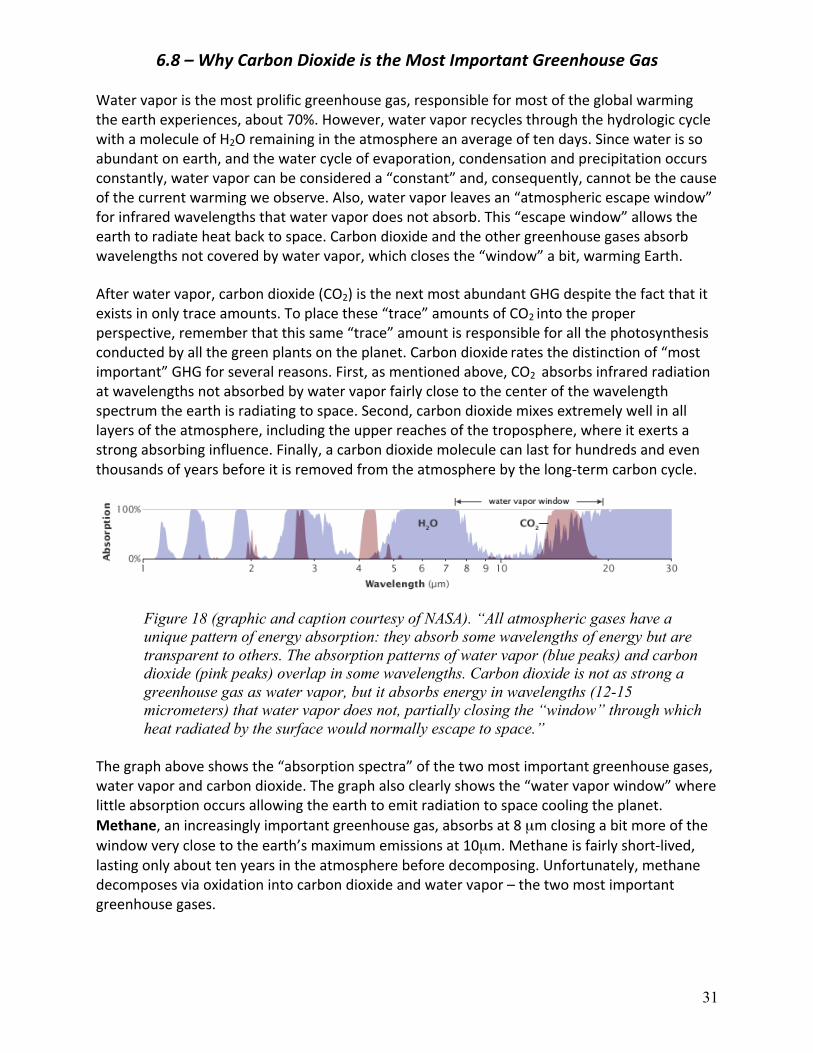
6.8–WhyCarbonDioxideistheMostImportantGreenhouseGas
Watervaporisthemostprolificgreenhousegas,responsibleformostoftheglobalwarmingtheearthexperiences,about70%.However,watervaporrecyclesthroughthehydrologiccyclewithamoleculeofH2Oremainingintheatmosphereanaverageoftendays.Sincewaterissoabundantonearth,andthewatercycleofevaporation,condensationandprecipitationoccursconstantly,watervaporcanbeconsidereda“constant”and,consequently,cannotbethecauseofthecurrentwarmingweobserve.Also,watervaporleavesan“atmosphericescapewindow”forinfraredwavelengthsthatwatervapordoesnotabsorb.This“escapewindow”allowstheearthtoradiateheatbacktospace.Carbondioxideandtheothergreenhousegasesabsorbwavelengthsnotcoveredbywatervapor,whichclosesthe“window”abit,warmingEarth.
Afterwatervapor,carbondioxide(CO2)isthenextmostabundantGHGdespitethefactthatitexistsinonlytraceamounts.Toplacethese“trace”amountsofCO2intotheproperperspective,rememberthatthissame“trace”amountisresponsibleforallthephotosynthesisconductedbyallthegreenplantsontheplanet.Carbondioxideratesthedistinctionof“mostimportant”GHGforseveralreasons.First,asmentionedabove,CO2absorbsinfraredradiationatwavelengthsnotabsorbedbywatervaporfairlyclosetothecenterofthewavelengthspectrumtheearthisradiatingtospace.Second,carbondioxidemixesextremelywellinalllayersoftheatmosphere,includingtheupperreachesofthetroposphere,whereitexertsastrongabsorbinginfluence.Finally,acarbondioxidemoleculecanlastforhundredsandeventhousandsofyearsbeforeitisremovedfromtheatmospherebythelong-termcarboncycle.
Figure 18 (graphic and caption courtesy of NASA). “All atmospheric gases have a unique pattern of energy absorption: they absorb some wavelengths of energy but are transparent to others. The absorption patterns of water vapor (blue peaks) and carbon dioxide (pink peaks) overlap in some wavelengths. Carbon dioxide is not as strong a greenhouse gas as water vapor, but it absorbs energy in wavelengths (12-15 micrometers) that water vapor does not, partially closing the “window” through which heat radiated by the surface would normally escape to space.”
Thegraphaboveshowsthe“absorptionspectra”ofthetwomostimportantgreenhousegases,watervaporandcarbondioxide.Thegraphalsoclearlyshowsthe“watervaporwindow”wherelittleabsorptionoccursallowingtheearthtoemitradiationtospacecoolingtheplanet.Methane,anincreasinglyimportantgreenhousegas,absorbsat8µmclosingabitmoreofthewindowveryclosetotheearth’smaximumemissionsat10µm.Methaneisfairlyshort-lived,lastingonlyabouttenyearsintheatmospherebeforedecomposing.Unfortunately,methanedecomposesviaoxidationintocarbondioxideandwatervapor–thetwomostimportantgreenhousegases.
32
Chapter7–UnderstandingtheCarbonCycle
7.1–TheCarbonCycleBasics:“Sources”,“Sinks”and“Flows”ofCarbon
Carbondioxideiscriticallyimportanttomaintainingatemperaturethatallowslifetothrivebutscientistsspeakmoreoftenoftheimportanceof“carbon”,becausecarbonflowsthroughmanydifferentchemicalformulationsandplaysmanyrolesthataffecttheearth’sclimate.ThefollowingquotefromNOAAnicelysummarizesthe“carboncycle”:
“Whatisthecarboncycle?CarbonisthechemicalbackboneofalllifeonEarth.AllofthecarbonwecurrentlyhaveonEarthisthesameamountwehavealwayshad.Whennewlifeisformed,carbonformskeymoleculeslikeproteinandDNA.It'salsofoundinouratmosphereintheformofcarbondioxideorCO2.Thecarboncycleisnature'swayofreusingcarbonatoms,whichtravelfromtheatmosphereintoorganismsintheEarthandthenbackintotheatmosphereoverandoveragain.Mostcarbonisstoredinrocksandsediments,whiletherestisstoredintheocean,atmosphere,andlivingorganisms.Thesearethereservoirs,orsinks,throughwhichcarboncycles.Theoceanisagiantcarbonsinkthatabsorbscarbon.Marineorganismsfrommarshplantstofish,fromseaweedtobirds,alsoproducecarbonthroughlivinganddying.Sometimesdeadorganismsbecomefossilfuelsthatgothroughcombustion,givingoffCO2,andthecyclecontinues.”(NOAA,NationalOceanService,transcriptfromvideo,“WhatIstheCarbonCycle”)
Fromtheperspectiveofclimatescientistsandtheproblemofglobalwarming,ourfocusmustbeonthe“sources”,“sinks”and“flows”ofcarbonthroughthevariouselementsoftheearth’sclimatesystem.Asourceisanyprocessthatreleasesanyformofcarbon,whileasinkisareservoirthattakesupandstorescarbon.Themannerinwhichcarbonmovesthroughthemanyelementsoftheearthistermedthe“flow”or“flux”.Asweshallsee,themostimportantformofcarbonforunderstandingclimatechangeiscarbondioxide.
It’simportanttorememberthattherearenaturalsourcesofcarbondioxidethataddtotheconcentrationofatmosphericCO2butthesenaturalsourceshavebeeninbalanceforhundredsofthousandsofyears.Onlyrelativelyrecentlyhastheearth’scarbonbudgetbeendisruptedbyhumanactivities.ToquoteDavidHerringofNOAA:
“Therearenaturalsourcesofcarbondioxide,suchasdecomposingbiomass,ventingvolcanoes,naturallyoccurringwildfires,humanandanimalrespiration,etc.Overgeologicaltimespansbeforetheindustrialrevolution,thesenaturalsourcesofcarbondioxidewereinbalancewithnatural"sinks"—suchastheocean,phytoplankton,andplantsonlandthatabsorbcarbondioxide.TheonlynewprocessonEarththathasbeenidentifiedthatcanaccountforthesignificanttippingofEarth'scarbonbalanceishumansburningeverincreasingamountsoffossilfuelstogetherwithotherlarge-scaleactivitieslikedeforestation,biomassburning,andcementproduction.Sincetheindustrialrevolution,humanactivitieshaveincreasedtheabundanceofcarbondioxideintheloweratmospherebyabout40%.”(NOAA,ClimateQ&A,January23,2014)
33
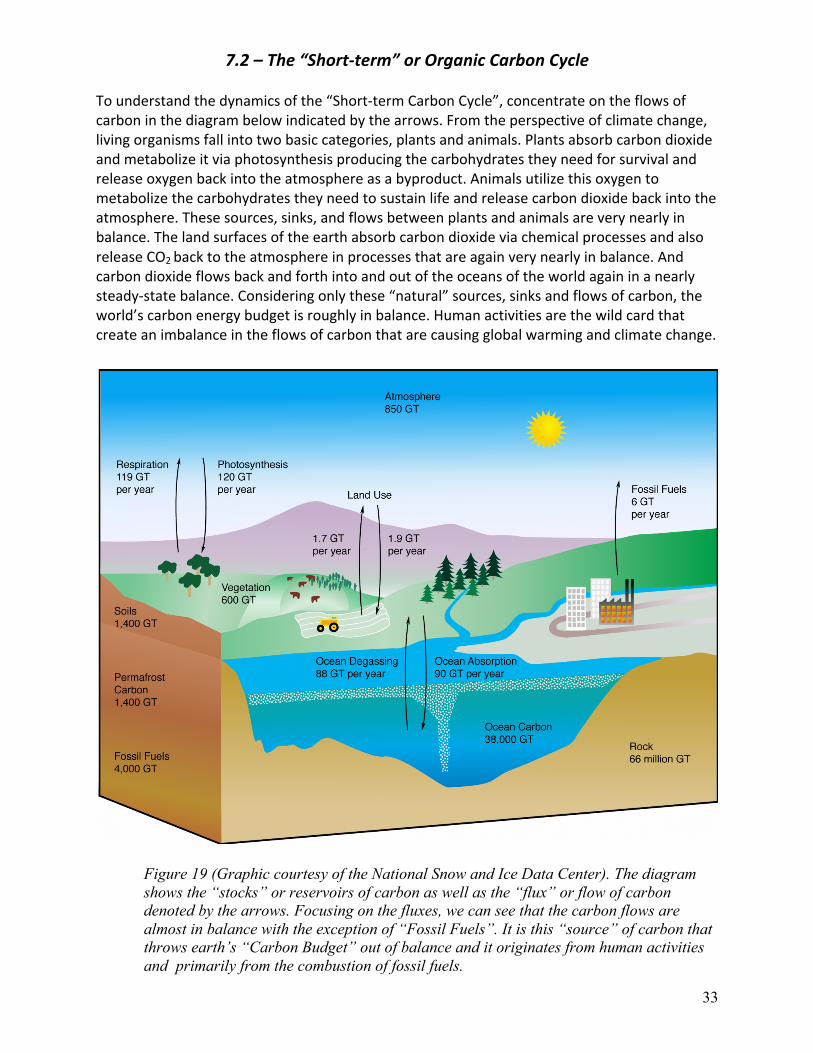
7.2–The“Short-term”orOrganicCarbonCycle
Tounderstandthedynamicsofthe“Short-termCarbonCycle”,concentrateontheflowsofcarboninthediagrambelowindicatedbythearrows.Fromtheperspectiveofclimatechange,livingorganismsfallintotwobasiccategories,plantsandanimals.Plantsabsorbcarbondioxideandmetabolizeitviaphotosynthesisproducingthecarbohydratestheyneedforsurvivalandreleaseoxygenbackintotheatmosphereasabyproduct.Animalsutilizethisoxygentometabolizethecarbohydratestheyneedtosustainlifeandreleasecarbondioxidebackintotheatmosphere.Thesesources,sinks,andflowsbetweenplantsandanimalsareverynearlyinbalance.ThelandsurfacesoftheearthabsorbcarbondioxideviachemicalprocessesandalsoreleaseCO2backtotheatmosphereinprocessesthatareagainverynearlyinbalance.Andcarbondioxideflowsbackandforthintoandoutoftheoceansoftheworldagaininanearlysteady-statebalance.Consideringonlythese“natural”sources,sinksandflowsofcarbon,theworld’scarbonenergybudgetisroughlyinbalance.Humanactivitiesarethewildcardthatcreateanimbalanceintheflowsofcarbonthatarecausingglobalwarmingandclimatechange.
Figure 19 (Graphic courtesy of the National Snow and Ice Data Center). The diagram shows the “stocks” or reservoirs of carbon as well as the “flux” or flow of carbon denoted by the arrows. Focusing on the fluxes, we can see that the carbon flows are almost in balance with the exception of “Fossil Fuels”. It is this “source” of carbon that throws earth’s “Carbon Budget” out of balance and it originates from human activities and primarily from the combustion of fossil fuels.
34
7.3–Earth’sThermostat:The“Long-term”orInorganicCarbonCycleHowCarbonDioxideRegulatesEarth’sTemperature
Carbondioxideissometimesconsideredtobetheearth’s“thermostat”operatingthroughthe“Long-termCarbonCycle”.CarbondioxideregulatesEarth’stemperatureviachemicalinteractionswiththelithosphere(theearth’srockycrust)creatingchemicalsubstancesthateventuallyreachtheworld’soceans.Intheocean,calcifyingorganismsusethesebuildingblockstocreatetheirshells.Whentheseorganismsdie,theirshellssinktothedeepoceanfloorforminglimestonedepositsthateffectivelystorethecarbonforhundredsofmillionsofyears.
Lookingatthechemicalprocessesabitmorecloselyisworthwhile.Basically,carbondioxidereactswithwatertoformcarbonicacid,aweakacid,andthischemicalprocesscanoccureitherintheoceansoftheworld,intheatmosphere,orinthesoilsoftheearth.Thechemistryofweatheringviacarbonicacidiscomplexbutforourpurposesweonlyneedtounderstandthebasics.ToquoteNASA,EarthObservatory,“TheSlowCarbonCycle”:
“Themovementofcarbonfromtheatmospheretothelithosphere(rocks)beginswithrain.Atmosphericcarboncombineswithwatertoformaweakacid—carbonicacid—thatfallstothesurfaceinrain.Theaciddissolvesrocks—aprocesscalledchemicalweathering—andreleasescalcium,magnesium,potassium,orsodiumions.Riverscarrytheionstotheocean.Intheocean,thecalciumionscombinewithbicarbonateionstoformcalciumcarbonate,theactiveingredientinantacidsandthechalkywhitesubstancethatdriesonyourfaucetifyouliveinanareawithhardwater.Inthemodernocean,mostofthecalciumcarbonateismadebyshell-building(calcifying)organisms(suchascorals)andplankton(likecoccolithophoresandforaminifera).Aftertheorganismsdie,theysinktotheseafloor.Overtime,layersofshellsandsedimentarecementedtogetherandturntorock,storingthecarboninstone—limestoneanditsderivatives.
Theslowcyclereturnscarbontotheatmospherethroughvolcanoes.Earth’slandandoceansurfacessitonseveralmovingcrustalplates.Whentheplatescollide,onesinksbeneaththeother,andtherockitcarriesmeltsundertheextremeheatandpressure.Theheatedrockrecombinesintosilicateminerals,releasingcarbondioxide.
Whenvolcanoeserupt,theyventthegastotheatmosphereandcoverthelandwithfreshsilicaterocktobeginthecycleagain.Atpresent,volcanoesemitbetween130and380millionmetrictonsofcarbondioxideperyear.Forcomparison,humansemitabout30billiontonsofcarbondioxideperyear—100–300timesmorethanvolcanoes—byburningfossilfuels.”
Carbondioxidehasearnedthetitle,“Earth’sThermostat”becausewhenatmosphericconcentrationsofcarbondioxidearehigh(andtheearth’stemperatureishigh),morecarbonicacidisformedandweatheringspeedsup.Unfortunately,this“thermostat”isnotusefulinmitigatinghuman-causedglobalwarmingbecausethechemicalprocessesrequiremanymillionsofyearstoweatherrocksofthelithosphere.Overgeologicaltimeperiods,thisweatheringprocessdoesremovecarbondioxidefromtheatmosphere,effectivelyloweringearth’stemperatureandearningCO2thenickname,“Earth’sthermostat”.
35
Chapter8–GreenhouseGasEmissionsandConcentration
8.1–UnderstandingtheDifferencebetweenGHGEmissionsandAtmosphericConcentrationofGreenhouseGases
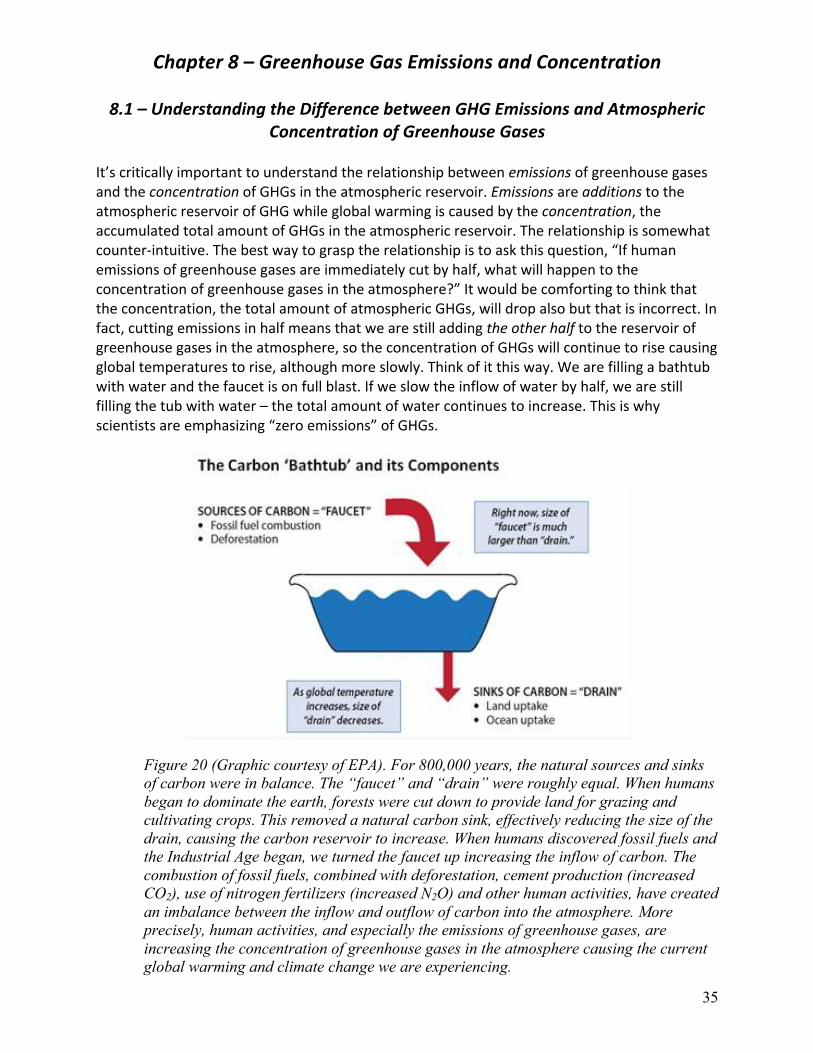
It’scriticallyimportanttounderstandtherelationshipbetweenemissionsofgreenhousegasesandtheconcentrationofGHGsintheatmosphericreservoir.EmissionsareadditionstotheatmosphericreservoirofGHGwhileglobalwarmingiscausedbytheconcentration,theaccumulatedtotalamountofGHGsintheatmosphericreservoir.Therelationshipissomewhatcounter-intuitive.Thebestwaytograsptherelationshipistoaskthisquestion,“Ifhumanemissionsofgreenhousegasesareimmediatelycutbyhalf,whatwillhappentotheconcentrationofgreenhousegasesintheatmosphere?”Itwouldbecomfortingtothinkthattheconcentration,thetotalamountofatmosphericGHGs,willdropalsobutthatisincorrect.Infact,cuttingemissionsinhalfmeansthatwearestilladdingtheotherhalftothereservoirofgreenhousegasesintheatmosphere,sotheconcentrationofGHGswillcontinuetorisecausingglobaltemperaturestorise,althoughmoreslowly.Thinkofitthisway.Wearefillingabathtubwithwaterandthefaucetisonfullblast.Ifweslowtheinflowofwaterbyhalf,wearestillfillingthetubwithwater–thetotalamountofwatercontinuestoincrease.Thisiswhyscientistsareemphasizing“zeroemissions”ofGHGs.
Figure 20 (Graphic courtesy of EPA). For 800,000 years, the natural sources and sinks of carbon were in balance. The “faucet” and “drain” were roughly equal. When humans began to dominate the earth, forests were cut down to provide land for grazing and cultivating crops. This removed a natural carbon sink, effectively reducing the size of the drain, causing the carbon reservoir to increase. When humans discovered fossil fuels and the Industrial Age began, we turned the faucet up increasing the inflow of carbon. The combustion of fossil fuels, combined with deforestation, cement production (increased CO2), use of nitrogen fertilizers (increased N2O) and other human activities, have created an imbalance between the inflow and outflow of carbon into the atmosphere. More precisely, human activities, and especially the emissions of greenhouse gases, are increasing the concentration of greenhouse gases in the atmosphere causing the current global warming and climate change we are experiencing.
36
8.2–IncreasingEmissions=IncreasingConcentrationofCO2
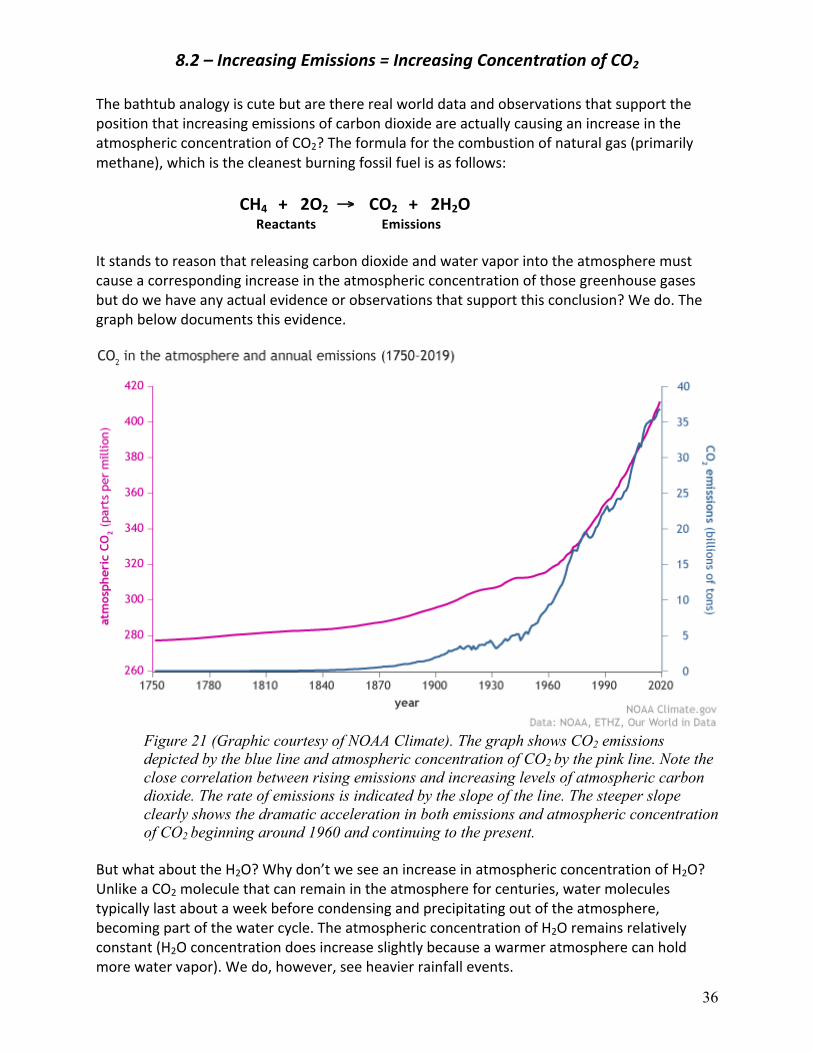
ThebathtubanalogyiscutebutarethererealworlddataandobservationsthatsupportthepositionthatincreasingemissionsofcarbondioxideareactuallycausinganincreaseintheatmosphericconcentrationofCO2?Theformulaforthecombustionofnaturalgas(primarilymethane),whichisthecleanestburningfossilfuelisasfollows: CH4+2O2→ CO2+2H2O Reactants EmissionsItstandstoreasonthatreleasingcarbondioxideandwatervaporintotheatmospheremustcauseacorrespondingincreaseintheatmosphericconcentrationofthosegreenhousegasesbutdowehaveanyactualevidenceorobservationsthatsupportthisconclusion?Wedo.Thegraphbelowdocumentsthisevidence.
Figure 21 (Graphic courtesy of NOAA Climate). The graph shows CO2 emissions depicted by the blue line and atmospheric concentration of CO2 by the pink line. Note the close correlation between rising emissions and increasing levels of atmospheric carbon dioxide. The rate of emissions is indicated by the slope of the line. The steeper slope clearly shows the dramatic acceleration in both emissions and atmospheric concentration of CO2 beginning around 1960 and continuing to the present.
ButwhatabouttheH2O?Whydon’tweseeanincreaseinatmosphericconcentrationofH2O?UnlikeaCO2moleculethatcanremainintheatmosphereforcenturies,watermoleculestypicallylastaboutaweekbeforecondensingandprecipitatingoutoftheatmosphere,becomingpartofthewatercycle.TheatmosphericconcentrationofH2Oremainsrelativelyconstant(H2Oconcentrationdoesincreaseslightlybecauseawarmeratmospherecanholdmorewatervapor).Wedo,however,seeheavierrainfallevents.
37
8.3–DoAllFossilFuelsEmittheSameAmountofCO2?
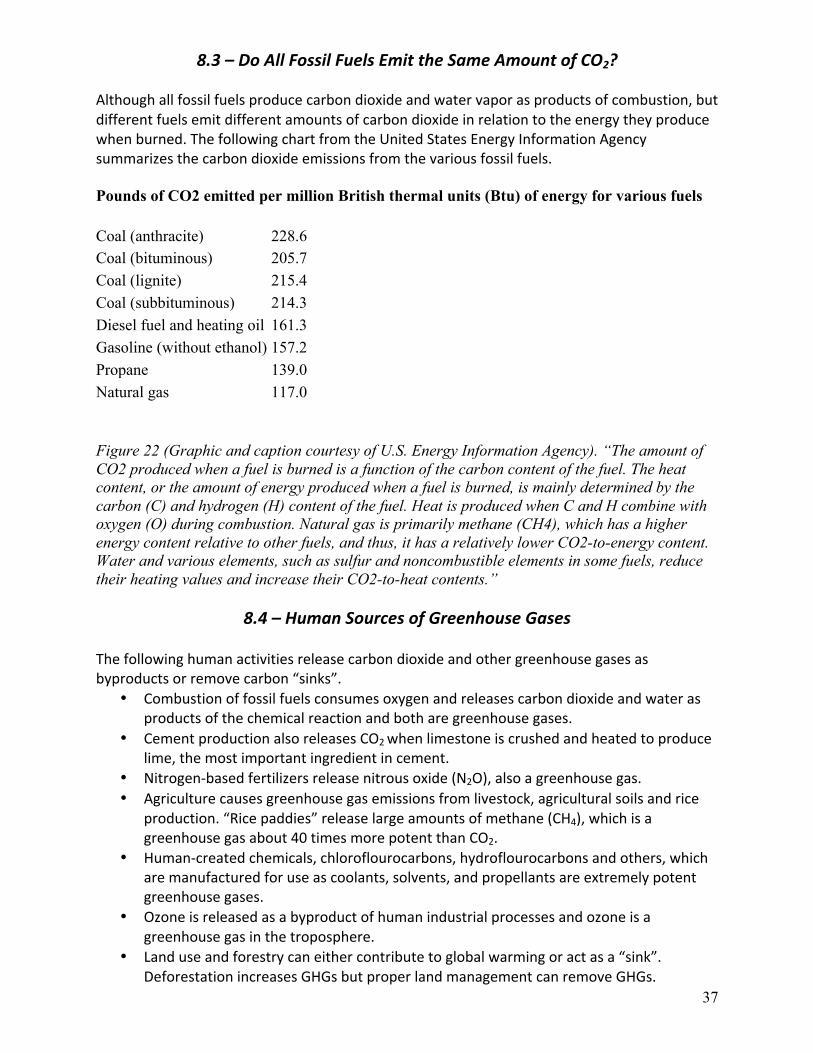
Althoughallfossilfuelsproducecarbondioxideandwatervaporasproductsofcombustion,butdifferentfuelsemitdifferentamountsofcarbondioxideinrelationtotheenergytheyproducewhenburned.ThefollowingchartfromtheUnitedStatesEnergyInformationAgencysummarizesthecarbondioxideemissionsfromthevariousfossilfuels.
Pounds of CO2 emitted per million British thermal units (Btu) of energy for various fuels
Figure 22 (Graphic and caption courtesy of U.S. Energy Information Agency). “The amount of CO2 produced when a fuel is burned is a function of the carbon content of the fuel. The heat content, or the amount of energy produced when a fuel is burned, is mainly determined by the carbon (C) and hydrogen (H) content of the fuel. Heat is produced when C and H combine with oxygen (O) during combustion. Natural gas is primarily methane (CH4), which has a higher energy content relative to other fuels, and thus, it has a relatively lower CO2-to-energy content. Water and various elements, such as sulfur and noncombustible elements in some fuels, reduce their heating values and increase their CO2-to-heat contents.”
8.4–HumanSourcesofGreenhouseGasesThefollowinghumanactivitiesreleasecarbondioxideandothergreenhousegasesasbyproductsorremovecarbon“sinks”.
• Combustionoffossilfuelsconsumesoxygenandreleasescarbondioxideandwaterasproductsofthechemicalreactionandbotharegreenhousegases.
• CementproductionalsoreleasesCO2whenlimestoneiscrushedandheatedtoproducelime,themostimportantingredientincement.
• Nitrogen-basedfertilizersreleasenitrousoxide(N2O),alsoagreenhousegas.• Agriculturecausesgreenhousegasemissionsfromlivestock,agriculturalsoilsandrice
production.“Ricepaddies”releaselargeamountsofmethane(CH4),whichisagreenhousegasabout40timesmorepotentthanCO2.
• Human-createdchemicals,chloroflourocarbons,hydroflourocarbonsandothers,whicharemanufacturedforuseascoolants,solvents,andpropellantsareextremelypotentgreenhousegases.
• Ozoneisreleasedasabyproductofhumanindustrialprocessesandozoneisagreenhousegasinthetroposphere.
• Landuseandforestrycaneithercontributetoglobalwarmingoractasa“sink”.DeforestationincreasesGHGsbutproperlandmanagementcanremoveGHGs.
Coal (anthracite) 228.6 Coal (bituminous) 205.7 Coal (lignite) 215.4 Coal (subbituminous) 214.3 Diesel fuel and heating oil 161.3 Gasoline (without ethanol) 157.2 Propane 139.0 Natural gas 117.0
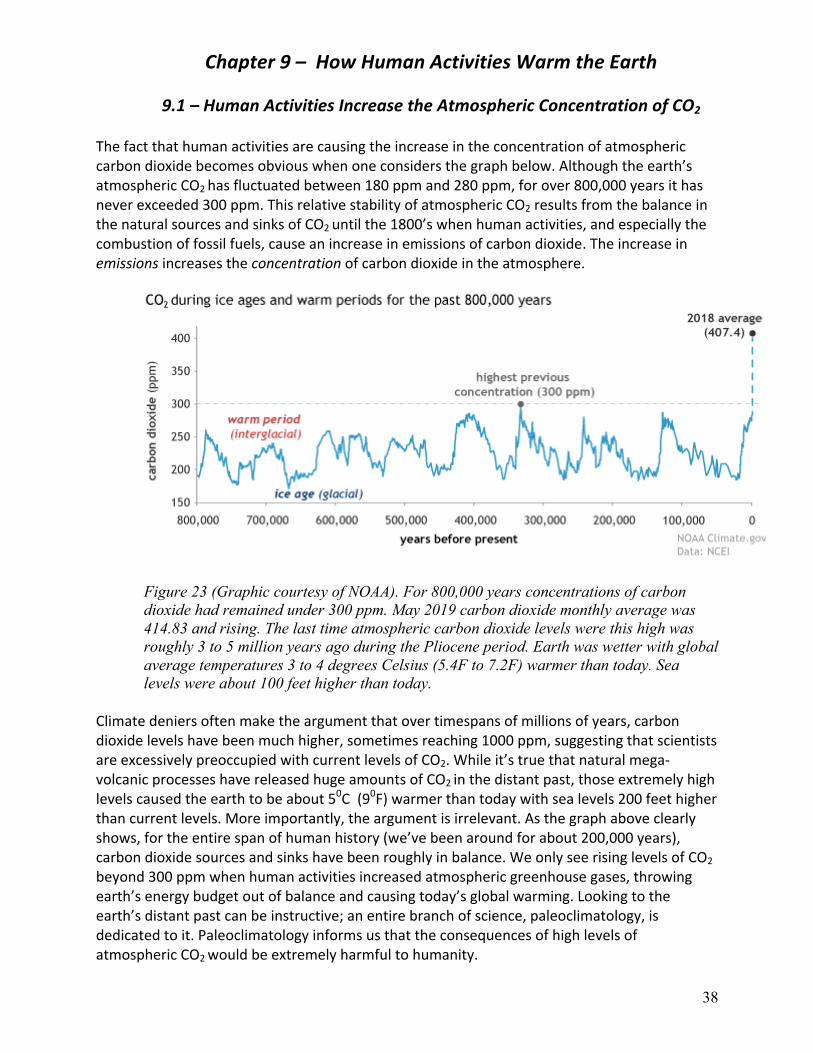
38
Chapter9–HowHumanActivitiesWarmtheEarth9.1–HumanActivitiesIncreasetheAtmosphericConcentrationofCO2
Thefactthathumanactivitiesarecausingtheincreaseintheconcentrationofatmosphericcarbondioxidebecomesobviouswhenoneconsidersthegraphbelow.Althoughtheearth’satmosphericCO2hasfluctuatedbetween180ppmand280ppm,forover800,000yearsithasneverexceeded300ppm.ThisrelativestabilityofatmosphericCO2resultsfromthebalanceinthenaturalsourcesandsinksofCO2untilthe1800’swhenhumanactivities,andespeciallythecombustionoffossilfuels,causeanincreaseinemissionsofcarbondioxide.Theincreaseinemissionsincreasestheconcentrationofcarbondioxideintheatmosphere.
Figure 23 (Graphic courtesy of NOAA). For 800,000 years concentrations of carbon dioxide had remained under 300 ppm. May 2019 carbon dioxide monthly average was 414.83 and rising. The last time atmospheric carbon dioxide levels were this high was roughly 3 to 5 million years ago during the Pliocene period. Earth was wetter with global average temperatures 3 to 4 degrees Celsius (5.4F to 7.2F) warmer than today. Sea levels were about 100 feet higher than today.
Climatedeniersoftenmaketheargumentthatovertimespansofmillionsofyears,carbondioxidelevelshavebeenmuchhigher,sometimesreaching1000ppm,suggestingthatscientistsareexcessivelypreoccupiedwithcurrentlevelsofCO2.Whileit’struethatnaturalmega-volcanicprocesseshavereleasedhugeamountsofCO2inthedistantpast,thoseextremelyhighlevelscausedtheearthtobeabout50C(90F)warmerthantodaywithsealevels200feethigherthancurrentlevels.Moreimportantly,theargumentisirrelevant.Asthegraphaboveclearlyshows,fortheentirespanofhumanhistory(we’vebeenaroundforabout200,000years),carbondioxidesourcesandsinkshavebeenroughlyinbalance.WeonlyseerisinglevelsofCO2beyond300ppmwhenhumanactivitiesincreasedatmosphericgreenhousegases,throwingearth’senergybudgetoutofbalanceandcausingtoday’sglobalwarming.Lookingtotheearth’sdistantpastcanbeinstructive;anentirebranchofscience,paleoclimatology,isdedicatedtoit.PaleoclimatologyinformsusthattheconsequencesofhighlevelsofatmosphericCO2wouldbeextremelyharmfultohumanity.
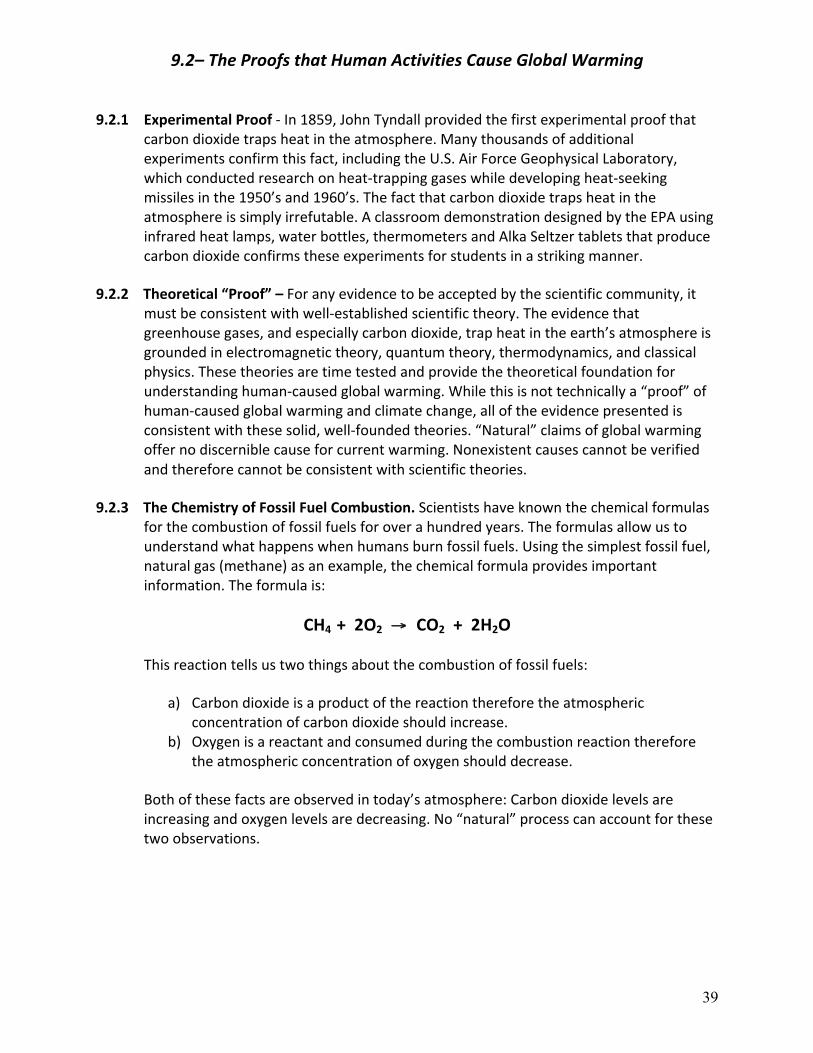
39
9.2 –TheProofsthatHumanActivitiesCauseGlobalWarming
9.2.1 ExperimentalProof-In1859,JohnTyndallprovidedthefirstexperimentalproofthatcarbondioxidetrapsheatintheatmosphere.Manythousandsofadditionalexperimentsconfirmthisfact,includingtheU.S.AirForceGeophysicalLaboratory,whichconductedresearchonheat-trappinggaseswhiledevelopingheat-seekingmissilesinthe1950’sand1960’s.Thefactthatcarbondioxidetrapsheatintheatmosphereissimplyirrefutable.AclassroomdemonstrationdesignedbytheEPAusinginfraredheatlamps,waterbottles,thermometersandAlkaSeltzertabletsthatproducecarbondioxideconfirmstheseexperimentsforstudentsinastrikingmanner.
9.2.2Theoretical“Proof”–Foranyevidencetobeacceptedbythescientificcommunity,itmustbeconsistentwithwell-establishedscientifictheory.Theevidencethatgreenhousegases,andespeciallycarbondioxide,trapheatintheearth’satmosphereisgroundedinelectromagnetictheory,quantumtheory,thermodynamics,andclassicalphysics.Thesetheoriesaretimetestedandprovidethetheoreticalfoundationforunderstandinghuman-causedglobalwarming.Whilethisisnottechnicallya“proof”ofhuman-causedglobalwarmingandclimatechange,alloftheevidencepresentedisconsistentwiththesesolid,well-foundedtheories.“Natural”claimsofglobalwarmingoffernodiscerniblecauseforcurrentwarming.Nonexistentcausescannotbeverifiedandthereforecannotbeconsistentwithscientifictheories.
9.2.3TheChemistryofFossilFuelCombustion.Scientistshaveknownthechemicalformulasforthecombustionoffossilfuelsforoverahundredyears.Theformulasallowustounderstandwhathappenswhenhumansburnfossilfuels.Usingthesimplestfossilfuel,naturalgas(methane)asanexample,thechemicalformulaprovidesimportantinformation.Theformulais:
CH4+2O2→ CO2+2H2O
Thisreactiontellsustwothingsaboutthecombustionoffossilfuels:
a) Carbondioxideisaproductofthereactionthereforetheatmosphericconcentrationofcarbondioxideshouldincrease.
b) Oxygenisareactantandconsumedduringthecombustionreactionthereforetheatmosphericconcentrationofoxygenshoulddecrease.
Bothofthesefactsareobservedintoday’satmosphere:Carbondioxidelevelsareincreasingandoxygenlevelsaredecreasing.No“natural”processcanaccountforthesetwoobservations.
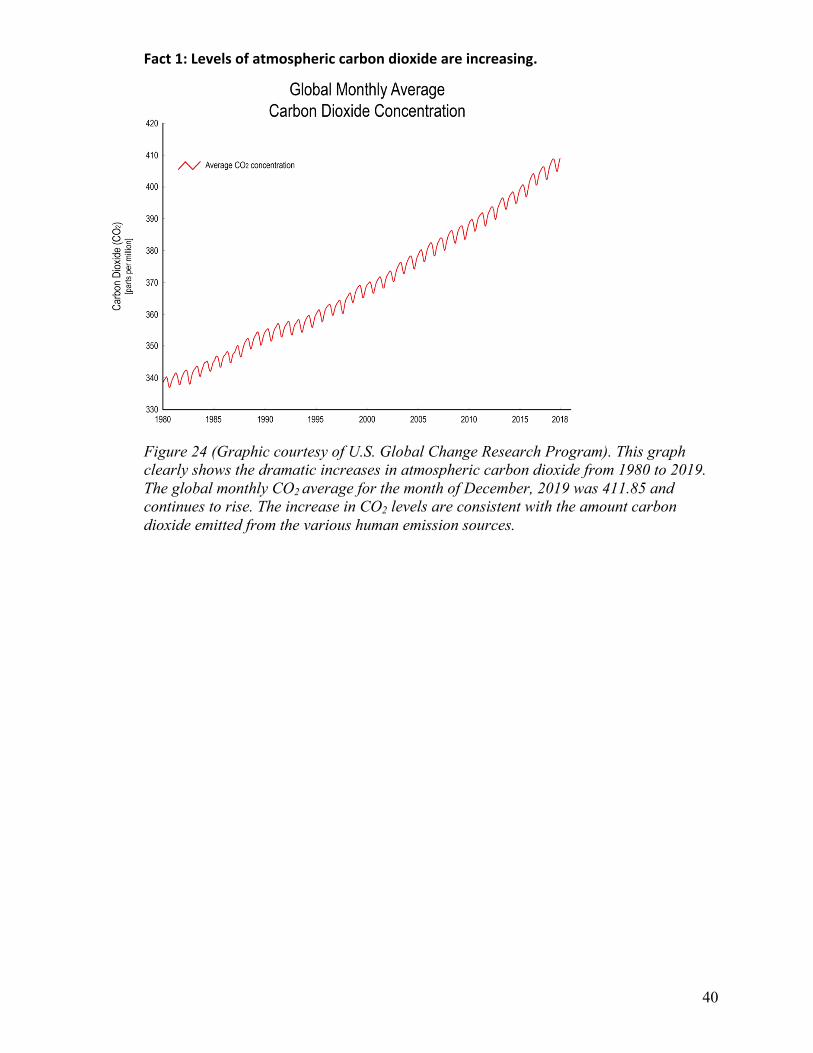
40
Fact1:Levelsofatmosphericcarbondioxideareincreasing.
Figure 24 (Graphic courtesy of U.S. Global Change Research Program). This graph clearly shows the dramatic increases in atmospheric carbon dioxide from 1980 to 2019. The global monthly CO2 average for the month of December, 2019 was 411.85 and continues to rise. The increase in CO2 levels are consistent with the amount carbon dioxide emitted from the various human emission sources.
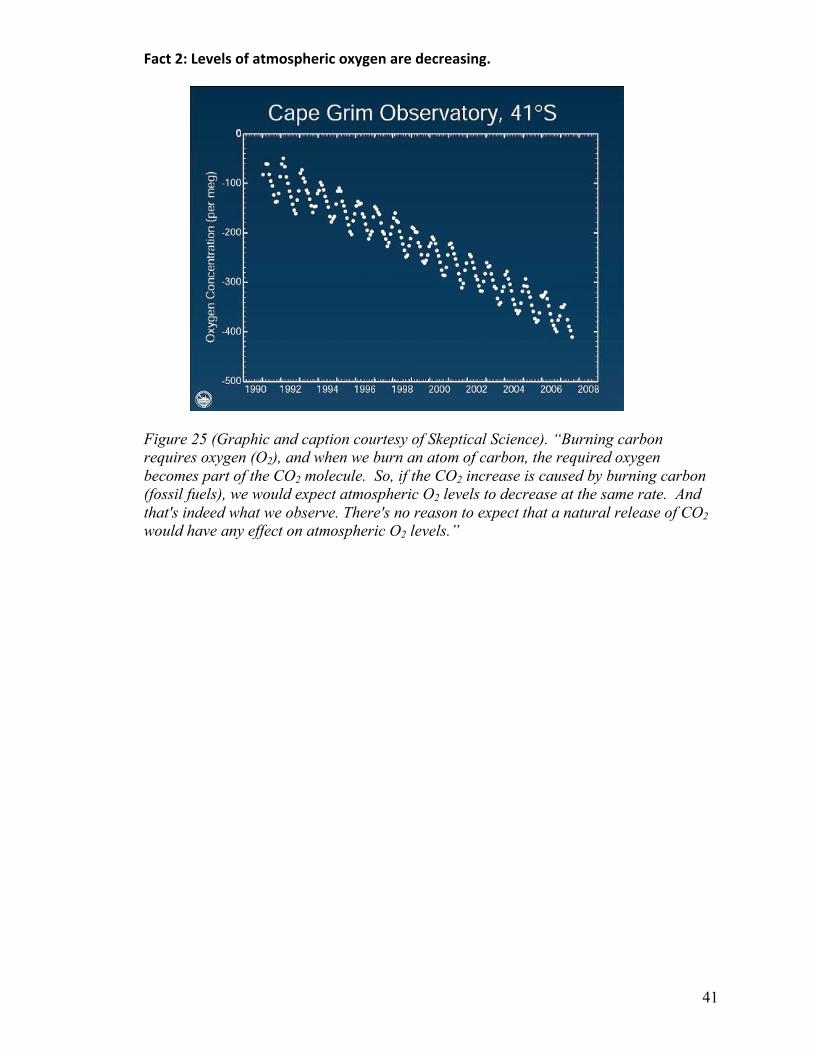
41
Fact2:Levelsofatmosphericoxygenaredecreasing.
Figure 25 (Graphic and caption courtesy of Skeptical Science). “Burning carbon requires oxygen (O2), and when we burn an atom of carbon, the required oxygen becomes part of the CO2 molecule. So, if the CO2 increase is caused by burning carbon (fossil fuels), we would expect atmospheric O2 levels to decrease at the same rate. And that's indeed what we observe. There's no reason to expect that a natural release of CO2 would have any effect on atmospheric O2 levels.”
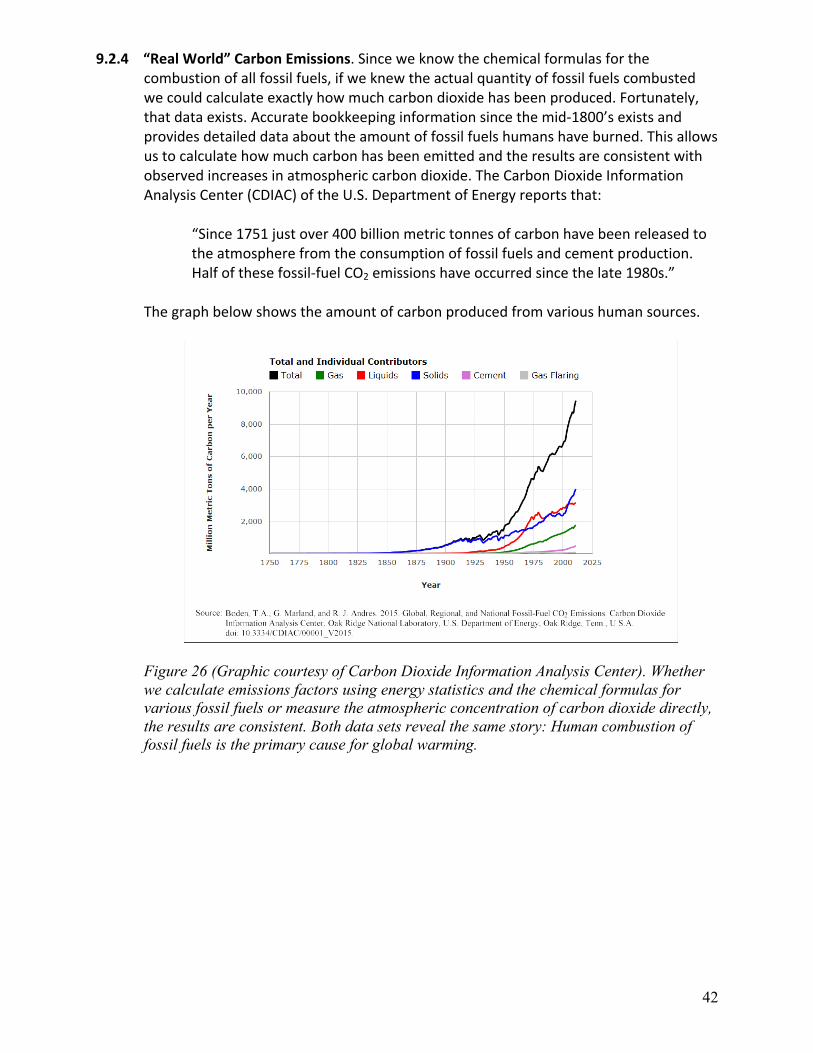
42
9.2.4“RealWorld”CarbonEmissions.Sinceweknowthechemicalformulasforthecombustionofallfossilfuels,ifweknewtheactualquantityoffossilfuelscombustedwecouldcalculateexactlyhowmuchcarbondioxidehasbeenproduced.Fortunately,thatdataexists.Accuratebookkeepinginformationsincethemid-1800’sexistsandprovidesdetaileddataabouttheamountoffossilfuelshumanshaveburned.Thisallowsustocalculatehowmuchcarbonhasbeenemittedandtheresultsareconsistentwithobservedincreasesinatmosphericcarbondioxide.TheCarbonDioxideInformationAnalysisCenter(CDIAC)oftheU.S.DepartmentofEnergyreportsthat:
“Since1751justover400billionmetrictonnesofcarbonhavebeenreleasedtotheatmospherefromtheconsumptionoffossilfuelsandcementproduction.Halfofthesefossil-fuelCO2emissionshaveoccurredsincethelate1980s.”
Thegraphbelowshowstheamountofcarbonproducedfromvarioushumansources.
Figure 26 (Graphic courtesy of Carbon Dioxide Information Analysis Center). Whether we calculate emissions factors using energy statistics and the chemical formulas for various fossil fuels or measure the atmospheric concentration of carbon dioxide directly, the results are consistent. Both data sets reveal the same story: Human combustion of fossil fuels is the primary cause for global warming.
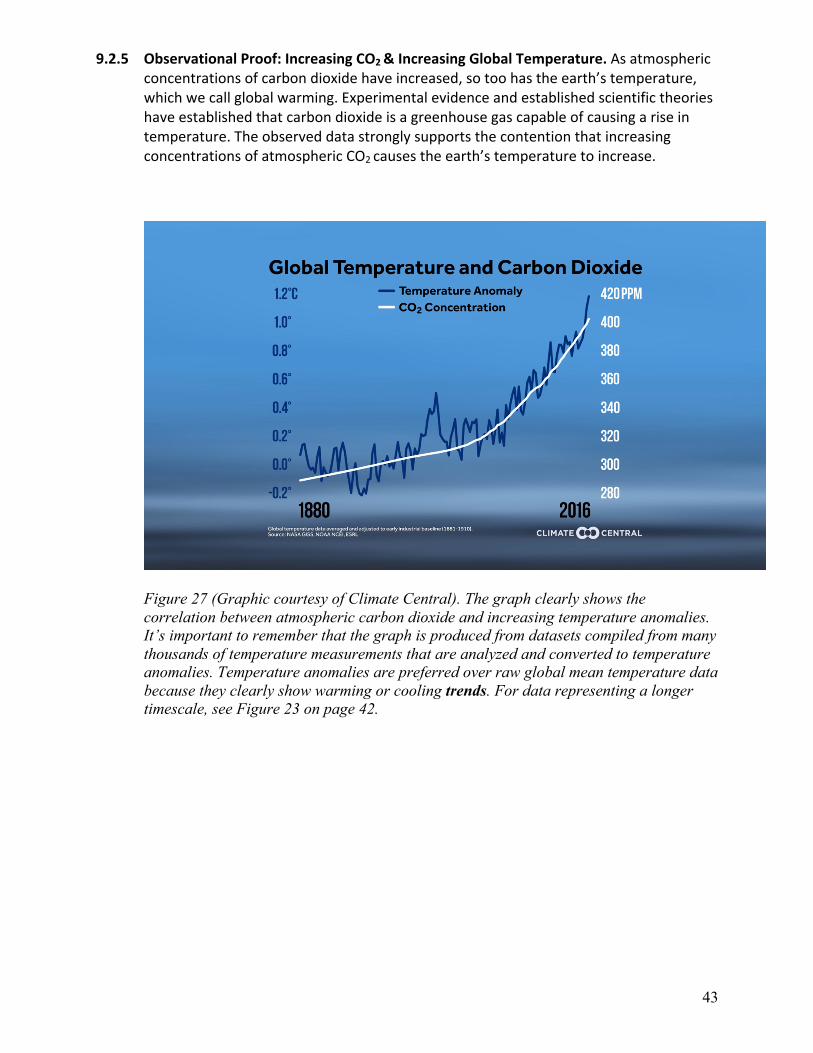
43
9.2.5 ObservationalProof:IncreasingCO2&IncreasingGlobalTemperature.Asatmosphericconcentrationsofcarbondioxidehaveincreased,sotoohastheearth’stemperature,whichwecallglobalwarming.Experimentalevidenceandestablishedscientifictheorieshaveestablishedthatcarbondioxideisagreenhousegascapableofcausingariseintemperature.TheobserveddatastronglysupportsthecontentionthatincreasingconcentrationsofatmosphericCO2causestheearth’stemperaturetoincrease.
Figure 27 (Graphic courtesy of Climate Central). The graph clearly shows the correlation between atmospheric carbon dioxide and increasing temperature anomalies. It’s important to remember that the graph is produced from datasets compiled from many thousands of temperature measurements that are analyzed and converted to temperature anomalies. Temperature anomalies are preferred over raw global mean temperature data because they clearly show warming or cooling trends. For data representing a longer timescale, see Figure 23 on page 42.
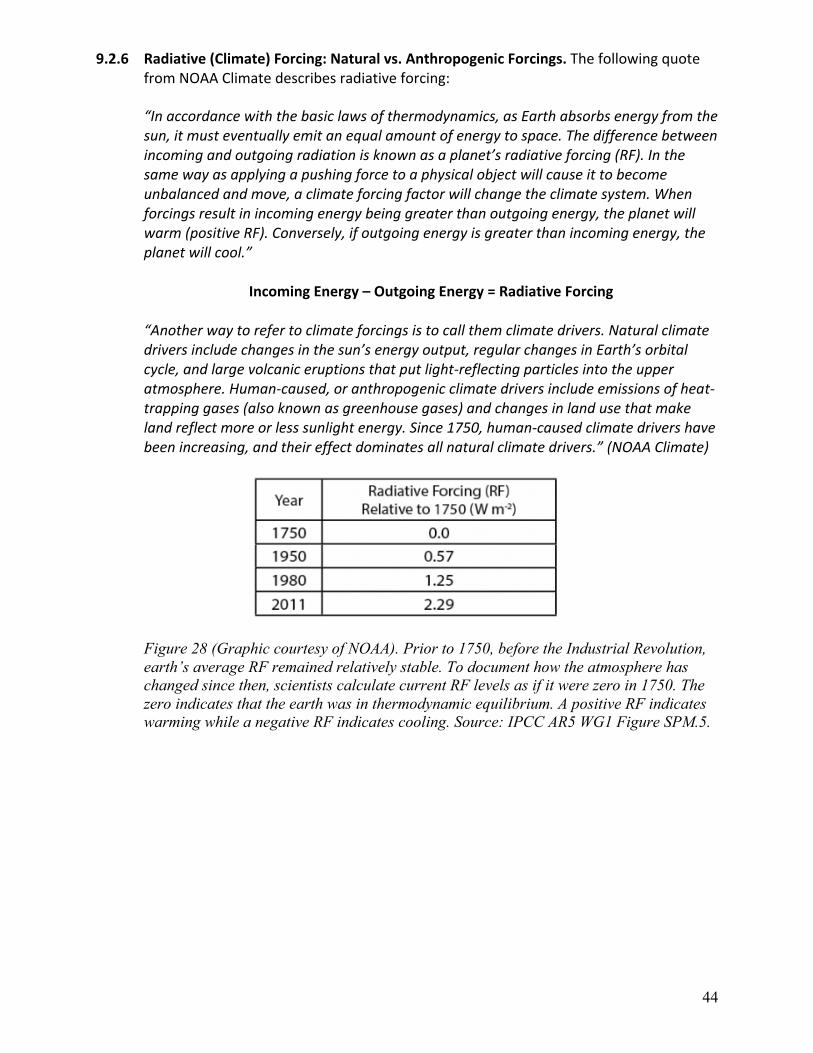
44
9.2.6 Radiative(Climate)Forcing:Naturalvs.AnthropogenicForcings.ThefollowingquotefromNOAAClimatedescribesradiativeforcing:
“Inaccordancewiththebasiclawsofthermodynamics,asEarthabsorbsenergyfromthesun,itmusteventuallyemitanequalamountofenergytospace.Thedifferencebetweenincomingandoutgoingradiationisknownasaplanet’sradiativeforcing(RF).Inthesamewayasapplyingapushingforcetoaphysicalobjectwillcauseittobecomeunbalancedandmove,aclimateforcingfactorwillchangetheclimatesystem.Whenforcingsresultinincomingenergybeinggreaterthanoutgoingenergy,theplanetwillwarm(positiveRF).Conversely,ifoutgoingenergyisgreaterthanincomingenergy,theplanetwillcool.”
IncomingEnergy–OutgoingEnergy=RadiativeForcing
“Anotherwaytorefertoclimateforcingsistocallthemclimatedrivers.Naturalclimatedriversincludechangesinthesun’senergyoutput,regularchangesinEarth’sorbitalcycle,andlargevolcaniceruptionsthatputlight-reflectingparticlesintotheupperatmosphere.Human-caused,oranthropogenicclimatedriversincludeemissionsofheat-trappinggases(alsoknownasgreenhousegases)andchangesinlandusethatmakelandreflectmoreorlesssunlightenergy.Since1750,human-causedclimatedrivershavebeenincreasing,andtheireffectdominatesallnaturalclimatedrivers.”(NOAAClimate)
Figure 28 (Graphic courtesy of NOAA). Prior to 1750, before the Industrial Revolution, earth’s average RF remained relatively stable. To document how the atmosphere has changed since then, scientists calculate current RF levels as if it were zero in 1750. The zero indicates that the earth was in thermodynamic equilibrium. A positive RF indicates warming while a negative RF indicates cooling. Source: IPCC AR5 WG1 Figure SPM.5.
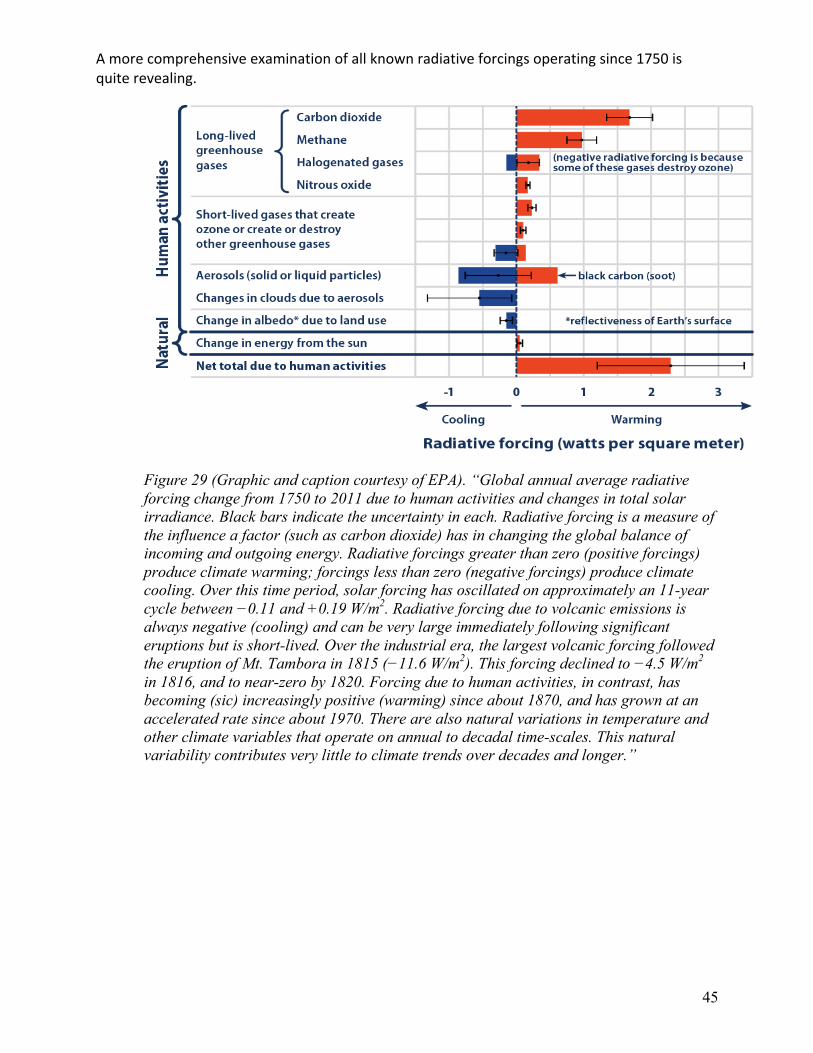
45
Amorecomprehensiveexaminationofallknownradiativeforcingsoperatingsince1750isquiterevealing.
Figure 29 (Graphic and caption courtesy of EPA). “Global annual average radiative forcing change from 1750 to 2011 due to human activities and changes in total solar irradiance. Black bars indicate the uncertainty in each. Radiative forcing is a measure of the influence a factor (such as carbon dioxide) has in changing the global balance of incoming and outgoing energy. Radiative forcings greater than zero (positive forcings) produce climate warming; forcings less than zero (negative forcings) produce climate cooling. Over this time period, solar forcing has oscillated on approximately an 11-year cycle between −0.11 and +0.19 W/m2. Radiative forcing due to volcanic emissions is always negative (cooling) and can be very large immediately following significant eruptions but is short-lived. Over the industrial era, the largest volcanic forcing followed the eruption of Mt. Tambora in 1815 (−11.6 W/m2). This forcing declined to −4.5 W/m2 in 1816, and to near-zero by 1820. Forcing due to human activities, in contrast, has becoming (sic) increasingly positive (warming) since about 1870, and has grown at an accelerated rate since about 1970. There are also natural variations in temperature and other climate variables that operate on annual to decadal time-scales. This natural variability contributes very little to climate trends over decades and longer.”
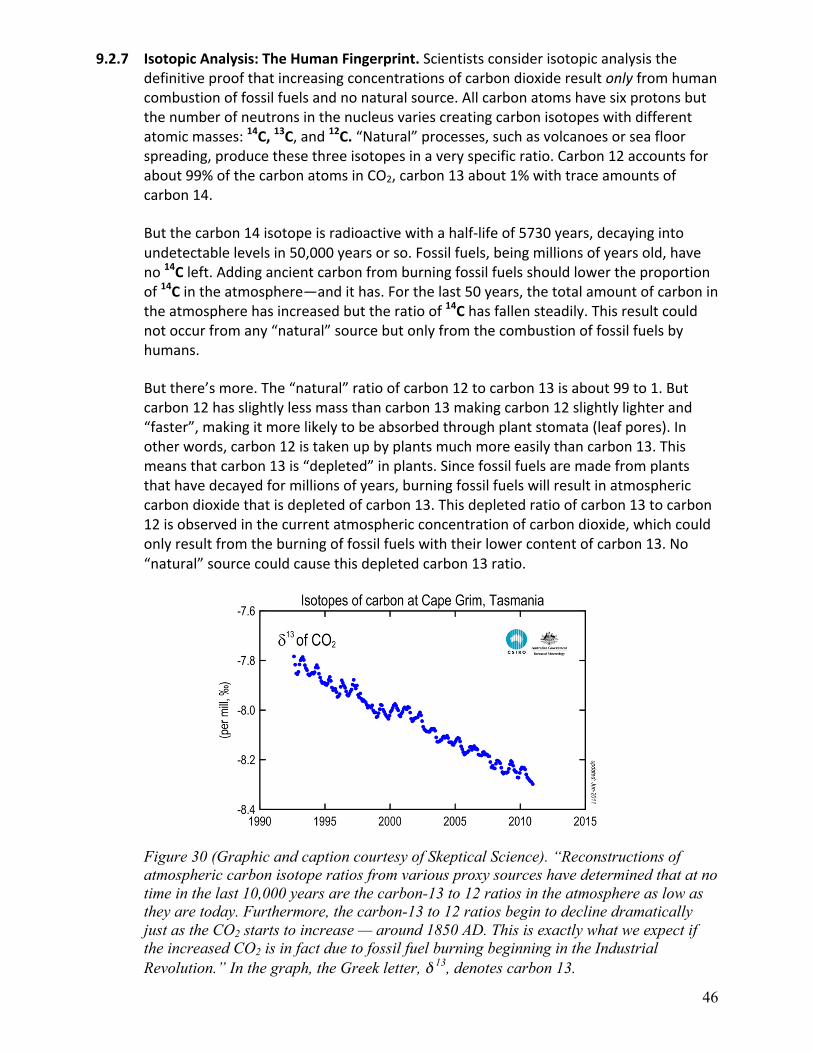
46
9.2.7 IsotopicAnalysis:TheHumanFingerprint.Scientistsconsiderisotopicanalysisthedefinitiveproofthatincreasingconcentrationsofcarbondioxideresultonlyfromhumancombustionoffossilfuelsandnonaturalsource.Allcarbonatomshavesixprotonsbutthenumberofneutronsinthenucleusvariescreatingcarbonisotopeswithdifferentatomicmasses:14C,13C,and12C.“Natural”processes,suchasvolcanoesorseafloorspreading,producethesethreeisotopesinaveryspecificratio.Carbon12accountsforabout99%ofthecarbonatomsinCO2,carbon13about1%withtraceamountsofcarbon14.
Butthecarbon14isotopeisradioactivewithahalf-lifeof5730years,decayingintoundetectablelevelsin50,000yearsorso.Fossilfuels,beingmillionsofyearsold,haveno14Cleft.Addingancientcarbonfromburningfossilfuelsshouldlowertheproportionof14Cintheatmosphere—andithas.Forthelast50years,thetotalamountofcarbonintheatmospherehasincreasedbuttheratioof14Chasfallensteadily.Thisresultcouldnotoccurfromany“natural”sourcebutonlyfromthecombustionoffossilfuelsbyhumans.
Butthere’smore.The“natural”ratioofcarbon12tocarbon13isabout99to1.Butcarbon12hasslightlylessmassthancarbon13makingcarbon12slightlylighterand“faster”,makingitmorelikelytobeabsorbedthroughplantstomata(leafpores).Inotherwords,carbon12istakenupbyplantsmuchmoreeasilythancarbon13.Thismeansthatcarbon13is“depleted”inplants.Sincefossilfuelsaremadefromplantsthathavedecayedformillionsofyears,burningfossilfuelswillresultinatmosphericcarbondioxidethatisdepletedofcarbon13.Thisdepletedratioofcarbon13tocarbon12isobservedinthecurrentatmosphericconcentrationofcarbondioxide,whichcouldonlyresultfromtheburningoffossilfuelswiththeirlowercontentofcarbon13.No“natural”sourcecouldcausethisdepletedcarbon13ratio.
Figure 30 (Graphic and caption courtesy of Skeptical Science). “Reconstructions of atmospheric carbon isotope ratios from various proxy sources have determined that at no time in the last 10,000 years are the carbon-13 to 12 ratios in the atmosphere as low as they are today. Furthermore, the carbon-13 to 12 ratios begin to decline dramatically just as the CO2 starts to increase — around 1850 AD. This is exactly what we expect if the increased CO2 is in fact due to fossil fuel burning beginning in the Industrial Revolution.” In the graph, the Greek letter, δ 13, denotes carbon 13.
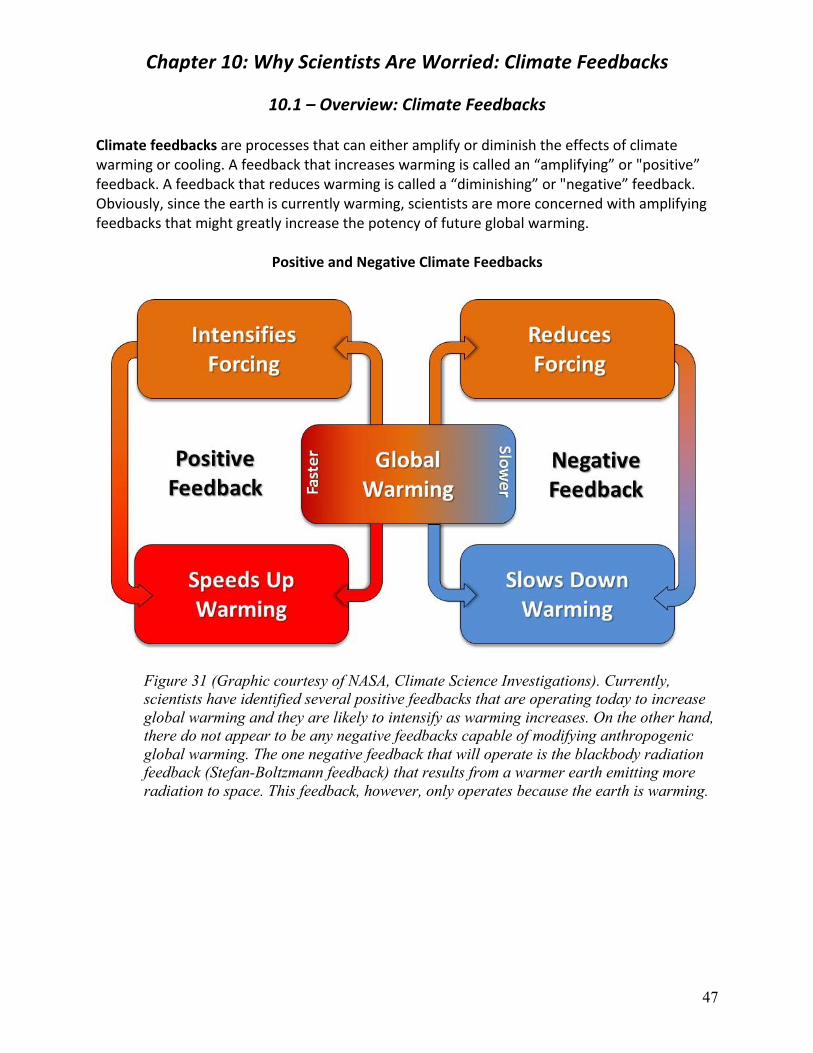
47
Chapter10:WhyScientistsAreWorried:ClimateFeedbacks
10.1–Overview:ClimateFeedbacks
Climatefeedbacksareprocessesthatcaneitheramplifyordiminishtheeffectsofclimatewarmingorcooling.Afeedbackthatincreaseswarmingiscalledan“amplifying”or"positive”feedback.Afeedbackthatreduceswarmingiscalleda“diminishing”or"negative”feedback.Obviously,sincetheearthiscurrentlywarming,scientistsaremoreconcernedwithamplifyingfeedbacksthatmightgreatlyincreasethepotencyoffutureglobalwarming.
PositiveandNegativeClimateFeedbacks
Figure 31 (Graphic courtesy of NASA, Climate Science Investigations). Currently, scientists have identified several positive feedbacks that are operating today to increase global warming and they are likely to intensify as warming increases. On the other hand, there do not appear to be any negative feedbacks capable of modifying anthropogenic global warming. The one negative feedback that will operate is the blackbody radiation feedback (Stefan-Boltzmann feedback) that results from a warmer earth emitting more radiation to space. This feedback, however, only operates because the earth is warming.
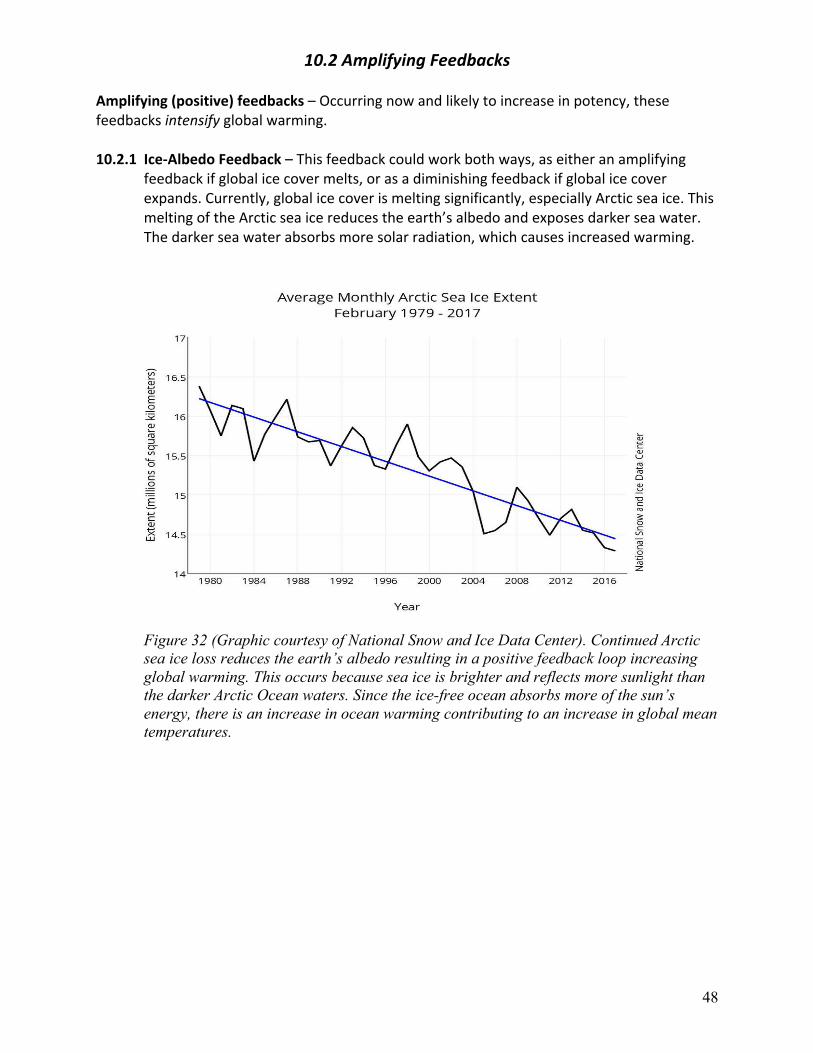
48
10.2AmplifyingFeedbacksAmplifying(positive)feedbacks–Occurringnowandlikelytoincreaseinpotency,thesefeedbacksintensifyglobalwarming.10.2.1 Ice-AlbedoFeedback–Thisfeedbackcouldworkbothways,aseitheranamplifying
feedbackifglobalicecovermelts,orasadiminishingfeedbackifglobalicecoverexpands.Currently,globalicecoverismeltingsignificantly,especiallyArcticseaice.ThismeltingoftheArcticseaicereducestheearth’salbedoandexposesdarkerseawater.Thedarkerseawaterabsorbsmoresolarradiation,whichcausesincreasedwarming.
Figure 32 (Graphic courtesy of National Snow and Ice Data Center). Continued Arctic sea ice loss reduces the earth’s albedo resulting in a positive feedback loop increasing global warming. This occurs because sea ice is brighter and reflects more sunlight than the darker Arctic Ocean waters. Since the ice-free ocean absorbs more of the sun’s energy, there is an increase in ocean warming contributing to an increase in global mean temperatures.
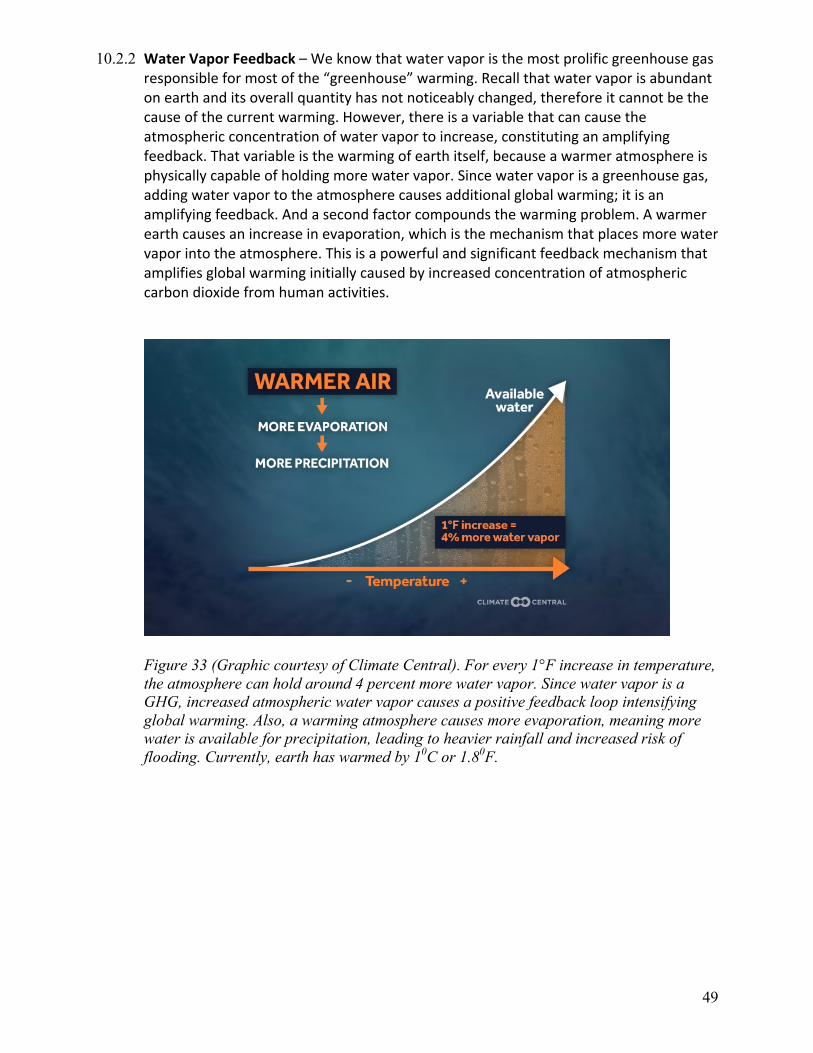
49
10.2.2 WaterVaporFeedback–Weknowthatwatervaporisthemostprolificgreenhousegasresponsibleformostofthe“greenhouse”warming.Recallthatwatervaporisabundantonearthanditsoverallquantityhasnotnoticeablychanged,thereforeitcannotbethecauseofthecurrentwarming.However,thereisavariablethatcancausetheatmosphericconcentrationofwatervaportoincrease,constitutinganamplifyingfeedback.Thatvariableisthewarmingofearthitself,becauseawarmeratmosphereisphysicallycapableofholdingmorewatervapor.Sincewatervaporisagreenhousegas,addingwatervaportotheatmospherecausesadditionalglobalwarming;itisanamplifyingfeedback.Andasecondfactorcompoundsthewarmingproblem.Awarmerearthcausesanincreaseinevaporation,whichisthemechanismthatplacesmorewatervaporintotheatmosphere.Thisisapowerfulandsignificantfeedbackmechanismthatamplifiesglobalwarminginitiallycausedbyincreasedconcentrationofatmosphericcarbondioxidefromhumanactivities.
Figure 33 (Graphic courtesy of Climate Central).For every 1°F increase in temperature, the atmosphere can hold around 4 percent more water vapor. Since water vapor is a GHG, increased atmospheric water vapor causes a positive feedback loop intensifying global warming. Also, a warming atmosphere causes more evaporation, meaning more water is available for precipitation, leading to heavier rainfall and increased risk of flooding. Currently, earth has warmed by 10C or 1.80F.
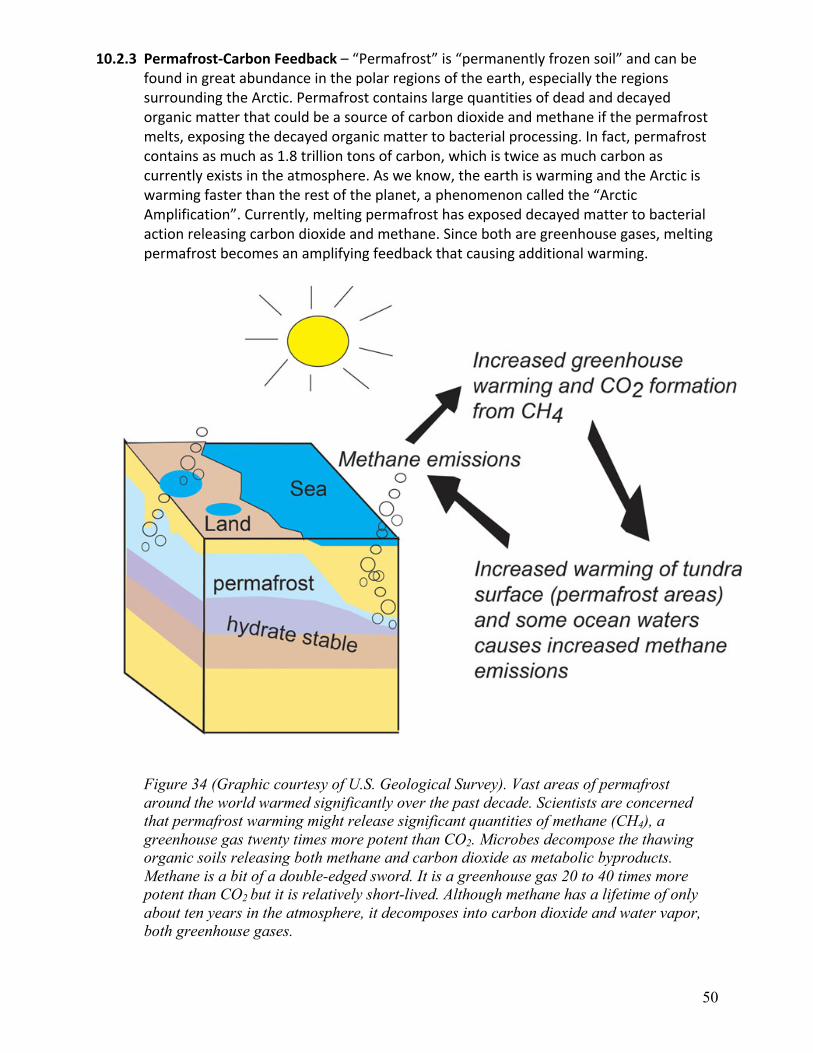
50
10.2.3 Permafrost-CarbonFeedback–“Permafrost”is“permanentlyfrozensoil”andcanbefoundingreatabundanceinthepolarregionsoftheearth,especiallytheregionssurroundingtheArctic.Permafrostcontainslargequantitiesofdeadanddecayedorganicmatterthatcouldbeasourceofcarbondioxideandmethaneifthepermafrostmelts,exposingthedecayedorganicmattertobacterialprocessing.Infact,permafrostcontainsasmuchas1.8trilliontonsofcarbon,whichistwiceasmuchcarbonascurrentlyexistsintheatmosphere.Asweknow,theearthiswarmingandtheArcticiswarmingfasterthantherestoftheplanet,aphenomenoncalledthe“ArcticAmplification”.Currently,meltingpermafrosthasexposeddecayedmattertobacterialactionreleasingcarbondioxideandmethane.Sincebotharegreenhousegases,meltingpermafrostbecomesanamplifyingfeedbackthatcausingadditionalwarming.
Figure 34 (Graphic courtesy of U.S. Geological Survey). Vast areas of permafrost around the world warmed significantly over the past decade. Scientists are concerned that permafrost warming might release significant quantities of methane (CH4), a greenhouse gas twenty times more potent than CO2. Microbes decompose the thawing organic soils releasing both methane and carbon dioxide as metabolic byproducts. Methane is a bit of a double-edged sword. It is a greenhouse gas 20 to 40 times more potent than CO2 but it is relatively short-lived. Although methane has a lifetime of only about ten years in the atmosphere, it decomposes into carbon dioxide and water vapor, both greenhouse gases.
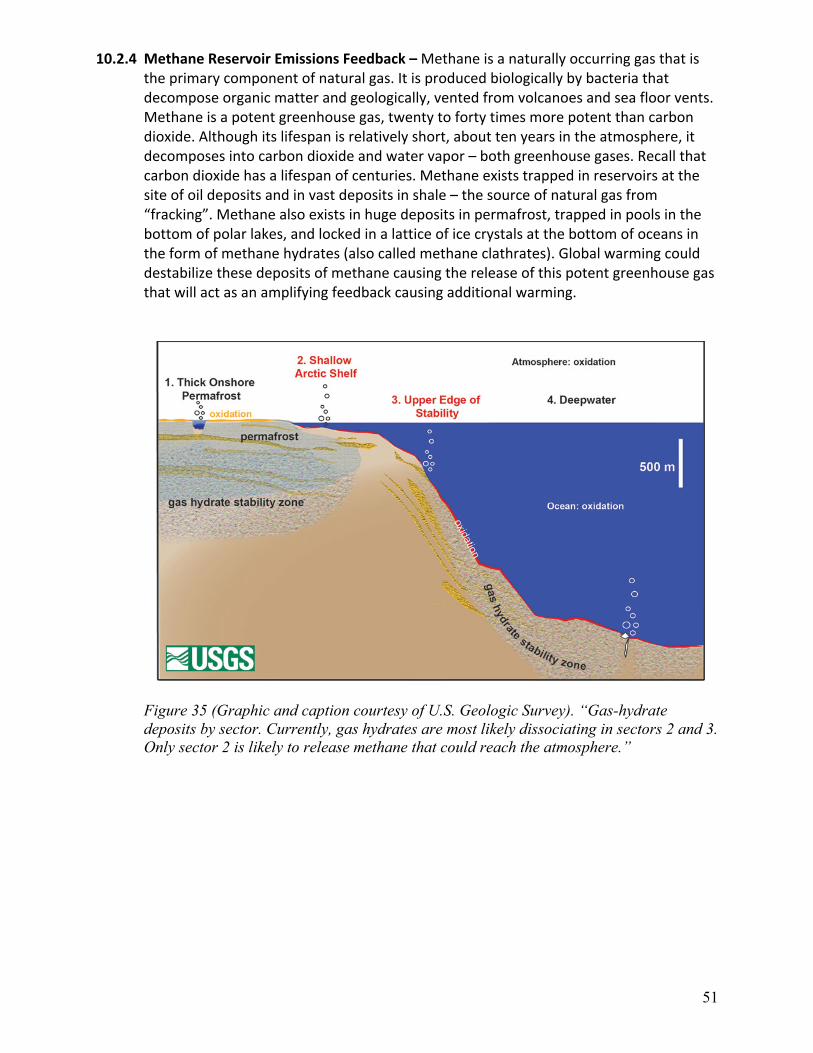
51
10.2.4 MethaneReservoirEmissionsFeedback–Methaneisanaturallyoccurringgasthatistheprimarycomponentofnaturalgas.Itisproducedbiologicallybybacteriathatdecomposeorganicmatterandgeologically,ventedfromvolcanoesandseafloorvents.Methaneisapotentgreenhousegas,twentytofortytimesmorepotentthancarbondioxide.Althoughitslifespanisrelativelyshort,abouttenyearsintheatmosphere,itdecomposesintocarbondioxideandwatervapor–bothgreenhousegases.Recallthatcarbondioxidehasalifespanofcenturies.Methaneexiststrappedinreservoirsatthesiteofoildepositsandinvastdepositsinshale–thesourceofnaturalgasfrom“fracking”.Methanealsoexistsinhugedepositsinpermafrost,trappedinpoolsinthebottomofpolarlakes,andlockedinalatticeoficecrystalsatthebottomofoceansintheformofmethanehydrates(alsocalledmethaneclathrates).Globalwarmingcoulddestabilizethesedepositsofmethanecausingthereleaseofthispotentgreenhousegasthatwillactasanamplifyingfeedbackcausingadditionalwarming.
Figure 35 (Graphic and caption courtesy of U.S. Geologic Survey). “Gas-hydrate deposits by sector. Currently, gas hydrates are most likely dissociating in sectors 2 and 3. Only sector 2 is likely to release methane that could reach the atmosphere.”
52
10.3DiminishingFeedbacksDiminishing(negative)feedbacks–Despiteclaimsfromsomeclimatechangedenialists,theredonotappeartobeanysignificantnegativefeedbackscurrentlyactingtodiminishglobalwarmingexceptforthetechnical“blackbodyradiation”feedback.Inthe1970’s,agroupofclimatescientistsformedthe"AdHocGrouponCarbonDioxideandClimate".Thegroup,chairedbyJuleCharneyofMIT,produced“TheCharneyReport”,thefirstmodernassessmentoftheeffectofrisinglevelsofcarbondioxideonearth’sclimate.Thegroupsearchedforanynegativefeedbackloopsandreachedthisconclusion:
“Wehaveexaminedwithcareallknownnegativefeedbackmechanisms….Wehavetriedbutbeenunabletofindanyoverlookedorunderestimatedphysicaleffectsthatcouldreducethecurrentlyestimatedglobalwarmingsduetoadoublingofatmosphericcarbondioxidetonegligibleproportionsorreversethemaltogether.”
Thatevaluationhasn’tchanged.Theonlysignificantnegativefeedbackmechanismoperatingtodayisthetechnical“BlackbodyRadiationFeedback”.Cloudscanactasanegativefeedbackmechanismbutalsoasanamplifyingfeedback,sotheoveralleffectiscomplicated.
10.3.1 BlackbodyRadiationFeedback(Stefan-BoltzmannFeedbackorPlanckFeedback)–Asthetemperatureoftheearthincreases,theStefan-BoltzmannLawstatesthattheemissionof(infrared)radiationbackintospacemustincreaseuntilanewthermodynamicequilibriumtemperatureisreached.Byincreasingtheamountofoutgoingradiationastheearthwarms,thereisaslightcooling,orstabilizing,effectbringingtheearthbacktoanequilibriumtemperature.
10.3.2 Evaporation/CloudFeedback–Asthetemperatureoftheearth’ssurface,seasurfaceandatmosphereincreases, soalsodoesevaporation.Asnotedabove,awarmeratmospherecanholdmorewatervapor,whichcondensesaroundaerosolparticulatestoformclouds.Unfortunately,thecloudfeedbackeffectishighlycomplex.Whethercloudsactasamplifyingordiminishingfeedbacksdependsonanumberofvariablesincludingthetypeofcloud,relativedarknessofthecloud,watervaporcontent,altitudeofthecloud,andotherfactors.Currently,climatescientistsbelievethatcloudscauseaslightcoolingeffect.
10.3.3 Long-termCarbonDioxideFeedback(InorganicCarbonCycle)–Althoughnotoftenmentionedasafeedbackloop,carbondioxideactsasthe“earth’sthermostat”overthespanofgeologictime–millionsofyears.Whenearthwarmsduetoincreasedlevelsofcarbondioxide,theweatheringofsilicatemineralsoftheearth’srockysurfaceincreases.Thisoccursbecausecarbondioxidereactswithwatertoformcarbonicacid(H2CO3)thatreactswithsilicatemineralsproducingbicarbonateionsthateventuallyreachtheoceanswheretheyencouragethegrowthofcarbonatesecretingorganisms.Astheseorganismsdie,theircarbonateshellsformdepositsoflimestonethateffectivelyremovescarbondioxidefromtheatmospherecoolingtheearth(SeeChapter7,the”LongTerm”CarbonCycle).
53
10.4–OtherFactorsThatCouldInfluenceGlobalWarming
Deforestation–Forestsandespeciallytropicalrainforestsactasveryimportantcarbondioxide“sinks”.Theseforestsabsorbhugeamountsofcarbondioxidefromtheatmosphereduringphotosynthesisandemitoxygen.Whentheseforestsarecutdown,lesscarbondioxideisremovedandthereforestaysintheatmospherewarmingtheearth.Reforestation–Ofcourse,theflipsideholdstruealso.Byreplantingforests,thetreeswillabsorbmorecarbondioxidefromtheatmosphereandremovinganygreenhousegaswillhelppreventfuturewarming.
Geoengineering–Humanshavealreadydevisedtechnologiesthatcanslowglobalwarming.Themostpromisinginvolvephysicallyremovingcarbondioxidefromtheatmosphereandeithersequesteringthecarbondeepintheearthorconvertingthecarbontosomeusefulpurpose,suchasfuel.Thesestrategiesmustbedevelopedandimplemented.However,whilegeoengineeringholdspromiseandmightactualbenecessaryinthefuture,someofthestrategiesareriskysincewedon’tknowexactlyhowthecomplexclimatesystemoftheearthwillreact.Forexample,sprayingaerosolsintothestratospherewillreducetheamountofsunlightthatreachesearth’ssurface.However,thepotential“unintendedconsequences”makethis“solution”extremelyproblematicandmostscientistsarereluctanttoendorsethesestrategies.Seequoteonpages67-68.
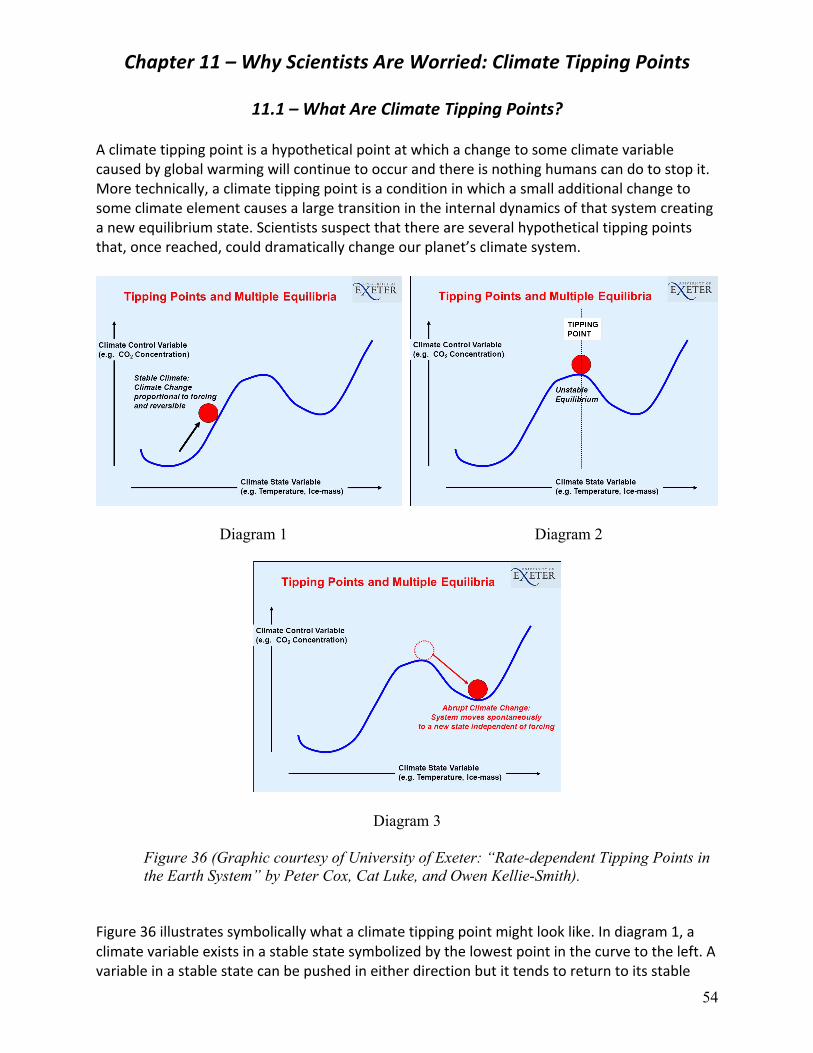
54
Chapter11–WhyScientistsAreWorried:ClimateTippingPoints
11.1–WhatAreClimateTippingPoints?
Aclimatetippingpointisahypotheticalpointatwhichachangetosomeclimatevariablecausedbyglobalwarmingwillcontinuetooccurandthereisnothinghumanscandotostopit.Moretechnically,aclimatetippingpointisaconditioninwhichasmalladditionalchangetosomeclimateelementcausesalargetransitionintheinternaldynamicsofthatsystemcreatinganewequilibriumstate.Scientistssuspectthatthereareseveralhypotheticaltippingpointsthat,oncereached,coulddramaticallychangeourplanet’sclimatesystem.
Diagram 1 Diagram 2
Diagram 3
Figure 36 (Graphic courtesy of University of Exeter: “Rate-dependent Tipping Points in the Earth System” by Peter Cox, Cat Luke, and Owen Kellie-Smith).
Figure36illustratessymbolicallywhataclimatetippingpointmightlooklike.Indiagram1,aclimatevariableexistsinastablestatesymbolizedbythelowestpointinthecurvetotheleft.Avariableinastablestatecanbepushedineitherdirectionbutittendstoreturntoitsstable
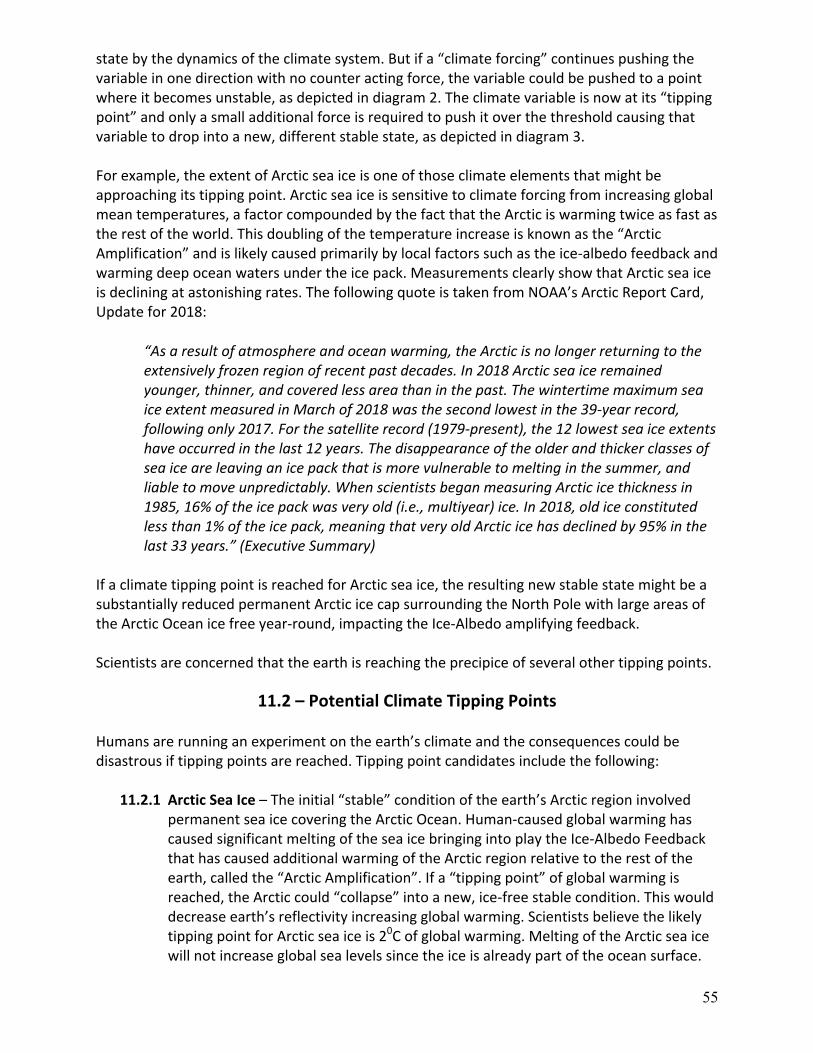
55
statebythedynamicsoftheclimatesystem.Butifa“climateforcing”continuespushingthevariableinonedirectionwithnocounteractingforce,thevariablecouldbepushedtoapointwhereitbecomesunstable,asdepictedindiagram2.Theclimatevariableisnowatits“tippingpoint”andonlyasmalladditionalforceisrequiredtopushitoverthethresholdcausingthatvariabletodropintoanew,differentstablestate,asdepictedindiagram3.Forexample,theextentofArcticseaiceisoneofthoseclimateelementsthatmightbeapproachingitstippingpoint.Arcticseaiceissensitivetoclimateforcingfromincreasingglobalmeantemperatures,afactorcompoundedbythefactthattheArcticiswarmingtwiceasfastastherestoftheworld.Thisdoublingofthetemperatureincreaseisknownasthe“ArcticAmplification”andislikelycausedprimarilybylocalfactorssuchastheice-albedofeedbackandwarmingdeepoceanwatersundertheicepack.MeasurementsclearlyshowthatArcticseaiceisdecliningatastonishingrates.ThefollowingquoteistakenfromNOAA’sArcticReportCard,Updatefor2018:
“Asaresultofatmosphereandoceanwarming,theArcticisnolongerreturningtotheextensivelyfrozenregionofrecentpastdecades.In2018Arcticseaiceremainedyounger,thinner,andcoveredlessareathaninthepast.ThewintertimemaximumseaiceextentmeasuredinMarchof2018wasthesecondlowestinthe39-yearrecord,followingonly2017.Forthesatelliterecord(1979-present),the12lowestseaiceextentshaveoccurredinthelast12years.Thedisappearanceoftheolderandthickerclassesofseaiceareleavinganicepackthatismorevulnerabletomeltinginthesummer,andliabletomoveunpredictably.WhenscientistsbeganmeasuringArcticicethicknessin1985,16%oftheicepackwasveryold(i.e.,multiyear)ice.In2018,oldiceconstitutedlessthan1%oftheicepack,meaningthatveryoldArcticicehasdeclinedby95%inthelast33years.”(ExecutiveSummary)
IfaclimatetippingpointisreachedforArcticseaice,theresultingnewstablestatemightbeasubstantiallyreducedpermanentArcticicecapsurroundingtheNorthPolewithlargeareasoftheArcticOceanicefreeyear-round,impactingtheIce-Albedoamplifyingfeedback.Scientistsareconcernedthattheearthisreachingtheprecipiceofseveralothertippingpoints.
11.2–PotentialClimateTippingPointsHumansarerunninganexperimentontheearth’sclimateandtheconsequencescouldbedisastrousiftippingpointsarereached.Tippingpointcandidatesincludethefollowing:
11.2.1 ArcticSeaIce–Theinitial“stable”conditionoftheearth’sArcticregioninvolvedpermanentseaicecoveringtheArcticOcean.Human-causedglobalwarminghascausedsignificantmeltingoftheseaicebringingintoplaytheIce-AlbedoFeedbackthathascausedadditionalwarmingoftheArcticregionrelativetotherestoftheearth,calledthe“ArcticAmplification”.Ifa“tippingpoint”ofglobalwarmingisreached,theArcticcould“collapse”intoanew,ice-freestablecondition.Thiswoulddecreaseearth’sreflectivityincreasingglobalwarming.ScientistsbelievethelikelytippingpointforArcticseaiceis20Cofglobalwarming.MeltingoftheArcticseaicewillnotincreaseglobalsealevelssincetheiceisalreadypartoftheoceansurface.
56
11.2.2 GreenlandIceSheet–ThislargeicesheetcoversalmosttheentireislandofGreenland.Observationsandmeasurementsindicatethatthisicesheetislosingmassatanacceleratingrate–6%fastertodaythanthe1990’s.IftheGreenlandicesheet“collapses”intoanewstableconditionthatresultsinanice-freeGreenland,sealevelswillriseby6-7metersorabout20feet.Thisisnotimmediatelyimminentbutdefinitelyaconcernforthefuture.Onceagain,scientistsbelievethataglobalmeantemperatureof20CisthetippingpointfortheGreenlandicesheet.
11.2.3 WestAntarcticIceSheet–ThescenarioissimilartotheGreenlandicesheetbuta
significantmeltdownoftheWestAntarcticicesheetcreatesthepossibilityofsubstantiallygreaterincreaseinsealevel.Thisregionisofparticularconcernbecauseitismeltingatanacceleratingrate(again,6%fasterthanthe1990’s)anditholdsconsiderablymorepotentialforsealevelrisecomparedtoGreenland.ThetemperaturetippingpointforWestAntarcticaismorecomplexandhasnotbeenestimated.However,evidencesuggeststhatthisicesheetisalreadyundergoingsignificantstructuralchanges.
11.2.4 AtlanticMeridionalOverturningCirculation(AMOC)–The“GulfStream”ispartofthisoceancurrentthatbringswarmerwaternorthtoArcticregionsaffectingtheweatheroftheNorthAmericanandEuropeancontinents.Itscirculationtransportsheataroundtheglobelikeaconveyorbelt,andifitsmovementweretostoporsubstantiallydiminish,theeffectsonweatherpatternswouldbesignificantanddramatic.Unfortunately,thecomplexityofweatherpatternsandthemanyclimaticmitigatingfactorsmakepredictionsextremelydifficult.Scientistshavealreadydeterminedthatthisoceancurrentisslowing,whichisonereasontheAtlanticEastCoastisexperiencingarateofsealevelrisegreaterthantheglobalmeanincrease.
11.2.5 CoralReefsCollapsing–Coralreefsmightwellbethe“canaryinthecoalmine”for
climatechange.Thereareseveralcausesforcoraldie-offsbutthereisnodoubtthatoceanwarmingisoneofthemitigatingfactors.Whenwatertemperaturesbecometoohigh,thecoralsexpelthealgaelivingintheirtissuesthatgivethecoralstheircolor.Thisiscoralbleaching.Coralscansurvivebeachingeventsbuttheyarestressedandifwatertemperaturesremainhigh,thecoralscoulddie.Othercausesofbleachingincludeagriculturalfertilizerrunoffthataffectthecoralsabilitytometabolizenitrogenandphosphorous,stronglysuggestingthatlocalwaterqualityisintimatelyrelatedtothecoralsabilitytosurvivewarmingwaters.
11.2.6 SubstantialPermafrostMeltdown–Asweknow,permafrostis“permanentlyfrozen”groundthatcontainslargeamountsoforganicmatterthatcoulddecomposeandreleasemethane,averypotentgreenhousegas,aswellascarbondioxide.Scientistsareconcernedthatrisingtemperaturescouldreachatippingpointthatcausesvastareasofpermafrosttomelt,exposingthisbiomasstobacterialactionreleasingvastamountsofmethaneandcarbondioxide.Thisreleaseofhugeamountsofgreenhousegasesisalsoapositivefeedbackthatincreasesglobalwarming.
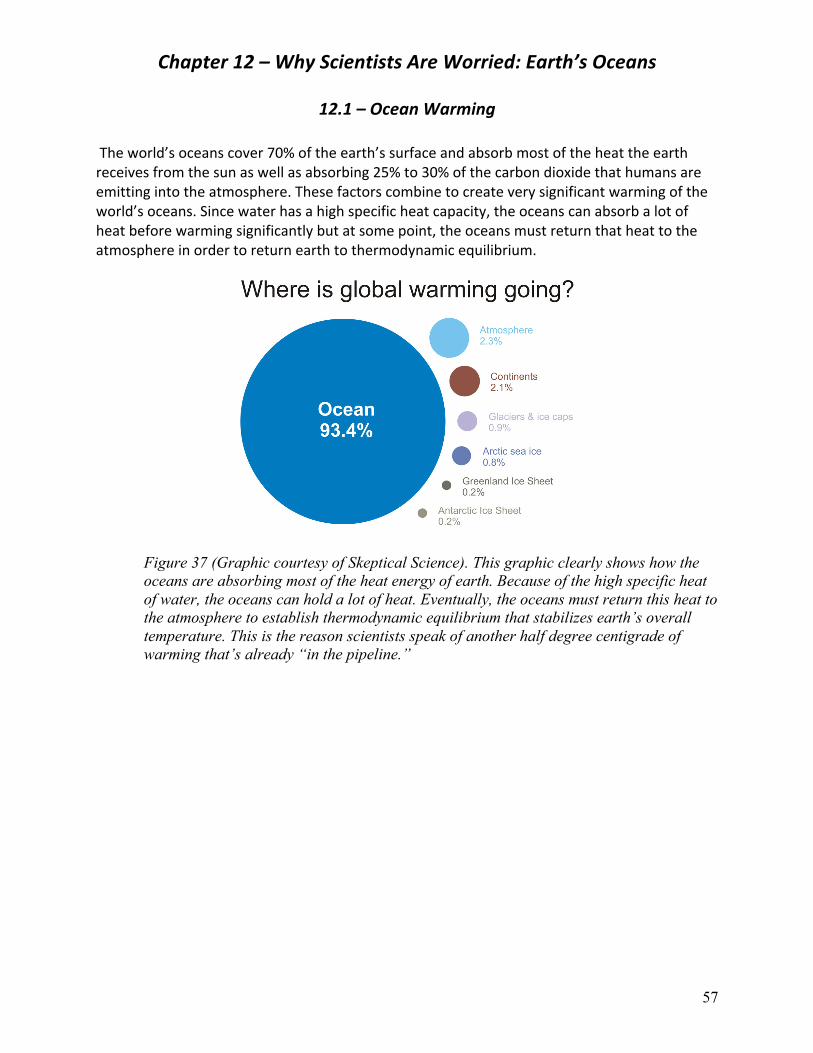
57
Chapter12–WhyScientistsAreWorried:Earth’sOceans
12.1–OceanWarmingTheworld’soceanscover70%oftheearth’ssurfaceandabsorbmostoftheheattheearthreceivesfromthesunaswellasabsorbing25%to30%ofthecarbondioxidethathumansareemittingintotheatmosphere.Thesefactorscombinetocreateverysignificantwarmingoftheworld’soceans.Sincewaterhasahighspecificheatcapacity,theoceanscanabsorbalotofheatbeforewarmingsignificantlybutatsomepoint,theoceansmustreturnthatheattotheatmosphereinordertoreturnearthtothermodynamicequilibrium.
Figure 37 (Graphic courtesy of Skeptical Science). This graphic clearly shows how the oceans are absorbing most of the heat energy of earth. Because of the high specific heat of water, the oceans can hold a lot of heat. Eventually, the oceans must return this heat to the atmosphere to establish thermodynamic equilibrium that stabilizes earth’s overall temperature. This is the reason scientists speak of another half degree centigrade of warming that’s already “in the pipeline.”
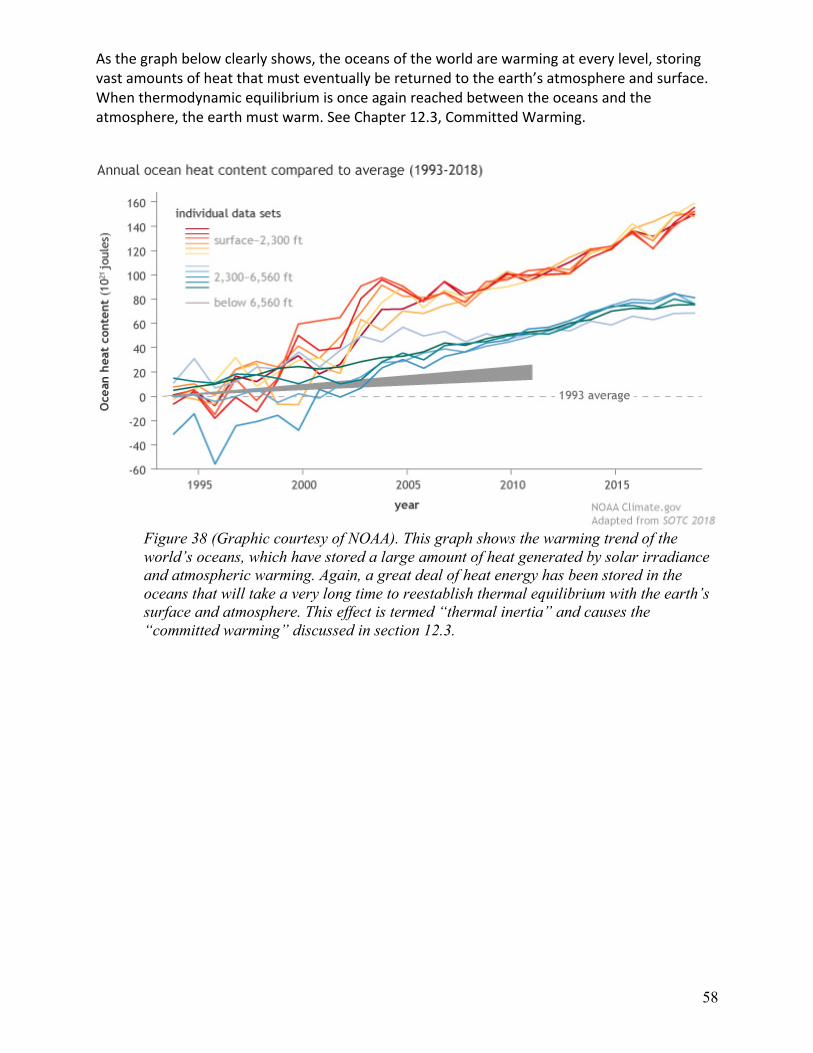
58
Asthegraphbelowclearlyshows,theoceansoftheworldarewarmingateverylevel,storingvastamountsofheatthatmusteventuallybereturnedtotheearth’satmosphereandsurface.Whenthermodynamicequilibriumisonceagainreachedbetweentheoceansandtheatmosphere,theearthmustwarm.SeeChapter12.3,CommittedWarming.
Figure 38 (Graphic courtesy of NOAA). This graph shows the warming trend of the world’s oceans, which have stored a large amount of heat generated by solar irradiance and atmospheric warming. Again, a great deal of heat energy has been stored in the oceans that will take a very long time to reestablish thermal equilibrium with the earth’s surface and atmosphere. This effect is termed “thermal inertia” and causes the “committed warming” discussed in section 12.3.
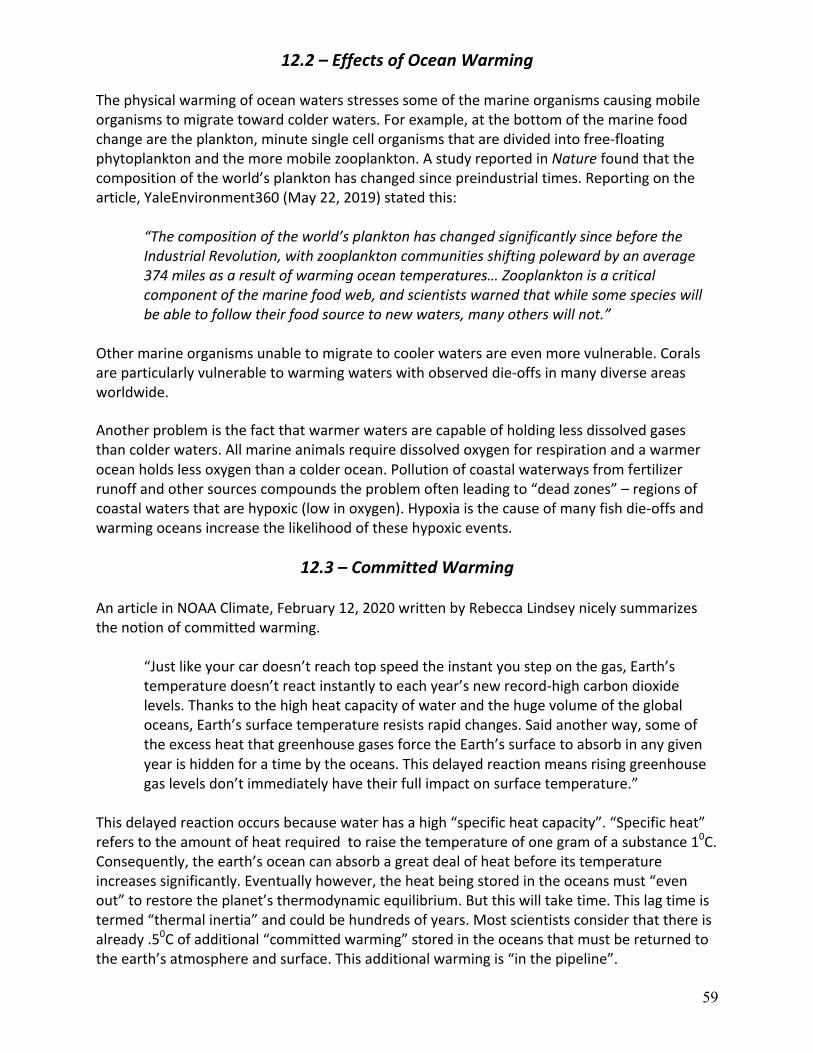
59
12.2–EffectsofOceanWarming
Thephysicalwarmingofoceanwatersstressessomeofthemarineorganismscausingmobileorganismstomigratetowardcolderwaters.Forexample,atthebottomofthemarinefoodchangearetheplankton,minutesinglecellorganismsthataredividedintofree-floatingphytoplanktonandthemoremobilezooplankton.AstudyreportedinNaturefoundthatthecompositionoftheworld’splanktonhaschangedsincepreindustrialtimes.Reportingonthearticle,YaleEnvironment360(May22,2019)statedthis:
“Thecompositionoftheworld’splanktonhaschangedsignificantlysincebeforetheIndustrialRevolution,withzooplanktoncommunitiesshiftingpolewardbyanaverage374milesasaresultofwarmingoceantemperatures…Zooplanktonisacriticalcomponentofthemarinefoodweb,andscientistswarnedthatwhilesomespecieswillbeabletofollowtheirfoodsourcetonewwaters,manyotherswillnot.”
Othermarineorganismsunabletomigratetocoolerwatersareevenmorevulnerable.Coralsareparticularlyvulnerabletowarmingwaterswithobserveddie-offsinmanydiverseareasworldwide.
Anotherproblemisthefactthatwarmerwatersarecapableofholdinglessdissolvedgasesthancolderwaters.Allmarineanimalsrequiredissolvedoxygenforrespirationandawarmeroceanholdslessoxygenthanacolderocean.Pollutionofcoastalwaterwaysfromfertilizerrunoffandothersourcescompoundstheproblemoftenleadingto“deadzones”–regionsofcoastalwatersthatarehypoxic(lowinoxygen).Hypoxiaisthecauseofmanyfishdie-offsandwarmingoceansincreasethelikelihoodofthesehypoxicevents.
12.3–CommittedWarmingAnarticleinNOAAClimate,February12,2020writtenbyRebeccaLindseynicelysummarizesthenotionofcommittedwarming.
“Justlikeyourcardoesn’treachtopspeedtheinstantyousteponthegas,Earth’stemperaturedoesn’treactinstantlytoeachyear’snewrecord-highcarbondioxidelevels.Thankstothehighheatcapacityofwaterandthehugevolumeoftheglobaloceans,Earth’ssurfacetemperatureresistsrapidchanges.Saidanotherway,someoftheexcessheatthatgreenhousegasesforcetheEarth’ssurfacetoabsorbinanygivenyearishiddenforatimebytheoceans.Thisdelayedreactionmeansrisinggreenhousegaslevelsdon’timmediatelyhavetheirfullimpactonsurfacetemperature.”
Thisdelayedreactionoccursbecausewaterhasahigh“specificheatcapacity”.“Specificheat”referstotheamountofheatrequiredtoraisethetemperatureofonegramofasubstance10C.Consequently,theearth’soceancanabsorbagreatdealofheatbeforeitstemperatureincreasessignificantly.Eventuallyhowever,theheatbeingstoredintheoceansmust“evenout”torestoretheplanet’sthermodynamicequilibrium.Butthiswilltaketime.Thislagtimeistermed“thermalinertia”andcouldbehundredsofyears.Mostscientistsconsiderthatthereisalready.50Cofadditional“committedwarming”storedintheoceansthatmustbereturnedtotheearth’satmosphereandsurface.Thisadditionalwarmingis“inthepipeline”.
60
12.4–OceanAcidification:The“OtherCO2Problem”
Since1800,theatmosphericconcentrationofcarbondioxidehasincreasedfrom280ppmtoover400ppmanditcontinuestoincrease.Theworld’soceanscover70%oftheearth’ssurfaceandabsorbhugeamountsofCO2helpingregulatetheatmosphericCO2concentrationbutthisuptakeofcarbondioxidefromtheatmospherechangestheocean’schemistry.OneofthemostimportanteffectsofabsorbingthisCO2isoceanacidification.Thefollowingsummaryistakenfromthebooklet,OceanAcidificationpublishedbytheNationalResearchCounciloftheNationalAcademies:
“Atmosphericcarbondioxideisabsorbedbytheocean,whereitreactswithseawatertoformcarbonicacid(H2CO3).Almostimmediately,carbonicaciddissociatestoformbicarbonateions(HCO3
-)andhydrogenions(H+).Astheconcentrationofhydrogenionsincreases,thewaterbecomesmoreacidic.Someoftheextrahydrogenionsreactwithcarbonateions(CO3
2-)toformmorebicarbonate.Thismakescarbonateionslessabundant–aproblemformanymarinespeciesthatabsorbcarbonatefromseawateranduseittobuildcalciumcarbonateshellsandskeletonsinaprocesscalledcalcification.Ascarbonatebecomeslessabundant,theseorganisms,suchascoralsandclams,havemoredifficultybuildingandmaintainingtheirshellsandskeletons.Increasedaciditycanevencausesomecarbonateshellstodissolve.Hydrogenionsreactwiththesolidcalciumcarbonate(CaCO3)andconvertittosolublebicarbonate(HCO3
-)and(Ca2+)ions.”(page6)
Thechemistryisabitcomplexbutworthalittleeffort.
Step1.CarbondioxideflowsintoandoutoftheoceansrelativelyeasilybutsomeoftheCO2Isabsorbedbytheoceans.ThedissolvedCO2combineswithwatermoleculestoformrelativelyweakcarbonicacid.
CO2+H2O→ H2CO3(carbonicacid)
Step2.Almostimmediately,thecarbonicaciddissociatestoformbicarbonateionsandhydrogenions.ItistheincreaseinhydrogenionsthatcausesthepHoftheoceanstodecrease;theoceanbecomemoresacidic.
H2CO3(carbonicacid)→ HCO3-(bicarbonate)+H+(Hydrogenions)
Step3.Someofthehydrogenionsreactwithcarbonateionstoproducebicarbonate,whichremovesthecarbonatefromtheseawatermakingitmoredifficultforcalcifyingmarineorganismstoconstructtheirshells.
H+(hydrogenions)+CO32-(carbonate)→ HCO3
-(bicarbonate)
61
12.5–LocalStressors,HypoxiaandEcosystemResilience
Theabilityofourcoastalecosystemstocopewithacidificationisinfluencedbythelocalstressorstheymustcontendwith,suchashighnutrientinput,orchangesintemperatureorsalinity.Excessnutrientsfromriverinputsandfertilizerrunoffcancausealgalblooms.Whenthesealgalbloomsdie,theyconsumeoxygenandreleasecarbondioxide.Iftoomuchoxygenisconsumedbythesedyingblooms,hypoxia(lowoxygenlevels)canresult.Theselocaloxygendepletioneventscanleadtomarinedie-offsandtheexcesscarbondioxidecausesadditionalacidification.TheabilityofanymarineecosystemtodealwiththegeneralincreaseinacidificationfromrisinglevelsofatmosphericCO2isalsoimpactedbytheselocalevents.Controllingandminimizingtheselocalstressorsisanimportantmitigatingfactorinhelpingthesecoastalecosystemscopewithoceanacidification.ThefollowingquotefromNOAAOceanServiceEducation,“Estuaries,NutrientPollution–Eutrophication”,summarizestheproblem.
“Nitratesandphosphatesarenutrientsthatplantsneedtogrow.Insmallamountstheyarebeneficialtomanyecosystems.Inexcessiveamounts,however,nutrientscauseatypeofpollutioncalledeutrophication.Eutrophicationstimulatesanexplosivegrowthofalgae(algalblooms)thatdepletesthewaterofoxygenwhenthealgaedieandareeatenbybacteria.Estuarinewatersmaybecomehypoxic(oxygenpoor)oranoxic(completelydepletedofoxygen)fromalgalblooms.Whilehypoxiamaycauseanimalsinestuariestobecomephysicallystressed,anoxicconditionscankillthem.”
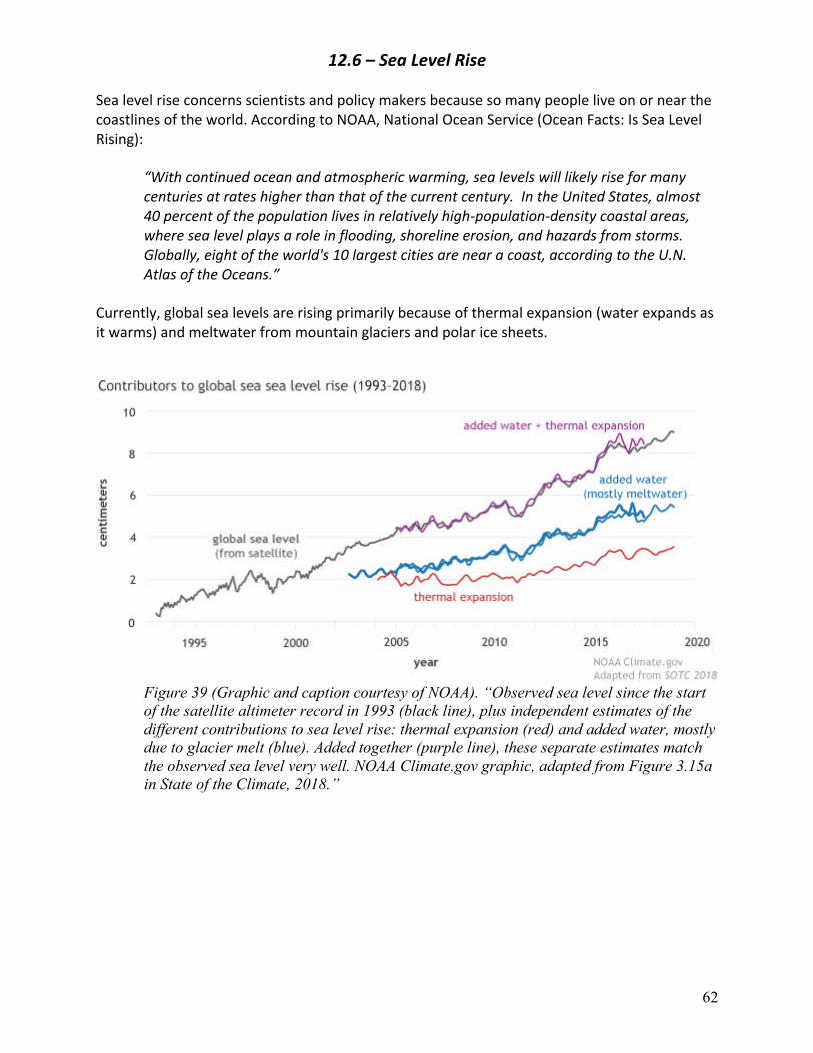
62
12.6–SeaLevelRise
Sealevelriseconcernsscientistsandpolicymakersbecausesomanypeopleliveonornearthecoastlinesoftheworld.AccordingtoNOAA,NationalOceanService(OceanFacts:IsSeaLevelRising):
“Withcontinuedoceanandatmosphericwarming,sealevelswilllikelyriseformanycenturiesatrateshigherthanthatofthecurrentcentury.IntheUnitedStates,almost40percentofthepopulationlivesinrelativelyhigh-population-densitycoastalareas,wheresealevelplaysaroleinflooding,shorelineerosion,andhazardsfromstorms.Globally,eightoftheworld's10largestcitiesarenearacoast,accordingtotheU.N.AtlasoftheOceans.”
Currently,globalsealevelsarerisingprimarilybecauseofthermalexpansion(waterexpandsasitwarms)andmeltwaterfrommountainglaciersandpolaricesheets.
Figure 39 (Graphic and caption courtesy of NOAA). “Observed sea level since the start of the satellite altimeter record in 1993 (black line), plus independent estimates of the different contributions to sea level rise: thermal expansion (red) and added water, mostly due to glacier melt (blue). Added together (purple line), these separate estimates match the observed sea level very well. NOAA Climate.gov graphic, adapted from Figure 3.15a in State of the Climate, 2018.”
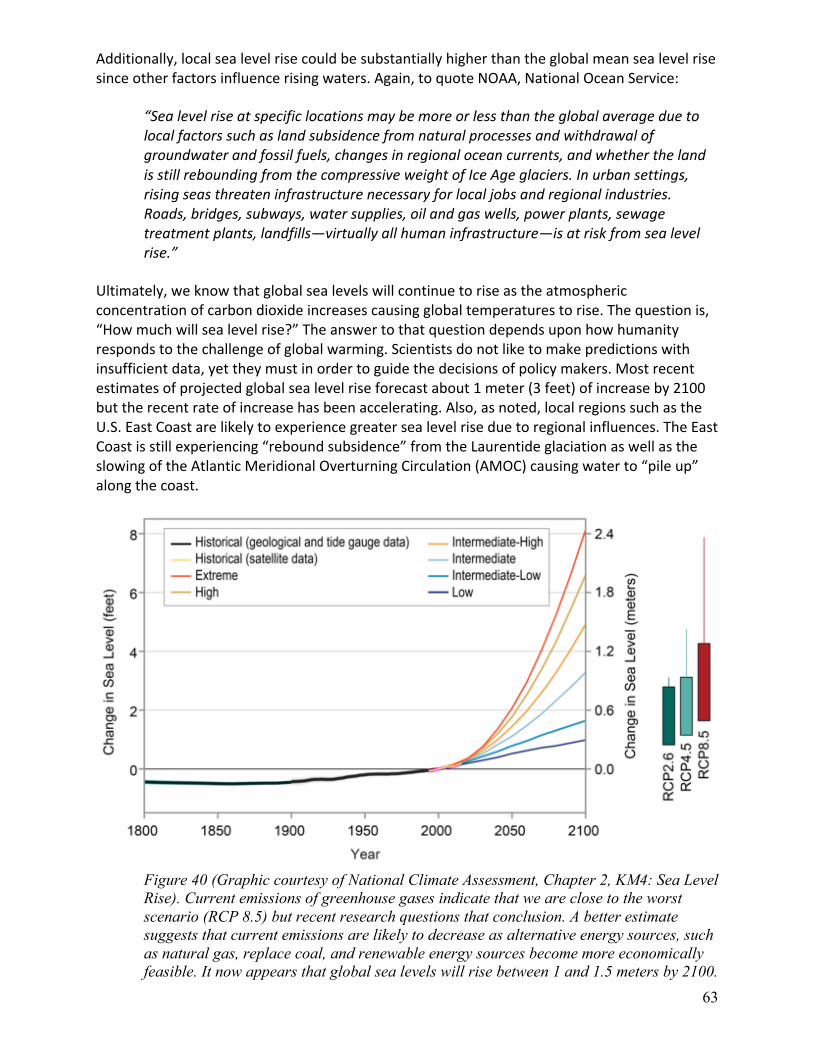
63
Additionally,localsealevelrisecouldbesubstantiallyhigherthantheglobalmeansealevelrisesinceotherfactorsinfluencerisingwaters.Again,toquoteNOAA,NationalOceanService:
“Sealevelriseatspecificlocationsmaybemoreorlessthantheglobalaverageduetolocalfactorssuchaslandsubsidencefromnaturalprocessesandwithdrawalofgroundwaterandfossilfuels,changesinregionaloceancurrents,andwhetherthelandisstillreboundingfromthecompressiveweightofIceAgeglaciers.Inurbansettings,risingseasthreateninfrastructurenecessaryforlocaljobsandregionalindustries.Roads,bridges,subways,watersupplies,oilandgaswells,powerplants,sewagetreatmentplants,landfills—virtuallyallhumaninfrastructure—isatriskfromsealevelrise.”
Ultimately,weknowthatglobalsealevelswillcontinuetoriseastheatmosphericconcentrationofcarbondioxideincreasescausingglobaltemperaturestorise.Thequestionis,“Howmuchwillsealevelrise?”Theanswertothatquestiondependsuponhowhumanityrespondstothechallengeofglobalwarming.Scientistsdonotliketomakepredictionswithinsufficientdata,yettheymustinordertoguidethedecisionsofpolicymakers.Mostrecentestimatesofprojectedglobalsealevelriseforecastabout1meter(3feet)ofincreaseby2100buttherecentrateofincreasehasbeenaccelerating.Also,asnoted,localregionssuchastheU.S.EastCoastarelikelytoexperiencegreatersealevelriseduetoregionalinfluences.TheEastCoastisstillexperiencing“reboundsubsidence”fromtheLaurentideglaciationaswellastheslowingoftheAtlanticMeridionalOverturningCirculation(AMOC)causingwaterto“pileup”alongthecoast.
Figure 40 (Graphic courtesy of National Climate Assessment, Chapter 2, KM4: Sea Level Rise). Current emissions of greenhouse gases indicate that we are close to the worst scenario (RCP 8.5) but recent research questions that conclusion. A better estimate suggests that current emissions are likely to decrease as alternative energy sources, such as natural gas, replace coal, and renewable energy sources become more economically feasible. It now appears that global sea levels will rise between 1 and 1.5 meters by 2100.
64
Chapter13–WhyScientistsAreWorried:ExtremeWeatherEvents
Overthepastdecade,scientistshaveestablishedalinkbetweenglobalwarmingandextremeweathereventsandevidencefortheconnectionbetweenglobalwarminggrowsstrongereachday.Extremeweathereventsthathavebeenlinkedtoglobalwarminginclude,tropicalcyclones,heatwaves,droughts,intenserainfallevents,flooding,wildfires,andevenwinterblizzards.Possiblelinkstootherextremeweathereventssuchastornadoescannotberuledout.Thetollfortheseeventsispaidnotjustinhumansufferinganddeathbutinhugeamountsofeconomicresources.
ThefollowingexcerptfromtheNationalAcademiesofSciences,EngineeringandMedicine,“BasedonScience”articleentitled,“Globalwarmingismakingextremeweathereventsworse”,summarizesthetopicnicely:
“AsEarth’sclimatehaswarmed,anewpatternofmorefrequentandmoreintenseweathereventshasunfoldedaroundtheworld.Scientistsidentifytheseextremeweathereventsbasedonthehistoricalrecordofweatherinaparticularregion.Theyconsiderextremeweathereventstobethosethatproduceunusuallyhighorlowlevelsofrainorsnow,temperature,wind,orothereffects.Typically,theseeventsareconsideredextremeiftheyareunlike90%or95%ofsimilarweathereventsthathappenedbeforeinthatsamearea.
Globalwarmingcancontributetotheintensityofheatwavesbyincreasingthechancesofveryhotdaysandnights.Warmingairalsoboostsevaporation,whichcanworsendrought.Moredroughtcreatesdryfieldsandforeststhatarepronetocatchingfire,andincreasingtemperaturesmeanalongerwildfireseason.Globalwarmingalsoincreaseswatervaporintheatmosphere,whichcanleadtomorefrequentheavyrainandsnowstorms.
Awarmerandmoremoistatmosphereovertheoceansmakesitlikelythatthestrongesthurricaneswillbemoreintense,producemorerainfall,andpossiblybelarger.Inaddition,globalwarmingcausessealeveltorise,whichincreasestheamountofseawater,alongwithmorerainfall,thatispushedontoshoreduringcoastalstorms.Thatseawater,alongwithmorerainfall,canresultindestructiveflooding.Whileglobalwarmingislikelymakinghurricanesmoreintense,scientistsdon’tknowyetifglobalwarmingisincreasingthenumberofhurricaneseachyear.Theeffectofglobalwarmingonthefrequency,intensity,size,andspeedofhurricanesremainsasubjectofscientificresearch.”
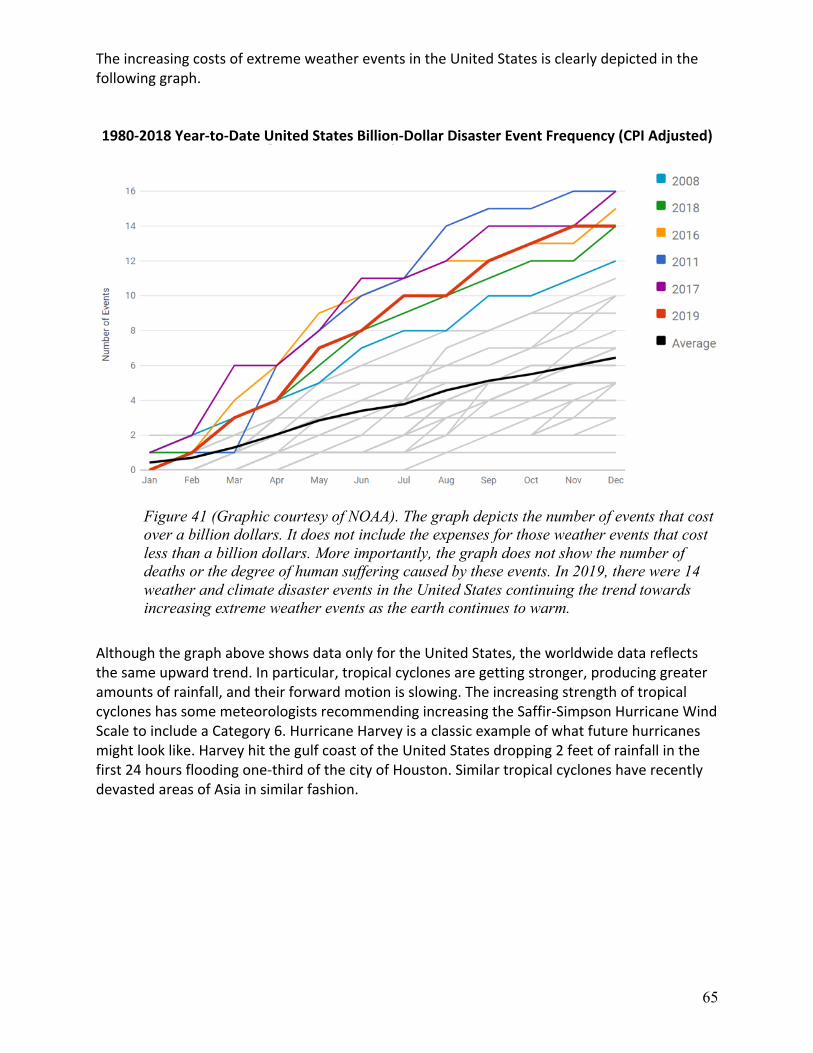
65
TheincreasingcostsofextremeweathereventsintheUnitedStatesisclearlydepictedinthefollowinggraph. 1980-2018Year-to-DateUnitedStatesBillion-DollarDisasterEventFrequency(CPIAdjusted)
Figure 41 (Graphic courtesy of NOAA). The graph depicts the number of events that cost over a billion dollars. It does not include the expenses for those weather events that cost less than a billion dollars. More importantly, the graph does not show the number of deaths or the degree of human suffering caused by these events. In 2019, there were 14 weather and climate disaster events in the United States continuing the trend towards increasing extreme weather events as the earth continues to warm.
AlthoughthegraphaboveshowsdataonlyfortheUnitedStates,theworldwidedatareflectsthesameupwardtrend.Inparticular,tropicalcyclonesaregettingstronger,producinggreateramountsofrainfall,andtheirforwardmotionisslowing.TheincreasingstrengthoftropicalcycloneshassomemeteorologistsrecommendingincreasingtheSaffir-SimpsonHurricaneWindScaletoincludeaCategory6.HurricaneHarveyisaclassicexampleofwhatfuturehurricanesmightlooklike.HarveyhitthegulfcoastoftheUnitedStatesdropping2feetofrainfallinthefirst24hoursfloodingone-thirdofthecityofHouston.SimilartropicalcycloneshaverecentlydevastedareasofAsiainsimilarfashion.

66
Chapter14–WhatCanWeDoAboutGlobalWarmingandClimateChange
The secret of getting ahead is getting started. Mark Twain
14.1–Adaptation,Mitigation,andGeoengineering
Climatechangeaffectseveryone,whichmeansthateveryonemustengagethisthreat.However,beingpractical,onlygovernmentshavetheresourcestosignificantlyaddresstheprobleminameaningfulwayandthereareonlythreestrategiesavailable:adaptation,mitigation,andgeoengineering.14.1.1 Adaptation.Adaptationinvolvesanticipatingtheadverseeffectsofclimatechangeand
takingappropriateactiontopreventorminimizethedamagetheycancause.Examplesofadaptationinclude:usingscarcewaterresourcesmoreefficiently;adaptingbuildingcodesdesignedtominimizedamagefromextremeweatherevents;buildingflooddefenses,suchasbermsordikes;raisingthelevelsofroadwaysandbridges;developingdrought-tolerantcrops;choosingtreespeciesandforestrypracticeslessvulnerabletostormsandfires;andsettingasidelandcorridorstohelpspeciesmigrate.Adaptationcanalsomeantakingadvantageofopportunitiesthatmayarisefromglobalwarmingandclimatechange.Forexample,alongergrowingseasoncanoffsetsomeofthenegativeimpactsglobalwarmingcanhaveoncrops.Inonesense,adaptationisaneasysell.Whensealevelrisecreatesproblems,asithasfortheU.S.NavyatitsNorfolkNavalbase,thesolutionisnotonlyobviousbutimmediatelynecessary.TheNavyhasspentabout$250milliontoraisetwopiersjusttoaccommodateitsshipsandwillhavetomakefurtheradjustments.NewYorkCitysufferedcostlydamagefromSuperStormSandyandseveralplanshavebeenfloatedtoadapttofuturestormsurges.Thelatestisa$119billionproposalfromtheU.S.ArmyCorpsofEngineerstoprotectNewYorkandNewJersey,aplanthathasmanycriticsbecauseofthescaleandcost.Coastalcitiesworldwideareinvestigatingvariousplanstoadapttosealevelrisebutifaroadwayregularlyfloodswithastronomicalhightides,thesolutionisclearandnecessary–raisetheroadway.Asnecessaryasadaptivesolutionsmightbe,theyhaveonefatalflaw:Adaptationdealsonlywiththeeffectsofclimatechange,notthecause.Adaptationstrategiesareultimatelydoomedtofailwithoutaddressingthesourceoftheproblem–humanemissionsofgreenhousegases.Buildingasixfootwalliseffective…untilsealevelsrisesevenfeet.
67
14.1.2 Mitigation.Mitigationactuallydealswiththecauseofglobalwarmingandinvolvesstrategiesdesignedtoreducetheeffectsofhuman-causedglobalwarmingandclimatechange.ThefollowingquotesaretakenfromtheFourthNationalClimateAssessment,MitigationSection,Introduction:
“Mitigationreferstoactionsthatreducethehumancontributiontotheplanetarygreenhouseeffect.Mitigationactionsincludeloweringemissionsofgreenhousegaseslikecarbondioxideandmethane,andparticleslikeblackcarbon(soot)thathaveawarmingeffect.Increasingthenetuptakeofcarbondioxidethroughland-usechangeandforestrycanmakeacontributionaswell.Asawhole,humanactivitiesresultinhigherglobalconcentrationsofgreenhousegasesandtoawarmingoftheplanet–andtheeffectisincreasedbyvariousself-reinforcingcyclesintheEarthsystem(suchasthewaymeltingseaiceresultsinmoredarkoceanwater,whichabsorbsmoreheat,andleadstomoreseaiceloss).”
“Theamountoffutureclimatechangewilllargelybedeterminedbychoicessocietymakesaboutemissions.Loweremissionsofheattrappinggasesmeanlessfuturewarmingandlesssevereimpacts.Emissionscanbereducedthroughimprovedenergyefficiencyandswitchingtolow-carbonornon-carbonenergysources.”
14.1.3 Geoengineering.Scientistsareconcernedthateffortstomitigateclimatechangemight
notbesufficienttopreventthedisastrousconsequencesthatappeartobeinourfuture.Ifmitigationfailstostopemissionsofgreenhousegases,wemighthavetoresorttogeoengineering:deliberatelymanipulatingphysical,chemical,orbiologicalaspectsoftheearth’sclimatesystemtoreducetheeffectsofglobalwarming.AccordingtothePolicyStatementoftheAmericanMeteorologicalSociety:
“Geoengineeringcouldlowergreenhousegasconcentrations,provideoptionsforreducingspecificclimateimpacts,orofferstrategiesoflastresortifabrupt,catastrophic,orotherwiseunacceptableclimate-changeimpactsbecomeunavoidablebyothermeans.However,researchtodatehasnotdeterminedwhethertherearelarge-scalegeoengineeringapproachesthatwouldproducesignificantbenefits,orwhetherthosebenefitswouldsubstantiallyoutweighthedetriments.Indeed,geoengineeringmustbeviewedwithcautionbecausemanipulatingtheEarthsystemhasconsiderablepotentialtotriggeradverseandunpredictableconsequences.
Geoengineeringproposalsfallintoatleastthreebroadcategories:1)reducingthelevelsofatmosphericgreenhousegasesthroughlarge-scalemanipulations(e.g.,oceanfertilizationorafforestationusingnon-nativespecies);2)exertingacoolinginfluenceonEarthbyreflectingsunlight(e.g.,puttingreflectiveparticlesintotheatmosphere,puttingmirrorsinspace,increasingsurfacereflectivity,oralteringtheamountorcharacteristicsofclouds);and3)otherlarge-scalemanipulationsdesignedtodiminishclimatechangeoritsimpacts(e.g.,constructingverticalpipesintheoceanthatwouldincreasedownwardheattransport).
68
Geoengineeringproposalsdifferwidelyintheirpotentialtoreduceimpacts,createnewrisks,andredistributeriskamongnations.TechniquesthatremoveCO2directlyfromtheairwouldconferglobalbenefitsbutcouldalsocreateadverselocalimpacts.ReflectingsunlightwouldlikelyreduceEarth’saveragetemperaturebutcouldalsochangeglobalcirculationpatternswithpotentiallyseriousconsequencessuchaschangingstormtracksandprecipitationpatterns.Aswithinadvertenthuman-inducedclimatechange,theconsequencesofreflectingsunlightwouldalmostcertainlynotbethesameforallnationsandpeoples,thusraisinglegal,ethical,diplomatic,andnationalsecurityconcerns.Explorationofgeoengineeringstrategiesalsocreatespotentialrisks.Thepossibilityofquickandseeminglyinexpensivegeoengineeringfixescoulddistractthepublicandpolicymakersfromcriticallyneededeffortstoreducegreenhousegasemissionsandbuildsociety’scapacitytodealwithunavoidableclimateimpacts.Developinganynewcapacity,includinggeoengineering,requiresresourcesthatwillpossiblybedrawnfrommoreproductiveuses.Geoengineeringtechnologies,oncedeveloped,mayenableshort-sightedandunwisedeploymentdecisions,withpotentiallyseriousunforeseenconsequences.
Evenifreasonablyeffectiveandbeneficialoverall,geoengineeringisunlikelytoalleviatealloftheseriousimpactsfromincreasinggreenhousegasemissions.Forexample,enhancingsolarreflectionwouldnotdiminishthedirecteffectsofelevatedCO2concentrationssuchasoceanacidificationorchangestothestructureandfunctionofbiologicalsystems.”
14.1.4 ProjectDrawdown.ProjectDrawdownisacomprehensivemitigationprojectinitiatedbyPaulHawkenandclimateactivistAmandaJoyRavenhill.Theprojectfocuseson100solutionsthatarecurrentlytechnologicallyviableandlistedaccordingtotheamountofcarbontheywouldremovefromtheenvironment.
ThebookDrawdown:TheMostComprehensivePlanEverProposedToReverseGlobalWarmingisamustreadforanyoneinterestedinsolutionstotheproblemofhumancausedglobalwarming.AccordingtoProjectDrawdown:
“Drawdowndescribesthe100mostsubstantivesolutionstoglobalwarming.Foreachsolution,wedescribeitshistory,thecarbonimpactitprovides,therelativecostandsavings,thepathtoadoption,andhowitworks.ThegoaloftheresearchthatinformsDrawdownistodetermineifwecanreversethebuildupofatmosphericcarbonwithinthirtyyears.Allsolutionsmodeledarealreadyinplace,wellunderstood,analyzedbasedonpeer-reviewedscience,andareexpandingaroundtheworld.”
69
Chapter15–Conclusion“Thegoodthingaboutscienceisthatit’struewhetherornotyoubelieveinit.”
NeildeGrasseTyson
15.1–Scienceand“Uncertainty”Askepticmightsay,“Butareyou100%certainthatyouknowthefinalspeedofafallingobject?”Goodpoint,but“certainty”doesnotexistintherealmofscience,andthatisagoodthing.Inscience,thereisnodogmaandnounerringauthoritywhoproclaimsthetruth.Scienceisevidence-basedandalltheoriesareconditionallyacceptedbaseduponcurrentevidence,whichensuresthatscienceishonestandself-correcting.Scientistsmustalwaysallowforthepossibilitythatevidencefromacurrentlyunknownvariableexiststhatcouldinfluencetheirposition.Thisiswhyscientificknowledgegrowsandissosuccessfulatexplainingnature.Scientistsdonottalkabout100%certaintyregardinganythinginnature,theyspeakintermsofprobabilityorlevelofconfidence–thingswewouldcall“likelihood”.Butthisdoesnotmeanscienceis“unsure”ofitsbeliefs.Let’slookattheterminalvelocityofanobjectfallingtoearth.Wealreadyknowtheformulaforaccelerationduetogravity(a=32ft/s2)butarescientistsabsolutely“certain”thisformulapredictstheterminalvelocityofahumanfallingfromatwo-thousandfoottower?No,theyarenot,becauseothervariableswillinfluencetheterminalvelocity.Foronething,airresistancewillslowtheobject.Theshapeandmassoftheobject,surfaceareaexposedtoairresistance,humidity,precipitation,andotherfactorsallinfluencefinalvelocity.Forexample,aspidercanjumpfromthat2000foottower,landandwalkawayunharmed.Itsmassissmallanditssurfaceareawithhairylegssplayedoutprovidessufficientairresistancetoslowitsfinalvelocitytoasurvivablespeed.But,knowingthatthereissomeuncertaintyinvolvedinpredictingtheterminalvelocityofahumaninfreefall,wouldyoustepconfidentlyoffthetowerthinkingyourfatewouldbesimilartothespider?Ofcoursenot.Thedegreeofuncertaintyisinsignificantrelativetothedangerandscientistscanprovideyouwithapredictedterminalvelocitythatwillbeveryclosetoarealworldevent.Foratypicalhuman,thebodywillreach99%ofterminalvelocityafterfalling2,000feet,whichtakesanywherefrom10-14seconds,andthevelocitywillbebetween118and125milesperhour.Andyes,scientistsareextremelyconfidentinthatprediction.Justasscientistsare99%confidentintheterminalvelocityofafallingobjectonearth,theyareequally99%confidentthathumanactivitiesarethecauseofthecurrentglobalwarmingandclimatechange.Thequestionsscientistsarenowconcernedwithinvolvehowmuchtheearthwillwarm,howquicklyitwillhappen,andhowthiswarmingwillimpactlifeasweknowit.Scientiststermthis“climatesensitivity”.Unfortunately,virtuallyeverymonth,newstudiessuggestthattheearth’sclimateismuchmoresensitivethantheIPCCpredictions.Itisliterallytruethatfossilfuelshaveprovideduswiththestandardoflivingweenjoytoday.Butthefossilfuelindustryisa19thcenturytechnologythatnowthreatensourveryexistence.Itistimetodevelopa21stcenturytechnology–onethatdoesnotincreasetheconcentrationofgreenhousegases.Thisisanopportunitywemustembrace–developinganeconomybaseduponrenewableenergyresources.Wehavethetechnologytoaccomplishthisandgrowtheworldeconomyinasociallyresponsibleway.Allweneednowisthewilltodoit.

70
Butifwefailtoengagethischallengetoday,wewillloseawindowofopportunitythatisquicklyclosing.Hopefully,thissummaryhasprovidedsomeofthenecessaryinformationtohelpusmakeinformeddecisions.Whetherweareteachers,policymakers,orstudentswewillbeforcedtolivewiththedecisionswemake,orfailtomake,today.Tomorrowwillbetoolate.
71
Epilogue
TheEpilogueforthestoryofanthropogenicclimatechangemustbewrittenbyfuturegenerations.ThefollowingquoteistakenfromamonumentrecentlyerectedinIcelandcommemoratingthedeathofOk,anIcelandicglacier“killed”byglobalwarming.
“Ok is the first Icelandic glacier to lose its status as a glacier.
In the next 200 years all our glaciers are expected to follow the same path.
This monument is to acknowledge that we know what is happening and what needs to be done.
Only you know if we did it.”