Embed Size (px)
DESCRIPTION
GLOBAL CLIMATE CHANGE A Warming Planet?. 13. STUDENT LEARNING OUTCOMES. After reading this chapter, students will be able to. - PowerPoint PPT Presentation
Citation preview

PowerPoint® Lecture prepared by Gary A. Beluzo
GLOBAL CLIMATE CHANGE A Warming Planet?
13

Copyright © 2007 McGraw-Hill Publishing Company
STUDENT LEARNING OUTCOMESAfter reading this chapter, students will be able to
• Identify the factors that affect the amount of energy that enters and leaves the Earth’s atmosphere and how this affects global temperature.
• Explain the effect of human activity on climate based changes in storages and flows in global biogeochemical cycles.
• Explain how detection and attribution are critical to climate change policy.
• Describe the positive and negative effects of climate change on environmental and economic systems.
• Describe the factors that determine economically efficient climate change policy and what it implies about the Kyoto Protocol.

Copyright © 2007 McGraw-Hill Publishing Company
Climate Change and Norse Settlements
• Norse farmers set up colonies in Iceland, Greenland, Newfoundland, and North America.
• Settlement began in Medieval Warm Period
• On Greenland the Norse settlements persisted for 450 years (984 to sometime in early 1400s)
• Greenland Norse disappeared suddenly
• Arrival of the Inuit and the Little Ice Age
• Less farming and more reliant on local wildlife but Inuit better hunters
• Lack of food confirmed by bones

Copyright © 2007 McGraw-Hill Publishing Company
Climate versus Weather
WeatherWeather• Atmospheric conditions at
particular place and time
• How it changes from day to day
• Temperature, precipitation, wind speed, cloud cover, humidity, etc
ClimateClimate• Average weather conditions
over a long period
• Repeating pattern of weather
• Average temperature and average precipitation
Climate Change Climate Change is a shift in the long-run average of weather
Copyright © 2007 McGraw-Hill Publishing Company
Climate Change- Rule not Exception

Copyright © 2007 McGraw-Hill Publishing Company
The Heat Balance of Planet EarthClimate Change is caused by a change in the planet’s
heat balance (energy in versus energy out).

Copyright © 2007 McGraw-Hill Publishing Company
The Greenhouse Effect
• The ability of the atmosphere to absorb energy with longer wavelengths and convert it to heat
• Natural phenomena that warms the lower atmosphere by about 35 degrees Celsius
• Greenhouse gases • Water vapor (H2O)
• Carbon dioxide (CO2)
• Methane (CH4)
• Nitrous Oxide (N2O)
• Chlorofluorocarbons (CFCs) not natural
• Particles and Aerosols

Copyright © 2007 McGraw-Hill Publishing Company
Radiative Forcing

Copyright © 2007 McGraw-Hill Publishing Company
Residence Time

Copyright © 2007 McGraw-Hill Publishing Company
Hemispheric Radiative Forcing• Greenhouse gases well
mixed throughout entire atmosphere
• Sulfate aerosols have variable residence time; and incomplete mixing
Figure 13.4a
Figure 13.4bFigure 13.4c

Copyright © 2007 McGraw-Hill Publishing Company
Greenhouse Gases
Figure 13.5a Figure 13.5b
Figure 13.5c Figure 13.5d

Copyright © 2007 McGraw-Hill Publishing Company
Carbon Dioxide, Methane, and Temperature
Figure 13.6

Copyright © 2007 McGraw-Hill Publishing Company
Disrupting the Global Carbon Cycle• Nearly all greenhouse gases and sulfur aerosols at or
near maximum value observed over last 500,000 years
• Largely due to human activities that have disrupted the global biogeochemical cycles of C,N, and S.
• Carbon (as CO2 and CH4)• Fossil fuel combustion (coal releases the most)
• Coal mining
• Land-Use Change (deforestation and agriculture)
• Landfills

Copyright © 2007 McGraw-Hill Publishing Company
Carbon Dioxide Futures
Figure 13.7

Copyright © 2007 McGraw-Hill Publishing Company
Disrupting the Global Sulfur Cycle
• Coal combustion
• Reflect sunlight and enhance cloud formation
• Will sulfur emissions Increase or Decrease?
• Pollution abatement technologies are promising
• But emissions could increase if world coal increases

Copyright © 2007 McGraw-Hill Publishing Company
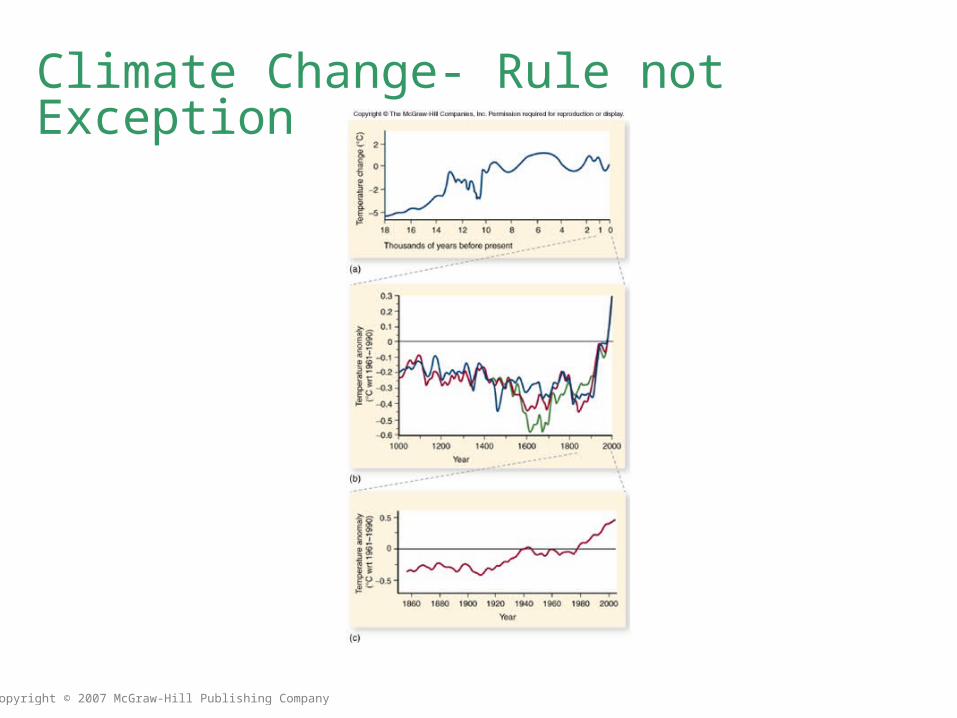
Detecting Climate Change
• Choose an indicator• Direct measurement of mean annual global temperature
• Sea level change
• Size of glaciers
• Remote Sensing of Vegetation (growing season and biomass)
• Organism behavior (migrations, leaf out, onset of breeding)
• Measure the mean and natural variability
• Are recent changes greater than expected based on natural variability?
Copyright © 2007 McGraw-Hill Publishing Company
Detecting Climate Change

Copyright © 2007 McGraw-Hill Publishing Company
Detecting Climate Change
Figure 13.10

Copyright © 2007 McGraw-Hill Publishing Company
Attribution• Establishing cause and effect relationship between
human activity and the observed change in climate.
• The IPCC suggests there is a discernible human influence on climate
• Statistical Analyses of Historical Data
Figure 13.11

Copyright © 2007 McGraw-Hill Publishing Company
Climate Models

Copyright © 2007 McGraw-Hill Publishing Company
The Role of Human Activity

Copyright © 2007 McGraw-Hill Publishing Company
The IPCC
An Interdisciplinary Effort To Make Climate Change Policy states “The warming over the past 100 years is very unlikely to be due to internal variability alone…and is unlikely to be entirely natural in origin…Detection and attribution studies consistently find evidence for anthropogenic signal in the climate record of the last 25-50 years…most of the observed warming over the last 50 years is likely to have been due to the increase in greenhouse gas concentrations.”

Copyright © 2007 McGraw-Hill Publishing Company
Skeptics?• Reluctance to slow down emissions?
• Incomplete understanding of the science?
• The State of Fear by Michael Crichton

Copyright © 2007 McGraw-Hill Publishing Company
Satellite/Thermometer Discrepancy

Copyright © 2007 McGraw-Hill Publishing Company
How Will Humans Affect Climate?• The 460,000 year climate
record shows a correlation between greenhouse gases and temperature
• But did one cause the other?
• “chicken-or-egg problem”
Copyright © 2007 McGraw-Hill Publishing Company
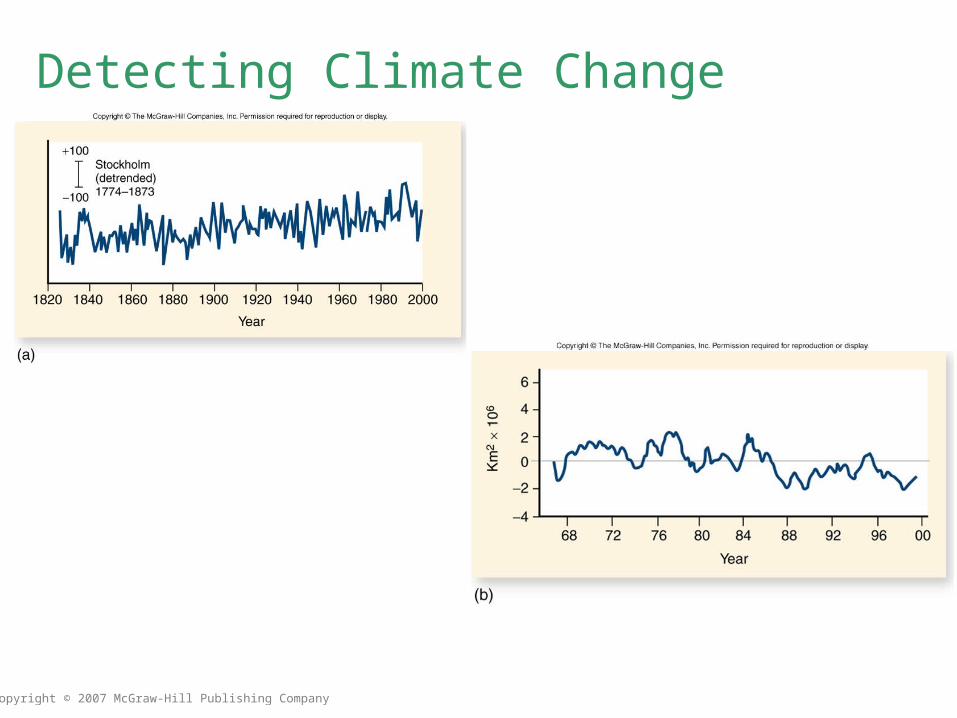
Why Does Temperature Rise?

Copyright © 2007 McGraw-Hill Publishing Company
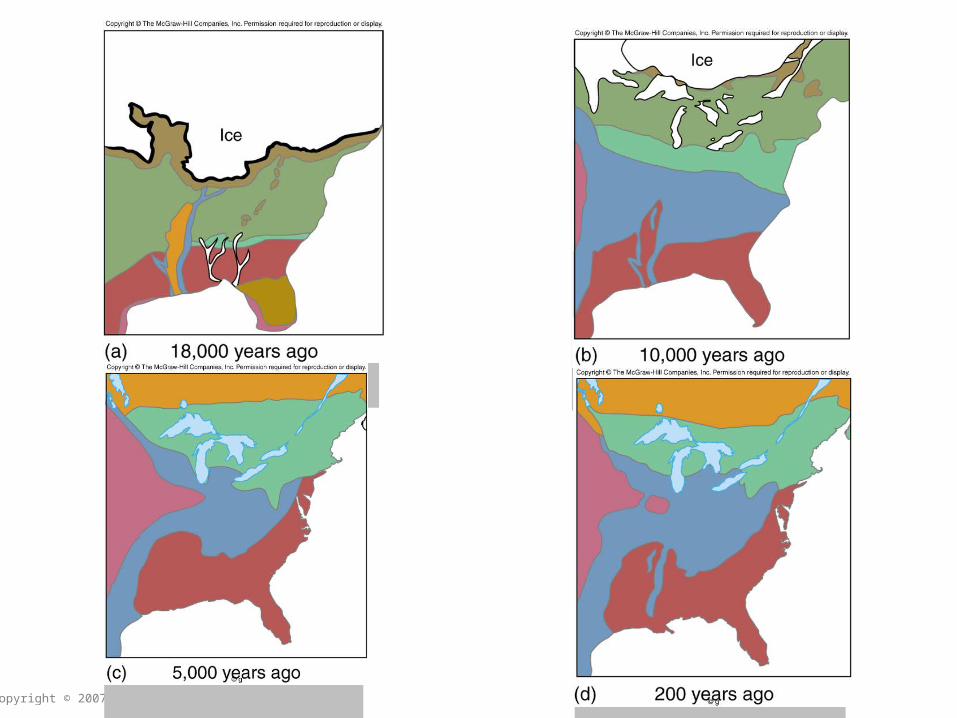
The Impacts of Global Climate Change• The 3.5 degree C rise in mean annual global
temperature from doubling in the radiative forcing similar to glacial to interglacial• Most of North America covered by ice
• Boreal forests covered what is now North Carolina
• As climate warmed 10,000 years ago, tree species shifted their range north about 100-400 meters/year
Copyright © 2007 McGraw-Hill Publishing Company
Figure 13.18a
Figure 13.18c
Figure 13.18b
Figure 13.18d
Copyright © 2007 McGraw-Hill Publishing Company
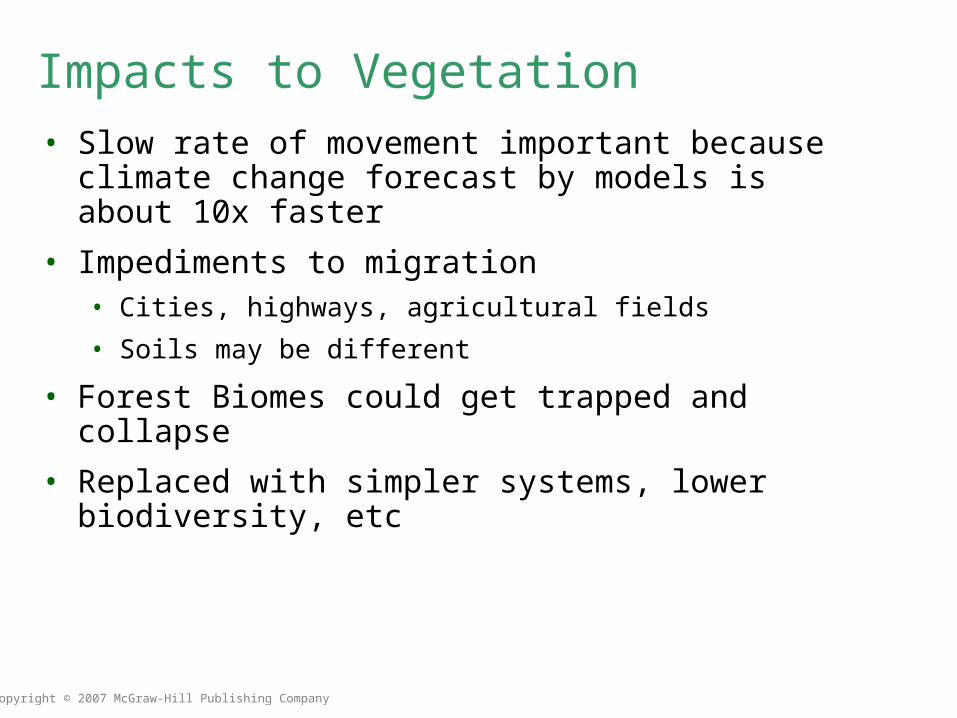
Impacts to Vegetation• Slow rate of movement important because climate
change forecast by models is about 10x faster
• Impediments to migration• Cities, highways, agricultural fields
• Soils may be different
• Forest Biomes could get trapped and collapse
• Replaced with simpler systems, lower biodiversity, etc
Copyright © 2007 McGraw-Hill Publishing Company
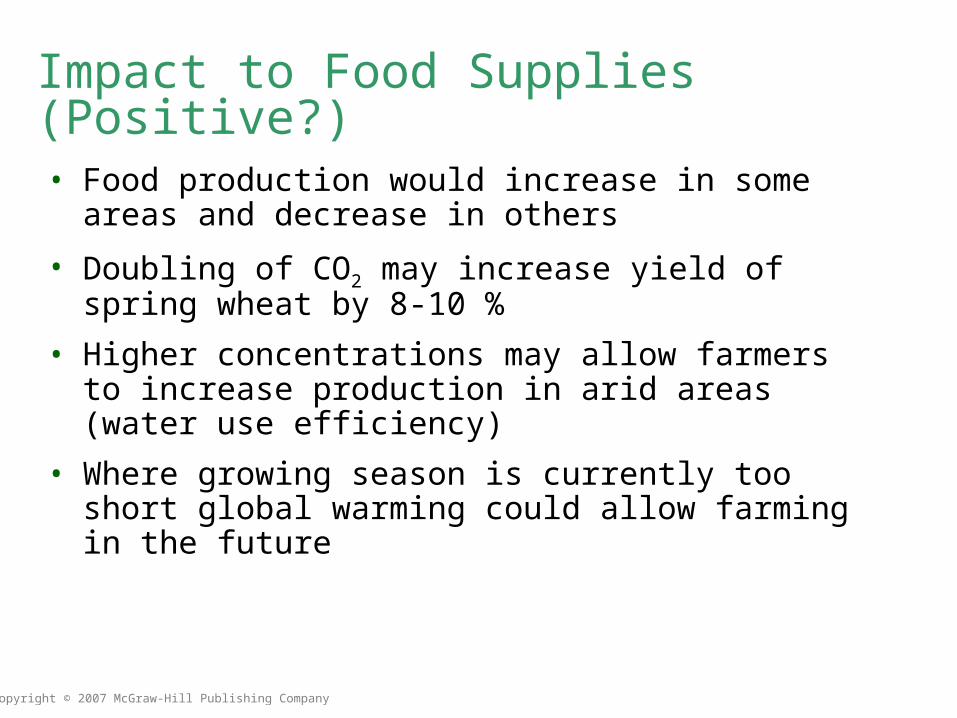
Impact to Food Supplies (Positive?)
• Food production would increase in some areas and decrease in others
• Doubling of CO2 may increase yield of spring wheat by 8-10 %
• Higher concentrations may allow farmers to increase production in arid areas (water use efficiency)
• Where growing season is currently too short global warming could allow farming in the future

Copyright © 2007 McGraw-Hill Publishing Company
Impact to Food Supplies (Negative?)
• Most of world’s best agricultural areas are located in the middle of continents- these are forecast to dry
• More suitable habitats for pests and diseases in the future

Copyright © 2007 McGraw-Hill Publishing Company
Rising Seas
• IPCC forecasts sea level will rise about 0.39 meters• 0.29m is due to thermal expansion
• 0.11m is due to melting of mountain glaciers and icecaps
• Complete melting of the Antarctic and Greenland ice sheets would raise sea levels by 70 meters
• 20% of world’s population lives within 30 km of ocean and 40% live within 100 km
• 0.5 meter rise could destroy $20-150 billion human infrastructure in the U.S.
• Also reduce area and productivity of estuaries and coastal wetlands

Copyright © 2007 McGraw-Hill Publishing Company
Species Extinction
• Toads first species to go extinct due to climate change
• High altitudes in Central American cloud forests
• 9-52% of world’s known terrestrial species could go extinct
• Climate envelope
• Worst case: 38-52%
• Best case: 9-13%
• World corals?

Copyright © 2007 McGraw-Hill Publishing Company
Climate Change Policy• Human Activity is changing climate
• Our activities now will result in future changes
• Policy can only slow not prevent climate changes
• Not economical to eliminate all activities that emit greenhouse gases
• Optimal level of pollution

Copyright © 2007 McGraw-Hill Publishing Company
Damage Functions

Copyright © 2007 McGraw-Hill Publishing Company
The Kyoto Protocol: A First Step?