Embed Size (px)
Citation preview
Journal of Geodynamics 39 (2005) 317–336
Geodetic and hydrological aspects of the Meranoearthquake of 17 July 2001
Alessandro Caporalia,∗, Carla Braitenbergb, Matteo Massironia
a Dipartimento di Geologia, Paleontologia e Geofisica, Universit`a di Padova, Italyb Dipartimento di Scienze della Terra, Universit`a di Trieste, Italy
Received 10 June 2004; received in revised form 9 December 2004; accepted 5 January 2005
Abstract
Even a relatively small earthquake can become a study case if the seismological data are augmented with non-conventional information, such as geodetic and hydrological data. This could be the case of theM= 4.8 earthquakeof 17 July 2001 with epicentre near Merano, in northern Italy, where a 4-year long time series of the permanentGPS station MERA, a few kilometers from the epicentre, and water table data from four wells within 8 km of theestimated epicenter are available. A steplike signal in the time series of the geodetic coordinates of MERA is foundto be simultaneous with the epoch of the earthquake. If such jump is interpreted as a coseismic displacement, thefault plane solution of this strike slip earthquake is constrained in a manner, which is consistent with the generaltectonic setting of the area. Geodetic and seismological data are used to constrain the depth of the hypocenter. Weshow that the fault dislocation data and the geodetic displacement of the GPS station clearly support the hypothesisof a shallow earthquake (<5 km depth), whereas purely seismological data set the hypocenter somewhere between0.5 and 18 km. Water level data from four wells in the epicentral area show small, random changes, which becomecoincident at the epoch of the earthquake. Assuming that the wells can be treated as hydraulic heads, we numericallycompute the strain field generated on the surface of an elastic half space subject to a localized stress drop on thefault. Using the published fault plane solution as a model of the excitation source we show that the form of thechanges of the water level are consistent with the one we predict numerically. Because all the wells, after correctionfor rain and air pressure, show a rise in the water level, they must be in a compressional sector and this helps innarrowing the number of candidate epicenters. We conclude that the addition of geodetic and hydrologic data to the
∗ Corresponding author.E-mail address:[email protected] (A. Caporali).
0264-3707/$ – see front matter © 2005 Elsevier Ltd. All rights reserved.doi:10.1016/j.jog.2005.01.001
318 A. Caporali et al. / Journal of Geodynamics 39 (2005) 317–336
seismological data enables, in this study case, both the hypocenter and the fault plane solution to be constrainedmore uniquely than with seismological data alone.© 2005 Elsevier Ltd. All rights reserved.
Keywords:GPS geodesy; Seismology; Hydrology; Structural geology
1. Introduction
TheM= 4.8 Merano earthquake struck the alpine city of Merano in South Tyrol at 15:06 UTC of17 July 2001. The event was recorded locally by the seismic networks of the Istituto Nazionale diGeofisica e Vulcanologia (INGV) in Rome, of the Centro Sismologico of the Istituto Nazionale diOceanografia e Geofisica Sperimentale (OGS) in Trieste, and the Eidgenossische Technische Hochschulein Zurich (ETHZ), Switzerland. The epicenter is near the northern border of the Italian territory, inan area of generally low seismicity. Being at the border of the existing national seismic networks ofthe Italian, Austrian and Swiss territories, the area is not well monitored seismically. This explains thesomewhat large differences of the epicentral locations computed by the different agencies (Table 1aand Fig. 1a). The focal mechanisms given by NEIC/CSEM (National Earthquake Information Cen-ter/European Mediterranean Seismological Center), INGV and ETHZ agree in the orientation of thetwo planes, bearing some differences in dip (Table 1b), and all suggest a sinistral strike slip compo-nent along a mid to high angle NNE fault, very likely belonging to the North Giudicarie system. TheNorth Giudicarie system is an important segment of the Periadriatic lineament, the tectonic divide be-tween the Alpine north-vergent collisional wedge and the South Alpine south-vergent thrust and foldbelt. A sinistral kinematics along the North Giudicarie inferred from the focal mechanisms of thisevent would completely agree with a northwards indentation of the Adria microplate or promontoryinto the Eurasian plate (Bressan et al., 1998; Regenauer-Lieb and Petit, 1997; Renner and Slejko, 1994).Hence the importance to understand as exactly as possible the geometry of the fault plane of this earth-quake.
The Merano earthquake is remarkable because, besides the seismologic data, two additional types ofdata are available. One is represented by the coordinates of the permanent GPS station MERA, locateddowntown Merano and hence within a few kilometers from the epicenter. The second consists of thewater table level measured at four wells at or near the valley of the river Adige, near Merano, again withina few kilometers from the epicenter. Both types of data seem to exhibit a peculiar behaviour at and nearthe epoch of the earthquake: the geodetic coordinates are discontinuous as for a point on an elastic blocknear a yielding point; the water table at the wells appears to change suddenly, as it would be expected foran hydraulic head responding to a sudden pressure change.
In this context it is natural to ask how and to which extent the geodetic and hydrological data contributein constraining the information coming from seismology. It will be shown that the observed pattern inthe well logs and the observed dislocation in the GPS station exclude some of the proposed epicenters.We will then combine the seismological, hydrological and geodetic data to infer a picture of the seismicevent, which is more detailed than that which could be obtained from the present seismologic dataalone.
A.Caporalietal./Jo
urnalofGeodynamics
39(2005)317–336
319
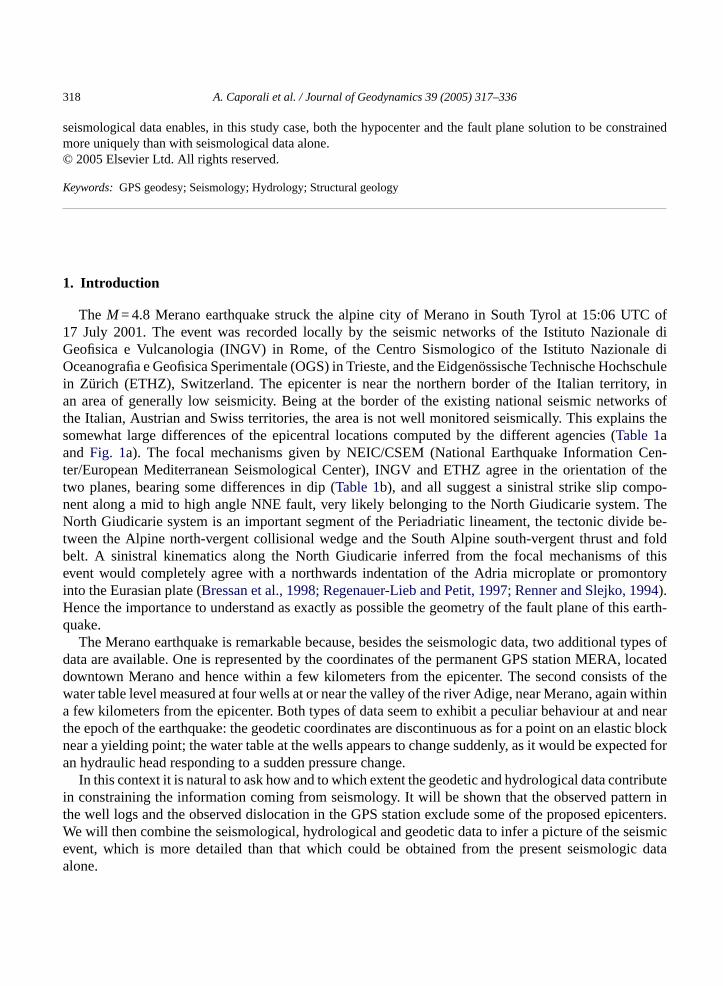
Table 1Different solutions of the hypocentral position of the event and fault plane mechanism: (a) hypocentral location and magnitude and (b) fault plane solutions
Analysis center North latitude East longitude Depth (km) Magnitude Reference
(a) hypocentral location and magnitudeNEIC 46.735◦ 11.201◦ 12 4.7 (Mw) http://neic.usgs.gov/neis/sopar/INGV 46.632◦ (error: 2.3 km) 11.049◦ (error: 1.9 km) 5 4.8 (Md) ftp://ftp.ingv.it/bollet/2001.datINGV RCMT 46.70± 0.01◦ 11.16± 0.01◦ 22 4.8 (Mw) http://www.ingv.it/seismoglo/RCMT/
2001/R071701A.html(Pondrelli et al., 2004)ETHZ 46.735◦ 11.201◦ 15± 5 4.8 (Mw) http://www.seismo.ethz.ch/momenttensor/
2001/0107171506.ap.3060s15kOGS 46.680◦ (error: 1.1 km) 11.098◦ (error: 1.1 km) 4.7± 1.3 5.2 (Md) http://www.crs.ogs.trieste.it/waveOld/
RSFVG/PRE/RSFVG-PRE.it.htmlCSEM 46.77◦ 11.40◦ 12 4.7 http://www.gfz-potsdam.de/pb2/pb24/emsc/
solutions/solution0107171506SSGH 46.650 11.133 1.6 5.1 This paper
Analysis center Seismic moment (/1016 N m) CMT First fault plane Second fault plane
Strike Rake Dip Strike Rake Dip
(b) fault plane solutionsNEIC/CSEM 1.2± 0.6 132 −141 55 17 −42 59ETHZ 1.4 116 163 77 210 14 74INGV RCMT 2.1 117 162 83 210 7 72SSGH 3.9 17 18 80
All the angles are in degrees. The geodetic, seismologic and hydrologic data constrain the epicenter to the value labeled SSGH (structural, seismological,geodetic and hydrological combined solution). The orientation of the first fault plane is in this case not given, as the dislocation model was applied to the secondfault plane, as suggested by structural and geodetic constraints.
320 A. Caporali et al. / Journal of Geodynamics 39 (2005) 317–336
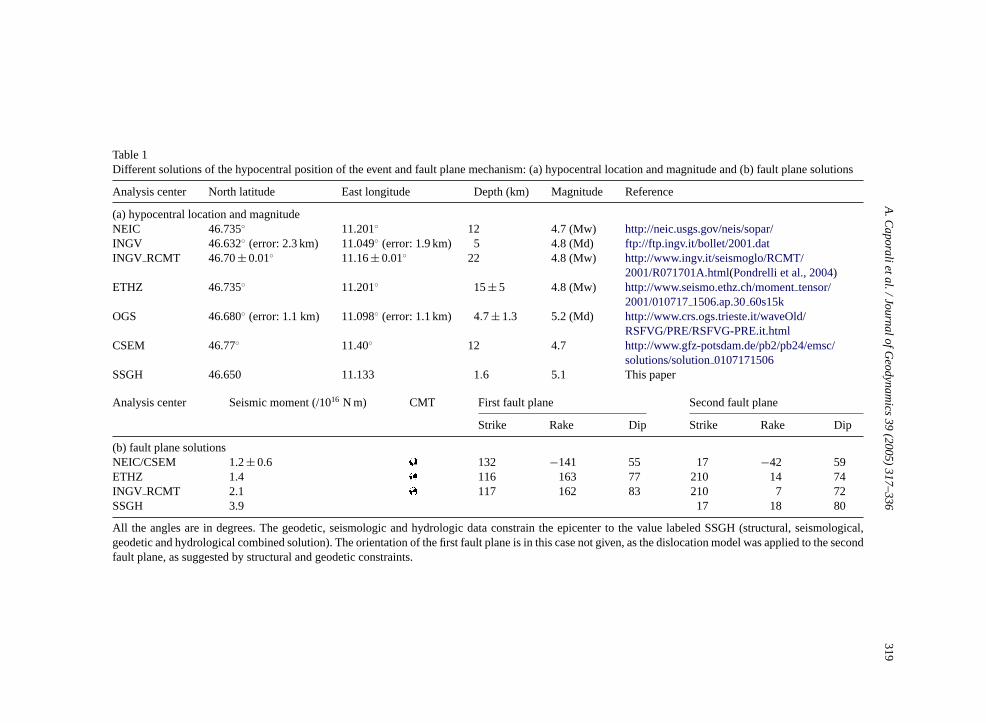
Fig. 1. (a) Topography of the Merano area (Autonome Provinz Bozen-Sudtirol, Amt fur uberortliche Raumordnung), showingfive estimated locations of the epicentre of the 2001 earthquake: INGVRCMT is the centroid location of the regional centroidmoment tensor of INGV (Pondrelli et al., 2004). ETHZ/NEIC is the estimate by the NEIC, which coincides with the value givenby the ETHZ. OGS, CSEM and INGV are the final locations found in the seismological bulletins of these Organizations. Thelocation SSGH (structural–seismologic–geodetic–hydrologic) is the one, which best fits the combined data set. It is intermediateto the location estimated by INGVRCMT, INGV and OGS. The corresponding coordinates are given inTable 1a. We also showthe location of two rain-gauges, both managed by the Autonomous Province of Bolzano (ME Obermais and ME Gratsch) andone GPS station. The inset shows the distribution of the seismologic stations used by the different agencies for determining theearthquake parameters. The Swiss agency ETHZ also used stations farther to the north, which fall outside the range of this map.(b) Detail of (a) with the four wells M201, M202, M203 and M701, and the two rain gauges.
A. Caporali et al. / Journal of Geodynamics 39 (2005) 317–336 321
2. Structural and seismological settings of the area and the Merano earthquake
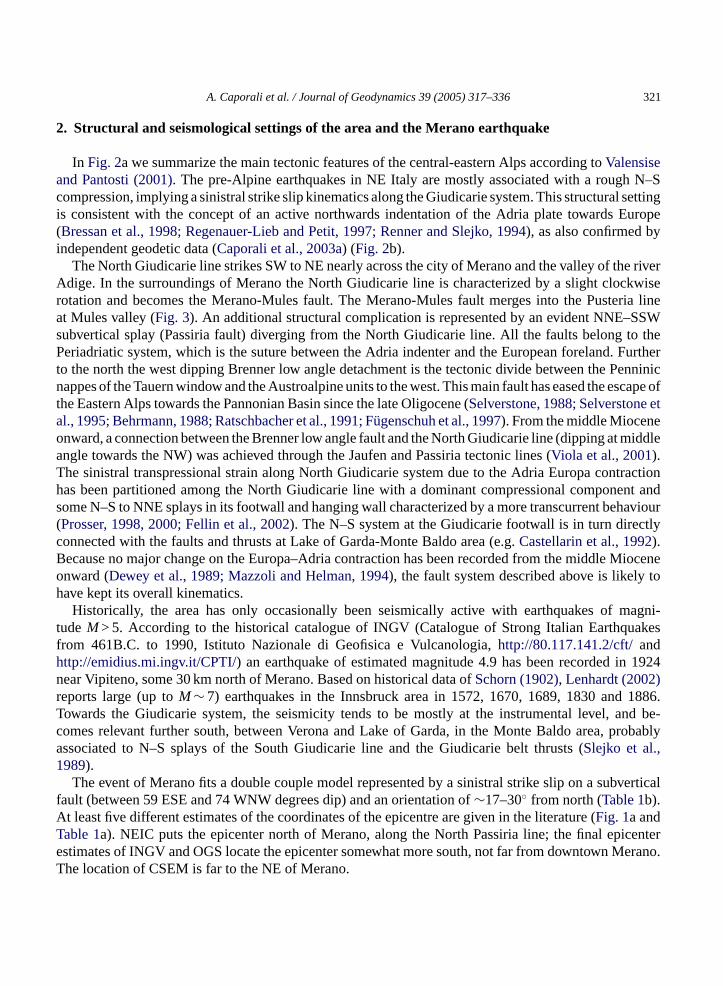
In Fig. 2a we summarize the main tectonic features of the central-eastern Alps according toValensiseand Pantosti (2001). The pre-Alpine earthquakes in NE Italy are mostly associated with a rough N–Scompression, implying a sinistral strike slip kinematics along the Giudicarie system. This structural settingis consistent with the concept of an active northwards indentation of the Adria plate towards Europe(Bressan et al., 1998; Regenauer-Lieb and Petit, 1997; Renner and Slejko, 1994), as also confirmed byindependent geodetic data (Caporali et al., 2003a) (Fig. 2b).
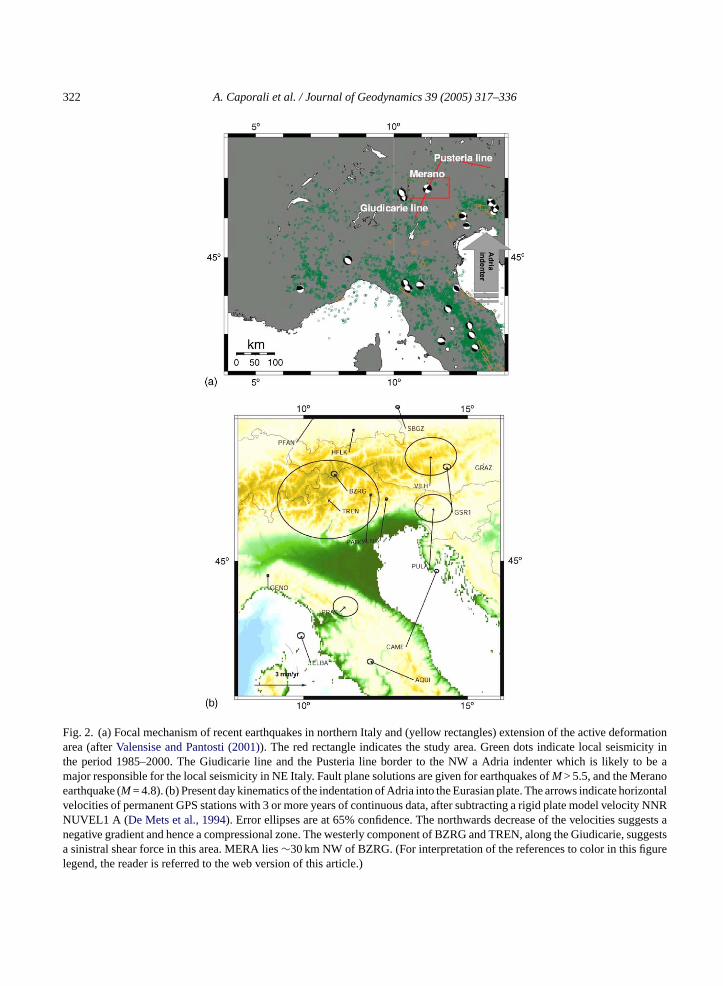
The North Giudicarie line strikes SW to NE nearly across the city of Merano and the valley of the riverAdige. In the surroundings of Merano the North Giudicarie line is characterized by a slight clockwiserotation and becomes the Merano-Mules fault. The Merano-Mules fault merges into the Pusteria lineat Mules valley (Fig. 3). An additional structural complication is represented by an evident NNE–SSWsubvertical splay (Passiria fault) diverging from the North Giudicarie line. All the faults belong to thePeriadriatic system, which is the suture between the Adria indenter and the European foreland. Furtherto the north the west dipping Brenner low angle detachment is the tectonic divide between the Penninicnappes of the Tauern window and the Austroalpine units to the west. This main fault has eased the escape ofthe Eastern Alps towards the Pannonian Basin since the late Oligocene (Selverstone, 1988; Selverstone etal., 1995; Behrmann, 1988; Ratschbacher et al., 1991; Fugenschuh et al., 1997). From the middle Mioceneonward, a connection between the Brenner low angle fault and the North Giudicarie line (dipping at middleangle towards the NW) was achieved through the Jaufen and Passiria tectonic lines (Viola et al., 2001).The sinistral transpressional strain along North Giudicarie system due to the Adria Europa contractionhas been partitioned among the North Giudicarie line with a dominant compressional component andsome N–S to NNE splays in its footwall and hanging wall characterized by a more transcurrent behaviour(Prosser, 1998, 2000; Fellin et al., 2002). The N–S system at the Giudicarie footwall is in turn directlyconnected with the faults and thrusts at Lake of Garda-Monte Baldo area (e.g.Castellarin et al., 1992).Because no major change on the Europa–Adria contraction has been recorded from the middle Mioceneonward (Dewey et al., 1989; Mazzoli and Helman, 1994), the fault system described above is likely tohave kept its overall kinematics.
Historically, the area has only occasionally been seismically active with earthquakes of magni-tudeM> 5. According to the historical catalogue of INGV (Catalogue of Strong Italian Earthquakesfrom 461B.C. to 1990, Istituto Nazionale di Geofisica e Vulcanologia,http://80.117.141.2/cft/andhttp://emidius.mi.ingv.it/CPTI/) an earthquake of estimated magnitude 4.9 has been recorded in 1924near Vipiteno, some 30 km north of Merano. Based on historical data ofSchorn (1902), Lenhardt (2002)reports large (up toM∼ 7) earthquakes in the Innsbruck area in 1572, 1670, 1689, 1830 and 1886.Towards the Giudicarie system, the seismicity tends to be mostly at the instrumental level, and be-comes relevant further south, between Verona and Lake of Garda, in the Monte Baldo area, probablyassociated to N–S splays of the South Giudicarie line and the Giudicarie belt thrusts (Slejko et al.,1989).
The event of Merano fits a double couple model represented by a sinistral strike slip on a subverticalfault (between 59 ESE and 74 WNW degrees dip) and an orientation of∼17–30◦ from north (Table 1b).At least five different estimates of the coordinates of the epicentre are given in the literature (Fig. 1a andTable 1a). NEIC puts the epicenter north of Merano, along the North Passiria line; the final epicenterestimates of INGV and OGS locate the epicenter somewhat more south, not far from downtown Merano.The location of CSEM is far to the NE of Merano.
322 A. Caporali et al. / Journal of Geodynamics 39 (2005) 317–336
Fig. 2. (a) Focal mechanism of recent earthquakes in northern Italy and (yellow rectangles) extension of the active deformationarea (afterValensise and Pantosti (2001)). The red rectangle indicates the study area. Green dots indicate local seismicity inthe period 1985–2000. The Giudicarie line and the Pusteria line border to the NW a Adria indenter which is likely to be amajor responsible for the local seismicity in NE Italy. Fault plane solutions are given for earthquakes ofM> 5.5, and the Meranoearthquake (M= 4.8). (b) Present day kinematics of the indentation of Adria into the Eurasian plate. The arrows indicate horizontalvelocities of permanent GPS stations with 3 or more years of continuous data, after subtracting a rigid plate model velocity NNRNUVEL1 A (De Mets et al., 1994). Error ellipses are at 65% confidence. The northwards decrease of the velocities suggests anegative gradient and hence a compressional zone. The westerly component of BZRG and TREN, along the Giudicarie, suggestsa sinistral shear force in this area. MERA lies∼30 km NW of BZRG. (For interpretation of the references to color in this figurelegend, the reader is referred to the web version of this article.)
A. Caporali et al. / Journal of Geodynamics 39 (2005) 317–336 323
Fig. 3. Structural map of the Giudicarie system—Merano area showing the major structural lineaments referred in the text: theGiudicarie and Passiria lines, the Jaufen and Meran-Mules fault, the Pusteria fault and the Brenner fault.
324 A. Caporali et al. / Journal of Geodynamics 39 (2005) 317–336
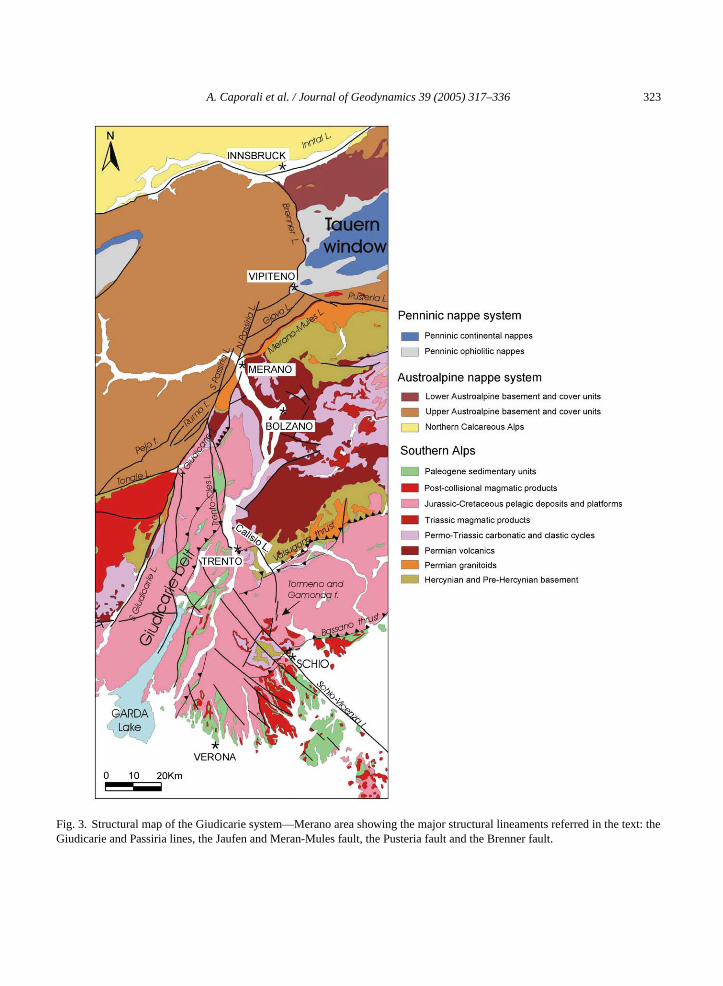
Fig. 4. Seismic section of the crust underneath the southern eastern Alps along the Adige valley (adapted fromCassinis andScarascia (2002)), with the overlying topography (from ETOPO30 Digital Terrain Model of US Geological Survey) and structuralmap of Italy (Bigi et al., 1990). The red spot indicates the depth of the hypocenter of the Merano 2001 earthquake which issupported by the combination of seismological and geodetic data. Velocities of the P waves in km/s. Low velocity channels atdepths of 40–50 km may correspond to low viscosity horizons which mechanically decouple the upper crust from the lowercrust.
There are great uncertainties regarding the depth of the hypocenter, ranging from mid-crust (22 km)to superficial (0.5 km) (Table 1a). According to recent surveys, the upper crust is characterized by anormalVp zone (6.2–6.4 km/s) with a nearly horizontal seismic horizon (Fig. 4) (Scarascia and Cassinis,1997; Ebbing et al., 2001; Cassinis and Scarascia, 2002). Between Trento and the Pusteria Line there isindication of one, possibly two, low velocity zones (from 7 to 6.5 km/s) between 45 and 50 km.
3. The time series of permanent GPS stations
The permanent GPS station MERA is located downtown Merano on the roof of a∼50 years oldconcrete building, within a few kilometers from the epicenter. MERA has been active for about 4 years,beginning July 2000 up to present, and has generated daily RINEX data files archived at the Universityof Padova. MERA data are processed weekly at the University of Padova as part of the maintenanceof the Italian network of permanent GPS stations (Caporali et al., 2003b). The Italian permanent GPSnetwork is accurately aligned to the standard terrestrial reference frame ITRF2000 (Altamimi et al.,2002) by means of the 15 Italian stations, which are also part of the EUREF/IGS network (EUREF andIGS are acronyms for European Reference Frame and International GPS Service, respectively). Moreinformation about the EUREF and IGS Permanent GPS networks can be found, respectively, at the
A. Caporali et al. / Journal of Geodynamics 39 (2005) 317–336 325
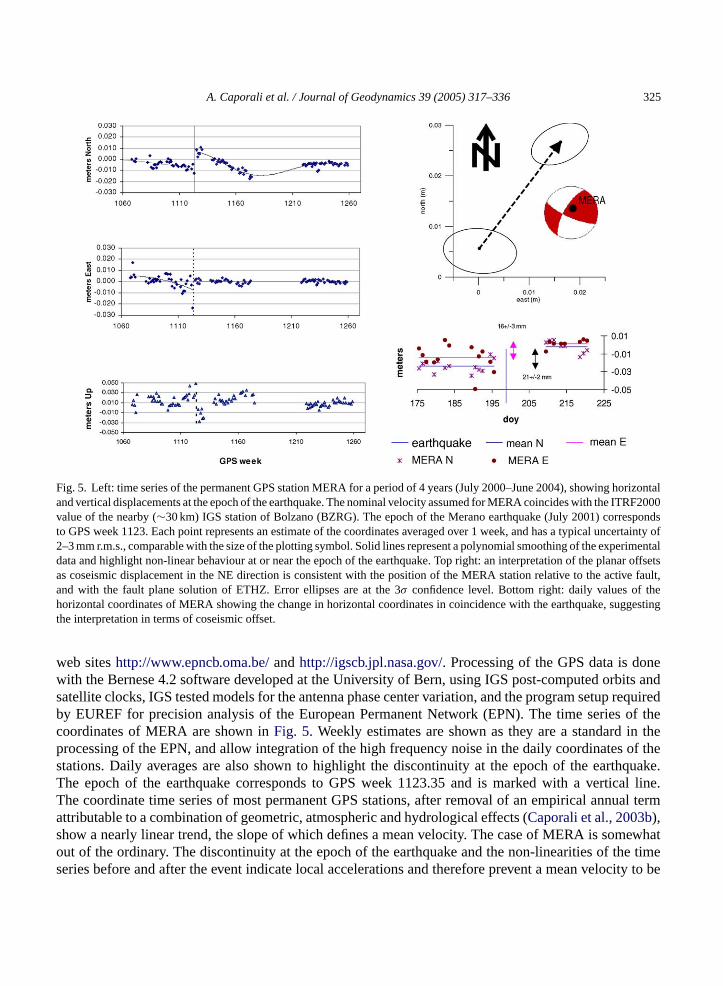
Fig. 5. Left: time series of the permanent GPS station MERA for a period of 4 years (July 2000–June 2004), showing horizontaland vertical displacements at the epoch of the earthquake. The nominal velocity assumed for MERA coincides with the ITRF2000value of the nearby (∼30 km) IGS station of Bolzano (BZRG). The epoch of the Merano earthquake (July 2001) correspondsto GPS week 1123. Each point represents an estimate of the coordinates averaged over 1 week, and has a typical uncertainty of2–3 mm r.m.s., comparable with the size of the plotting symbol. Solid lines represent a polynomial smoothing of the experimentaldata and highlight non-linear behaviour at or near the epoch of the earthquake. Top right: an interpretation of the planar offsetsas coseismic displacement in the NE direction is consistent with the position of the MERA station relative to the active fault,and with the fault plane solution of ETHZ. Error ellipses are at the 3σ confidence level. Bottom right: daily values of thehorizontal coordinates of MERA showing the change in horizontal coordinates in coincidence with the earthquake, suggestingthe interpretation in terms of coseismic offset.
web siteshttp://www.epncb.oma.be/andhttp://igscb.jpl.nasa.gov/. Processing of the GPS data is donewith the Bernese 4.2 software developed at the University of Bern, using IGS post-computed orbits andsatellite clocks, IGS tested models for the antenna phase center variation, and the program setup requiredby EUREF for precision analysis of the European Permanent Network (EPN). The time series of thecoordinates of MERA are shown inFig. 5. Weekly estimates are shown as they are a standard in theprocessing of the EPN, and allow integration of the high frequency noise in the daily coordinates of thestations. Daily averages are also shown to highlight the discontinuity at the epoch of the earthquake.The epoch of the earthquake corresponds to GPS week 1123.35 and is marked with a vertical line.The coordinate time series of most permanent GPS stations, after removal of an empirical annual termattributable to a combination of geometric, atmospheric and hydrological effects (Caporali et al., 2003b),show a nearly linear trend, the slope of which defines a mean velocity. The case of MERA is somewhatout of the ordinary. The discontinuity at the epoch of the earthquake and the non-linearities of the timeseries before and after the event indicate local accelerations and therefore prevent a mean velocity to be
326 A. Caporali et al. / Journal of Geodynamics 39 (2005) 317–336
uniquely defined for the∼4 years data span. We have therefore constrained the velocity of MERA tothe ITRF2000 value of the nearby (∼30 km) EPN station BZRG, in Bolzano (the corresponding timeseries for BZRG is available at the EUREF-EPN web sitehttp://www.epncb.oma.be/). Hence the timeseries shown inFig. 5 is computed after having subtracted predictions based on the assumption that themean velocity of MERA coincides with the ITRF2000 velocity of BZRG. This linear trend, which wassubtracted corresponds to a velocity in thex, y, zdirections of−12.4, 18.9, 13.9 mm/year, or 15.7, 21.0,4.3 mm/year in the north, east and up directions, respectively. The coseismic offset in the MERA timeseries shown inFig. 5is (21± 2) mm in the north direction and (16± 3) mm in the east direction. Hencethe total coseismic offset is 26± 3 mm, roughly in the NE direction.
4. Modeling the coseismic deformation implied by the GPS data
In order to model the observed coseismic signal in the GPS observation, we use the model of afault-plane buried in a homogeneous halfspace. We adopt the formulation proposed byOkada (1992).The required input data are the fault dimensions (lengthL and widthW), the fault dip and strike, thedisplacement on the fault, and the fault depth (measured as the depth of the center of the fault). We assumethe halfspace to be a Poisson body (with Lame’ coefficientsλ =µ), in which case the Poisson ratio is0.25, a good approximation to the values derived from the propagation of seismic waves (Dziewonskiand Anderson, 1981).
In order to choose the values defining the fault we rely on published focal mechanisms. For a smallearthquake the seismic momentM0 can be approximated by the product of the fault area (A), the slip (u)on the fault and the shear modulus (µ):
M0 = Auµ (1)
We adopt a standard value of the shear modulusµ for crustal faults of 30 GPa (Hanks and Kanamori,1979). From Eq.(1) it can be seen that the parameterµ acts as a scaling factor between the faultdimensions and the seismic moment. As no further constraints on the fault plane are available, we useempirical relations in order to deduce the fault area and the seismic slip.Wells and Coppersmith (1994)analyzed a worldwide database of 421 earthquakes and produced empirical relationships between momentmagnitude and fault source parameters. According to this regression analysis, the fault area (A) can beestimated from the moment magnitude by
log A = −3.42(±0.18)+ 0.90(±0.05)M (2)
where the moment magnitude is related to the seismic moment by:
M = 2
3log(M0) − 6 (3)
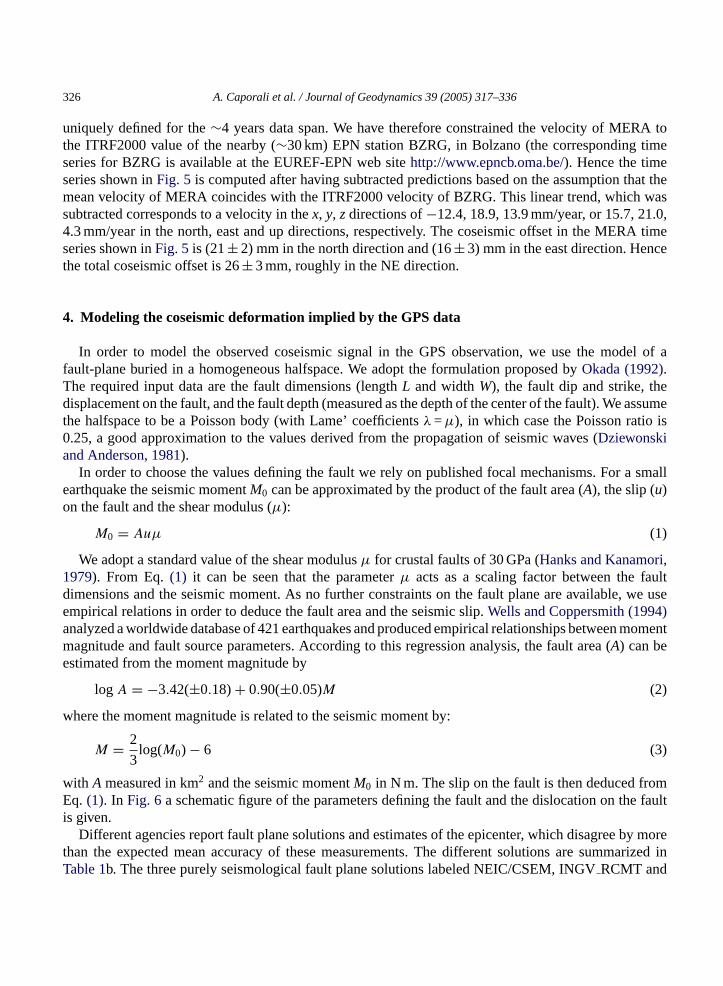
with Ameasured in km2 and the seismic momentM0 in N m. The slip on the fault is then deduced fromEq. (1). In Fig. 6a schematic figure of the parameters defining the fault and the dislocation on the faultis given.
Different agencies report fault plane solutions and estimates of the epicenter, which disagree by morethan the expected mean accuracy of these measurements. The different solutions are summarized inTable 1b. The three purely seismological fault plane solutions labeled NEIC/CSEM, INGVRCMT and
A. Caporali et al. / Journal of Geodynamics 39 (2005) 317–336 327
Fig. 6. Schematic figure of the parameters defining the fault and the dislocation along the fault.WandL represent the width andlength of the fault.
ETHZ agree in the strike of the fault planes, the first being oriented WNW–ESE, the second NNE–SSW.The second plane is subvertical in all solutions (59–74◦). A greater difference is in the dip of the firstplane, which is subvertical in two solutions (INGVRCMT and ETHZ) and less inclined in the other(NEIC/CSEM). Considering the second plane as the preferred fault plane (oriented NNE–SSW), accordingto the above structural geological consideration, the mechanism translates into a nearly sinistral strikeslip movement with small thrust component for the ETHZ and INGVRCMT solutions, and to a sinistralstrike slip movement with a normal component for the NEIC/CSEM solution.
We have calculated the dislocation field associated with the different fault plane solutions (CSEM,INGV RCMT and ETHZ) and compared it with the coordinate time series of the GPS station MERA.It results in both cases that in order to explain the observed northeasterly coseismic movement, the GPSstation must be to the NE of the fault. This information excludes all epicentral locations that (Fig. 1a) areto the N and E of the MERA GPS station, namely ETHZ/NEIC, CSEM, INGVRCMT. However the faultdimension and slip recovered from the seismological moment of NEIC/CSEM, INGVRCMT and ETHZin Table 1b underestimate the observed dislocation of the GPS station. In order to explain the observeddislocation, the fault must be more superficial and of greater seismic moment, as otherwise the dislocationat the surface results to be too small. It cannot be excluded that the geodetic signal near a strike slip faultis amplified by the existence of a soft surface layer (Honda and Yomogida, 2003), as it happens also innormal faults (Amoruso et al., 2004). However there is no indication that this layer exists at and nearthe epicentral area. We have proceeded in a further refinement of our forward model, by accepting thefocal mechanism according to the seismological model, taking into account the error bands, and testingthe different proposed hypocentral seismological solutions, until the computed displacement matches thedisplacement of the GPS station MERA. Furthermore we have used the constraint that the water tablestations be in a quadrant of compressional volume deformation, as they show a coseismic water tableincrease, as discussed in more detail in the next paragraph. The dislocation produced by our final modelis given inFig. 7, where the arrows show the displacement vector field and the isolines represent thedisplacement amplitude. The hypocentral depth, and magnitude and orientation of the model fault planeare given inTable 1a and b, respectively, under label SSGH, and do result in a displacement at the GPSstation of∼2 cm, in NE direction. The uncertainty range on strike and dip is about 10◦, on rake of about20◦ and on hypocentral position in the order of a kilometer. The surface projection of the fault is shownby the rectangle and the position of the GPS station is shown. The geodetically estimated seismic moment
328 A. Caporali et al. / Journal of Geodynamics 39 (2005) 317–336
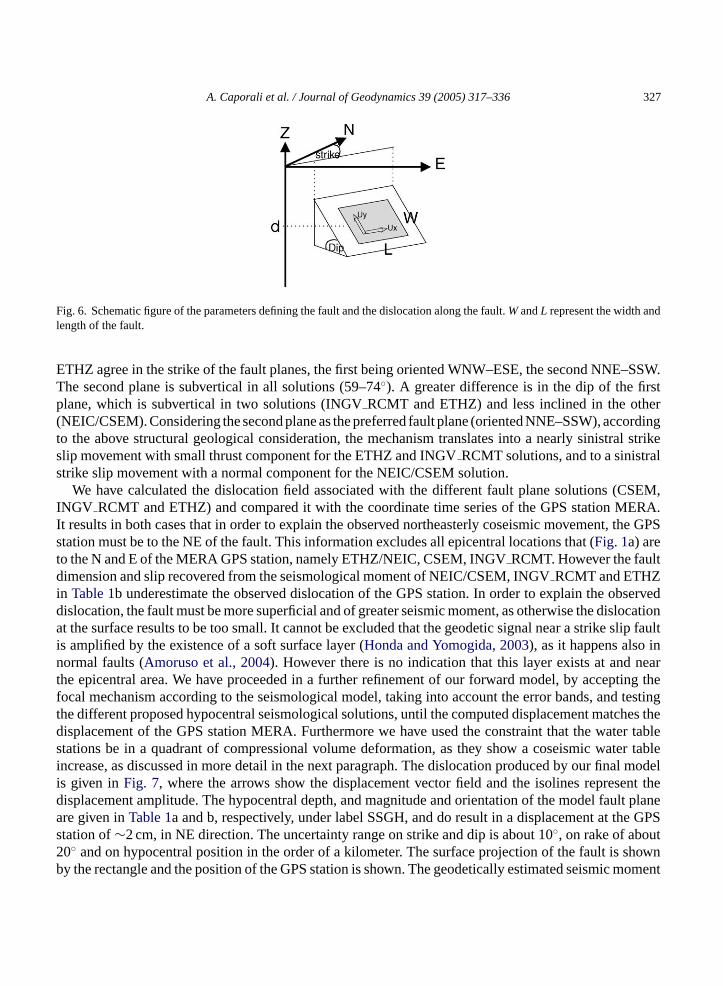
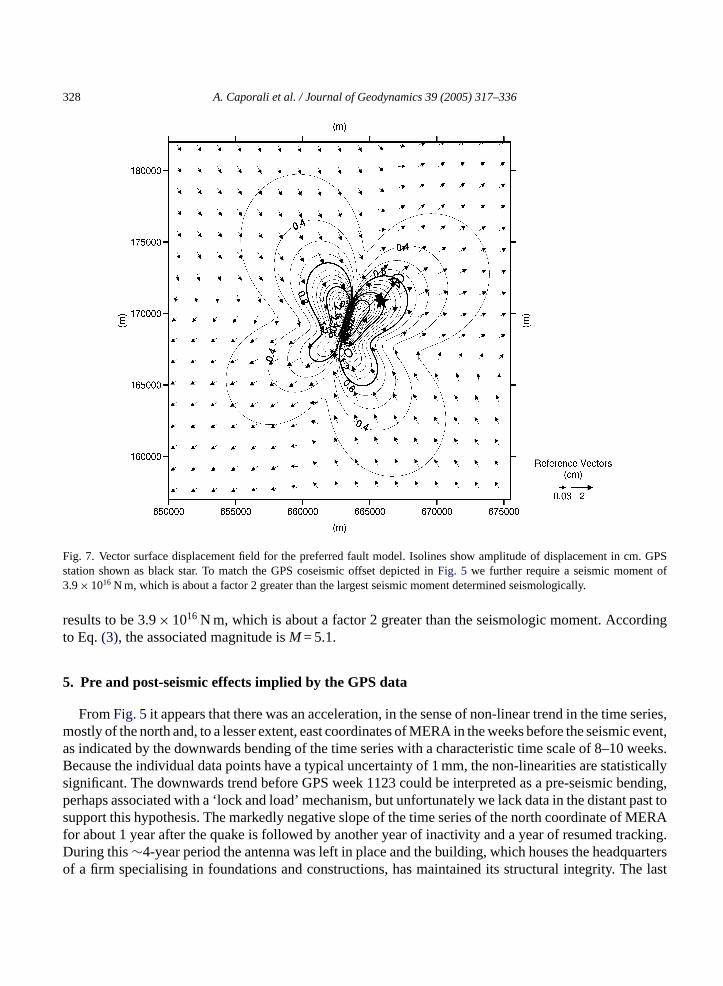
Fig. 7. Vector surface displacement field for the preferred fault model. Isolines show amplitude of displacement in cm. GPSstation shown as black star. To match the GPS coseismic offset depicted inFig. 5 we further require a seismic moment of3.9× 1016 N m, which is about a factor 2 greater than the largest seismic moment determined seismologically.
results to be 3.9× 10¹⁶ N m, which is about a factor 2 greater than the seismologic moment. Accordingto Eq.(3), the associated magnitude isM= 5.1.
5. Pre and post-seismic effects implied by the GPS data
FromFig. 5it appears that there was an acceleration, in the sense of non-linear trend in the time series,mostly of the north and, to a lesser extent, east coordinates of MERA in the weeks before the seismic event,as indicated by the downwards bending of the time series with a characteristic time scale of 8–10 weeks.Because the individual data points have a typical uncertainty of 1 mm, the non-linearities are statisticallysignificant. The downwards trend before GPS week 1123 could be interpreted as a pre-seismic bending,perhaps associated with a ‘lock and load’ mechanism, but unfortunately we lack data in the distant past tosupport this hypothesis. The markedly negative slope of the time series of the north coordinate of MERAfor about 1 year after the quake is followed by another year of inactivity and a year of resumed tracking.During this∼4-year period the antenna was left in place and the building, which houses the headquartersof a firm specialising in foundations and constructions, has maintained its structural integrity. The last
A. Caporali et al. / Journal of Geodynamics 39 (2005) 317–336 329
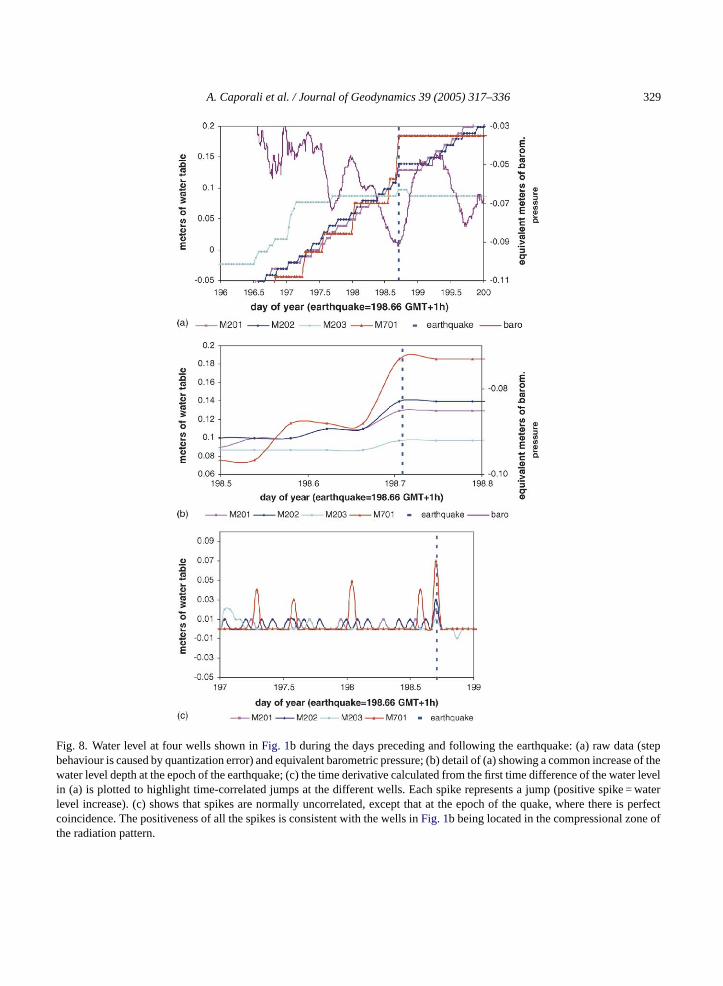
Fig. 8. Water level at four wells shown inFig. 1b during the days preceding and following the earthquake: (a) raw data (stepbehaviour is caused by quantization error) and equivalent barometric pressure; (b) detail of (a) showing a common increase of thewater level depth at the epoch of the earthquake; (c) the time derivative calculated from the first time difference of the water levelin (a) is plotted to highlight time-correlated jumps at the different wells. Each spike represents a jump (positive spike = waterlevel increase). (c) shows that spikes are normally uncorrelated, except that at the epoch of the quake, where there is perfectcoincidence. The positiveness of all the spikes is consistent with the wells inFig. 1b being located in the compressional zone ofthe radiation pattern.
330 A. Caporali et al. / Journal of Geodynamics 39 (2005) 317–336
year of the series suggests a form of settling to a more stable equilibrium after the shock, with a permanentoffset of the order of 10 mm relative to the position the antenna had before the quake. It is unlikely thatthis new equilibrium was achieved by viscoelastic relaxation of an elastic plate overlaying a viscous fluid.Although the low velocity channels described inFig. 4at a depth of 45–50 km could in principle be usefulin attempting to justify a viscoelastic model of the post-seismic time series of the Merano station, the
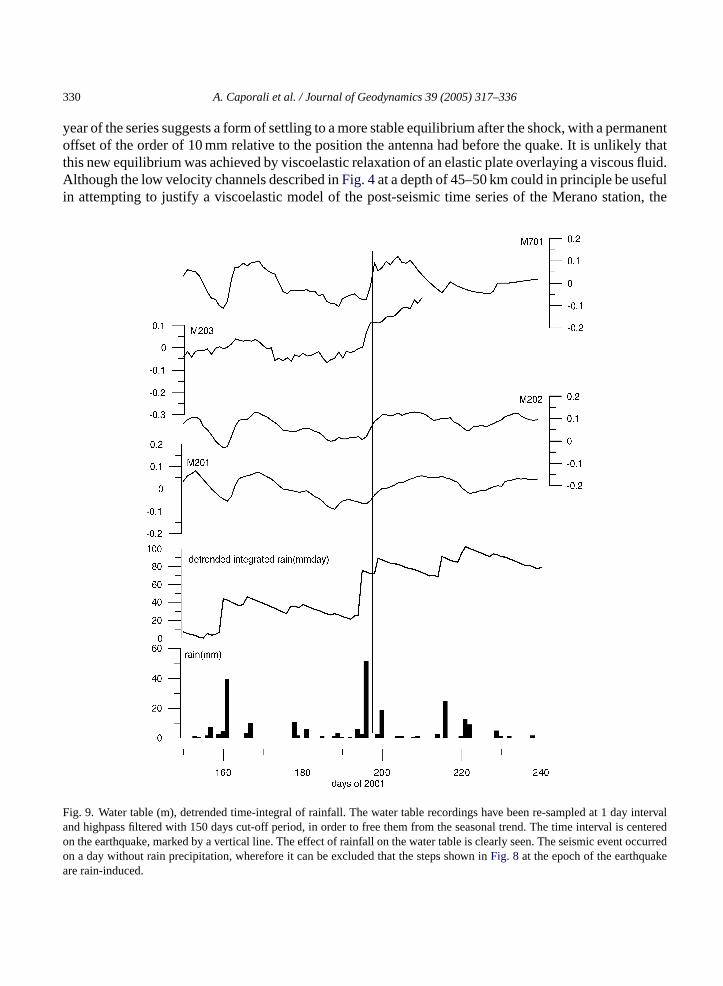
Fig. 9. Water table (m), detrended time-integral of rainfall. The water table recordings have been re-sampled at 1 day intervaland highpass filtered with 150 days cut-off period, in order to free them from the seasonal trend. The time interval is centeredon the earthquake, marked by a vertical line. The effect of rainfall on the water table is clearly seen. The seismic event occurredon a day without rain precipitation, wherefore it can be excluded that the steps shown inFig. 8 at the epoch of the earthquakeare rain-induced.
A. Caporali et al. / Journal of Geodynamics 39 (2005) 317–336 331
estimated hypocentral depth is too shallow to interact with such deep structures. Hence it is more likelythat the post-seismic relaxation is accommodated by porous flow in the uppermost crust.
6. Hydrological data
The sensitiveness of the level of subsurface waters to tectonic deformation has been observed in manycases in the form of e.g. pre-, co- and post-seismic well-level changes, temperature changes and spring-and streamflow changes. Comprehensive overviews are given inRoeloffs (1988, 1996, 1998), Quilty andRoeloffs (1997)andShibata et al. (2003). A critical study of the records of 194 well-level sensors in CentralEurope during the occurrence of the Roermond (Mw 5.4) event of 1992 was made byGrecksch et al.(1999). The co-seismic well level steps have been explained by the static volumetric strain accompanyingthe earthquake. In general the extensional strain produces a well level fall and the compressive straina well-level rise (Grecksch et al., 1999; Wakita, 1975), which has been observed in confined and non-confined aquifers. Other hydrologic responses to seismic events include seismic oscillations of water
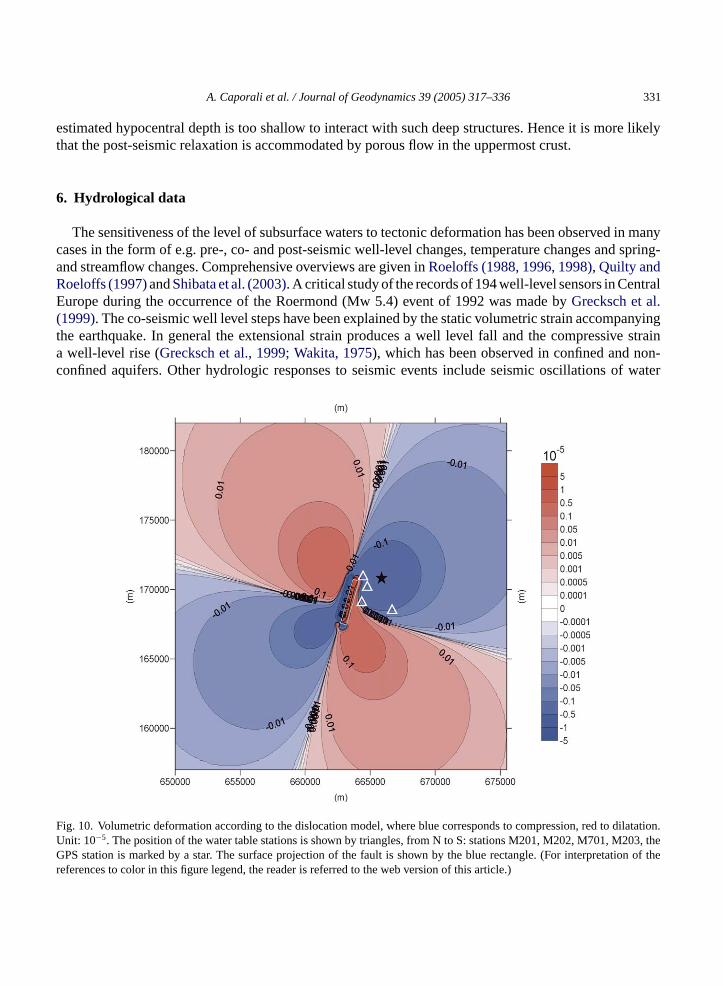
Fig. 10. Volumetric deformation according to the dislocation model, where blue corresponds to compression, red to dilatation.Unit: 10−5. The position of the water table stations is shown by triangles, from N to S: stations M201, M202, M701, M203, theGPS station is marked by a star. The surface projection of the fault is shown by the blue rectangle. (For interpretation of thereferences to color in this figure legend, the reader is referred to the web version of this article.)
332 A. Caporali et al. / Journal of Geodynamics 39 (2005) 317–336
levels, due to the effect of surface waves, and long term changes in water table levels that persist fordays or weeks, due to changes in the aquifer properties (Roeloffs, 1998). The study of seismic effectsin water-level changes must take into account rainfall and barometric pressure, as both can have a directinfluence on the well level records.
We investigate the time series from four wells located within a distance of 5 km from the MERA GPSstation.Fig. 8(seeFig. 1a and b for the location of the wells and meteo stations) summarises the raw watertable data sampled at the wells M201, M202, M203 and M701, the rainfall and the barometric pressurefor a time interval of 10 days, centered on the occurrence time of the earthquake. The rain meters arelocated at the sites Gratsch and Obermais, and we have averaged the two data sets. The water table andthe barometric pressure are recorded with hourly sampling, the rainfall with daily sampling. The watertable stations M202, M201, M203 are recorded with a resolution of 1 cm, the station M701 with a lowerresolution of 2 cm. It can be seen that at the epoch of the earthquake there was a rise of the water levelsimultaneously at all the four locations, with increases of 7, 2, 3 and 1 cm for the stations M701, M201,M202 and M203, respectively. It seems unlikely that this rise is caused by barometric pressure effects,
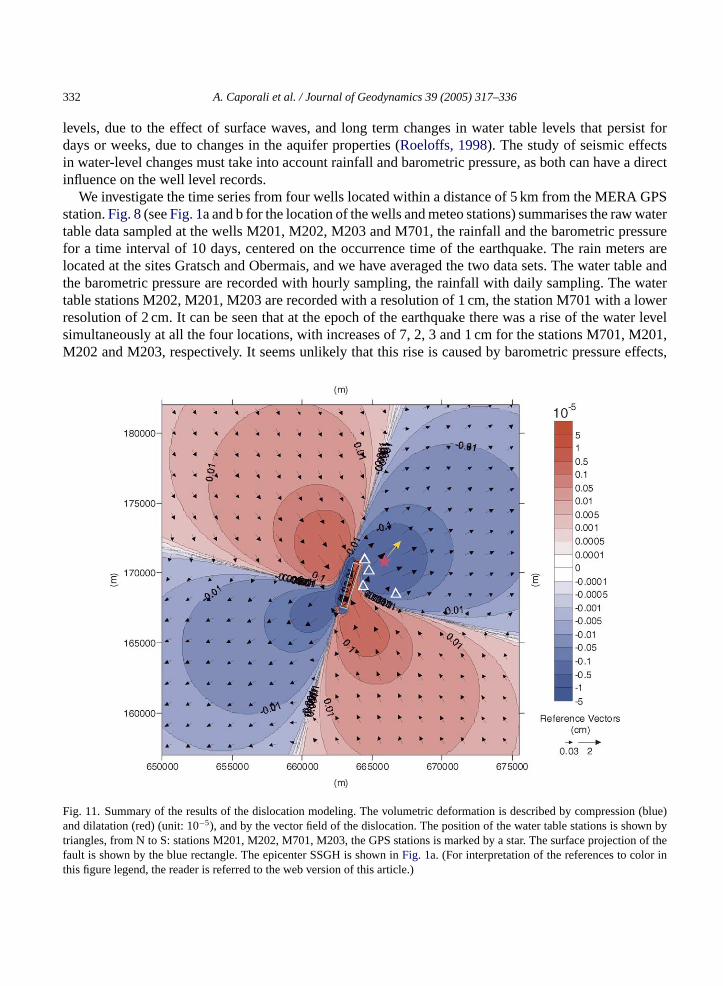
Fig. 11. Summary of the results of the dislocation modeling. The volumetric deformation is described by compression (blue)and dilatation (red) (unit: 10−5), and by the vector field of the dislocation. The position of the water table stations is shown bytriangles, from N to S: stations M201, M202, M701, M203, the GPS stations is marked by a star. The surface projection of thefault is shown by the blue rectangle. The epicenter SSGH is shown inFig. 1a. (For interpretation of the references to color inthis figure legend, the reader is referred to the web version of this article.)
A. Caporali et al. / Journal of Geodynamics 39 (2005) 317–336 333
as the atmospheric pressure changed very slowly, as demonstrated by the high frequency data available(Fig. 8). To investigate the well data in more detail, we separate the seasonal near to yearly variation of thewater table from the remaining signal and consider the possible influence of rainfall. In order to isolatethe small sub-seasonal time variations, the recordings are treated with a frequency domain cosine taperfilter, which cuts off all periods greater than 150 days. The depths from the ground of the mean water tablelevel are 6.5, 18.5, 16 and 9 m and the annual excursions are 3, 4.5, 4 and 2 m, for the four stations M701,M201, M202 and M203, respectively. The filtered time series are shown inFig. 9, together with rainfall.Furthermore the de-trended time integral of rainfall has been added to the graph, which is the simplestalgorithm to simulate a water-collecting basin with a steady mean water outlet (Braitenberg, 1999a,b).When comparing the possible influence of rainfall on the water table variations, this function is to bepreferred to the raw rainfall data, as it represents the time integral of rainfall, which is a quantity morerepresentative of the water table level than the daily variations of rain fall. Inspection of the curves showsthat the influence of rainfall on the height of the water table is only slight, and evident only in the two casesof stronger rainfall (more than 40 mm in 1 day). The day before the earthquake (16 July 2001) a relativelystrong rainfall occurred, and it cannot be ruled out that the observed water table rise is, at least in part,connected to the influence of rainfall. On the other hand, the close-ups inFig. 8do show that at the epochof the earthquake there was a rise of the water level simultaneously at all the four locations, which lagsbehind the rain event. In this area the nature of soil is such that the water table responds instantly to rain.This supports the hypothesis that the simultaneous rise of the water level at the epoch of the earthquakein Fig. 8is more likely to be related to the quake than to the rain of the day before. InFig. 10the positionof the water table stations is displayed with respect to the co-seismic volumetric deformation computedfor the earthquake model discussed above. The fault plane solution and epicentral location is that of thepreceding paragraph, which optimizes the modeling of the dislocation observed with GPS. The watertable stations are all located in an area of compression. Hence, the observed coseismic increase givesfurther confidence in the epicenter location SSGH found with our geodetic, seismologic and structuralanalysis.
In fact, with reference toFig. 1 we note that the epicentre estimate by INGV is consistent with thewater table data, whereas the epicenter labeled ETHZ/NEIC would require a drop of the water table atall four sites (Fig. 11). Likewise the epicenter labeled OGS would be consistent with only a fraction ofthe available well data. Unfortunately there are no wells in areas of suspected extension. If our model iscorrect, they would have shown a negative peak inFig. 8c. This gap in the data coverage of areas subjectto extensional strain, and the uncertainties in the effect of rain precipitation certainly limit the strength ofour hydrological arguments.
7. Conclusion
The Merano earthquake offers an interesting opportunity to examine seismologic data in conjunctionwith geodetic and hydrological data. Due to its off-centered location with respect to existing nationalseismologic networks, its epicentral position differs by up to 25 km, according to the different seismo-logical agencies. We have succeeded in reducing this uncertainty by rejecting those published epicentrallocations, which are incompatible with the geodetic and water table observations. According to our model,the epicenter was very close to the main town of Merano. Adopting published fault plane solutions andmaking a detailed analysis of the geologic structure we propose that the fault belongs to the Giudicarie
334 A. Caporali et al. / Journal of Geodynamics 39 (2005) 317–336
system, and in particular the NNE–SSE trending Passiria deformation zone, which crosses the town ofMerano. The fault area can be estimated to be about 9 km2 on a subvertical fault with a sinistral strikeslip movement.
The geodetic data do clearly show a coseismic displacement, and indicate a post-seismic relaxation,perhaps connected to porous flow in the upper crust.
We conclude that the combined structural, seismological, geodetic and hydrological (SSGH) solutiondescribed inTable 1, although not an inversion in a strict seismological sense, supports the hypocentraldepth computed by OGS, an epicentral location intermediate to the solutions of INGV, INGVRCMTand OGS, and the activated fault plane of the seismological inversion.
Acknowledgements
We thank Dr. Jochen Braunmuller and Dr. Massimo Di Bona for information about the seismologicdata, and the OGS, INGV, CSEM and ETHZ for releasing the seismologic information. We thank Mr. A.di Girolamo, the firm Studio Geom. Mario Sacchin, Proff. Richard Spiess and Bernhard Schrefler, andthe Hydrographic Office of the Autonomous Province of Bolzano for kindly providing the rain and meteodata. Fabio de Giusti aided in the realization ofFig. 3. A.C. acknowledges the support of the ProjectCERGOP 2—Environment financed by the European Union under the 5. Framework Programme, and ofthe project ‘Deformation of the Mediterranean Area’ financed by the Ministry of University and ScientificResearch. C.B. acknowledges support from the COFIN2002 project ‘Observation and modeling of crustaldeformations in seismogenetic area’ financed by the Ministry of University and Scientific Research. Prof.Gerhard Jentzsch and an anonymous referee are thanked for a review of the paper.
References
Altamimi, Z., Sillard, P., Boucher, C., 2002. ITRF2000: a new release of the international terrestrial reference frame for earthscience applications. J. Geophys. Res. 107 (B10), 2214, doi:10.1029/2001JB000561.
Amoruso, A., Crescentini, L., Fidani, C., 2004. Effects of crustal layering on source parameter inversion from coseismic geodeticdata. Geophys. J. Int. 159, 353–364.
Behrmann, J.H., 1988. Crustal-scale extension in a convergent orogen: the Sterzing-Steinach mylonite zone in the Eastern Alps.Geodinamica Acta 2, 63–73.
Bigi, G., Casentino D., Parlotto, M., Sartori, R., Scandone, P., 1990. Structural model of Italy. In: Castellarin, A., Coli, M., DalPiaz, G.V., Sartori, R., Scandone, P., Vai, G.B. (Eds.), Sheet No. 1. CNR, Progetto Finalizzato Geodinamica, Roma.
Braitenberg, C., 1999a. Estimating the hydrologic induced signal in geodetic measurements with predictive filtering methods.Geophys. Res. Lett. 26, 775–778.
Braitenberg, C., 1999b. The hydrologic induced strain – a review.Marees Terrestres Bulletin D’Informations 131, 1071–1081.Bressan, G., Snidarcig, A., Venturini, C., 1998. Present state of tectonic stress of the Friuli area (eastern southern Alps).
Tectonophysics 292, 211–227.Caporali, A., Martin, S., Massironi, M., 2003a. Average strain rate in the Italian crust inferred from a permanent GPS network.
Part 2. Strain rate vs. seismicity and structural geology. Geophys. J. Int. 155, 254–268.Caporali, A., Maseroli, R., Pierozzi, M., 2003b. ETRS89 coordinates at epoch 10.07.2002 for seventeen permanent GPS stations
in Italy and additional 22 reference EPN sites in Italy, France, Switzerland and Austria. In: Torres, J.A., Hornik, H. (Eds.),Proceedings of the EUREF Symposium, Toledo, Spain, June 4–6, 2003. Veroeffentlichungen der Bayerischen Kommissionfuer die Internationale Erdmessung der Bayerischen Akademie der Wissenshaften, in press.
A. Caporali et al. / Journal of Geodynamics 39 (2005) 317–336 335
Cassinis, R., Scarascia, S., 2002. The structure of the deep crust and Moho boundary along TRANSALP according to the DSSdata—a contribution to the lateral extension of the model. Mem. Sci. Geol. 54, 41–44.
Castellarin, A., Cantelli, L., Fesce, A.M., Mercier, J.L., Picotti, V., Pini, G.A., Prosser, G., Selli, L., 1992. Alpine compressionaltectonics in the southern Alps. Relationships with the N-Apennines. Annales Tectonicæ VI (1), 62–94.
De Mets, C., Gordon, R.G., Argus, D.F., Stein, S., 1994. Effect of recent revisions to the geomagnetic reversal time scale onestimates of current plate motions. Geophys. Res. Lett. 21, 2191–2194.
Dewey, J.F., Helman, M.L., Turco, E., Hutton, D.H.W., Knott, S.D., 1989. Kinematics of the western Mediterranean. In: Coward,M.P., Dietrich, D., Park, RG. (Eds.), Alpine Tectonics, vol. 45. Geol. Soc. Spec. Publ., London, pp. 265–284.
Dziewonski, A.M., Anderson, D.L., 1981. Preliminary reference Earth model. Phys. Earth Planet. Int. 25, 297–356.Ebbing, J., Braitenberg, C., Gotze, H.-J., 2001. Forward and inverse modelling of gravity revealing insight into crustal structures
of the eastern Alps. Tectonophysics 337, 191–208.Fellin, S., Martin, S., Massironi, M., 2002. Polyphase tertiary fault kinematics and quaternary reactivation in the central-eastern
Alps (western Trentino). J. Geodyn. 34, 31–46.Fugenschuh, B., Seward, D., Mancktelow, N., 1997. Exhumation in a convergent orogen: the western Tauren window. Terra
Nova 9, 213–217.Grecksch, G., Roth, F., Kumpel, H.-J., 1999. Coseismic well-level changes due to the 1992 Roermond earthquake compared to
static deformation of half-space solutions. Geophys. J. Int. 138, 470–478.Hanks, T.C., Kanamori, H., 1979. A moment-magnitude scale. J. Geophys. Res. 84, 2348–2350.Honda, R., Yomogida, K., 2003. Effects of a soft surface layer on near-fault static and dynamic displacements. Geophys. J. Int.
154, 441–462.Lenhardt, W.A., 2002. Seismicity in Tyrol in relation to the TRANSALP transect. Mem. Sci. Geol. 54, 49–52.Mazzoli, S., Helman, M., 1994. Neogene patterns of relative plate motion for Africa–Europe: some implications for recent
Central Mediterranean tectonics. Geol. Rundsch. 83, 464–468.Okada, Y., 1992. Internal deformation due to shear and tensile faults in a half-space. Bull. Seismol. Soc. Am. 82, 1018–
1040.Pondrelli, S., Morelli, A., Ekstrom, G., 2002. European-Mediterranean regional centroid moment tensor catalog: solutions for
years 2001 and 2002. Phys. Earth Planet. Int. 145, 127–147.Prosser, G., 1998. Strike-slip movements and thrusting along a transpressive fault zone: the North Giudicarie line (Insubric line,
northern Italy). Tectonics 17, 921–937.Prosser, G., 2000. The development of the North Giudicarie fault zone (Insubric line, northern Italy). J. Geodyn. 30, 229–
250.Quilty, E.G., Roeloffs, E.A., 1997. Water-level changes in response to the 20 December 1994 earthquake near Parkfield, California.
Bull. Seismol. Soc. Am. 87, 310–317.Ratschbacher, L.W., Frisch, H., Linzer, G., Merle, O., 1991. Lateral extrusion in the eastern Alps, 2, Structural analysis. Tectonics
10, 257–271.Regenauer-Lieb, K., Petit, J.P., 1997. Cutting of the European continental lithosphere; plasticity theory applied to the present
Alpine collision. J. Geophys. Res. 102, 7731–7746.Renner, G., Slejko, D., 1994. Some comments on the seismicity of the Adriatic region. Boll. Geof. Teor. Appl. 36, 141–144.Roeloffs, E., 1988. Hydrologic precursors to earthquakes: a review. Pure Appl. Geophys. 126, 177–209.Roeloffs, E., 1996. Poroelastic techniques in the study of earthquake-related hydrologic phenomena. Adv. Geophys. 37, 135–
195.Roeloffs, E., 1998. Persistent water level changes in a well near Parkfield, California, due to local and distant earthquakes. J.
Geophys. Res. 103, 869–889.Scarascia, R., Cassinis, R., 1997. Crustal structures in the central-eastern Alpine sector: a revision of the available DSS data.
Tectonophysics 271, 157–188.Schorn, J., 1902. Die Erdbeben von Tirol und Voralberg, Zeitschrift d. Ferdinandeums, III. Folge, 46. Heft, Innsbruck.Selverstone, J., 1988. Evidence for east–west crustal extension in the eastern Alps: implications for the unroofing history of the
Tauern window. Tectonics 7, 87–105.Selverstone, J., Axen, G.J., Bartley, J.M., 1995. Fluid inclusion constraints on the kinematics of footwall uplift beneath the
Brenner Line normal fault, eastern Alps. Tectonics 14, 264–278.Shibata, T., Matsumoto, N., Akita, F., 2003. Fluctuation in groundwater level prior to the critical failure point of the crustal
rocks. Geophys. Res. Lett. 30 (1), 1024, doi:10.1029/2002GL016050.

336 A. Caporali et al. / Journal of Geodynamics 39 (2005) 317–336
Slejko, D., Carulli, G.B., Nicolich, R., Rebez, A., Zanferrari, A., Cavallin, A., Doglioni, C., Carraro, F., Castaldini, D., Iliceto,V., Semenza, E., Zanolla, C., 1989. Seismotectonics of the eastern southern-Alps: a review. Boll. Geof. Teor. Appl. 31 (122),109–136.
Valensise, G.L., Pantosti, D., 2001. Database of potential sources for earthquakes larger than M 5.5 in Italy. Annali di Geofisica44, 777–964.
Viola, G., Mancktelow, N., Seward, D., 2001. The late Oligocene–Neogene evolution of the Europa–Adria collision: newstructural and geochronological evidences from the Giudicarie fault system. Tectonics 20, 999–1020.
Wakita, H., 1975. Water wells as possible indicators of tectonic strain. Science 189, 553–555.Wells, D.L., Coppersmith, K.J., 1994. New empirical relationships among magnitude, rupture length, rupture width, rupture
area, and surface displacement. Bull. Seismol. Soc. Am. 84, 974–1002.