Embed Size (px)
Citation preview
Freeway Capacity Analysis
CE331 Transportation Engineering
2
Objectives
Understand the concept of level of service (LOS)
Define peak hour factor (PHF) Determine the LOS for a given
freeway Determine the number of lanes to
achieve a given LOS
3
Some Terms
CapacityMax hourly flow rate for a roadway
segment under existing conditions Free Flow Speed (FFS)
Speed of traffic when no vehicles are present
In practice, measured at flow < 1,300 pcphpl Level of Service (LOS)
Qualitative measure of traffic conditionsLevel of congestionMostly determined by density
4
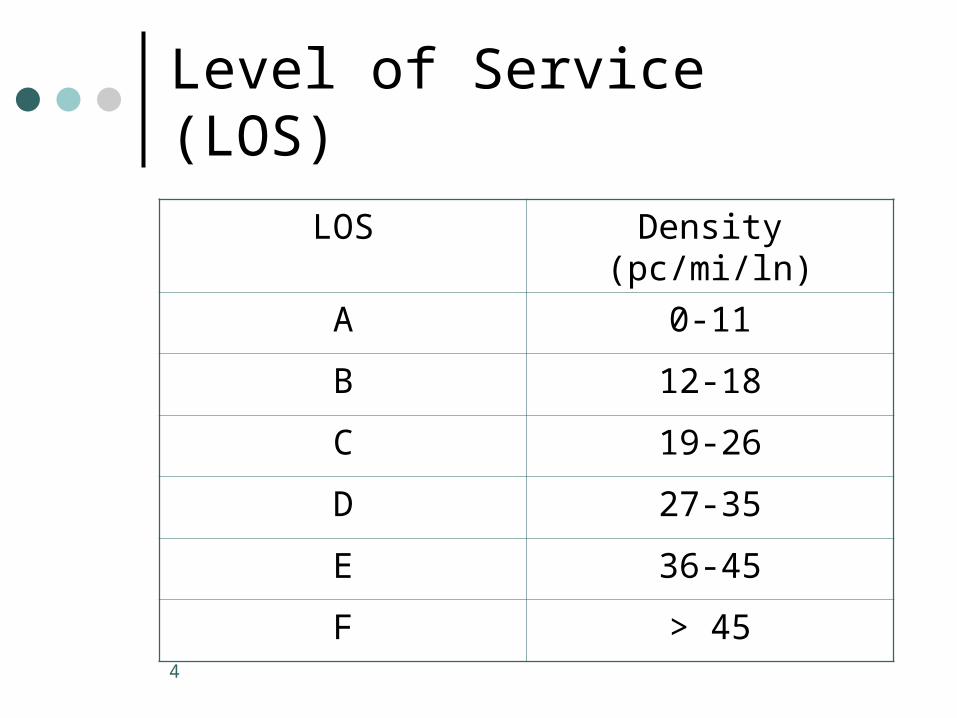
Level of Service (LOS)
LOS Density (pc/mi/ln)
A 0-11
B 12-18
C 19-26
D 27-35
E 36-45
F > 45
5
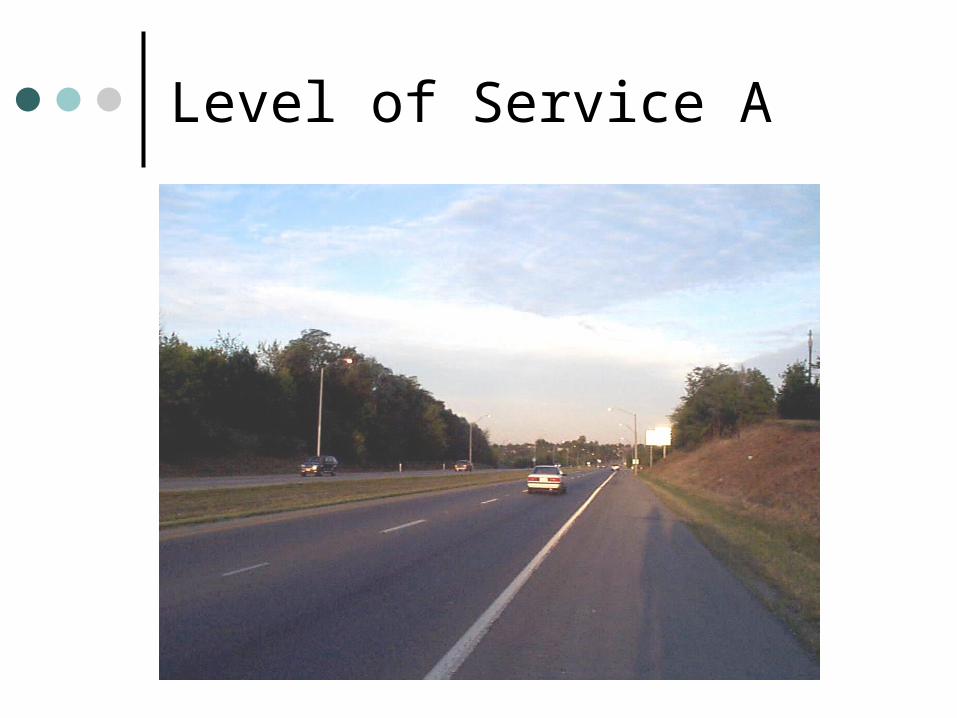
Level of Service A
6
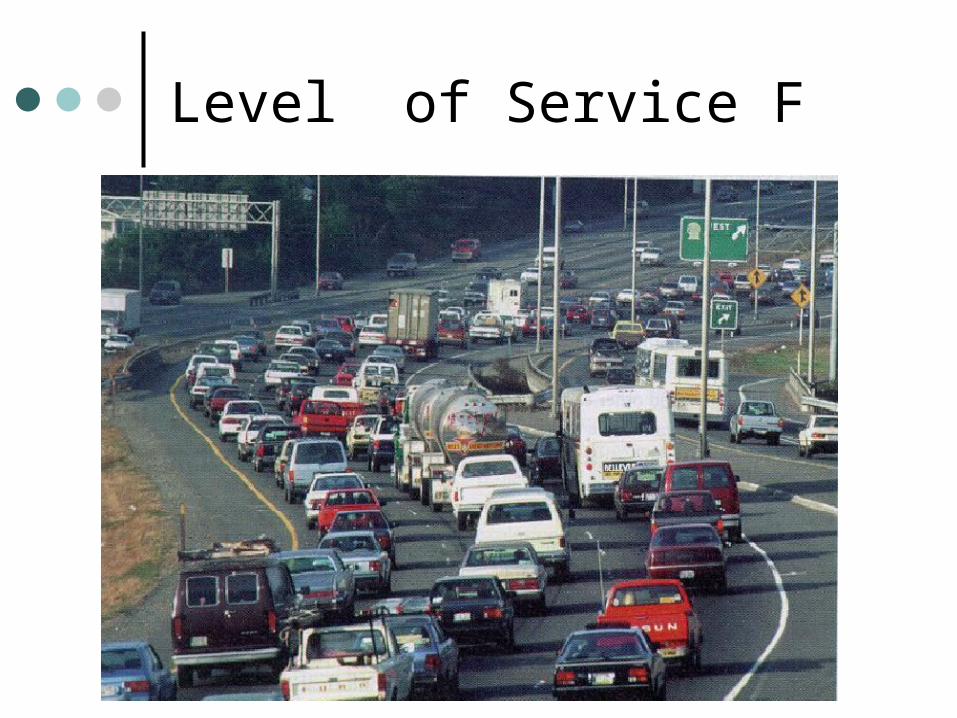
Level of Service F
7
Freeways
Limited access roads with high design standards, divided, and at least two lanes per direction

8
Freeway Components
Basic freeway sections Weaving areas Ramps and ramp junctions
Weaving area Basic freeway segment Ramp junction
9
“Ideal” Conditions
12-foot lanes 6-foot right shoulder 2-foot left shoulder Only passenger cars Leveled terrain Interchange density 0.5/mi (or 2-mile spacing) Everyday commuters Five or more lanes per direction (urban only)
10
Procedure for Determining LOS
1. Estimate free flow speed (FFS)2. Calculate equivalent flow rate (vp)3. Compute density (D=vp/S) and
compare D to values in Exhibit 23-3 to determine LOS
11
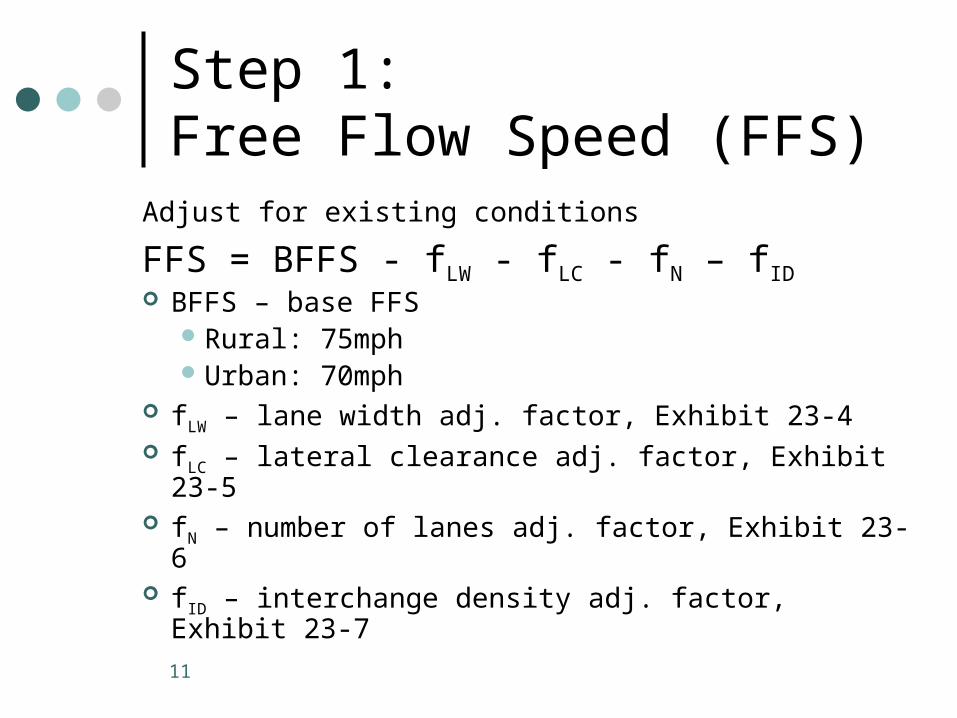
Step 1:Free Flow Speed (FFS)
Adjust for existing conditions
FFS = BFFS - fLW - fLC - fN – fID BFFS – base FFS
Rural: 75mphUrban: 70mph
fLW – lane width adj. factor, Exhibit 23-4 fLC – lateral clearance adj. factor, Exhibit 23-5 fN – number of lanes adj. factor, Exhibit 23-6 fID – interchange density adj. factor, Exhibit 23-7
12
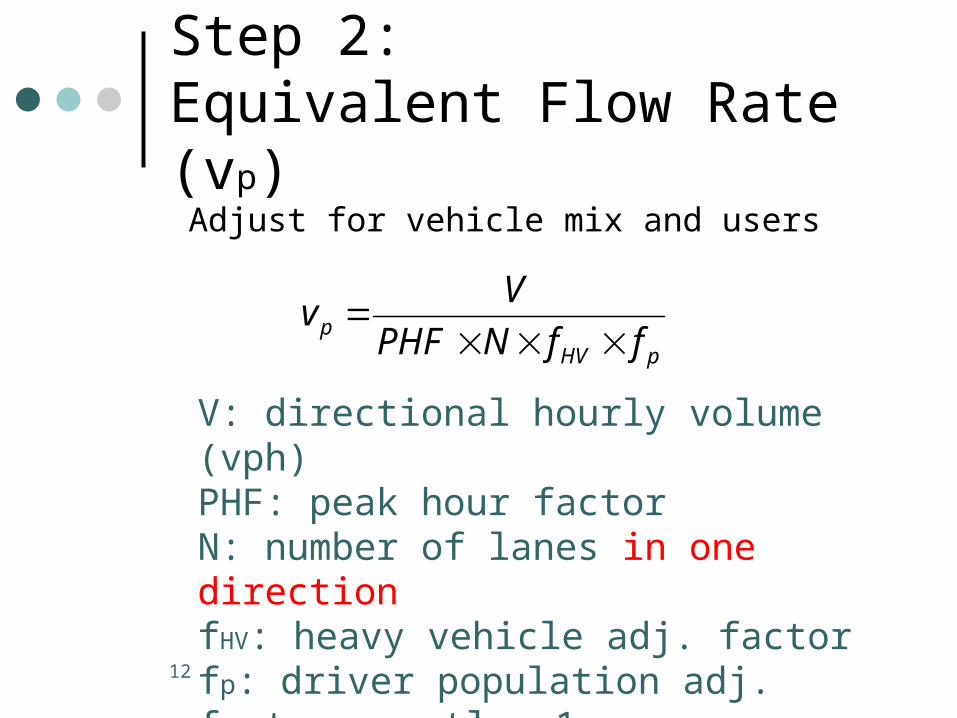
Step 2:Equivalent Flow Rate (vp)
Adjust for vehicle mix and users
pHVp ffNPHF
Vv
V: directional hourly volume (vph)PHF: peak hour factorN: number of lanes in one directionfHV: heavy vehicle adj. factorfp: driver population adj. factor, mostly =1

13
Peak Hour Factor (PHF)
Describes concentration of traffic within one hour
Definition:
V – hourly volumeV15 – maximum 15-min flow rate within
the hour
415V
VPHF
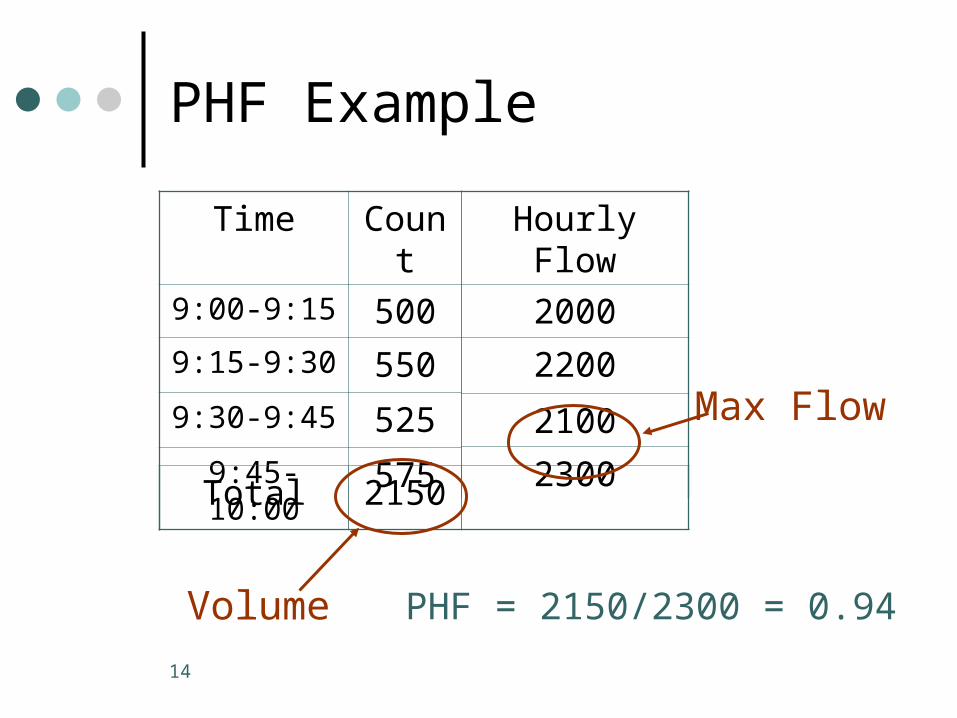
14
PHF Example
Time Count
9:00-9:15 500
9:15-9:30 550
9:30-9:45 525
9:45-10:00 575
Total 2150
Volume
Hourly Flow
2000
2200
2100
2300Max Flow
PHF = 2150/2300 = 0.94
15
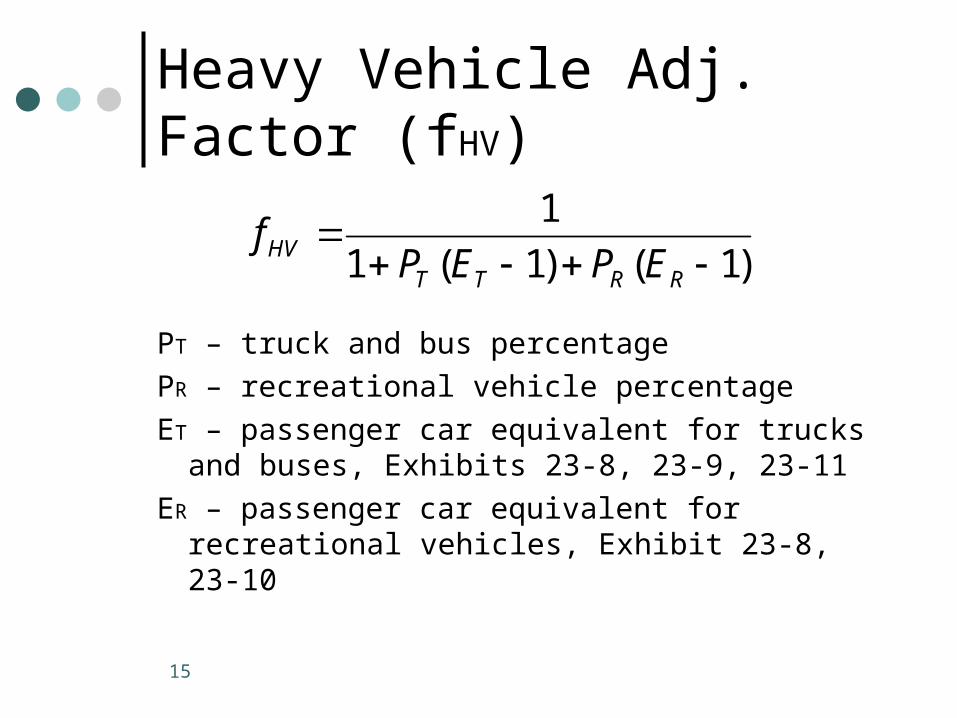
Heavy Vehicle Adj. Factor (fHV)
)1()1(1
1
RRTTHV EPEPf
PT – truck and bus percentage
PR – recreational vehicle percentage
ET – passenger car equivalent for trucks and buses, Exhibits 23-8, 23-9, 23-11
ER – passenger car equivalent for recreational vehicles, Exhibit 23-8, 23-10
16
Step 3:Calculate Density and Compare
Density (D) = vp / S Compare D with threshold values in
Exhibit 23-3 and determine LOS

17
Types of Analysis
Operational
Design & Planning
Determine LOS
Determine number of
lanes
18
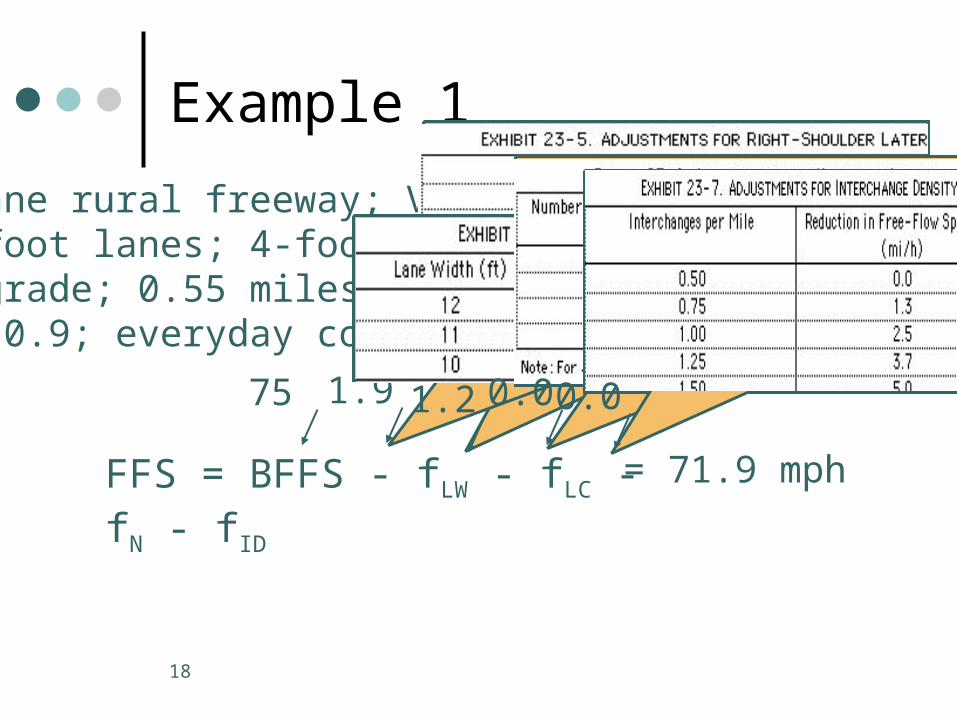
Example 1
4-Lane rural freeway; V=2,100 vph; 6% trucks; 11-foot lanes; 4-foot right and left shoulders; 3% grade; 0.55 miles; 0.25 interchanges/mile; PHF 0.9; everyday commuters. LOS?
FFS = BFFS - fLW - fLC - fN - fID
1.975
= 71.9 mph
1.2 0.0 0.0
19
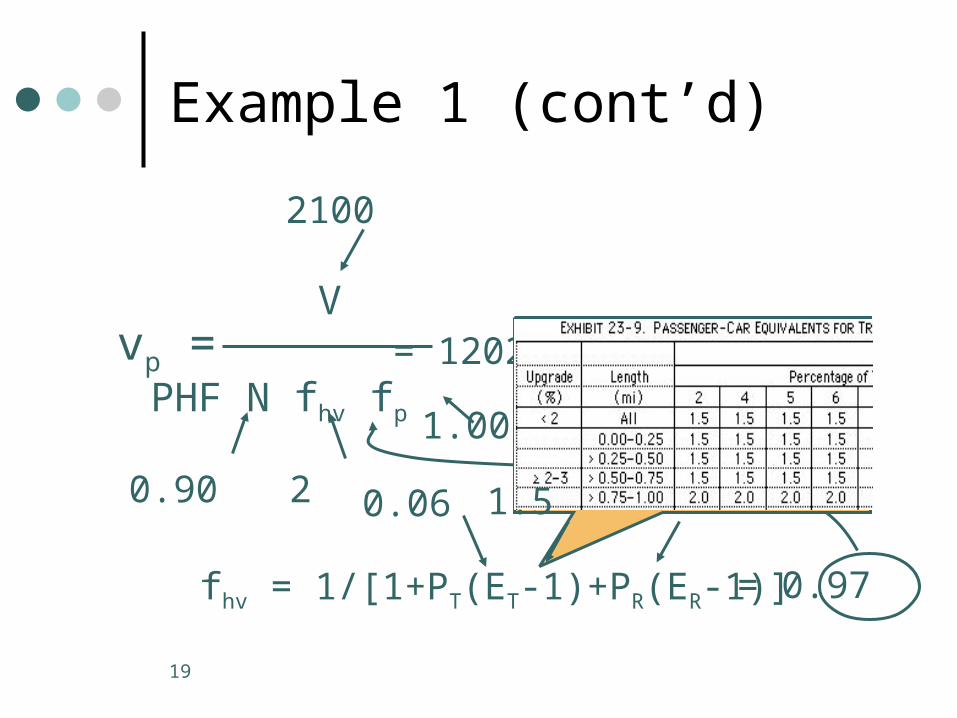
Example 1 (cont’d)
vp =V
PHF N fhv fp
2100
0.90 2
fhv = 1/[1+PT(ET-1)+PR(ER-1)]
0.06
= 0.97
0.0
1.00
= 1202 pcphpl
1.5
20
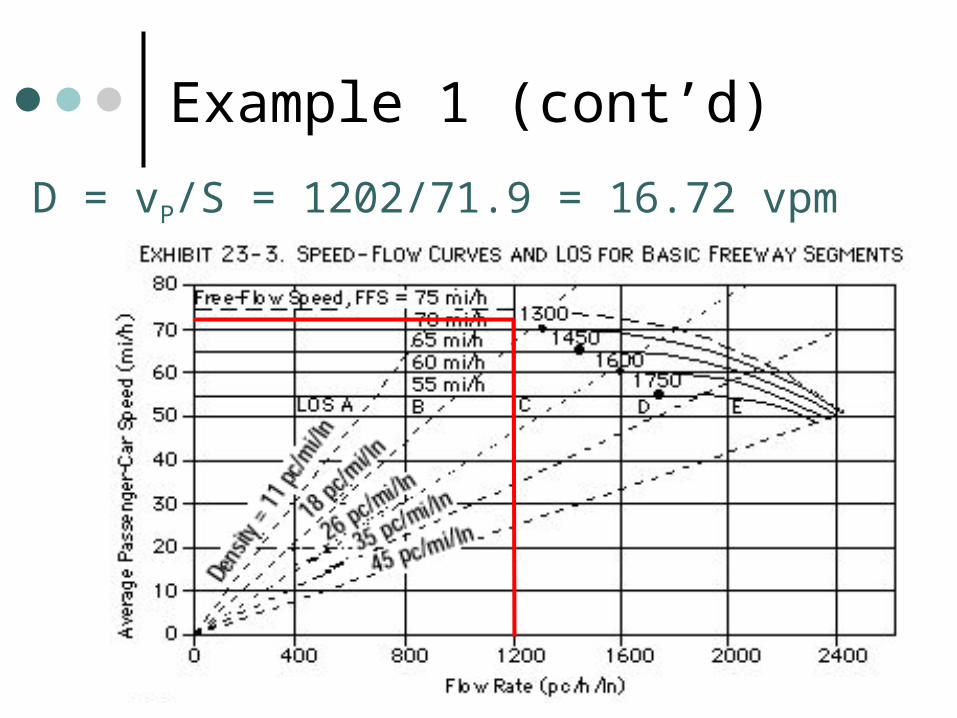
Example 1 (cont’d)
D = vP/S = 1202/71.9 = 16.72 vpm
21
Example 2
An urban freeway segment of 1.5 miles is expected to be designed under ideal conditions and it will be located on a 3% upgrade. The directional design hourly volume is expected to be 3,200vph and it will consist of 5% trucks, 5% recreational vehicles, and 90% passenger cars. Most drivers will be everyday commuters. If similar freeways showed a PHF=0.90 and no interchanges are planned within this section, determine the number of lanes required to accommodate the traffic at minimum LOS C.

Example 2(2/7)
FFS = BFFS - fLW - fLC - fN - fID
0.0 0.0 4.570 (urban) 0.0
= 65.5 mph
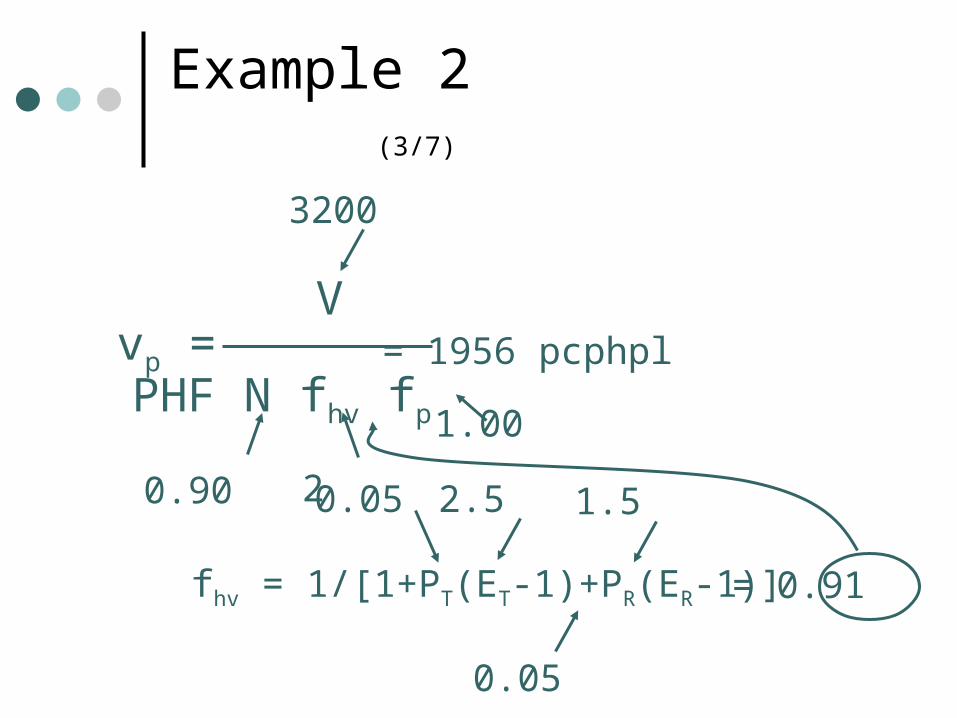
Example 2 (3/7)
vp =V
PHF N fhv fp
3200
0.90 2
fhv = 1/[1+PT(ET-1)+PR(ER-1)]
0.05 2.5
= 0.91
0.05
1.00
= 1956 pcphpl
1.5
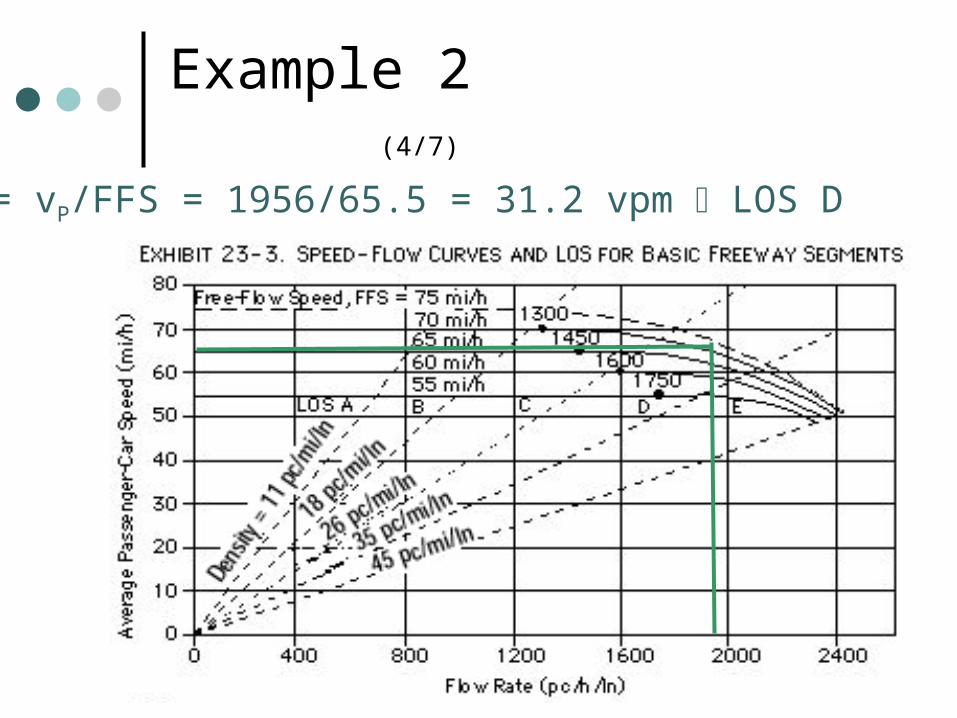
Example 2 (4/7)
D = vP/FFS = 1956/65.5 = 31.2 vpm LOS D
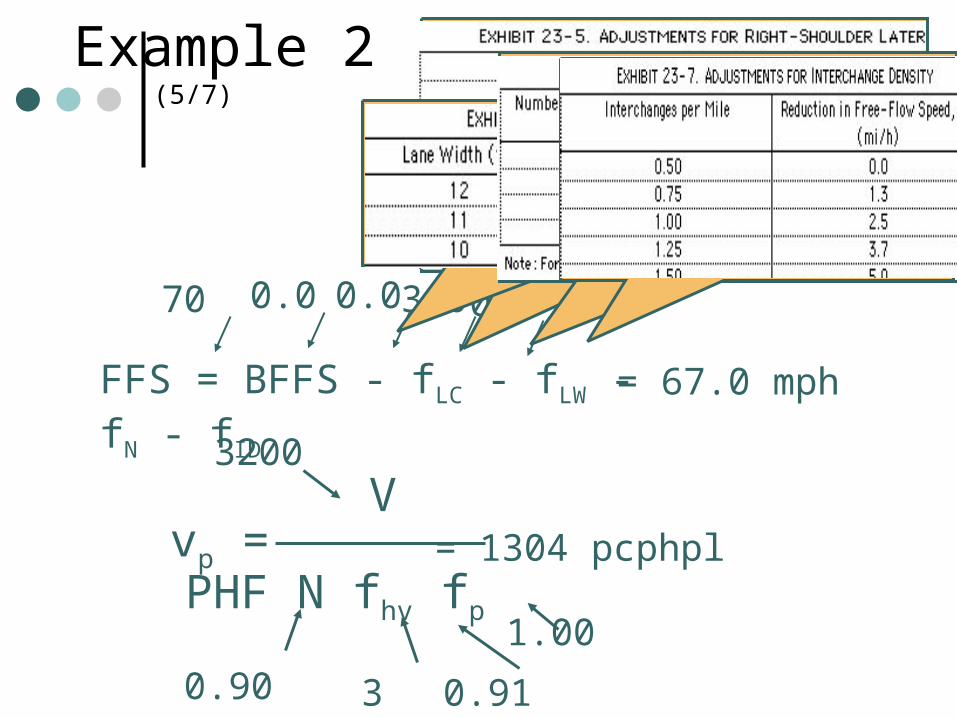
Example 2 (5/7)
FFS = BFFS - fLC - fLW - fN - fID
0.0 0.0 3.070 0.0
= 67.0 mph
vp =V
PHF N fhv fp
3200
0.90 3
1.00
= 1304 pcphpl
0.91
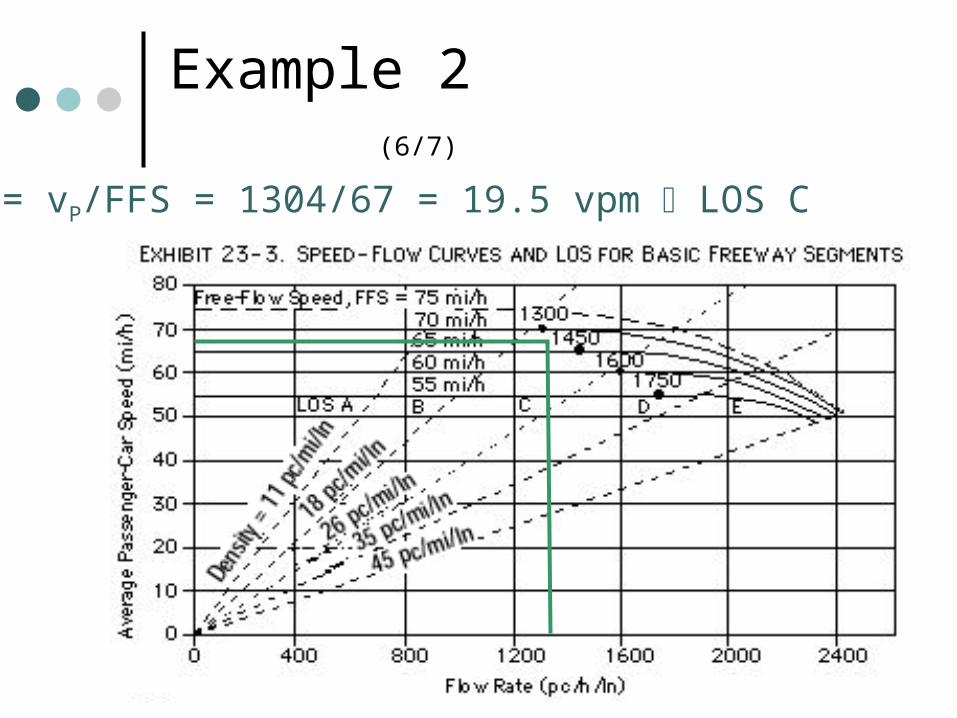
Example 2
(6/7)
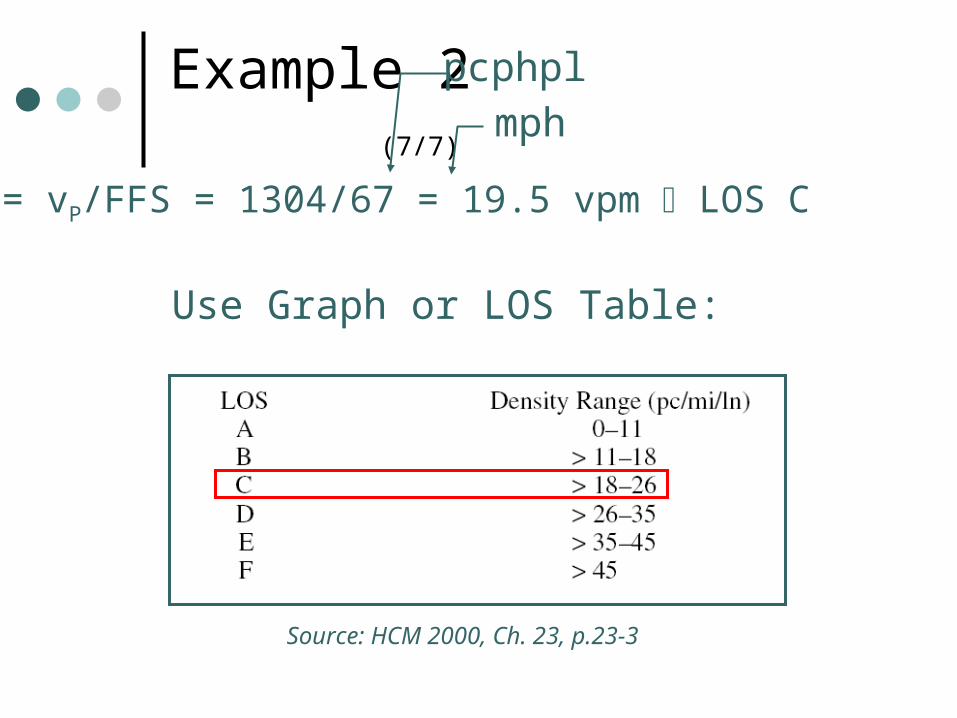
D = vP/FFS = 1304/67 = 19.5 vpm LOS C
Example 2
(7/7)
pcphplmph
Use Graph or LOS Table:
Source: HCM 2000, Ch. 23, p.23-3
D = vP/FFS = 1304/67 = 19.5 vpm LOS C