Embed Size (px)
Citation preview
Prefatory Note
The attached document represents the most complete and accurate version available based on original copies culled from the files of the FOMC Secretariat at the Board of Governors of the Federal Reserve System. This electronic document was created through a comprehensive digitization process which included identifying the best-preserved paper copies, scanning those copies,1 and then making the scanned versions text-searchable.2 Though a stringent quality assurance process was employed, some imperfections may remain.
Please note that this document may contain occasional gaps in the text. These gaps are the result of a redaction process that removed information obtained on a confidential basis. All redacted passages are exempt from disclosure under applicable provisions of the Freedom of Information Act.
1 In some cases, original copies needed to be photocopied before being scanned into electronic format. All scanned images were deskewed (to remove the effects of printer- and scanner-introduced tilting) and lightly cleaned (to remove dark spots caused by staple holes, hole punches, and other blemishes caused after initial printing). 2 A two-step process was used. An advanced optimal character recognition computer program (OCR) first created electronic text from the document image. Where the OCR results were inconclusive, staff checked and corrected the text as necessary. Please note that the numbers and text in charts and tables were not reliably recognized by the OCR process and were not checked or corrected by staff.
Strictly Confidential (FR)
MONETARY POLICY ALTERNATIVES
Prepared for the Federal Open Market Committee
By the staff Board of Governors of the Federal Reserve System
Class I FOMC
Strictly Confidential (FR)Class I - FOMC August 16, 1996
MONETARY POLICY ALTERNATIVES
Recent Developments
(1) By the time of the July 2-3 FOMC meeting, market
participants had mostly become convinced that no action to tighten
reserve market conditions would be taken at that meeting. As a
result, the decision to keep the federal funds rate at 5-1/4 percent
prompted only modest declines in rates at short maturities and no
reaction further along the yield curve. Maintaining the funds rate at
that intended level over the intermeeting period, however, proved
difficult at times in light of unpredictably high demand for reserves
at the end of July and in early August, and perhaps pressures spilling
over from the financing market. As a consequence, the federal funds
rate averaged a shade more than its intended level over the
intermeeting period.1
(2) Most market interest rates have declined 15 to 25 basis
points, on net, over the intermeeting period (chart). Rates rose
sharply in the days just after the July FOMC meeting as incoming data
were read by market participants as indicating that the economy was
straining its productive resources and pressures on labor costs were
mounting. Futures quotes (chart) indicated a presumption that the
funds rate would be hiked at the August FOMC meeting, and there was
even some market chatter that an intermeeting move was a distinct
possibility. While Chairman Greenspan's Humphrey-Hawkins' testimony
1. Reserve shortfalls--from the supply as well as the demandside--were met in part by borrowing at the discount window, so thatadjustment plus seasonal borrowing averaged about $30 million over itsallowance in the four maintenance periods completed since the Julymeeting. The allowance was raised twice, to $325 million, to reflectthe normal upsurge in seasonal borrowing at this time of year.
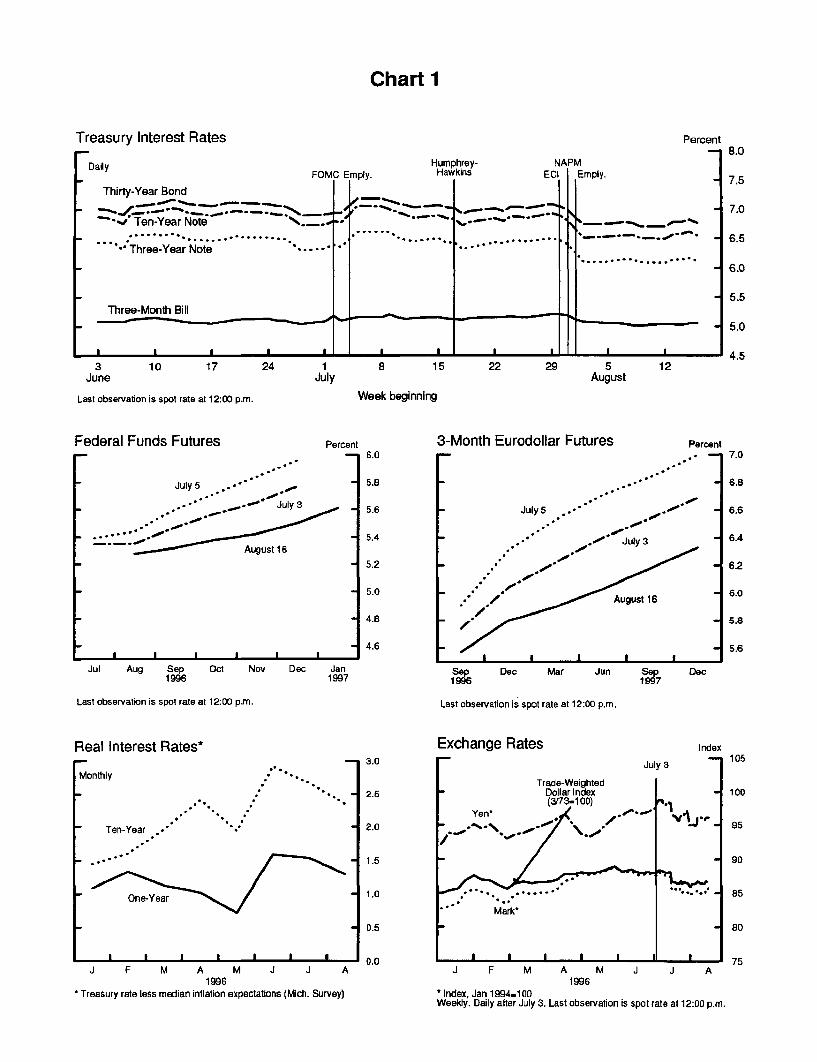
Chart 1
Treasury Interest Rates
[Daily
Thirty-Year Bond
.' Ten-Year Note .."" . **Te-.......Yr Ne....
* Three-Year Note *-*
3 10 17 24 1 8 15 22 29 5 12June July August
Last observation is spot rate at 12:00 p.m. Week beginning
Federal Funds Futures Percent
---.July 5 .. ** " .
* .- *" July 3
August 16
Jul Aug Sep Oct Nov Dec Jan1996 1997
Last observation is spot rate at 12:00 p.m.
Real Interest Rates*
Monthly * ** .
' *
Ten-Year .
One-Year
J F M A M J J A1996
STreasury rate less median inflation expectations (Mich. Survey)
3-Month Eurodollar Futures
August 16
I- - I -lSOp Dec Mar Jun 1S7
Last observation is spot rate at 12:00 p.m.
Percent
Dec
Exchange Rates Index
J F M A M J J A1996
*Index, Jan 1994=100Weekly. Daily after July 3. Last observation is spot rate at 12:00 p.m.
Percent

conveyed to the market the notion that inflation risks were clearly
tilted to the upside, it also raised the possibility that the economy
could settle into a sustainable growth path without policy action and
it flagged several upcoming data releases as important in assessing
that possibility. As those reports became available, they were seen,
by and large, to be pointing to a slowing in demand growth and only a
mild upturn in labor compensation, and a considerable decline in in-
terest rates ensued. Market participants have mostly discounted the
possibility of action at the upcoming FOMC meeting, and further-ahead
futures quotes seem consistent with high odds that policy would be on
hold for a considerable stretch. Yields on Treasury coupon securities
have declined 25 to 35 basis points since the Chairman's testimony.
While some of this decline probably reflects an easing of inflation
expectations, the sharp rebound in equity prices in recent weeks--
which were also helped by favorable earnings reports--and the easing
of the dollar in foreign exchange markets support the assessment that
much of the drop in interest rates represented a downward movement in
real rates. The decline, reflecting a reassessment of the path of
real rates needed to keep inflation pressures contained, likely
reversed only a fraction of the run-up in long-term real rates since
January.
(3) The dollar's foreign exchange value has decreased 1-1/4
percent on a weighted-average basis since the July FOMC meeting. The
dollar moved down 2-1/4 percent against the mark and 2 percent against
the yen. Japanese and German monetary policies remained on hold dur-
ing the period, and short-term interest rates in Japan and Germany
were little changed. Bond yields in Japan were also essentially un-
changed. Surprising the market by failing to reduce its RP rate,

Bundesbank officials stated that above-target money growth is still a
concern, although some of those officials apparently believe a further
easing might still be possible. Despite disappointed expectations
about German monetary policy, German bond yields decreased somewhat
during the period, possibly reflecting a reduction in inflation and
uncertainty premiums in German financial markets as doubts about the
implementation of European Monetary Union resurfaced.
The Desk did not intervene.
(4) The expansion of the monetary aggregates slowed more
abruptly in July than the staff had anticipated at the last FOMC meet-
ing. M2 grew at a 2-1/4 percent pace last month, down from a 5-1/2
percent rate in June, but still remained in the upper portion of its
annual range. Much of the weakness in July was accounted for by an
unexpected drop in demand deposits, which had posted unusually strong
growth in the first half of this year. Offsetting part of the recent
slowdown, currency growth has picked up some, apparently fueled by
shipments abroad. Contacts with currency shippers have indicated that
much of this cash is destined for Russia, but growing worldwide accep-
tance of the new hundred dollar bill also may have played a role.2
M2 apparently has not benefitted much from investors' recent skittish-
ness about long-term investments. Net inflows to stock and bond funds
fell off substantially in July, but little of that financial capital
2. M1 contracted at an 8-3/4 percent rate in July, but the initialeffects of new sweep activity accounts for about all of that decline.Bolstered by strength in currency, the monetary base grew at a 7-1/2percent rate last month and would have expanded at a 9-1/2 percentrate absent sweeps.
appears to have been redirected toward money market mutual funds or
retail deposits.
(5) The weaker growth of M2 showed through to M3, which ex-
panded at a 3-3/4 percent rate in July, about a percentage point
slower than in the previous month. This slower growth opened a little
room between M3 and the upper end of its annual range. Bank funding
needs apparently were weak, with bank credit growing at only a 1 per-
cent rate in July. Banks ran off their securities holdings at a 6-1/2
percent pace, even as lending diminished. The growth rates of both
real estate and consumer loans edged lower, but the former seems to
have been pulled down by a step-up in the pace of securitization.
Banks continue to pull back from their aggressive stance in seeking
consumer loans: In a recent survey, about half of the banks said that
they tightened their standards for approving credit card applications
and about a quarter tightened standards for other consumer installment
loans.
(6) Data on credit flows for July and early August, apart
from those provided by commercial banks, are sparse. The available
information suggests that the expansion of debt of nonfederal sectors
has slowed in recent months. In the household sector, consumer credit
growth fell off to around a 8-3/4 percent rate in the second quarter,
and mortgage borrowing remained moderate. Net bond issuance by non-
financial firms in July was a touch above its second-quarter rate, but
most of this reflected lessened reliance on shorter-term borrowing.
Credit continues to be readily available to business borrowers, with
spreads in securities markets still narrow and banks continuing to
3. With inflows to capital market funds estimated to be weak andequity prices, on average, lower, M2 plus stock and bond funds likelywas at a standstill in July, putting that measure about 7 percentabove its level in the fourth quarter of 1995.

-5-
offer accommodative loan terms. The runoff of the debt of state and
local governments persisted, with particularly hefty retirements
bunched at the beginning of July. Surprisingly strong tax inflows
allowed the Treasury to slash its borrowing in the second quarter, but
borrowing has since picked up. Overall, domestic nonfinancial debt
grew at a 4-3/4 percent pace in the second quarter. From the fourth
quarter to June, debt of the nonfinancial sectors expanded a 4-3/4
percent pace, putting the aggregate a tad below the midpoint of its
3 to 7 percent annual range.

MONEY, CREDIT, AND RESERVE AGGREGATES(Seasonally adjusted annual rates of growth)
QIVto
May June July July
Money and credit aggregates
M1Adjusted for retail sweeps
M2
M3
Domestic nonfinancial debtFederalNonfederal
Bank credit
Reserve measures
2Nonborrowed reserves
Total reservesAdjusted for retail sweeps
Monetary baseAdjusted for retail sweeps
Memo: (Millions of dollars)
Adjustment plus seasonalborrowing
Excess reserves
-6.82.0
-1.7
3.0
3.71.84.4
-21.6
-20.8-2.2
1.03.2
860
-0.57.9
5.5
4.7
-8.8 -2.7-0.5 6.0
2.3
3.7
3.82.54.3
1.5
-8.3
-2.513.9
5.77.9
386
1150
-20.0
-20.3-2.8
7.69.4
4.4
5.8
4.73.75.0
-9.2
-8.88.3
2.85.1
368
1066
1. QIV to June for debt aggregates.2. Includes "other extended credit" from the Federal Reserve.
NOTE: Monthly reserve measures, including excess reserves and borrow-ing, are calculated by prorating averages for two-week reservemaintenance periods that overlap months. Reserve data incor-porate adjustments for discontinuities associated with changesin reserve requirements.

Policy Alternatives
(7) Reports since the last FOMC meeting have suggested that,
on balance, aggregate measures of spending, production, and inflation
are coming in fairly close to staff projections. Wage and total labor
compensation figures, though, have seemed more clearly to point to an
acceleration in recent quarters. Even with economic expansion pro-
jected by the staff to slow to around the growth rate of potential
output over the next year and a half, resource utilization would re-
main high. Moreover, the just-passed federal minimum wage hike, not
previously assumed in the staff forecast, will add to future labor-
cost pressure on prices. As a result, the staff envisions that an
uptrend in core CPI inflation will become apparent over the coming
year, even after methodological improvements in that price measure.
The increase in the CPI for 1997 in the staff forecast would be a
little above the central tendency range of FOMC members in the
Humphrey-Hawkins' report, even though the real growth and unemployment
outcomes for 1997 would be consistent with the central tendencies for
these measures.
(8) Nonetheless, the Committee may well feel that it can
afford to wait, as in alternative B, for additional data to accumulate
to allow a more confident judgment concerning whether an underlying
process of rising inflation seems to be taking hold. Arguably, the
upturn in the compensation trend is not firmly established in a
statistical sense, leaving questions about the level of the NAIRU.
And even if wages have begun to accelerate, the profit share may be
sufficiently high to cushion the extent to which faster increases in
labor compensation are passed through to prices for a time. Even if
the staff assessment of emerging price pressures is confirmed, with
the economy still close to its potential, the pickup in inflation
would be gradual. Consequently, as long as a slowdown in real GDP
growth of the dimension foreseen by the staff still appears to be in
train, the case for an immediate policy tightening may not be seen as
compelling. While keeping policy on hold for a time in these cir-
cumstances might imply the need for a greater tightening later to
reverse the pickup in inflation, so long as the action were not post-
poned too long, a wrenching adjustment to output should be avoidable.
(9) The decision at this FOMC meeting to leave the policy
stance unchanged would accord with the current market consensus.
Still, the elimination of the small perceived chance of a tightening
at this FOMC meeting could cause interest rates to slip off, but only
a bit, and the exchange value of the dollar would remain around recent
levels. Over the next few weeks, when new information on the economy
will be relatively sparse, market interest rates probably would be
little changed. Subsequently, markets could be quite volatile in
response to the heavier flow of economic news, as participants sort
out its implications against the background of a Federal Reserve
characterized by Chairman Greenspan as "especially vigilant to in-
cipent inflation pressures." A partial retracing of the recent bond
market rally cannot be ruled out, if, consistent with the staff fore-
cast, incoming indicators suggest prospective inflation pressures.
(10) The Committee instead may wish to implement the 25 basis
point increase in the intended federal funds rate involved in alterna-
tive C. Especially in light of the recent low level of initial claims
and the upside potential for inventory stocking, the Committee may
question the staff forecast that economic activity is likely to down-
shift in the near term by enough to stabilize resource utilization.
Alternatively, even if the Committee does expect growth in real ag-
gregate demand soon to line up with that of potential output, it may
be troubled by the strains on resource availability and the uptrend in
core inflation embodied in the staff forecast. Particularly with the
upward pressure on prices from the minimum wage hike, a rise in the
nominal funds rate would be necessary at some point just to keep the
real rate from falling and thus the stance of policy from effectively
easing, unless the economy is appreciably weaker or output-price
tradeoffs considerably more favorable than the staff predicts. An
immediate tightening of 1/4 percentage point would increase the like-
lihood of holding the line against an upcreep in core inflation by
better ensuring an eventual relief of pressures on resources. Such a
tightening might be viewed as a fairly typical policy reaction to the
revision to the outlook since the Committee last eased at the end of
January. From the February monetary policy report to that in July,
the members' central tendencies for real GDP growth and CPI inflation
for 1996 were revised up by 1/2 and 1/4 points, respectively. In
light of these revisions and their implications for the longer-term
outlook, an immediate 25 basis point tightening, or perhaps one of 50
basis points, would be even more warranted if the Committee were seek-
ing to move policy over time to a stance restrictive enough to put a
downward tilt to the inflation rate in 1997 and beyond.
(11) Given the recent adjustment to their expectations for
monetary policy, market participants would be somewhat surprised by a
Committee decision to raise its intended federal funds rate by 25
basis points, as under alternative C. Other short-term market rates
would immediately adjust upward by a like amount. Because the likely
-10-
trajectory of short-term interest rates would be higher over the in-
termediate run than previously expected by the market, some increases
in longer-term interest rates and in the exchange value of the dollar
would occur. The size of the upward adjustments would depend in part
on whether the market saw the policy firming as an isolated event or
the first of a series of policy tightenings. Some market participants
apparently sense that the Committee may require extra evidence to
change direction in monetary policy, and hence might assume that
Committee members now see the potential inflationary situation as
having worsened appreciably and may be contemplating more than one
small move. In that regard, the announcement accompanying the policy
tightening presumably could provide some guidance to the market on
these matters.
(12) The debt of domestic nonfinancial sectors is projected
by the staff to expand at about a 4-1/4 percent rate over the second
half of this year, slower than the first-half pace and leaving growth
for the year a little below the midpoint of its annual range. The
moderation is concentrated in the household sector. Still-high fixed-
rate mortgage costs should begin to bite more into residential housing
activity and mortgage lending. Consumer credit should also decelerate
over the second half in keeping with diminished growth in outlays on
durables and a more cautious approach to such credit by both house-
holds and banks. Meanwhile, credit for business should remain avail-
able on favorable terms both from banks and in securities markets.
Business borrowing should continue to be moderate, supported by large
equity retirements and inventory restocking.
(13) The staff has revised down its projection of the growth
of M2 and M3 for this year under the unchanged funds rate of the

-11-
greenbook forecast by 1/4 percentage point each to 4-3/4 percent and
5-3/4 percent, respectively (see table). The slight downward revi-
sions primarily reflect weaker than expected money growth in July.
The recent lull in M2 growth is not expected to persist, however. For
one thing, demand deposits should return to a more normal pace of
expansion. More fundamentally, M2 growth will be buoyed by moderate
growth in nominal GDP while opportunity costs experience little fur-
ther change. The projected strengthening in M2 is expected to show
through to M3, but the pickup in M3 growth likely will be restrained
to a degree by a sluggish projected advance in bank credit. M1 will
continue to be depressed by additional sweeps; M1 adjusted for the
initial effects of such sweeps is projected to grow at a 6-1/2 percent
pace this year.4
Growth Rates of Money and Debt(percent, annual rates)
July 1995-Q4to to
December 1996-Q4
M2 5 4-3/4M3 5-1/2 5-3/4
M1 -3 -2-3/4Adjusted for sweeps 7 6-1/2Debt 4-1/4 4-1/2
1. June to December for domestic nonfinancial debt.
4. From July to December, the monetary base is projected to grow ata 6 percent annual rate. Abstracting from sweeps, the growth ratewould be 8-1/2 percent.

Alternative Levels and Growth Rates for Key Monetary Aggregates
M2 M3 M1
Alt. B Alt. C Alt. B Alt. C Alt. B Alt. C
Levels in BillionsMay-96 3730.7 3730.7 4705.1 4705.1 1117.2 1117.2Jun-96 3747.8 3747.8 4723.5 4723.5 1116.7 1116.7Jul-96 3755.0 3755.0 4738.2 4738.2 1108.5 1108.5Aug-96 3769.4 3769.1 4759.1 4758.9 1102.8 1102.7Sep-96 3785.1 3783.8 4780.2 4779.4 1100.4 1099.9Oct-96 3800.9 3798.3 4801.3 4799.7 1098.5 1097.5Nov-96 3817.0 3813.3 4822.9 4820.6 1096.6 1095.0Dec-96 3833.2 3828.6 4844.6 4841.8 1095.2 1092.8
Monthly Growth RatesMay-96 -1.7 -1.7 3.0 3.0 -6.8 -6.8Jun-96 5.5 5.5 4.7 4.7 -0.5 -0.5Jul-96 2.3 2.3 3.7 3.7 -8.8 -8.8Aug-96 4.6 4.5 5.3 5.3 -6.2 -6.3Sep-96 5.0 4.7 5.3 5.2 -2.6 -3.0Oct-96 5.0 4.6 5.3 5.1 -2.1 -2.7Nov-96 5.1 4.7 5.4 5.2 -2.1 -2.7Dec-96 5.1 4.8 5.4 5.3 -1.5 -2.4
Quarterly Averages96 Q1 5.9 5.9 7.2 7.2 -2.7 -2.796 Q2 4.1 4.1 5.4 5.4 -0.6 -0.796 Q3 3.4 3.3 4.4 4.4 -5.5 -5.596 Q4 5.0 4.7 5.4 5.2 -2.6 -3.1
Growth RateFrom ToDec-95 Jul-96 4.3 4.3 6.1 6.1 -2.5 -2.5Jul-96 Dec-96 5.0 4.7 5.4 5.2 -2.9 -3.4
95 Q4 Jul-96 4.4 4.4 5.8 5.8 -2.7 -2.794 Q4 95 Q4 4.0 4.0 5.9 5.9 -1.8 -1.895 Q4 96 Q4 4.7 4.6 5.7 5.7 -2.8 -3.0
1996 Target Ranges: 1.0 to 5.0 2.0 to 6.0
-13-
Directive Language
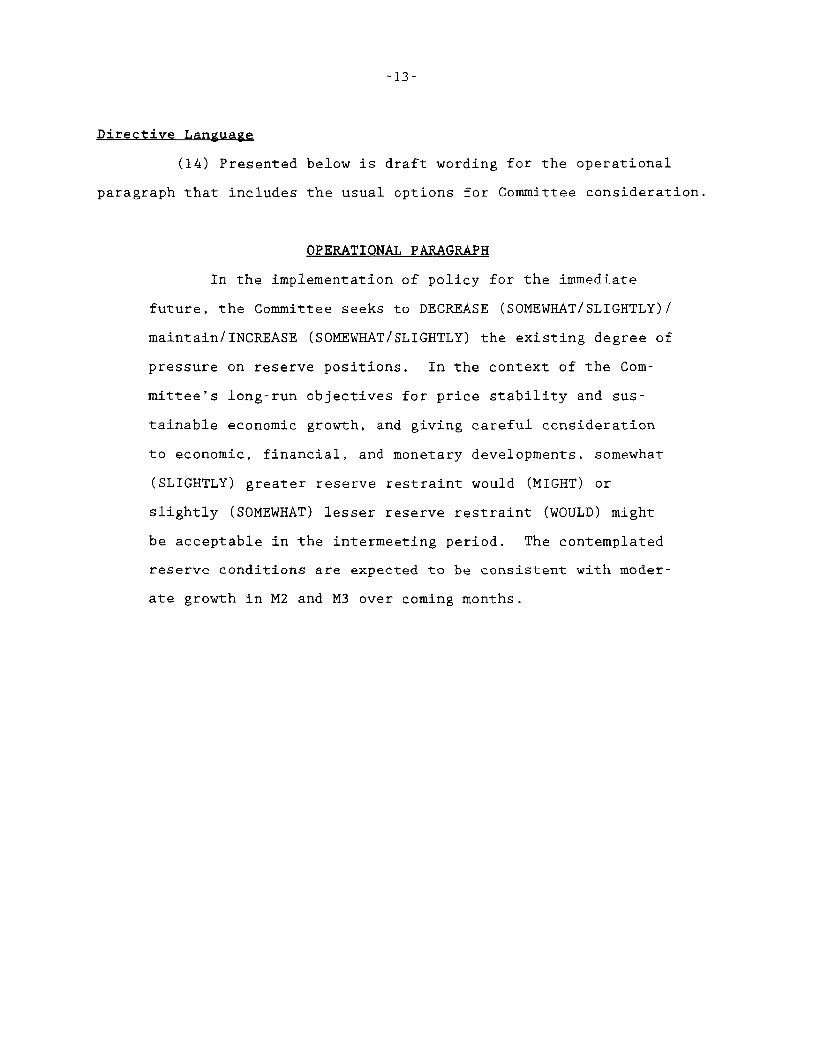
(14) Presented below is draft wording for the operational
paragraph that includes the usual options for Committee consideration.
OPERATIONAL PARAGRAPH
In the implementation of policy for the immediate
future, the Committee seeks to DECREASE (SOMEWHAT/SLIGHTLY)/
maintain/INCREASE (SOMEWHAT/SLIGHTLY) the existing degree of
pressure on reserve positions. In the context of the Com-
mittee's long-run objectives for price stability and sus-
tainable economic growth, and giving careful consideration
to economic, financial, and monetary developments, somewhat
(SLIGHTLY) greater reserve restraint would (MIGHT) or
slightly (SOMEWHAT) lesser reserve restraint (WOULD) might
be acceptable in the intermeeting period. The contemplated
reserve conditions are expected to be consistent with moder-
ate growth in M2 and M3 over coming months.

August 15, 1996
SELECTED INTEREST RATES(percent)
Short-Term Long-TermCOs money corporate conventional home mortgages
federal Treasury bills secondary comm. market bank U.S. govemment constant A-utility municipal secondary primaryfunds secondary market market paper mutual prime maturity yields recently Bond market marketS3-month 6-month -year 3-month 1-month fund loan -year 10-year 30-year offered Buyer fixed-rate fixed-rate ARM
1 2 3 4 5 6 7 8 9 10 11 12 13 14 15 16
95 -- High-- Low
96 -- High-- Low
MonthlyAug 95Sep 95Oct 95Nov 95Dec 95
Jan 96Feb 96Mar 96Apr 96May 96Jun 96Jul 96
WeeklyApr 24 96
May 1 96May 8 96May 15 96May 22 96May 29 96
Jun 5 96Jun 12 96Jun 19 96Jun 26 96
Jul 3 96Jul 10 96Jul 17 96Jul 24 96Jul 31 96
Aug 7 96Daily
Aug 9 96Aug 13 96Aug 14 96
6.21 5.81 6.31 6.75 6.39 6.10 5.61 9.005.40 4.89 5.05 4.98 5.55 5.73 5.16 8.50
5.61 5.18 5.37 5.61 5.57 5.73 5.15 8.505.08 4.79 4.71 4.57 5.13 5.28 4.73 8.25
5.74 5.40 5.41 5.43 5.77 5.85 5.27 8.755.80 5.28 5.30 5.31 5.73 5.82 5.24 8.755.76 5.28 5.32 5.28 5.79 5.81 5.20 8.755.80 5.36 5.27 5.14 5.74 5.80 5.26 8.755.60 5.14 5.13 5.03 5.62 5.84 5.20 8.65
5.56 5.00 4.92 4.82 5.39 5.56 5.05 8.505.22 4.83 4.77 4.69 5.15 5.29 4.85 8.255.31 4.96 4.96 5.06 5.29 5.39 4.76 8.255.22 4.95 5.06 5.23 5.36 5.40 4.75 8.255.24 5.02 5.12 5.33 5.36 5.38 4.74 8.255.27 5.09 5.25 5.48 5.46 5.45 4.76 8.255.40 5.15 5.30 5.52 5.53 5.44 4.81 8.25
5.24 4.92 5.04 5.20 5.35 5.38 4.73 8.25
5.30 4.99 5.06 5.28 5.35 5.39 4.75 8.255.22 5.00 5.13 5.37 5.38 5.40 4.73 8.255.26 5.00 5.10 5.30 5.36 5.39 4.74 8.255.22 5.02 5.12 5.26 5.35 5.37 4.74 8.255.19 5.04 5.13 5.33 5.34 5.37 4.74 8.25
5.33 5.06 5.17 5.44 5.39 5.41 4.76 8.255.24 5.12 5.29 5.51 5.47 5.43 4.75 8.255.45 5.08 5.26 5.47 5.47 5.44 4.77 8.255.21 5.11 5.25 5.51 5.48 5.48 4.78 8.25
5.53 5.09 5.21 5.43 5.47 5.49 4.81 8.255.26 5.17 5.37 5.61 5.57 5.47 4.81 8.255.23 5.13 5.29 5.49 5.55 5.45 4.78 8.255.25 5.15 5.29 5.51 5.52 5.41 4.80 8.255.53 5.18 5.30 5.54 5.54 5.42 4.82 8.25
5.38 5.06 5.12 5.32 5.43 5.41 4.87 8.25
5.10 5.01 5.11 5.27 5.41 5.384.89 5.03 5.11 5.31 5.39 5.385.22 5.02 5.10 5.29 5.39 5.39
8.258.258.25
7.80 7.85 7.895.36 5.68 6.06
6.59 7.02 7.164.95 5.59 5.97
6.10 6.49 6.865.89 6.20 6.555.77 6.04 6.375.57 5.93 6.265.39 5.71 6.06
5.20 5.65 6.055.14 5.81 6.245.79 6.27 6.606.11 6.51 6.796.27 6.74 6.936.49 6.91 7.066.45 6.87 7.03
6.11 6.54 6.80
6.15 6.61 6.856.36 6.85 7.066.24 6.72 6.916.20 6.65 6.846.25 6.69 6.88
6.42 6.84 6.986.52 6.94 7.076.50 6.95 7.106.52 6.94 7.09
6.36 6.78 6.946.59 7.02 7.166.45 6.86 7.046.40 6.80 6.986.45 6.87 7.04
6.14 6.56 6.77
6.09 6.50 6.706.14 6.57 6.786.14 6.58 6.78
8.81 6.94 9.57 9.22 6.876.98 5.65 7.40 7.11 5.53
8.23 6.34 8.72 8.42 6.017.00 5.63 7.35 6.94 5.19
7.84 6.37 8.24 7.86 5.937.55 6.18 8.01 7.64 5.817.36 6.05 7.88 7.48 5.747.30 5.89 7.79 7.38 5.647.10 5.74 7.53 7.20 5.57
7.09 5.72 7.45 7.03 5.447.31 5.73 7.51 7.08 5.317.75 6.07 8.07 7.62 5.517.90 6.20 8.32 7.93 5.738.02 6.22 8.46 8.07 5.778.13 6.25 8.59 8.32 5.928.07 6.15 8.56 8.25 5.98
7.90 6.16 8.26 7.92 5.74
8.22 6.32 8.56 7.99 5.768.01 6.32 8.43 8.24 5.807.92 6.17 8.37 8.08 5.787.90 6.10 8.38 8.01 5.758.08 6.17 8.54 8.03 5.76
8.12 6.20 8.64 8.30 5.868.20 6.34 8.64 8.39 5.918.20 6.27 8.59 8.30 5.937.97 6.20 8.48 8.29 5.98
8.23 6.15 8.72 8.14 5.948.09 6.24 8.56 8.42 6.018.01 6.10 8.44 8.23 5.978.06 6.10 8.53 8.19 6.017.76 6.02 8.20 8.23 5.98
7.73 5.92 8.21 7.88 5.89
NOTE: Weekly data for columns 1 through 11 are statement week averages. Data in column 7 are taken from Donoghue's Money Fund Report. Columns 12,13 and 14 are 1-day quotes for Friday, Thursday or Friday, respectively,following the end of the statement week. Column 13 is the Bond Buyer revenue index. Column 14 is the FNMA purchase yield, plus loan servicing fee, on 30-day mandatory delivery commitments. Column 15 is the averagecontract rate on new commitments for fixed-rate mortgages (FRMs) with 80 percent loan-to-value ratios at major institutional lenders. Column 16 is the average initial contract rate on new commitments for 1-year, adjustable-rate mortgages (ARMs) at major institutional lenders offering both FRMs and ARMs with the same number of discount points.

Strictly Confidential (FR)-
Money and Credit Aggregate Measures class FOMC
Sesonally adjusted AUGUST 19, 1996
Money stock measures and liquid assets Bank credit Domestic nonfinancial debt
nontransactions components tototal loans
Period M1 M2 M3 L and U. S. other= total'In M2 In M3 only investments' gove m ment2
1 2 3 4 5 6 7 8 9 ~ 1Annual arowth rates(%) t
Annually (Q4 to Q4)1993 10.5 1.4 -2.4 -0.5 1.0 1.4 5.0 8.4 4.1 5.21994 2.4 0.6 -0.3 6.2 1.6 2.6 6.8 5.7 5.1 5.21995 -1.8 4.0 6.8 14.5 5.9 7.3 8.7 4.4 6.1 5.6
Quarterly (average)1995-Q3 -1.5 6.9 10.9 12.1 7.9 9.1 6.6 4.6 5.0 4.91995-Q4 -5.1 4.1 8.3 6.3 4.5 5.9 4.8 2.3 5.5 4.71996-Q1 -2.7 5.9 9.7 12.6 7.2 5.1 5.3 2.7 5.4 4.71996-Q2 -0.6 4.1 6.1 10.6 5.4 2.5 5.2 4.7 4.8
Monthly1995-JULY 0.9 6.3 8.8 12.3 7.5 10.7 5.7 4.3 3.1 3.4
AUG. -1.7 6.6 10.5 10.3 7.3 7.8 5.2 2.0 5.9 4.8SEP. -3.8 4.3 8.1 9.6 5.4 9.9 7.7 0.8 5.1 3.9OCT. -8.8 2.5 7.6 10.4 4.1 5.8 3.6 2.9 5.2 4.6NOV. -3.0 4.0 7.1 -0.1 3.2 1.4 4.0 4.4 6.8 6.2DEC. -4.4 5.7 10.3 -3.7 3.8 5.4 3.7 -0.4 4.5 3.2
1996-JAN. -6.1 4.8 9.7 18.0 7.5 4.0 9.6 -2.0 5.2 3.3FEB. -2.0 5.4 8.6 28.6 10.1 4.4 4.6 7.6 6.2 6.6MAR. 10.0 11.7 12.4 9.0 11.1 12.6 -2.0 11.2 4.3 6.1APR. -3.2 1.9 4.1 1.5 1.8 4.5 5.9 3.6 4.8 4.5MAY -6.8 -1.7 0.6 21.2 3.0 -1.0 1.3 1.8 4.4 3.7JUNE -0.5 5.5 8.1 1.5 4.7 1.5 2.5 4.3 3.8JULY p -8.8 2.3 7.0 9.3 3.7 1.0
Levela (Sbillions).Monthly
1996-MAR. 1126.6 3729.9 2603.3 956.3 4686.2 5785.4 3641.4 3696.0 10384.4 14080.4APR. 1123.6 3735.9 2612.3 957.5 4693.4 5807.2 3659.3 3707.0 10425.9 14132.9MAY 1117.2 3730.7 2613.5 974.4 4705.1 5802.5 3663.4 3712.6 10464.4 14177.0JONE 1116.7 3747.8 2631.2 975.6 4723.5 3668.1 3720.2 10502.1 14222.4JULY p 1108.5 3755.0 2646.5 983.2 4738.2 3671.3
Weekly1996-JULY 1 1118.0 3749.4 2631.4 972.4 4721.8
8 1106.0 3753.9 2647.9 983.2 4737.115 1102.6 3747.5 2645.0 984.1 4731.622 1107.1 3754.0 2646.9 984.1 4738.129 p 1111.3 3756.3 2645.0 983.7 4740.0
AUG. 5 p 1108.0 3766.2 2658.2 982.4 4748.6
1. Adjusted for breaks caused by reclassifications.2. Debt data are on a monthly average basis, derived by averaging end-of-month levels of adjacent months, and have been adjusted to remove discontinuities.
p preliminarype preliminary estimate
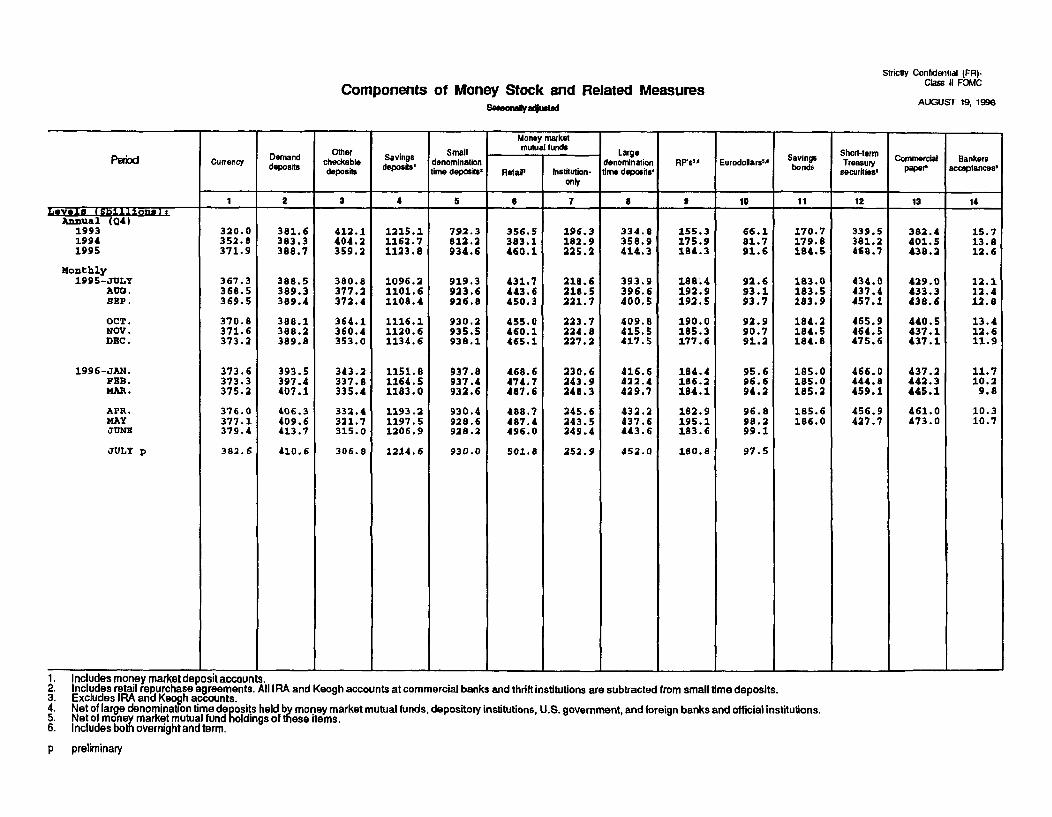
Strictly Confidential (FR)-Class I FOMC
AUGUST 19, 1996Components of Money Stock and Related Measures
Samonay4umted
Money market
Other Small mutualfunds Large Short-termurrency mand checkable Sa s denomination denomination RP's Eurodollars Svin Treasury Comm ial Bankers
dep
os deposits deposit time deposits. Retail' Institution- time deposits' b securities pape acceptances'
only
1 2 3 5 1 7 8 I 10 11 12 13 14IreVjee I a.j.Oions1I
Annual (Q4)199319941995
Monthly1995-JULY
ADO.SEP.
OCT.NOV.DEC.
1996-JAN.PEB.MAR.
APR.MAYJUNE
JULY p
320.0352.8371.9
367.3368.5369.5
370.8371.6373.2
373.6373.3375.2
376.0377.1379.4
382.6
381.6383.3388.7
388.5389.3389.4
388.1388.2389.8
393.5397.4407.1
406.3409.6413.7
410.6
412.1404.2359.2
380.8377.2372.4
364.1360.4353.0
343.2337.8335.4
332.4321.7315.0
306.8
1215.11162.71123.8
1096.21101.61108.4
1116.11120.61134.6
1151.81164.51183.0
1193.21197.51206.9
1214.6
792.3 356.5 196.3812.2 383.1 182.9934.6 460.1 225.2
919.3923.6926.8
930.2935.5938.1
937.8937.4932.6
930.4928.6928.2
930.0
431.7443.6450.3
455.0460.1465.1
468.6474.7487.6
488.7487.4496.0
501.8
218.6218.5221.7
223.7224.8227.2
230.6243.9248.3
245.6243.5249.4
252.9
334.8358.9414.3
393.9396.6400.5
409.8415.5417.5
416.6422.4429.7
432.2437.6443.6
452.0
155.3175.9184.3
188.4192.9192.5
190.0185.3177.6
184.4186.2184.1
182.9195.1183.6
180.8
66.181.791.6
92.693.193.7
92.990.791.2
95.696.694.2
96.898.299.1
97.5
170.7 339.5179.8 381.2184.5 468.7
183.0183.5183.9
184.2184.5184.8
185.0185.0185.2
185.6186.0
434.0437.4457.1
465.9464.5475.6
466.0444.8459.1
456.9427.7
382.4401.5438.2
429.0433.3438.6
440.5437.1437.1
437.2442.3445.1
461.0473.0
15.713.812.6
12.112.412.8
13.412.611.9
11.710.29.8
10.310.7
1. Includes money market deposit accounts.2. Includes retail repurchase agreements. All IRA and Keogh accounts at commercial banks and thrift institutions are subtracted from small time deposits.3. Excludes IRA and Keogh accounts.4. Net of large denomination time deposits held by money market mutual funds, depository institutions, U.S. government, and foreign banks and official institutions.5. Net of money market mutual fund holdings of these items.6. Includes both overnight and term.
p preliminary

NET CHANGES IN SYSTEM HOLDINGS OF SECURITES 1
Millions of dollars, not seasonally adjusted
STRICTLY CONFIDENTIAL (FR)
CLASS II-FOMC
Treasury bills Treasurycoupons Federal Net changeSNet urchases 3 agencies outright
Period Net Redemptions Redemptions Net redemptions holdingspurchases (-) change 1 | 1-5 5-10 over 10 (-) Change ( total RPs
199319941995
1995 ---Q1---02---Q3
---04
1996 ---Q1---02
1995 AugustSeptemberOctoberNovemberDecember
1996 JanuaryFebruaryMarchAprilMayJuneJuly
WeeklyMay 1
815
2229
June 512
1926
July 310172431
August 714
Memo: LEVEL (bil. $)6August 14
17,71717.48410,032
4,470842
4,721
17,71717.48410,932
4,470842
5,621
3,399
433409
1,3504,271
88
3,311--.
---
3,311
__-
---
--
-- _
198.9
10,3509.1684,966
2,549100
2,317
35 1,899
218.4
100
2,317
1,899
1,279
93.9
4,168 3,4573,818 3.6061,239 3,122
1,138100
1,884
479 1,065
100
1,884
1,065
7672.3371,476
621370
485
1,228787
485
1,228
787
34.1 39.5
18,43115,493
8,241
-6214,156
2004,506
-1,2282,691
200-485400
4,591
-1,228
2,691
2,476
385.9___________________________ l'
35,37431,97516.970
-8508,314
5418,965
-1,3365,952
311563
-1184,5514,533
-1,228
-1082,697
-163,271
-52
-47
-16
3,271
-37
-15
2,476
5,974-7,412-1,023
-4,08310,395
-15,9798,644
-8,87910,133
-2,984608
-4272,4046,666
-12,623-1,6895,433-505
4,1746,4637,118
-15,1582,610
-1,8955,194
-4,4272,584
-6,78417,726-8,9195,399
4765,130
-12,00712.371-9,379
160
400.2 -12.1
1. Change from end-of-period to end-of-period.2. Outright transactions in market and with foreign accounts.3. Outright transactions in market and with foreign accounts, and short-term notesin exchange for maturing bills. Excludes maturity shifts and rollovers of maturing issues.
4. Reflects net change in redemptions (-) of Treasury and agency securities.5. Includes change in RPs (+), matched sale-purchase transactions (-), and matched purchase sale transactions (+).
acquired 6. The levels of agency issues were as follows:
August 14
within1 year 1-5 5-10 over 10 total
1.4 0.5 0.5 0.0 2.4
August 16, 1996
--- 3,399
--- 433--- 409
900 4504,271