Embed Size (px)
Citation preview

Prefatory Note
The attached document represents the most complete and accurate version available based on original copies culled from the files of the FOMC Secretariat at the Board of Governors of the Federal Reserve System. This electronic document was created through a comprehensive digitization process which included identifying the best-preserved paper copies, scanning those copies,1 and then making the scanned versions text-searchable.2 Though a stringent quality assurance process was employed, some imperfections may remain.
Please note that this document may contain occasional gaps in the text. These gaps are the result of a redaction process that removed information obtained on a confidential basis. All redacted passages are exempt from disclosure under applicable provisions of the Freedom of Information Act.
1 In some cases, original copies needed to be photocopied before being scanned into electronic format. All scanned images were deskewed (to remove the effects of printer- and scanner-introduced tilting) and lightly cleaned (to remove dark spots caused by staple holes, hole punches, and other blemishes caused after initial printing). 2 A two-step process was used. An advanced optimal character recognition computer program (OCR) first created electronic text from the document image. Where the OCR results were inconclusive, staff checked and corrected the text as necessary. Please note that the numbers and text in charts and tables were not reliably recognized by the OCR process and were not checked or corrected by staff.

STRICTLY CONFIDENTIAL (FR) CLASS I FOMC
DECEMBER 12, 1997
MONETARY POLICY ALTERNATIVES
PREPARED FOR THE FEDERAL OPEN MARKET COMMITTEE
BY THE STAFF OF THE BOARD OF GOVERNORS OF THE FEDERAL RESERVE SYSTEM

Strictly Confidential (F.R.) December 12, 1997Class I - FOMC
MONETARY POLICY ALTERNATIVES
Recent Developments
(1) U.S. financial markets have settled down some over the intermeeting period,
but further turmoil in a number of foreign markets has engendered an underlying sense of
unease, and, on occasion, has left its imprint on trading and prices. Implied volatility
measures for both bond and equity markets have dropped back to levels prevailing before the
October disturbances, and, though share prices for companies with significant exposures to
Asian economies have been hit hard, broad measures of equity prices are mainly somewhat
higher (Chart 1). The wider yield spreads on some private securities that opened up in late
October have persisted, although they remain low by historical standards, and premiums paid
by Japanese banks for short-term dollar funding have increased, on net, during the
intermeeting period. Although data releases over the period, on balance, signaled stronger
economic activity than had been anticipated by most private analysts, yields on most Treasury
securities have declined somewhat. 1 Investors apparently have come to the view that, with
future U.S. exports to Asia restrained by slower growth in that region and a stronger dollar,
inflation news will continue to be favorable. The prices of Treasury securities were also
1. The widely anticipated decision to keep the Committee's intended federal funds rate at5-1/2 percent in November elicited no market reaction, and the effective federal funds rategenerally has averaged close to the intended rate over the intermeeting period. The upwardtrend in excess reserves evident in recent months has become more pronounced, and the Deskraised the formal path allowance for excess reserves to $1.4 billion. Also during the period,Yamaichi International (America), Inc., a primary dealer, ceased operations, along with itsJapanese parent. After winding down its positions in an orderly fashion, the dealer, at itsrequest, was dropped from the list of primary dealers on December 4.

Chart 1
Selected Treasury Interest Rates
3.5 -
DailyFOMC
_t-PP II PIRS *
- -.
GDP
:4::z7-_2 I -
=
I I I I I I II
Thirty-year
.......-..
Ten-year
Three-year
Ten-yearIndexed(left scale)
Three-month
I II I II
Percent
EMP RS PPII
IIII
5.0
...-- . . *. '. . a ' ' 'I I 4I A
12 14 18 5 11 12
Implied Volatility
Selected Stock Indexes Index*
J M M J S N J M M J S N1996 1997
*Index, Jan 199 6=100
Daily beainnina November 10.
Federal Funds Futures Percenti
S&P 500(right scale)I- * .'".* .. ".."
.. *..... :*. *. :*.
J M M J S N J M M J1996 1997
Daily beginning November 10.
Nominal Exchange Rates:Industrial CountriesWeekly
Mal
-'*
* '". . ."". Yen*, * \ / - *. .
S N
Index*
Nov. 12rk* FO
M C
rIl".:,.J
G-10 Trade-WeightedDollar Index(3/73=100)
J M M J S N J M M J S N
*Index, Jan 19 91 1997Daily beginning November 10.
12/12/97......... 11/10/97
...........- ... ...... . .............
Dec. Jan. Feb. Mar. Apr.Contract Months
Nominal Exchange Rates:Developing Countries Index*
Weekly Nov. 12FOMC
Ten-CountryTrade-WeightedDollar Index*
J M M J S N J M M J S N1996 1997
*Index, Jan 1996=100Daily beginning November 10.
180
160
140
120
100
6.00
5.75
5.50
5.25
5.00
D
'- C t -- ~ -

-2-
buoyed by demands for safe assets on occasions when foreign problems seemed to intensify.
Adjusting for estimated year-end effects, federal funds futures rates suggest that investors
view the possibility of a change in monetary policy at this FOMC meeting as essentially nil.2
(2) Over 1997, nominal yields on long-term Treasury securities have fallen about
80 basis points; short-term Treasury bill rates have changed little, despite the March policy
tightening, which raised the intended federal funds rate by 25 basis points.3 As a result, the
Treasury yield curve has flattened considerably this year, with the spread between the yields
on the ten-year note and three-month bill now at a level last seen in January 1996, when
market participants expected a policy easing (Chart 2). Some of the flattening this year may
stem from reduced uncertainty about future long-term rates, perhaps reflecting less concern
about the small possibility of sharply higher inflation. Expected volatility of bond prices
inferred from options on futures contracts has declined appreciably on net this year. The real
federal funds rate has moved up over the year, but the increase has not been mirrored at
longer maturities. Real one-year interest rates, constructed as the nominal rate less the mean
of survey-based measures of inflation expectations at that maturity, have changed little, and
real rates at the ten-year maturity have been unchanged or somewhat lower, depending on the
measure used. Thus, the substantial decline in nominal long-term yields this year seems to
2. Domestic banks reportedly are paying premiums of 2 to 3 percentage points for federalfunds over the turn of the year, about in line with recent years.
3. Three- and six-month Treasury bill rates may have been held down by net paydowns ofthose bills in three of the four quarters this year.

Chart 2Spread Between Treasury 10-year Note Yield and 3-Month Bill Yield Percent
]
I1 I I I I I
1976 1978 1980 1982 1984 1986 1988 1990 1992 1994 1996
Measures of the Real Federal Funds Rate*
- CPI.. . Core CPI
&.r"
- Michigan
- Michigan........ Philadelphia
1. ..'-"
Percent
1976 1978 1980 1982 1984 1986 1988 1990 1992 1994 1996*Nominal federal funds rate (365-day basis) less the change in the price index over the previous 12 months
Real One-Year Treasury Rates Percent
~VV~f~AV
I I I I I I I I
1976 1978 1980 1982 1984 1986 1988 1990 1992 1994 1996*Nominal yield on 12-month Treasury bills less the mean one-year inflation expectation from indicated survey
Real Ten-Year Treasury Rates
Philadelphia
* *
.. Jan
Percentlation-Indexed Debt Percent97 Daily 3.8
N'W^ -- Ten-Year J 3.4
Apr Jul Oct3.0 - 6
chIgan I I
1976 1978 1980 1982 1984 1986 1988 1990 1992 1994 1996'Nominal yield on 10-year constant maturity Treasury securities less the mean Phil. (10 year) or Mich. (5-10 year) inflation expectation
Monthly
I~
Z
..... IIIII--E
I 1 n r i 1
l I l I I
I I I I I I

-3-
stem importantly from a drop in inflation expectations. As calculated, both one-year and ten-
year real rates are well within their ranges of the last two years.
(3) Most East Asian currencies--the main exceptions being those of China and
Hong Kong--have continued to depreciate against the dollar since the November FOMC
meeting. A weighted average of the exchange value of the dollar vis-a-vis the currencies of
ten (mostly Asian) developing economies, based on multilateral exports shares, has increased
about 11-1/2 percent over the intermeeting period (Chart 1). In Korea, the central bank
expended most of its foreign exchange reserves in the weeks before the country reached an
agreement with the IMF on December 3--as the government tried to avoid making
fundamental policy changes ahead of national presidential elections on December 18.
However, the willingness of the Korean government to implement the IMF program has been
called into question, contributing to a precipitous further decline in the won and doubts about
the ability of many Korean borrowers to meet their obligations--especially on foreign currency
debt. Many southeast Asian currencies have continued to weaken against the dollar over the
last month owing to the effects of the deteriorating Korean situation and investor
disappointment over the slow pace of reforms in those countries. Meanwhile, Russian
financial markets have sold off in recent weeks as the spillover from Asia has been
intensified by a scandal that has undermined the standing of key economic reformers.
(4) Relative to the currencies of the other G-10 countries, the dollar has
appreciated about 3-1/2 percent over the intermeeting period. Investors apparently have
revised upward their estimates of the effects of the financial market turmoil in Asian and
other emerging market economies, including those in Eastern Europe, on many of the G-10

-4-
countries. With inflation also continuing to be subdued in these industrial countries, prospects
for monetary tightening appear to have ebbed and interest rates generally have fallen. The
one major exception is Canada where concerns over the exchange value of the Canadian
dollar in an environment of continued strong growth led the Bank of Canada to raise its Bank
rate by 75 basis points over the intermeeting period. Downward pressures on interest and
dollar-exchange rates in Continental Europe also have been fostered by data releases
indicating that German economic growth has been moderate and by statements of European
central bank officials that interest rates will converge at the low end of the current spectrum
of European interest rates as monetary union approaches next year. Relative to the yen, the
dollar has appreciated 5-1/4 percent as worries about the Japanese economy have intensified
in the wake of widening domestic financial difficulties, punctuated by failures of a top-twenty
bank and a major securities firm. Nonetheless, long-term government bond yields in Japan
have been little changed on balance as investors have anticipated some fiscal stimulus and
government expenditures to resolve troubled financial institutions.
(5) Growth of the broad monetary aggregates accelerated in November. M2
advanced at a 6-3/4 percent pace, stronger than the projection in the previous bluebook, as
currency and liquid deposits surged. Preliminary data suggest a notable rise in U.S. currency
shipments to Russia, likely stemming from concerns related to the financial turmoil already
mentioned as well as the pending ruble redenomination. Liquid deposits have been boosted
by a pickup in mortgage refinancing activity and perhaps by robust income growth. M3
climbed at a 10-3/4 percent pace, well above the rate anticipated in the previous bluebook, as
bank credit growth strengthened and a few banks greatly stepped up their RP borrowing.
-5-
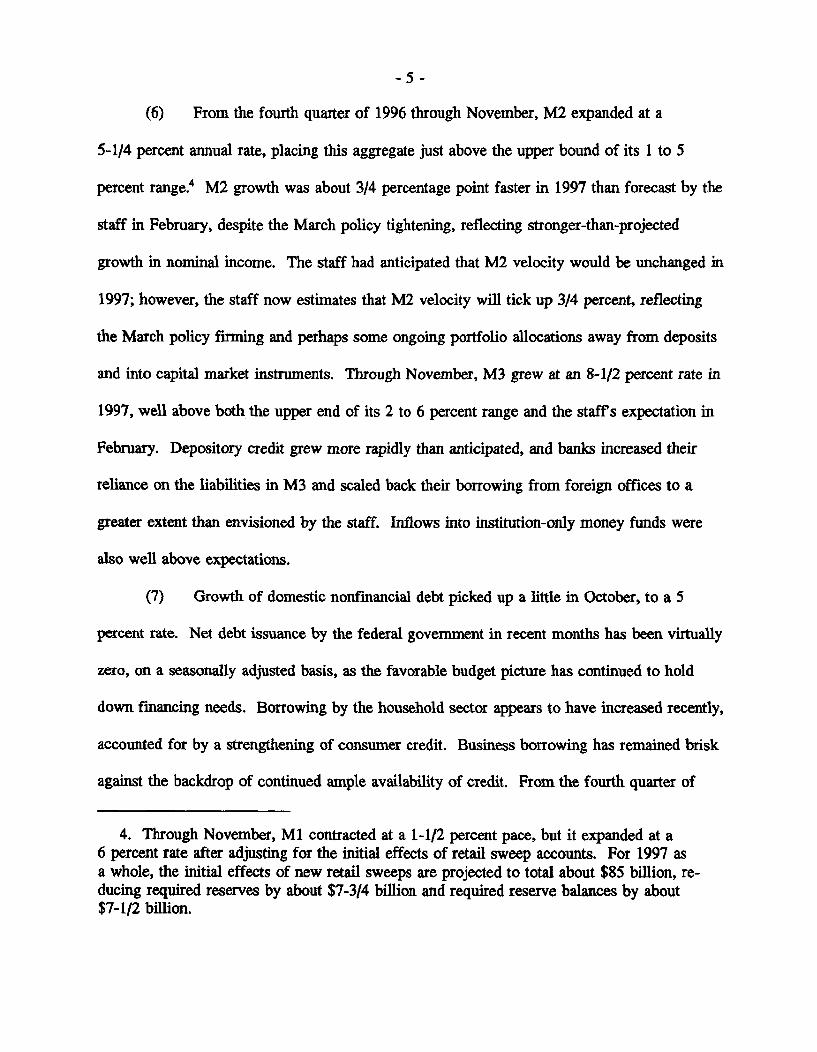
(6) From the fourth quarter of 1996 through November, M2 expanded at a
5-1/4 percent annual rate, placing this aggregate just above the upper bound of its 1 to 5
percent range.4 M2 growth was about 3/4 percentage point faster in 1997 than forecast by the
staff in February, despite the March policy tightening, reflecting stronger-than-projected
growth in nominal income. The staff had anticipated that M2 velocity would be unchanged in
1997; however, the staff now estimates that M2 velocity will tick up 3/4 percent, reflecting
the March policy firming and perhaps some ongoing portfolio allocations away from deposits
and into capital market instruments. Through November, M3 grew at an 8-1/2 percent rate in
1997, well above both the upper end of its 2 to 6 percent range and the staffs expectation in
February. Depository credit grew more rapidly than anticipated, and banks increased their
reliance on the liabilities in M3 and scaled back their borrowing from foreign offices to a
greater extent than envisioned by the staff. Inflows into institution-only money funds were
also well above expectations.
(7) Growth of domestic nonfinancial debt picked up a little in October, to a 5
percent rate. Net debt issuance by the federal government in recent months has been virtually
zero, on a seasonally adjusted basis, as the favorable budget picture has continued to hold
down financing needs. Borrowing by the household sector appears to have increased recently,
accounted for by a strengthening of consumer credit. Business borrowing has remained brisk
against the backdrop of continued ample availability of credit. From the fourth quarter of
4. Through November, M1 contracted at a 1-1/2 percent pace, but it expanded at a6 percent rate after adjusting for the initial effects of retail sweep accounts. For 1997 asa whole, the initial effects of new retail sweeps are projected to total about $85 billion, re-ducing required reserves by about $7-3/4 billion and required reserve balances by about$7-1/2 billion.

-6-
1996 through October, domestic nonfinancial debt increased at a 4-1/2 percent pace, placing
this aggregate somewhat below the midpoint of its 3 to 7 percent monitoring range. Debt
growth was about 1/2 percentage point slower than forecast by the staff in February. The
markedly weaker-than-projected expansion of federal debt was only partly offset by higher
than anticipated business borrowing. The slowing of household credit expansion was more
pronounced than anticipated.

-7-
MONEY, CREDIT, AND RESERVE AGGREGATES(Seasonally adjusted annual rates of growth)
96:Q4to
Sept. Oct. Nov. Nov.3
Money and Credit Aggregates
M1Adjusted for sweeps
M2
M3
Domestic nonfinancial debtFederalNonfederal
Bank CreditAdjusted1
Reserve Measures
Nonborrowed Reserves2
Total ReservesAdjusted for sweeps
Monetary BaseAdjusted for sweeps
Memo: (millions of dollars)
Adjustment plus seasonalborrowing
Excess reserves
-15.0
-18.97.9
7.510.1
438
1295
5.10.56.6
10.510.5
-1.2
-5.58.7
6.88.3
270
1396
-1.55.9
5.2
8.4
4.40.65.7
8.98.4
-6.0
-6.19.0
6.07.7
153
1711
1. Adjusted to remove effects of mark-to-market accounting rules (FIN 39 and FASB 115).2. Includes "other extended credit" from the Federal Reserve.3. For nonfinancial debt and its components, 96:Q4 to October.
NOTE: Monthly reserve measures, including excess reserves and borrowing, are calculated by proratingaverages for two-week reserve maintenance periods that overlap months. Reserve data incorporate adjustmentsfor discontinuities associated with changes in reserve requirements.

-8-
Short-run Policy Alternatives
(8) The staff now reads the effect of intensifying strains in Asia and emerging
markets elsewhere as shaving enough from aggregate demand to hold the growth of GDP
over the next two years below that of its potential by more than in the last Greenbook, even
without any increase in the federal funds rate. The unemployment rate currently is slightly
lower than anticipated in the last forecast, but it is at a higher level at the end of the forecast
in 1999. Still, it remains low by historical standards throughout the forecast period. The
tight labor markets tend to put upward pressure on costs and prices. Those pressures are
tempered in the forecast relative to November by more ample industrial capacity than had
been anticipated and by faster growth in productivity in 1999. Over the near term, price
pressures also are damped by lower import prices and greater competition from foreign
producers, as the negative spending shock abroad is transmitted to the U.S. economy in part
through recent dollar appreciation. In addition, a decline in oil prices resulting from softer
Asian demand and a higher level of OPEC production helps to hold down inflation over the
next few quarters. By the second half of 1998, most of the effects of these favorable supply
shocks wear off and reported CPI inflation edges up; during 1999, the CPI increases about
2-1/4 percent-a little below the November forecast. (The acceleration relative to this year is
damped a few tenths by technical changes to the index.)
(9) While the economy continues to operate in the staff forecast at a level above
estimates of its potential, inflation remains quiescent for some time with no change in the
federal funds rate and stays relatively low over the forecast period. Even if the Committee is
concerned about the pressures on labor resources and finds the eventual uptrend in underlying

-9-
inflation unacceptable, it may be willing to keep the funds rate constant at this meeting, as
under Alternative B. In the staff forecast, the emergence of inflation has been pushed back
enough to suggest that delaying possible firming to await further information about global and
national economic developments runs minimal risk of embedding higher inflation and
inflation expectations in economic decisionmaking. The situation in a number of foreign
markets and economies remains quite unsettled, amplifying uncertainties about the extent of
the global retrenchment and its implications for the U.S. financial markets and economy. The
circumstances are sufficiently fluid that the Committee might see some possibility of a major
economic retrenchment, which could be exacerbated by a preemptive tightening of U.S.
monetary policy at this time. Under alternative B, the Committee would be buying time to
assess the extent to which developments abroad restrain aggregate demand, depress oil prices,
and support the dollar, as well as the degree to which recent momentum in the economy
might be sustained. More data might also be seen as especially useful in sorting out some of
the questions about underlying pressures on labor compensation and the extent to which
productivity behavior might damp the feed-through of higher compensation to profit margins
and prices.
(10) The markets expect no policy action over the next few months and would react
little, if at all, to the choice of alternative B. Apart from year-end effects, interest rates--
especially Treasury yields--should fluctuate close to recent lows over the intermeeting period.
Any tendency for rates to edge higher if foreign markets settle down should be offset by the
effects of more moderate economic growth, as in the staff forecast. Stock prices, however,
could drift down as economic reports begin to undermine the prospects for profits. In these

- 10-
circumstances, investors might reevaluate credit risk more generally, and spreads on bonds
could widen a touch further. The market for Treasury securities might, from time to time, be
buffeted by the fallout from developments in Asia. On occasion in recent weeks, the
Treasury market has weakened temporarily on the expectation of official and private sales of
Treasuries for purposes of addressing financial difficulties in Asia, and such events could well
recur over the weeks and months ahead. However, by themselves, such sales are unlikely to
have much lasting effect on dollar yields because they do not change the fundamental outlook
for prices and spending in the United States. Moreover, they should be easily absorbed into
markets benefiting from demands for safer assets and from reduced borrowing by Asian
financial institutions to the extent they repay dollar liabilities with the proceeds of their asset
sales.
(11) The 25 basis point tightening of Alternative C might be favored if the
Committee wanted to lean against the inflationary bias that may well be inherent in the
current and prospective tautness of labor markets. The further tightening of labor markets
this fall indicates that financial conditions prevailing over recent quarters have not been
sufficiently restrictive to hold economic growth to a sustainable pace. With real bond rates
no higher--and perhaps even a bit lower--than over the last few quarters, equity prices still
high, and monetary growth above expectations, only the rise in the dollar gives any hint of
the firmer financial conditions needed to damp strong aggregate demands. Against this
background, and with labor markets already extremely tight, the Committee might perceive
that counting on sufficient additional restraint coming from Asian developments runs an
unacceptable risk of a rebound in inflation in 1998 that would be disruptive to reverse.

- 11 -
(12) Indeed, the Committee may believe that fragile financial markets abroad may
be better positioned to weather a small tightening now than a larger increase later. A
tightening at this time would catch the markets by surprise and money market interest rates
and the prime rate would increase around 25 basis points. The impact on the longer end of
the market would depend on the degree to which market participants extrapolated further
tightening. Indeed, market participants might read action at this time, when financial markets
remain unsettled in many parts of the globe, as evidence that the Committee was quite
worried about unsustainable strength in the U.S. economy. At a minimum, market
participants would be unlikely to expect a reversal of the tightening for a considerable period,
and with the yield curve at this time arguably embodying no rise in short-term rates, interest
rates should ratchet noticeably higher, at least through the intermediate-term maturities. The
stock market likely would come under substantial selling pressure, especially if the move
were seen to be only the first in a series of tightenings.
(13) The 25 basis point easing of Alternative A might be favored if the Committee
were concerned that turmoil abroad might have an even greater impact on the U.S. economy
than the staff has built into the forecast. Given the favorable near-term inflation outlook for
the United States, the Committee might see insurance against such an outcome to be
relatively inexpensive in that the easing likely could be reversed, if that proved necessary,
before it boosted inflation and inflation expectations. Indeed, such an easing, by lowering
real dollar interest rates might contribute a little toward stabilizing foreign markets, helping to
forestall some repercussions in the United States. Moreover, the recent weakness in

- 12-
commodity prices and the shallow slope of the yield curve may support the view that real
short-term rates are high relative to their equilibrium.
(14) An easing at this time would also catch the market by surprise, and short-
term interest rates would decline by around the 25 basis point reduction in the funds rate.
The extent of the decline in longer-term rates would depend on whether market participants
were convinced that an easing could be sustained because of damped export demand and
lower import prices stemming from recent developments overseas or whether they viewed the
Committee to be taking undesirable inflation risks in order to stabilize global markets in the
short run. The dollar likely would give back some of its recent gains while stock prices
probably would rise, especially if investors were to see the easing as sustainable.
(15) Growth of the broad money aggregates is expected to moderate from the recent
rapid pace, as the expansion of nominal GDP slows in the first quarter. M2 growth is
projected at around a 4 percent annual pace over the November-to-March period under
alternative B, leaving this aggregate near the upper end of its provisional 1998 range.
Nonetheless, growth in M2 would again outpace that of nominal GDP in the first quarter of
1998, and M2 velocity would edge lower. M3 should slow by more than M2 over the
November-to-March period, as growth in bank credit ebbs and some of the shifting in the
composition of bank managed liabilities diminishes. Nonetheless, growth in M3--at a 6-1/2
percent rate--is expected to run above the upper end of its provisional range for 1998.
(16) Borrowing by domestic nonfinancial sectors other than the federal government
is projected to remain substantial in late 1997 and early 1998. Continued favorable
conditions in capital markets should tilt borrowing toward longer-term sources. Rising

- 13 -
external financing needs of corporations, as capital outlays continue to advance while internal
funds level out, will be boosting business credit demands. Household debt growth is expected
to stay around the moderate pace of the past year. Credit supply conditions should continue
to be generally accommodative as any reassessment of risk by business creditors should be
limited. Moreover, U.S. banks and other financial intermediaries appear sufficiently strong to
absorb losses stemming from their exposure to Asia and other emerging markets without
facing significant funding difficulties. The federal government should continue to be a light
borrower, as the deficit stays narrow. Growth in overall debt of domestic nonfinancial sectors
over the coming months is expected to average around 4-3/4 percent at an annual rate, a bit
below the midpoint of its provisional range for 1998.

- 14-
Directive Language
(15) Presented below is draft wording for the operational paragraph that includes the
usual options for Committee consideration.
OPERATIONAL PARAGRAPH
In the implementation of policy for the immediate future, the Committee
seeks conditions in reserve markets consistent with maintaining/INCREASING/DECREAS-
ING the federal funds rate at/TO an average of around ____ [DEL: 5-1/2] percent. In the context of
the Committee's long-run objectives for price stability and sustainable economic growth, and
giving careful consideration to economic, financial, and monetary developments, a some-
what/SLIGHTLY higher federal funds rate would/MIGHT or a SOMEWHAT/slightly lower
federal funds rate WOULD/might be acceptable in the intermeeting period. The contemplated
reserve conditions are expected to be consistent with some moderation in the growth of M2
and M3 over coming months.

Alternative Levels and Growth Rates for Key Monetary Aggregates
M2
Alt. A Alt. B Alt. C
M3
Alt. A Alt. B Alt. C
M1
Alt. A Alt. B Alt. C
Monthly Growth RatesJun-97Jul-97Aug-97Sep-97Oct-97Nov-97Dec-97Jan-98Feb-98Mar-98
Quarterly Averages97 Q197 Q297 Q397 Q498 Q1
Growth RateFrom To95 Q4 96 Q496 Q4 97 Q496 Q4 Nov-9796 Q4 Dec-97
97 Q4 Mar-98Nov-97 Mar-98Dec-97 Mar-98
1997 Annual Ranges:
4.23.4
10.85.94.86.84.64.73.73.7
5.43.85.16.24.6
4.35.25.25.2
4.44.24.0
4.23.4
10.85.94.86.84.54.43.33.3
5.43.85.16.14.3
4.35.25.25.2
4.13.93.7
4.23.4
10.85.94.86.84.44.12.92.9
5.43.85.16.14.1
4.35.25.25.2
3.83.63.3
4.610.312.19.58.1
10.710.05.75.65.5
7.76.78.49.77.2
6.68.48.48.6
6.86.75.6
4.610.312.19.58.1
10.79.95.55.45.3
7.76.78.49.77.1
6.68.48.48.6
6.66.65.4
1.0 to 5.0 2.0 to 6.0
4.610.312.19.58.1
10.79.95.45.25.1
7.76.78.49.76.9
6.68.48.48.6
6.56.45.2
0.3-1.18.5
-9.9-3.87.7
-0.80.6
-0.2-0.4
-0.7-5.50.2
-0.90.8
-4.6-1.7-1.5-1.5
0.5-0.20.0
0.3-1.18.5
-9.9-3.87.7-0.90.2-0.8-1.1
-0.7-5.50.2-0.90.4
-4.6-1.7-1.5-1.5
0.1-0.6-0.6
0.3-1.1
8.5-9.9-3.8
7.7-1.0-0.2-1.4-1.8
-0.7-5.5
0.2-0.90.1
-4.6-1.7-1.5-1.5
-0.4-1.1-1.1

Chart 3
Actual and Projected M2
Monthly
--- Actual Level
* Short-Run Alternatives
''"'''''''''''
' 1%
Oct Nov Dec Jan Feb Mar Apr May Jun Jul Aug Sep Oct Nov Dec Jan Feb Mar Apr May Jun
4300
4200
4100
4000
3900
3800
3700
''''''''''
1996 1997 1998

Chart 4
Actual and Projected M3Billions of Dollars
5700
Monthly
S5600
Actual Level .... "6% 5500
* Short-Run Alternatives ...- *
... A,B,C - 54002%
o ...**...*. . 5 3 0 0
- 5200
5100
S- 5000
"."2%
4900
SI I I 4800Oct Nov Dec Jan Feb Mar Apr May Jun Jul Aug Sep Oct Nov Dec Jan Feb Mar Apr May Jun
1996 1997 1998

Chart 5
Actual and Projected DebtBillions of Dollars
S--- 15800
15600
15400
15200
15000
14800
14600
14400
14200
Oct Nov Dec Jan Feb Mar Apr May Jun Jul Aug Sep Oct Nov Dec Jan Feb Mar Apr May Jun
1996 1997 1998
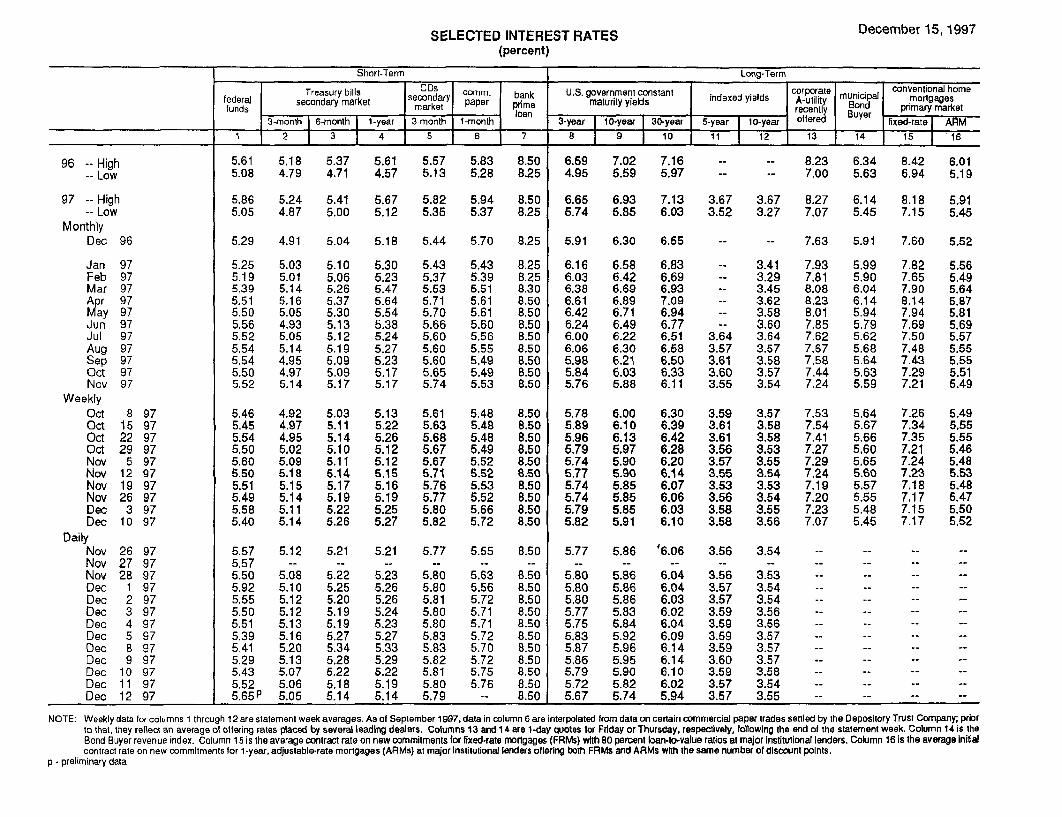
December 15,1997SELECTED INTEREST RATES(percent)
96 -- High-- Low
97 -- High-- Low
MonthlyDec 96
Jan 97Feb 97Mar 97Apr 97
ay 97Jun 97Jul 97Aug 97Sep 97Oct 97Nov 97
WeeklyOct 8 97Oct 15 97Oct 22 97Oct 29 97Nov 5 97Nov 12 97Nov 19 97Nov 26 97Dec 3 97Dec 10 97
DailyNov 26 97Nov 27 97Nov 28 97Dec 1 97Dec 2 97Dec 3 97Dec 4 97Dec 5 97Dec 8 97Dec 9 97Dec 10 97Dec 11 97Dec 12 97
Short-Term Long-Term
Treasury bills mm anCDsk U.S. gove corporate conventional homecomm. bank .S. government constant corpor municipal mortgagesfederal secondary market mar ppr pie rmaturity yields indexed yields A-e m i l opria me
funds lnmarket loan ofer Buyer p
3-month 6-month 1-year 3-month 1-month 3-year 10-year 30-year 5-year 10-year oere fixed-rate ARM
1 2 3 4 5 6 7 B 9 10 1 11 12 13 14 15 116
5.61 5.185.08 4.79
5.86 5.245.05 4.87
5.29 4.91
5.25 5.035.19 5.015.39 5.145.51 5.165.50 5.055.56 4.935.52 5.055.54 5.145.54 4.955.50 4.975.52 5.14
5.46 4.925.45 4.975.54 4.955.50 5.025.60 5.095.50 5.185.51 5.155.49 5.145.58 5.115.40 5.14
5.57 5.125.575.50 5.085.92 5.105.55 5.125.50 5.125.51 5.135.39 5.165.41 5.205.29 5.135.43 5.075.52 5.065.65P 5.05
5.37 5.61 5.57 5.83 8.504.71 4.57 5.13 5.28 8.25
5.41 5.67 5.82 5.94 8.505.00 5.12 5.35 5.37 8.25
5.04
5.105.065.265.375.305.135.125.195.095.095.17
5.035.115.145.105.115.145.175.195.225.26
5.21
5.225.255.205.195.195.275.345.285.225.185.14
5.18 5.44 5.70 8.25
5.30 5.43 5.43 8.255.23 5.37 5.39 8.255.47 5.53 5.51 8.305.64 5.71 5.61 8.505.54 5.70 5.61 8.505.38 5.66 5.60 8.505.24 5.60 5.56 8.505.27 5.60 5.55 8.505.23 5.60 5.49 8.505.17 5.65 5.49 8.505.17 5.74 5.53 8.50
5.13 5.61 5.48 8.505.22 5.63 5.48 8.505.26 5.68 5.48 8.505.12 5.67 5.49 8.505.12 5.67 5.52 8.505.15 5.71 5.52 8.505.16 5.76 5.53 8.505.19 5.77 5.52 8.505.25 5.80 5.66 8.505.27 5.82 5.72 8.50
5.21 5.77 5.55 8.50
5.23 5.80 5.63 8.505.26 5.80 5.56 8.505.26 5.81 5.72 8.505.24 5.80 5.71 8.505.23 5.80 5.71 8.505.27 5.83 5.72 8.505.33 5.83 5.70 8.505.29 5.82 5.72 8.505.22 5.81 5.75 8.505.19 5.80 5.76 8.505.14 5.79 -- 8.50
6.59 7.02 7.164.95 5.59 5.97
6.65 6.93 7.13 35.74 5.85 6.03 3
- - 8.23 6.34 8.42- - 7.00 5.63 6.94
.67 3.67 8.27 6.14 8.18
.52 3.27 7.07 5.45 7.15
5.91 6.30 6.55
6.16 6.58 6.83 -- 3.416.03 6.42 6.69 -- 3.296.38 6.69 6.93 -- 3.456.61 6.89 7.09 -- 3.626.42 6.71 6.94 -- 3.586.24 6.49 6.77 -- 3.606.00 6.22 6.51 3.64 3.646.06 6.30 6.58 3.57 3.575.98 6.21 6.50 3.61 3.585.84 6.03 6.33 3.60 3.575.76 5.88 6.11 3.55 3.54
5.78 6.00 6.30 3.59 3.575.89 6.10 6.39 3.61 3.585.96 6.13 6.42 3.61 3.585.79 5.97 6.28 3.56 3.535.74 5.90 6.20 3.57 3.555.77 5.90 6.14 3.55 3.545.74 5.85 6.07 3.53 3.535.74 5.85 6.06 3.56 3.545.79 5.85 6.03 3.58 3.555.82 5.91 6.10 3.58 3.56
5.77 5.86 '6.06 3.56 3.54
5.80 5.86 6.04 3.56 3.535.80 5.86 6.04 3.57 3.545.80 5.86 6.03 3.57 3.545.77 5.83 6.02 3.59 3.565.75 5.84 6.04 3.59 3.565.83 5.92 6.09 3.59 3.575.87 5.96 6.14 3.59 3.575.86 5.95 6.14 3.60 3.575.79 5.90 6.10 3.59 3.585.72 5.82 6.02 3.57 3.545.67 5.74 5.94 3.57 3.55
7.63
7.937.818.088.238.017.857.627.677.587.447.24
7.537.547.417.277.297.247.197.207.237.07
5.91
5.995.906.046.145.945.795.625.685.645.635.59
5.645.675.665.605.655.605.575.555.485.45
6.015.19
5.915.45
5.52
5.565.495.645.875.815.695.575.555.555.515.49
5.495.555.555.465.485.535.485.475.505.52
NOTE: Weekly data for columns 1 through 12 are statement week averages. As of September 1997, data in column 6 are interpolated from data on certain commercial paper trades settled by the Depository Trust Company; priorto that, they reflect an average of offering rates placed by several leading dealers. Columns 13 and 14 are 1-day quotes for Friday or Thursday, respectively, following the end of the statement week. Column 14 is theBond Buyer revenue index. Column 15 is the average contract rate on new commitments for fixed-rate mortgages (FRMs) with 80 percent loan-to-value ratios at major institutional lenders. Column 16 is the average initialcontract rate on new commitments for 1-year, adjustable-rate mortgages (ARMs) at major institutional lenders offering both FRMs and ARMs with the same number of discount points.
p - preliminary data

Strictly Confidential (FR)-Class II FOMC
Money and Credit Aggregate Measures C FDECEB3EF 15, 1997
Seasonally adjusted
_Money stock measures and liquid as ets Bank credit I Domestic nonfinancial debt,
nontransactions componentstotal loans
Period MI M2 M3 L and U. S. other' total=In M2 In M3 only investments' government'
1 2 3 4 ~ 5 8 7 8 9 ~ 10Annual arowth rates(9 ):
Annually (04 to 04)1994 2.5 0.6 -0.3 6.5 1.7 2.7 6.9 5.7 4.8 5.11995 -1.6 4.0 6.7 15.2 6.1 7.4 8.8 4.4 5.7 5.41996 -4.6 4.3 8.4 15.5 6.6 6.3 4.0 3.7 5.7 5.2
Quarterly(average)1996-Q4 -7.3 4.2 9.0 19.6 7.5 6.2 6.0 3.4 5.2 4.71997-Q1 -0.7 5.4 7.8 15.9 7.7 6.1 9.7 1.8 5.1 4.21997-Q2 -5.5 3.8 7.4 16.7 6.7 7.8 7.7 0.4 6.2 4.7199 7 -Q3 0.2 5.1 6.9 19.7 8.4 7.7 6.9 -0.6 5.3 3.7
Monthly1996-NOV. -0.2 5.9 8.4 8.7 6.6 6.7 8.4 4.5 5.4 5.2
DEC. 1.1 6.6 8.8 23.3 10.3 6.1 8.8 3.2 4.4 4.1
1997-JAN. -1.6 4.8 7.4 7.3 5.4 2.9 10.6 -0.6 4.8 3.4FEB. 1.1 4.8 6.2 23.8 9.0 9.4 11.3 1.5 5.9 4.8MAR. -5.9 4.8 9.0 16.9 7.6 8.7 6.0 4.4 5.3 5.1APR. -11.3 5.5 12.1 22.3 9.4 10.7 12.1 2.1 7.0 5.8MAY -248 -0.7 0.0 9.2 1.5 3.5 1.4 -4.3 6.5 3.7JUNE 0.3 4.2 5.6 6.1 4.6 4.3 6.2 -4.2 4.5 2.3JULY -1.1 3.4 5.0 33.4 10.3 6.8 10.8 1.0 5.3 4.2AUG. 8.5 10.8 11.7 16.1 12.1 13.5 4.1 1.6 5.1 4.2SEP. -9.9 5.9 11.8 21.0 9.5 9.4 7.5 1.1 5.4 4.3OCT. -3.8 4.8 7.9 18.4 8.1 10.5 0.5 6.6 5.1NOV. p 7.7 6.8 6.5 23.2 10.7 13.5
Levels (Sbillions);Monthly
1997-JULY 1062.1 3905.3 2843,2 1212.1 5117.4 6307.4 3957.4 3779.5 11059.5 14838.9AUG. 1069.6 3940.5 2871.0 1228.4 5168.9 6378.2 3970.9 3784.5 11106.6 14891.1SEP. 1060.8 3960.0 2899.3 1249.9 5209.9 6428.4 3995.8 3788.0 11156.9 14944.8OCT. 1057.4 3975.8 2918.4 1269.1 5244.9 4030.9 3789.6 11218.2 15007.8NOV. p 1064.2 3998.3 2934.1 1293.6 5291.8 4076.4
Weekly1997-NOV. 3 1073.4 3990.4 2916.9 1287.7 5278.0
10 1059.4 3985.4 2926.1 1283.9 5269.317 1056.9 3993.8 2937.0 1292.6 5286.424 p 1061.4 4001.2 2939.8 1297.0 5298.3
DEC. 1 p 1073.4 4015.6 2942.2 1304.9 5320.5
1. Adiusted for breaks caused by reclassifications.2. Debt data are on a monthly average basis, derived by averaging end-of-month levels of adjacent months, and have been adjusted to remove discontinuities.
p preliminarype preliminary estimate

Strictly Confidential (FR)-Class II FOMC
DBEB ER15, 1897Components of Money Stock and Related Measures
Seasonallyadjusted
Money marketmutual funds
Demand Other Small mutualfunds Large Savings Short-term Commercial BankersPeriod Currency deposits checkable Savings denomination denomination RP'so. Eurodollars ' bonds Treasury om c Ba er
deposits deposits time deposit Retai Institution- time deposits' securities' paper acceptances'
only
1 2 3 4 5 6 7 8 9 10 11 12 13 14Levels (Sblllonl:-
Annual (Q4)1994 352.4 384.9 404.8 1164.0 806.5 379.8 197.4 358.7 176.6 80.5 179.7 378.8 402.2 13.61995 371.4 390.3 362.1 1127.3 930.4 451.0 244.7 416.3 186.7 89.5 184.4 465.6 439.3 11.61996 392.6 401.1 278.3 1258.8 943.5 516.2 293.1 485.3 195.1 108.7 187.0 471.1 486.1 12.2
Monthly1996-NOV. 392.5 402.2 276.8 1259.0 943.9 515.2 292.0 483.4 195.3 107.1 187.0 480.0 483.2 12.2
DEC. 395.2 402.6 274.8 1271.0 945.7 521.5 299.3 491.5 194.1 113.9 187.0 456.5 495.5 12.2
1997-JAN. 397.0 401.6 272.5 1282.5 946.8 525.7 296.3 493.3 198.3 117.5 186.7 436.1 509.1 11.9FEB. 400.5 404.3 267.3 1290.5 948.2 530.6 305.4 500.1 202.1 119.7 186.4 437.6 517.5 12.7MAR. 402.4 403.1 261.5 1304.3 947.4 538.3 311.8 509.1 200.6 121.7 186.3 441.5 525.9 13.5
APR. 403.7 395.6 257.7 1321.1 948.9 548.1 311.6 522.1 204.1 126.6 186.2 446.6 537.8 12.8MAY 406.1 395.7 252.8 1320.9 953.3 543.9 311.6 523.6 204.5 133.5 186.2 451.8 543.9 13.1JUNE 407.7 397.2 250.1 1325.4 957.9 548.0 318.9 533.0 198.7 128.8 186.3 443.0 555.9 12.6
JULY 410.2 396.4 247.2 1329.9 960.9 552.5 324.1 551.1 207.1 129.8 186.4 423.8 566.8 12.9AUG. 412.1 402.0 247.2 1341.4 962.5 567.0 329.2 557.2 208.6 133.4 186.5 445.6 563.9 13.3SEP. 415.4 390.6 246.7 1356.7 964.3 578.3 338.9 570.9 205.7 134.4 186.5 455.2 563.9 12.8
OCT. 418.0 386.4 244.8 1370.2 966.5 581.8 345.3 574.5 217.6 131.6NOV. p 421.8 390.9 243.2 1379.5 966.6 588.0 346.4 580.5 233.6 133.1
1. Includes money market deposit accounts.2. Includes retail repurchase agreements. All IRA and Keogh accounts at commercial banks and thrift institutions are subtracted from small time deposits.3. Excludes IRA and Keogh accounts.4. Net of large denomination time deposits held by money market mutual funds, depository institutions, U.S. government, and foreign banks and official institutions.5. Net of money market mutual fund holdings of these items.6. Includes both overnight and term.
p preliminary

December 12, 1997
NET CHANGES IN SYSTEM HOLDINGS OF SECURITES 1
Millions of dollars, not seasonally adjusted
STRICTLY CONFIDENTIAL (FR)
CLASS II-FOMC
Treasury bills Treasurycoupons Federal Net changeNt purch s 3 agencies outright
Period Net Redemptions Net Net purchases Redemptions Net redemptions holdingspurchases ( ) change 1 year 1-5 5-10 over 10 (-) Change total 4 Net RPs
199419951996
1996 ---Q1---02---03---04
1997 ---Q1---02---03
1996 December
1997 JanuaryFebruaryMarchAprilMayJuneJulyAugustSeptemberOctoberNovember
WeeklySeptember 3
101724
October 18152229
November 5121926
December 310
Memo: LEVEL (bit. $) 6December 10
17,484
10,9329,901
3,399
6,502
4,602
4,006
596
2,545
17,48410,0329,901
3,399
6,502
4,602
4,006
596
2,545
9,916 3,575 3,6065,366 1,432 2,5293,898 1,116 1,655
65459
°..
818877644
818
383494
644
1,462
644
1,451
11
1,947
48.2
1,8392,060
.°°
3,9855,8232,697
1,1252,8611,9241,1022,797
2,697
3,323
1,042-..
1,655
1,8901,433
1,831
S 1,1171,233 1,894
2,3371,7762,015
1.228787
607376598
607
376
598
416
416--..
93.6 40.9 48.3
15,4937,9415,179
-1,2282,6913,716
5,3149,4512,744
-6071,9433,9781,5483,2064,696
-598
3,3411,0026,224
1,686
1,655
1,002
1,4511,8902,883
5,605
231.0
9421,003409
108138
7985
230498571
12
187271724
474287179105631
26
7035
60
521153526
32,03516.97014,670
-1,3365,9523,6376,417
5,113,1
2,
-7
1,3,!5,3,4,-I
3,
6,
1,
1,
1,1 ,2,1
8,
-7,412-1,0235,351
.8,8792,959
-2,45413,726
084 -18,046555 11,984173 44,096
-12 9,518
793 -10,151916 -7,371961 -524530 41,665206 -42,664818 12,984885 -11,565179 30,805236 24,856371 44,928198 7,839
-70 7,113-35 2,583686 7,101
3,496595 18,492
2,984481 -1,346-15 39,422-35 -9,186-26 11,468451 -2,080890 -22883 4,255
19,108150 -17,351
428.4 14,0
1. Change from end-of-period to end-of-period. 4. Reflects net change in redemptions (-) of Treasury and agency securities.2. Outright transactions in market and with foreign accounts. 5. Includes change in RPs (+), matched sale-purchase transactions (-), and matched purchase sale transactions (+).3. Outright transactions in market and with foreign accounts, and short-term notes acquired 6. The levels of agency issues were as follows:in exchange for maturing bills. Excludes maturity shifts and rollovers of maturing issues. I ,~h I
December 10
1 year 1-5 5-10 over 10 total0.3 0.2 0.3 0.0 0.8
I