Embed Size (px)
Citation preview
Tram Stop 133
Yarra Trams
13-Sep-2013
Doc No. 77spa
D R A F T
Fitzroy Street Traffic Impact Assessment
Route 96 Corridor Development Project

AECOM
Tram Stop 133
Fitzroy Street Traffic Impact Assessment
D R A F T
P:\60248376\4. Tech work area\4.1 Traffic\Traffic\FitzroyStreet_Stop_133\Report\Draft Fitzroy Street Stop 133 Draft Traffic Impact Assessment RevC.docx Revision C – 13-Sep-2013 Prepared for – Yarra Trams – ABN: 42 138 066 074
Fitzroy Street Traffic Impact Assessment
Route 96 Corridor Development Project
Client: Yarra Trams
ABN: 42 138 066 074
Prepared by
AECOM Australia Pty Ltd
Level 9, 8 Exhibition Street, Melbourne VIC 3000, Australia
T +61 3 9653 1234 F +61 3 9654 7117 www.aecom.com
ABN 20 093 846 925
13-Sep-2013
Job No.: 60248376
AECOM in Australia and New Zealand is certified to the latest version of ISO9001, ISO14001, AS/NZS4801 and OHSAS18001.
© AECOM Australia Pty Ltd (AECOM). All rights reserved.
AECOM has prepared this document for the sole use of the Client and for a specific purpose, each as expressly stated in the document. No other
party should rely on this document without the prior written consent of AECOM. AECOM undertakes no duty, nor accepts any responsibility, to any
third party who may rely upon or use this document. This document has been prepared based on the Client’s description of its requirements and
AECOM’s experience, having regard to assumptions that AECOM can reasonably be expected to make in accordance with sound professional
principles. AECOM may also have relied upon information provided by the Client and other third parties to prepare this document, some of which
may not have been verified. Subject to the above conditions, this document may be transmitted, reproduced or disseminated only in its entirety.
AECOM
Tram Stop 133
Fitzroy Street Traffic Impact Assessment
D R A F T
P:\60248376\4. Tech work area\4.1 Traffic\Traffic\FitzroyStreet_Stop_133\Report\Draft Fitzroy Street Stop 133 Draft Traffic Impact Assessment RevC.docx Revision C – 13-Sep-2013 Prepared for – Yarra Trams – ABN: 42 138 066 074
Quality Information
Document Fitzroy Street Traffic Impact Assessment
Ref 60248376
Date 13-Sep-2013
Prepared by Daniel North
Reviewed by Christian Bodé
Revision History
Revision Revision
Date Details
Authorised
Name/Position Signature
0 19-Oct-2012 Draft Traffic Impact
Assessment
Christian Bodé
Associate Director
A 11-Jan-2013 Final Traffic Impact
Assessment
Christian Bodé
Associate Director
B 3-Sep-2013 Draft Revised Traffic Impact
Assessment
Christian Bodé
Associate Director
C 13-Sep-2013 Draft Revised Traffic Impact
Assessment
Christian Bodé
Associate Director

AECOM
Tram Stop 133
Fitzroy Street Traffic Impact Assessment
D R A F T
P:\60248376\4. Tech work area\4.1 Traffic\Traffic\FitzroyStreet_Stop_133\Report\Draft Fitzroy Street Stop 133 Draft Traffic Impact Assessment RevC.docx Revision C – 13-Sep-2013 Prepared for – Yarra Trams – ABN: 42 138 066 074
Table of Contents
1.0 Introduction 1 1.1 Tram Stop 133 Study Area 1 1.2 Public Transport and Intermodal Connectivity 1 1.3 Proposed Concept Design Options 2 1.4 VicRoads Route Classifications 3
2.0 Data Collection 3 2.1 VicRoads Sourced Traffic Data and Analysis 3
2.1.1 Fitzroy Street Signal Operation 3 2.1.2 SCATS Traffic Flow Profile 3
3.0 Surveyed Traffic Data 4 3.1 Tram Frequency by Service Number 4 3.2 Queue Lengths 5 3.3 Pedestrian Survey Data 6 3.4 Cyclist Survey Data 8
4.0 VISSIM Microsimulation Traffic Modelling 9 4.1 Existing Conditions Model Development and Validation 9 4.2 Existing Conditions Model Performance 10 4.3 Concept Design Operational Analysis 14
4.3.1 Comparison of Results 14 5.0 Network Fit Assessment (NFA) 16 6.0 Crash Analysis 17 7.0 Swept Path Analysis - St Kilda Park Primary School Access Point 21 8.0 Conclusions and Recommendations 22
8.1 VISSIM Network Modelling 22 8.2 Network Fit Assessment 22 8.3 Crash Analysis 22 8.4 Swept Path Analysis 22 8.5 Recommendations 22
Appendix A Fitzroy Street Crash Statistics A (01/01/2007-30/12/2011) A
Appendix B VicRoads Definitions for Classifying Accidents (DCA) B
Appendix C VicRoads Controller Operation Specification Sheets C
Appendix D SmartRoads LOS Definitions for Arterial Roads D
Appendix E Assessed Concept Designs E
Appendix F NFA Approach Results F
List of Tables
Table 1 Tram frequency - AM peak period (0700-0900) 4 Table 2 Tram frequency – PM peak period (1600-1800) 5 Table 3 Average and Maximum Queues 5 Table 4 Matrix of pedestrian movements at Fitzroy Street and Lakeside Drive/ Princes Street
intersection from 0700-0900 on Tuesday 16th
October 2012 6

AECOM
Tram Stop 133
Fitzroy Street Traffic Impact Assessment
D R A F T
P:\60248376\4. Tech work area\4.1 Traffic\Traffic\FitzroyStreet_Stop_133\Report\Draft Fitzroy Street Stop 133 Draft Traffic Impact Assessment RevC.docx Revision C – 13-Sep-2013 Prepared for – Yarra Trams – ABN: 42 138 066 074
Table 5 Matrix of pedestrian movements at Fitzroy Street and Lakeside Drive/ Princes Street
intersection from 1600-1800 on Tuesday 16th
October 2012 6 Table 6 Matrix of pedestrian movements at Fitzroy Street and Canterbury Road/ Grey Street
intersection from 0700-0900 on Tuesday 16th
October 2012 7 Table 7 Matrix of pedestrian movements at Fitzroy Street and Canterbury Road/ Grey Street
intersection from 1600-1800 on Tuesday 16th
October 2012 7 Table 8 Yearly crash totals January 2007 to December 2011 18
List of Figures
Figure 1 Existing conditions locality plan - Stop 133 and 132 Fitzroy Street 1 Figure 2 VicRoads declared road network map 3 Figure 3 24 hour SCATS traffic flow profile (Tuesday 16 October 2012) – All movements 4 Figure 4 Pedestrian movement diagram indicating dwell points at Fitzroy Street and Lakeside
Drive/ Princes Street intersection 6 Figure 5 Pedestrian movement diagram indicating dwell points at Fitzroy Street and Canterbury
Road/ Grey Street intersection 7 Figure 6 Surveyed on-road cyclist movements at Fitzroy Street and Lakeside Drive/ Princes Street
intersection on Tuesday 16th
October 2012 from 0700-0900 and 1600-1800 8 Figure 7 Surveyed on-road cyclists movements at Fitzroy Street and Canterbury Road/ Grey
Street intersection on Tuesday 16th
October 2012 from 0700-0900 and 1600-1800 8 Figure 8 Observed versus modelled 2 hour flow volumes – light and heavy vehicles 10 Figure 9 Fitzroy Street / Canterbury Road / Grey Street Existing Conditions LOS summary 11 Figure 10 Fitzroy Street / Princes Street / Lakeside Drive Existing Conditions LOS Summary 11 Figure 11 Turning movement traffic calibration schematic – light vehicles and trams modelled
versus observed 12 Figure 12 Turning movement traffic calibration schematic – heavy vehicles modelled versus
observed 13 Figure 13 Fitzroy Street / Canterbury Road / Grey Street modelled average vehicle delay (seconds) 14 Figure 14 Fitzroy Street / Lakeside Drive / Princes Street modelled average vehicle delay
(seconds) 15 Figure 15 SmartRoads Network Operating Plan – Fitzroy Street, St Kilda (City of Port Phillip) 16 Figure 16 Option 1 NFA results 17 Figure 17 Option 2 NFA results 17 Figure 18 Option 3 NFA results 17 Figure 19 Option 4 NFA results 17 Figure 20 Crash severity (January 2007 to December 2011) 17 Figure 21 Crash summary by DCA groups 18 Figure 22 Crash frequency by time of day 18 Figure 23 Proportion of vehicle types involved crashes 19 Figure 24 Collision diagram – Fitzroy Street, Lakeside Drive to Canterbury Road (January 2007 to
December 2011) 20 Figure 29 Fitzroy Street Stop 133 Option 1 Concept Design e-1 Figure 30 Fitzroy Street Stop 133 Option 2 Concept Design e-2 Figure 31 Fitzroy Street Stop 133 Option 3 Concept Design e-3 Figure 32 Fitzroy Street Stop 133 Option 4 Concept Design e-4

AECOM
Tram Stop 133
Fitzroy Street Traffic Impact Assessment
D R A F T
P:\60248376\4. Tech work area\4.1 Traffic\Traffic\FitzroyStreet_Stop_133\Report\Draft Fitzroy Street Stop 133 Draft Traffic Impact Assessment RevC.docx Revision C – 13-Sep-2013 Prepared for – Yarra Trams – ABN: 42 138 066 074
1
1.0 Introduction
1.1 Tram Stop 133 Study Area
Stop 133 is located on the southwest side of the Fitzroy Street / Canterbury Road intersection and services Route
3a, 16, and 96. As part of the Route 96 Corridor Development Project, Stop 132 to the northeast of Stop 133 will
be removed and Stop 133 moved northeast and upgraded to an accessible tram stop. The new Stop 133 will be a
midblock stop between Princes Street and Canterbury Road, approximately equal distance from Stop 132 and
134. This stop will only service Routes 3a and 16 as the 96 tram travels to and from the city via the light rail
connection. This removes a stop from Route 96 which will provide a shorter journey time. The Traffic Impact
Assessment will involve traffic analysis of the following signalised intersections:
- Fitzroy Street / Grey Street / Canterbury Road
- Fitzroy Street / Princes Street / Lakeside Drive
Figure 1 shows the study area and current positioning of tram stops 132 and 133.
Figure 1 Existing conditions locality plan - Stop 133 and 132 Fitzroy Street
Source: Open Street Map
A good connection to the broader metropolitan road network is provided within the direct vicinity of the focus area.
Fitzroy Street north connects directly to St Kilda junction linking to Melbourne’s principle north-south arterial spine
in Punt Road. St Kilda Road north and Queens Road provide direct access to the CBD. Dandenong Road and
Nepean Highway connect to the eastern and south suburbs. Freeway access is limited; the M1 is approximately
5 kilometres north.
1.2 Public Transport and Intermodal Connectivity
The following tram routes run north-south on Fitzroy Street servicing stops 133 and 132:
- Route 3a – Melbourne University to East Malvern (via St Kilda)
- Route 16 – Melbourne University to Kew (via St Kilda Beach)
Route 96 (East Brunswick to St Kilda Beach) also services stop 133 but exits/enters Fitzroy Street immediately
north of Canterbury Road at the St Kilda Light Rail Station. Route 96 connects to the CBD at this point via the St
Kilda Light Rail Line which runs this service exclusively.
The following bus services run in a clockwise loop via Grey Street, Fitzroy Street and Princes Street stopping
adjacent the St Kilda Bowling Club at bus stop 4610, immediately north of Balluk William Court:
Lakeside Drive
Princes Street
Canterbury Road
Grey Street
Fitzroy Street
Existing tram stop 133
Existing tram stop 132
AECOM
Tram Stop 133
Fitzroy Street Traffic Impact Assessment
D R A F T
P:\60248376\4. Tech work area\4.1 Traffic\Traffic\FitzroyStreet_Stop_133\Report\Draft Fitzroy Street Stop 133 Draft Traffic Impact Assessment RevC.docx Revision C – 13-Sep-2013 Prepared for – Yarra Trams – ABN: 42 138 066 074
2
- Route 600 – Southland Shopping Centre to St Kilda Light Rail Station (via Tramway Parade)
- Route 922 – Southland Shopping Centre to St Kilda Light Rail Station (via North Brighton Station)
- Route 923 – Southland Shopping Centre to St Kilda Light Rail Station
The closest rail alignment is the Sandringham rail line with Windsor Station located approximately one kilometre
east of St Kilda Junction.
The assessed section of Fitzroy Street is listed on the Principal Bicycle Network (PBN) as ‘Shared Bicycle and
Parking Lane’ although an off-road shared footway/bicycle path is provided over a section on the north side of
Fitzroy Street.
1.3 Proposed Concept Design Options
Four Concept Design Options have been developed by AECOM as part of Work Package 3 Route 96 Corridor
Development Project. All options involve the removal of Stop 132 and relocation of Stop 133. This analysis
focuses on the two preferred options as detailed below:
Option 1 - Drawing Number SK_R96_1103 (Revision B 13/07/2012)
- Relocation of Stop 133 to the northeast of St Kilda Park Primary School access point:
- Two raised tram platform stops (one in each direction), 33 metres long by 3.1 metres wide
- Through traffic lanes reduced from two lanes to one each direction adjacent the stop. Traffic required to
merge from right to left
- Staggered zebra crossing on the northern end of the platform stop
- Pedestrian Operated Signals (POS) and staggered crossing on the southern side of the platform stop
- Removal of some parking provision on the north and south side of Fitzroy Street
Option 2 – Drawing Number SK_R96_1104 (Revision B 13/07/2012)
- Relocation of Stop 133 to the southwest of St Kilda Park Primary School access point
- Two raised platform stops (one in each direction), 33 metres long by 3.1 metres wide
- Through traffic lanes reduced from two lanes to one each direction adjacent the stop. Traffic required to
merge from right to left in the northbound direction
- Staggered zebra crossing on the northern end of the platform stop
- Pedestrian Operated Signals (POS) and staggered crossing on the southern side of the platform stop
- Banning of the right-turn movement from St Kilda Park Primary School access point and Ballak William
Court to Fitzroy Street. Vehicles will be required to turn left into Fitzroy Street and u-turn at Fitzroy Street /
Princes Street / Lakeside Drive
- Removal of some parking provision on the north and south side of Fitzroy Street
- Bus stop 4610 relocated further north-east along Fitzroy Street
Option 3 – Drawing Number SK_R96_1103 (Revision A 28/08/2013)
- Right to left merge, departure side of Fitzroy Street / Lakeside Drive / Princes Street
- Existing tram stop 133 and 132 to be removed
- New signalised pedestrian crossing to access tram platforms
Option 4 – Drawing Number SK_R96_1103 (Revision A 05/08/2013)
- Single through lane Fitzroy Street westbound
- Existing tram stop 133 and 132 to be removed
- New signalised pedestrian crossing to access tram platforms
AECOM
Tram Stop 133
Fitzroy Street Traffic Impact Assessment
D R A F T
P:\60248376\4. Tech work area\4.1 Traffic\Traffic\FitzroyStreet_Stop_133\Report\Draft Fitzroy Street Stop 133 Draft Traffic Impact Assessment RevC.docx Revision C – 13-Sep-2013 Prepared for – Yarra Trams – ABN: 42 138 066 074
3
Concept design drawings for these options are provided in Appendix E.
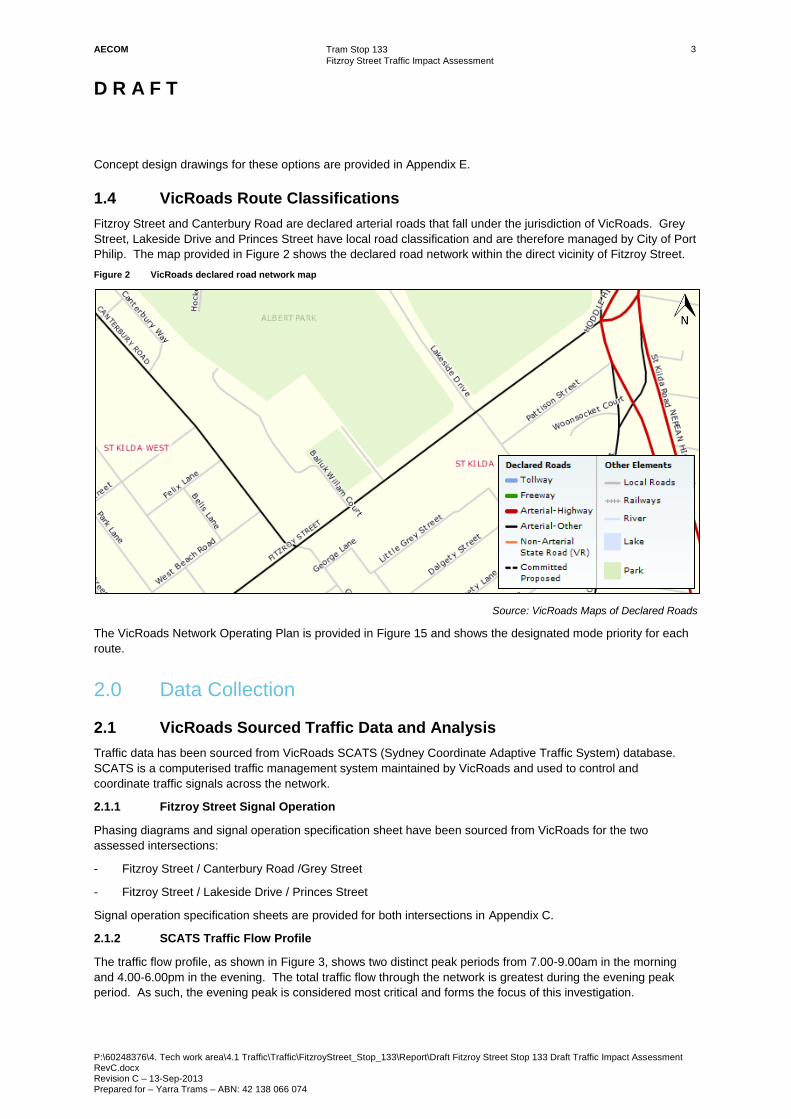
1.4 VicRoads Route Classifications
Fitzroy Street and Canterbury Road are declared arterial roads that fall under the jurisdiction of VicRoads. Grey
Street, Lakeside Drive and Princes Street have local road classification and are therefore managed by City of Port
Philip. The map provided in Figure 2 shows the declared road network within the direct vicinity of Fitzroy Street.
Figure 2 VicRoads declared road network map
Source: VicRoads Maps of Declared Roads
The VicRoads Network Operating Plan is provided in Figure 15 and shows the designated mode priority for each
route.
2.0 Data Collection
2.1 VicRoads Sourced Traffic Data and Analysis
Traffic data has been sourced from VicRoads SCATS (Sydney Coordinate Adaptive Traffic System) database.
SCATS is a computerised traffic management system maintained by VicRoads and used to control and
coordinate traffic signals across the network.
2.1.1 Fitzroy Street Signal Operation
Phasing diagrams and signal operation specification sheet have been sourced from VicRoads for the two
assessed intersections:
- Fitzroy Street / Canterbury Road /Grey Street
- Fitzroy Street / Lakeside Drive / Princes Street
Signal operation specification sheets are provided for both intersections in Appendix C.
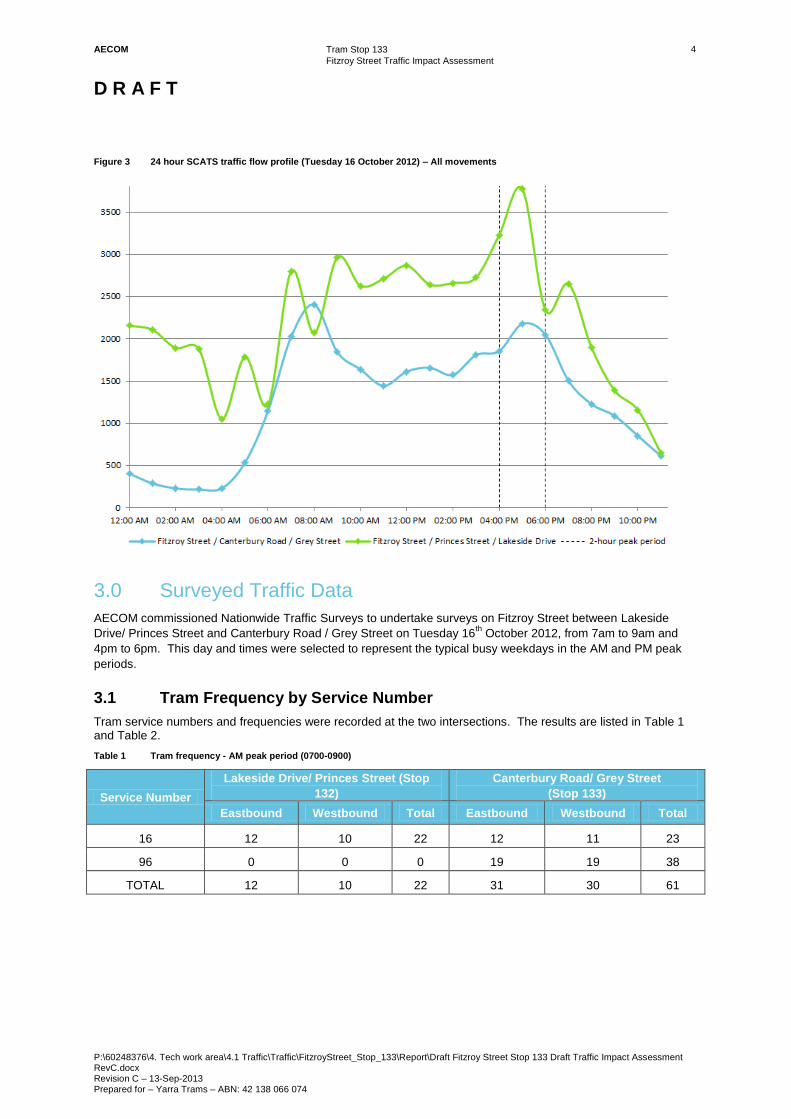
2.1.2 SCATS Traffic Flow Profile
The traffic flow profile, as shown in Figure 3, shows two distinct peak periods from 7.00-9.00am in the morning
and 4.00-6.00pm in the evening. The total traffic flow through the network is greatest during the evening peak
period. As such, the evening peak is considered most critical and forms the focus of this investigation.
AECOM
Tram Stop 133
Fitzroy Street Traffic Impact Assessment
D R A F T
P:\60248376\4. Tech work area\4.1 Traffic\Traffic\FitzroyStreet_Stop_133\Report\Draft Fitzroy Street Stop 133 Draft Traffic Impact Assessment RevC.docx Revision C – 13-Sep-2013 Prepared for – Yarra Trams – ABN: 42 138 066 074
4
Figure 3 24 hour SCATS traffic flow profile (Tuesday 16 October 2012) – All movements
3.0 Surveyed Traffic Data
AECOM commissioned Nationwide Traffic Surveys to undertake surveys on Fitzroy Street between Lakeside
Drive/ Princes Street and Canterbury Road / Grey Street on Tuesday 16th October 2012, from 7am to 9am and
4pm to 6pm. This day and times were selected to represent the typical busy weekdays in the AM and PM peak
periods.
3.1 Tram Frequency by Service Number
Tram service numbers and frequencies were recorded at the two intersections. The results are listed in Table 1 and Table 2.
Table 1 Tram frequency - AM peak period (0700-0900)
Service Number
Lakeside Drive/ Princes Street (Stop
132)
Canterbury Road/ Grey Street
(Stop 133)
Eastbound Westbound Total Eastbound Westbound Total
16 12 10 22 12 11 23
96 0 0 0 19 19 38
TOTAL 12 10 22 31 30 61

AECOM
Tram Stop 133
Fitzroy Street Traffic Impact Assessment
D R A F T
P:\60248376\4. Tech work area\4.1 Traffic\Traffic\FitzroyStreet_Stop_133\Report\Draft Fitzroy Street Stop 133 Draft Traffic Impact Assessment RevC.docx Revision C – 13-Sep-2013 Prepared for – Yarra Trams – ABN: 42 138 066 074
5
Table 2 Tram frequency – PM peak period (1600-1800)
Service Number Lakeside Drive/ Princes Street (Stop 132)
Canterbury Road/ Grey Street
(Stop 133)
Eastbound Westbound Total Eastbound Westbound Total
16 12 12 24 12 12 24
96 0 0 0 18 19 37
Not In Service 0 1 1 2 1 3
TOTAL 12 13 25 32 32 64
3.2 Queue Lengths
The queue lengths of all approach arms at the two intersections were recorded during the traffic survey. The
queue lengths are summarised in Table 3. Queue lengths were recorded as the number of vehicles extending to
the back of the queue. In order to express the queue length in metres an average vehicle length of 6 metres has
been assumed which incorporates some allowance for the space between vehicles.
Table 3 Average and Maximum Queues
Intersection Road Direction
Average and Maximum Queues
AM Peak Period (0700-0900) PM Peak Period (1600-1800)
Avg. Q
Veh.
Avg. Q
(m)
Max. Q
Veh.
Max. Q
(m)
Avg. Q
Veh.
Avg. Q
(m)
Max. Q
Veh.
Max. Q
(m)
Fitzroy St & Canterbury Rd/Grey St
Fitzroy St EB 12 72 33 198 11 66 26 156
Fitzroy St WB 13 78 34 204 11 66 26 156
Grey St NB 34 204 58 348 14 84 30 180
Canterbury Rd SB 12 72 30 180 21 126 43 258
Fitzroy St & Lakeside Dr/Princes St
Fitzroy St EB 4 24 14 84 4 24 11 66
Fitzroy St WB 5 30 15 90 5 30 15 90
Princes St NB 13 78 35 210 4 24 10 60
Lakeside Dr SB 3 18 11 66 10 60 33 198
Notes: Avg.=Average, Q=Queue, Veh.=Vehicles, (m)=Metres, EB=Eastbound, WB=Westbound, NB=Northbound, SB=Southbound
The survey results indicate that:
- The average and maximum queue lengths on Fitzroy Street were relatively consistent in the AM and PM
peak hours at both intersections.
- In the AM peak period, northbound traffic on Grey Street was longest with an average queue length of 204
metres and a maximum queue length of 348 metres.
- In the PM peak period, southbound traffic on Canterbury Road was longest with an average queue length of
126 metres and a maximum queue length of 258 metres.
AECOM
Tram Stop 133
Fitzroy Street Traffic Impact Assessment
D R A F T
P:\60248376\4. Tech work area\4.1 Traffic\Traffic\FitzroyStreet_Stop_133\Report\Draft Fitzroy Street Stop 133 Draft Traffic Impact Assessment RevC.docx Revision C – 13-Sep-2013 Prepared for – Yarra Trams – ABN: 42 138 066 074
6
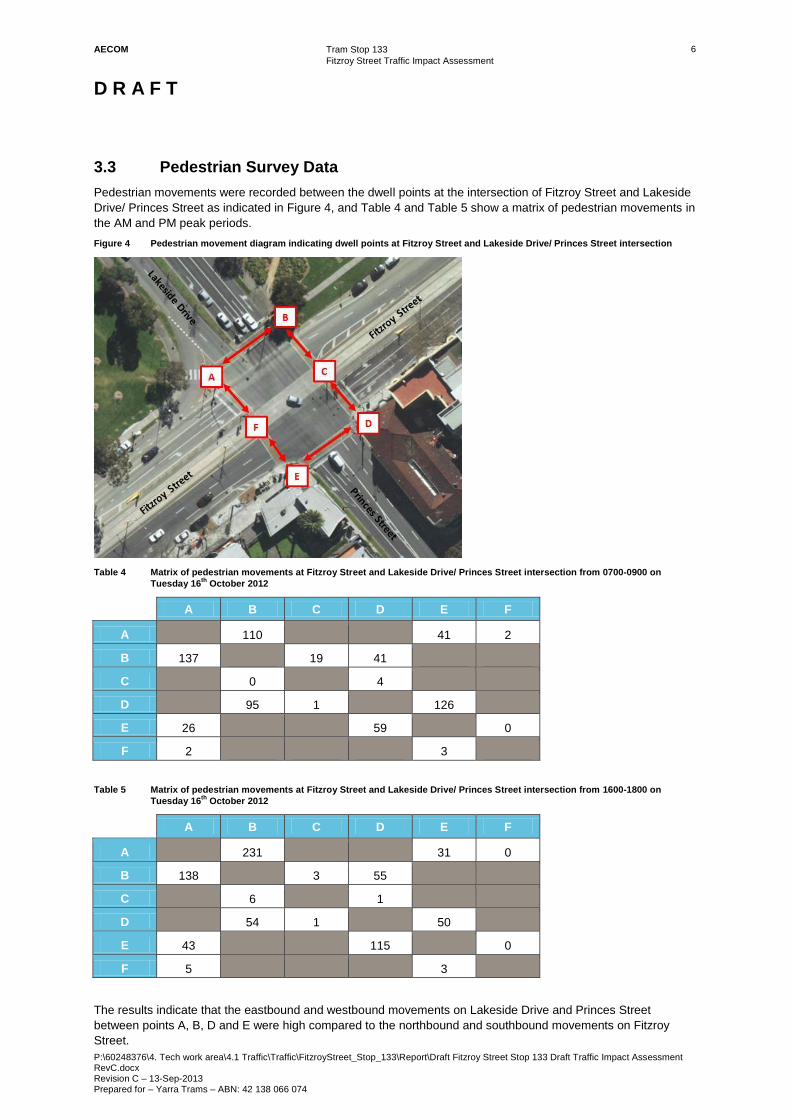
3.3 Pedestrian Survey Data
Pedestrian movements were recorded between the dwell points at the intersection of Fitzroy Street and Lakeside
Drive/ Princes Street as indicated in Figure 4, and Table 4 and Table 5 show a matrix of pedestrian movements in
the AM and PM peak periods.
Figure 4 Pedestrian movement diagram indicating dwell points at Fitzroy Street and Lakeside Drive/ Princes Street intersection
Table 4 Matrix of pedestrian movements at Fitzroy Street and Lakeside Drive/ Princes Street intersection from 0700-0900 on
Tuesday 16th
October 2012
A B C D E F
A
110
41 2
B 137
19 41
C
0
4
D
95 1
126
E 26
59
0
F 2
3
Table 5 Matrix of pedestrian movements at Fitzroy Street and Lakeside Drive/ Princes Street intersection from 1600-1800 on
Tuesday 16th
October 2012
A B C D E F
A
231
31 0
B 138
3 55
C
6
1
D
54 1
50
E 43
115
0
F 5
3
The results indicate that the eastbound and westbound movements on Lakeside Drive and Princes Street
between points A, B, D and E were high compared to the northbound and southbound movements on Fitzroy
Street.

AECOM
Tram Stop 133
Fitzroy Street Traffic Impact Assessment
D R A F T
P:\60248376\4. Tech work area\4.1 Traffic\Traffic\FitzroyStreet_Stop_133\Report\Draft Fitzroy Street Stop 133 Draft Traffic Impact Assessment RevC.docx Revision C – 13-Sep-2013 Prepared for – Yarra Trams – ABN: 42 138 066 074
7
Pedestrian movements were recorded between the dwell points at the intersection of Fitzroy Street and
Canterbury Road/ Grey Street as indicated in Figure 5, and Table 6 and Table 7 show a matrix of pedestrian
movements in the AM and PM peak periods.
Figure 5 Pedestrian movement diagram indicating dwell points at Fitzroy Street and Canterbury Road/ Grey Street intersection
Table 6 Matrix of pedestrian movements at Fitzroy Street and Canterbury Road/ Grey Street intersection from 0700-0900 on
Tuesday 16th
October 2012
A B C D E
A
37
43 38
B 88
63
C
157
145
D 26
138
195
E 10
39
Table 7 Matrix of pedestrian movements at Fitzroy Street and Canterbury Road/ Grey Street intersection from 1600-1800 on
Tuesday 16th
October 2012
A B C D E
A
115
46 25
B 85
238
C
150
261
D 61
294
79
E 49
114
The results indicate that the pedestrian movements were high in all directions including the movement between
Grey Street and tram stop 133 on Fitzroy Street in both AM and PM peak periods.
AECOM
Tram Stop 133
Fitzroy Street Traffic Impact Assessment
D R A F T
P:\60248376\4. Tech work area\4.1 Traffic\Traffic\FitzroyStreet_Stop_133\Report\Draft Fitzroy Street Stop 133 Draft Traffic Impact Assessment RevC.docx Revision C – 13-Sep-2013 Prepared for – Yarra Trams – ABN: 42 138 066 074
8
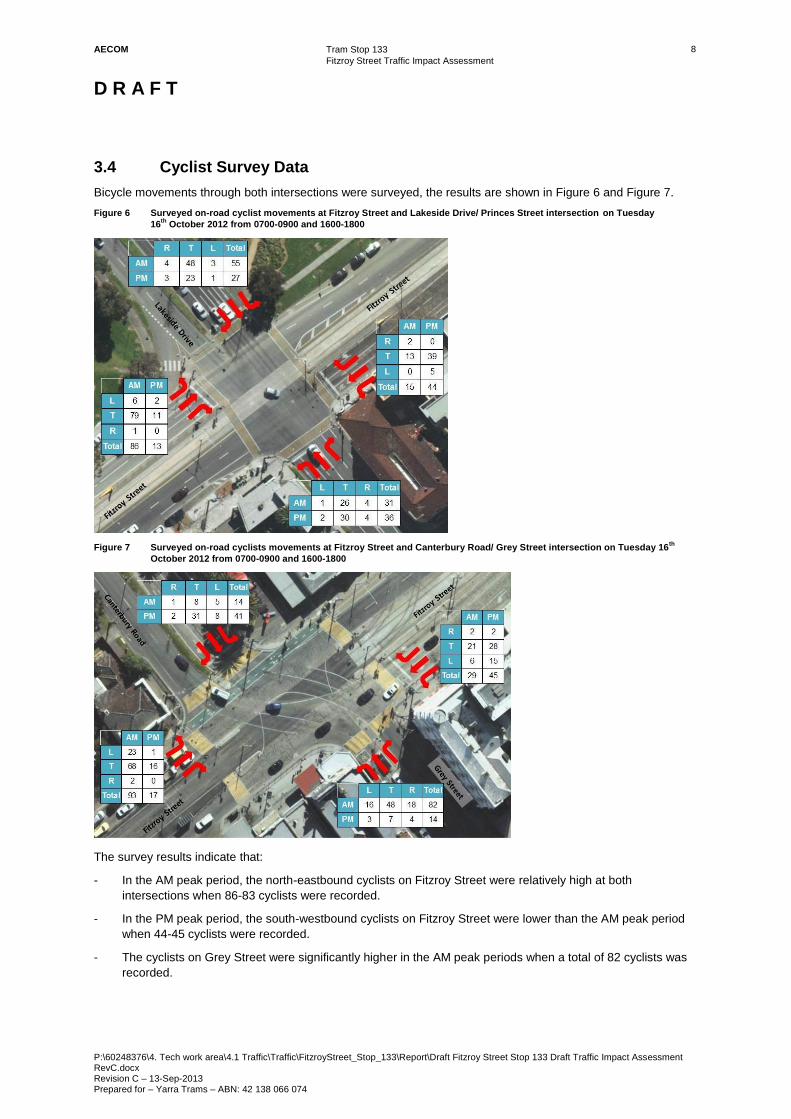
3.4 Cyclist Survey Data
Bicycle movements through both intersections were surveyed, the results are shown in Figure 6 and Figure 7.
Figure 6 Surveyed on-road cyclist movements at Fitzroy Street and Lakeside Drive/ Princes Street intersection on Tuesday
16th
October 2012 from 0700-0900 and 1600-1800
Figure 7 Surveyed on-road cyclists movements at Fitzroy Street and Canterbury Road/ Grey Street intersection on Tuesday 16th
October 2012 from 0700-0900 and 1600-1800
The survey results indicate that:
- In the AM peak period, the north-eastbound cyclists on Fitzroy Street were relatively high at both
intersections when 86-83 cyclists were recorded.
- In the PM peak period, the south-westbound cyclists on Fitzroy Street were lower than the AM peak period
when 44-45 cyclists were recorded.
- The cyclists on Grey Street were significantly higher in the AM peak periods when a total of 82 cyclists was
recorded.
AECOM
Tram Stop 133
Fitzroy Street Traffic Impact Assessment
D R A F T
P:\60248376\4. Tech work area\4.1 Traffic\Traffic\FitzroyStreet_Stop_133\Report\Draft Fitzroy Street Stop 133 Draft Traffic Impact Assessment RevC.docx Revision C – 13-Sep-2013 Prepared for – Yarra Trams – ABN: 42 138 066 074
9
4.0 VISSIM Microsimulation Traffic Modelling
4.1 Existing Conditions Model Development and Validation
An existing conditions Base Case VISSIM microsimulation model was developed for the area shown in Figure 1
incorporating the following intersections and access points:
- Fitzroy Street / Lakeside Drive / Princes Street
- Fitzroy Street / Canterbury Road / Grey Street
- Fitzroy Street / Balluk William Court
- Fitzroy Street / St Kilda Park Primary School access point
The modelled area extended beyond the intersections listed above to fully encompass traffic congestion resulting
from delays generated at these locations.
Survey data collected Tuesday 16 October 2012 was used to populate and validate the model to acceptable
Australian and UK modelling criteria and to reproduce conditions observed onsite during the evening peak period.
As discussed in Section 2.1.2, peak traffic flow occurs during the evening peak period. Consequently, the
evening peak 4.00-6.00pm has been represented in the modelling. The adopted process thus includes a
comprehensive numerical and qualitative assessment that the modelled areas of congestion are at locations, and
to appropriate extents, as could reasonably be expected by someone familiar with typical, real life network
conditions.
Flow to volume related criteria is a measure of the goodness-of-fit of the model against observed conditions
through application of the “GeH” Statistic. The GeH statistic provides a self-scaling measure of goodness of fit of
modelled to observed flows, necessary because of the large range over which observed traffic flows can.
The GeH statistic is defined as:
Where: O = Observed Flow and M = Model Flow
Common acceptability thresholds adopted in the field of traffic engineering for flow rates are itemised below:
- GeH value of less than or equal to 2.0 – Good fit of modelled flow relative to observed value.
- GeH value of between 2.0 and 5.0 – Moderate fit of modelled flow relative to observed value.
- GeH value of greater than 5.0 – Poor fit of modelled flow relative to observed value.
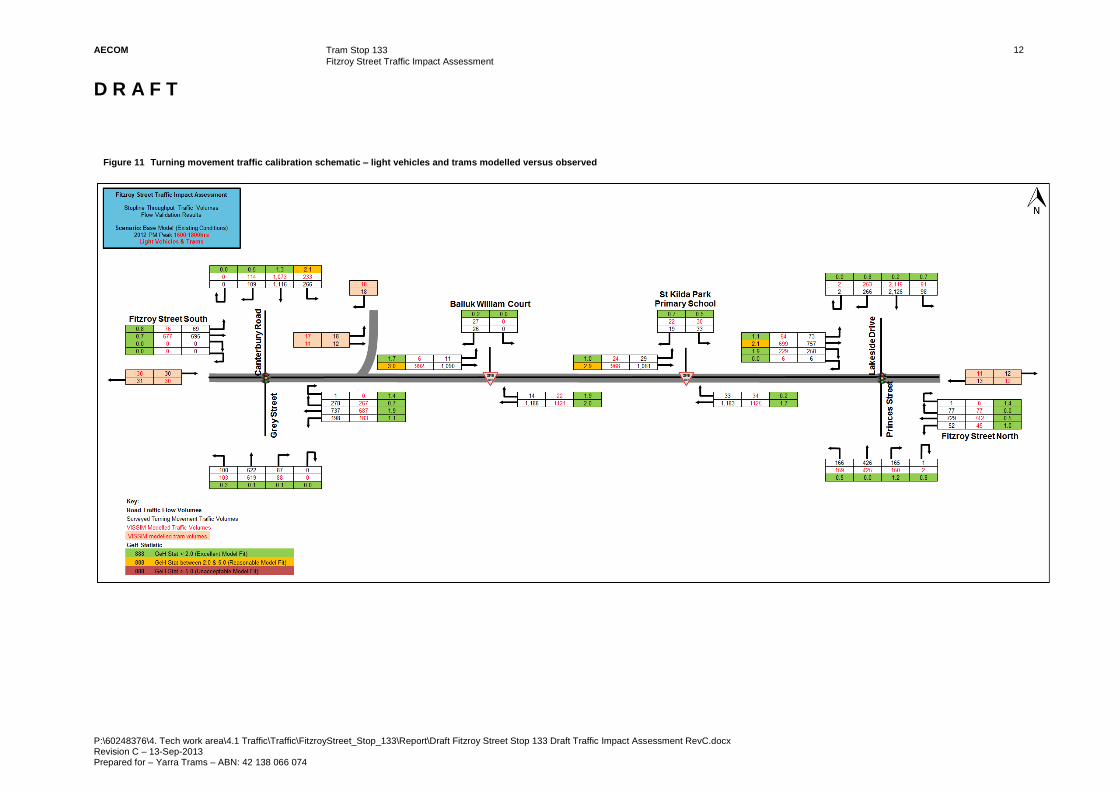
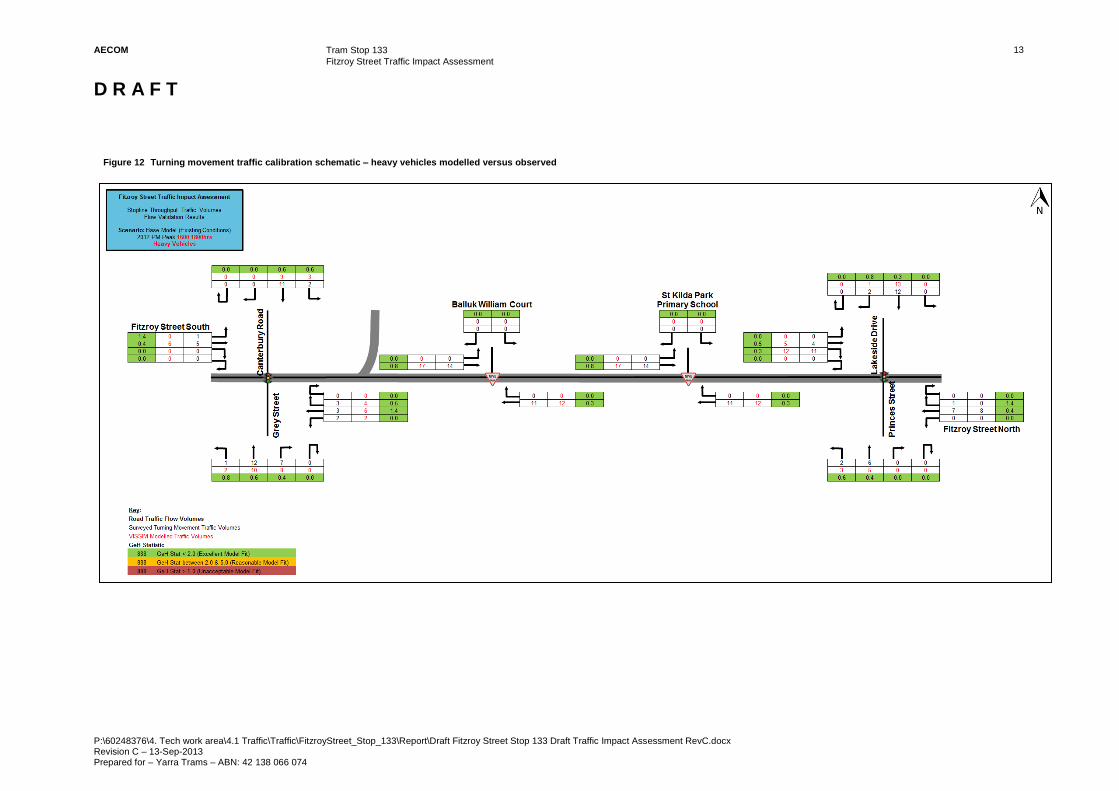
Modelled traffic volumes have been compared against survey volumes for all movements at the intersections
listed above as well as tram movements to and from St Kilda Light Rail Station. The results of the comparison are
shown in Figure 11 and Figure 12.
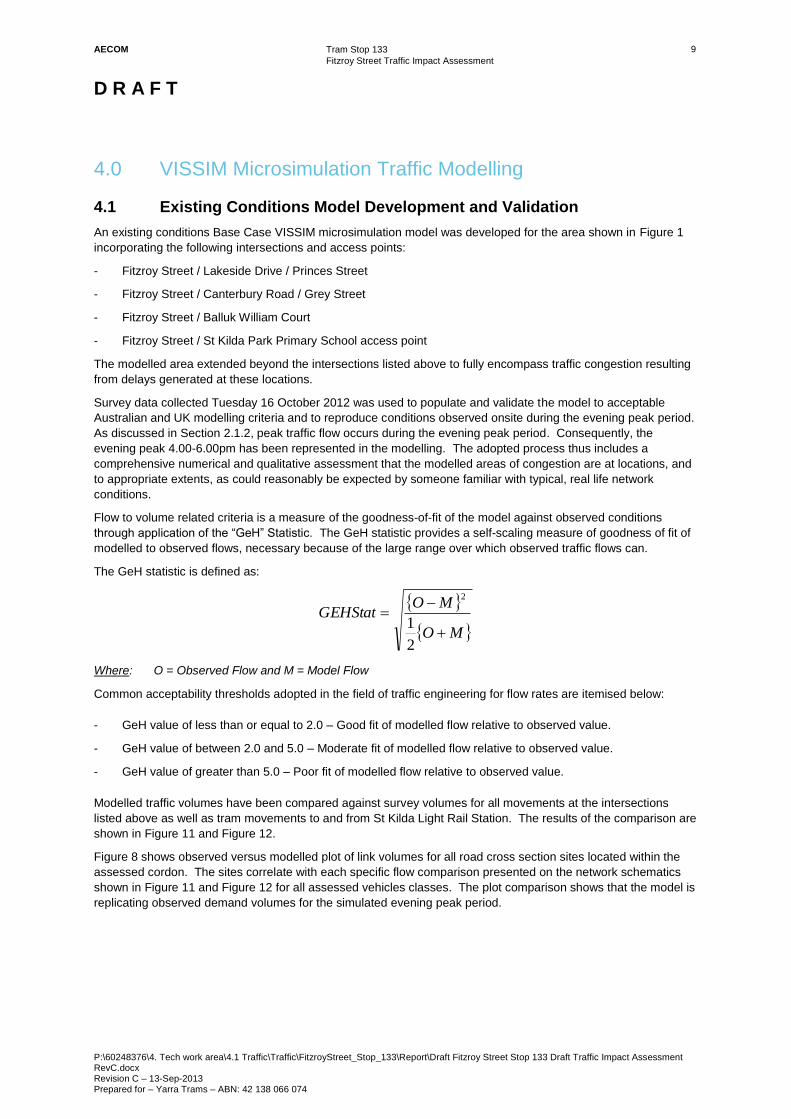
Figure 8 shows observed versus modelled plot of link volumes for all road cross section sites located within the
assessed cordon. The sites correlate with each specific flow comparison presented on the network schematics
shown in Figure 11 and Figure 12 for all assessed vehicles classes. The plot comparison shows that the model is
replicating observed demand volumes for the simulated evening peak period.
MO
MOGEHStat
2
1
2
AECOM
Tram Stop 133
Fitzroy Street Traffic Impact Assessment
D R A F T
P:\60248376\4. Tech work area\4.1 Traffic\Traffic\FitzroyStreet_Stop_133\Report\Draft Fitzroy Street Stop 133 Draft Traffic Impact Assessment RevC.docx Revision C – 13-Sep-2013 Prepared for – Yarra Trams – ABN: 42 138 066 074
10
Figure 8 Observed versus modelled 2 hour flow volumes – light and heavy vehicles
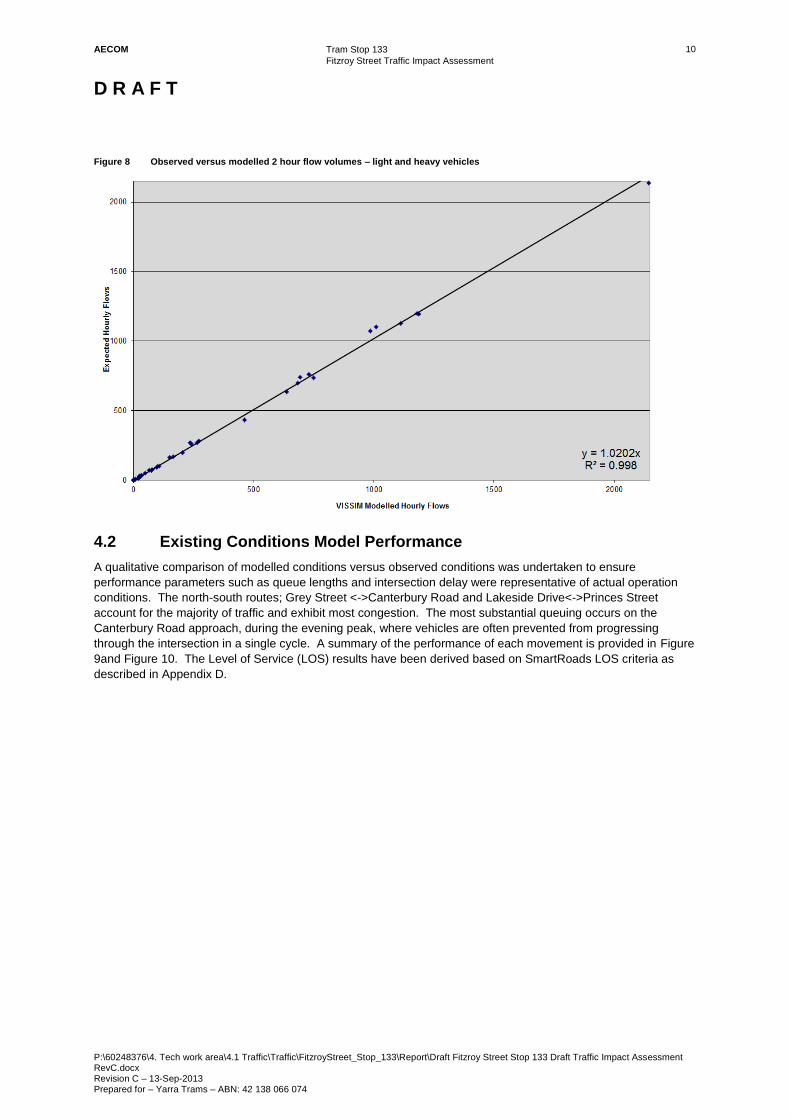
4.2 Existing Conditions Model Performance
A qualitative comparison of modelled conditions versus observed conditions was undertaken to ensure
performance parameters such as queue lengths and intersection delay were representative of actual operation
conditions. The north-south routes; Grey Street <->Canterbury Road and Lakeside Drive<->Princes Street
account for the majority of traffic and exhibit most congestion. The most substantial queuing occurs on the
Canterbury Road approach, during the evening peak, where vehicles are often prevented from progressing
through the intersection in a single cycle. A summary of the performance of each movement is provided in Figure
9and Figure 10. The Level of Service (LOS) results have been derived based on SmartRoads LOS criteria as
described in Appendix D.
AECOM
Tram Stop 133
Fitzroy Street Traffic Impact Assessment
D R A F T
P:\60248376\4. Tech work area\4.1 Traffic\Traffic\FitzroyStreet_Stop_133\Report\Draft Fitzroy Street Stop 133 Draft Traffic Impact Assessment RevC.docx Revision C – 13-Sep-2013 Prepared for – Yarra Trams – ABN: 42 138 066 074
11
Figure 9 Fitzroy Street / Canterbury Road / Grey Street Existing Conditions LOS summary
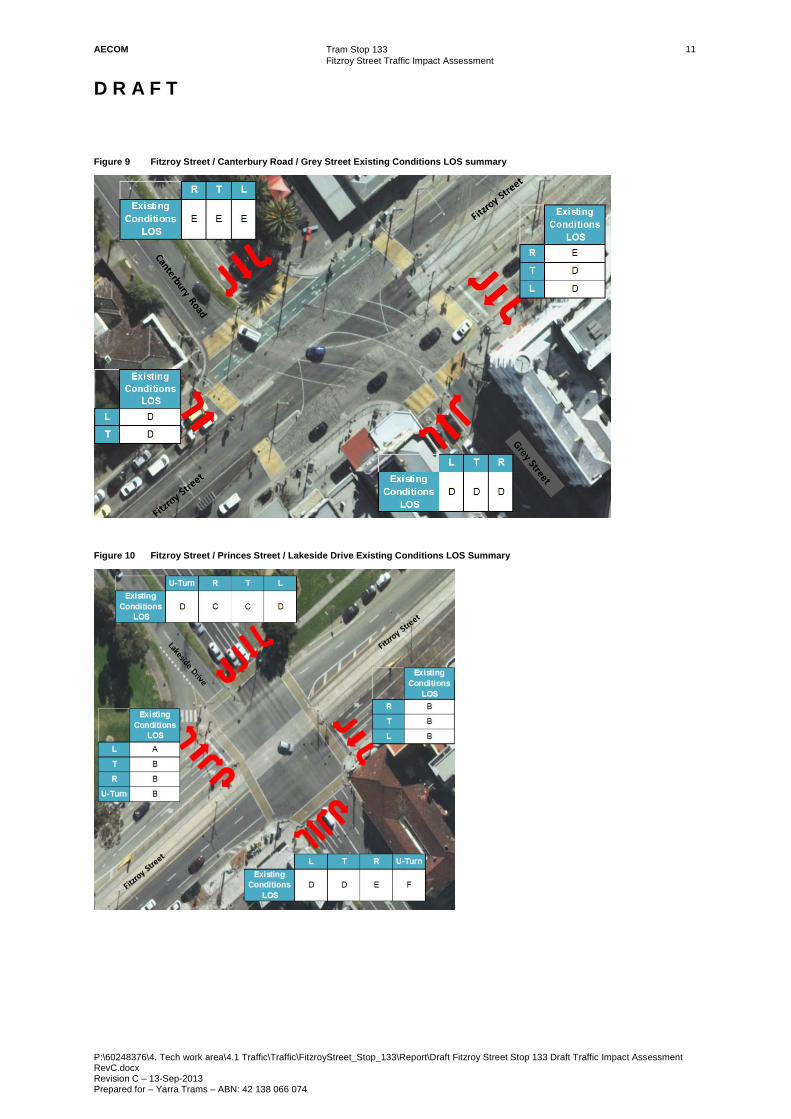
Figure 10 Fitzroy Street / Princes Street / Lakeside Drive Existing Conditions LOS Summary
AECOM
Tram Stop 133
Fitzroy Street Traffic Impact Assessment
D R A F T
P:\60248376\4. Tech work area\4.1 Traffic\Traffic\FitzroyStreet_Stop_133\Report\Draft Fitzroy Street Stop 133 Draft Traffic Impact Assessment RevC.docx Revision C – 13-Sep-2013 Prepared for – Yarra Trams – ABN: 42 138 066 074
12
Figure 11 Turning movement traffic calibration schematic – light vehicles and trams modelled versus observed
AECOM
Tram Stop 133
Fitzroy Street Traffic Impact Assessment
D R A F T
P:\60248376\4. Tech work area\4.1 Traffic\Traffic\FitzroyStreet_Stop_133\Report\Draft Fitzroy Street Stop 133 Draft Traffic Impact Assessment RevC.docx Revision C – 13-Sep-2013 Prepared for – Yarra Trams – ABN: 42 138 066 074
13
Figure 12 Turning movement traffic calibration schematic – heavy vehicles modelled versus observed
AECOM
Tram Stop 133
Fitzroy Street Traffic Impact Assessment
D R A F T
P:\60248376\4. Tech work area\4.1 Traffic\Traffic\FitzroyStreet_Stop_133\Report\Draft Fitzroy Street Stop 133 Draft Traffic Impact Assessment RevC.docx Revision C – 13-Sep-2013 Prepared for – Yarra Trams – ABN: 42 138 066 074
14
4.3 Concept Design Operational Analysis
The concept design options as described in Section 1.3 and shown in Appendix E have been coded in VISSIM
and used to assess the operational performance of the road network under the four proposed tram stop
configurations. In each case this involved the following:
- Construction of a pedestrian activated signal crossing (which has been fully represented in the
microsimulation model)
- Relocation of the tram pedestrian demand from the existing tram stops at Fitzroy Street / Canterbury and
Fitzroy Street / Princes Street
- A single through lane on Fitzroy Street as necessary on sections adjacent to the accessible tram stop
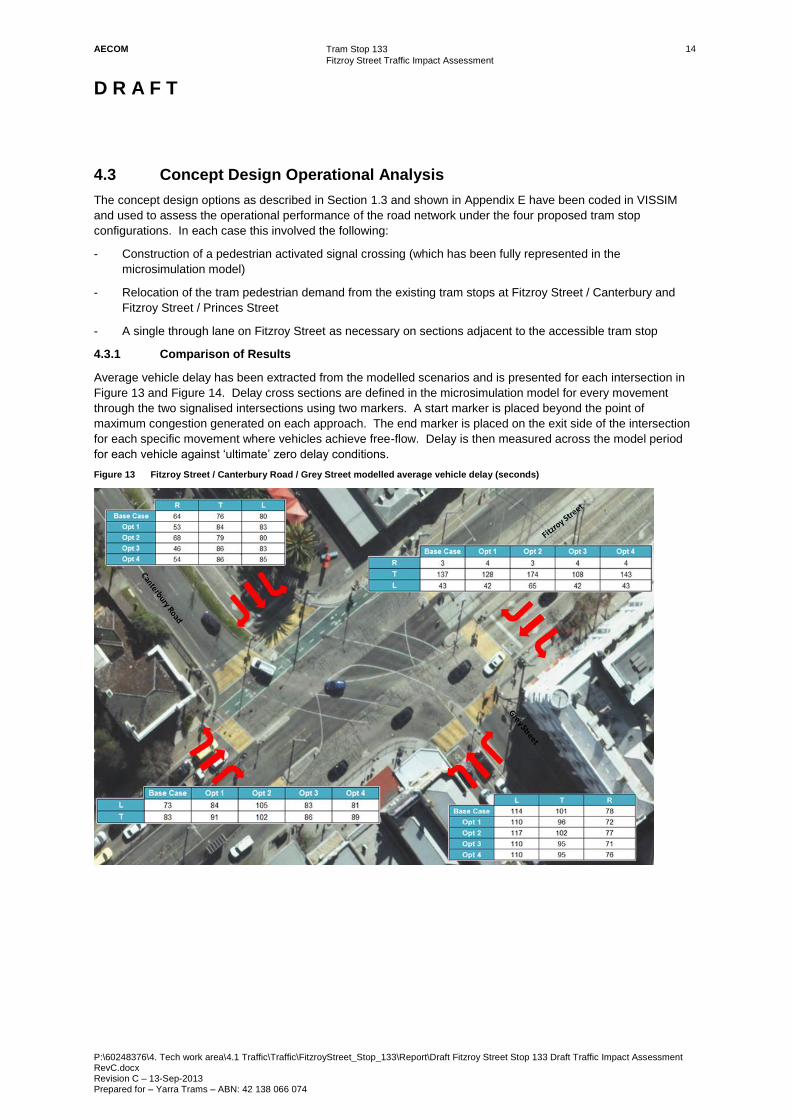
4.3.1 Comparison of Results
Average vehicle delay has been extracted from the modelled scenarios and is presented for each intersection in
Figure 13 and Figure 14. Delay cross sections are defined in the microsimulation model for every movement
through the two signalised intersections using two markers. A start marker is placed beyond the point of
maximum congestion generated on each approach. The end marker is placed on the exit side of the intersection
for each specific movement where vehicles achieve free-flow. Delay is then measured across the model period
for each vehicle against ‘ultimate’ zero delay conditions.
Figure 13 Fitzroy Street / Canterbury Road / Grey Street modelled average vehicle delay (seconds)
AECOM
Tram Stop 133
Fitzroy Street Traffic Impact Assessment
D R A F T
P:\60248376\4. Tech work area\4.1 Traffic\Traffic\FitzroyStreet_Stop_133\Report\Draft Fitzroy Street Stop 133 Draft Traffic Impact Assessment RevC.docx Revision C – 13-Sep-2013 Prepared for – Yarra Trams – ABN: 42 138 066 074
15
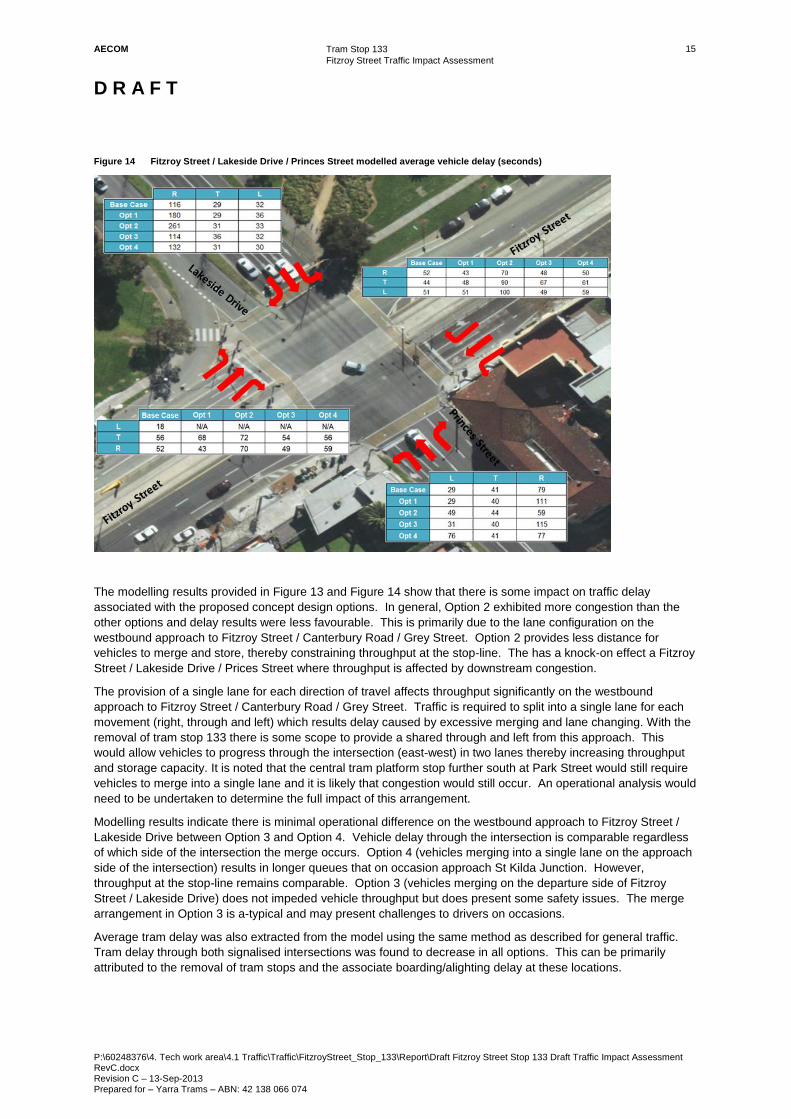
Figure 14 Fitzroy Street / Lakeside Drive / Princes Street modelled average vehicle delay (seconds)
The modelling results provided in Figure 13 and Figure 14 show that there is some impact on traffic delay
associated with the proposed concept design options. In general, Option 2 exhibited more congestion than the
other options and delay results were less favourable. This is primarily due to the lane configuration on the
westbound approach to Fitzroy Street / Canterbury Road / Grey Street. Option 2 provides less distance for
vehicles to merge and store, thereby constraining throughput at the stop-line. The has a knock-on effect a Fitzroy
Street / Lakeside Drive / Prices Street where throughput is affected by downstream congestion.
The provision of a single lane for each direction of travel affects throughput significantly on the westbound
approach to Fitzroy Street / Canterbury Road / Grey Street. Traffic is required to split into a single lane for each
movement (right, through and left) which results delay caused by excessive merging and lane changing. With the
removal of tram stop 133 there is some scope to provide a shared through and left from this approach. This
would allow vehicles to progress through the intersection (east-west) in two lanes thereby increasing throughput
and storage capacity. It is noted that the central tram platform stop further south at Park Street would still require
vehicles to merge into a single lane and it is likely that congestion would still occur. An operational analysis would
need to be undertaken to determine the full impact of this arrangement.
Modelling results indicate there is minimal operational difference on the westbound approach to Fitzroy Street /
Lakeside Drive between Option 3 and Option 4. Vehicle delay through the intersection is comparable regardless
of which side of the intersection the merge occurs. Option 4 (vehicles merging into a single lane on the approach
side of the intersection) results in longer queues that on occasion approach St Kilda Junction. However,
throughput at the stop-line remains comparable. Option 3 (vehicles merging on the departure side of Fitzroy
Street / Lakeside Drive) does not impeded vehicle throughput but does present some safety issues. The merge
arrangement in Option 3 is a-typical and may present challenges to drivers on occasions.
Average tram delay was also extracted from the model using the same method as described for general traffic.
Tram delay through both signalised intersections was found to decrease in all options. This can be primarily
attributed to the removal of tram stops and the associate boarding/alighting delay at these locations.
AECOM
Tram Stop 133
Fitzroy Street Traffic Impact Assessment
D R A F T
P:\60248376\4. Tech work area\4.1 Traffic\Traffic\FitzroyStreet_Stop_133\Report\Draft Fitzroy Street Stop 133 Draft Traffic Impact Assessment RevC.docx Revision C – 13-Sep-2013 Prepared for – Yarra Trams – ABN: 42 138 066 074
16
5.0 Network Fit Assessment (NFA)
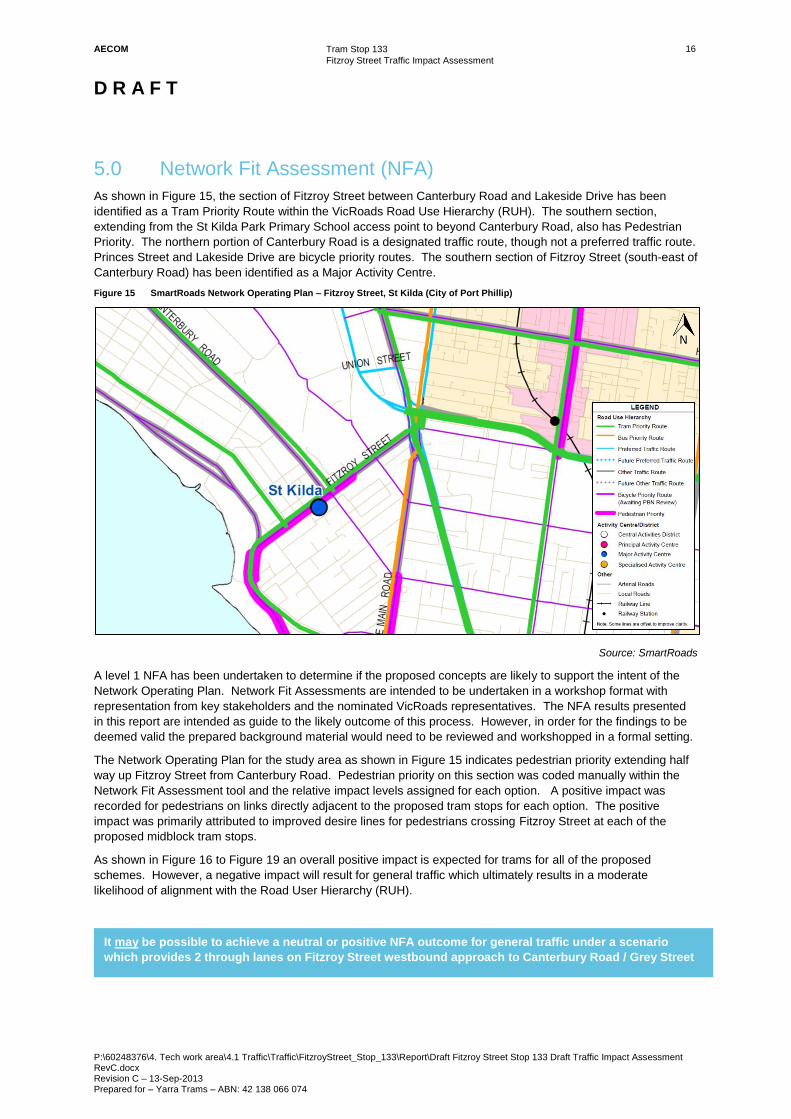
As shown in Figure 15, the section of Fitzroy Street between Canterbury Road and Lakeside Drive has been
identified as a Tram Priority Route within the VicRoads Road Use Hierarchy (RUH). The southern section,
extending from the St Kilda Park Primary School access point to beyond Canterbury Road, also has Pedestrian
Priority. The northern portion of Canterbury Road is a designated traffic route, though not a preferred traffic route.
Princes Street and Lakeside Drive are bicycle priority routes. The southern section of Fitzroy Street (south-east of
Canterbury Road) has been identified as a Major Activity Centre.
Figure 15 SmartRoads Network Operating Plan – Fitzroy Street, St Kilda (City of Port Phillip)
Source: SmartRoads
A level 1 NFA has been undertaken to determine if the proposed concepts are likely to support the intent of the
Network Operating Plan. Network Fit Assessments are intended to be undertaken in a workshop format with
representation from key stakeholders and the nominated VicRoads representatives. The NFA results presented
in this report are intended as guide to the likely outcome of this process. However, in order for the findings to be
deemed valid the prepared background material would need to be reviewed and workshopped in a formal setting.
The Network Operating Plan for the study area as shown in Figure 15 indicates pedestrian priority extending half
way up Fitzroy Street from Canterbury Road. Pedestrian priority on this section was coded manually within the
Network Fit Assessment tool and the relative impact levels assigned for each option. A positive impact was
recorded for pedestrians on links directly adjacent to the proposed tram stops for each option. The positive
impact was primarily attributed to improved desire lines for pedestrians crossing Fitzroy Street at each of the
proposed midblock tram stops.
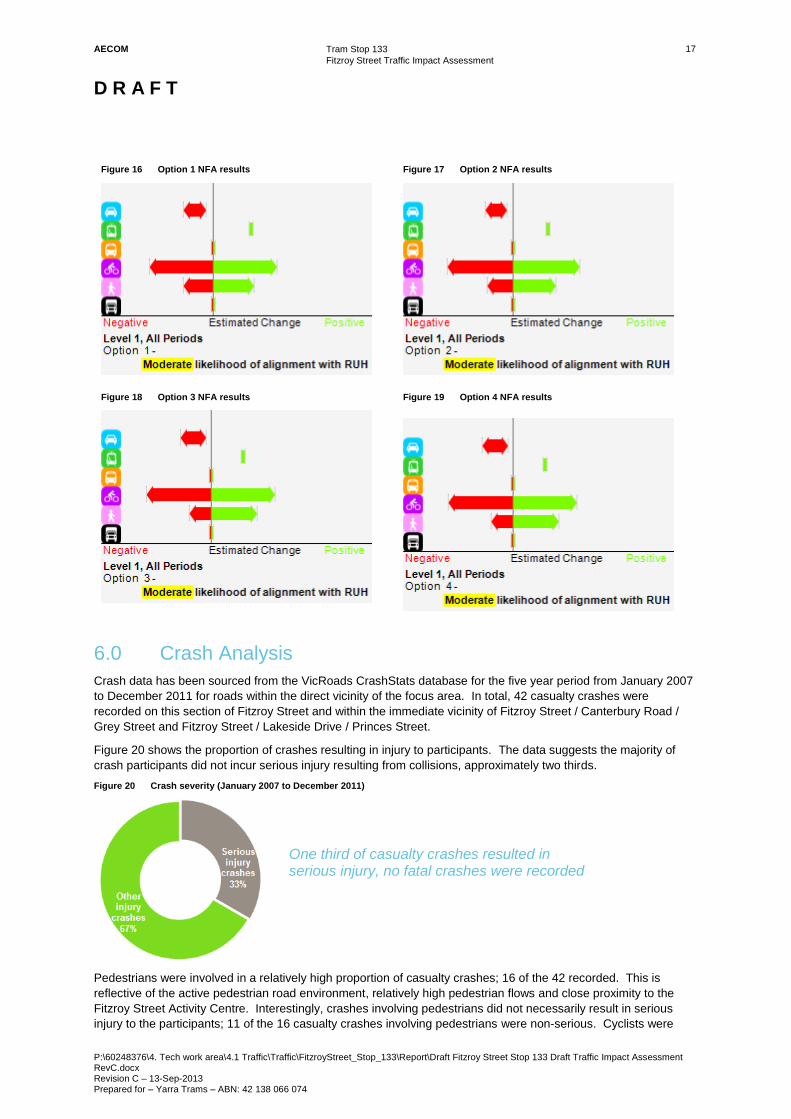
As shown in Figure 16 to Figure 19 an overall positive impact is expected for trams for all of the proposed
schemes. However, a negative impact will result for general traffic which ultimately results in a moderate
likelihood of alignment with the Road User Hierarchy (RUH).
It may be possible to achieve a neutral or positive NFA outcome for general traffic under a scenario
which provides 2 through lanes on Fitzroy Street westbound approach to Canterbury Road / Grey Street
AECOM
Tram Stop 133
Fitzroy Street Traffic Impact Assessment
D R A F T
P:\60248376\4. Tech work area\4.1 Traffic\Traffic\FitzroyStreet_Stop_133\Report\Draft Fitzroy Street Stop 133 Draft Traffic Impact Assessment RevC.docx Revision C – 13-Sep-2013 Prepared for – Yarra Trams – ABN: 42 138 066 074
17
Figure 16 Option 1 NFA results
Figure 17 Option 2 NFA results
Figure 18 Option 3 NFA results Figure 19 Option 4 NFA results
6.0 Crash Analysis
Crash data has been sourced from the VicRoads CrashStats database for the five year period from January 2007
to December 2011 for roads within the direct vicinity of the focus area. In total, 42 casualty crashes were
recorded on this section of Fitzroy Street and within the immediate vicinity of Fitzroy Street / Canterbury Road /
Grey Street and Fitzroy Street / Lakeside Drive / Princes Street.
Figure 20 shows the proportion of crashes resulting in injury to participants. The data suggests the majority of
crash participants did not incur serious injury resulting from collisions, approximately two thirds.
Figure 20 Crash severity (January 2007 to December 2011)
Pedestrians were involved in a relatively high proportion of casualty crashes; 16 of the 42 recorded. This is
reflective of the active pedestrian road environment, relatively high pedestrian flows and close proximity to the
Fitzroy Street Activity Centre. Interestingly, crashes involving pedestrians did not necessarily result in serious
injury to the participants; 11 of the 16 casualty crashes involving pedestrians were non-serious. Cyclists were
One third of casualty crashes resulted in serious injury, no fatal crashes were recorded

AECOM
Tram Stop 133
Fitzroy Street Traffic Impact Assessment
D R A F T
P:\60248376\4. Tech work area\4.1 Traffic\Traffic\FitzroyStreet_Stop_133\Report\Draft Fitzroy Street Stop 133 Draft Traffic Impact Assessment RevC.docx Revision C – 13-Sep-2013 Prepared for – Yarra Trams – ABN: 42 138 066 074
18
also highly represented with vehicles and cyclists colliding on eight occasions. One collision was reported
involving a cyclist and a pedestrian however neither participant incurred serious injury.
The physical road environment was not impacted significantly by road crashes with vehicles colliding with fixed
objects on only two occasions in the five year period. Run-off road crashes accounted for only 14%. Rear-end
collisions also accounted for 14% of crashes. There were no crashes with trams reported in crash data for this
period. Figure 21 shows the number of crashes recorded for each VicRoads Definitions for Classifying Accidents
(DCA) categories.
Figure 21 Crash summary by DCA groups
As shown in Table 8, the total number of crashes annually remains relatively low for this site. Only three casualty
crashes were recorded in the 2011 calendar year, although the annual average was eight.
Table 8 Yearly crash totals January 2007 to December 2011
2007 2008 2009 2010 2011
13 11 5 10 3
As shown in Figure 22, crash frequency was not necessarily concentrated to a specific time of day. A higher
number of crashes did occur during the AM peak period with low numbers recorded early in the morning and at
midday. This may be somewhat attributed to increased activity surrounding school drop-offs.
Figure 22 Crash frequency by time of day
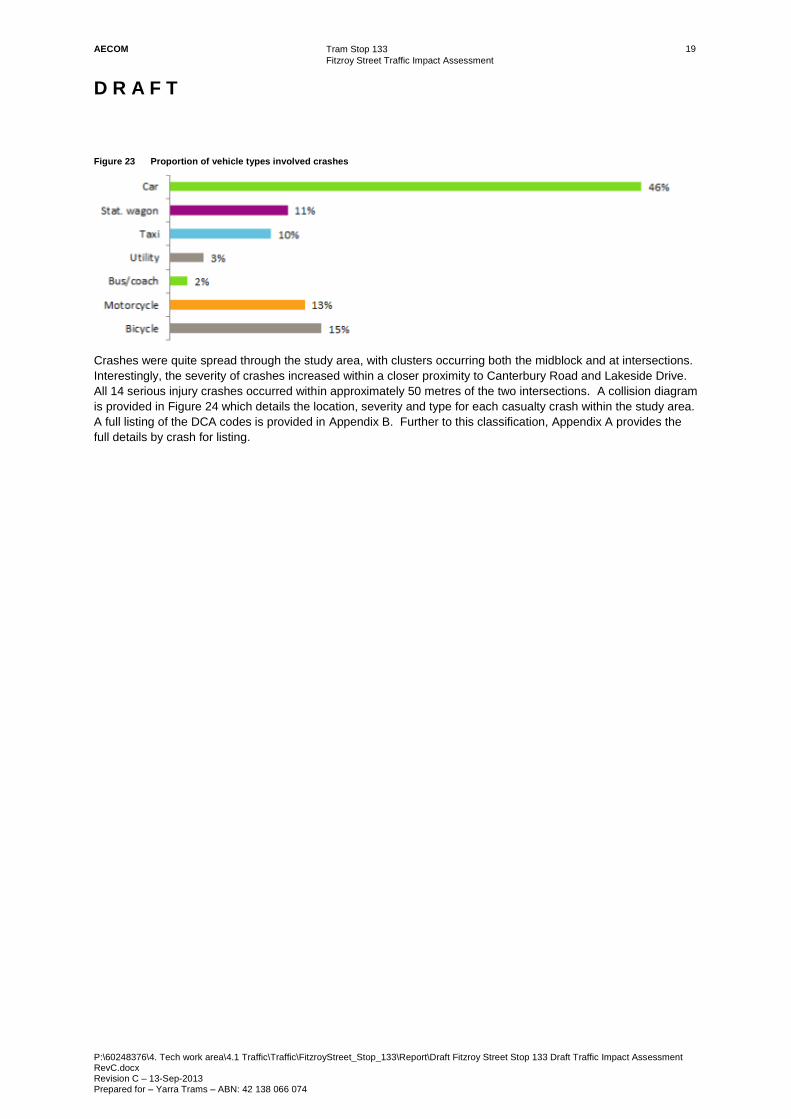
Figure 23 shows the proportion various vehicle types involved in crashes across the assessment period. General
traffic vehicles were involved in the majority of crashes. However, almost a third of crashes involved either
motorcycles or bicycles.
AECOM
Tram Stop 133
Fitzroy Street Traffic Impact Assessment
D R A F T
P:\60248376\4. Tech work area\4.1 Traffic\Traffic\FitzroyStreet_Stop_133\Report\Draft Fitzroy Street Stop 133 Draft Traffic Impact Assessment RevC.docx Revision C – 13-Sep-2013 Prepared for – Yarra Trams – ABN: 42 138 066 074
19
Figure 23 Proportion of vehicle types involved crashes
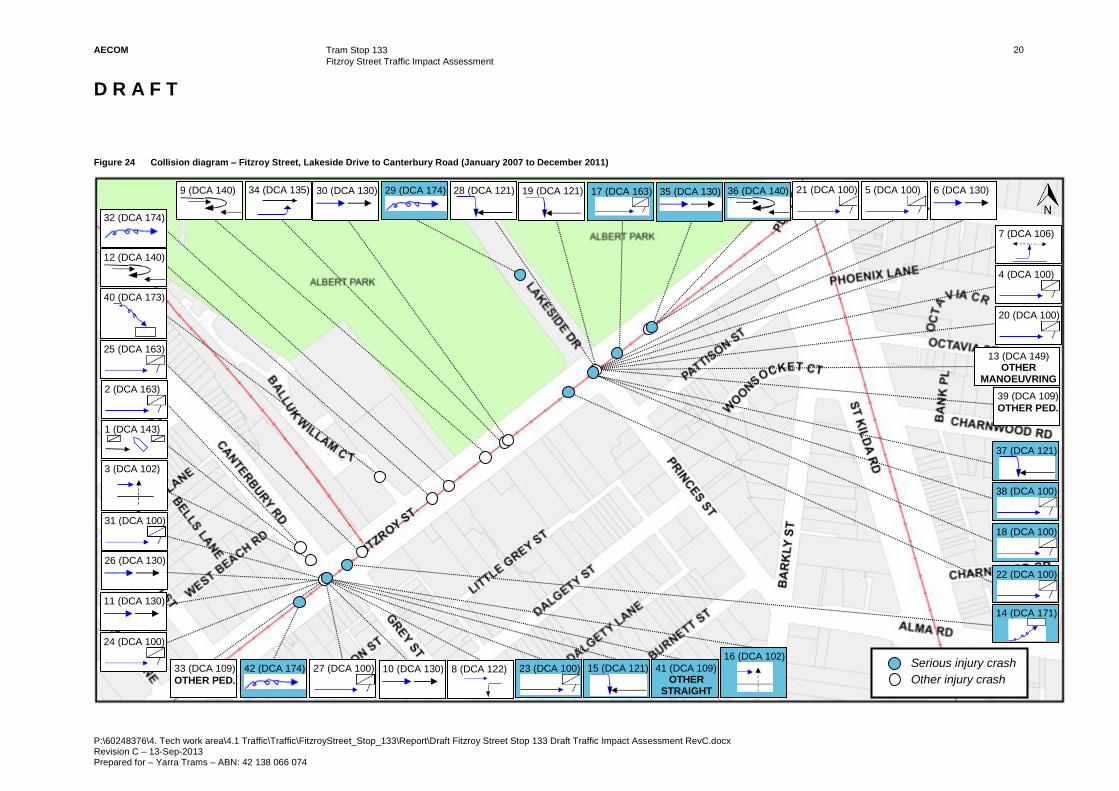
Crashes were quite spread through the study area, with clusters occurring both the midblock and at intersections.
Interestingly, the severity of crashes increased within a closer proximity to Canterbury Road and Lakeside Drive.
All 14 serious injury crashes occurred within approximately 50 metres of the two intersections. A collision diagram
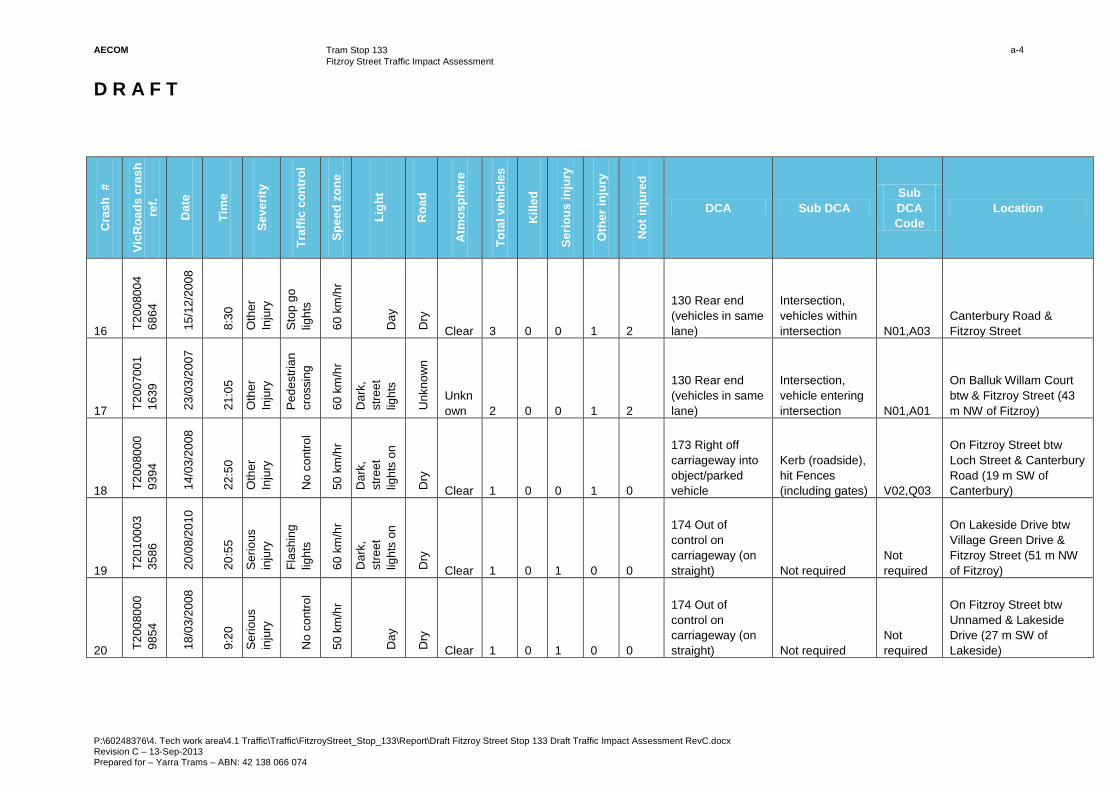
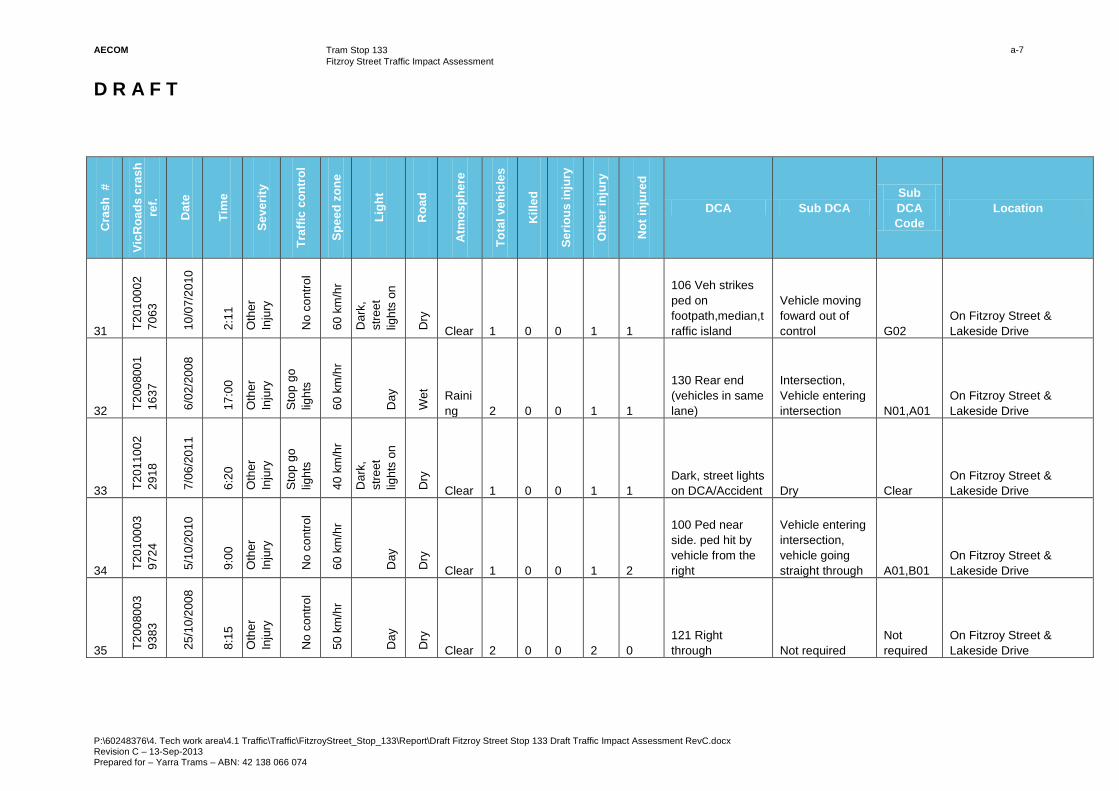
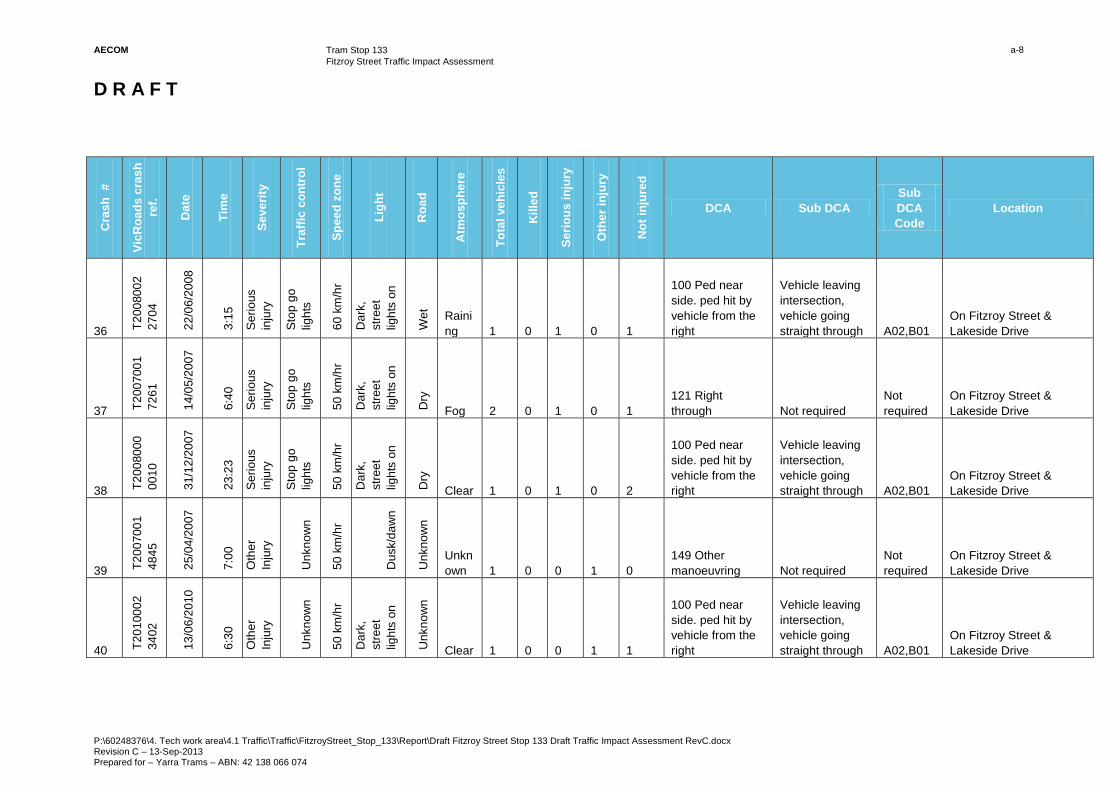
is provided in Figure 24 which details the location, severity and type for each casualty crash within the study area.
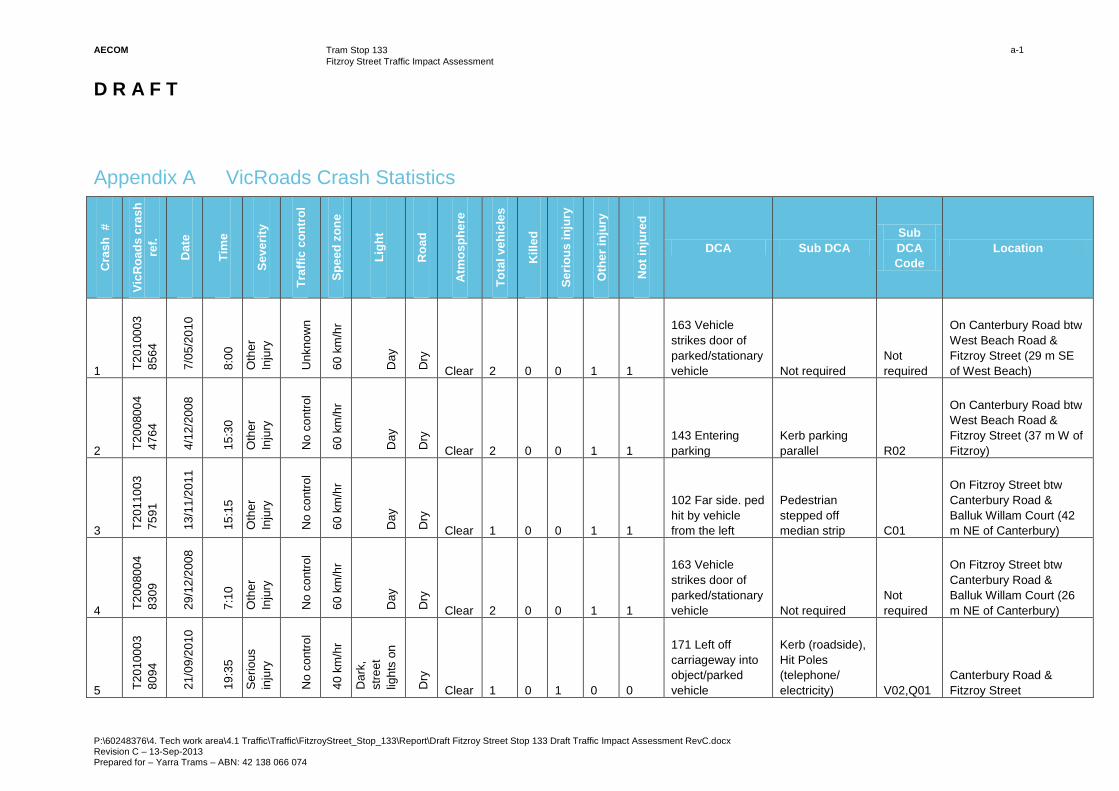
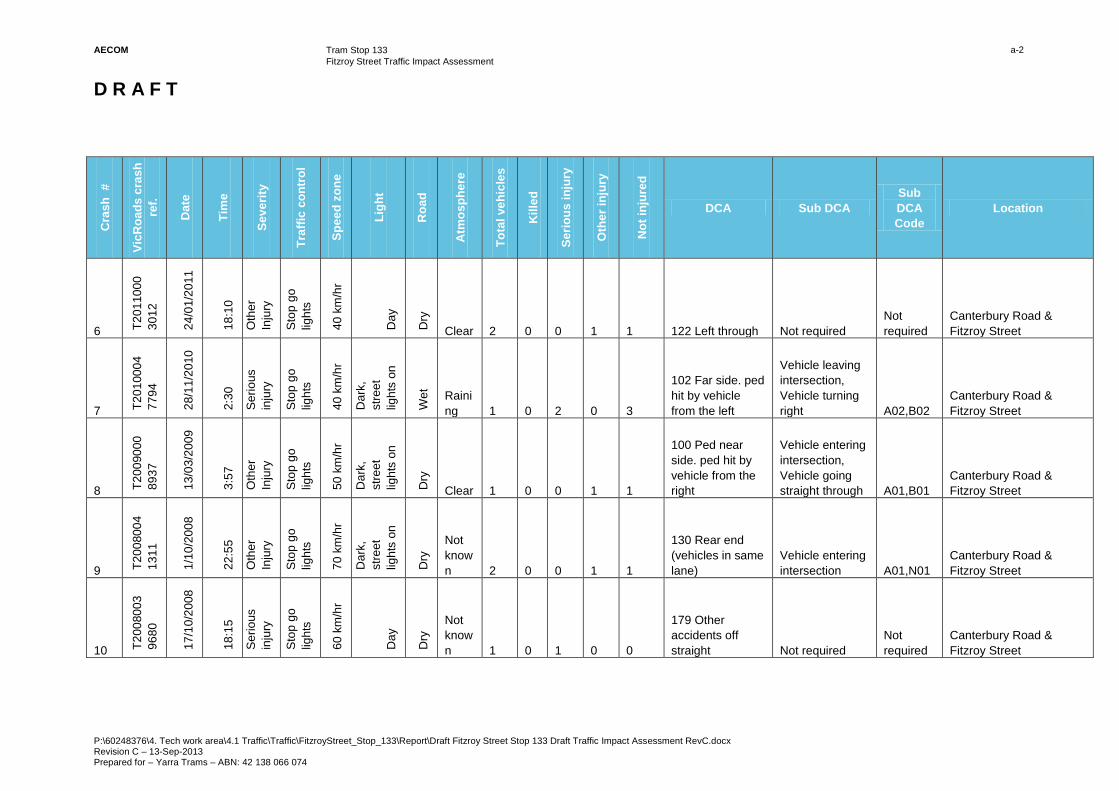
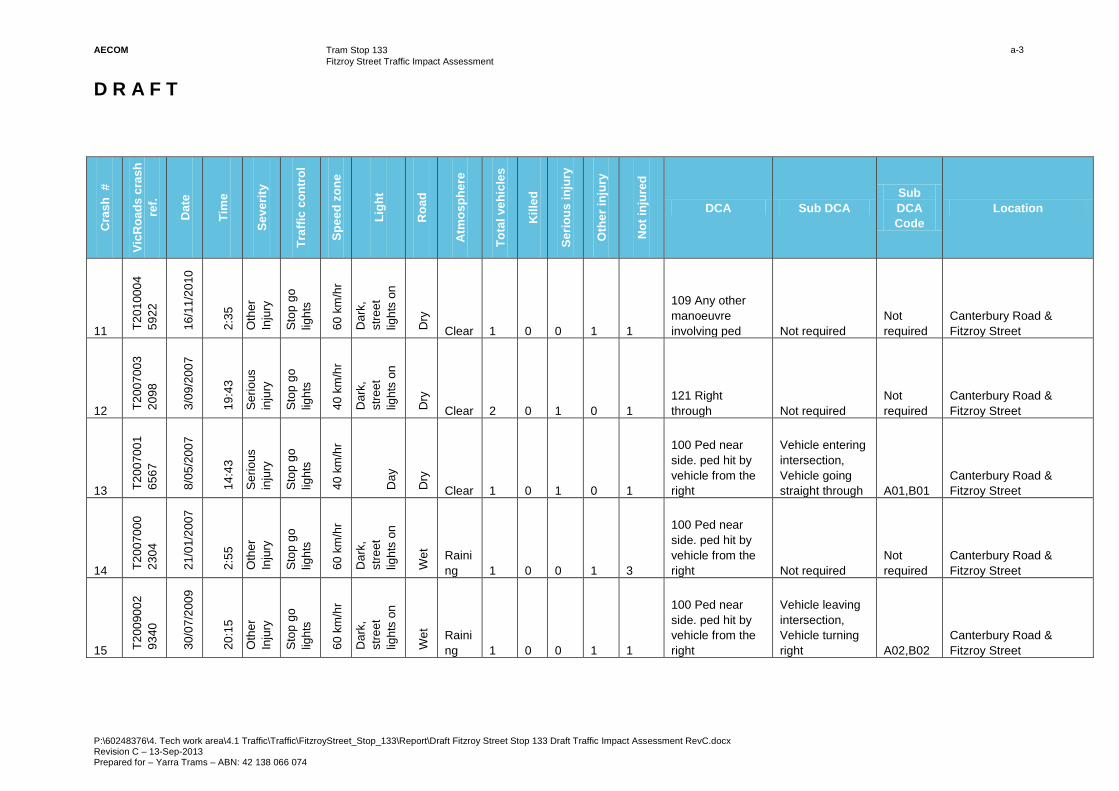
A full listing of the DCA codes is provided in Appendix B. Further to this classification, Appendix A provides the
full details by crash for listing.
AECOM
Tram Stop 133
Fitzroy Street Traffic Impact Assessment
D R A F T
P:\60248376\4. Tech work area\4.1 Traffic\Traffic\FitzroyStreet_Stop_133\Report\Draft Fitzroy Street Stop 133 Draft Traffic Impact Assessment RevC.docx Revision C – 13-Sep-2013 Prepared for – Yarra Trams – ABN: 42 138 066 074
20
Figure 24 Collision diagram – Fitzroy Street, Lakeside Drive to Canterbury Road (January 2007 to December 2011)
1 (DCA 143)
3 (DCA 102)
31 (DCA 100)
26 (DCA 130)
11 (DCA 130)
24 (DCA 100)
33 (DCA 109)
OTHER PED. 8 (DCA 122)
27 (DCA 100)
10 (DCA 130)
12 (DCA 140)
40 (DCA 173)
13 (DCA 149) OTHER
MANOEUVRING
7 (DCA 106)
20 (DCA 100)
42 (DCA 174)
23 (DCA 100)
15 (DCA 121)
Serious injury crash
Other injury crash 41 (DCA 109)
OTHER STRAIGHT
16 (DCA 102)
14 (DCA 171)
22 (DCA 100)
37 (DCA 121)
38 (DCA 100)
18 (DCA 100)
29 (DCA 174)
39 (DCA 109)
OTHER PED.
2 (DCA 163)
4 (DCA 100)
25 (DCA 163)
32 (DCA 174)
6 (DCA 130)
5 (DCA 100)
21 (DCA 100)
36 (DCA 140)
35 (DCA 130)
17 (DCA 163)
19 (DCA 121)
28 (DCA 121)
30 (DCA 130)
34 (DCA 135)
9 (DCA 140)

AECOM
Tram Stop 133
Fitzroy Street Traffic Impact Assessment
D R A F T
P:\60248376\4. Tech work area\4.1 Traffic\Traffic\FitzroyStreet_Stop_133\Report\Draft Fitzroy Street Stop 133 Draft Traffic Impact Assessment RevC.docx Revision C – 13-Sep-2013 Prepared for – Yarra Trams – ABN: 42 138 066 074
21
7.0 Swept Path Analysis - St Kilda Park Primary School Access Point
A Swept path analysis was completed for light vehicles entering and exiting St Kilda Park Primary School access point. The figure shown below indicates that the movements
can be successfully completed within the specified allocation.

AECOM
Tram Stop 133
Fitzroy Street Traffic Impact Assessment
D R A F T
P:\60248376\4. Tech work area\4.1 Traffic\Traffic\FitzroyStreet_Stop_133\Report\Draft Fitzroy Street Stop 133 Draft Traffic Impact Assessment RevC.docx Revision C – 13-Sep-2013 Prepared for – Yarra Trams – ABN: 42 138 066 074
22
8.0 Conclusions and Recommendations
The analysis presented in this report falls into four sections as outlined below.
8.1 VISSIM Network Modelling
Micro simulation traffic modelling was undertaken using VISSIM to represent existing conditions and to quantify
the impact on the surrounding road network for the following proposed concept designs:
- Option 1 - relocation of tram stop 133 to Fitzroy Street north-east
- Option 2 - relocation of tram stop 133 to Fitzroy Street south-west
- Option 3 - right to left merge, departure side of Fitzroy Street / Lakeside Drive / Princes Street
- Option 4 - single through lane Fitzroy Street westbound
The traffic modelling indicates infrastructure changes associated with all four options will result in additional
congestion across the assessed network. Average delay was compared for all movements through both
signalised intersection. Overall Option 3 performed more favourably than the other options which can be primarily
attributed to the amount storage space on the east approach to Fitzroy Street / Canterbury Road / Grey Street
and the metering effect associated with reducing the westbound approach to Fitzroy Street / Lakeside Drive to
one through lane. Additional analysis should be undertaken to assess the operational impact associated with
providing 2 exit lanes on Fitzroy Street at Canterbury Road as well as providing a shared through and left
movement form Fitzroy street westbound approach. Tram delay decreased from existing conditions in all options
due to reduced boarding/alighting delay associated with the removal of tram stops.
8.2 Network Fit Assessment
The results of the preliminary Level 1 NFA assessment are provided in Section 5.0. The assessment has resulted
in an overall positive impact for all options for trams and pedestrians. Specifically, Option 2 provides improved
pedestrian connection in both directions across Fitzroy Street. The proposed mid-block tram stop and pedestrian
crossing will be positioned within the pedestrian priority area defined on the SmartRoads Network Operating plan
shown in Figure 15. The benefit provided for pedestrians at this location under Option 2 translates to an overall
positive rating for pedestrian for this scheme.
When all transport modes are considered the NFA tool indicates a moderate alignment with the RUH all options.
Although a positive rating is achieved for trams and pedestrians, the deterioration in general traffic performance
across the network influences the overall result.
8.3 Crash Analysis
Crash data for a five year period from January 2007 to December 2011 was assessed. The data showed a high
proportion crashes involved pedestrians and cyclists which is representative of the pedestrian activity within the
precinct. Only one third of crashes resulted in serious injuries and no fatal crashes occurred. Yearly crash totals
remain consistently low across the five year period.
8.4 Swept Path Analysis
A Swept path analysis was completed for light vehicles entering and exiting St Kilda Park Primary School access
point. The figure presented in Section 7.0 shows that the movements can be successfully completed within the
specified allocation.
8.5 Recommendations
It is recommended additional modelling be undertaken to assess the operational impact of providing a shared
through and left lane on the east approach to Fitzroy Street / Canterbury Road / Grey Street. This additional
scenario would include 2 exit lanes on Fitzroy Street westbound.
AECOM
Tram Stop 133
Fitzroy Street Traffic Impact Assessment
D R A F T
P:\60248376\4. Tech work area\4.1 Traffic\Traffic\FitzroyStreet_Stop_133\Report\Draft Fitzroy Street Stop 133 Draft Traffic Impact Assessment RevC.docx Revision C – 13-Sep-2013 Prepared for – Yarra Trams – ABN: 42 138 066 074
23
A level 2 NFA should be undertaken and an NFA workshop held with representation from VicRoads and the
various stakeholders. Level of Service, extracted from the microsimulation modelling would be used to inform this
process.
Improved performance may be achieved for general traffic with revised signal operation. Signals could be
optimised and coordinated at both intersections to increase throughput and minimise delay. Additional modelling
could be undertaken using TRANSYT or similar signalised optimisation software to generate optimal green times
across the model period.
AECOM
Tram Stop 133
Fitzroy Street Traffic Impact Assessment
D R A F T
P:\60248376\4. Tech work area\4.1 Traffic\Traffic\FitzroyStreet_Stop_133\Report\Draft Fitzroy Street Stop 133 Draft Traffic Impact Assessment RevC.docx Revision C – 13-Sep-2013 Prepared for – Yarra Trams – ABN: 42 138 066 074
Appendix A
Fitzroy Street Crash Statistics (01/01/2007-30/12/2011)
AECOM
Tram Stop 133
Fitzroy Street Traffic Impact Assessment
D R A F T
P:\60248376\4. Tech work area\4.1 Traffic\Traffic\FitzroyStreet_Stop_133\Report\Draft Fitzroy Street Stop 133 Draft Traffic Impact Assessment RevC.docx Revision C – 13-Sep-2013 Prepared for – Yarra Trams – ABN: 42 138 066 074
a-1
Appendix A VicRoads Crash Statistics
Cra
sh
#
Vic
Ro
ad
s c
ras
h
ref.
Date
Tim
e
Se
ve
rity
Tra
ffic
co
ntr
ol
Sp
ee
d z
on
e
Lig
ht
Ro
ad
Atm
os
ph
ere
To
tal
ve
hic
les
Kil
led
Se
rio
us
in
jury
Oth
er
inju
ry
No
t in
jure
d
DCA Sub DCA
Sub
DCA
Code
Location
1 T2
01
00
03
85
64
7/0
5/2
01
0
8:0
0
Oth
er
Inju
ry
Unkn
ow
n
60
km
/hr
Day
Dry
Clear 2 0 0 1 1
163 Vehicle
strikes door of
parked/stationary
vehicle Not required
Not
required
On Canterbury Road btw
West Beach Road &
Fitzroy Street (29 m SE
of West Beach)
2 T2
00
80
04
47
64
4/1
2/2
00
8
15
:30
Oth
er
Inju
ry
No c
ontr
ol
60
km
/hr
Day
Dry
Clear 2 0 0 1 1
143 Entering
parking
Kerb parking
parallel R02
On Canterbury Road btw
West Beach Road &
Fitzroy Street (37 m W of
Fitzroy)
3 T2
01
10
03
75
91
13
/11
/20
11
15
:15
Oth
er
Inju
ry
No c
ontr
ol
60
km
/hr
Day
Dry
Clear 1 0 0 1 1
102 Far side. ped
hit by vehicle
from the left
Pedestrian
stepped off
median strip C01
On Fitzroy Street btw
Canterbury Road &
Balluk Willam Court (42
m NE of Canterbury)
4 T2
00
80
04
83
09
29
/12
/20
08
7:1
0
Oth
er
Inju
ry
No c
ontr
ol
60
km
/hr
Day
Dry
Clear 2 0 0 1 1
163 Vehicle
strikes door of
parked/stationary
vehicle Not required
Not
required
On Fitzroy Street btw
Canterbury Road &
Balluk Willam Court (26
m NE of Canterbury)
5 T2
01
00
03
80
94
21
/09
/20
10
19
:35
Se
rio
us
inju
ry
No c
ontr
ol
40
km
/hr
Dark
,
str
ee
t
ligh
ts o
n
Dry
Clear 1 0 1 0 0
171 Left off
carriageway into
object/parked
vehicle
Kerb (roadside),
Hit Poles
(telephone/
electricity) V02,Q01
Canterbury Road &
Fitzroy Street
AECOM
Tram Stop 133
Fitzroy Street Traffic Impact Assessment
D R A F T
P:\60248376\4. Tech work area\4.1 Traffic\Traffic\FitzroyStreet_Stop_133\Report\Draft Fitzroy Street Stop 133 Draft Traffic Impact Assessment RevC.docx Revision C – 13-Sep-2013 Prepared for – Yarra Trams – ABN: 42 138 066 074
a-2
Cra
sh
#
Vic
Ro
ad
s c
ras
h
ref.
Date
Tim
e
Se
ve
rity
Tra
ffic
co
ntr
ol
Sp
ee
d z
on
e
Lig
ht
Ro
ad
Atm
os
ph
ere
To
tal
ve
hic
les
Kil
led
Se
rio
us
in
jury
Oth
er
inju
ry
No
t in
jure
d
DCA Sub DCA
Sub
DCA
Code
Location
6 T2
01
10
00
30
12
24
/01
/20
11
18
:10
Oth
er
Inju
ry
Sto
p g
o
ligh
ts
40
km
/hr
Day
Dry
Clear 2 0 0 1 1 122 Left through Not required
Not
required
Canterbury Road &
Fitzroy Street
7 T2
01
00
04
77
94
28
/11
/20
10
2:3
0
Se
rio
us
inju
ry
Sto
p g
o
ligh
ts
40
km
/hr
Dark
,
str
ee
t
ligh
ts o
n
We
t
Raini
ng 1 0 2 0 3
102 Far side. ped
hit by vehicle
from the left
Vehicle leaving
intersection,
Vehicle turning
right A02,B02
Canterbury Road &
Fitzroy Street
8 T2
00
90
00
89
37
13
/03
/20
09
3:5
7
Oth
er
Inju
ry
Sto
p g
o
ligh
ts
50
km
/hr
Dark
,
str
ee
t
ligh
ts o
n
Dry
Clear 1 0 0 1 1
100 Ped near
side. ped hit by
vehicle from the
right
Vehicle entering
intersection,
Vehicle going
straight through A01,B01
Canterbury Road &
Fitzroy Street
9 T2
00
80
04
13
11
1/1
0/2
00
8
22
:55
Oth
er
Inju
ry
Sto
p g
o
ligh
ts
70
km
/hr
Dark
,
str
ee
t
ligh
ts o
n
Dry
Not
know
n 2 0 0 1 1
130 Rear end
(vehicles in same
lane)
Vehicle entering
intersection A01,N01
Canterbury Road &
Fitzroy Street
10 T2
00
80
03
96
80
17
/10
/20
08
18
:15
Se
rio
us
inju
ry
Sto
p g
o
ligh
ts
60
km
/hr
Day
Dry
Not
know
n 1 0 1 0 0
179 Other
accidents off
straight Not required
Not
required
Canterbury Road &
Fitzroy Street
AECOM
Tram Stop 133
Fitzroy Street Traffic Impact Assessment
D R A F T
P:\60248376\4. Tech work area\4.1 Traffic\Traffic\FitzroyStreet_Stop_133\Report\Draft Fitzroy Street Stop 133 Draft Traffic Impact Assessment RevC.docx Revision C – 13-Sep-2013 Prepared for – Yarra Trams – ABN: 42 138 066 074
a-3
Cra
sh
#
Vic
Ro
ad
s c
ras
h
ref.
Date
Tim
e
Se
ve
rity
Tra
ffic
co
ntr
ol
Sp
ee
d z
on
e
Lig
ht
Ro
ad
Atm
os
ph
ere
To
tal
ve
hic
les
Kil
led
Se
rio
us
in
jury
Oth
er
inju
ry
No
t in
jure
d
DCA Sub DCA
Sub
DCA
Code
Location
11 T2
01
00
04
59
22
16
/11
/20
10
2:3
5
Oth
er
Inju
ry
Sto
p g
o
ligh
ts
60
km
/hr
Dark
,
str
ee
t
ligh
ts o
n
Dry
Clear 1 0 0 1 1
109 Any other
manoeuvre
involving ped Not required
Not
required
Canterbury Road &
Fitzroy Street
12 T2
00
70
03
20
98
3/0
9/2
00
7
19
:43
Se
rio
us
inju
ry
Sto
p g
o
ligh
ts
40
km
/hr
Dark
,
str
ee
t
ligh
ts o
n
Dry
Clear 2 0 1 0 1
121 Right
through Not required
Not
required
Canterbury Road &
Fitzroy Street
13 T2
00
70
01
65
67
8/0
5/2
00
7
14
:43
Se
rio
us
inju
ry
Sto
p g
o
ligh
ts
40
km
/hr
Day
Dry
Clear 1 0 1 0 1
100 Ped near
side. ped hit by
vehicle from the
right
Vehicle entering
intersection,
Vehicle going
straight through A01,B01
Canterbury Road &
Fitzroy Street
14 T2
00
70
00
23
04
21
/01
/20
07
2:5
5
Oth
er
Inju
ry
Sto
p g
o
ligh
ts
60
km
/hr
Dark
,
str
ee
t
ligh
ts o
n
We
t
Raini
ng 1 0 0 1 3
100 Ped near
side. ped hit by
vehicle from the
right Not required
Not
required
Canterbury Road &
Fitzroy Street
15 T2
00
90
02
93
40
30
/07
/20
09
20
:15
Oth
er
Inju
ry
Sto
p g
o
ligh
ts
60
km
/hr
Dark
,
str
ee
t
ligh
ts o
n
We
t
Raini
ng 1 0 0 1 1
100 Ped near
side. ped hit by
vehicle from the
right
Vehicle leaving
intersection,
Vehicle turning
right A02,B02
Canterbury Road &
Fitzroy Street
AECOM
Tram Stop 133
Fitzroy Street Traffic Impact Assessment
D R A F T
P:\60248376\4. Tech work area\4.1 Traffic\Traffic\FitzroyStreet_Stop_133\Report\Draft Fitzroy Street Stop 133 Draft Traffic Impact Assessment RevC.docx Revision C – 13-Sep-2013 Prepared for – Yarra Trams – ABN: 42 138 066 074
a-4
Cra
sh
#
Vic
Ro
ad
s c
ras
h
ref.
Date
Tim
e
Se
ve
rity
Tra
ffic
co
ntr
ol
Sp
ee
d z
on
e
Lig
ht
Ro
ad
Atm
os
ph
ere
To
tal
ve
hic
les
Kil
led
Se
rio
us
in
jury
Oth
er
inju
ry
No
t in
jure
d
DCA Sub DCA
Sub
DCA
Code
Location
16 T2
00
80
04
68
64
15
/12
/20
08
8:3
0
Oth
er
Inju
ry
Sto
p g
o
ligh
ts
60
km
/hr
Day
Dry
Clear 3 0 0 1 2
130 Rear end
(vehicles in same
lane)
Intersection,
vehicles within
intersection N01,A03
Canterbury Road &
Fitzroy Street
17 T2
00
70
01
16
39
23
/03
/20
07
21
:05
Oth
er
Inju
ry
Pe
de
str
ian
cro
ssin
g
60
km
/hr
Dark
,
str
ee
t
ligh
ts
Unkn
ow
n
Unkn
own 2 0 0 1 2
130 Rear end
(vehicles in same
lane)
Intersection,
vehicle entering
intersection N01,A01
On Balluk Willam Court
btw & Fitzroy Street (43
m NW of Fitzroy)
18 T2
00
80
00
93
94
14
/03
/20
08
22
:50
Oth
er
Inju
ry
No c
ontr
ol
50
km
/hr
Dark
,
str
ee
t
ligh
ts o
n
Dry
Clear 1 0 0 1 0
173 Right off
carriageway into
object/parked
vehicle
Kerb (roadside),
hit Fences
(including gates) V02,Q03
On Fitzroy Street btw
Loch Street & Canterbury
Road (19 m SW of
Canterbury)
19 T2
01
00
03
35
86
20
/08
/20
10
20
:55
Se
rio
us
inju
ry
Fla
sh
ing
ligh
ts
60
km
/hr
Dark
,
str
ee
t
ligh
ts o
n
Dry
Clear 1 0 1 0 0
174 Out of
control on
carriageway (on
straight) Not required
Not
required
On Lakeside Drive btw
Village Green Drive &
Fitzroy Street (51 m NW
of Fitzroy)
20 T2
00
80
00
98
54
18
/03
/20
08
9:2
0
Se
rio
us
inju
ry
No c
ontr
ol
50
km
/hr
Day
Dry
Clear 1 0 1 0 0
174 Out of
control on
carriageway (on
straight) Not required
Not
required
On Fitzroy Street btw
Unnamed & Lakeside
Drive (27 m SW of
Lakeside)

AECOM
Tram Stop 133
Fitzroy Street Traffic Impact Assessment
D R A F T
P:\60248376\4. Tech work area\4.1 Traffic\Traffic\FitzroyStreet_Stop_133\Report\Draft Fitzroy Street Stop 133 Draft Traffic Impact Assessment RevC.docx Revision C – 13-Sep-2013 Prepared for – Yarra Trams – ABN: 42 138 066 074
a-5
Cra
sh
#
Vic
Ro
ad
s c
ras
h
ref.
Date
Tim
e
Se
ve
rity
Tra
ffic
co
ntr
ol
Sp
ee
d z
on
e
Lig
ht
Ro
ad
Atm
os
ph
ere
To
tal
ve
hic
les
Kil
led
Se
rio
us
in
jury
Oth
er
inju
ry
No
t in
jure
d
DCA Sub DCA
Sub
DCA
Code
Location
21 T2
00
80
01
66
08
7/0
5/2
00
8
22
:20
Se
rio
us
inju
ry
No c
ontr
ol
60
km
/hr
Dark
,
str
ee
t
ligh
ts o
n
Dry
Clear 1 0 1 0 1
100 Ped near
side. ped hit by
vehicle from the
right Not required
Not
required
On Fitzroy Street btw
Unnamed & Lakeside
Drive (64 m NE of
Unnamed)
22 T2
00
70
02
49
01
8/0
7/2
00
7
15
:00
Oth
er
Inju
ry
No c
ontr
ol
60
km
/hr
Day
We
t
Raini
ng 2 0 0 2 1
130 Rear end
(vehicles in same
lane) Mid block N02
On Fitzroy Street btw
Unnamed & Lakeside
Drive (63 m NE of
Unnamed)
23 T2
00
70
03
62
83
7/1
0/2
00
7
15
:00
Oth
er
Inju
ry
No c
ontr
ol
60
km
/hr
Day
Dry
Clear 2 0 0 1 1
135 Lane change
left (not
overtaking) Not required
Not
required
On Fitzroy Street btw
Unnamed & Lakeside
Drive (33 m NE of
Unnamed)
24 T2
00
70
04
19
52
18
/11
/20
07
7:4
0
Oth
er
inju
ry
No c
ontr
ol
50
km
/hr
Day
We
t
Raini
ng 2 0 0 1 3 140 U turn
Hit by veh from
same dir as
initial dir of U
turn P01
On Fitzroy Street btw
Balluk Willam Court &
Unnamed (33 m SW of
Unnamed)
25 T2
01
00
03
62
99
8/0
9/2
01
0
14
:00
Oth
er
inju
ry
No c
ontr
ol
40
km
/hr
Day
Dry
Clear 1 0 0 1 0
174 Out of
control on
carriageway (on
straight)
No vehicle
mounted/struck V01
On Fitzroy Street btw
Balluk Willam Court &
Unnamed (15 m NE of
Balluk Willam)

AECOM
Tram Stop 133
Fitzroy Street Traffic Impact Assessment
D R A F T
P:\60248376\4. Tech work area\4.1 Traffic\Traffic\FitzroyStreet_Stop_133\Report\Draft Fitzroy Street Stop 133 Draft Traffic Impact Assessment RevC.docx Revision C – 13-Sep-2013 Prepared for – Yarra Trams – ABN: 42 138 066 074
a-6
Cra
sh
#
Vic
Ro
ad
s c
ras
h
ref.
Date
Tim
e
Se
ve
rity
Tra
ffic
co
ntr
ol
Sp
ee
d z
on
e
Lig
ht
Ro
ad
Atm
os
ph
ere
To
tal
ve
hic
les
Kil
led
Se
rio
us
in
jury
Oth
er
inju
ry
No
t in
jure
d
DCA Sub DCA
Sub
DCA
Code
Location
26 T2
00
70
01
53
49
29
/04
/20
07
7:3
6
Oth
er
Inju
ry
Sto
p g
o
ligh
ts
50
km
/hr
Day
We
t
Dust,
Fog,
Rain 2 0 0 1 1 140 U turn
Hit by veh from
same dir as
initial dir of U
turn P01
On Fitzroy Street btw
Lakeside Drive & Punt
Road (52 m NE of
Lakeside)
27 T2
00
70
02
68
23
23
/07
/20
07
12
:40
Se
rio
us
inju
ry
No c
ontr
ol
60
km
/hr
Day
Dry
Clear 2 0 1 0 1
130 Rear end
(vehicles in same
lane) Mid block N02
On Fitzroy Street btw
Lakeside Drive & Punt
Road (53 m NE of
Lakeside)
28 T2
00
90
02
19
54
10
/06
/20
09
8:2
3
Se
rio
us
inju
ry
No c
ontr
ol
50
km
/hr
Day
We
t
Raini
ng 2 0 1 0 1 140 U turn
Hit by veh from
same dir as
initial dir of U
turn P01
On Fitzroy Street btw
Lakeside Drive & Punt
Road (53 m NE of
Lakeside)
29 T2
01
00
00
58
07
15
/02
/20
10
0:3
0
Oth
er
Inju
ry
No c
ontr
ol
50
km
/hr
Dark
,
str
ee
t
ligh
ts o
n
Unkn
ow
n
Unkn
own 1 0 0 1 1
100 Ped near
side. ped hit by
vehicle from the
right Not required
Not
required
On Fitzroy Street btw
Lakeside Drive & Punt
Road (17 m NE of
Lakeside)
30 T2
00
70
00
92
87
15
/03
/20
07
9:1
5
Se
rio
us
inju
ry
No c
ontr
ol
50
km
/hr
Day
Dry
Clear 2 0 1 1 2
163 Vehicle
strikes door of
parked/stationary
vehicle Not required
Not
required
On Fitzroy Street &
Lakeside Drive
AECOM
Tram Stop 133
Fitzroy Street Traffic Impact Assessment
D R A F T
P:\60248376\4. Tech work area\4.1 Traffic\Traffic\FitzroyStreet_Stop_133\Report\Draft Fitzroy Street Stop 133 Draft Traffic Impact Assessment RevC.docx Revision C – 13-Sep-2013 Prepared for – Yarra Trams – ABN: 42 138 066 074
a-7
Cra
sh
#
Vic
Ro
ad
s c
ras
h
ref.
Date
Tim
e
Se
ve
rity
Tra
ffic
co
ntr
ol
Sp
ee
d z
on
e
Lig
ht
Ro
ad
Atm
os
ph
ere
To
tal
ve
hic
les
Kil
led
Se
rio
us
in
jury
Oth
er
inju
ry
No
t in
jure
d
DCA Sub DCA
Sub
DCA
Code
Location
31 T2
01
00
02
70
63
10
/07
/20
10
2:1
1
Oth
er
Inju
ry
No c
ontr
ol
60
km
/hr
Dark
,
str
ee
t
ligh
ts o
n
Dry
Clear 1 0 0 1 1
106 Veh strikes
ped on
footpath,median,t
raffic island
Vehicle moving
foward out of
control G02
On Fitzroy Street &
Lakeside Drive
32 T2
00
80
01
16
37
6/0
2/2
00
8
17
:00
Oth
er
Inju
ry
Sto
p g
o
ligh
ts
60
km
/hr
Day
We
t
Raini
ng 2 0 0 1 1
130 Rear end
(vehicles in same
lane)
Intersection,
Vehicle entering
intersection N01,A01
On Fitzroy Street &
Lakeside Drive
33 T2
01
10
02
29
18
7/0
6/2
01
1
6:2
0
Oth
er
Inju
ry
Sto
p g
o
ligh
ts
40
km
/hr
Dark
,
str
ee
t
ligh
ts o
n
Dry
Clear 1 0 0 1 1
Dark, street lights
on DCA/Accident Dry Clear
On Fitzroy Street &
Lakeside Drive
34 T2
01
00
03
97
24
5/1
0/2
01
0
9:0
0
Oth
er
Inju
ry
No c
ontr
ol
60
km
/hr
Day
Dry
Clear 1 0 0 1 2
100 Ped near
side. ped hit by
vehicle from the
right
Vehicle entering
intersection,
vehicle going
straight through A01,B01
On Fitzroy Street &
Lakeside Drive
35 T2
00
80
03
93
83
25
/10
/20
08
8:1
5
Oth
er
Inju
ry
No c
ontr
ol
50
km
/hr
Day
Dry
Clear 2 0 0 2 0
121 Right
through Not required
Not
required
On Fitzroy Street &
Lakeside Drive
AECOM
Tram Stop 133
Fitzroy Street Traffic Impact Assessment
D R A F T
P:\60248376\4. Tech work area\4.1 Traffic\Traffic\FitzroyStreet_Stop_133\Report\Draft Fitzroy Street Stop 133 Draft Traffic Impact Assessment RevC.docx Revision C – 13-Sep-2013 Prepared for – Yarra Trams – ABN: 42 138 066 074
a-8
Cra
sh
#
Vic
Ro
ad
s c
ras
h
ref.
Date
Tim
e
Se
ve
rity
Tra
ffic
co
ntr
ol
Sp
ee
d z
on
e
Lig
ht
Ro
ad
Atm
os
ph
ere
To
tal
ve
hic
les
Kil
led
Se
rio
us
in
jury
Oth
er
inju
ry
No
t in
jure
d
DCA Sub DCA
Sub
DCA
Code
Location
36 T2
00
80
02
27
04
22
/06
/20
08
3:1
5
Se
rio
us
inju
ry
Sto
p g
o
ligh
ts
60
km
/hr
Dark
,
str
ee
t
ligh
ts o
n
We
t
Raini
ng 1 0 1 0 1
100 Ped near
side. ped hit by
vehicle from the
right
Vehicle leaving
intersection,
vehicle going
straight through A02,B01
On Fitzroy Street &
Lakeside Drive
37 T2
00
70
01
72
61
14
/05
/20
07
6:4
0
Se
rio
us
inju
ry
Sto
p g
o
ligh
ts
50
km
/hr
Dark
,
str
ee
t
ligh
ts o
n
Dry
Fog 2 0 1 0 1
121 Right
through Not required
Not
required
On Fitzroy Street &
Lakeside Drive
38 T2
00
80
00
00
10
31
/12
/20
07
23
:23
Se
rio
us
inju
ry
Sto
p g
o
ligh
ts
50
km
/hr
Dark
,
str
ee
t
ligh
ts o
n
Dry
Clear 1 0 1 0 2
100 Ped near
side. ped hit by
vehicle from the
right
Vehicle leaving
intersection,
vehicle going
straight through A02,B01
On Fitzroy Street &
Lakeside Drive
39 T2
00
70
01
48
45
25
/04
/20
07
7:0
0
Oth
er
Inju
ry
Unkn
ow
n
50
km
/hr
Dusk/d
aw
n
Unkn
ow
n
Unkn
own 1 0 0 1 0
149 Other
manoeuvring Not required
Not
required
On Fitzroy Street &
Lakeside Drive
40 T2
01
00
02
34
02
13
/06
/20
10
6:3
0
Oth
er
Inju
ry
Unkn
ow
n
50
km
/hr
Dark
,
str
ee
t
ligh
ts o
n
Unkn
ow
n
Clear 1 0 0 1 1
100 Ped near
side. ped hit by
vehicle from the
right
Vehicle leaving
intersection,
vehicle going
straight through A02,B01
On Fitzroy Street &
Lakeside Drive

AECOM
Tram Stop 133
Fitzroy Street Traffic Impact Assessment
D R A F T
P:\60248376\4. Tech work area\4.1 Traffic\Traffic\FitzroyStreet_Stop_133\Report\Draft Fitzroy Street Stop 133 Draft Traffic Impact Assessment RevC.docx Revision C – 13-Sep-2013 Prepared for – Yarra Trams – ABN: 42 138 066 074
a-9
Cra
sh
#
Vic
Ro
ad
s c
ras
h
ref.
Date
Tim
e
Se
ve
rity
Tra
ffic
co
ntr
ol
Sp
ee
d z
on
e
Lig
ht
Ro
ad
Atm
os
ph
ere
To
tal
ve
hic
les
Kil
led
Se
rio
us
in
jury
Oth
er
inju
ry
No
t in
jure
d
DCA Sub DCA
Sub
DCA
Code
Location
41 T2
00
90
02
15
37
7/0
6/2
00
9
11
:49
Oth
er
Inju
ry
Sto
p g
o
ligh
ts
60
km
/hr
Day
Dry
Clear 2 0 0 2 2
121 Right
through Not required
Not
required
On Fitzroy Street &
Lakeside Drive
42 T2
00
90
02
27
09
15
/06
/20
09
16
:15
Oth
er
Inju
ry
Sto
p g
o
ligh
ts
60
km
/hr
Day
Dry
Clear 1 0 0 1 1
109 Any other
manoeuvre
involving ped Not required
Not
required
AECOM
Tram Stop 133
Fitzroy Street Traffic Impact Assessment
D R A F T
P:\60248376\4. Tech work area\4.1 Traffic\Traffic\FitzroyStreet_Stop_133\Report\Draft Fitzroy Street Stop 133 Draft Traffic Impact Assessment RevC.docx Revision C – 13-Sep-2013 Prepared for – Yarra Trams – ABN: 42 138 066 074
Appendix B
VicRoads Definitions for Classifying Accidents (DCA)
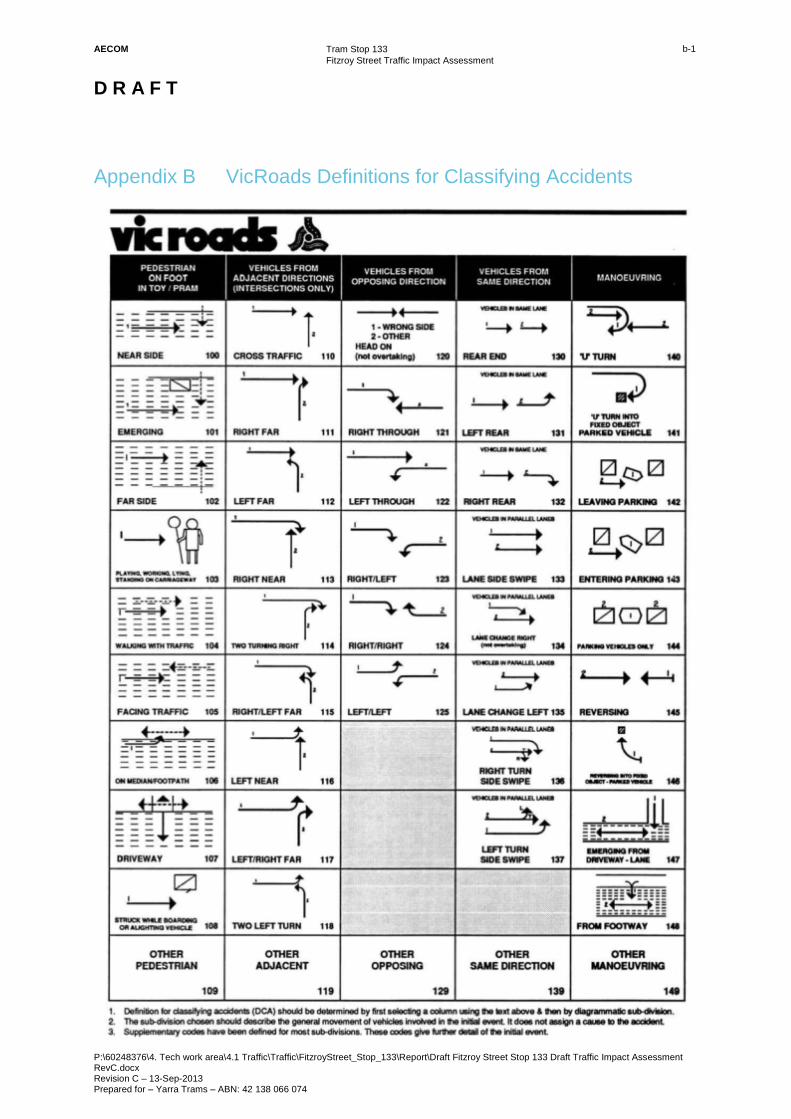
AECOM
Tram Stop 133
Fitzroy Street Traffic Impact Assessment
D R A F T
P:\60248376\4. Tech work area\4.1 Traffic\Traffic\FitzroyStreet_Stop_133\Report\Draft Fitzroy Street Stop 133 Draft Traffic Impact Assessment RevC.docx Revision C – 13-Sep-2013 Prepared for – Yarra Trams – ABN: 42 138 066 074
b-1
Appendix B VicRoads Definitions for Classifying Accidents
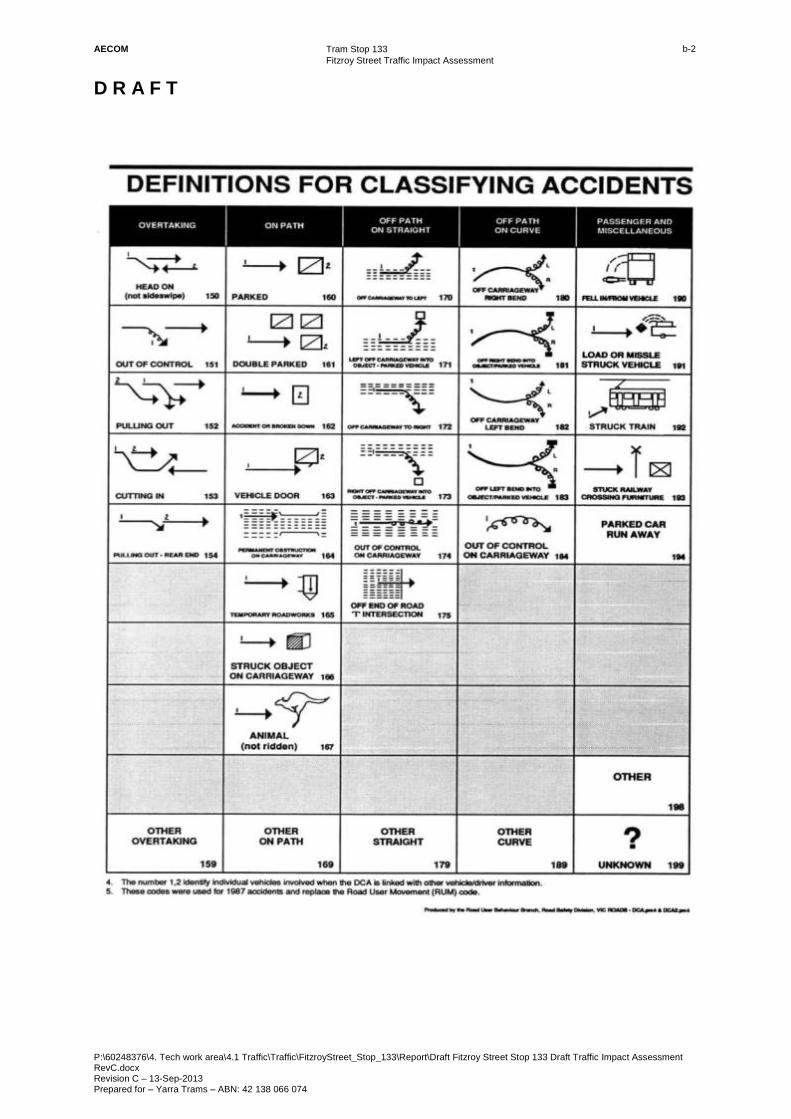
AECOM
Tram Stop 133
Fitzroy Street Traffic Impact Assessment
D R A F T
P:\60248376\4. Tech work area\4.1 Traffic\Traffic\FitzroyStreet_Stop_133\Report\Draft Fitzroy Street Stop 133 Draft Traffic Impact Assessment RevC.docx Revision C – 13-Sep-2013 Prepared for – Yarra Trams – ABN: 42 138 066 074
b-2
AECOM
Tram Stop 133
Fitzroy Street Traffic Impact Assessment
D R A F T
P:\60248376\4. Tech work area\4.1 Traffic\Traffic\FitzroyStreet_Stop_133\Report\Draft Fitzroy Street Stop 133 Draft Traffic Impact Assessment RevC.docx Revision C – 13-Sep-2013 Prepared for – Yarra Trams – ABN: 42 138 066 074
Appendix C
VicRoads Controller Operation Specification Sheets
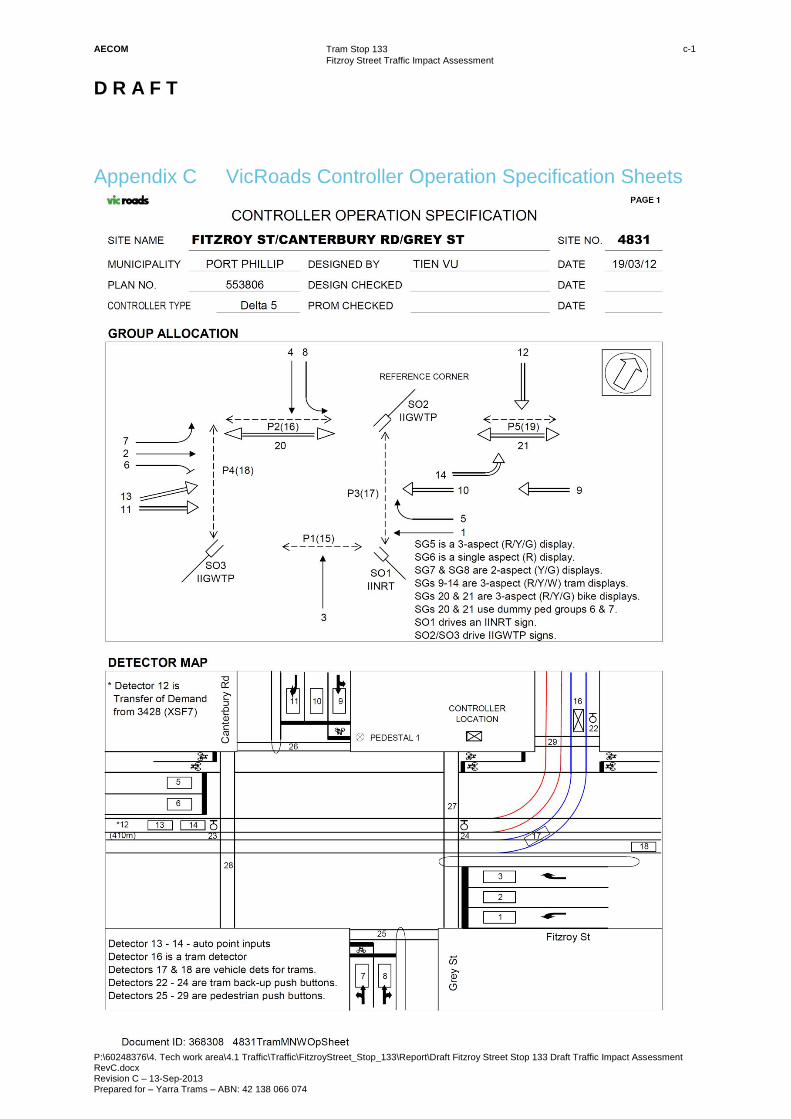
AECOM
Tram Stop 133
Fitzroy Street Traffic Impact Assessment
D R A F T
P:\60248376\4. Tech work area\4.1 Traffic\Traffic\FitzroyStreet_Stop_133\Report\Draft Fitzroy Street Stop 133 Draft Traffic Impact Assessment RevC.docx Revision C – 13-Sep-2013 Prepared for – Yarra Trams – ABN: 42 138 066 074
c-1
Appendix C VicRoads Controller Operation Specification Sheets
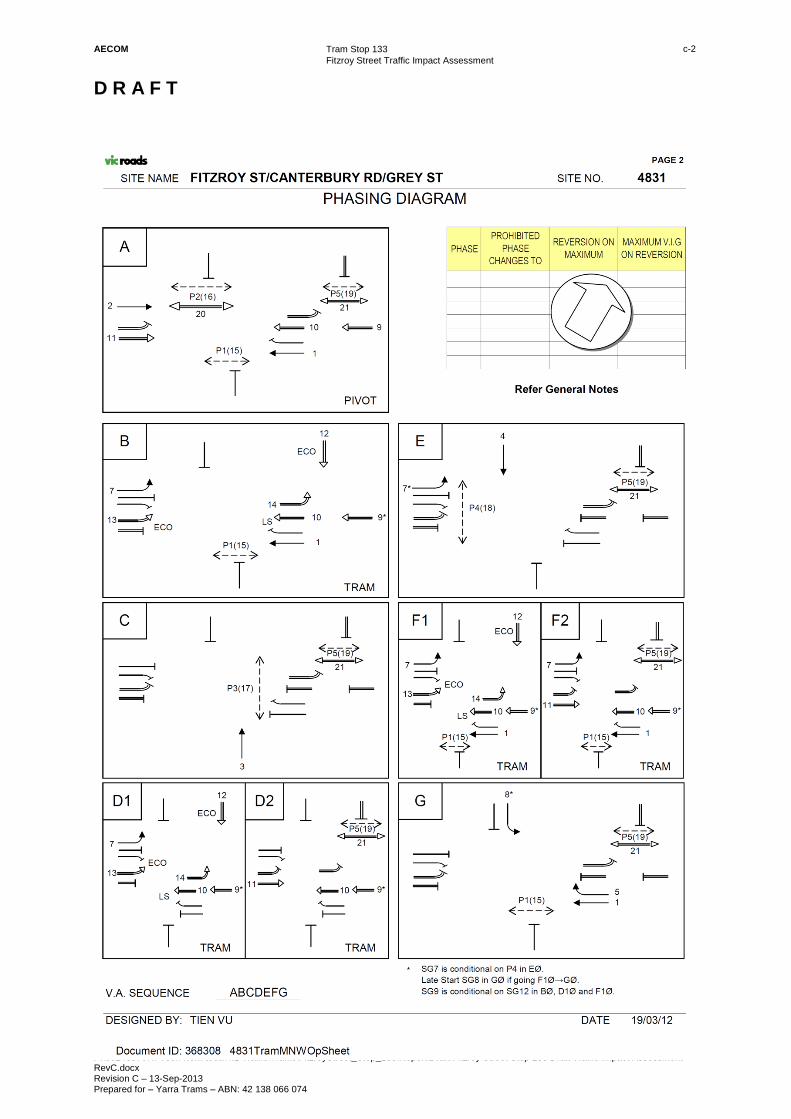
AECOM
Tram Stop 133
Fitzroy Street Traffic Impact Assessment
D R A F T
P:\60248376\4. Tech work area\4.1 Traffic\Traffic\FitzroyStreet_Stop_133\Report\Draft Fitzroy Street Stop 133 Draft Traffic Impact Assessment RevC.docx Revision C – 13-Sep-2013 Prepared for – Yarra Trams – ABN: 42 138 066 074
c-2
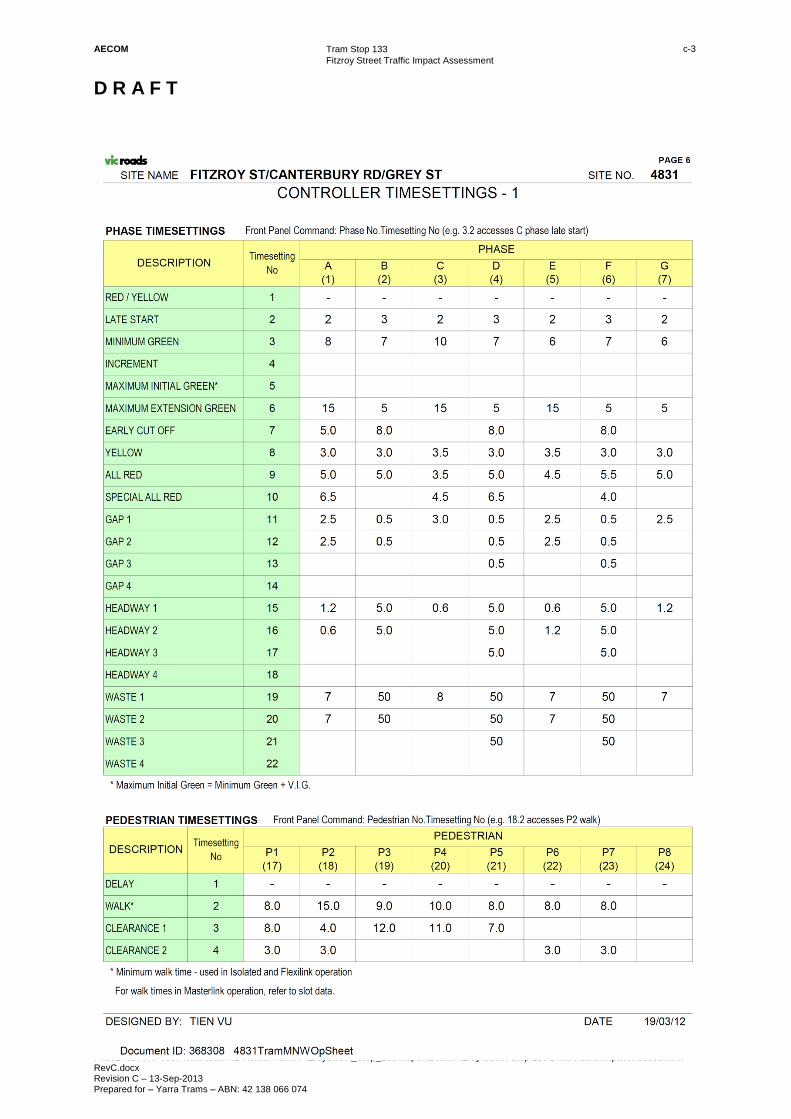
AECOM
Tram Stop 133
Fitzroy Street Traffic Impact Assessment
D R A F T
P:\60248376\4. Tech work area\4.1 Traffic\Traffic\FitzroyStreet_Stop_133\Report\Draft Fitzroy Street Stop 133 Draft Traffic Impact Assessment RevC.docx Revision C – 13-Sep-2013 Prepared for – Yarra Trams – ABN: 42 138 066 074
c-3
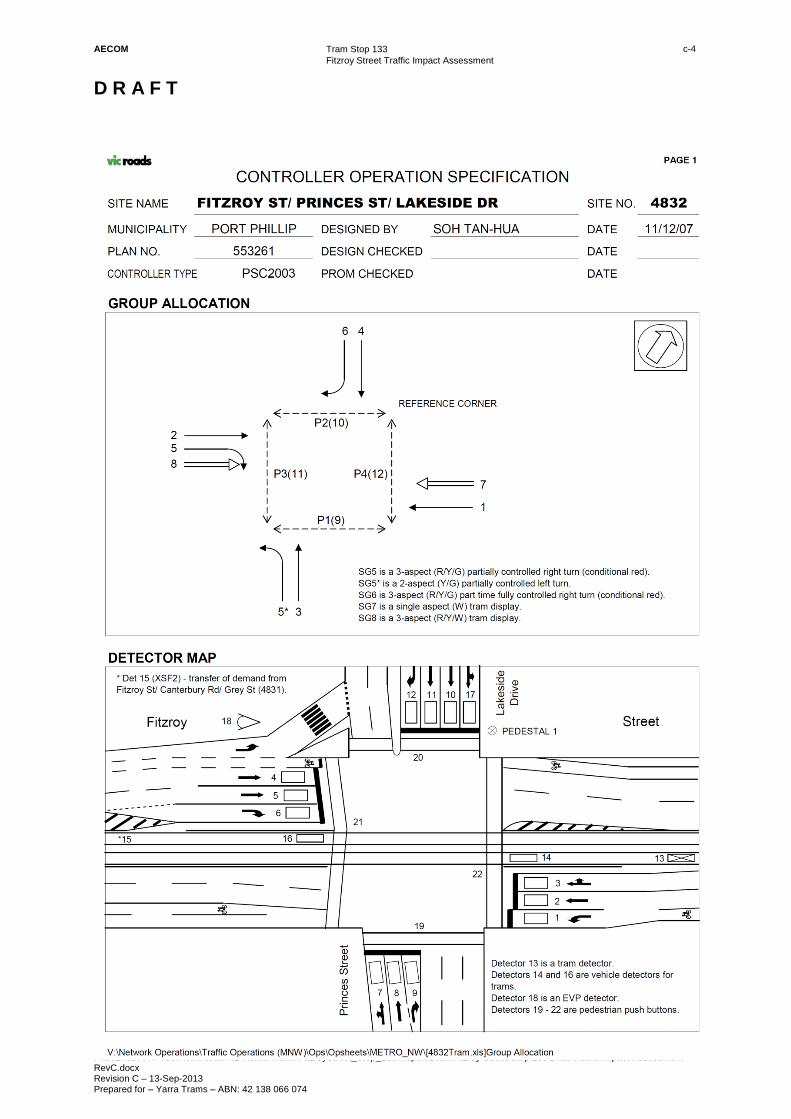
AECOM
Tram Stop 133
Fitzroy Street Traffic Impact Assessment
D R A F T
P:\60248376\4. Tech work area\4.1 Traffic\Traffic\FitzroyStreet_Stop_133\Report\Draft Fitzroy Street Stop 133 Draft Traffic Impact Assessment RevC.docx Revision C – 13-Sep-2013 Prepared for – Yarra Trams – ABN: 42 138 066 074
c-4

AECOM
Tram Stop 133
Fitzroy Street Traffic Impact Assessment
D R A F T
P:\60248376\4. Tech work area\4.1 Traffic\Traffic\FitzroyStreet_Stop_133\Report\Draft Fitzroy Street Stop 133 Draft Traffic Impact Assessment RevC.docx Revision C – 13-Sep-2013 Prepared for – Yarra Trams – ABN: 42 138 066 074
c-5

AECOM
Tram Stop 133
Fitzroy Street Traffic Impact Assessment
D R A F T
P:\60248376\4. Tech work area\4.1 Traffic\Traffic\FitzroyStreet_Stop_133\Report\Draft Fitzroy Street Stop 133 Draft Traffic Impact Assessment RevC.docx Revision C – 13-Sep-2013 Prepared for – Yarra Trams – ABN: 42 138 066 074
c-6

AECOM
Tram Stop 133
Fitzroy Street Traffic Impact Assessment
D R A F T
P:\60248376\4. Tech work area\4.1 Traffic\Traffic\FitzroyStreet_Stop_133\Report\Draft Fitzroy Street Stop 133 Draft Traffic Impact Assessment RevC.docx Revision C – 13-Sep-2013 Prepared for – Yarra Trams – ABN: 42 138 066 074
Appendix D
SmartRoads LOS Definitions for Arterial Roads

AECOM
Tram Stop 133
Fitzroy Street Traffic Impact Assessment
D R A F T
P:\60248376\4. Tech work area\4.1 Traffic\Traffic\FitzroyStreet_Stop_133\Report\Draft Fitzroy Street Stop 133 Draft Traffic Impact Assessment RevC.docx Revision C – 13-Sep-2013 Prepared for – Yarra Trams – ABN: 42 138 066 074
d-1
Appendix D SmartRoads LOS Definitions for Arterial Roads
General Traffic LOS Examples for Arterial Roads
Table 3-6 General Traffic Level of Service for Arterials
A
B Half of the vehicles experience little or no delay. Occurs in co-ordinated signal systems with competing demands for signal time.
C Vehicles generally have to stop but all waiting vehicles clear intersection during 1 signal cycle.
D Vehicles join the back of an existing queue and take 2 signal cycles to clear intersection.
E
Vehicles join the back of an existing queue and take 3 or more signal cycles to clear intersection. Backups from downstream occasionally restricts movement
F Vehicles take 3 or more signal cycles to clear intersection and backups from downstream significantly impact traffic flow.

AECOM
Tram Stop 133
Fitzroy Street Traffic Impact Assessment
D R A F T
P:\60248376\4. Tech work area\4.1 Traffic\Traffic\FitzroyStreet_Stop_133\Report\Draft Fitzroy Street Stop 133 Draft Traffic Impact Assessment RevC.docx Revision C – 13-Sep-2013 Prepared for – Yarra Trams – ABN: 42 138 066 074
Appendix E
Assessed Concept Designs
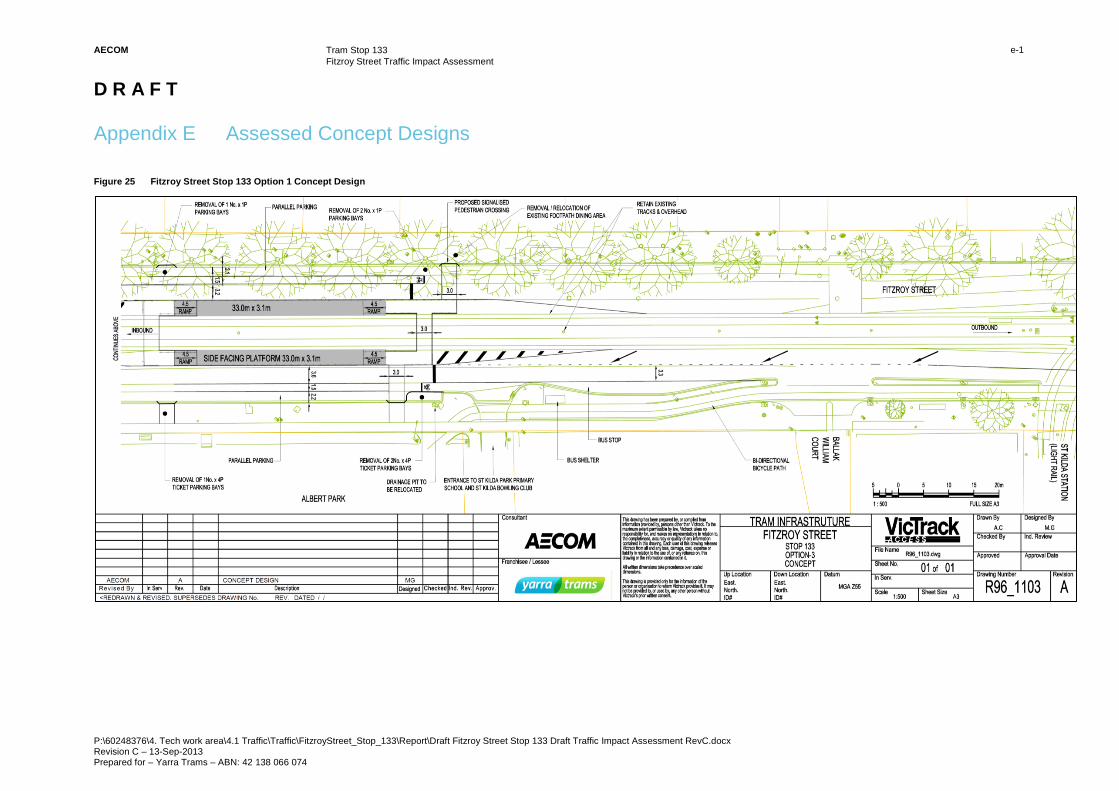
AECOM
Tram Stop 133
Fitzroy Street Traffic Impact Assessment
D R A F T
P:\60248376\4. Tech work area\4.1 Traffic\Traffic\FitzroyStreet_Stop_133\Report\Draft Fitzroy Street Stop 133 Draft Traffic Impact Assessment RevC.docx Revision C – 13-Sep-2013 Prepared for – Yarra Trams – ABN: 42 138 066 074
e-1
Appendix E Assessed Concept Designs
Figure 25 Fitzroy Street Stop 133 Option 1 Concept Design
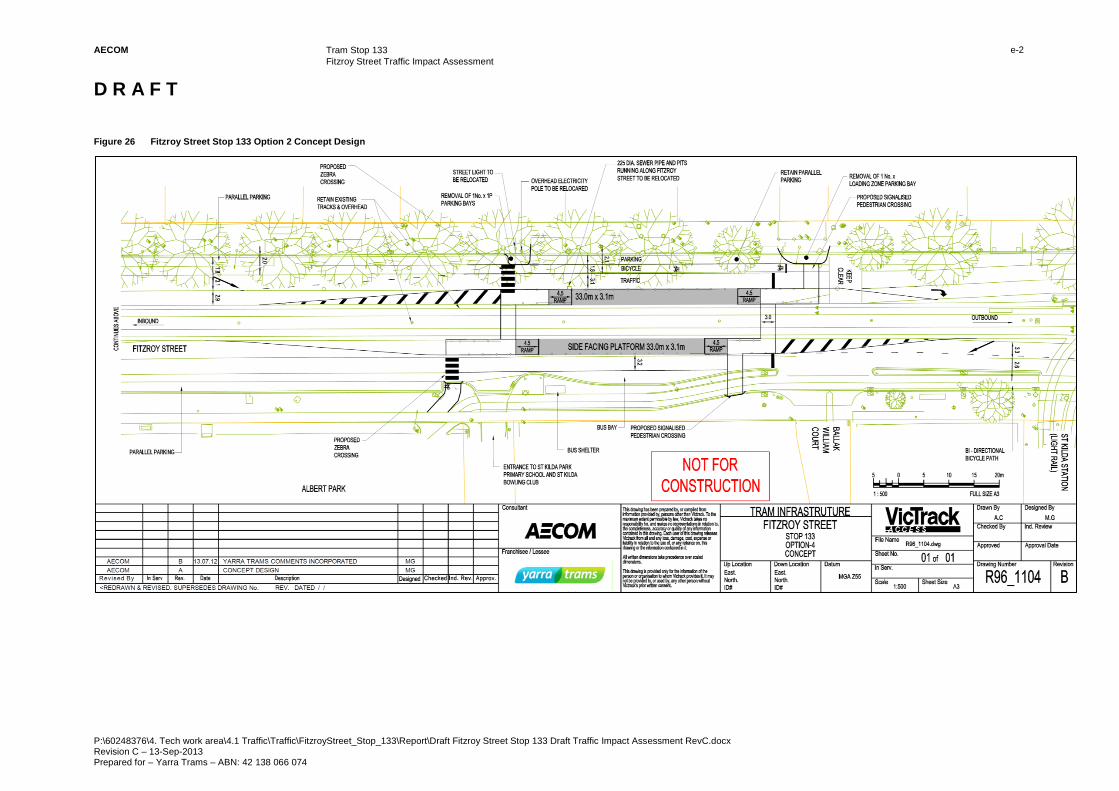
AECOM
Tram Stop 133
Fitzroy Street Traffic Impact Assessment
D R A F T
P:\60248376\4. Tech work area\4.1 Traffic\Traffic\FitzroyStreet_Stop_133\Report\Draft Fitzroy Street Stop 133 Draft Traffic Impact Assessment RevC.docx Revision C – 13-Sep-2013 Prepared for – Yarra Trams – ABN: 42 138 066 074
e-2
Figure 26 Fitzroy Street Stop 133 Option 2 Concept Design

AECOM
Tram Stop 133
Fitzroy Street Traffic Impact Assessment
D R A F T
P:\60248376\4. Tech work area\4.1 Traffic\Traffic\FitzroyStreet_Stop_133\Report\Draft Fitzroy Street Stop 133 Draft Traffic Impact Assessment RevC.docx Revision C – 13-Sep-2013 Prepared for – Yarra Trams – ABN: 42 138 066 074
e-3
Figure 27 Fitzroy Street Stop 133 Option 3 Concept Design
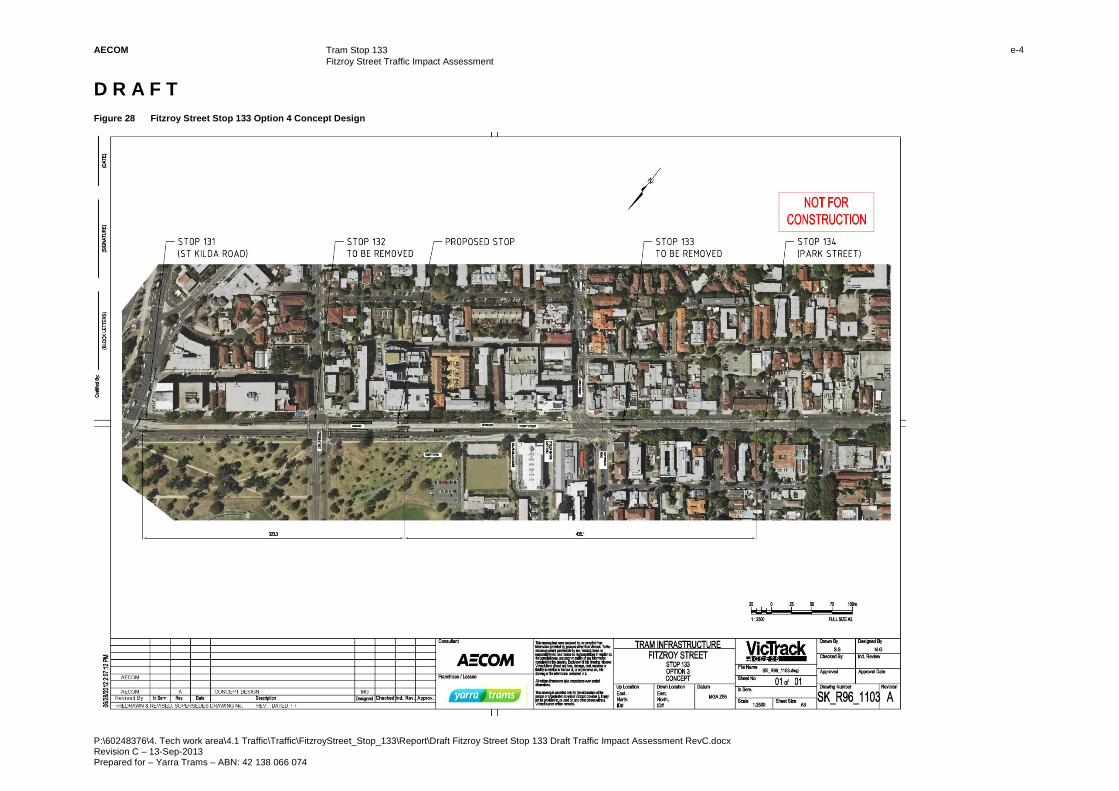
AECOM
Tram Stop 133
Fitzroy Street Traffic Impact Assessment
D R A F T
P:\60248376\4. Tech work area\4.1 Traffic\Traffic\FitzroyStreet_Stop_133\Report\Draft Fitzroy Street Stop 133 Draft Traffic Impact Assessment RevC.docx Revision C – 13-Sep-2013 Prepared for – Yarra Trams – ABN: 42 138 066 074
e-4
Figure 28 Fitzroy Street Stop 133 Option 4 Concept Design

AECOM
Tram Stop 133
Fitzroy Street Traffic Impact Assessment
D R A F T
P:\60248376\4. Tech work area\4.1 Traffic\Traffic\FitzroyStreet_Stop_133\Report\Draft Fitzroy Street Stop 133 Draft Traffic Impact Assessment RevC.docx Revision C – 13-Sep-2013 Prepared for – Yarra Trams – ABN: 42 138 066 074
Appendix F
NFA Approach Results
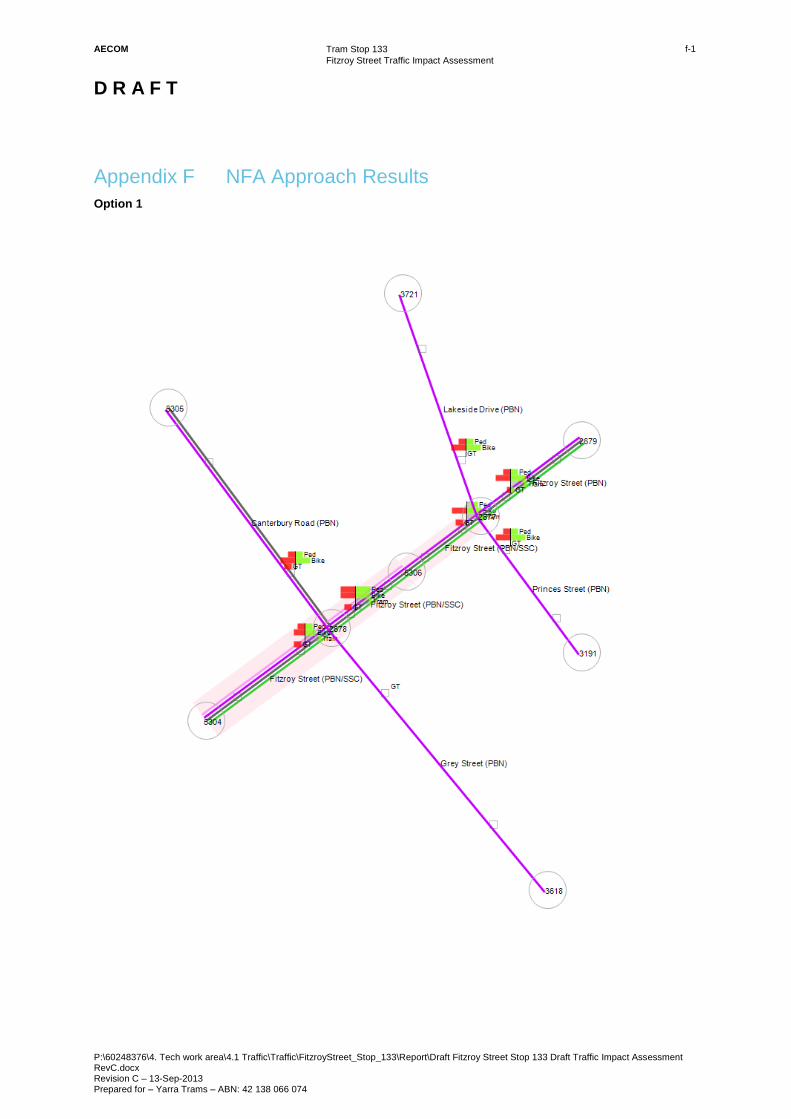
AECOM
Tram Stop 133
Fitzroy Street Traffic Impact Assessment
D R A F T
P:\60248376\4. Tech work area\4.1 Traffic\Traffic\FitzroyStreet_Stop_133\Report\Draft Fitzroy Street Stop 133 Draft Traffic Impact Assessment RevC.docx Revision C – 13-Sep-2013 Prepared for – Yarra Trams – ABN: 42 138 066 074
f-1
Appendix F NFA Approach Results
Option 1
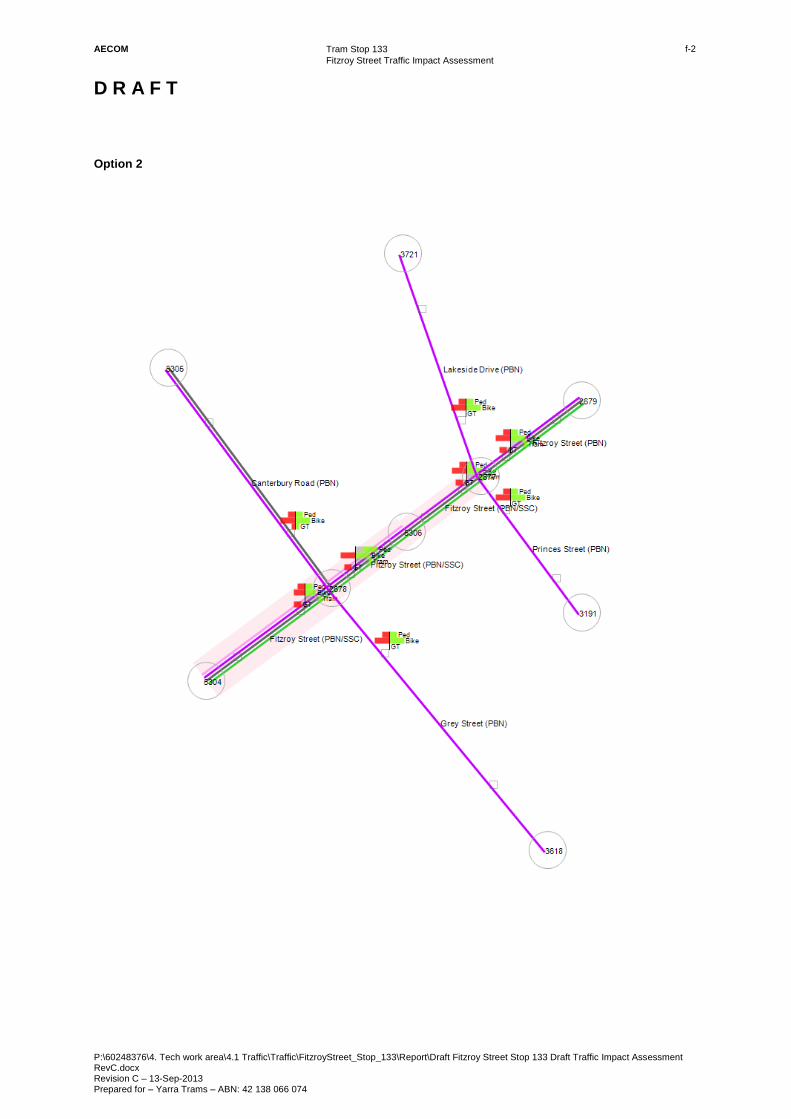
AECOM
Tram Stop 133
Fitzroy Street Traffic Impact Assessment
D R A F T
P:\60248376\4. Tech work area\4.1 Traffic\Traffic\FitzroyStreet_Stop_133\Report\Draft Fitzroy Street Stop 133 Draft Traffic Impact Assessment RevC.docx Revision C – 13-Sep-2013 Prepared for – Yarra Trams – ABN: 42 138 066 074
f-2
Option 2

AECOM
Tram Stop 133
Fitzroy Street Traffic Impact Assessment
D R A F T
P:\60248376\4. Tech work area\4.1 Traffic\Traffic\FitzroyStreet_Stop_133\Report\Draft Fitzroy Street Stop 133 Draft Traffic Impact Assessment RevC.docx Revision C – 13-Sep-2013 Prepared for – Yarra Trams – ABN: 42 138 066 074
f-3
Option 3
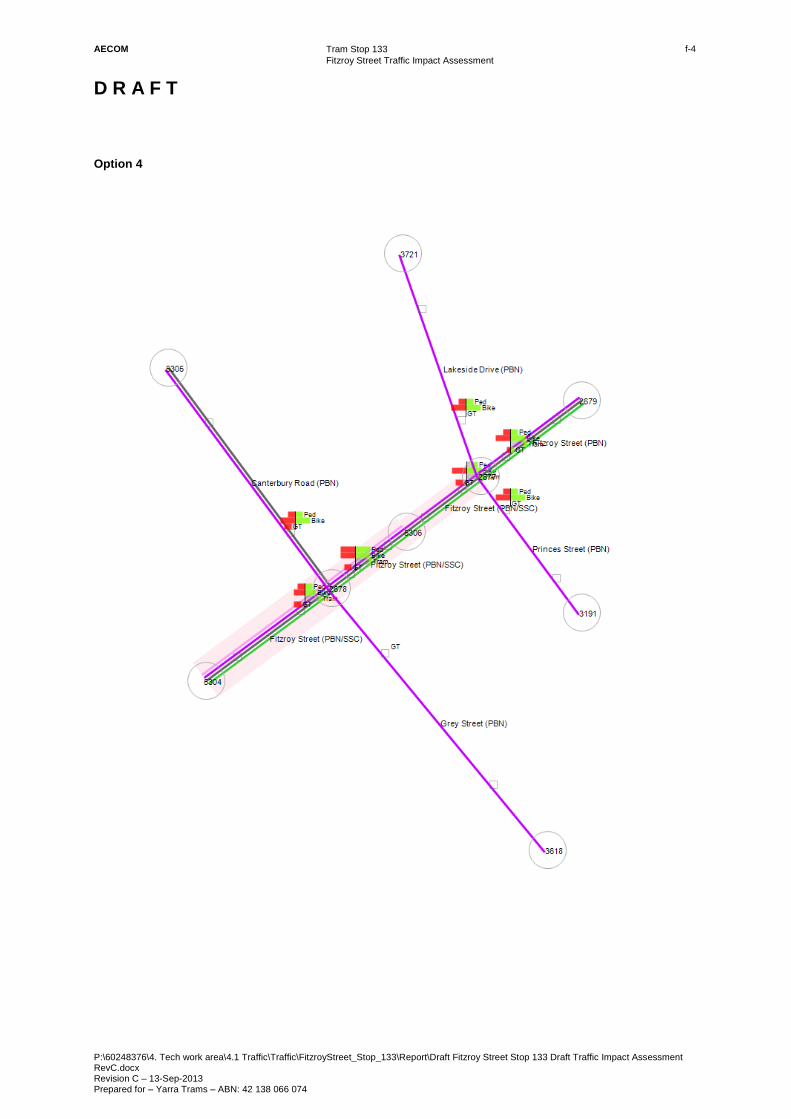
AECOM
Tram Stop 133
Fitzroy Street Traffic Impact Assessment
D R A F T
P:\60248376\4. Tech work area\4.1 Traffic\Traffic\FitzroyStreet_Stop_133\Report\Draft Fitzroy Street Stop 133 Draft Traffic Impact Assessment RevC.docx Revision C – 13-Sep-2013 Prepared for – Yarra Trams – ABN: 42 138 066 074
f-4
Option 4