Embed Size (px)
Citation preview

USE OR DISCLOSURE OF INFORMATION CONTAINED ON THIS SHEET IS SUBJECT TO THE RESTRICTIONS ON THE TITLE SLIDE
THIS DOCUMENT, OR AN EMBODIMENT OF IT IN ANY MEDIA, DISCLOSES INFORMATION THAT IS PROPRIETARY, IS THE PROPERTY OF LYDALL, INC. AND/OR ITS AFFILIATE (COLLECTIVELY, “LYDALL”), IS AN UNPUBLISHED WORK PROTECTED UNDER APPLICABLE COPYRIGHT LAWS AND IS DELIVERED ON THE EXPRESS CONDITION THAT IT IS NOT TO BE USED, DISCLOSED, OR REPRODUCED, IN WHOLE OR IN PART (INCLUDING REPRODUCTION AS A DERIVATIVE
WORK), OR USED FOR MANUFACTURE FOR ANYONE OTHER THAN LYDALL WITHOUT ITS WRITTEN CONSENT. NO RIGHT IS GRANTED TO DISCLOSE OR SO USE ANY INFORMATION CONTAINED HEREIN. ALL RIGHTS RESERVED. © LYDALL, INC. 2021
First Quarter 2021 Financial ReviewApril 28, 2021
1
USE OR DISCLOSURE OF INFORMATION CONTAINED ON THIS SHEET IS SUBJECT TO THE RESTRICTIONS ON THE TITLE SLIDE 2
Forward Looking Statement
This presentation contains “forward-looking statements” within the meaning of Section 21E of the Securities Exchange Act of 1934, as amended. These forward-looking statements are intended to provide management’s current expectations for the future operating and financial performance of the Company based on current expectations and assumptions relating to the Company’s business, the economy and other future conditions, and generally can be identified through the use of words such as “believes,” “anticipates,” “may,” “should,” “will,” “plans,” “projects,” “expects,” “estimates,” “forecasts,” “predicts,” “targets,” “prospects,” “strategy,” “signs,” and other words of similar meaning. These forward-looking statements are not guarantees of future results and are subject to risks, uncertainties and assumptions that could cause actual results to differ materially andadversely from those expressed in any forward-looking statement. Investors, therefore, are cautioned against relying on any of these forward-looking statements. Lydall’s Annual Report on Form 10-K, Quarterly Reports on Form 10-Q, and other Securities and Exchange Commission filings discuss important risk factors that could affect the Company’s business, results of operations and financial condition.
These forward-looking statements speak only as of the date of this presentation, and Lydall does not assume any obligation to update or revise any forward-looking statement made in this presentation.
This presentation contains non-GAAP financial measures as defined by SEC regulations. The Appendix of this presentation includes a reconciliation to the most comparable GAAP measures.

USE OR DISCLOSURE OF INFORMATION CONTAINED ON THIS SHEET IS SUBJECT TO THE RESTRICTIONS ON THE TITLE SLIDEUSE OR DISCLOSURE OF INFORMATION CONTAINED ON THIS SHEET IS SUBJECT TO THE RESTRICTIONS ON THE TITLE SLIDE
1
2
3
3
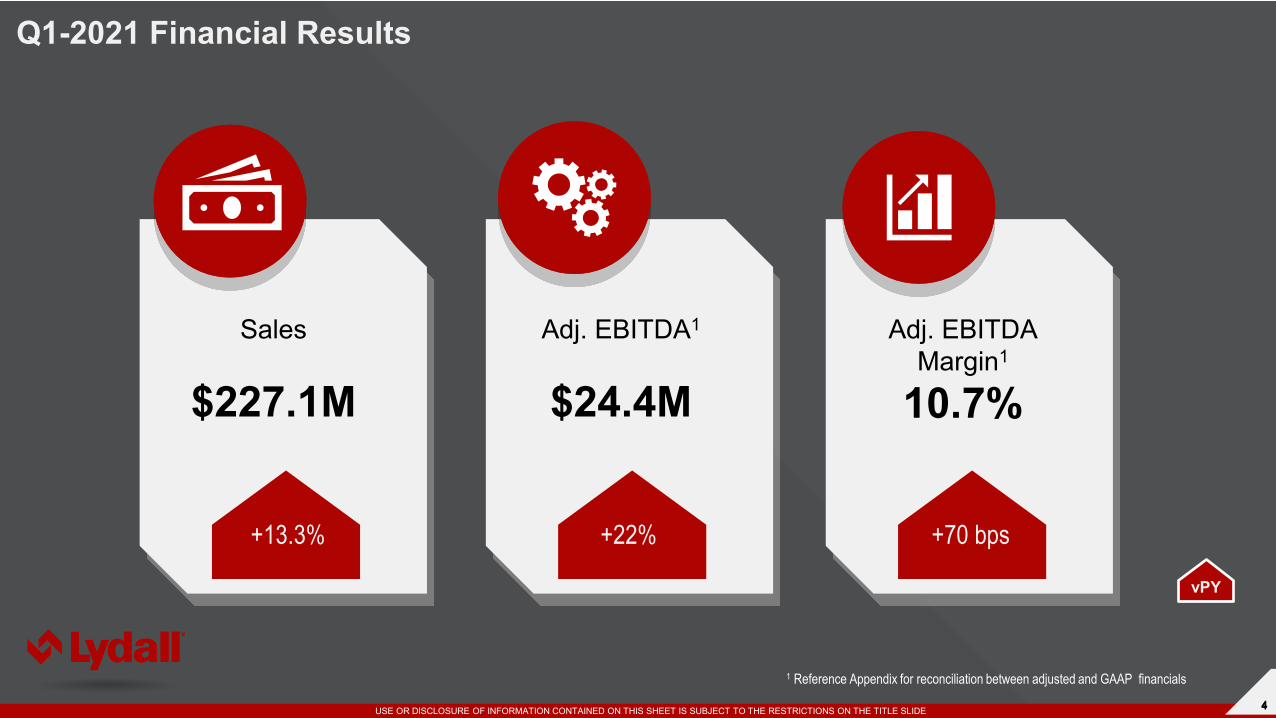
Q1-2021 Key Highlights
Strong sales growth in key end markets led by continued robust specialty filtration sales and strong automotive demand
Significant profitability improvements with adjusted EBITDA of $24.4 million, up 22% from prior year and 38% sequentially
Reduction in COVID related impacts in Thermal Acoustical operations; Proactively managing supply chain challenges
1 Net Debt = Total debt less cash
USE OR DISCLOSURE OF INFORMATION CONTAINED ON THIS SHEET IS SUBJECT TO THE RESTRICTIONS ON THE TITLE SLIDE 4USE OR DISCLOSURE OF INFORMATION CONTAINED ON THIS SHEET IS SUBJECT TO THE RESTRICTIONS ON THE TITLE SLIDE 4
Q1-2021 Financial Results
Sales
$227.1M
Adj. EBITDA1
$24.4M
Adj. EBITDA Margin1
10.7%
+13.3% +22% +70 bps
1 Reference Appendix for reconciliation between adjusted and GAAP financials
vPY
USE OR DISCLOSURE OF INFORMATION CONTAINED ON THIS SHEET IS SUBJECT TO THE RESTRICTIONS ON THE TITLE SLIDEUSE OR DISCLOSURE OF INFORMATION CONTAINED ON THIS SHEET IS SUBJECT TO THE RESTRICTIONS ON THE TITLE SLIDE 5
Liquidity and Cash Flow remain strong
63
15TTM
Q1-20TTM
Q1-21
200
172
Q1-20 Q1-21
Free Cash Flow1 Net Leverage3Net Debt2
2.52.4
Q1-20 Q1-21
1 Free Cash Flow = Net Cash provided by Operations less Capital Expenditures2 Net Debt = Total debt less cash3 Net Leverage = (Total Debt less Cash) / (TTM Adj. EBITDA)
$($M) ($M)
USE OR DISCLOSURE OF INFORMATION CONTAINED ON THIS SHEET IS SUBJECT TO THE RESTRICTIONS ON THE TITLE SLIDEUSE OR DISCLOSURE OF INFORMATION CONTAINED ON THIS SHEET IS SUBJECT TO THE RESTRICTIONS ON THE TITLE SLIDE
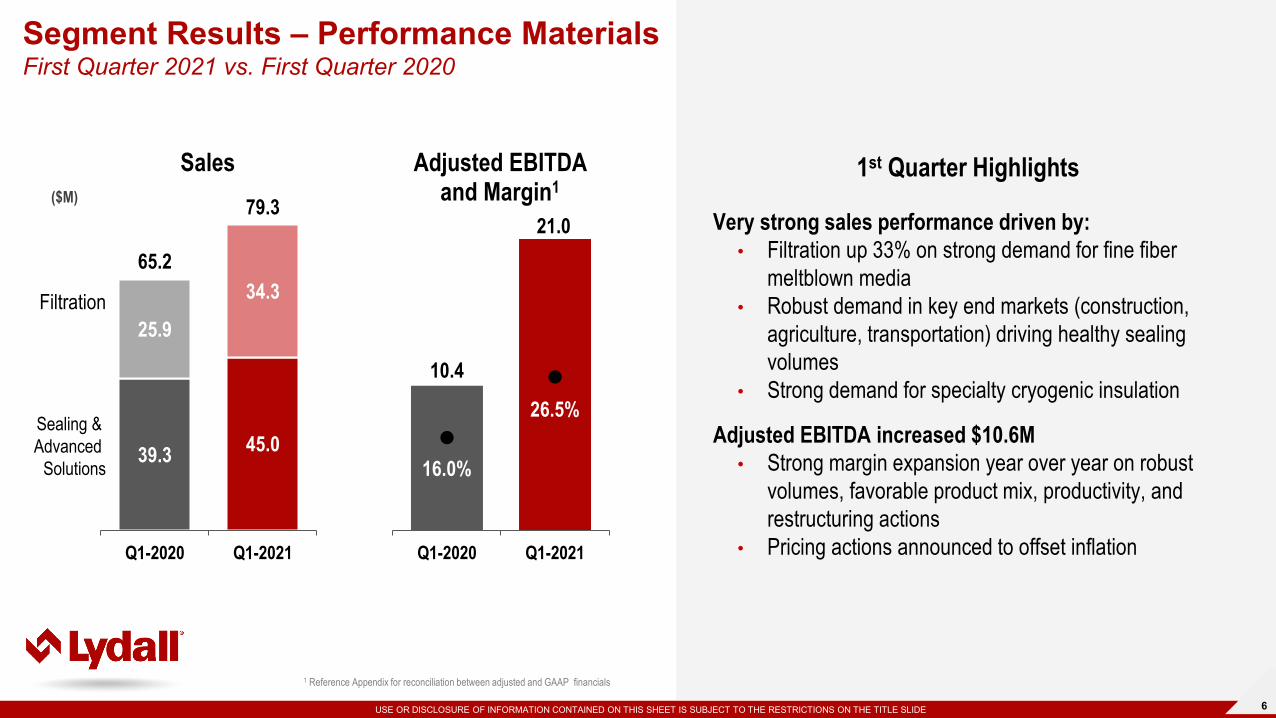
Segment Results – Performance MaterialsFirst Quarter 2021 vs. First Quarter 2020
1st Quarter Highlights
Very strong sales performance driven by:• Filtration up 33% on strong demand for fine fiber
meltblown media• Robust demand in key end markets (construction,
agriculture, transportation) driving healthy sealing volumes
• Strong demand for specialty cryogenic insulation
Adjusted EBITDA increased $10.6M• Strong margin expansion year over year on robust
volumes, favorable product mix, productivity, and restructuring actions
• Pricing actions announced to offset inflation
6
1 Reference Appendix for reconciliation between adjusted and GAAP financials
39.3 45.0
25.9
34.365.2
79.3
Q1-2020 Q1-2021
Sales
10.4
21.0
16.0%
26.5%
Q1-2020 Q1-2021
Adjusted EBITDA and Margin1
Filtration
Sealing & Advanced
Solutions
($M)
USE OR DISCLOSURE OF INFORMATION CONTAINED ON THIS SHEET IS SUBJECT TO THE RESTRICTIONS ON THE TITLE SLIDEUSE OR DISCLOSURE OF INFORMATION CONTAINED ON THIS SHEET IS SUBJECT TO THE RESTRICTIONS ON THE TITLE SLIDE
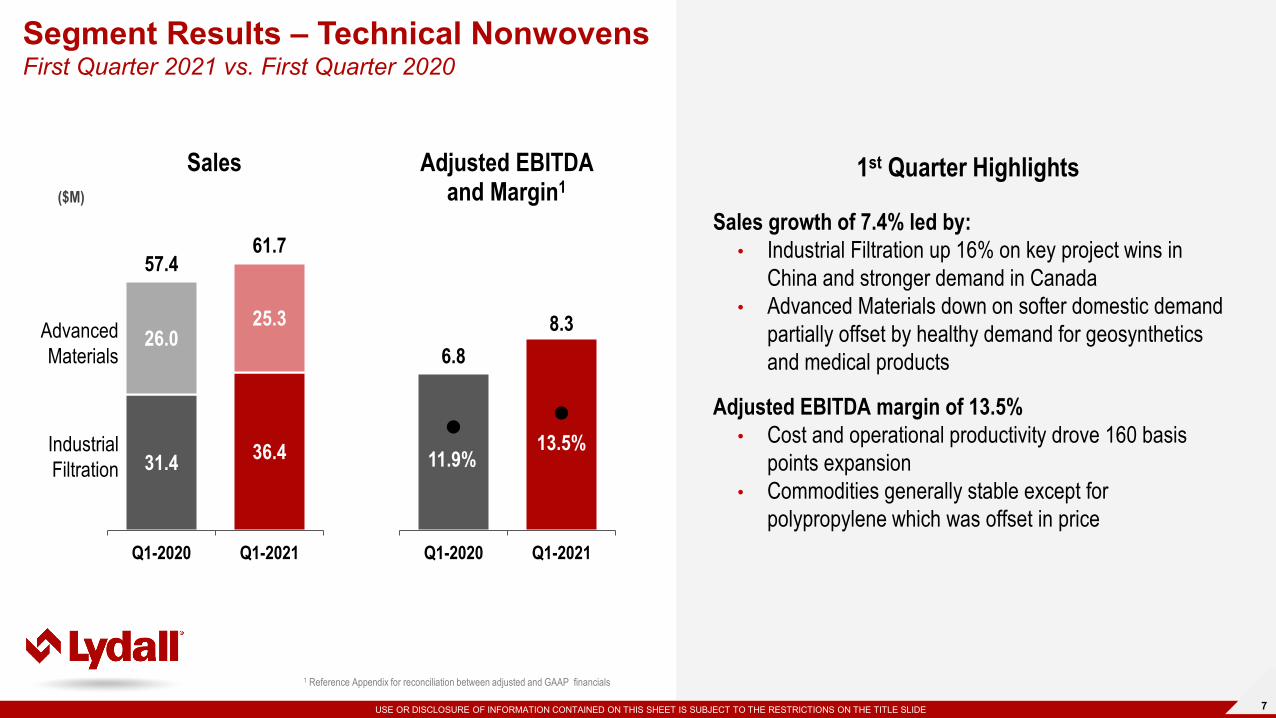
Segment Results – Technical NonwovensFirst Quarter 2021 vs. First Quarter 2020
1st Quarter Highlights
Sales growth of 7.4% led by:• Industrial Filtration up 16% on key project wins in
China and stronger demand in Canada • Advanced Materials down on softer domestic demand
partially offset by healthy demand for geosynthetics and medical products
Adjusted EBITDA margin of 13.5%• Cost and operational productivity drove 160 basis
points expansion• Commodities generally stable except for
polypropylene which was offset in price
7
1 Reference Appendix for reconciliation between adjusted and GAAP financials
31.4 36.4
26.025.3
57.461.7
Q1-2020 Q1-2021
Sales
6.88.3
11.9%13.5%
Q1-2020 Q1-2021
Adjusted EBITDA and Margin1
IndustrialFiltration
AdvancedMaterials
($M)
USE OR DISCLOSURE OF INFORMATION CONTAINED ON THIS SHEET IS SUBJECT TO THE RESTRICTIONS ON THE TITLE SLIDEUSE OR DISCLOSURE OF INFORMATION CONTAINED ON THIS SHEET IS SUBJECT TO THE RESTRICTIONS ON THE TITLE SLIDE
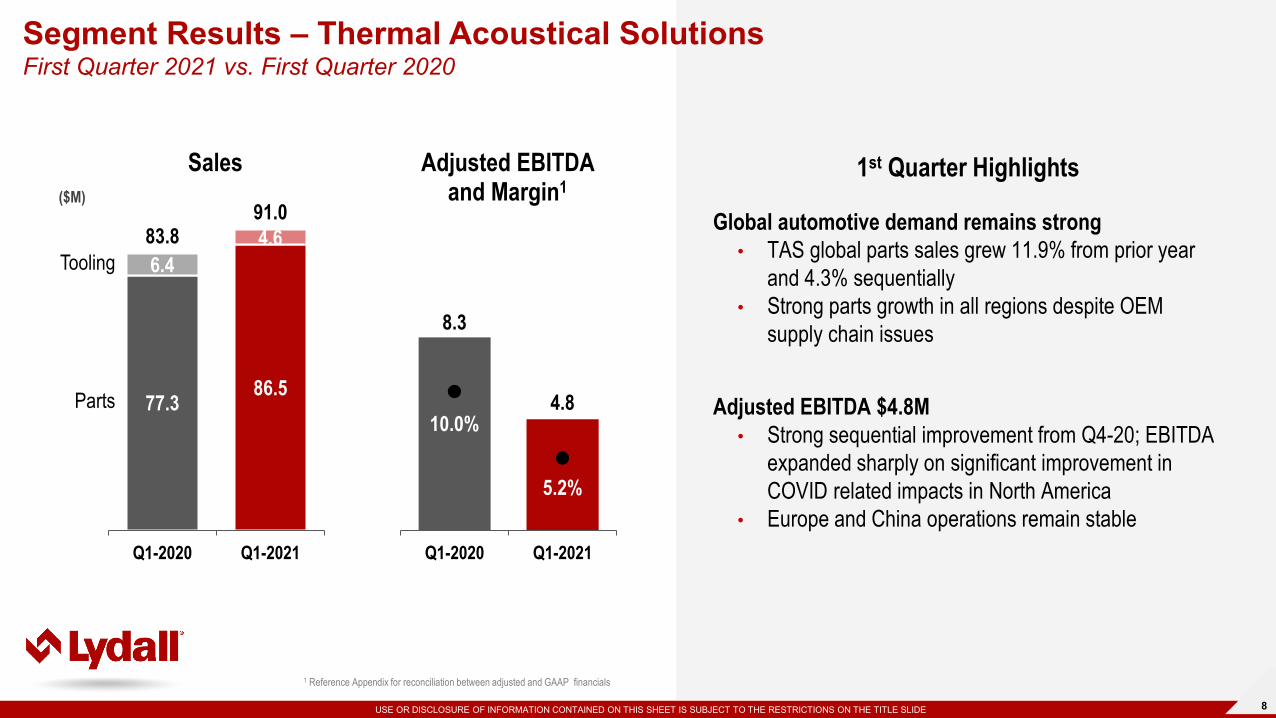
Segment Results – Thermal Acoustical SolutionsFirst Quarter 2021 vs. First Quarter 2020
1st Quarter Highlights
Global automotive demand remains strong• TAS global parts sales grew 11.9% from prior year
and 4.3% sequentially • Strong parts growth in all regions despite OEM
supply chain issues
Adjusted EBITDA $4.8M• Strong sequential improvement from Q4-20; EBITDA
expanded sharply on significant improvement in COVID related impacts in North America
• Europe and China operations remain stable
8
1 Reference Appendix for reconciliation between adjusted and GAAP financials
77.386.5
6.44.683.891.0
Q1-2020 Q1-2021
Sales
8.3
4.810.0%
5.2%
Q1-2020 Q1-2021
Adjusted EBITDA and Margin1
Tooling
Parts
($M)

USE OR DISCLOSURE OF INFORMATION CONTAINED ON THIS SHEET IS SUBJECT TO THE RESTRICTIONS ON THE TITLE SLIDE 9
Long-Term Roadmap to Value Creation
Leveraging our materials science and
engineering expertise to develop a portfolio of
innovative products to further expand into
attractive end markets
1.Fix and Focus2020 - 2021
2.Grow andDifferentiate2021 - 2023
3.Accelerate Value Creation 2023 - Forward
Lydall’s HEPA grade filtration media is on Mars aboard NASA’s Perseverance Rover.
The filtration media is used in the MOXIE
module (inset) which creates oxygen as a
test for possible human exploration on
the red planet.
USE OR DISCLOSURE OF INFORMATION CONTAINED ON THIS SHEET IS SUBJECT TO THE RESTRICTIONS ON THE TITLE SLIDEUSE OR DISCLOSURE OF INFORMATION CONTAINED ON THIS SHEET IS SUBJECT TO THE RESTRICTIONS ON THE TITLE SLIDE 10
USE OR DISCLOSURE OF INFORMATION CONTAINED ON THIS SHEET IS SUBJECT TO THE RESTRICTIONS ON THE TITLE SLIDEUSE OR DISCLOSURE OF INFORMATION CONTAINED ON THIS SHEET IS SUBJECT TO THE RESTRICTIONS ON THE TITLE SLIDE
Clear, Consistent Strategy for Profitable Growth
1 Free Cash Flow Conversion = (Adj. EBITDA less Capital Expenditures) / Adj. EBITDA; Adj. EBITDA on a trailing twelve-month basis; reference appendix for reconciliation 2 ROIC = (Adjusted EBITA after proforma tax) / Average (Net PP&E plus Net Working Capital); Adj. EBITDA on a trailing twelve-month basis; reference appendix for reconciliation
ACCELERATINGSHAREHOLDER RETURNS
ADJUSTED EBITDA
FCF CONVERSION 1
ROIC 2
$24M
54%
8.2%
$110M - $120M
~65%
~15%
$140 - $160M
75%+
20%+
Q1-2021 2023 2025
11
$
USE OR DISCLOSURE OF INFORMATION CONTAINED ON THIS SHEET IS SUBJECT TO THE RESTRICTIONS ON THE TITLE SLIDE 12
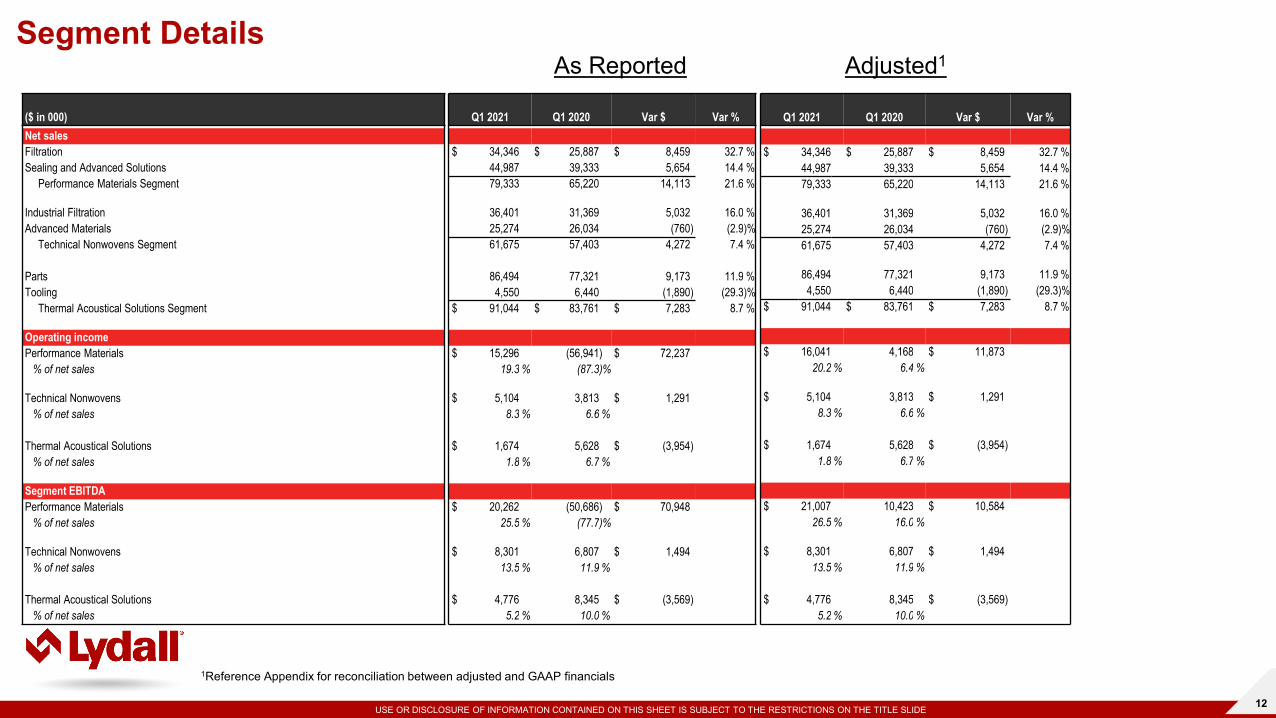
Segment DetailsAs Reported Adjusted1
1Reference Appendix for reconciliation between adjusted and GAAP financials
($ in 000) Q1 2021 Q1 2020 Var $ Var %Net salesFiltration $ 34,346 $ 25,887 $ 8,459 32.7 %Sealing and Advanced Solutions 44,987 39,333 5,654 14.4 %
Performance Materials Segment 79,333 65,220 14,113 21.6 %
Industrial Filtration 36,401 31,369 5,032 16.0 %Advanced Materials 25,274 26,034 (760) (2.9)%
Technical Nonwovens Segment 61,675 57,403 4,272 7.4 %
Parts 86,494 77,321 9,173 11.9 %Tooling 4,550 6,440 (1,890) (29.3)%
Thermal Acoustical Solutions Segment $ 91,044 $ 83,761 $ 7,283 8.7 %
Operating incomePerformance Materials $ 15,296 (56,941) $ 72,237
% of net sales 19.3 % (87.3)%
Technical Nonwovens $ 5,104 3,813 $ 1,291% of net sales 8.3 % 6.6 %
Thermal Acoustical Solutions $ 1,674 5,628 $ (3,954)% of net sales 1.8 % 6.7 %
Segment EBITDAPerformance Materials $ 20,262 (50,686) $ 70,948
% of net sales 25.5 % (77.7)%
Technical Nonwovens $ 8,301 6,807 $ 1,494% of net sales 13.5 % 11.9 %
Thermal Acoustical Solutions $ 4,776 8,345 $ (3,569)% of net sales 5.2 % 10.0 %
Q1 2021 Q1 2020 Var $ Var %
$ 34,346 $ 25,887 $ 8,459 32.7 %44,987 39,333 5,654 14.4 %79,333 65,220 14,113 21.6 %
36,401 31,369 5,032 16.0 %25,274 26,034 (760) (2.9)%61,675 57,403 4,272 7.4 %
86,494 77,321 9,173 11.9 %4,550 6,440 (1,890) (29.3)%
$ 91,044 $ 83,761 $ 7,283 8.7 %
$ 16,041 4,168 $ 11,87320.2 % 6.4 %
$ 5,104 3,813 $ 1,2918.3 % 6.6 %
$ 1,674 5,628 $ (3,954)1.8 % 6.7 %
$ 21,007 10,423 $ 10,58426.5 % 16.0 %
$ 8,301 6,807 $ 1,49413.5 % 11.9 %
$ 4,776 8,345 $ (3,569)5.2 % 10.0 %
USE OR DISCLOSURE OF INFORMATION CONTAINED ON THIS SHEET IS SUBJECT TO THE RESTRICTIONS ON THE TITLE SLIDE 13
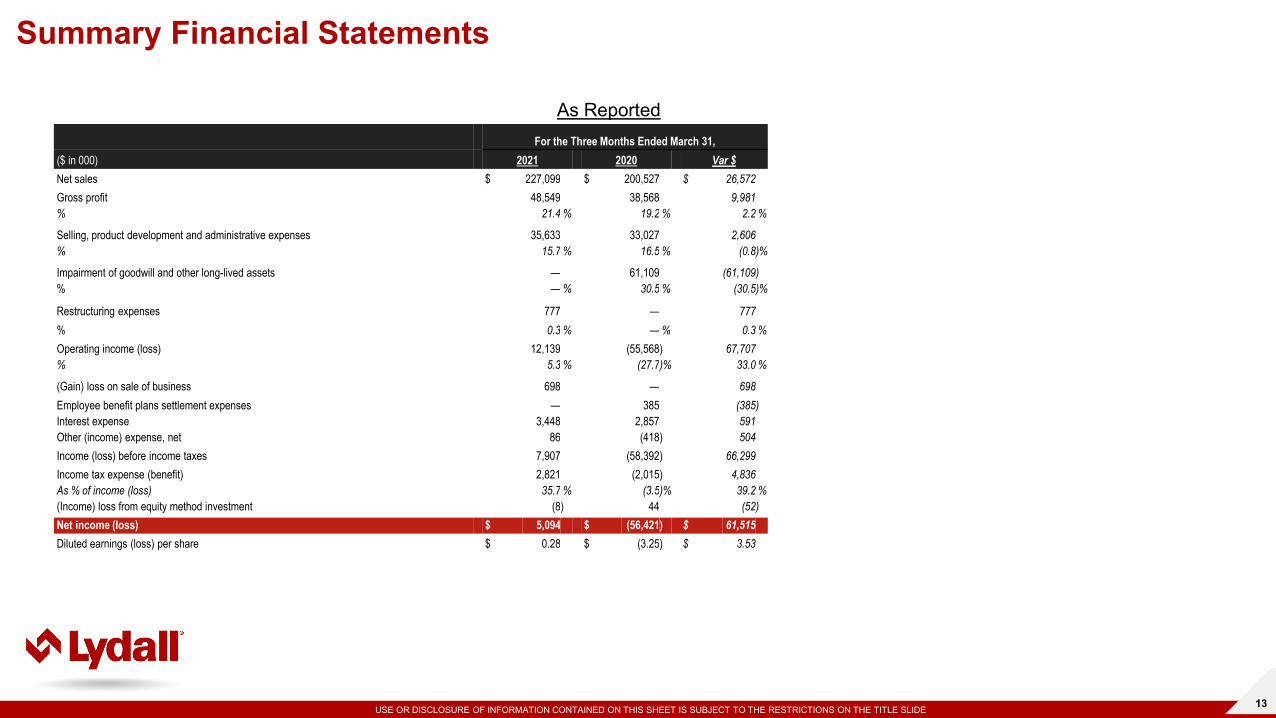
Summary Financial Statements
As ReportedFor the Three Months Ended March 31,
($ in 000) 2021 2020 Var $Net sales $ 227,099 $ 200,527 $ 26,572Gross profit 48,549 38,568 9,981% 21.4 % 19.2 % 2.2 %
Selling, product development and administrative expenses 35,633 33,027 2,606% 15.7 % 16.5 % (0.8)%
Impairment of goodwill and other long-lived assets — 61,109 (61,109)% — % 30.5 % (30.5)%
Restructuring expenses 777 — 777% 0.3 % — % 0.3 %Operating income (loss) 12,139 (55,568) 67,707% 5.3 % (27.7)% 33.0 %
(Gain) loss on sale of business 698 — 698Employee benefit plans settlement expenses — 385 (385)Interest expense 3,448 2,857 591Other (income) expense, net 86 (418) 504Income (loss) before income taxes 7,907 (58,392) 66,299Income tax expense (benefit) 2,821 (2,015) 4,836As % of income (loss) 35.7 % (3.5)% 39.2 %(Income) loss from equity method investment (8) 44 (52)Net income (loss) $ 5,094 $ (56,421) $ 61,515Diluted earnings (loss) per share $ 0.28 $ (3.25) $ 3.53
USE OR DISCLOSURE OF INFORMATION CONTAINED ON THIS SHEET IS SUBJECT TO THE RESTRICTIONS ON THE TITLE SLIDE 14
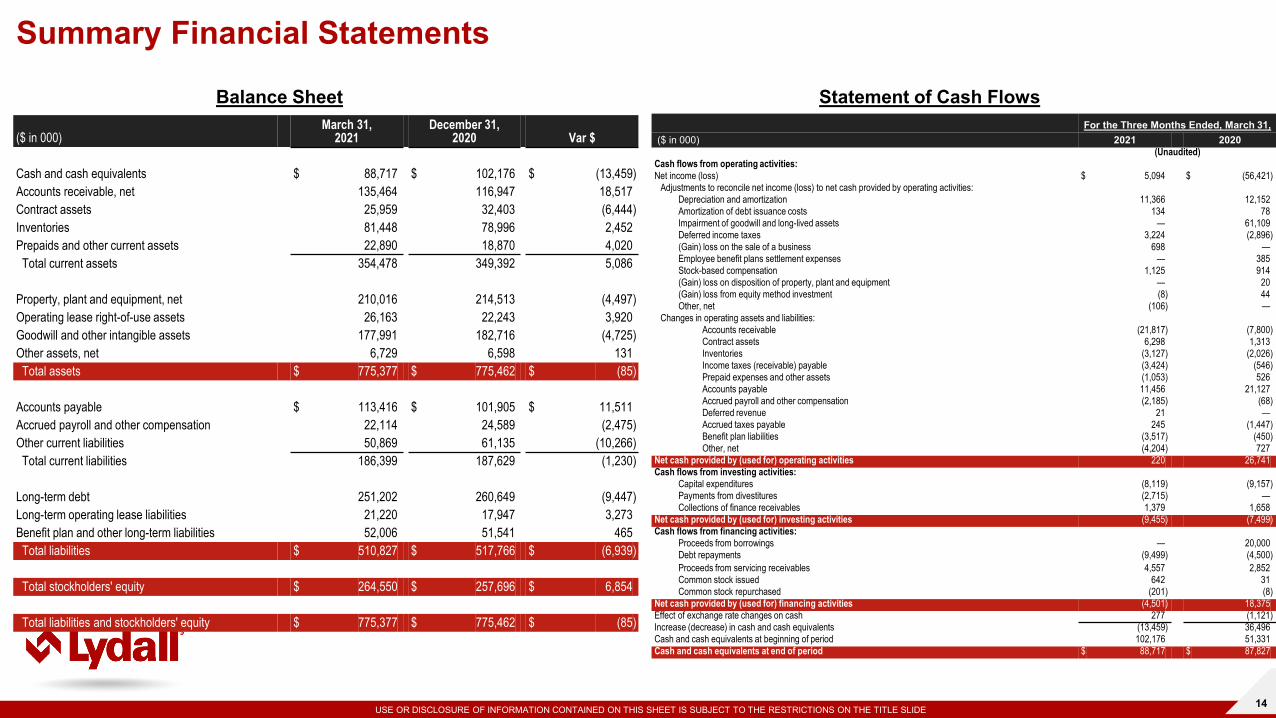
Summary Financial Statements
Balance Sheet Statement of Cash Flows
($ in 000)March 31,
2021December 31,
2020 Var $
Cash and cash equivalents $ 88,717 $ 102,176 $ (13,459)Accounts receivable, net 135,464 116,947 18,517Contract assets 25,959 32,403 (6,444)Inventories 81,448 78,996 2,452Prepaids and other current assets 22,890 18,870 4,020Total current assets 354,478 349,392 5,086
Property, plant and equipment, net 210,016 214,513 (4,497)Operating lease right-of-use assets 26,163 22,243 3,920Goodwill and other intangible assets 177,991 182,716 (4,725)Other assets, net 6,729 6,598 131Total assets $ 775,377 $ 775,462 $ (85)
Accounts payable $ 113,416 $ 101,905 $ 11,511Accrued payroll and other compensation 22,114 24,589 (2,475)Other current liabilities 50,869 61,135 (10,266)Total current liabilities 186,399 187,629 (1,230)
Long-term debt 251,202 260,649 (9,447)Long-term operating lease liabilities 21,220 17,947 3,273Benefit plan and other long-term liabilities 52,006 51,541 465Total liabilities $ 510,827 $ 517,766 $ (6,939)
Total stockholders' equity $ 264,550 $ 257,696 $ 6,854
Total liabilities and stockholders' equity $ 775,377 $ 775,462 $ (85)
For the Three Months Ended, March 31,($ in 000) 2021 2020
(Unaudited)Cash flows from operating activities:Net income (loss) $ 5,094 $ (56,421)
Adjustments to reconcile net income (loss) to net cash provided by operating activities:Depreciation and amortization 11,366 12,152Amortization of debt issuance costs 134 78Impairment of goodwill and long-lived assets — 61,109Deferred income taxes 3,224 (2,896)(Gain) loss on the sale of a business 698 —Employee benefit plans settlement expenses — 385Stock-based compensation 1,125 914(Gain) loss on disposition of property, plant and equipment — 20(Gain) loss from equity method investment (8) 44Other, net (106) —
Changes in operating assets and liabilities:Accounts receivable (21,817) (7,800)Contract assets 6,298 1,313Inventories (3,127) (2,026)Income taxes (receivable) payable (3,424) (546)Prepaid expenses and other assets (1,053) 526Accounts payable 11,456 21,127Accrued payroll and other compensation (2,185) (68)Deferred revenue 21 —Accrued taxes payable 245 (1,447)Benefit plan liabilities (3,517) (450)Other, net (4,204) 727
Net cash provided by (used for) operating activities 220 26,741Cash flows from investing activities:
Capital expenditures (8,119) (9,157)Payments from divestitures (2,715) —Collections of finance receivables 1,379 1,658
Net cash provided by (used for) investing activities (9,455) (7,499)Cash flows from financing activities:
Proceeds from borrowings — 20,000Debt repayments (9,499) (4,500)Proceeds from servicing receivables 4,557 2,852Common stock issued 642 31Common stock repurchased (201) (8)
Net cash provided by (used for) financing activities (4,501) 18,375Effect of exchange rate changes on cash 277 (1,121)Increase (decrease) in cash and cash equivalents (13,459) 36,496Cash and cash equivalents at beginning of period 102,176 51,331Cash and cash equivalents at end of period $ 88,717 $ 87,827
USE OR DISCLOSURE OF INFORMATION CONTAINED ON THIS SHEET IS SUBJECT TO THE RESTRICTIONS ON THE TITLE SLIDE 15
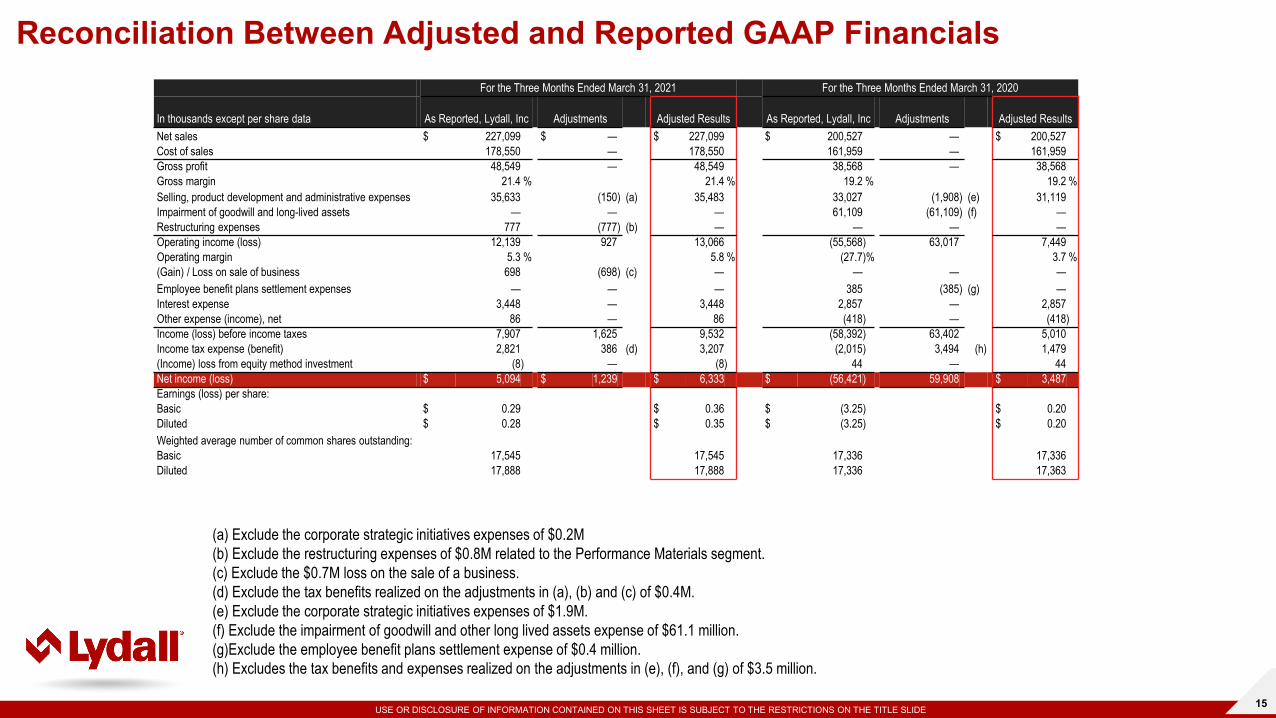
Reconciliation Between Adjusted and Reported GAAP Financials
(a) Exclude the corporate strategic initiatives expenses of $0.2M(b) Exclude the restructuring expenses of $0.8M related to the Performance Materials segment.(c) Exclude the $0.7M loss on the sale of a business.(d) Exclude the tax benefits realized on the adjustments in (a), (b) and (c) of $0.4M.(e) Exclude the corporate strategic initiatives expenses of $1.9M.(f) Exclude the impairment of goodwill and other long lived assets expense of $61.1 million.(g)Exclude the employee benefit plans settlement expense of $0.4 million.(h) Excludes the tax benefits and expenses realized on the adjustments in (e), (f), and (g) of $3.5 million.
For the Three Months Ended March 31, 2021 For the Three Months Ended March 31, 2020
In thousands except per share data As Reported, Lydall, Inc Adjustments Adjusted Results As Reported, Lydall, Inc Adjustments Adjusted ResultsNet sales $ 227,099 $ — $ 227,099 $ 200,527 — $ 200,527Cost of sales 178,550 — 178,550 161,959 — 161,959Gross profit 48,549 — 48,549 38,568 — 38,568Gross margin 21.4 % 21.4 % 19.2 % 19.2 %Selling, product development and administrative expenses 35,633 (150) (a) 35,483 33,027 (1,908) (e) 31,119Impairment of goodwill and long-lived assets — — — 61,109 (61,109) (f) —Restructuring expenses 777 (777) (b) — — — —Operating income (loss) 12,139 927 13,066 (55,568) 63,017 7,449Operating margin 5.3 % 5.8 % (27.7)% 3.7 %(Gain) / Loss on sale of business 698 (698) (c) — — — —Employee benefit plans settlement expenses — — — 385 (385) (g) —Interest expense 3,448 — 3,448 2,857 — 2,857Other expense (income), net 86 — 86 (418) — (418)Income (loss) before income taxes 7,907 1,625 9,532 (58,392) 63,402 5,010Income tax expense (benefit) 2,821 386 (d) 3,207 (2,015) 3,494 (h) 1,479(Income) loss from equity method investment (8) — (8) 44 — 44Net income (loss) $ 5,094 $ 1,239 $ 6,333 $ (56,421) 59,908 $ 3,487Earnings (loss) per share:Basic $ 0.29 $ 0.36 $ (3.25) $ 0.20Diluted $ 0.28 $ 0.35 $ (3.25) $ 0.20Weighted average number of common shares outstanding:Basic 17,545 17,545 17,336 17,336Diluted 17,888 17,888 17,336 17,363
USE OR DISCLOSURE OF INFORMATION CONTAINED ON THIS SHEET IS SUBJECT TO THE RESTRICTIONS ON THE TITLE SLIDE 16
Reconciliation Between Adjusted and Reported GAAP Financials
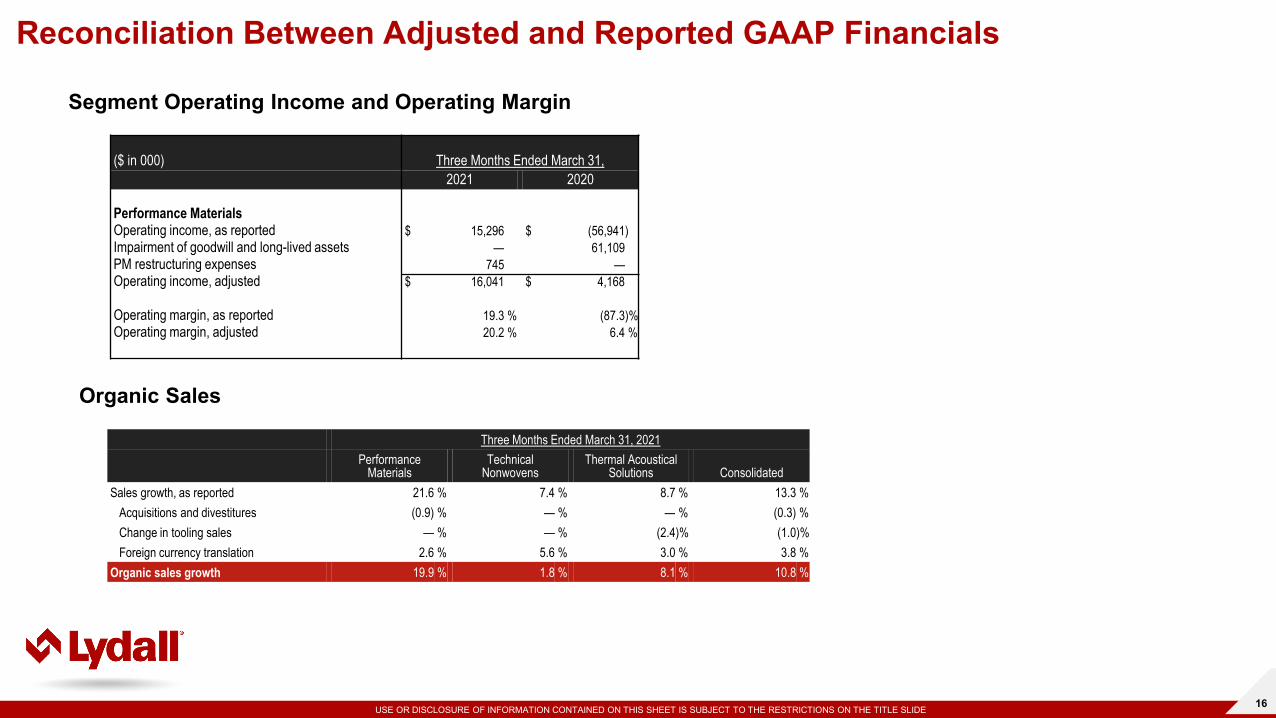
($ in 000) Three Months Ended March 31,2021 2020
Performance MaterialsOperating income, as reported $ 15,296 $ (56,941)Impairment of goodwill and long-lived assets — 61,109PM restructuring expenses 745 —Operating income, adjusted $ 16,041 $ 4,168
Operating margin, as reported 19.3 % (87.3)%Operating margin, adjusted 20.2 % 6.4 %
Organic Sales
Three Months Ended March 31, 2021Performance
MaterialsTechnical
NonwovensThermal Acoustical
Solutions ConsolidatedSales growth, as reported 21.6 % 7.4 % 8.7 % 13.3 %
Acquisitions and divestitures (0.9) % — % — % (0.3) %Change in tooling sales — % — % (2.4)% (1.0)%Foreign currency translation 2.6 % 5.6 % 3.0 % 3.8 %
Organic sales growth 19.9 % 1.8 % 8.1 % 10.8 %
Segment Operating Income and Operating Margin
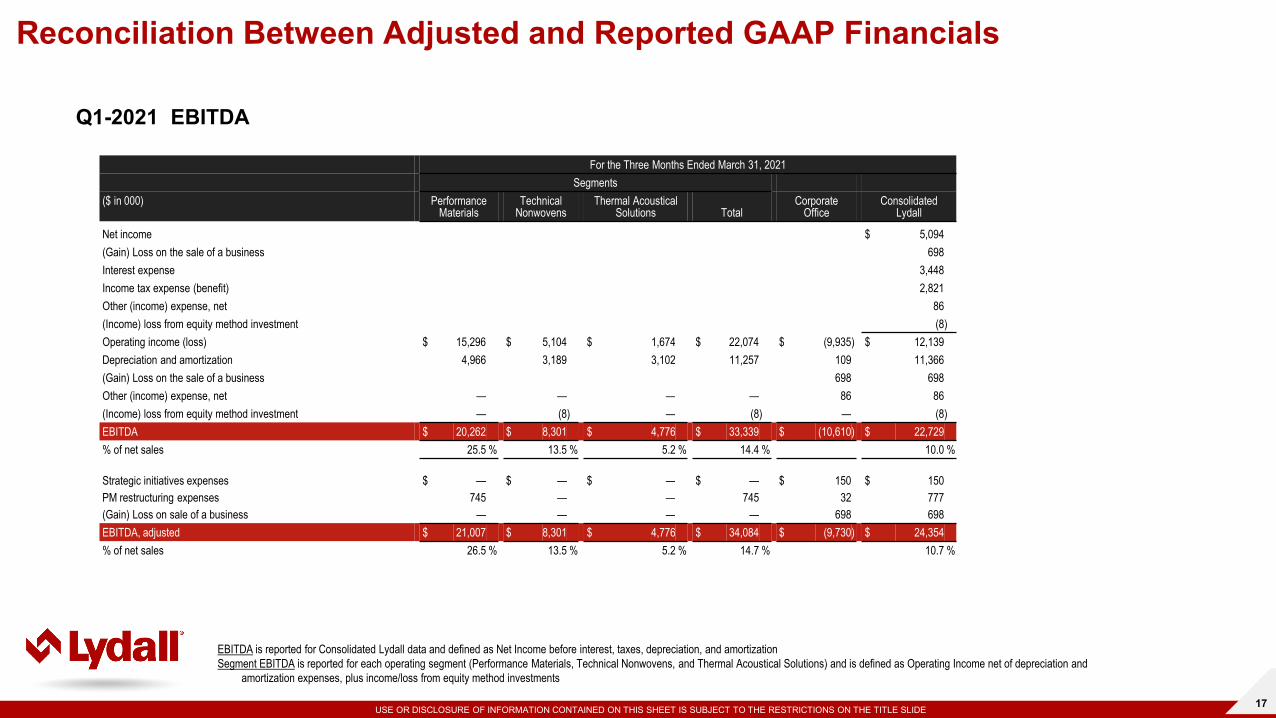
USE OR DISCLOSURE OF INFORMATION CONTAINED ON THIS SHEET IS SUBJECT TO THE RESTRICTIONS ON THE TITLE SLIDE 17
Reconciliation Between Adjusted and Reported GAAP Financials
Q1-2021 EBITDA
EBITDA is reported for Consolidated Lydall data and defined as Net Income before interest, taxes, depreciation, and amortizationSegment EBITDA is reported for each operating segment (Performance Materials, Technical Nonwovens, and Thermal Acoustical Solutions) and is defined as Operating Income net of depreciation and
amortization expenses, plus income/loss from equity method investments
For the Three Months Ended March 31, 2021Segments
($ in 000) PerformanceMaterials
TechnicalNonwovens
Thermal Acoustical Solutions Total
Corporate Office
Consolidated Lydall
Net income $ 5,094(Gain) Loss on the sale of a business 698Interest expense 3,448Income tax expense (benefit) 2,821Other (income) expense, net 86(Income) loss from equity method investment (8)Operating income (loss) $ 15,296 $ 5,104 $ 1,674 $ 22,074 $ (9,935) $ 12,139Depreciation and amortization 4,966 3,189 3,102 11,257 109 11,366(Gain) Loss on the sale of a business 698 698Other (income) expense, net — — — — 86 86(Income) loss from equity method investment — (8) — (8) — (8)EBITDA $ 20,262 $ 8,301 $ 4,776 $ 33,339 $ (10,610) $ 22,729% of net sales 25.5 % 13.5 % 5.2 % 14.4 % 10.0 %
Strategic initiatives expenses $ — $ — $ — $ — $ 150 $ 150PM restructuring expenses 745 — — 745 32 777(Gain) Loss on sale of a business — — — — 698 698EBITDA, adjusted $ 21,007 $ 8,301 $ 4,776 $ 34,084 $ (9,730) $ 24,354% of net sales 26.5 % 13.5 % 5.2 % 14.7 % 10.7 %
USE OR DISCLOSURE OF INFORMATION CONTAINED ON THIS SHEET IS SUBJECT TO THE RESTRICTIONS ON THE TITLE SLIDE 18
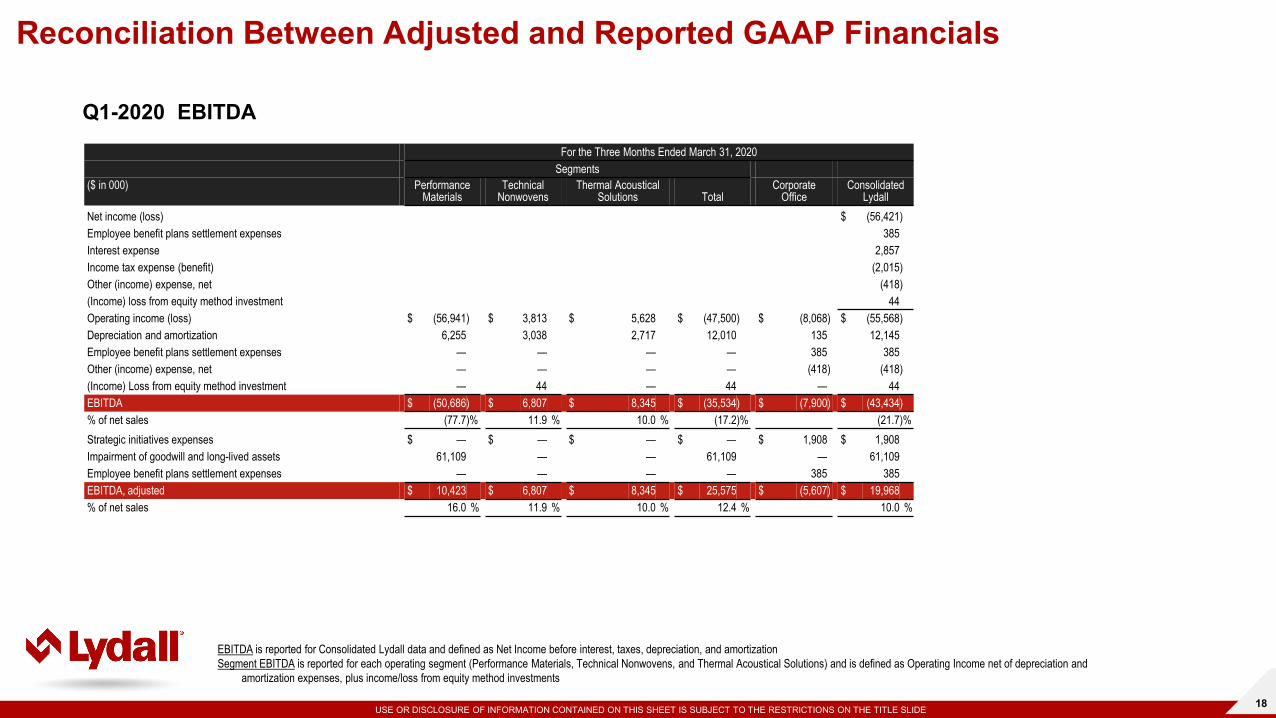
Reconciliation Between Adjusted and Reported GAAP Financials
Q1-2020 EBITDA
EBITDA is reported for Consolidated Lydall data and defined as Net Income before interest, taxes, depreciation, and amortizationSegment EBITDA is reported for each operating segment (Performance Materials, Technical Nonwovens, and Thermal Acoustical Solutions) and is defined as Operating Income net of depreciation and
amortization expenses, plus income/loss from equity method investments
For the Three Months Ended March 31, 2020Segments
($ in 000) PerformanceMaterials
TechnicalNonwovens
Thermal Acoustical Solutions Total
Corporate Office
Consolidated Lydall
Net income (loss) $ (56,421)Employee benefit plans settlement expenses 385Interest expense 2,857Income tax expense (benefit) (2,015)Other (income) expense, net (418)(Income) loss from equity method investment 44Operating income (loss) $ (56,941) $ 3,813 $ 5,628 $ (47,500) $ (8,068) $ (55,568)Depreciation and amortization 6,255 3,038 2,717 12,010 135 12,145Employee benefit plans settlement expenses — — — — 385 385Other (income) expense, net — — — — (418) (418)(Income) Loss from equity method investment — 44 — 44 — 44EBITDA $ (50,686) $ 6,807 $ 8,345 $ (35,534) $ (7,900) $ (43,434)% of net sales (77.7)% 11.9 % 10.0 % (17.2)% (21.7)%Strategic initiatives expenses $ — $ — $ — $ — $ 1,908 $ 1,908Impairment of goodwill and long-lived assets 61,109 — — 61,109 — 61,109Employee benefit plans settlement expenses — — — — 385 385EBITDA, adjusted $ 10,423 $ 6,807 $ 8,345 $ 25,575 $ (5,607) $ 19,968% of net sales 16.0 % 11.9 % 10.0 % 12.4 % 10.0 %
USE OR DISCLOSURE OF INFORMATION CONTAINED ON THIS SHEET IS SUBJECT TO THE RESTRICTIONS ON THE TITLE SLIDE 19
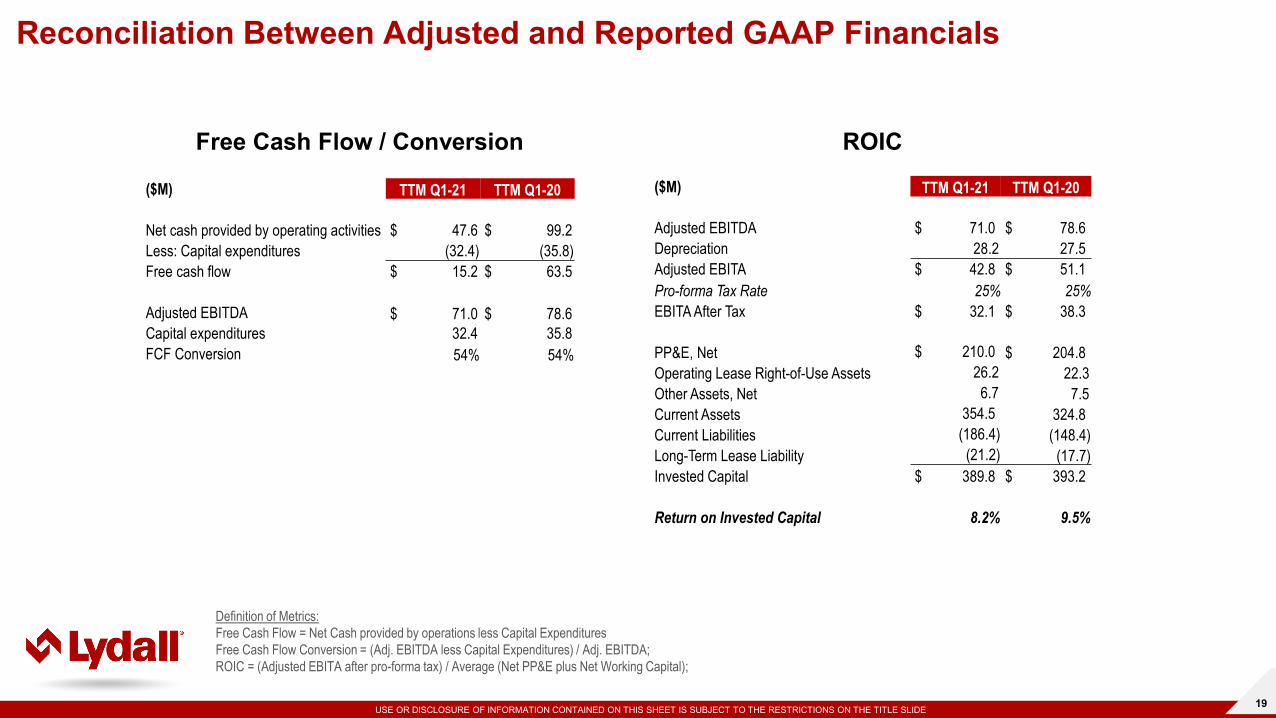
Reconciliation Between Adjusted and Reported GAAP Financials
Free Cash Flow / Conversion ROIC
($M) TTM Q1-21 TTM Q1-20
Net cash provided by operating activities $ 47.6 $ 99.2 Less: Capital expenditures (32.4) (35.8)Free cash flow $ 15.2 $ 63.5
Adjusted EBITDA $ 71.0 $ 78.6 Capital expenditures 32.4 35.8FCF Conversion 54% 54%
($M) TTM Q1-21 TTM Q1-20
Adjusted EBITDA $ 71.0 $ 78.6 Depreciation 28.2 27.5 Adjusted EBITA $ 42.8 $ 51.1 Pro-forma Tax Rate 25% 25%EBITA After Tax $ 32.1 $ 38.3
PP&E, Net $ 210.0 $ 204.8Operating Lease Right-of-Use Assets 26.2 22.3 Other Assets, Net 6.7 7.5 Current Assets 354.5 324.8Current Liabilities (186.4) (148.4)Long-Term Lease Liability (21.2) (17.7)Invested Capital $ 389.8 $ 393.2
Return on Invested Capital 8.2% 9.5%
Definition of Metrics:Free Cash Flow = Net Cash provided by operations less Capital ExpendituresFree Cash Flow Conversion = (Adj. EBITDA less Capital Expenditures) / Adj. EBITDA; ROIC = (Adjusted EBITA after pro-forma tax) / Average (Net PP&E plus Net Working Capital);